

Page 1
LabQuest® 3 User Manual
Version 3.0.3
March 2021
Page 2
LabQuest® 3 User Manual
ii Vernier Software & Technology
ABOUT THIS GUIDE
LabQuest 3, first shipped in September 2020, comes with a Quick-Start Guide to get you started
with basic data collection and analysis. The LabQuest 3 User Manual is an extended guide
detailing the hardware and software features of LabQuest 3.
This document represents features available in the 3.0.3 version of LabQuest 3 software released
in March 2021.
Note: Vernier LabQuest 3 is designed for educational use. This product, related sensors, and
accessories are not designed or to be used for any industrial, medical, or commercial process
such as life support, patient diagnosis, control of a manufacturing process, or industrial testing of
any kind.
The included software is provided “as is." Vernier makes no warranties as to performance,
merchantability, fitness for a particular purpose, or any other warranties whether expressed or
implied.
Page 3

LabQuest® 3 User Manual
www.vernier.com/labq3 iii
SAFETY INFORMATION
Federal Communication Commission Interference Statement
This equipment has been tested and found to comply with the limits for a Class B digital device,
pursuant to Part 15 of the FCC rules. These limits are designed to provide reasonable protection
against harmful interference in a residential installation. This equipment generates, uses and can
radiate radio frequency energy and, if not installed and used in accordance with the instructions,
may cause harmful interference to radio communications. However, there is no guarantee that
interference will not occur in a particular installation. If this equipment does cause harmful
interference to radio or television reception, which can be determined by turning the equipment
off and on, the user is encouraged to try to correct the interference by one or more of the
following measures:
• Reorient or relocate the receiving antenna.
• Increase the separation between the equipment and receiver.
• Connect the equipment into an outlet on a circuit different from that to which the receiver is
connected.
• Consult the dealer or an experienced radio/TV technician for help.
FCC Caution
This device complies with Part 15 of the FCC Rules. Operation is subject to the following two
conditions:
(1) this device may not cause harmful interference and
(2) this device must accept any interference received, including interference that may cause
undesired operation
RF Exposure Warning
The equipment complies with RF exposure limits set forth for an uncontrolled environment. The
antenna(s) used for this transmitter must not be co-located or operating in conjunction with any
other antenna or transmitter.
You are cautioned that changes or modifications not expressly approved by the party responsible
for compliance could void your authority to operate the equipment.
Page 4

LabQuest® 3 User Manual
iv Vernier Software & Technology
IC Statement
This device contains licence-exempt transmitter(s)/receiver(s) that comply with Innovation,
Science and Economic Development Canada’s licence-exempt RSS(s). Operation is subject to
the following two conditions:
1. This device may not cause interference.
2. This device must accept any interference, including interference that may cause undesired
operation of the device.
Industry Canada - Class B This digital apparatus does not exceed the Class B limits for radio
noise emissions from digital apparatus as set out in the interference-causing equipment standard
entitled “Digital Apparatus,” ICES-003 of Industry Canada. Operation is subject to the following
two conditions: (1) this device may not cause interference, and (2) this device must accept any
interference, including interference that may cause undesired operation of the device. To reduce
potential radio interference to other users, the antenna type and its gain should be so chosen that
the equivalent isotropically radiated power (e.i.r.p.) is not more than that permitted for successful
communication.
RF exposure warning: The equipment complies with RF exposure limits set forth for an
uncontrolled environment. The antenna(s) used for this transmitter must not be co-located or
operating in conjunction with any other antenna or transmitter.
L’émetteur/récepteur exempt de licence contenu dans le présent appareil est conforme aux CNR
d’Innovation, Sciences et Développement économique Canada applicables aux appareils radio
exempts de licence. L’exploitation est autorisée aux deux conditions suivantes:
1. L’appareil ne doit pas produire de brouillage;
2. L’appareil doit accepter tout brouillage radioélectrique subi, même si le brouillage est
susceptible d’en compromettre le fonctionnement.
Cet appareil numérique respecte les limites de bruits radioélectriques applicables aux appareils
numériques de Classe B prescrites dans la norme sur le matériel interférant-brouilleur:
“Appareils Numériques,” NMB-003 édictée par industrie Canada. L’utilisation est soumise aux
deux conditions suivantes: (1) cet appareil ne peut causer d’interférences, et (2) cet appareil doit
accepter toutes interférences, y comprises celles susceptibles de provoquer un disfonctionnement
du dispositif. Afin de réduire les interférences radio potentielles pour les autres utilisateurs, le
type d’antenne et son gain doivent être choisie de telle façon que l’équivalent de puissance
isotrope émis (e.i.r.p) n’est pas plus grand que celui permis pour une communication établie.
Avertissement d’exposition RF: L’équipement est conforme aux limites d’exposition aux RF
établies pour un environnement non supervisé. L’antenne (s) utilisée pour ce transmetteur ne
doit pas être jumelés ou fonctionner en conjonction avec toute autre antenne ou transmetteur.
Page 5
LabQuest® 3 User Manual
www.vernier.com/labq3 v
CONTENTS
I. GETTING STARTED ................................................................................................................................. 1
What’s Included..................................................................................................................1
Preparing for First-Time Use..............................................................................................2
Powering on LabQuest .......................................................................................................2
Reading the Notification Bar ..............................................................................................3
II. USING THE TOUCH SCREEN ................................................................................................................. 4
Common Gestures ..............................................................................................................4
Accessing Home ..........................................................................................................4
Accessing Settings .......................................................................................................5
Switching Between Running Apps .....................................................................................5
Navigating the LabQuest App Screens ...............................................................................5
Data-Collection Controls ....................................................................................................6
III. CONNECTING SENSORS ....................................................................................................................... 7
Wired Sensors .....................................................................................................................7
Wireless Sensors .................................................................................................................8
Internal Sensors ..................................................................................................................9
IV. QUICK START TO DATA COLLECTION AND ANALYSIS ................................................................. 10
V. USING THE LABQUEST APP ............................................................................................................... 13
Preparing for Data Collection ...........................................................................................13
Modifying the Data-Collection Settings ...........................................................................14
Configuring Sensors .........................................................................................................19
Setting up Graphs .............................................................................................................22
Drawing Predictions .........................................................................................................25
Motion Matching ..............................................................................................................26
Collecting Data .................................................................................................................26
Manually Entering Data ...................................................................................................27
Analyzing Your Data ........................................................................................................30
Viewing Vernier Experiments ..........................................................................................38
Adding Notes to Your Experiment ...................................................................................38
Managing LabQuest App Files .........................................................................................38
VI. USING LABQUEST 3 AS A DATA SHARING SOURCE ..................................................................... 40
How Data Sharing Works .................................................................................................40
Connecting to a Wi-Fi Network .......................................................................................40
Enabling Data Sharing on LabQuest 3 .............................................................................42
Connecting to LabQuest 3 from Your Device ..................................................................44
Restricting Access to the Connections Setup ...................................................................45
Page 6
LabQuest® 3 User Manual
vi Vernier Software & Technology
VII. USING LABQUEST 3 WITH A COMPUTER OR CHROMEBOOK ..................................................... 46
VIII. EMAILING DATA FILES AND SCREENSHOTS ................................................................................ 48
IX. PRINTING FROM LABQUEST 3 .......................................................................................................... 50
X. PROJECTING AND MONITORING LABQUEST 3 DEVICES .............................................................. 52
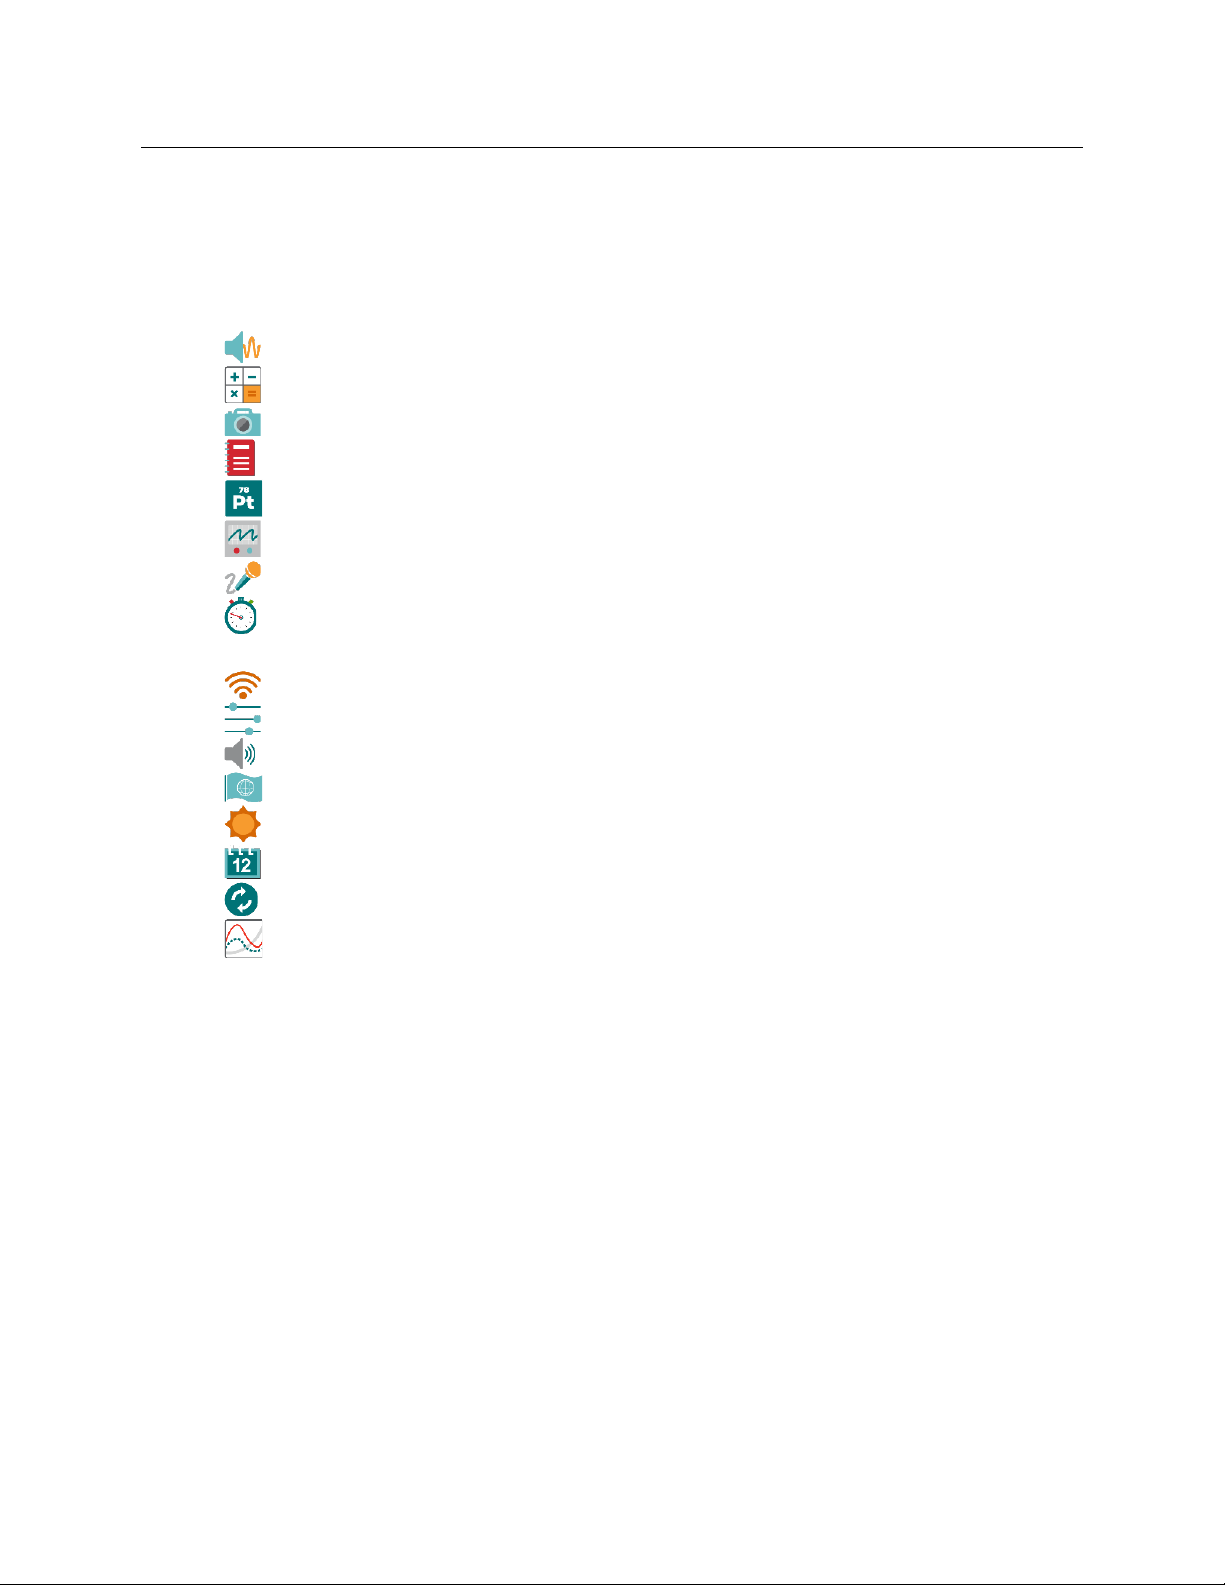
XI. USING OTHER APPS ........................................................................................................................... 54
Audio Function Generator .........................................................................................54
Calculator ..................................................................................................................54
Camera App ...............................................................................................................55
Experiment Viewer .....................................................................................................55
Periodic Table ...........................................................................................................55
Power Amplifier ........................................................................................................56
Sound Recorder .........................................................................................................56
Stopwatch ...................................................................................................................56
XII. CUSTOMIZING THE SETTINGS .......................................................................................................... 57
Connections—Wi-Fi, Data Sharing, and Email ........................................................57
Advanced Preferences ...............................................................................................57
Audio ..........................................................................................................................58
Language ...................................................................................................................58
Light & Power ...........................................................................................................58
Time & Date ..............................................................................................................58
Update ........................................................................................................................59
LabQuest App Settings ..............................................................................................59
XIII. APPENDIX .......................................................................................................................................... 60
Technical Specifications ...................................................................................................60
Battery Maintenance .........................................................................................................61
Replacing the Battery .......................................................................................................62
Troubleshooting Battery Issues ........................................................................................63
Case and Screen Maintenance ..........................................................................................63
Software Updates..............................................................................................................64
Getting Additional Help ...................................................................................................66
License Information..........................................................................................................66
Warranty ...........................................................................................................................66
Disposal ............................................................................................................................67
Replacement Parts ............................................................................................................67
Accessories .......................................................................................................................68
Page 7
LabQuest® 3 User Manual
www.vernier.com/labq3 1
I. GETTING STARTED
What’s Included
• LabQuest 3 unit
• Rechargeable battery (in unit)
• AC power adapter
• Micro-USB computer connection cable
• Quick-Start Guide
Page 8
Getting Started
2 Vernier Software & Technology
Preparing for First-Time Use
Remove the Protective Battery Tab
LabQuest ships with the battery in place; however, there is a protective tab covering the battery
contacts that must be removed. Remove the battery and discard the tab before using LabQuest.
For assistance on removing the battery, see Replacing the Battery in the appendix.
Remove the Protective Screen Covering
Remove and discard the protective screen cover that comes on the unit. This cover is intended to
prevent damage to the screen during shipping. It is not intended as a protective cover for
everyday use.
Charge Overnight
We recommend charging the battery for at least 12 hours prior to using LabQuest for the first
time on battery power. To do this, connect the included power adapter to LabQuest and an AC
power source.
LabQuest uses a high-quality lithium-ion battery. There is never a need to condition the battery
by regular full discharge/charge cycles and it is safe to leave the battery charging indefinitely.
For more details about the battery, see Battery Maintenance in the appendix
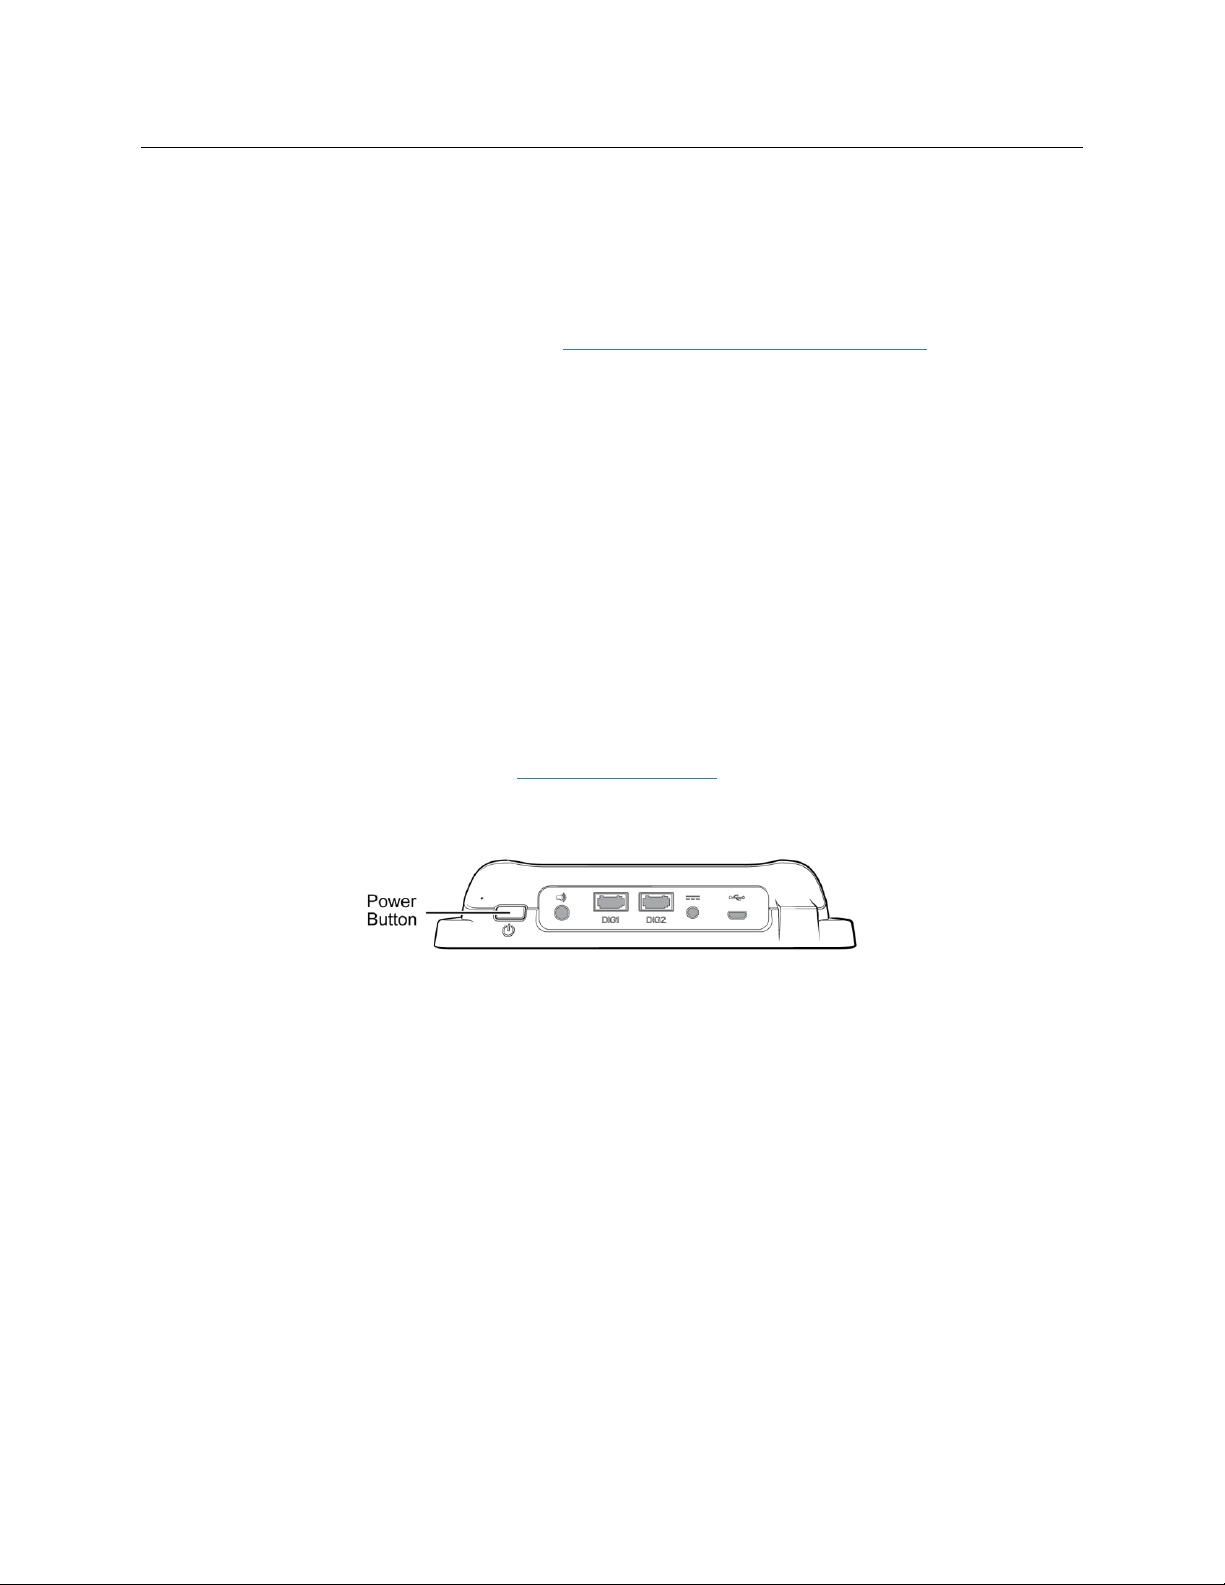
Powering on LabQuest
Press the power button located on the top edge of the unit. LabQuest completes its booting
procedure and automatically launches the LabQuest App. This can take 45 seconds to complete.
If the screen momentarily shows a charge battery icon or does not light after a moment, check to
be sure you have removed the protective battery tab and properly replaced the battery. Connect
the power adapter to LabQuest and to an AC power source, and then try the power button again.
Power Button Behavior
Power on/resume—If the screen is off for any reason (LabQuest is shutdown, suspended, or the
screen is off to conserve battery power), press and release the power button to turn LabQuest on.
• If only the screen is powered off, pressing the power button turns the screen on.
• If LabQuest is suspended, it takes a few seconds for the LabQuest App to start up.
• If LabQuest is shut down, it needs to fully boot, taking about 45 seconds.
Page 9
LabQuest® 3 User Manual
www.vernier.com/labq3 3
Suspend—When LabQuest is on, press and release the power button once to put LabQuest into a
suspend mode. In this mode, all running apps are closed. While suspended, LabQuest uses less
power but the battery can still drain.
Shut down—To shut down LabQuest, press and hold the power button for about five seconds
and release it when the shutdown message appears. Wait for LabQuest to shut down. To cancel
the shutdown procedure, tap Cancel before the countdown is complete. This is the lowest energy
state of the device; however, even when shutdown, the battery still drains very slowly.
Forced shutdown—Holding the power button down for more than eight seconds powers off
LabQuest uncleanly. This should be avoided as you are likely to lose your data and potentially
cause file system corruption. Only do this if you have no other way to power off the unit.
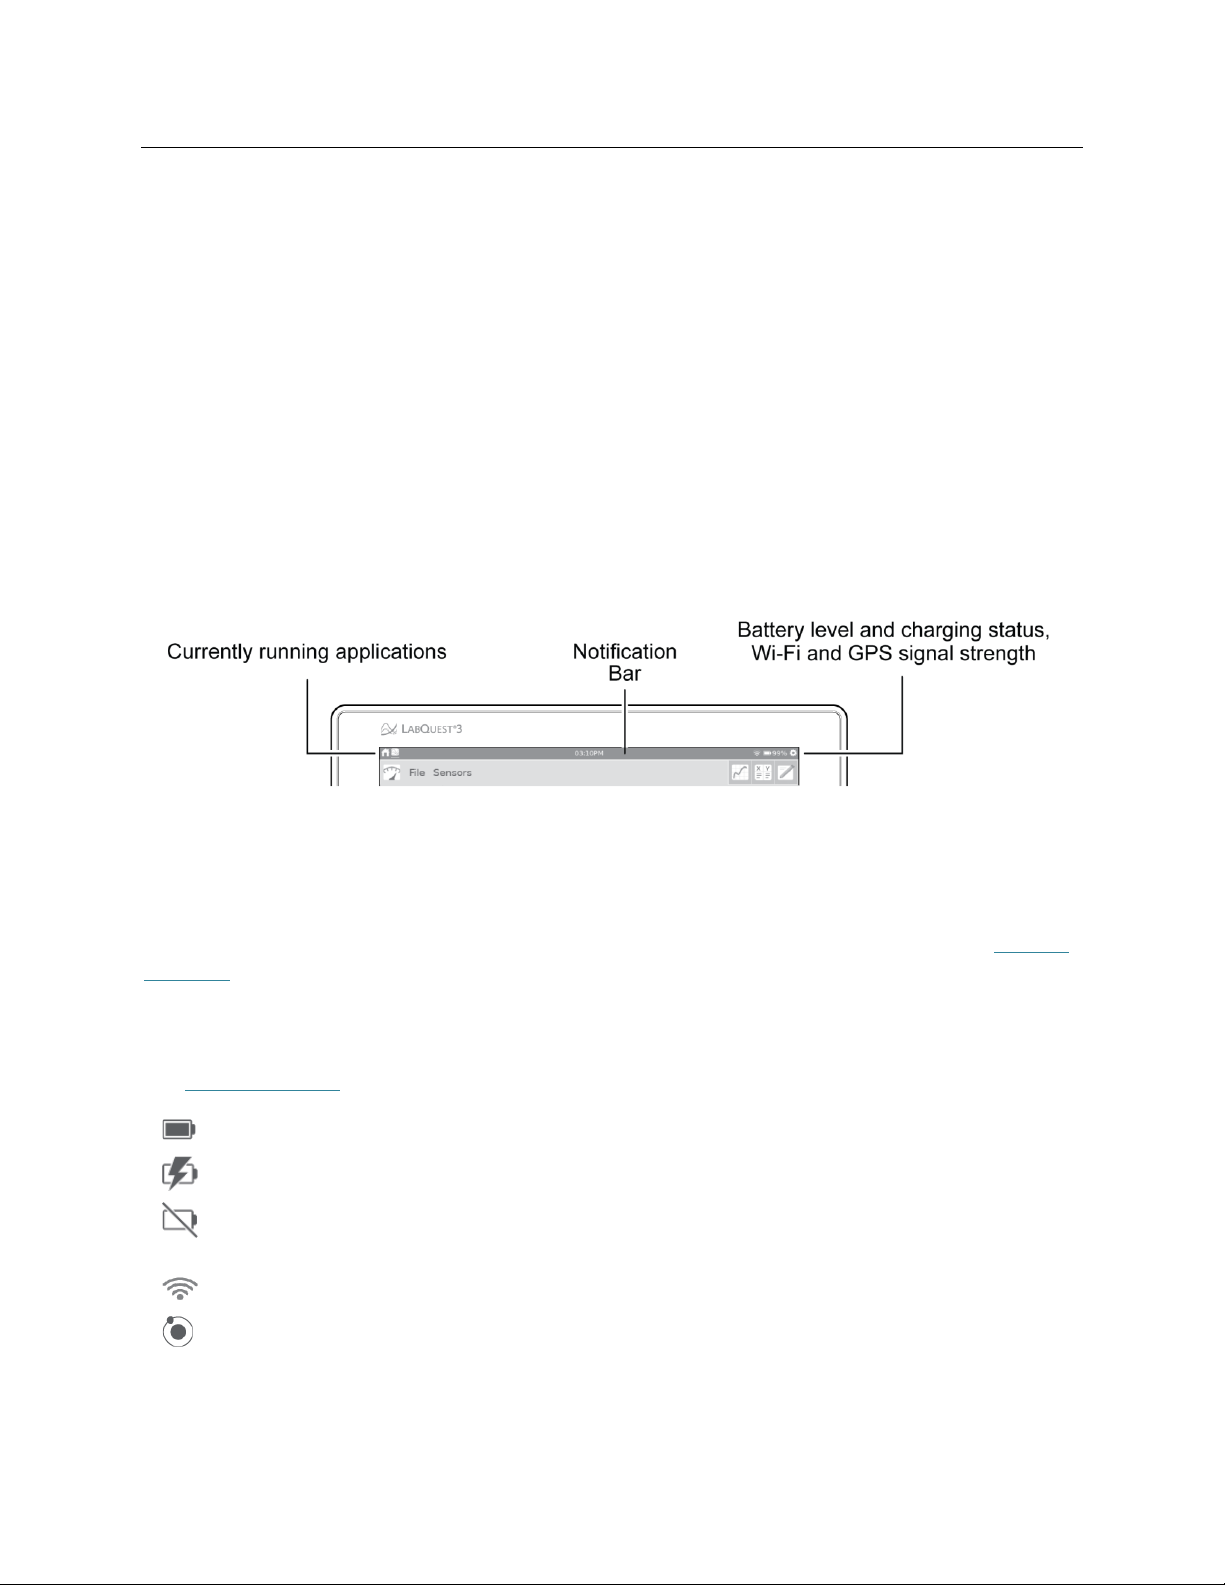
Reading the Notification Bar
The left side of the Notification bar shows the apps that are currently running in the order they
were launched. The white underline indicates the application you are currently viewing.
The current time is shown in the middle of the notification bar. The time is set using the Time &
Date app accessed from the Settings screen.
The right side of the Notification bar shows battery level and charging status as well as Wi-Fi
and GPS signal strength. GPS signal strength is only shown when the GPS sensor is being used.
See Internal Sensors for more details.
50%—Running on battery power (50% battery life remaining)
50%—Battery is charging (50% charged)
—Battery Fault or No Battery (If you see this icon when you power your LabQuest for the
first time, the protective battery tab may not have been removed.)
—Wi-Fi signal strength (If all bars are grayed out, Wi-Fi may be off.)
3—GPS is on (signals acquired from 3 satellites)
Page 10
Using the Touch Screen
4 Vernier Software & Technology
II. USING THE TOUCH SCREEN
LabQuest 3 has a capacitive touch screen like those found on tablets and smart phones. LabQuest
is controlled by touching the screen. Instead of using your finger, you can use a stylus designed
for capacitive touch screens (not included) if desired.
Common Gestures
• Single tap—Use a single tap to interact with most objects on the device.
• Touch and drag—Use touch and drag to select regions on a graph or to scroll through menus.
• Long press—Use the long press to activate special functionality on some objects such as
holding down the keyboard shift key to enable shift lock or beginning a table selection.
• Two-finger pinch/zoom/pan—Use this gesture to manually scale graphs or pan the data table.
• Double-tap—Double-tap to scale the graph to fit the data or to edit elements of the data table
such as cell data (when allowed), column name, or dataset name.
• Single-finger swipe (from edges)—Use this gesture to change which app is displayed.
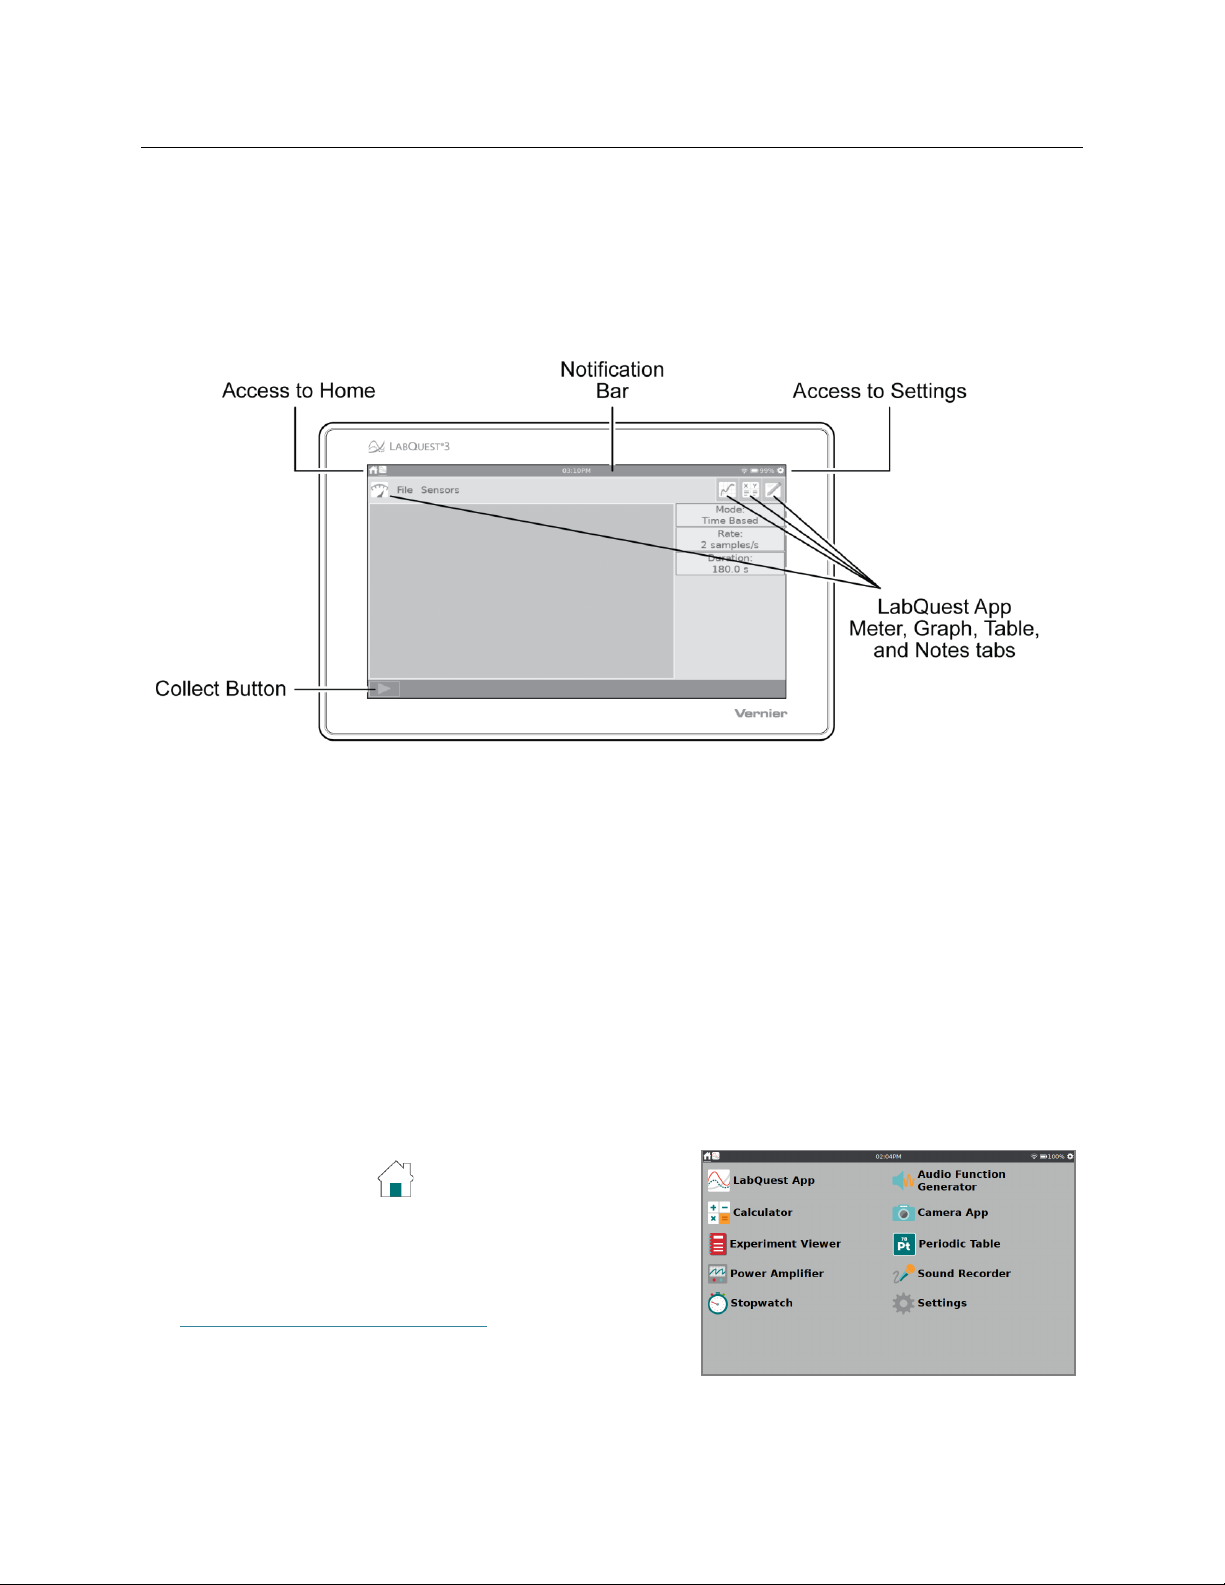
Accessing Home
• Tap or swipe down from the left side of the
Notification bar to view the Home screen.
• Tap to select an application you want to use. See
Additional Apps on LabQuest 3 for more details.
Page 11
LabQuest® 3 User Manual
www.vernier.com/labq3 5
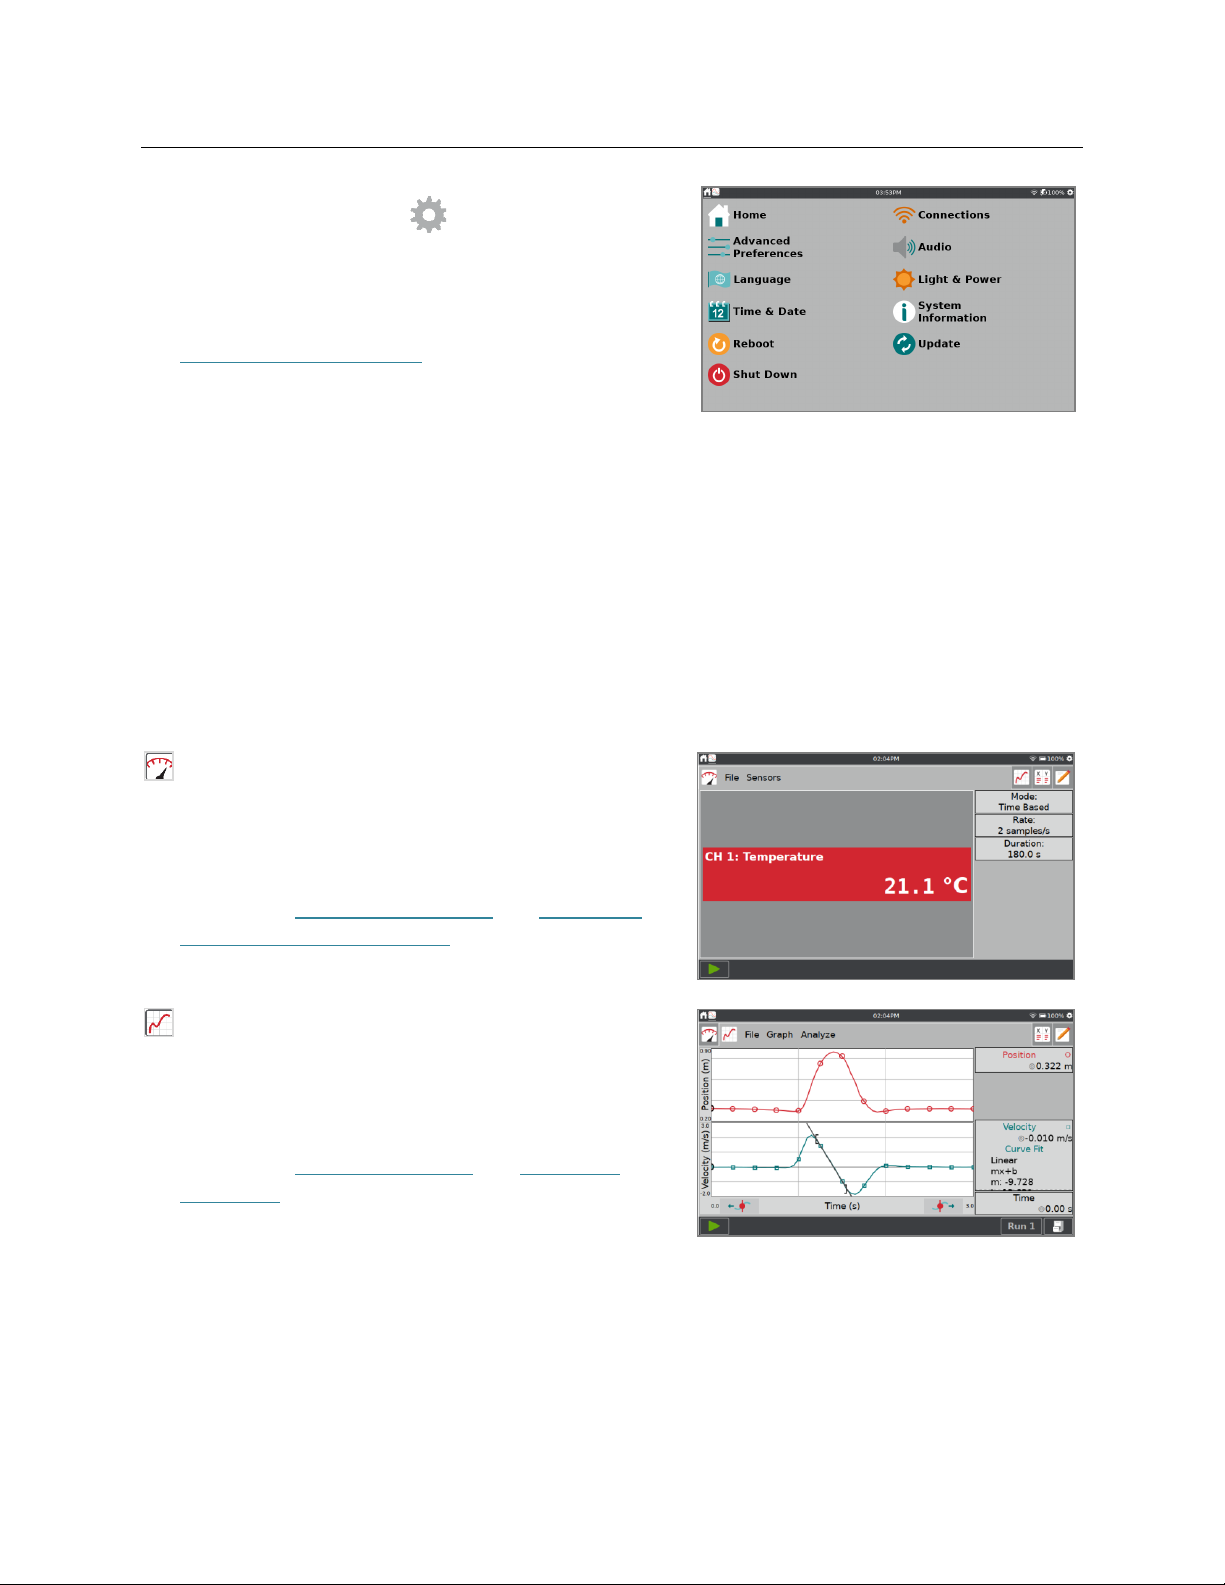
Accessing Settings
• Tap or swipe down from the left side of the
Notification bar to view the Settings screen.
• Tap to select the setting you want to modify. See
Customizing the Settings for more details.
Switching Between Running Apps
Swipe left or right from the edge of the screen to switch between running apps. The app order is
represented by the icons on the left side of the notification bar. The order that the icons appear
relates to the order in which the apps are launched.
Navigating the LabQuest App Screens
The LabQuest App Meter, Graph, Table, and Notes screens are accessed by tapping the
associated tab icons.
Meter screen—Use the Meter screen to view live
sensor readouts, configure sensors, and set datacollection parameters.
For a detailed description of how the Meter screen
is used, see Configuring Sensors and Modifying
the Data Collection Settings.
Graph screen—From the Graph screen you can
view a graph of your data and perform analyses,
including curve fits.
For a detailed description of how the Graph screen
is used, see Setting Up Graphs and Analyzing
Your Data.
Page 12
Using the Touch Screen
6 Vernier Software & Technology
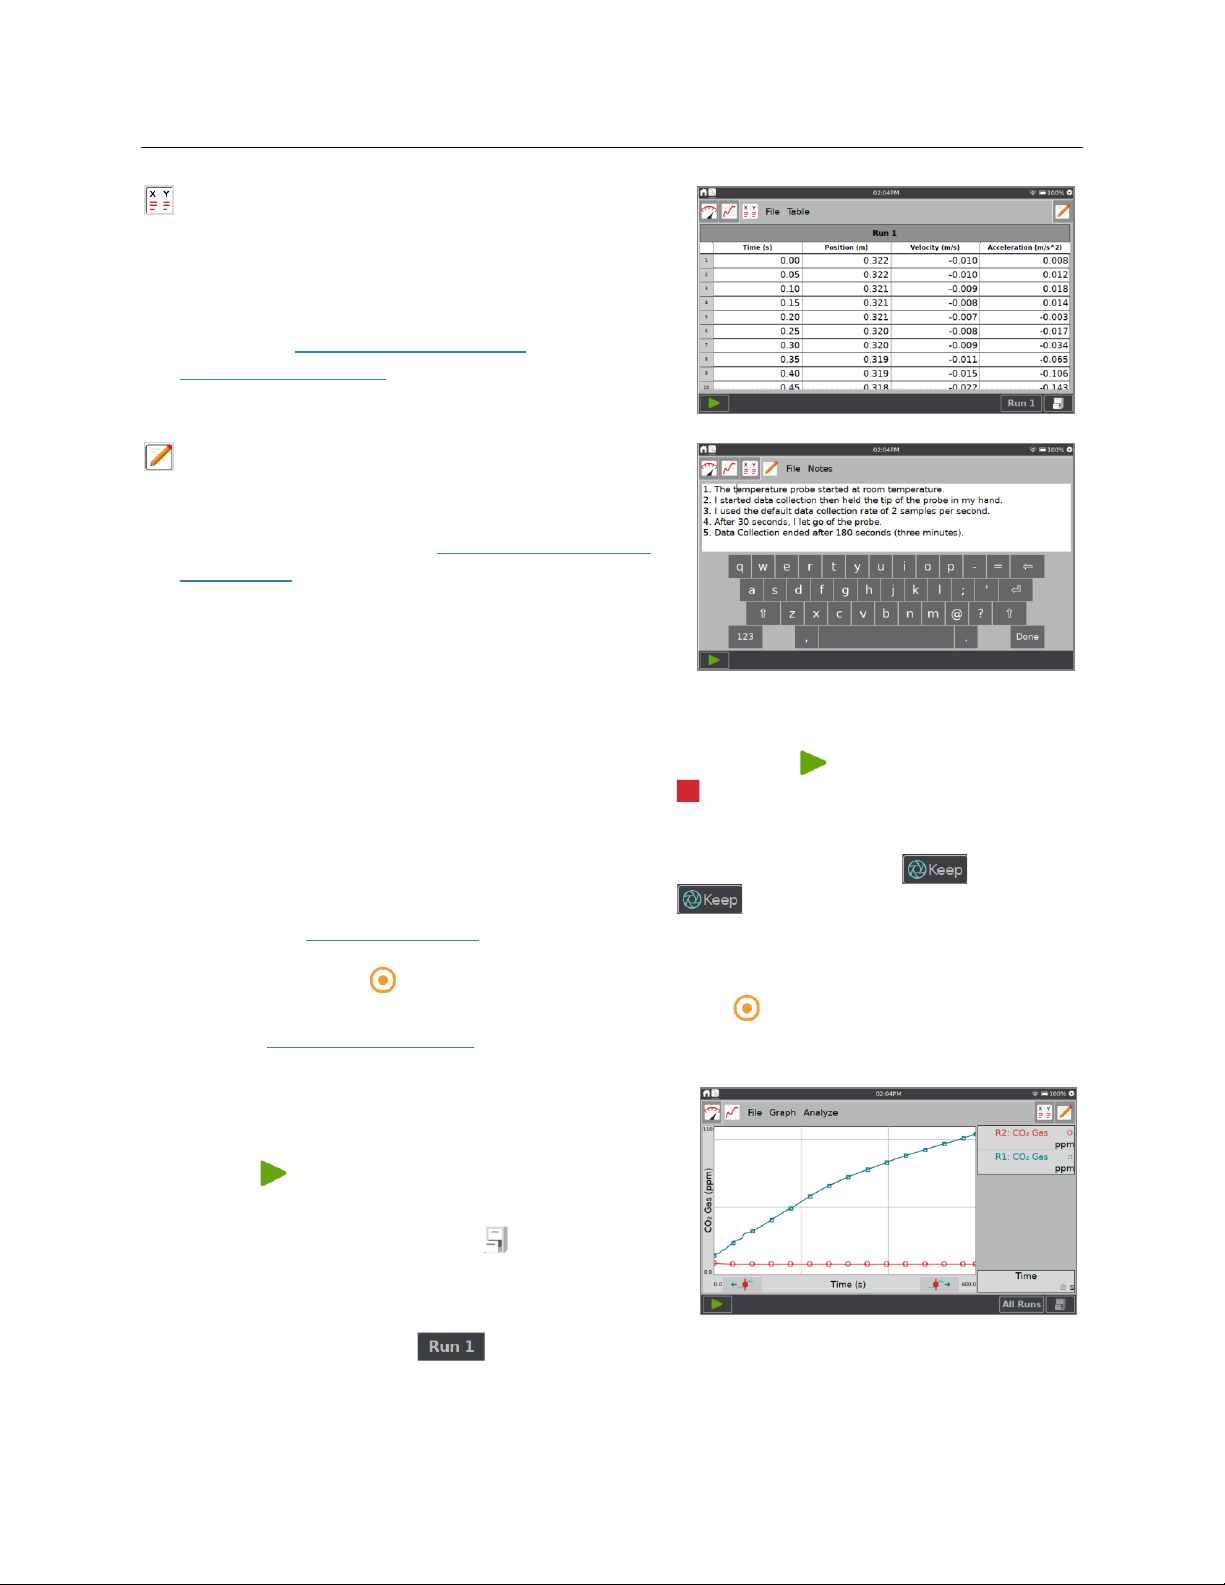
Table screen—Use the Table screen to view a
tabular representation of your data, create
calculated columns, and manually enter data.
For a detailed description of how the Table screen
is used, see Manually Entering Data and
Analyzing Your Data.
Notes screen—From the Notes screen you can
record observations about your experiment.
For more information, see Adding Notes to Your
Experiment.
Data-Collection Controls
To start data collection from any LabQuest App screen, tap Collect, . As data are collected,
the graph and table are updated live. You can tap Stop, , to end data collection early or wait
until the collection completes.
In event-based data-collection modes (e.g., Events with Entry), a Keep button,
, appears to
the right of the Stop button. In this mode, you must tap to record the data point. For more
information, see Events with Entry.
The Data Mark button, , appears to the right of the stop button when the data mark option is
enabled for time-based collections. As data are collected, tap to mark a particular point of
interest. See Enable Data Marking for more information.
Collecting Multiple Runs
To collect more data, overwriting your existing data,
tap Collect, , again.
To collect additional data without overwriting your
previous collection, tap Store Run, , before starting
a new data collection.
To display multiple runs of data on the same graph,
tap the run indicator button, , and select All
Runs.
Page 13
LabQuest® 3 User Manual
www.vernier.com/labq3 7
III. CONNECTING SENSORS
See www.vernier.com/lq3-sensors for a list of sensors compatible with LabQuest 3.
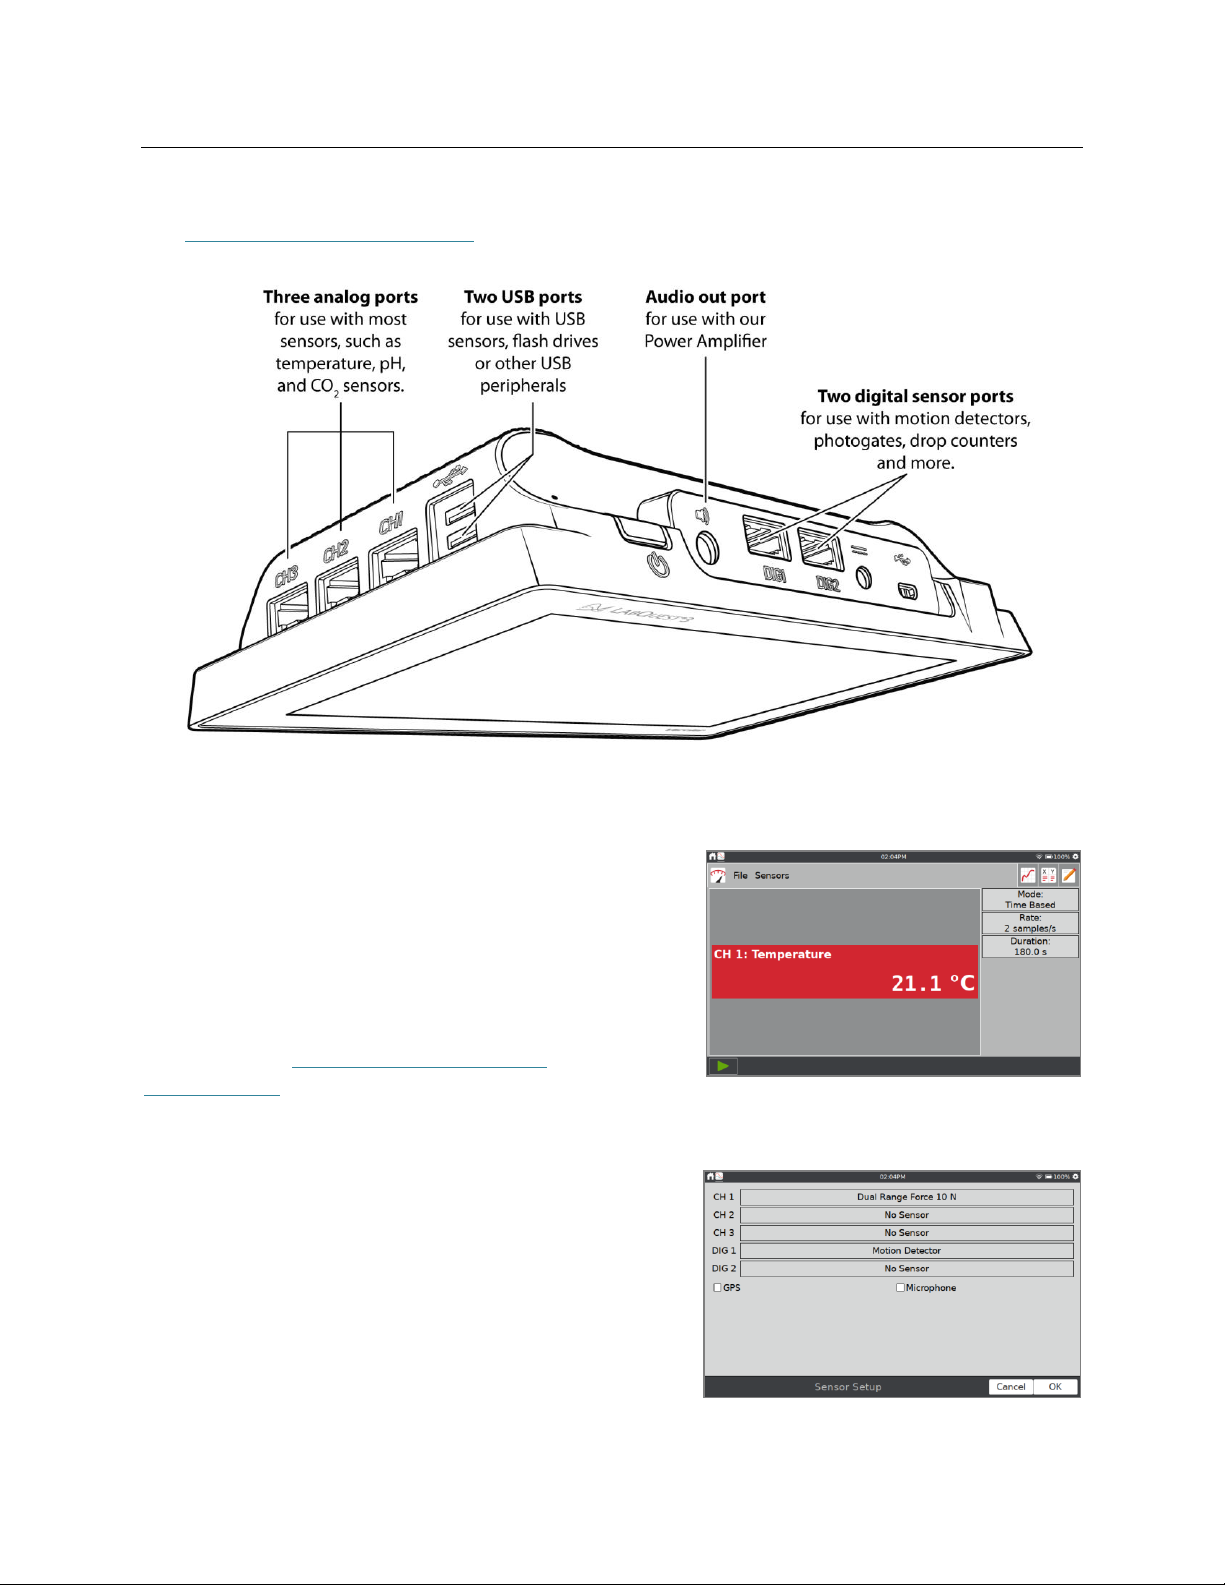
Wired Sensors
Connect your wired sensor to the appropriate sensor
port. LabQuest App displays a meter and sets the
default collection rate for the sensor.
TIP! If connecting a Go Direct® sensor that includes
multiple sensor channels, you may need to modify the
Sensor Channel configuration to use some of the builtin sensors. See Go Direct Sensor Channel
Configuration.
Manual Sensor Setup
If your wired analog (BTA) or digital (BTD) sensor is
not automatically identified by the LabQuest App, you
can set up the sensor manually.
Choose Sensor Setup from the Sensors menu. Tap the
field displaying No Sensor for the channel to which
your sensor is connected. Choose the appropriate
sensor from the list and tap OK.
Page 14
Connecting Sensors
8 Vernier Software & Technology
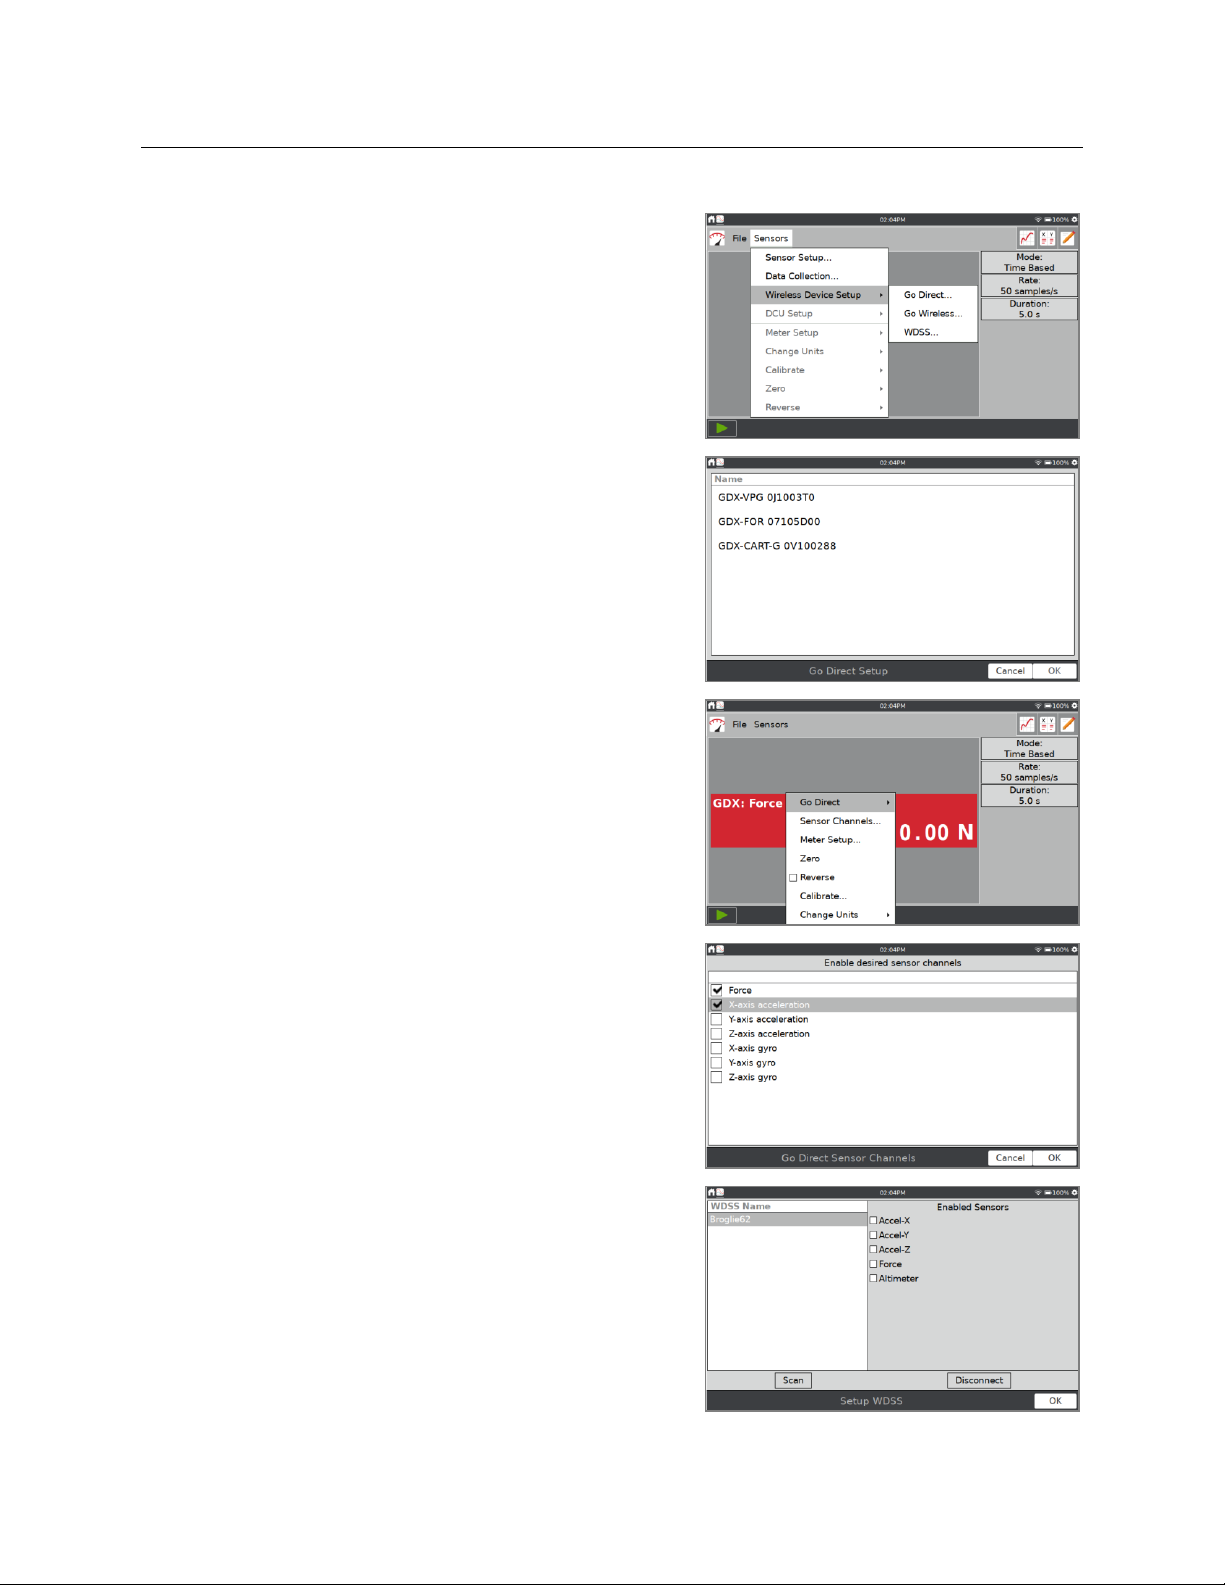
Wireless Sensors
Follow these steps to connect to a wireless sensor.
1. Choose New from the File menu. Power on the
sensor, tap Sensors ►Wireless Device Setup, and
choose the matching sensor type, Go Direct,
Go Wireless, or WDSS.
2. Select your sensor from the list of available sensors
and tap OK.
3. Some Go Direct sensors have multiple sensor
channels. These sensors have default configurations
that do not typically use all available sensor
channels.
Tap the sensor meter and select Sensor Channels to
access the configuration screen. Select the
applicable sensor channels and tap OK.
When connecting a Wireless Dynamic Sensor
System (WDSS), you may need to rescan for
devices if your device does not show up on the
initial scan. Once you are connected to your device,
select the sensors you want to use.
Page 15
LabQuest® 3 User Manual
www.vernier.com/labq3 9
4. LabQuest App automatically sets the default
collection rate for the sensor.
TIP! At most, three Go Direct sensors and three
Go Wireless® sensors can be connected at the same
time.
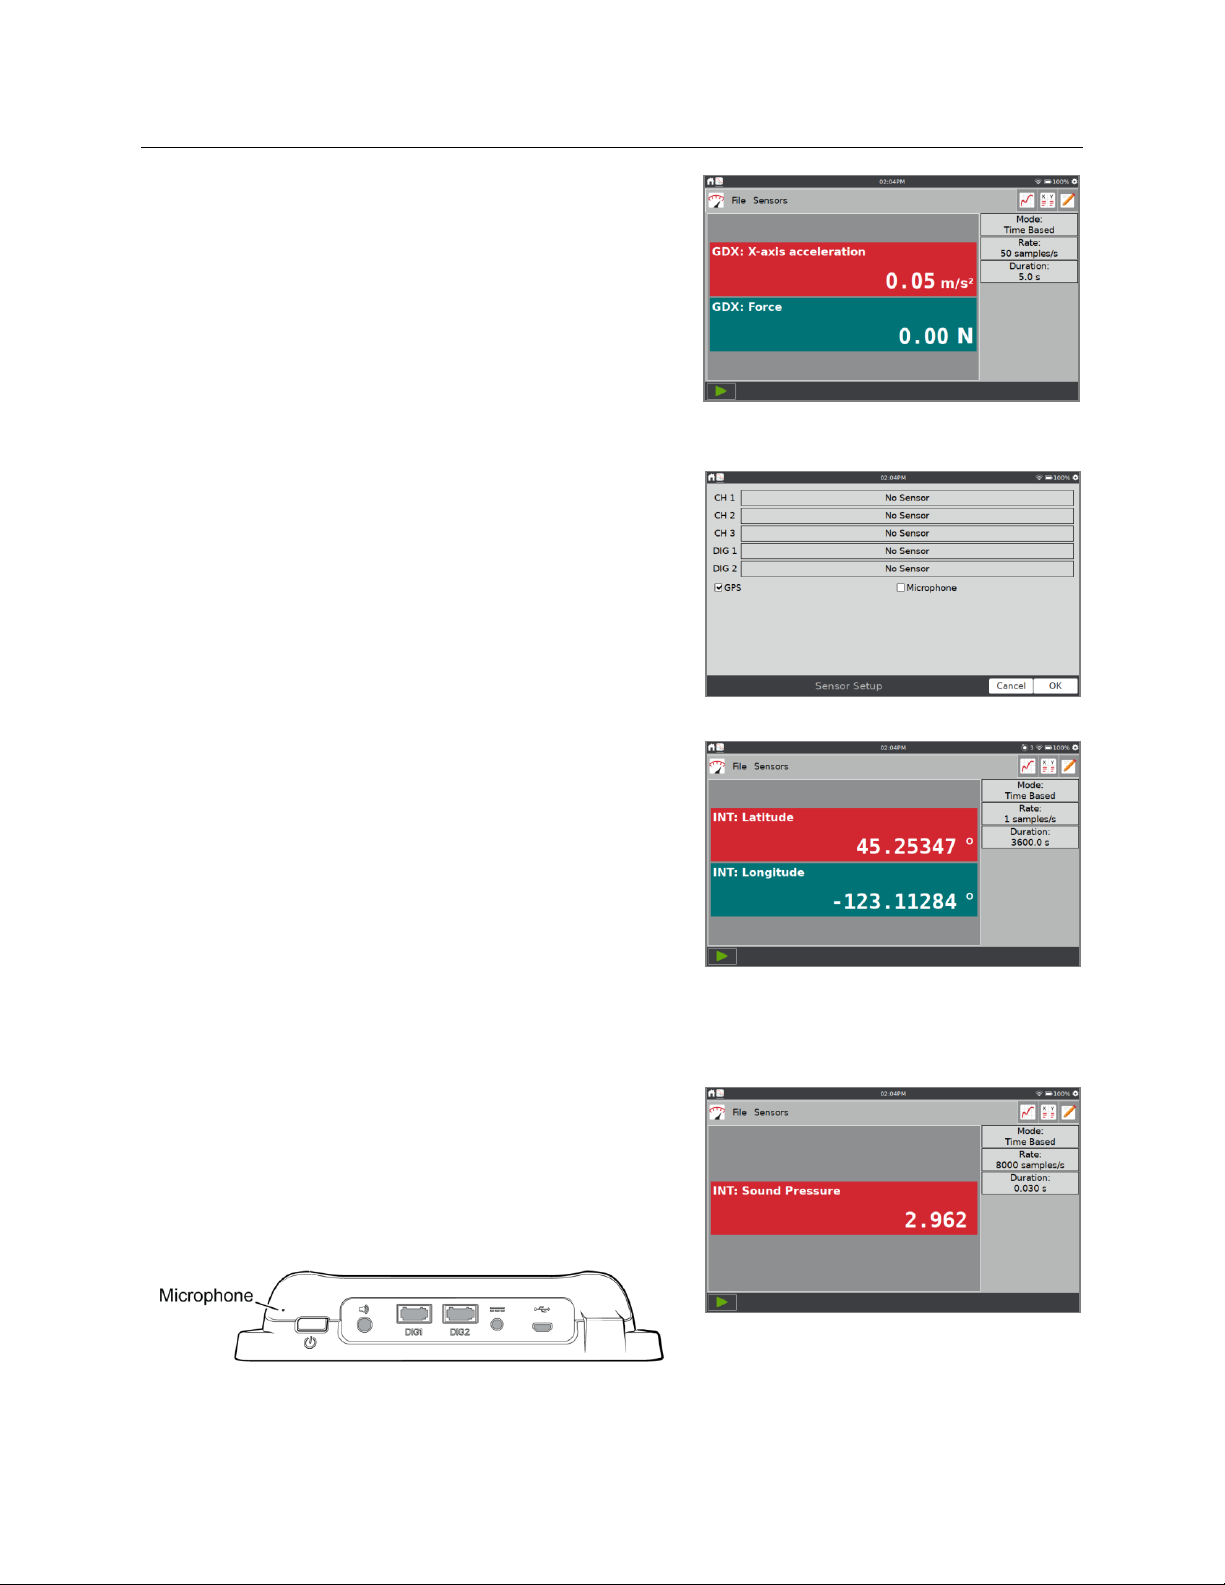
Internal Sensors
LabQuest also has two built-in sensors: GPS and
microphone. To enable an internal sensor, choose
Sensor Setup from the Sensors menu. Within the
Sensor Setup dialog box, select the check box to enable
the associated sensor. Tap OK to return to the Meter
screen.
LabQuest automatically sets the default data-collection
rate for the sensor.
• GPS—The internal Global Positioning Sensor
(GPS) collects latitude, longitude, and altitude
readings, and can be used with other sensors. You
can choose units of decimal degrees, degree
minutes, or UTM.
TIP! It may take 15 minutes or more to acquire
signals from enough GPS satellites to report your
position. This is especially true the first time you
use the sensor or after not using the sensor for a
while. We do not recommend using GPS indoors.
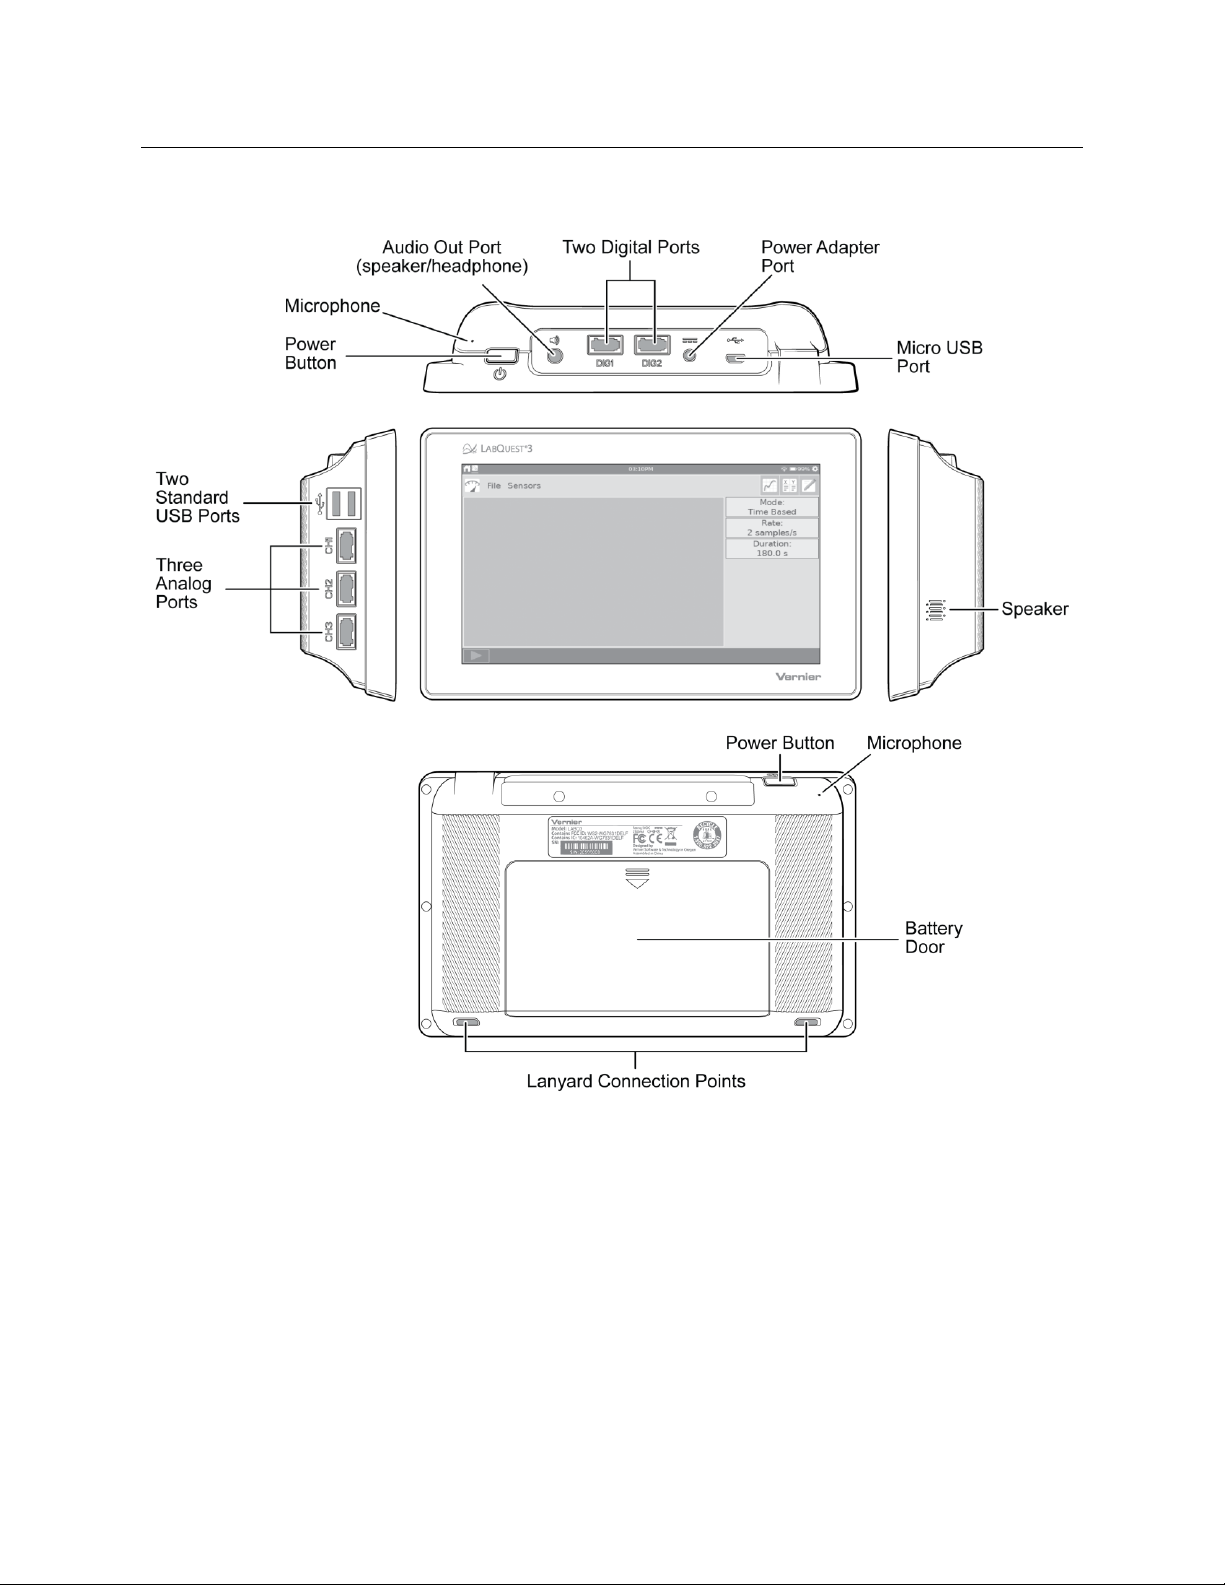
• Microphone—The internal Microphone is located
on the back of LabQuest, near the power button as
shown below. The sensor is used to show
waveforms of the sound inputs. It does not measure
sound level (i.e., decibels).
Page 16

Quick Start to Data Collection and Analysis
10 Vernier Software & Technology
IV. QUICK START TO DATA COLLECTION AND ANALYSIS
Follow these steps to quickly get started with basic data
collection. For more detailed instructions, see Using the
LabQuest App.
1. Press and release the power button located on the
top edge of LabQuest to turn on the unit.
LabQuest App launches automatically.
2. Choose New from the File menu, and then connect
your sensor as described in the Connecting Sensors
section.
LabQuest App will auto-ID the sensor, display a
meter, and automatically set the default collection
rate for that sensor.
3. Tap Collect, . LabQuest App switches to the
Graph Screen and data collection begins. Collected
data are displayed in real time for most sensors.
You can stop collection early by tapping
Stop, . Once data collection is complete, the
graph automatically scales to fit the data.
4. Tap the graph to examine a point of interest. The
coordinates of the point are shown in the panel to
the right of the graph. Tap another point or tap the
Examine buttons to move the cursor left, , or
right, .
TIP! You can pan and zoom the graph as desired
using a two-finger pinch gesture. Double- tap the
graph to rescale the graph to fit the data.
Page 17
LabQuest® 3 User Manual
www.vernier.com/labq3 11
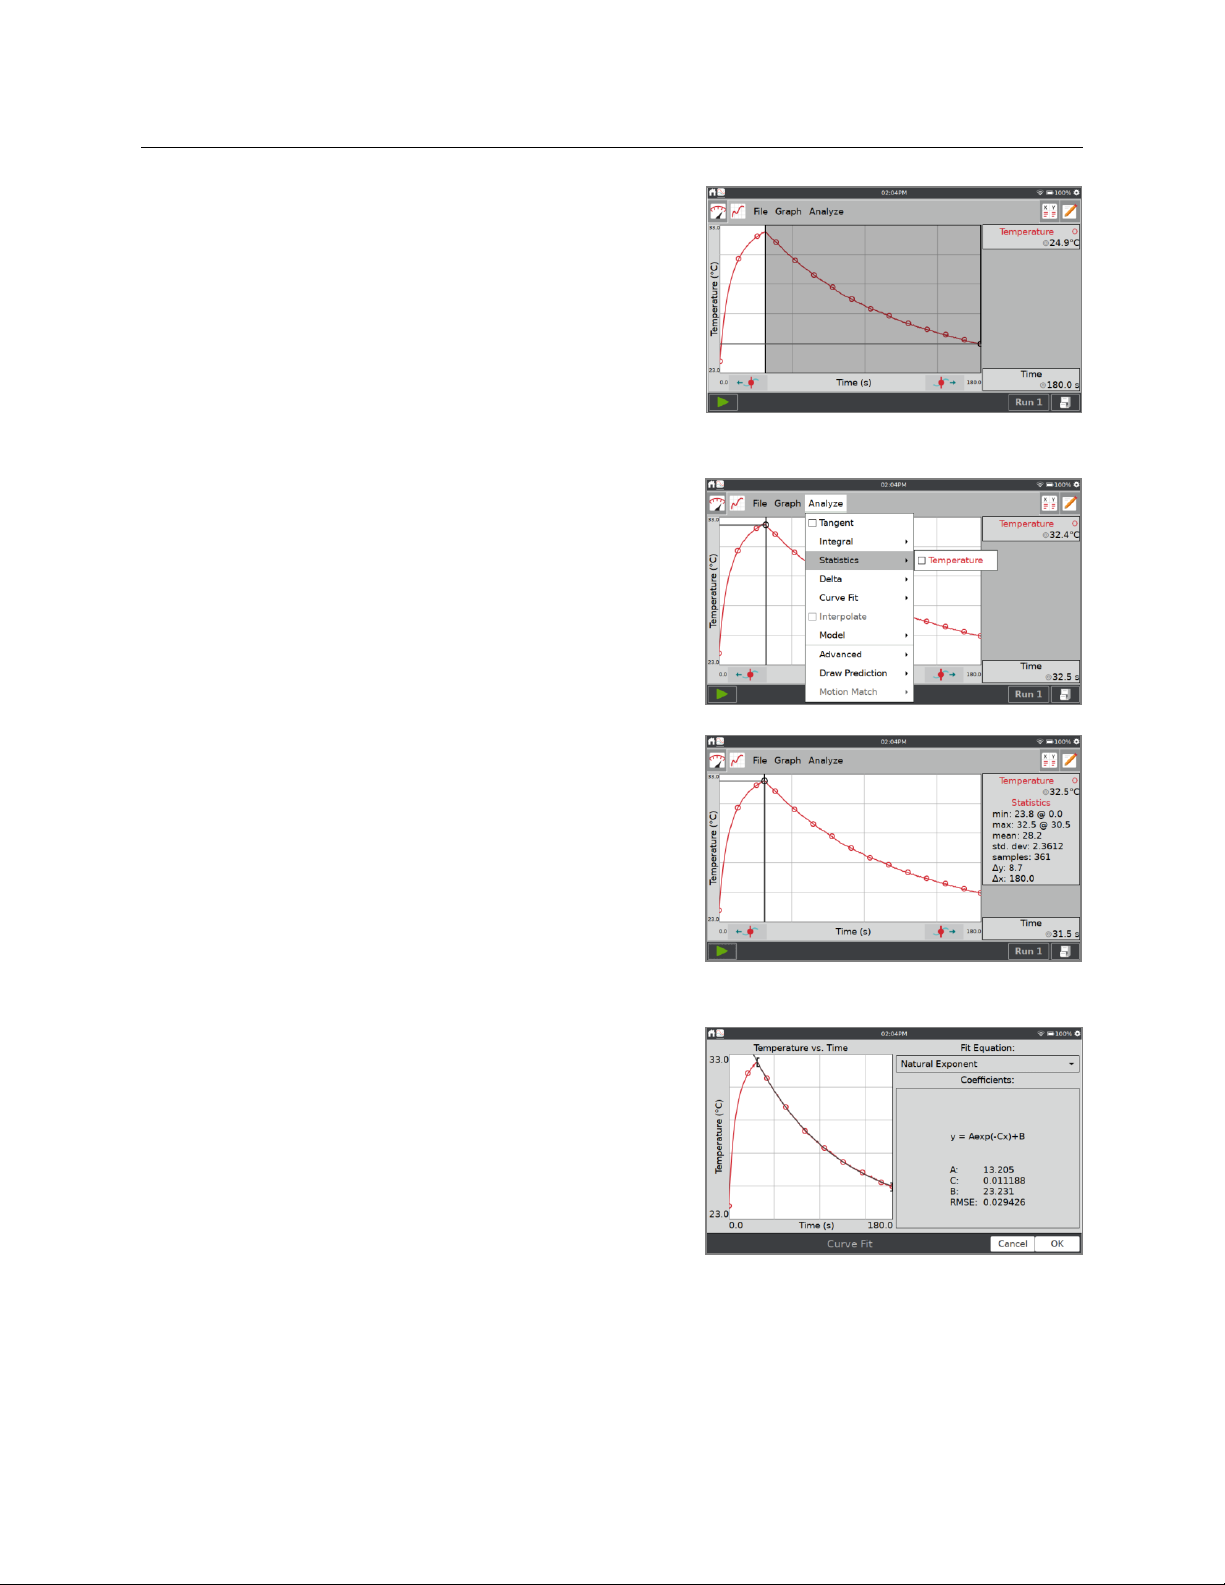
5. For data analysis, you can select to analyze all data
or just a portion of your data. To select a region of
data for analysis, touch-and-drag across the graph
to highlight the desired region.
Statistics
To view statistics for the selected data, choose
Statistics from the Analyze menu. Tap the check
box to select a data column.
The statistics information is then displayed in the
panel to the right of the graph.
To remove the displayed statistics, tap Analyze on
the Graph screen, choose Statistics, and then tap the
checked box to clear the selection.
Curve Fit
To fit a curve to the selected data, choose Curve Fit
from the Analyze menu. Tap the check box to
select a data column (the Linear fit is shown by
default). Tap the Fit Equation dropdown and
choose the desired equation.
LabQuest automatically determines and displays
the fit coefficients and displays a preview of the
curve fit on the graph. Tap OK to apply the fit and
return to the Graph screen.
To remove the fit, choose Curve Fit from the Analyze Menu, and then select the checked box
to clear the selection.
Page 18

Quick Start to Data Collection and Analysis
12 Vernier Software & Technology
TIP! The Curve Fit coefficients cannot be manually adjusted. To enter your own parameters,
see Model in the Analyzing Your Data section.
6. Collect additional data.
• To collect more data, overwriting your existing data, tap Collect, , again.
• To collect additional data without overwriting your previous collection, tap Store Run, ,
before starting data collection.
• When you have multiple runs, tap to select the run you want to show on the graph.
You can also choose to display all runs. For more information, see Changing What is
Plotted on a Graph.
• To clear your data and start over, choose New from the File menu. If you have unsaved
data, you are prompted to Save or Discard your data. You can save the data on the
LabQuest unit or to a connected USB flash drive. For more information, see Managing
LabQuest App Files.
Page 19
LabQuest® 3 User Manual
www.vernier.com/labq3 13
V. USING THE LABQUEST APP
The data-collection and analysis software, LabQuest App, is the heart of LabQuest 3. When you
turn on LabQuest, the LabQuest App starts automatically. If the LabQuest App is not displayed
on your screen, launch LabQuest App from the Home screen. See Accessing Home.
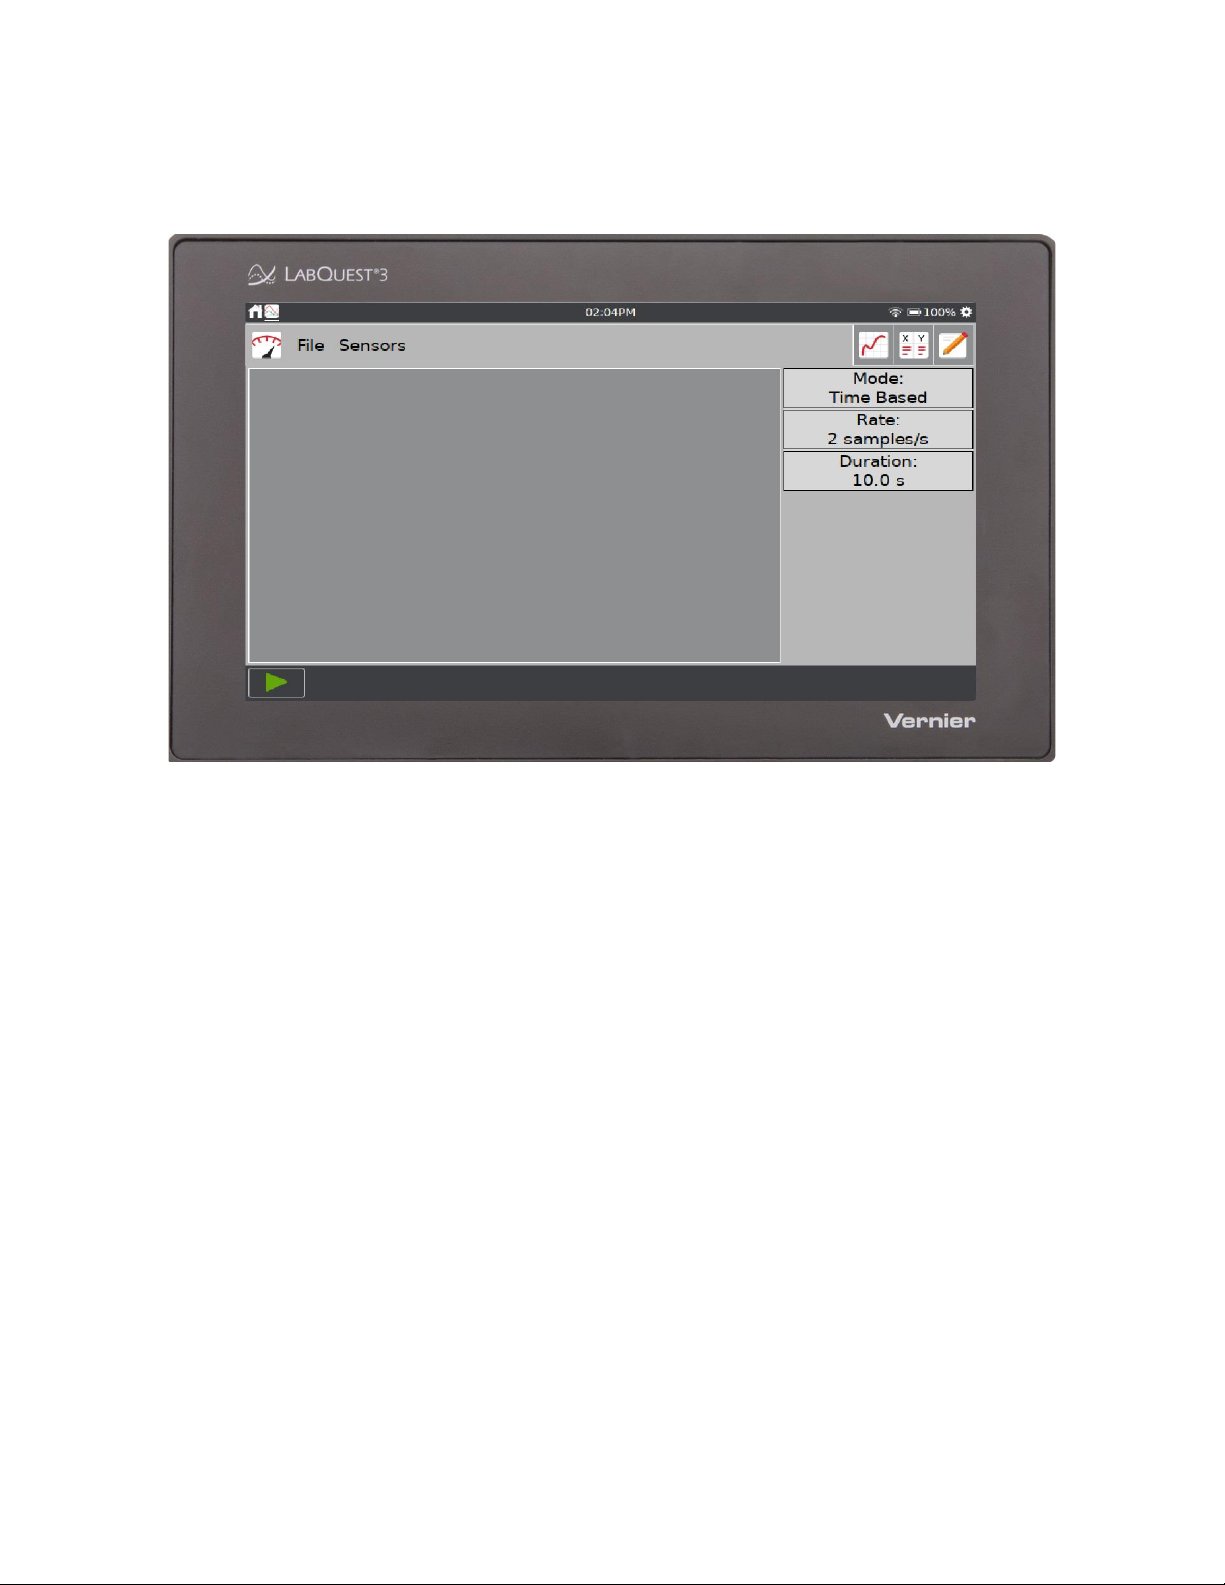
Preparing for Data Collection
Data collection with LabQuest starts from the Meter screen, which is the default screen for
LabQuest App. From this screen, you can view real-time sensor readings as well as a summary
of the data-collection settings. Additionally, you can access tools to modify and customize these
settings for your particular experiment.
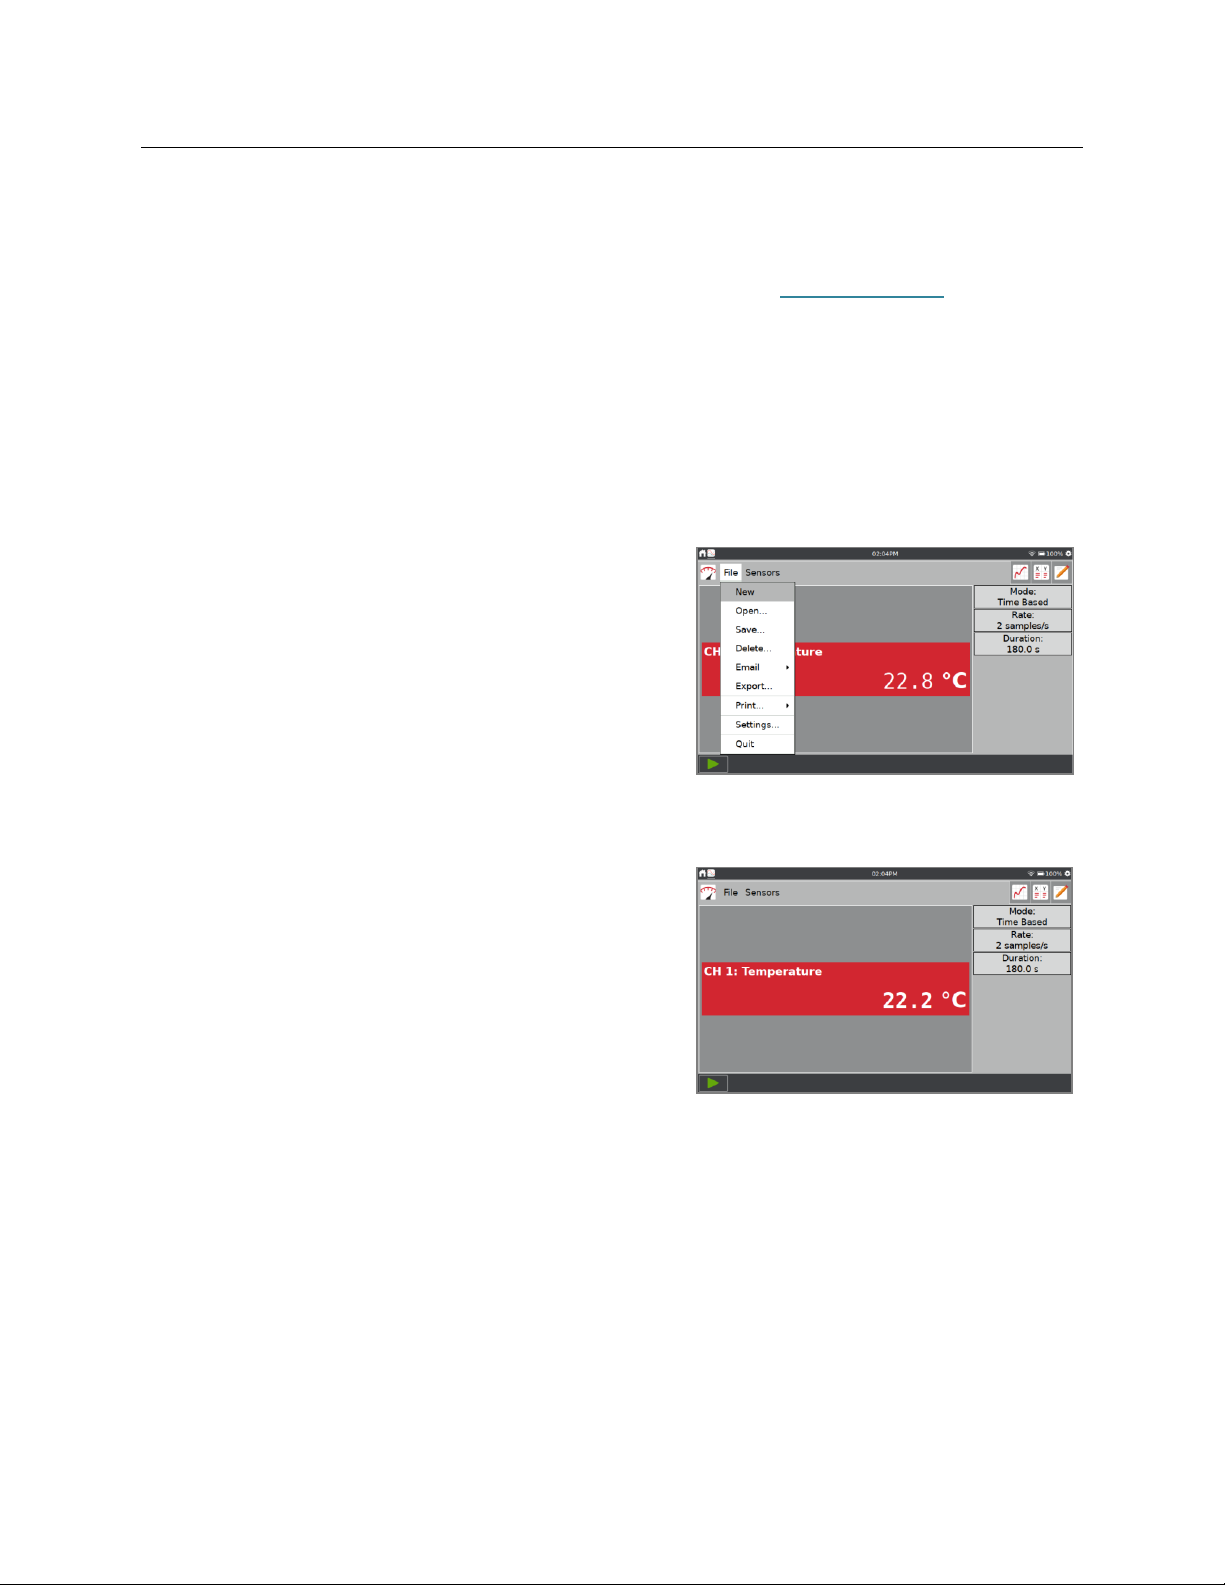
Starting a New File
Choose New from the File menu to reset all datacollection parameters and sensor calibrations back to
default values. If you have unsaved data, you are
prompted to either save or discard the data before
continuing.
TIP! Start a new file before you connect wireless
sensors or manually set up internal sensors. These
sensors are disconnected when you start a new file.
Data-Collection Summary
A summary of the data-collection settings (e.g., Mode,
Rate, and Duration) is shown in the panel to the right
of the sensor meters.
If the settings are not appropriate for your experiment,
tap the summary box to access the Data Collection
Setting dialog.
Page 20
Using the LabQuest® App
14 Vernier Software & Technology
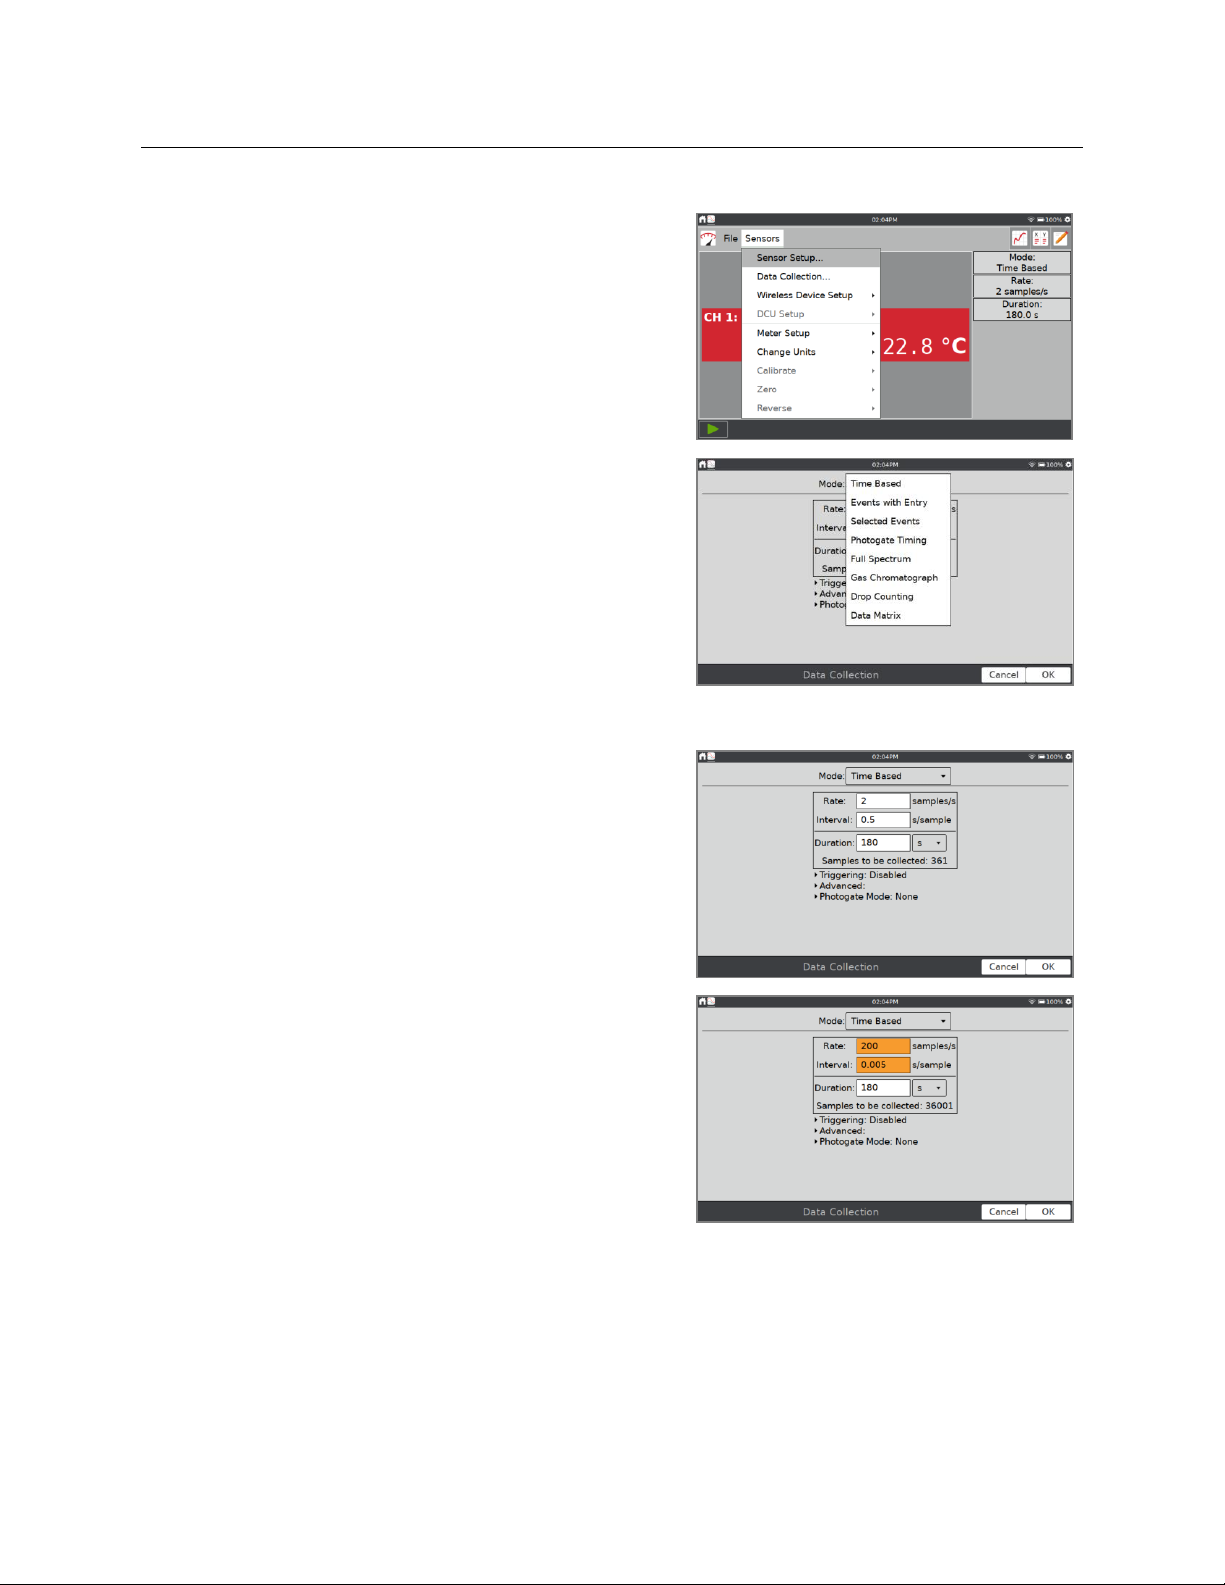
Modifying the Data-Collection Settings
For most sensors, the default data-collection mode is
Time Based. The default collection rate for the
connected sensor is automatically set up when
LabQuest identifies the sensor. To modify the datacollection settings, tap the summary box, or choose
Data Collection from the Sensors menu.
The parameters listed in the Data Collection dialog
depend on the mode selected.
Data-collection modes include Time Based, Events
with Entry, Selected Events, Photogate Timing, Full
Spectrum, Gas Chromatograph, Drop Counting, and
Data Matrix.
Mode: Time Based
Time-based data collection is the default datacollection mode for most sensors. In this mode, sensor
readings are recorded at regular time intervals.
Adjustable parameters for this mode include the rate
(or interval) and duration of data collection. The total
number of samples to be collected based on these
parameters is displayed.
Warning Messages—Under some circumstances, the
Rate, Interval, and Duration fields may be orange or
red. The orange highlight indicates that the rate has
been set to a value slower or faster than what is
recommended for the connected sensor or that the
number of samples could lead to performance issues.
You can still collect data using these settings;
however, you may have undesirable results.
Page 21

LabQuest® 3 User Manual
www.vernier.com/labq3 15
The red highlight indicates one of the following and
you cannot apply the changes until the warning
condition has been resolved:
• The rate has been set to a value slower or faster
than what a connected device and/or sensor
configuration can support.
• The number of samples exceeds the storage
available.
• The number of samples exceeds 2000 (for rates
faster than 80,000 samples/s).
Triggering—Triggering is only available in the Time-
Based mode. When enabled, LabQuest waits for a
trigger condition to be met before recording data. To
set the trigger, choose the sensor and set the threshold
conditions. You can also set the number of points to
be saved before the trigger condition is met.
Advanced—The Advanced field has three options that can be independently enabled by
selecting the associated check box.
• Oversampling can be used with data-collection
rates less than ten samples per second. When
enabled, the sensor samples at a rate higher than
your selected rate. The app averages those
readings and reports an average value for each
collection interval.
Oversampling can be used to reduce
measurement noise by combining a burst of
readings into one value. As an example,
oversampling can sometimes reduce the
influence of unseen but real variations, such as
those from a flickering light source.
• Repeat can be used when the data-collection rate is at most 500 samples per second. When
enabled, a new data-collection run is started as soon as the current run has ended. This
setting is helpful for exploratory investigations.
TIP! Data for each run is overwritten when a new run is started.
Page 22
Using the LabQuest® App
16 Vernier Software & Technology
• Enable Data Marking can be used to mark points
of interest during a time-based data collection.
When enabled, the Mark Data button, ,
appears next to the stop button during data
collection. Tap to mark a particular point of
interest. After completing data collection, data
marks can be named using the panel to the right
of the graph. See Tag Data for more information.
• Photogate Mode—This mode is used for photogate experiments that also use a time-based
sensor. Examples include impulse and momentum and centripetal force experiments that
use a photogate and force sensor to collect the necessary data. See Photogate Timing.
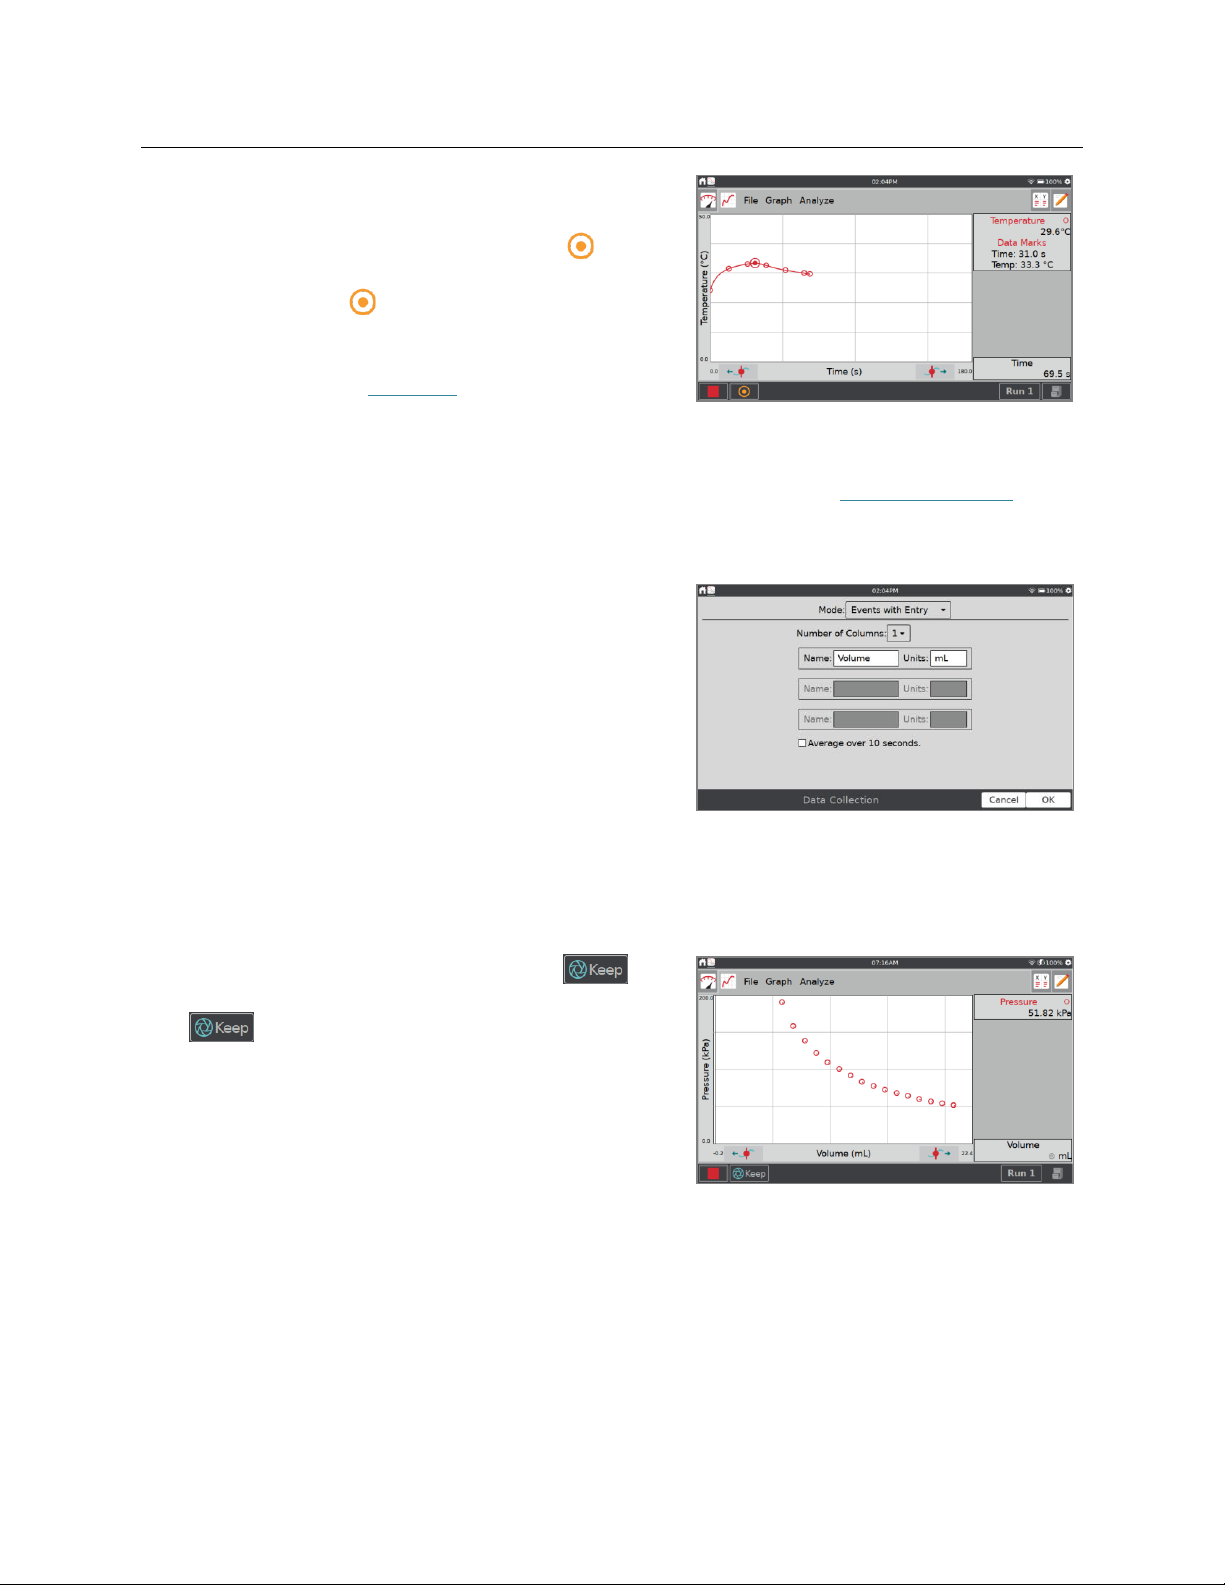
Mode: Events with Entry
Sometimes experiments depend on a quantity other
than time. For example, a Boyle’s law experiment
investigates pressure as a function of the volume of
gas in a closed container.
TIP! In Events with Entry mode, no time information
is recorded.
• Name and Units—Enter a name and units for
each independent variable.
• Average over 10 seconds—You can choose to average data over ten seconds and report
the averaged reading. When selected, each time you keep a point, data are collected for
10 seconds and the average reading over that time period is recorded.
In Events with Entry mode, a Keep button, ,
appears next to the stop button during data collection.
Tap to record the sensor value (e.g., gas
pressure in the Boyle’s law experiment).
In response, you are prompted to enter a value for the
independent variable (e.g., gas volume in the Boyle’s
law experiment). Sensor data are plotted against the
independent variable.
Page 23
LabQuest® 3 User Manual
www.vernier.com/labq3 17
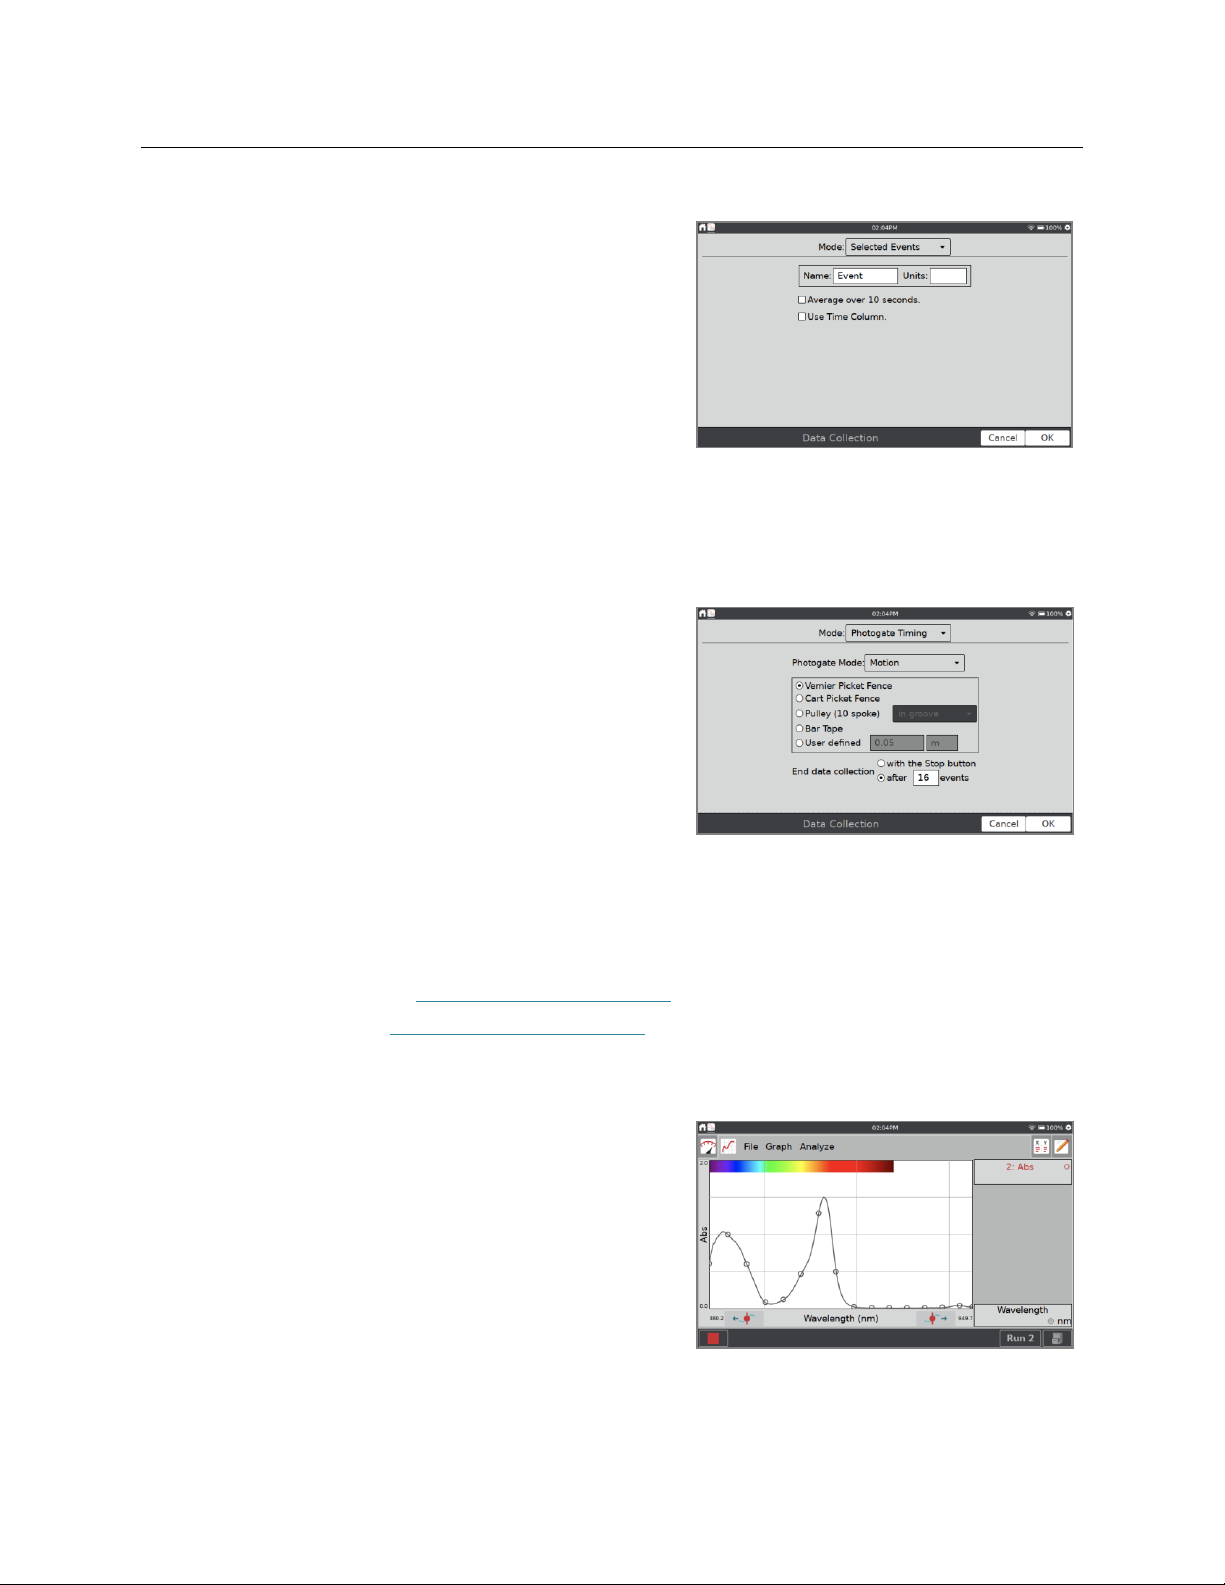
Mode: Selected Events
Selected Events mode is similar to Events with Entry,
except that entries of 1, 2, and 3... are automatically
recorded as the independent variable.
• Name and Units—Enter a name and units for each
independent variable.
• Average over 10 seconds—You can choose to
average data over ten seconds and report the
averaged reading.
• Use Time Column—Choose this option to record time instead of the reference number as the
independent variable.
Mode: Photogate Timing
Photogates require a different set of timing options.
When a wired (BTD) photogate is detected or when a
Go Direct Photogate is set up to use Gate State
channels only, LabQuest App defaults to Photogate
Timing mode.
You have two options for ending data collection in
this mode: with the Stop button or after a defined
number of events. A block/unblock pair counts as two
events, so a picket fence with 8 bars needs to stop
after 16 events.
Choose the proper Photogate Mode for your experiment. For more information, see
• Wired (BTD) Photogates www.vernier.com/til/3329
• Go Direct Photogates www.vernier.com/til/4314
Mode: Full Spectrum
When a spectrometer is detected, LabQuest App
defaults to Full Spectrum mode. In this mode,
Intensity, Absorbance, Fluorescence, or
%Transmittance can be measured as a function of
wavelength.
• For Beer’s law experiments with spectrometers use
Events with Entry mode.
• For Kinetics experiments use Time Based mode.
Page 24

Using the LabQuest® App
18 Vernier Software & Technology
Mode: Gas Chromatograph
When a Vernier mini gas chromatograph (e.g., Vernier Mini GC™ Plus) is detected, LabQuest
App defaults to the Gas Chromatograph mode. In this mode, various parameters are available
for the user to establish a temperature and pressure profile adequate for the current experiment.
When starting data collection, a set of default
parameters is displayed. Tap the parameter field to
enter a new value, or adjust the default value using the
buttons. These values are reflected in the preview of
the time-dependent temperature graph displayed to the
right. After setting the parameters, tap OK to initiate
the warm up.
Mode: Drop Counting
LabQuest App defaults to this mode when a Vernier
Drop Counter or Go Direct Drop Counter are
connected. When using this mode, data points are
recorded every time a drop is detected by the drop
counter. For information on calibrating a drop counter,
see
• Vernier Drop Counter
www.vernier.com/manuals/vdc-btd
• Go Direct Drop Counter
www.vernier.com/manuals/gdx-dc
Mode: Data Matrix
This mode is helpful for field work. It provides a way
to collect data referenced to two parameters, such as
the locations of your sampling sites and the dates they
are sampled. You can collect data from up to eight
sensors by adding and removing sensors during data
collection.
For more detailed information, see
www.vernier.com/til/2366/.
Page 25

LabQuest® 3 User Manual
www.vernier.com/labq3 19
DCU Setup
Connect a Digital Control Unit (DCU) to one of the
LabQuest digital ports. Choose DCU Setup from the
Sensors menu and select the DCU for setup.
• Test DCU—Manually turn on and off the digital
lines.
• Configure Activation—Use logic statements to
activate digital lines based on sensor readings.
• Start Activation—Apply digital output logic
immediately or only while collecting data.
Once digital output has been activated, automatic identification of sensors is disabled for the
port used by the DCU. The LabQuest App cannot detect the removal of the DCU or the addition
of any other digital sensor in that port. To turn off the digital output and enable auto-ID of
sensors, choose New from the File menu.
Configuring Sensors
A digital meter for each connected sensor is shown on
the meter screen. Tap on a sensor meter to display
options for changing sensor settings. The available
options depend on the sensor and can include options
to set up channels, change units, calibrate, zero, and
reverse the sensor. Many of these options can also be
accessed from the Sensors menu.
Go Direct Sensor Channel Configuration
Many Go Direct sensors have multiple sensor
channels. These sensors have a default configuration
that does not typically use all available sensor
channels.
Tap the sensor meter and select Sensor Channels to
access the configuration screen. Select the applicable
sensor channels and tap OK.
Page 26

Using the LabQuest® App
20 Vernier Software & Technology
Meter Type
The default meter style is a digital meter. You can also
display the meter as an analog meter.
To display an analog meter, tap the meter and choose
Meter Setup.
• Meter Type—Choose Digital, Analog (Bar) or
Analog (Pointer).
• Analog Meter Range—Enter the minimum and
maximum values for the numeric range displayed
on the analog meter. The default values are the
same as those used with the default graph setup.
• Show digital reading—When selected, this option
displays the digital sensor reading on the analog
meter.
TIP! Vernier energy sensors use analog meters by
default. All other sensors use digital meters.
Meter Name and Displayed Precision
The column name and default display precision are
intentionally determined based on the specific sensor.
You can change these values as needed.
From the Table screen, select Data Column Options
from the Table menu. Select the column that
corresponds to the meter you want to change.
Page 27

LabQuest® 3 User Manual
www.vernier.com/labq3 21
• Name—Change the column name.
• Units—If a sensor can be displayed with different
units of measure, you can change units here.
• Displayed Precision—Choose the number of
decimal places or significant figures to show in the
meter and in the data table. You can also choose to
display the values using scientific notation.
Changing Units
Some sensors can have the data displayed in other
units. Generally the default units are the SI unit for
that particular sensor reading. Tap the meter, choose
Change Units, and select the applicable unit.
Choosing a new unit updates all existing and
subsequent data for that sensor. Not all sensors can
change units.
Calibrating the Sensor
Most sensors use a custom calibration stored on the
sensor. However, some sensors do require calibration.
Choose Calibrate from the Sensors menu to calibrate a
sensor. Updating the calibration does not change data
already collected.
For more information on calibrating a sensor, see
www.vernier.com/til/3394 or your sensor’s user
manual. Not all sensors can be calibrated.
Zeroing the Sensor Reading
Tap the meter and choose Zero to set the current
sensor reading to zero. This adds an offset to all
subsequent sensor readings; data already collected are
not affected. Not all sensors can be zeroed.
TIP! Multiple sensors can be zeroed at the same time
by choosing Zero from the Sensors menu and selecting
All Sensors.
Page 28

Using the LabQuest® App
22 Vernier Software & Technology
Reversing the Sensor Reading
Some sensors read both positive and negative values.
For example, force sensors by default read positive
values when pulled, and negative values when
compressed.
Tap the meter and choose Reverse to swap the sign of
the reading with respect to the default sensor reading.
Not all sensors can be reversed.
Setting up Graphs
The default graph configuration is based on the connected sensor(s) and the selected datacollection mode. You can change the default behavior as desired. Changes to the graph can be
made either before or after data collection.
One or Two Graphs
The number of graphs displayed is determined by the connected sensors. While most sensors
typically only show one graph, some sensors, such as the motion detector, show two graphs by
default. When using multiple sensors, sensors with different units are plotted on separate axes
whenever possible. Sensors (and Go Direct Sensor Channels) added prior to data collection are
plotted automatically.
You can change the number of graphs displayed from
the Graph screen. Choose Show Graph from the Graph
menu and select the desired Graph configuration.
• Full Width—This option displays the graph(s)
using the full width of the screen by hiding the
graph details displayed to the right of the graph.
• Show Spectrum—When using a spectrometer, you
can control the color background shown on the
graph to be full screen, a narrow strip, or not
shown.
When two graphs are displayed, the graphs have a
common x-axis. While you can change the associated
data column and scaling of the independent axis, the
change applies to both graphs.
Page 29

LabQuest® 3 User Manual
www.vernier.com/labq3 23
Changing What is Plotted on a Graph
To change what is plotted on a graph, tap the axis
label, and add or remove a column that is plotted.
When data from more than one trial are available, you
can change which run to display or display all runs.
Tap on the Run selector button, , and select
which run to display.
For even more control over the graph setup, choose
Graph Options from the Graph menu.
Use the Graph Options dialog to change the style of
the graph traces.
• Point Symbols—Surround some, but not all, of the
points with a mark (e.g., a circle or triangle).
• Connect Points—Connect contiguous data points (data-table order) with straight-line
segments. The order the points are connected is determined by their order in the data table.
These lines help the eye follow the data trend but are not equivalent to a curve fit. By
default, connected points are on for time-based collections and off for events-based
collections such as Events with Entry.
Scaling the Graph
The scaling on your graph is set up automatically based on the connected sensors and datacollection mode. During data collection, the graph autoscales as needed to ensure all collected
data points are shown on the graph. When data collection is complete, the graph updates to fit
the data. If needed, you can adjust the scaling manually.
Page 30

Using the LabQuest® App
24 Vernier Software & Technology
Autoscale Options
Choose Graph Options from the Graph menu to
modify the autoscale settings. There are three options.
• Autoscale—This is the default option and
functions as described above.
• Autoscale from 0—This is the same as the default
option except that the origin is always shown on
the graph.
• Manual—This scaling option respects the graph scaling you have chosen.
Manual Scaling the Graph using Gestures
Use a two-finger pinch/zoom/pan gesture to rescale the graph as desired. Rescaling the graph
during data collection is not recommended unless your Autoscale option is set to Manual. This
is because a new data point could force the graph to rescale to show that point.
Double-tap the graph to rescale the graph to fit the data.
Manually Scaling the Graph Using Menus
Choose Graph Options from the Graph menu to
manually adjust the graph scaling.
• Left and Right—These change the x-axis range and
apply to both Graph 1 and Graph 2.
• Top and Bottom—These change the y-axis range.
There are separate entry boxes for Graph 1 and
Graph 2.
Choose Autoscale Once from the Graph menu to scale
the graph to the data. This is the same as doubletapping the graph.
TIP! Be sure your autoscale option is set to Manual if
you want to retain your manual scaling during data
collection.
Page 31

LabQuest® 3 User Manual
www.vernier.com/labq3 25
To zoom in on a selected region of data, touch and
drag across the screen to highlight a region. If needed,
you can adjust the trailing edge of the selected region
using the Examine Buttons ( , ).
Choose Zoom In from the Graph menu to scale the
x-axis to match the selected region. The y-axis
automatically scales to fit the data.
Choose Zoom Out from the Graph menu to undo a
Zoom In and return the graph axes to the previous
settings. If Zoom In is used several times, Zoom Out
will undo each Zoom In one at a time.
Drawing Predictions
The LabQuest App has a free-hand sketch tool for drawing on the Graph screen. This can be
used for a variety of purposes. It is most often used to sketch a prediction of how a graph will
appear once data are subsequently collected.
Choose Draw Prediction from the Analyze menu.
Select the desired graph (Graph 1 or Graph 2) to
activate the tool.
Touch-and-drag across the screen for smooth curves
or tap the screen in several places to connect
sequential taps with straight-line segments. The Reset
button removes your sketch if you need to start over.
Tap OK to place your sketch on the main graph. To
remove a prediction, choose Draw Prediction again
from the Analyze menu.
TIP! When collecting data, the data plot over the
prediction line.
Page 32

Using the LabQuest® App
26 Vernier Software & Technology
Motion Matching
The Motion Match feature adds a target position or velocity plot on your graph that you can
match as you collect data. The Motion Match menu is only available if a Motion Detector (any
version), Motion Encoder, or Go Direct Sensor Cart is connected.
Choose Motion Match from the Analyze menu and
select either a New Position Match or New Velocity
Match to activate the tool.
When Motion Match is activated, a random target
graph is generated for the matching exercise. Only the
selected graph (Position or Velocity) is shown.
You can change or remove the target graph by again
choosing Motion Match from the Analyze menu and
selecting the applicable option.
When you start data collection, the collected data plot
over the target data. You can collect data over the
target graph an unlimited amount of times.
TIP! When using Motion Match, automatic graph
scaling is disabled. The graph does not automatically
scale to fit the data during or after data collection.
Collecting Data
To start data collection, tap Collect, , from any LabQuest App screen. As data are collected,
the graph and table are updated. You can tap Stop, , to end data collection early or wait until
the collection completes.
In event-based data-collection modes (e.g., Events with Entry), a Keep button,
, appears to
the right of the Stop button. In this mode, you must tap to record the data point. For more
information, see Events with Entry.
The Data Mark button, , appears to the right of the Stop button when that option is enabled for
time-based collections. As data are collected, tap to mark a particular point of interest. See
Enable Data Marking for more information.
Page 33

LabQuest® 3 User Manual
www.vernier.com/labq3 27
Collecting Multiple Runs
To collect more data, overwriting your existing data,
tap Collect, , again. To collect additional data
without overwriting your previous collection, tap Store
Run, , before starting a new data collection.
To display multiple runs of data on the same graph, tap
the run indicator button, , and select All Runs.
Deleting Unwanted Runs
If you have collected multiple runs, you can delete runs
that are no longer needed.
From the Table screen, choose Delete Run from the
Table menu and select a run to delete.
NOTE: You cannot delete the last dataset created as it
is the active dataset for continued data collection.
Manually Entering Data
You can use LabQuest App to graph and analyze manually entered data. When no sensors are
connected, the table and graph default to display two manual data columns: X and Y. You can
manually enter data from the Table screen.
Navigating the Table Screen
Below are the common gestures used to navigate the Table screen:
• Edit a cell—Double-tap a cell, column name, or run name to edit the contents.
• Scroll the data table—Swipe up and down to scroll the data table.
• Pan the data table—When there are more than five columns in your data table, you can
touch and drag the table to view the additional columns.
• Select multiple cells—Touch-and-hold, then drag across the screen to select multiple cells.
Use the selected cells in conjunction with Strike Through Data and Cut/Copy/Paste edit
tools found in the Table menu.
• Change the displayed run—Tap the Run indicator button, , to change which dataset is
displayed on the data table.
Page 34

Using the LabQuest® App
28 Vernier Software & Technology
Naming a Column
From the Table screen, double-tap the column name to
access Column Options. Update the fields as needed.
• Name—Change the column name.
• Units—Enter units for your data.
• Displayed Precision—Choose the number of
decimal places or significant figures to show in the
table.
Entering and Editing Manual Data
From the column options dialog box, you can
automatically generate values, or you can enter data
manually.
Double tap a cell to enter or edit the cell data. Only
manual columns can be edited directly in this manner.
Sensor and time data cannot be edited in this way.
From the Table menu, you have access to edit tools
Cut, Copy, and Paste. Use these tools to copy data
from one column to another.
TIP! You can copy values to and from the table and
other applications such as the Calculator or the
Stopwatch.
Adding Manual Columns
Choose New Manual Column from the Table menu to
create additional manual columns as needed. Modify
the Name, Units, and Displayed Precision as desired.
TIP! You can also add a manual column to an
experiment file that includes sensor data.
Creating Calculated Columns
Calculated columns are columns with values that are based on other columns through a
mathematical formula. For example, you might define a calculated column as the inverse square
of another column, or you might calculate the ratio of mass and volume columns to create a
density column.
Page 35

LabQuest® 3 User Manual
www.vernier.com/labq3 29
Choose New Calculated Column from the Table
menu. Modify the Name, Units, and Displayed
Precision as desired.
Tap the Equation Type field and select an equation
type for your calculation. Note that A, B, C, etc.,
represent constants and X, Y, and Z represent other
data columns.
Define the data columns and coefficients for your
equation and tap OK.
TIP! Calculated columns can also be used with sensor
data and can be a useful data-analysis tool.
Managing the Data
Data that you have collected but no longer want can be deleted from the LabQuest App file.
• Delete Data Columns—Choose Delete Data Column from the Table menu and choose the
column you want to delete. Note that you cannot delete data collected from a sensor;
however, you can hide data using the Strike Through Data tool.
• Delete Run—If you have collected multiple runs, you can delete runs that are no longer
needed. Choose Delete Run from the Table menu and select a run to delete. Note that you
cannot delete the last dataset created.
• Clear All Data —Choose Clear All Data from the Table menu to delete all data from the
table. Upon choosing this option, you are prompted to confirm. This option is used when
you wish to clear previously manually entered data or collected sensor data without
changing any custom settings.
Page 36

Using the LabQuest® App
30 Vernier Software & Technology
Analyzing Your Data
Most data analysis can be done from the Graph screen. Analysis can include examining data on
the graph, calculating statistics, modeling with automatic or manual curve fits, and doing a FFT
analysis of your data. The results of your analysis are shown in the plot details box to the right
of the graph. Tap the box to view the results in a full screen.
To remove an analysis from your graph, select it again.
Examining the Data
To examine data on the Graph screen, tap on a data
point of interest. The Examine cursor jumps to the
data point with the nearest x-value. Cursor lines
highlight the x- and y-axis values and the coordinates
are displayed to the right of the graph.
You can make fine adjustments to the cursor location
by using the Left, , and Right, , examine
buttons.
Tangent
The Tangent mode enhances the Examine cursor by
adding a tangent line and numeric display of the slope
as you tap different locations on the graph. Choose
Tangent from the Analyze menu to activate this tool.
Interpolate
When you have performed a curve fit, you can use the
Interpolate tool to examine points on the fitted
function. Choose Interpolate from the Analyze menu
to activate this tool.
The Examine cursor locates a position on the fitted
function instead of a data point. Coordinates are
shown to the right of the graph.
TIP! When using Interpolate, the examine cursor is a square instead of a circle, the data points
and connecting lines are gray, and the curve fit is drawn in color.
Page 37

LabQuest® 3 User Manual
www.vernier.com/labq3 31
Tag Data
Use the tag data tool to tag a data point with a
comment for later reference.
Tap a point you wish to tag, then choose Tag Data
from the Graph menu to tag that point. The tagged
point is indicated with a large circle or square. Repeat
as needed.
To add comments, tap in the panel to the right of the
graph and enter a comment into the blank field.
TIP! Tag Data does not work for manually entered
data. If more than one run is plotted on the graph,
only the point from the most recent run is tagged.
Excluding Data from Analysis (Strike Through Data)
While you cannot delete data collected from sensors, you can exclude some data points from
the analysis. This option is called Strike Through Data. You can access Strike Through Data
from the Graph or Table menu.
Tap on a data point or touch-and-drag to select a
region of data that you wish to strike. The data can be
selected from either the graph or the table.
Choose Strike Through Data from either the Graph or
Table menu.
The struck data no longer appear on the graph.
Page 38

Using the LabQuest® App
32 Vernier Software & Technology
The data are shown in the table as struck. This is what
gives the tool its name.
To restore all struck data, choose Restore Data from
either the Graph or Table menu.
Delta
The Delta tool opens a preview graph where you can examine x- and y-deltas over regions of
your data.
From the Graph screen, choose Delta from the
Analyze menu. Touch-and-drag across the graph to
create a box overlaid on the graph. The vertical side of
the box yields y, and the horizontal side of the box
yields x.
To redo the selection, touch-and-drag again.
Tap OK to keep these values and display the box on
the graph. To exit the Delta tool without displaying
the box on the Graph screen, tap Cancel.
Integral
The Integral tool numerically integrates graphed data. If a region of the graph is selected, only
that region is used for the integral. If there is no selection, the entire graph is used. See also
Peak Integration.
From the Graph screen, choose Integral from the
Analyze menu. Enable the tool by tapping on the
displayed sensor or column name.
The area representing the integral is shaded and the
numeric result is displayed in the panel to the right of
the graph.
Page 39

LabQuest® 3 User Manual
www.vernier.com/labq3 33
Statistics
The Statistics tool displays descriptive statistics for selected data. If a region of the graph is
selected, only that region is used for fitting. If there is no selection, the entire graph is used.
From the Graph screen, choose Statistics from the
Analyze menu. Enable the tool by tapping on the
displayed sensor or column name.
The results are displayed in a panel to the right of the
graph. If a region is selected, brackets are drawn to
indicate the region used for calculations.
Curve Fit
The Curve Fit tool fits a chosen function to your data. If a region of the graph is selected, only
that region is used for fitting. If there is no selection, the entire graph is used.
From the Graph screen, choose Curve Fit from the
Analyze menu. Enable the tool by tapping on the
displayed sensor or column name.
A linear fit is displayed by default. To select a
different curve fit, tap the fit equation and choose the
desired equation.
LabQuest displays the fit in the preview graph at the
left. The fit coefficients and root mean square error
(RMSE) are displayed. For linear fits, the correlation
coefficient is also displayed.
Tap OK to keep this fit and display the curve on the
Graph screen. To exit the Curve Fit tool without
applying the curve fit, tap Cancel.
TIP! The RMSE is a measure of how well the fit matches the data. The smaller the RMSE, the
closer the data points are to the fitted line. The RMSE has the same units as the y-axis data.
Page 40

Using the LabQuest® App
34 Vernier Software & Technology
Model
The Model tool manually fits a chosen function to your data.
From the Graph screen, choose Model from the
Analyze menu. Enable the tool by tapping on the
displayed sensor or column name.
Choose the desired model equation from the Model
Equation list. LabQuest displays the modeled function
in the preview graph.
The model parameters (e.g., A, B, and C) are
adjustable. Change them by direct entry or by using
the + and – buttons. Use the Δ tool to modify the
difference associated with the buttons.
Tap OK to display the modeled function on the Graph
screen. To exit the Model tool without applying the
function, tap Cancel.
TIP! If no function appears on the graph when modeling, your parameters are likely defining a
curve that is outside of the plot window.
Baseline Adjustment
This tool is used when analyzing spirometer data. For a series of breathes, the volume data from
each breath should increase and then decrease, returning close to zero for each breath cycle.
In some cases, the baseline drifts making it so that
volume appears to increase or decrease by a given
amount for each breath. The baseline adjustment
applies a factor to compensate for this error.
Because LabQuest App uses the x-axis as its baseline
when calculating an integral, adjusting the baseline
can result in better lung volume measurements.
Page 41

LabQuest® 3 User Manual
www.vernier.com/labq3 35
From the Graph Screen, choose Advanced from the
Analyze menu, then select Baseline Adjustment.
Enable the tool by tapping on the displayed sensor or
column name.
Use the + and – buttons or tap the value to adjust the
graph so that the volume data returns to a value close
to zero after each cycle. Tap OK.
FFT Analysis
Fast Fourier Transforms (FFTs) are typically used when analyzing microphone data. The tool
calculates the FFT of the selected data. The results are displayed in a separate graph that can be
analyzed.
From the Graph screen, choose Advanced from the
Analyze menu and select FFT. Enable the tool by
tapping on the displayed sensor or column name.
Adjust the graph display by touching and dragging
across the graph to select a region, and then tap Zoom;
alternatively, you can use the two-finger
pinch/zoom/pan gesture to highlight a region of
interest. The frequency with the highest amplitude for
the region on the graph is displayed below the graph.
Tap OK to exit the tool. The results of the FFT
analysis are shown in the plot details.
Peak Integration
The Peak Integration tool is most commonly used when analyzing gas chromatograph data;
however, it can be applied to any data plot. Peak Integration differs from the Integral tool in that
it does not use the x-axis as the baseline. Instead, the integral for Peak Integration is evaluated
using the minimum y-values to the left and right of a selected peak or region.
Page 42

Using the LabQuest® App
36 Vernier Software & Technology
From the Graph screen, choose Advanced from the
Analyze menu and select Peak Integration. Enable the
tool by tapping on the displayed sensor or column
name.
Adjust the graph display by touching and dragging
across the graph to select a peak, and then tap Zoom;
alternatively, you can use the two-finger
pinch/zoom/pan gesture to highlight a peak. Tap Add
to report the value in the table.
As you add peaks, you can rename them by doubletapping the compound cell in the table below the
graph.
Repeat as needed to capture the data for all of your
peaks. If you need to look at data for a peak you have
already added, tap that region to select it.
If you have two peaks that overlap, you can find the
area of the two regions by first selecting the entire
region and adding it to the table. Tap the region to
select it, and then tap on the graph to show the point
where you want to split the region.
Tap the Split button to divide the original region into
two separate regions. The left portion of the region is
selected and shown in the table.
Tap the right portion of the split region to see the data
for that region.
Page 43

LabQuest® 3 User Manual
www.vernier.com/labq3 37
When you are done, tap OK to view the peak data in
the Plot Details, where you can see the full table of
data.
Pivot Data
Pivot Data is only available when the data-collection mode is set to Data Matrix mode. A typical
setup of the data matrix is to have the testing sites be the independent variable, and the days you
test be in different datasets.
Pivot Data transposes the independent variable with
the data sets, so you can view the daily data as the
location changes or pivot the data and view the
location data as the day changes.
From the Graph screen, choose Advanced from the
Analyze menu and select Pivot Data to activate this
tool.
Alternatively, from the Table screen, choose Pivot
Data from the Advanced menu.
Settings for LabQuest App Files
Trigonometric and derivative calculations used in
calculated columns, curve fits, and models include
settings you can control.
Select Settings from the File menu to access the
LabQuest Settings.
• Angle Units for Trigonometric Calculations
• Number of Points for Derivative Calculations
For more information on these settings, see LabQuest App Settings.
Page 44

Using the LabQuest® App
38 Vernier Software & Technology
Viewing Vernier Experiments
In previous versions of LabQuest, you could access Vernier experiments from within the
LabQuest App. In LabQuest 3, Vernier experiments are accessed using the Experiment Viewer
App. See Experiment Viewer App for more details.
Adding Notes to Your Experiment
From the Notes screen, you can enter notes as you
perform an experiment. The Notes menu provides
access to standard edit commands cut, copy, paste, and
clear all.
The keyboard comes up automatically when you tap
the notes field. Tap Done to dismiss the keyboard.
Managing LabQuest App Files
When the LabQuest App launches, a LabQuest file is created. The LabQuest App file can
contain data-collection settings, graphs, data tables, analyses, and notes. These files have a .qmbl
extension and can be saved to the internal storage space on LabQuest or to a USB flash drive.
LabQuest App files can also be opened and manipulated on a computer using Logger Pro® 3
software.
Tools to manage your files are found in the File menu, which can be accessed from any
LabQuest App screen. From the File menu, you can save, export, or email the current file. You
can also open previously saved files that are stored on LabQuest or on a USB flash drive.
If you are using a USB flash drive, the drive can be formatted in FAT16 or FAT32 (the most
common Windows® and macOS® formats). LabQuest cannot read NTFS or HFS+ formatted
drives.
Starting a New File
Choose New from the File menu to start a new
LabQuest App file. This action resets all datacollection parameters and sensor calibrations back to
their default values. Wireless, internal, and manually
connected sensors are disconnected.
If you have unsaved data, you are prompted to either
save or discard the data before continuing.
Page 45

LabQuest® 3 User Manual
www.vernier.com/labq3 39
Opening an Existing File
Choose Open from the File menu to display a list of
files that you have saved on LabQuest. To open a file,
tap the file name and tap Open.
When a USB flash drive is connected, the dialog
defaults to showing you files from your flash drive.
Saving the Current File
Choose Save from the File menu to display the Save As
dialog box where you can tap on a source icon
( USB, LabQuest) to select a destination. Tap in the
File name field to assign a name to the file.
When a USB flash drive is connected, the dialog
defaults to showing you files from your flash drive.
You can click the New Folder icon, , to add
additional folders for organizing your saved files.
Deleting a Saved File
Choose Delete from the File menu to display a file list
similar to the open file dialog. Tap on a source icon
( USB, LabQuest) to select the source where the
file is located. Tap the desired file name, and then tap
Delete.
When a USB flash drive is connected, the dialog
defaults to showing you files from your flash drive.
Page 46

Using LabQuest ® 3 as a Data Sharing Source
40 Vernier Software & Technology
VI. USING LABQUEST 3 AS A DATA SHARING SOURCE
LabQuest 3 can serve as a Data Sharing source that can wirelessly stream sensor data to Vernier
Graphical Analysis™ or Vernier Graphical Analysis™ Pro apps running on computers,
Chromebook™ notebooks, or mobile devices such as iOS, iPadOS®, and Android™ tablets and
smartphones.
How Data Sharing Works
• Set up an experiment with Vernier sensors and LabQuest 3.
• Use Graphical Analysis app to wirelessly connect to the LabQuest 3 unit using Wi-Fi. Both
devices must be on the same Wi-Fi network; however, the Wi-Fi network does not require
internet connectivity.
• Data collected on LabQuest 3 are shared with the connected devices. The data can be
streamed live during data collection or transferred in full after data collection is complete.
• Each recipient of the data can perform an individual analysis of the shared data on their
device. Data analysis done on LabQuest 3 or any connected device is not shared with the
other devices.
Connecting to a Wi-Fi Network
To set up LabQuest as a Data Sharing source, you need to connect LabQuest to a Wi-Fi
Network and enable Data Sharing.
1. Launch the Connections app, , from the
Settings screen. Verify Wi-Fi is on.
2. Tap the Network Settings icon, , to open the
Network Configuration dialog box. This dialog
lists any 2.4 GHz networks within range, as well as
options to manually join or create a network.
TIP! LabQuest 3 cannot detect or connect to
5 GHz networks.
3. Select a network. Choose from the following options:
• Existing Network (Infrastructure Network)
• LabQuest Hosted Network
Page 47

LabQuest® 3 User Manual
www.vernier.com/labq3 41
Existing Network (Infrastructure Network)
To connect to an existing Wi-Fi network, follow these instructions.
1. Locate the network within the list and tap on the
network name to select it.
2. If prompted, enter your network’s passphrase and
tap Connect.
If your network requires additional network
authentication information or if you have an
enterprise network that requires a network
certificate, see our website for more instructions:
www.vernier.com/til/2836.
3. Verify LabQuest has successfully connected to the
network. The network status should change to a
numeric IP address.
When LabQuest has successfully connected to the
network, tap OK to return to the Connections app.
Creating a LabQuest-Hosted Network
If you do not have access to an existing Wi-Fi network, or are not permitted to access your
school's network, set up a network using LabQuest 3.
Students can connect to a LabQuest network with their mobile devices. This network does not
support access to the internet, but that is not needed when using Data Sharing. LabQuest email
functionality and over-the-air updates are not supported with this type of network as they
require internet access.
Page 48

Using LabQuest ® 3 as a Data Sharing Source
42 Vernier Software & Technology
1. Scroll to the bottom of the available network list
and select Create Network.
2. Tap the Network Name field and assign a name to
this new network (e.g., LabGroup4 or Room403).
Tap Create.
3. Verify LabQuest has successfully created a
network. The network status should change to a
numeric IP address and a message noting that
LabQuest is hosting a network is shown on the
screen. Tap OK to return to the Connections app.
TIP! Some Android implementations have trouble
viewing and connecting to this type of ad-hoc
network. These devices require the use of an
infrastructure network.
Enabling Data Sharing on LabQuest 3
In addition to connecting to a Wi-Fi network, you need to set up LabQuest as a Data Sharing
Source using the following instructions.
1. Launch the Connections app, , from the
Settings screen.
Page 49

LabQuest® 3 User Manual
www.vernier.com/labq3 43
2. To easily identify your LabQuest unit, give it a
unique name. Tap and edit the name as
needed. Note that only alpha and numeric
characters are allowed. You cannot use spaces or
punctuation marks in the LabQuest name. Tap
Done to save the name.
3. Tap the Data Sharing icon, , to open Data
Sharing Settings.
4. Verify Data Sharing is On.
If you want to start and stop data collection from
your computing device, select the check box to
enable this feature. Tap OK to save the setup.
Page 50

Using LabQuest ® 3 as a Data Sharing Source
44 Vernier Software & Technology
Connecting to LabQuest 3 from Your Device
After setting up LabQuest as a Data Sharing source, you can connect to this LabQuest unit from
your computer, Chromebook, tablet, or smartphone.
Accessing LabQuest Data Using Graphical Analysis or Graphical Analysis Pro
1. Connect your computer, Chromebook, or mobile device to the same Wi-Fi network to which
you connected LabQuest 3.
2. Launch Graphical Analysis on your computer, Chromebook, tablet, or smartphone.
3. From New Experiment, select Data Sharing. Discovered Data Sharing sources are listed
automatically. Note: If your Graphical Analysis app has the Graphical Analysis Pro features
unlocked, click or tap Local from the Data Sharing connection dialog to see LabQuest data
sharing sources.
4. Tap the name of the LabQuest 3 source to connect. If your LabQuest 3 is not listed in Data
Sharing sources, you can connect by choosing Specify Source and manually entering the
LabQuest Data Sharing source address or by scanning the QR code.
Accessing LabQuest Data Using the Data Share Web App
1. Launch the Connections app from the Home screen.
2. Connect your computer, Chromebook, tablet, or smartphone to the same Wi-Fi network to
which you connected LabQuest 3.
3. On your computer, Chromebook, tablet, or smartphone, open a supported browser and enter
the Data Sharing Source Address. Alternatively, if you have a QR code reader on your
device, you can access the app using the provided QR code.
Page 51

LabQuest® 3 User Manual
www.vernier.com/labq3 45
Restricting Access to the Connections Setup
After configuring your LabQuest, you can set Advanced Preferences to restrict access to the
Connections setup information. This prevents students from inadvertently changing the network
and Data Sharing settings.
1. Launch Advanced Preferences, , from the
Settings screen and tap the Network tab.
2. Tap Edit Preference and select the desired setting.
Changes to the Connections main screen do not
show if the lockdown mode is changed while the
Connections app is running. Tap the close button,
×, then launch the Connections app again.
When option 1 is selected, you have access to
network connections only. LabQuest name, Data
Sharing, LabQuest Viewer®, and email settings are
not accessible.
When option 2 is selected, network settings are also
not accessible.
For access to all settings, choose option 0.
Page 52

Using LabQuest ® 3 with a Computer or Chromebook
46 Vernier Software & Technology
VII. USING LABQUEST 3 WITH A COMPUTER OR CHROMEBOOK
LabQuest 3 can be used via USB connection with the following software:
• Logger Pro® 3 (version 3.16.1 or newer) www.vernier.com/lp
• Vernier Graphical Analysis™ (version 4.11 or newer) www.vernier.com/ga
• Vernier Graphical Analysis™ Pro (all versions) www.vernier.com/gapro
Collecting Data Using Computer or Chromebook Software
LabQuest 3 can be used as a USB sensor interface with a computer or Chromebook. To collect
data, follow these steps:
1. Connect a wired (BTA or BTD) sensor to LabQuest. Note: USB and wireless sensors must
connect directly to the computer or Chromebook and not to the LabQuest unit.
2. Connect LabQuest to your computer or Chromebook using the included USB cable. The
micro end of the cable connects to LabQuest and the full-sized end connects to an available
USB port on your computer or Chromebook.
3. Open the data-collection software on your
computer or Chromebook. The software detects
LabQuest and the attached sensor(s), displaying a
graph ready for data collection. LabQuest displays
a screen with two arrows indicating it is controlled
by another device.
4. Click the Collect button on the computer or
Chromebook to start data collection.
When using LabQuest 3 as a computer interface, either the battery must be charged or
LabQuest must be connected to AC power. LabQuest 3 cannot operate on USB power alone.
Transferring Data from LabQuest App to Logger Pro 3
Automatically Transferring Data
If you collect data in LabQuest App and subsequently connect LabQuest to a computer,
Logger Pro 3 automatically detects the presence of the remote data and displays a message
indicating the data can be retrieved from LabQuest. Follow the onscreen instructions to
download data to the computer.
Manually Transferring Data
To manually transfer saved data from LabQuest, open Logger Pro 3 on your computer. Choose
LabQuest Browser from the computer File menu, and then choose Open. Select the desired
LabQuest file from the list and click Open. Once opened on the computer, you can choose to
save the file as a Logger Pro (.cmbl) file by choosing Save As from the computer File menu.
Page 53

LabQuest® 3 User Manual
www.vernier.com/labq3 47
TIP! If sensors are still connected when a LabQuest file is opened using Logger Pro 3, the
sensors are ignored. To enable the sensors, choose New from the Logger Pro 3 File menu.
Another method for manually transferring data from LabQuest to Logger Pro 3 is to choose
LabQuest Browser from the File menu in the computer software, then choose Import. Import
differs from Open in that only the data in the LabQuest file are added to the current computer
session. You can compile data from multiple LabQuest sessions into a single computer session
for graphing and comparison.
TIP! Compile class results from multiple LabQuest files or multiple LabQuest devices by
repeatedly importing data into a single Logger Pro 3 file.
Manually Moving Data from Logger Pro 3 to LabQuest
Data and/or sensor configurations can be saved to LabQuest from your computer. Open an
existing Logger Pro 3 file or set up a new file with the applicable data-collection settings.
Choose LabQuest Browser from the Logger Pro 3 File menu, then choose Save As and enter a
descriptive filename. Any data, as well as the sensor configuration, will be stored on LabQuest as
a LabQuest file. Any features in the computer file not existing on LabQuest (such as embedded
images, video analysis, graph annotations, or most calculated columns) will be ignored on
LabQuest.
Deleting Data on LabQuest from Logger Pro 3
To delete data on LabQuest from Logger Pro 3, choose LabQuest Browser from the File menu
and select Delete. Select the files you want to delete from the displayed list and click Delete.
TIP! You can use this feature to delete multiple files from your LabQuest.
Transferring Data from LabQuest App to Graphical Analysis and
Graphical Analysis Pro
Collected data can only be transferred from LabQuest to Graphical Analysis or
Graphical Analysis Pro through wireless Data Sharing via Wi-Fi. You cannot access data saved
on LabQuest 3 through a USB connection.
For more information on Data Sharing, see Using LabQuest 3 as a Data Sharing Source.
Page 54

Emailing Data Files and Screenshots
48 Vernier Software & Technology
VIII. EMAILING DATA FILES AND SCREENSHOTS
If LabQuest is connected to a network with internet access, you can email your data file, graph,
text file, or screenshot to an email client. To set this up, follow these instructions:
Configuring the Email Settings
1. Connect LabQuest to a network with internet access. For detailed instructions, see Connect to
a Wi-Fi Network.
2. Launch the Connections app, , from the Settings
screen.
TIP! If you don’t see the icons for accessing the
Email Configuration, you may need to update the
Connections app lockdown settings. See Restricting
Access to the Connections Setup for more
information.
3. Tap the Email settings icon, , to open the Email
Configuration dialog box. Verify email is On. This
configuration accesses the Vernier outbound email
service. Emails are sent using the email address
labquest@vernier.com.
TIP! The email ID is unique to each LabQuest and
is included in any email sent from each unit. You
cannot receive incoming emails on LabQuest.
4. If you want to use a different email service for
sending emails from LabQuest, tap Custom and
follow the on-screen prompts for setting up your
email.
Detailed instructions can be found on our website:
• For Gmail™, see www.vernier.com/til/8735.
• For Yahoo® mail, see www.vernier.com/til/10183.
TIP! This is used to access the outbound email server associated with this email account
required for sending emails. The email used here is the sending email account for the files
you send. You cannot receive incoming emails on LabQuest.
Page 55

Emailing Data Files and Screenshots
www.vernier.com/labq3 49
Emailing a file from the LabQuest App
1. Choose Email from the LabQuest App File menu
and select the type of file you want to email. You
can email the LabQuest App file (.qmbl), the graph
file (.pdf), text file (.txt), or screenshot (.png).
2. Enter the email address(es) and tap Send to email
the file.
Page 56

Printing from LabQuest® 3
50
IX. PRINTING FROM LABQUEST 3
LabQuest can print to networked printers that support the Internet Printing Protocol (IPP).You
can print a graph, data table, your own notes, or the screen as it is currently displayed in
LabQuest App. In addition, if a printer is not available or you cannot get your LabQuest on the
same network as your printer, you can use the Print to PDF option to save a PDF file to a USB
flash drive for printing from a computer later.
Printing to a Networked Printer
1. Connect LabQuest to the same network to which
your printer is connected. For detailed instructions,
see Connect to a Wi-Fi Network.
TIP! Your LabQuest and printer must be on the
same Wi-Fi network. The network does not have to
be connected to the internet for IPP printing to
work. Some printers can create their own networks
that support connecting directly to the printer itself.
2. From the LabQuest App, choose Print from the File
menu, and then choose the item that you want to
print (Graph, Table, My Notes, or Screen).
TIP! Options for printing Table and My Notes are
not available when those items have no data to
print.
3. The Print Options dialog box displays the available
printers. Tap on the printer name to select the
printer. If desired, you can choose to print in
grayscale, add a graph title, or add a customized
footer to your document.
4. Tap Print to print your document.
TIP! Your printer selection will be remembered
until you quit the LabQuest App or turn the
LabQuest off.
Using Print to PDF
With the Print to File feature, you can create PDF files of a graph, data table, notes, or LabQuest
screen (as currently displayed). You can use the files to include with lab reports or print the files
from a computer at a later time.
Page 57

LabQuest® 3 User Manual
www.vernier.com/labq3 51
1. To use Print to File, connect a USB flash drive to
your LabQuest.
2. Choose Print from the File menu, and then choose
the item that you want to print (Graph, Table, My
Notes, or Screen).
TIP! Options for printing Table and My Notes are
not available when those items have no data to
print.
3. Tap Print to PDF to select that option. If desired,
you can choose to print in grayscale, add a graph
title, or add a customized footer to your document.
TIP! You must have a USB flash drive connect to
your LabQuest to use the Print to PDF option.
4. Tap print to save the PDF to your USB flash drive.
TIP! LabQuest 3 does not support printing directly to a printer via a USB cable.
Page 58

Projecting and Monitoring LabQuest® 3 Devices
52 Vernier Software & Technology
X. PROJECTING AND MONITORING LABQUEST 3 DEVICES
Use our LabQuest Viewer software (order code, LQ-VIEW) for Windows and macOS
computers or LabQuest Viewer for iPad to view and control LabQuest wirelessly from your
computer or iPad. LabQuest Viewer can be used in conjunction with a projector to share the
LabQuest 3 screen with the entire class.
Instructors can use LabQuest Viewer to demonstrate LabQuest 3 to the class and have students
present their work to fellow classmates.
With LabQuest Viewer, you can
• View and control one or more LabQuest units from a computer or iPad.
• Connect to a projector or interactive white board for class demos or student sharing.
• Monitor student progress on any LabQuest connected to your network.
• Create screenshots of the LabQuest screen to copy and paste into lab instructions.
• Set customizable permissions that permit viewing without control, or password-protect a
connection.
LabQuest Viewer System Requirements
• Windows—Windows 7 (SP1), Windows 8, Windows 8.1, and Windows 10
• macOS—macOS 10.8 or newer
• iPad—iOS 8 or newer or iPadOS (any version)
LabQuest Setup
To set up your LabQuest to communicate with LabQuest Viewer, follow these instructions:
1. Connect LabQuest to a network. For detailed instructions, see Connecting to a Wi-Fi
Network.
TIP! The Network used for the LabQuest Viewer does not require internet connectivity.
2. Launch the Connections app, , from the
Settings screen.
Page 59

LabQuest® 3 User Manual
www.vernier.com/labq3 53
3. LabQuest Viewer requires each LabQuest unit to
have a unique name.
Tap and edit the name as needed. Note that
only alpha and numeric characters are allowed. You
cannot use spaces or punctuation marks in the
LabQuest name.
Tap Done to save the name.
4. Tap the Viewer settings, , to open the Viewer
Settings dialog box. Ensure the Viewer is On.
5. Select the checkbox to Allow Screen Control so
you can control the LabQuest unit from your
computer or iPad.
6. Tap OK to exit the LabQuest Viewer settings.
If Wi-Fi is not available, you can Enable Viewer over
USB to connect with the LabQuest Viewer computer
software via a USB connection.
The IP address for the USB connection to the computer
is displayed on the Network Setup dialog. There are
different addresses; which one applies depends on the
type of computer you are using.
TIP! While this option is selected, LabQuest cannot be used as a USB interface with
Logger Pro® 3, Graphical Analysis or Graphical Analysis Pro.
Page 60

Using Other Apps
54 Vernier Software & Technology
XI. USING OTHER APPS
Tap or swipe down from the left side of the Notification Bar to access additional apps on the
LabQuest 3.
Audio Function Generator
The Audio Function Generator is used to create
waveforms in the audio frequency range. Select a
waveform, frequency, and volume for each channel.
The link between left and right channels is on by
default so that both channels start and stop together.
Tap the link icon to control the channels independently.
Use the sliders to adjust the frequency.
A common use of the Audio Function Generator is to create tones and beats for waveform study
using a microphone. For the best waveform quality, connect a powered computer speaker to the
LabQuest audio output jack.
Calculator
The Calculator App is a standard scientific calculator
that uses algebraic notation. You can copy a calculator
result and paste it into the Notes tab or into a manual
column cell.
Page 61

LabQuest® 3 User Manual
www.vernier.com/labq3 55
Camera App
The Camera App works with digital (USB) cameras.
Use the Camera App to view a live image feed from a
camera and to capture and save images for later
viewing. You can also view images saved to a USB
flash drive.
See www.vernier.com/til/3659 for more information
regarding supported digital cameras.
Experiment Viewer
The Experiment Viewer is a PDF reader that can access
over 75 experiments that are pre-loaded on your
LabQuest. You can also use this application to view
other PDF files saved on a USB flash drive. These files
can be saved directly to your LabQuest unit, as needed.
In addition to experiment files, documentation for the
internal sensors, and a copy of this user manual are
available within this application.
In addition to the experiment files included on the LabQuest 3, Vernier offers a complete set of
lab books for elementary through college. For more information, see www.vernier.com/books.
Periodic Table
The Periodic Table app contains standard reference
information on the elements. Tap an element to see
details.
Data from the Periodic Table app is available as a
saved LabQuest App file. Choose Open from the
LabQuest App File menu and select the Periodic Table
Data file. From the Graph screen, tap on the y-axis
label to select different values to plot.
Page 62

Using Other Apps
56 Vernier Software & Technology
Power Amplifier
The Power Amplifier app controls the Vernier Power
Amplifier (order code PAMP) when connected to the
LabQuest Audio Out port. The Power Amplifier is used
to create waveforms with up to 10 V amplitude and
currents of 1 A.
Select the desired output (AC or DC). DC output levels
are limited to 0.2 V steps. AC waveforms include sine,
square, sawtooth, and ramps. Select an amplitude and
frequency using the controls. The frequency can be
changed by factors of two using the ÷2 and ×2 buttons.
Sound Recorder
You can use the Sound Recorder app to record and
replay short audio clips. The clips can be saved and
replayed as needed.
Stopwatch
The Stopwatch is a simple digital timer. Tap the Start
button, , to begin timing and tap the Stop button,
, to stop timing. Subsequent taps continue to start
and stop the timer. Tap the Reset button, , to return
the timer to zero.
Use the Copy button, , to place the current time on
the clipboard for pasting into the Notes screen, the
calculator, or a manual column data cell.
Page 63

LabQuest® 3 User Manual
www.vernier.com/labq3 57
XII. CUSTOMIZING THE SETTINGS
Tap or swipe down from the right side of the Notification Bar to access the apps that control the
device settings.
Connections—Wi-Fi, Data Sharing, and Email
Use the Connections app to connect your device to a
Wi-Fi network and set up other network-enabled
features such as Data Sharing and emailing files. Tap
the icon to modify the settings.
Connect to a Wi-Fi Network
Give your LabQuest a Unique Name
Setup Data Sharing
Configure LabQuest Viewer Settings
Connect to an Email Client
Advanced Preferences
Advanced feature options can be found in Advanced
Preferences. Tap on the name of the feature to view
details and edit the settings.
TIP! See Restricting Access to the Connections Setup
for an example of how to use this app.
Page 64

Customizing the Settings
58 Vernier Software & Technology
Audio
Use the slider to adjust the volume of the built-in
speaker or the Audio Out port. You can also enable
system sounds, such as a chirping sound, when the unit
powers on or off.
Language
Specify the language of the displayed text on your
device.
For more information on the supported languages, see
www.vernier.com/til/1808.
Light & Power
Adjust the screen brightness and select different power
profiles that can help extend your battery life between
charges. When using AC power, you can select to have
the screen always on.
For more information, see LabQuest Power Profiles.
Time & Date
You can set the LabQuest time and date. The time and
date are used to timestamp when files are saved and
when data collection begins (used with Logger Pro 3
software).
TIP! When connected to a Wi-Fi network, the time and
date are automatically updated; however, the time zone
must be updated manually.
Page 65

LabQuest® 3 User Manual
www.vernier.com/labq3 59
Update
You can check for updates when your LabQuest is
connected to a Wi-Fi network that has internet access.
You can also reset some or all of your user settings
back to factory defaults including network and email
configurations, user labs, and saved data files.
For more information, see Software Updates in the
Appendix.
LabQuest App Settings
Settings in the LabQuest App are specific to and save with the LabQuest App file. To access
these settings, choose Settings from the LabQuest App File menu. These settings can be applied
to existing files and automatically update the existing data. The settings return to default upon
choosing New from the File menu.
Angle Units for Trigonometric Calculations
Calculated columns, curve fits, and modeled functions
may use trigonometric calculations; choose Degrees or
Radians. The default unit is Radians.
Number of Points for Derivative Calculations
Calculated columns, curve fits, modeled functions, and
some calculated sensors columns (e.g., Motion
Detector velocity and acceleration columns) can use
numerical derivatives.
The algorithm for such derivatives utilizes a user-defined number of points. The default value of
seven points is sufficient for many experiments, but you may want to choose a larger number for
human-scale Motion Detector experiments (e.g., our Motion Match experiment), or a smaller
number for cart-based Motion Detector experiments (e.g., our Impulse and Momentum
experiment).
For more information on how derivatives are calculated, see www.vernier.com/til/1011.
Page 66

Appendix
60 Vernier Software & Technology
XIII. APPENDIX
Technical Specifications
Display
• 15.41 cm × 8.59 cm (17.64 cm diagonal)
color screen
• LED backlight
• Landscape screen orientation
Processor
• 2 GHz application processor
Connectivity
• Wi-Fi 802.11 b/g/n
• Bluetooth® wireless technology
User interface
• Capacitive touch screen
• Touch navigation utilizing gestures
Power
• Rechargeable, high-capacity battery
• DC charging/powering through external
adapter (included)
Data acquisition
• 12-bit resolution
• Built-in GPS and microphone
Ports
• 3 Analog (BTA) sensor ports
• 2 Digital (BTD) sensor ports
• 2 USB port for sensors, flash drives, and
peripherals
• USB micro port for computer connectivity
• DC power port
• Audio Out port for use with Vernier Power
Amplifier, headphones, and speakers
Maximum sampling rate
• Single sensor: 100,000 samples/s
(0.02 seconds maximum duration)
• Multiple sensors: 10,000 samples/s
(0.21 seconds maximum duration)
Minimum sampling rate
• 0.00125 samples/s (800 s/sample)
Maximum samples (standalone)
• Single sensor: 2000 samples 20K–100K
samples/s
• Single sensor: 14,000–21,000 samples* at
less than or equal to 10,000 samples/s
• Multiple sensors: 12,000–14,000 samples*
at less than or equal to 10,000 samples/s
Environmental durability
• Operating temperature: 0 – 45°C
• Storage temperature: –30 – 60°C
• Splash resistant
• Rugged enclosure designed to withstand a
fall from lab bench
Size and weight
• Size: 11.7 cm × 19.0 cm × 4.0 cm
• Weight: 549 g
Storage
• 500 MB
• Expandable with USB flash drive
Non-compatible sensors
LabQuest 3 does not support the following:
• Heat Pulser
• Vernier Flash Photolysis Spectrometer
*The highest number of samples is for the very first collection after starting LabQuest. The smaller number of samples depends
on the number of previous collections and stored runs during this LabQuest session.
Page 67

LabQuest® 3 User Manual
www.vernier.com/labq3 61
Battery Maintenance
LabQuest uses a high-quality lithium-ion battery. This is the same chemistry used in premium
laptop and smartphone batteries and you can expect similar performance. There is never a need
to condition the battery by regular full discharge/charge cycles.
Use only the supplied AC adapter to charge the LabQuest battery. A replacement adapter can be
purchased from our website (order code LQ3-PS). AC adapters from the original LabQuest or
LabQuest 2 should not be used with LabQuest 3 as they do not provide enough power to run the
unit and charge the battery. See www.vernier.com/til/8431/ for more information.
The battery takes about 12 hours to completely charge. It is safe to leave the battery charging
indefinitely, and there is no need to fully discharge the battery before charging. Battery life
depends on the sensors used, but in most cases, you can obtain six or more hours of use before
recharging. We recommend charging LabQuest overnight to start the next day with a full charge.
Battery life depends on the sensors and features used. To access power-saving options, choose
the Light & Power app from the Settings screen. Optimize day-to-day battery life by setting the
screen brightness to the minimum acceptable level and power off (suspend) the unit whenever
the unit is not in use.
When using LabQuest as a standalone device, the screen dims after a few minutes of no use,
even during data collection. However, LabQuest does not turn itself off while collecting data
until the battery is almost discharged. Data loss due to a loss of power is minimized through
periodic saving of a backup file.
When using LabQuest 3 as a computer interface, either the battery must be charged or LabQuest
must be connected to AC power. LabQuest 3 cannot operate on USB power alone.
The long-term life of the battery varies, but you can expect about 300 to 400 full
charge/discharge cycles before the battery needs to be replaced. In this count, a charge from halfway to a full charge would count as half of a charge cycle. In typical school use, the battery can
last three years or more. Exposure to temperatures over 35°C significantly reduces the battery
life.
As a battery reaches the end of its useful life, the run time becomes shorter and the battery begins
to swell. Eventually the run time will be too short for your application, and you will want to
replace the battery. You should also replace the battery when the swelling is visually noticeable.
Rechargeable batteries are considered a consumable, and as such, are warranted for one year. A
replacement battery can be ordered from our website (order code LQ3-BAT). Recycling
information is available at www.call2recycle.org.
Page 68

Appendix
62 Vernier Software & Technology
Replacing the Battery
Follow these steps to replace a LabQuest battery:
1. Turn the unit over being careful not to set the unit on something that could scratch the
screen.
2. Slide the battery door cover down until it releases, then lift it off the unit.
3. Lift the battery from the right side and pull the battery to the right as you lift it out of the
unit.
4. When replacing the battery only use a battery provided by Vernier (order code: LQ3-BAT).
5. Make sure the battery contact points on both the unit and battery are clean and free of debris.
6. Insert the new battery label side up, starting by putting the left edge in first.
7. Carefully set the battery in place so as not to damage the battery contacts or plastic tabs that
hold the battery against the contacts.
8. Set the battery door in over the battery just below its closed position, then slide the door up
until it latches.
9. Charge the new battery at least 12 hours to ensure it is fully charged.
LabQuest Power Profiles
There are three power profiles available: Battery, AC, and Automatic. Select the power profile
that best matches how you use your LabQuest unit. While the Battery and AC profile names
suggest when they might be used, these profiles do not depend on how you are powering your
LabQuest. The Battery profile is designed to conserve battery power during times the LabQuest
unit is inactive. The AC profile also applies power saving options; however, there is more time
between the different power saving steps.
Page 69

LabQuest® 3 User Manual
www.vernier.com/labq3 63
The Automatic profile option is the default option. When using this profile, the power
configuration is detected, and the appropriate power profile is applied. Note that LabQuest
cannot distinguish between power coming from an AC adapter or an external backup battery
such as the LabQuest Battery Boost 3. When using an external battery, you may want to use the
Battery profile to conserve power of the external battery.
Here is a summary of the power profile stages to conserve power:
Battery
AC
Not in Use
Collecting Data
Not in Use
Collecting Data
Dim screen
after 1 minute
after 1 minute
after 2 minutes
after 5 minutes
Screen off
after 3 minutes
after 3 minutes
after 5 minutes
after 15 minutes
Suspend
after 30 minutes
never
after 60 minutes
never
Shut down
after 2 days
never
after 2 days
never
If you are setting up LabQuest for display, you may not want the unit to dim at all. To do that,
connect your unit to AC power and choose the option to not dim the screen while on AC power.
TIP! We do not recommend using this option when using an external battery backup as your
batteries will drain rapidly.
Troubleshooting Battery Issues
Launch the System Information app, , from the
Settings screen. Tap the Battery tab to view details
about the battery.
The battery readings do not update automatically. Tap
Refresh to update the information on the screen.
For more information, see www.vernier.com/til/8479.
Case and Screen Maintenance
LabQuest is water and shock resistant. Do not submerge LabQuest in liquids or allow liquids to
sit on the screen for any extended time. Wipe it clean with a damp cloth only; do not use any
solvents including ammonia or glass cleaners. For information on disinfecting your LabQuest
unit, see www.vernier.com/til/6551.
Page 70

Appendix
64 Vernier Software & Technology
Software Updates
LabQuest arrives with software preloaded. To view the
version of the app you are currently running, launch the
System Information app, , from the Settings screen.
The summary tab shows the version you are currently
running.
When available, free updates are accessible from our
website at www.vernier.com/lq3-update.
Updating via USB Flash Drive
From the Vernier website, download the update file to a
USB flash drive. The file should be in the root directory
of the flash drive and not in a folder.
Connect the flash drive to your LabQuest. The Update
app launches automatically when the update file is
detected. Tap to update your LabQuest.
Before applying the update, your battery level is
checked to ensure you have enough power to update
LabQuest safely.
• If your battery level is greater than 30%, the update
continues automatically.
• If your battery level is less than 30%, you must
connect the AC power adapter before updating the
unit.
• If your battery level is too low to maintain power
without the AC adapter, the update does not
proceed automatically. In this case, you should only
attempt an update if you have no other option since
a loss of power during an update may leave your
unit in an unusable state.
Page 71

LabQuest® 3 User Manual
www.vernier.com/labq3 65
Once the update is complete, you receive a message
that your LabQuest is up to date.
Tap the close button, ×, and continue to use your
LabQuest.
Over-the-Air Updates
If you are running LabQuest software version 3.0.2 or
newer and your LabQuest is connected to a Wi-Fi
network that has internet connectivity, you can check
for and apply updates over the internet.
From the settings screen, tap Update to initiate a
check for updates.
If a newer version of the software is available, tap
to download and install the update.
Reset Device Settings
If you are running LabQuest software version 3.0.2 or
newer, you can also use the Update app to reset the
LabQuest back to factory settings. This includes
removing any saved network or email configurations
and user-saved files.
Tap and select Reset Defaults. Make sure the items
you want to reset are selected then tap .
Page 72

Appendix
66 Vernier Software & Technology
Getting Additional Help
For access to user manuals, our Technology
Information Library, and chat, visit our
website: www.vernier.com/labq3.
You may also contact Vernier directly by
phone or email:
Toll Free: 888.837.6437
Email: support@vernier.com
License Information
This product contains certain open source software originated by third parties that is subject to
the GNU General Public License as published by the Free Software Foundation, GNU
Library/Lesser General Public License (LGPL) and different and/or additional copyright
licenses, disclaimers or notices. These licenses give you the right to redistribute and/or modify
the software.
The software is distributed in the hope that it will be useful, but WITHOUT ANY
WARRANTY, without even the implied warranty of MERCHANTABILITY or FITNESS FOR
A PARTICULAR PURPOSE. See the GNU General Public License for more details.
Complete source code for the open source software is available on request. Contact us at
info@vernier.com, or by writing to
Source Code Request
Vernier Software & Technology
13979 SW Millikan Way
Beaverton, OR 97005
USA
Source code will be made available for download, or you may request a CD-ROM of the code. A
shipping and handling fee will be charged for a CD-ROM.
The exact terms of GPL, LGPL, and some other licenses are provided to you with the source
code distribution. You may also read the license at www.gnu.org/licenses.
Warranty
Vernier warrants this product (with the exception of the battery) to be free from defects in
materials and workmanship for a period of five years from the date of shipment to the customer.
This warranty does not cover damage to the product caused by abuse or improper use. This
warranty covers educational institutions only.
The LabQuest battery is a consumable, and as such, Vernier warrants this product to be free from
defects in materials and workmanship for a period of one year from the date of shipment to the
customer. For more information about the LabQuest battery, see Battery Maintenance.
Page 73

LabQuest® 3 User Manual
www.vernier.com/labq3 67
Disposal
When disposing of this electronic product, do not treat it as household waste. Its disposal is
subject to regulations that vary by country and region. This item should be given to an applicable
collection point for the recycling of electrical and electronic equipment. By ensuring that this
product is disposed of correctly, you help prevent potential negative consequences on human
health or on the environment. The recycling of materials will help to conserve natural resources.
For more detailed information about recycling this product, contact your local city office or your
disposal service.
Battery recycling information is available at www.call2recycle.org
Do not puncture or expose the battery to excessive heat or flame.
The symbol, shown here, indicates that this product must not be disposed of in a standard
waste container.
Replacement Parts
LabQuest Micro USB Computer Cable
Replacement LabQuest-to-computer USB cable
The cable has a USB micro plug and USB standard-A plug. One
cable is included with each LabQuest 3.
www.vernier.com/cb-usb-micro
Replacement LabQuest 3 Battery
Replacement high-capacity, rechargeable, lithium-ion battery for
the Vernier LabQuest 3
One battery is included with each LabQuest 3.
www.vernier.com/lq3-bat
LabQuest Power Supply
Replacement power supply for the LabQuest
One power supply is included with each LabQuest 3.
www.vernier.com/lq3-ps
Page 74

Appendix
68 Vernier Software & Technology
Accessories
LabQuest Viewer
Display and control LabQuest on a computer to teach students
how to use LabQuest, demonstrate experiments, or share class
data.
www.vernier.com/lq-view
Also available, LabQuest Viewer for iPad
www.vernier.com/product/labquest-viewer-for-ipad/
LabQuest Charge Station
Charge and store up to four LabQuest units with this compact and
affordable charge station.
www.vernier.com/lq3-crg
LabQuest Battery Boost 3
With the added power of an external battery, data can be
collected for extended periods in the field where AC power is not
available.
www.vernier.com/lq-boost3
Vernier Lanyard
The LabQuest neck strap helps prevent accidental drops during
field studies.
www.vernier.com/lq3-lan
LabQuest Micro to USB-C Computer Cable
LabQuest to computer USB-C cable
The cable has a USB micro plug and USB-C plug. This cable is
recommended for computers and Chromebook™ notebooks that
only have USB-C ports.
www.vernier.com/cb-usb-c-micro
LabQuest Stand
Use the LabQuest stand to prop your LabQuest off the lab bench
to protect it from accidental spills and to provide a natural
viewing angle for your screen.
www.vernier.com/lq3-stn
Page 75

LabQuest® 3 User Manual
www.vernier.com/labq3 69
Curriculum Resources
In addition to the experiment files included on the LabQuest 3
(see Experiment Viewer), Vernier offers a complete set of lab
books for elementary through college. For more information, see
www.vernier.com/books.
Page 76

Appendix
70 Vernier Software & Technology
Vernier Software & Technology
13979 S.W. Millikan Way • Beaverton, OR 97005-2886
Toll Free (888) 837-6437 • (503) 277-2299 • FAX (503) 277-2440
support@vernier.com • www.vernier.com/
Version 3.0.3
Published March 2021
Logger Pro, LabQuest, LabQuest Viewer, Go Wireless, Go Direct, Vernier Graphical Analysis,
Vernier Graphical Analysis Pro, and other marks shown are our trademarks or registered
trademarks in the United States.
All other marks not owned by us that appear herein are the property of their respective owners,
who may or may not be affiliated with, connected to, or sponsored by us.
 Loading...