

LabQuest®2—UserManual
Version 2.8.6
December 2020

LabQuest® 2 – User Manual
ABOUT THIS GUIDE
LabQuest 2, first shipped in March 2012, comes with a Quick-Start Guide to get you started
with basic data collection and analysis. The LabQuest 2 User Manual is an extended guide
detailing the features, hardware, and software of LabQuest 2.
ii

LabQuest® 2 User Manual
SAFETY INFORMATION
Federal Communication Commission Interference Statement
This equipment has been tested and found to comply with the limits for a Class B digital device,
pursuant to Part 15 of the FCC rules. These limits are designed to provide reasonable protection
against harmful interference in a residential installation. This equipment generates, uses and can
radiate radio frequency energy and, if not installed and used in accordance with the instructions,
may cause harmful interference to radio communications. However, there is no guarantee that
interference will not occur in a particular installation. If this equipment does cause harmful
interference to radio or television reception, which can be determined by turning the equipment
off and on, the user is encouraged to try to correct the interference by one or more of the
following measures:
Reorient or relocate the receiving antenna.
Increase the separation between the equipment and receiver.
Connect the equipment into an outlet on a circuit different from that to which the receiver is
connected.
Consult the dealer or an experienced radio/TV technician for help.
FCC Caution
This device complies with Part 15 of the FCC Rules. Operation is subject to the following two
conditions:
(1) this device may not cause harmful interference and
(2) this device must accept any interference received, including interference that may cause
undesired operation
RF Exposure Warning
The equipment complies with RF exposure limits set forth for an uncontrolled environment. The
antenna(s) used for this transmitter must not be co-located or operating in conjunction with any
other antenna or transmitter.
You are cautioned that changes or modifications not expressly approved by the party responsible
for compliance could void your authority to operate the equipment.
iii

LabQuest® 2 – User Manual
IC Statement
This device complies with Industry Canada license-exempt RSS standard(s). Operation is subject
to the following two conditions: (1) this device may not cause interference, and (2) this device
must accept any interference, including interference that may cause undesired operation of the
device.
Industry Canada - Class B This digital apparatus does not exceed the Class B limits for radio
noise emissions from digital apparatus as set out in the interference-causing equipment standard
entitled “Digital Apparatus,” ICES-003 of Industry Canada. Operation is subject to the following
two conditions: (1) this device may not cause interference, and (2) this device must accept any
interference, including interference that may cause undesired operation of the device. To reduce
potential radio interference to other users, the antenna type and its gain should be so chosen that
the equivalent isotropically radiated power (e.i.r.p.) is not more than that permitted for successful
communication.
RF exposure warning: The equipment complies with RF exposure limits set forth for an
uncontrolled environment. The antenna(s) used for this transmitter must not be co-located or
operating in conjunction with any other antenna or transmitter.
Le présent appareil est conforme aux CNR d’Industrie Canada applicables aux appareils radio
exempts de licence. L’exploitation est autorisée aux deux conditions suivantes : (1) l’appareil ne
doit pas produire de brouillage, et (2) l’appareil doit accepter tout interférence radioélectrique,
même si cela résulte à un brouillage susceptible d’en compromettre le fonctionnement.
Cet appareil numérique respecte les limites de bruits radioélectriques applicables aux appareils
numériques de Classe B prescrites dans la norme sur le matériel interférant-brouilleur:
“Appareils Numériques,” NMB-003 édictée par industrie Canada. L’utilisation est soumise aux
deux conditions suivantes: (1) cet appareil ne peut causer d’interférences, et (2) cet appareil doit
accepter toutes interférences, y comprises celles susceptibles de provoquer un disfonctionnement
du dispositif. Afin de réduire les interférences radio potentielles pour les autres utilisateurs, le
type d’antenne et son gain doivent être choisie de telle façon que l’équivalent de puissance
isotrope émis (e.i.r.p) n’est pas plus grand que celui permis pour une communication établie.
Avertissement d’exposition RF: L’équipement est conforme aux limites d’exposition aux RF
établies pour un environnement non supervisé. L’antenne (s) utilisée pour ce transmetteur ne
doit pas être jumelés ou fonctionner en conjonction avec toute autre antenne ou transmetteur.
iv

LabQuest® 2 User Manual
CONTENTS
I. GETTING STARTED WITH LABQUEST® 2 ........................................................................................ 1
What’s Included ..................................................................................................................1
Using LabQuest for the First Time .....................................................................................1
Quick Start to Data Collection ...........................................................................................1
II. LABQUEST® 2 HARDWARE ............................................................................................................... 4
Power Button ......................................................................................................................4
Touch Screen ......................................................................................................................5
Hardware Keys ...................................................................................................................5
Sensor Ports ........................................................................................................................5
Internal Sensors ..................................................................................................................7
III. LABQUEST® APP ................................................................................................................................ 9
Navigating LabQuest App ..................................................................................................9
File Menu..........................................................................................................................10
Data Collection .................................................................................................................12
Data Analysis ....................................................................................................................22
Viewing Vernier Lab Instructions ....................................................................................29
Adding Notes to Your Experiment ...................................................................................30
Storing LabQuest App Files .............................................................................................30
Exporting LabQuest App files ..........................................................................................31
IV. DATA SHARING: USING LABQUEST® 2 ......................................................................................... 32
How Data Sharing Works .................................................................................................32
Set Up Data Sharing on LabQuest....................................................................................32
Connect to LabQuest 2 from Your Device .......................................................................37
V. USING LABQUEST® 2 WITH A COMPUTER OR CHROMEBOOK™ VIA USB .............................. 39
VI. EMAILING FROM LABQUEST® 2 ..................................................................................................... 41
VII. PRINTING FROM LABQUEST® 2 ...................................................................................................... 42
VIII. PROJECTING AND MONITORING STUDENTS’ LABQUEST® 2 DEVICES ................................... 44
IX. ADDITIONAL APPS ON LABQUEST® 2 ........................................................................................... 46
Audio Function Generator ................................................................................................46
Periodic Table ...................................................................................................................47
Power Amplifier ...............................................................................................................47
Calculator .........................................................................................................................47
Camera App ......................................................................................................................48
Sound Recorder ................................................................................................................48
Stopwatch .........................................................................................................................48
v

LabQuest® 2 – User Manual
X. APPENDICES ..................................................................................................................................... 49
Appendix A—LabQuest 2 Technical Specifications .......................................................49
Appendix B—LabQuest Maintenance .............................................................................50
Appendix C—LabQuest Keyboard ..................................................................................52
Appendix D—License Information ..................................................................................53
Appendix E—Warranty ....................................................................................................53
Appendix F—Curriculum Resources ...............................................................................53
Appendix G—Accessories, Replacement Parts, and Related Products ...........................54
Appendix H—Disposal ....................................................................................................56
vi
I. GETTING STARTED WITH LABQUEST® 2
What’s Included
LabQuest 2 interface
Rechargeable battery (in unit)
AC power adapter
Computer connection (USB) cable
Quick-Start guide
Stylus (in unit)
Stylus tether
Using LabQuest for the First Time
Install the Battery
LabQuest ships with the battery in place; however, there is a protective tab covering the battery
contacts that needs to be removed before the first use. Pull the tab out of the unit before using
LabQuest.
Charge Overnight
We recommend charging the battery for at least 12 hours prior to using LabQuest for the first
time on battery power. To do this, connect the included power adapter to LabQuest and an AC
power source. You can also charge LabQuest using the LabQuest Charging Station (order
code LQ2-CRG, sold separately).
LabQuest uses a high-quality lithium-ion battery. This is the same chemistry used in premium
laptop and cell phone batteries, and you can expect similar performance. There is never a need to
condition the battery by regular full discharge/charge cycles.
It is safe to leave the battery charging indefinitely, and there is no need to fully discharge the
battery before charging. Battery life will depend on the sensors used, but in most cases you can
obtain six or more hours of use before recharging. We recommend charging LabQuest overnight
to start the next day with a full charge. For more details about the battery, see LabQuest Battery
.
Quick Start to Data Collection
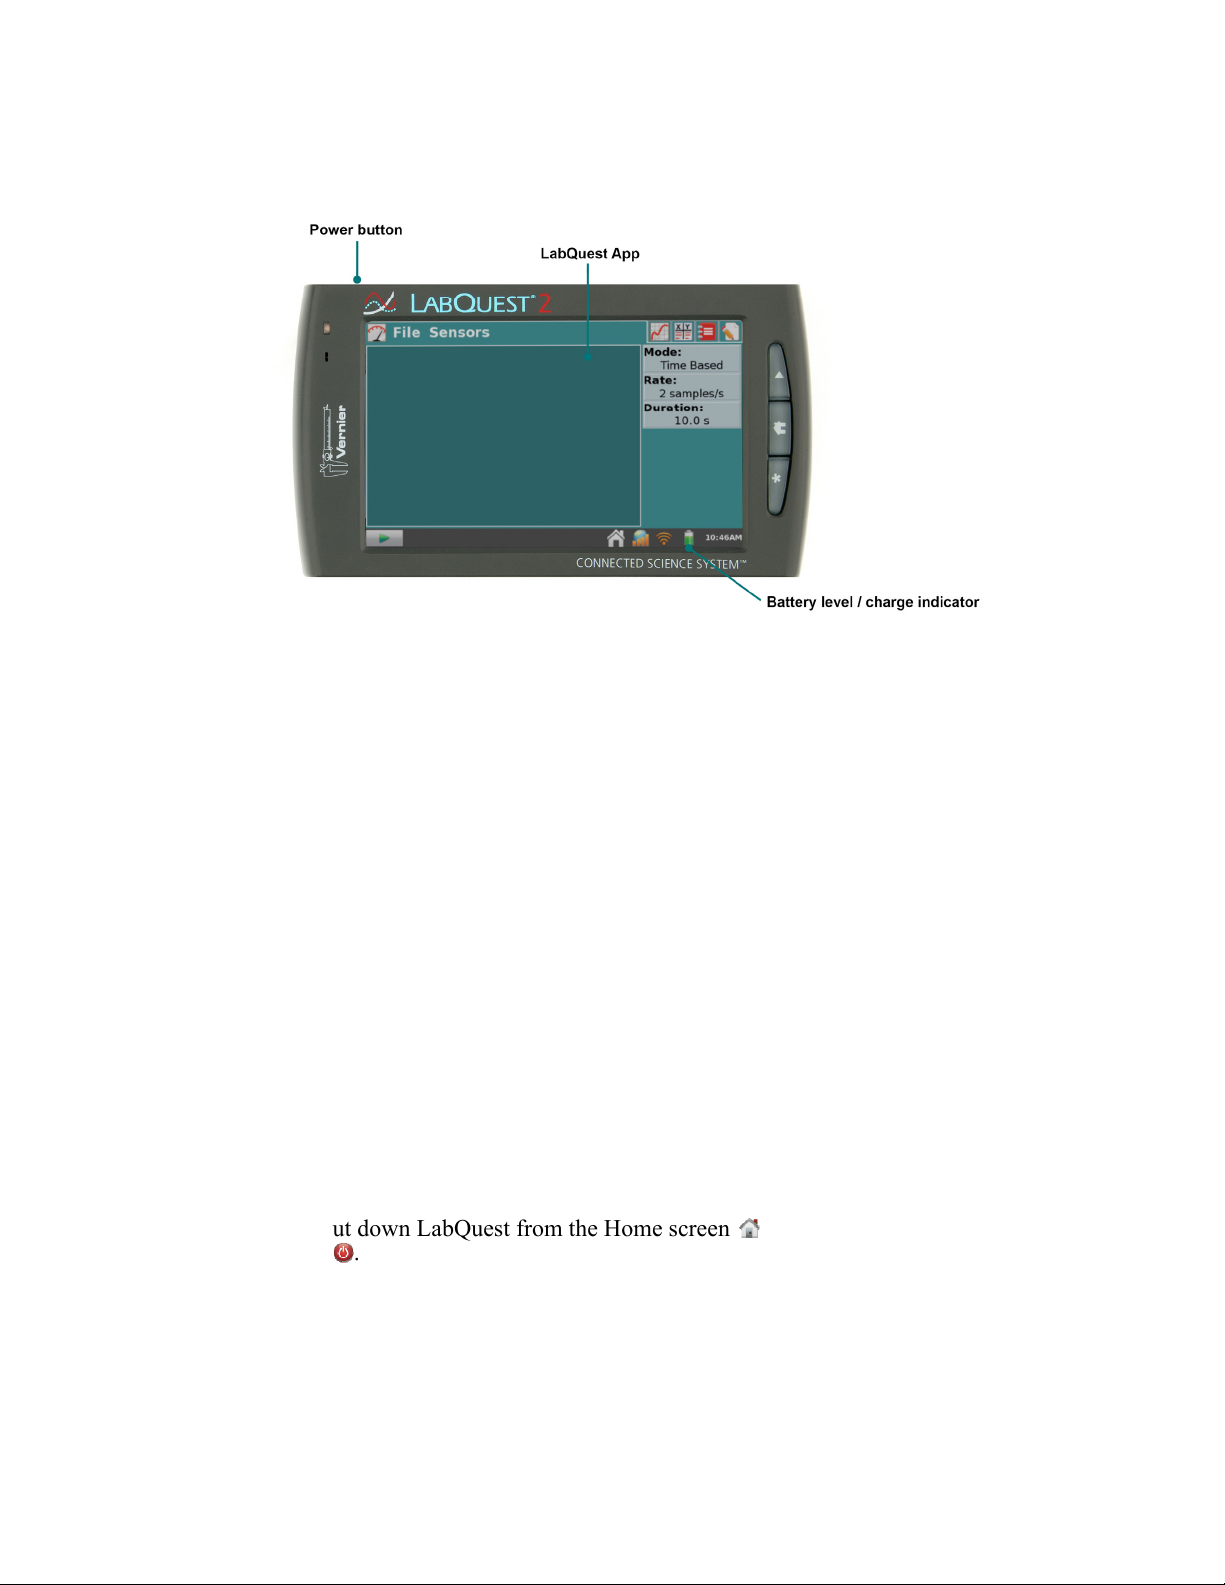
Follow these steps to quickly get startedwith basic data
collection. For more detailed instructions, see Data
Collection.
1. Press and release the power button located on the
top edge of LabQuest to turn on the unit.
LabQuest App launches automatically.
1
Getting Started with LabQuest® 2
r
2. Connect an analog sensor to the CH 1 port on
LabQuest or connect a digital sensor to the DIG 1
port. LabQuest App will auto-ID the connected
sensor and automatically set the default collection
rate for the sensor.
TIP! If your sensor is an older-style (DIN) sensor
requiring an adapter, the sensor will not auto-ID.
Instead, you will need to set up the sensor
manually. See Sensor Setup.
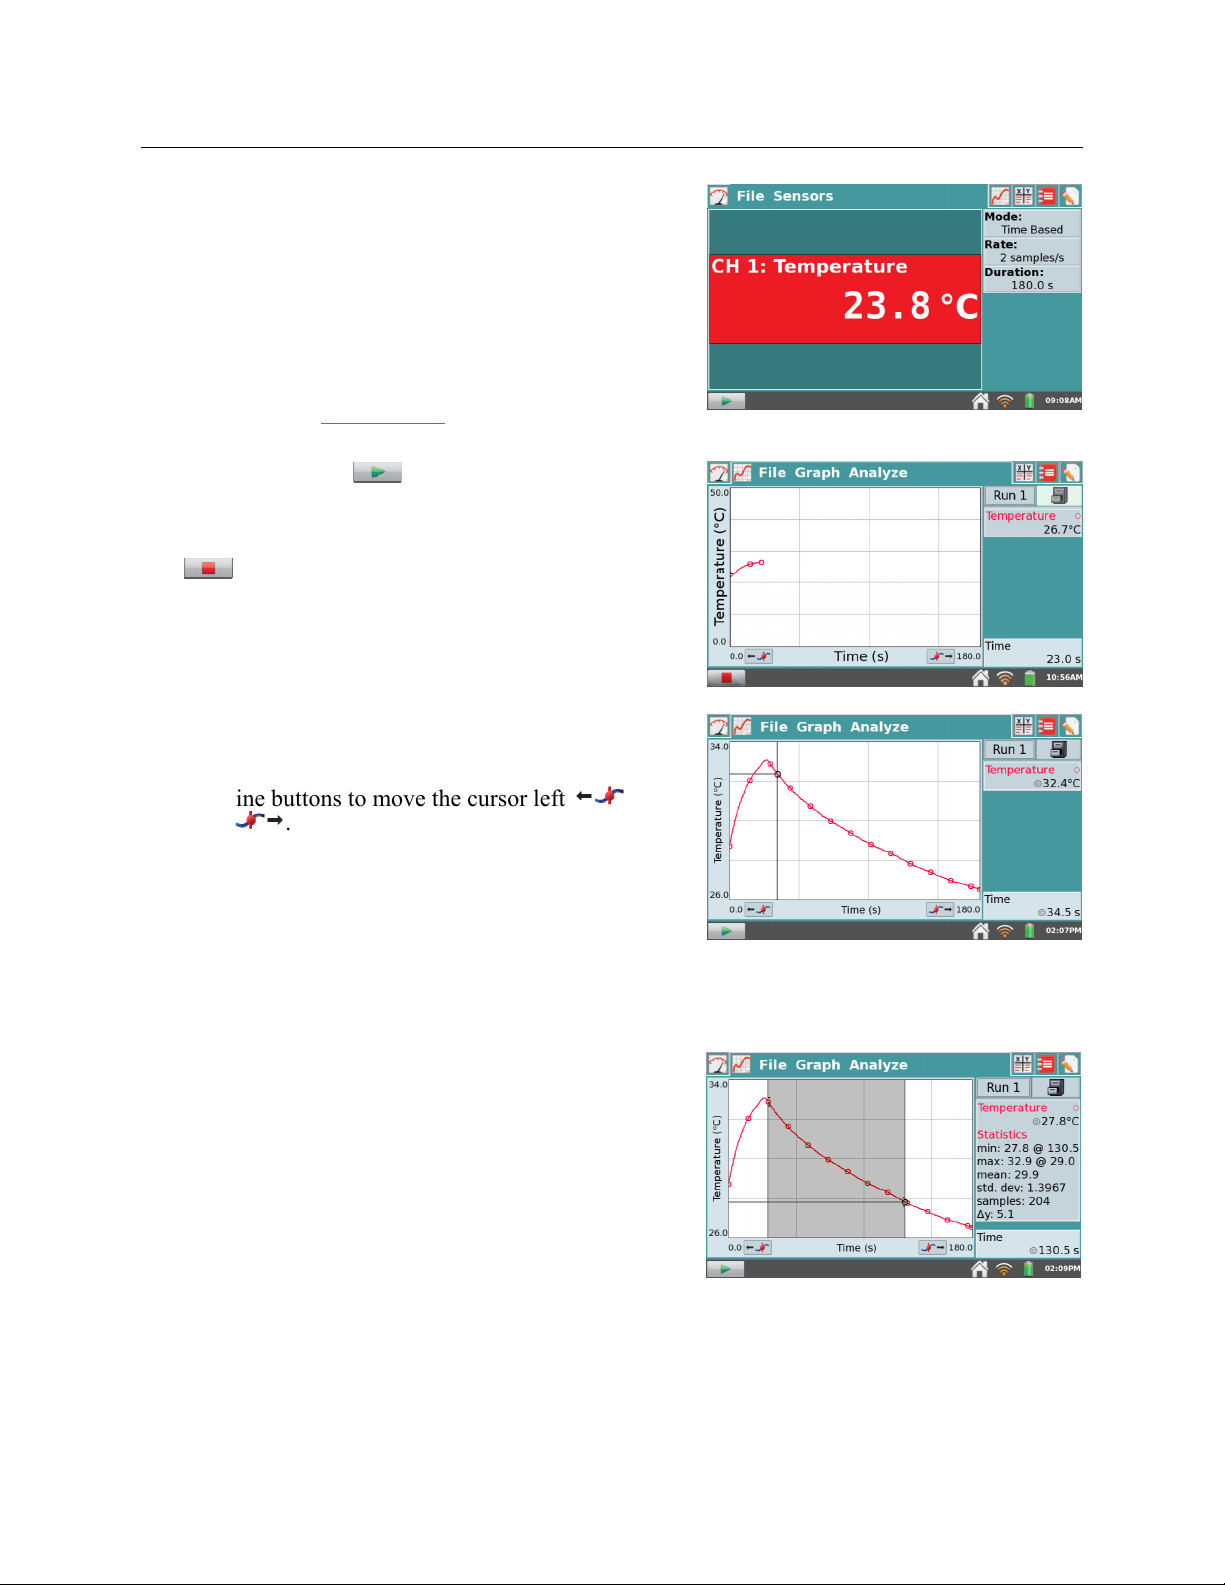
3. Next, tap Collect . Data collection begins and
LabQuest graphs the data in real time.
You can stop collection early by tapping Stop
.
Once data collection is complete, the graph
autoscales to the data.
4. Tap the graph to examine a point of interest. The
coordinates of the point are shown in the panel to
the right of the graph. Tap another point or tap the
Examine buttons to move the cursor left and
right .
5. To select a region of data for analysis, tap-and-drag across the graph to highlight the desired
region. TIP! To analyze all data, you do not need to select a region.
Statistics
To view statistics for the selected data on the Graph
screen, choose Statistics from the Analyze menu.
Select the check box to select a data column. The
statistics information is then displayed in the panel
to the right of the graph.
To remove the displayed statistics, tap Analyze on
the Graph screen, choose Statistics, and then select
the checked box to clea
the selection.
2
LabQuest®2 – User Manual
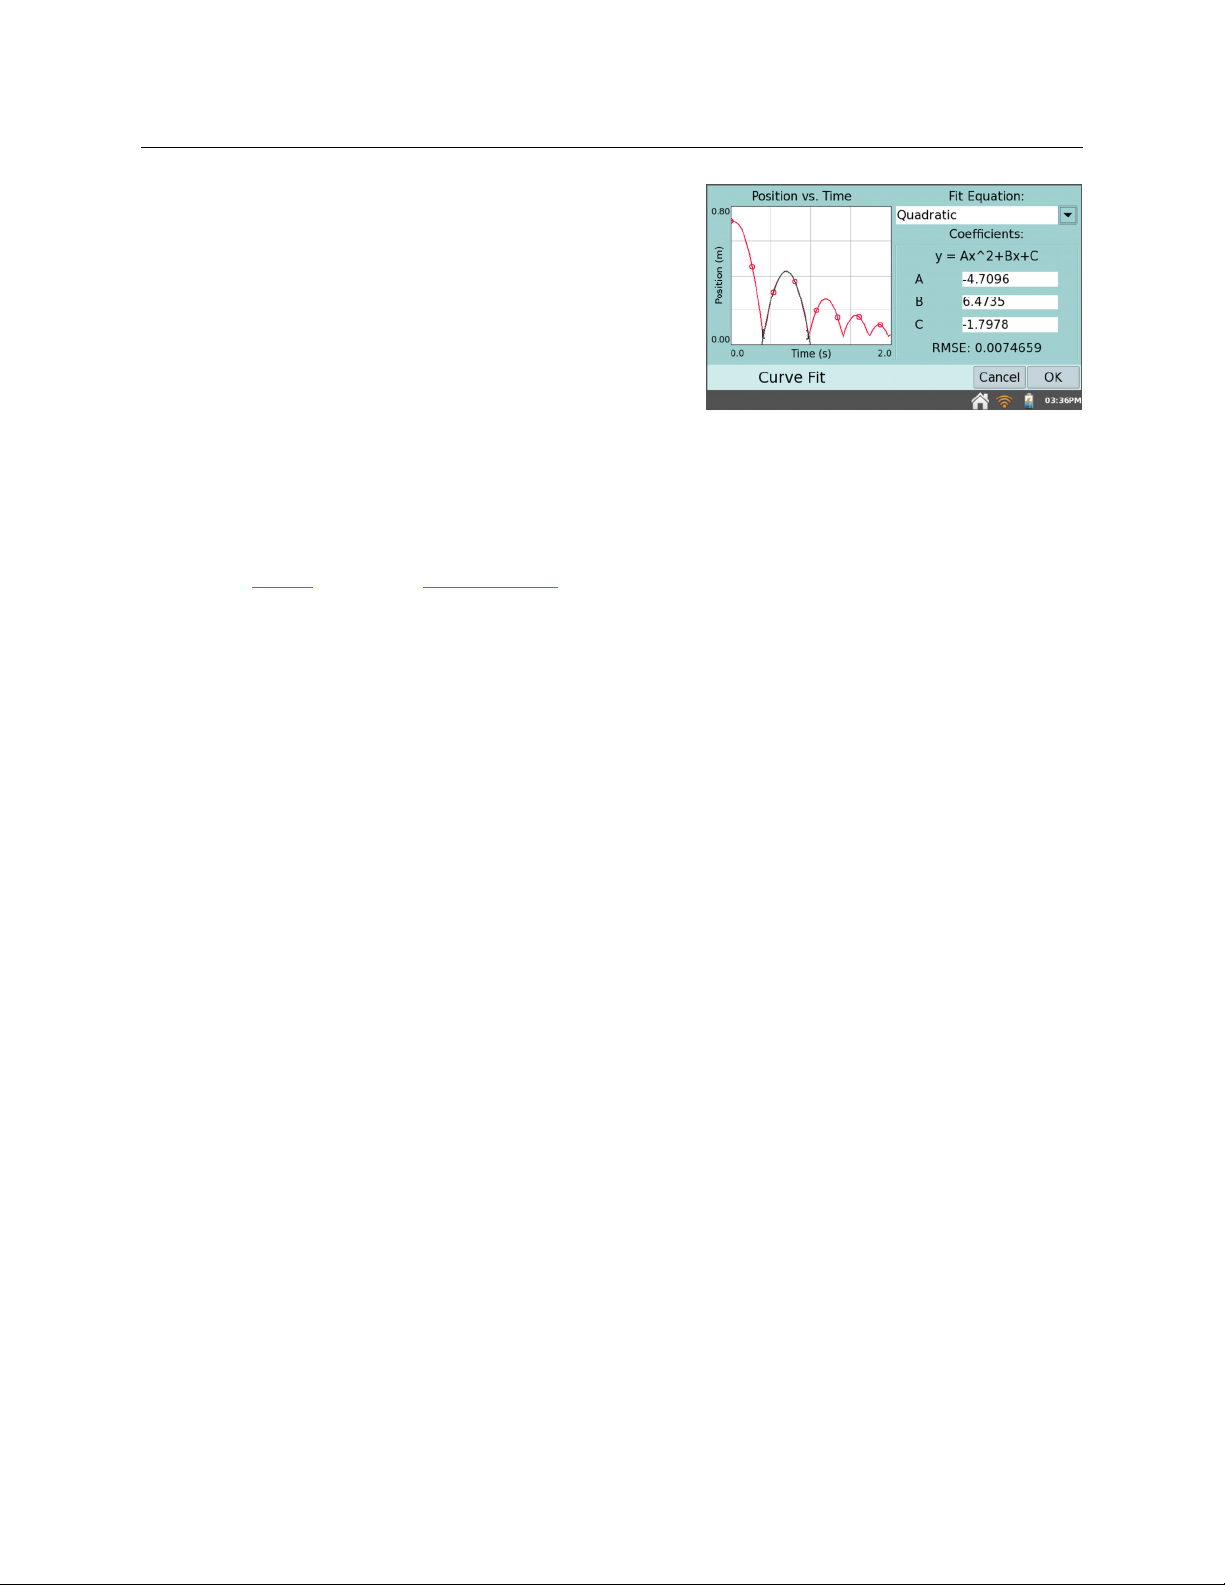
Curve Fit
To fit a curve to the selected data on the Graph
screen, choose Curve Fit from the Analyze menu.
Select the check box to select a data column. Tap
Choose Fit and choose the desired fit equation.
LabQuest automatically determines and displays
the fit coefficients, and displays a preview of the
curve fit on the graph. Tap OK to apply the fit and
return to the Graph screen.
To remove the fit, choose Curve Fit from the
Analyze Menu, and then select the checked box to
clear the selection.
TIP! The Curve Fit coefficients cannot be manually adjusted. To enter your own parameters,
see the Modeltool within Data Analysis.
3
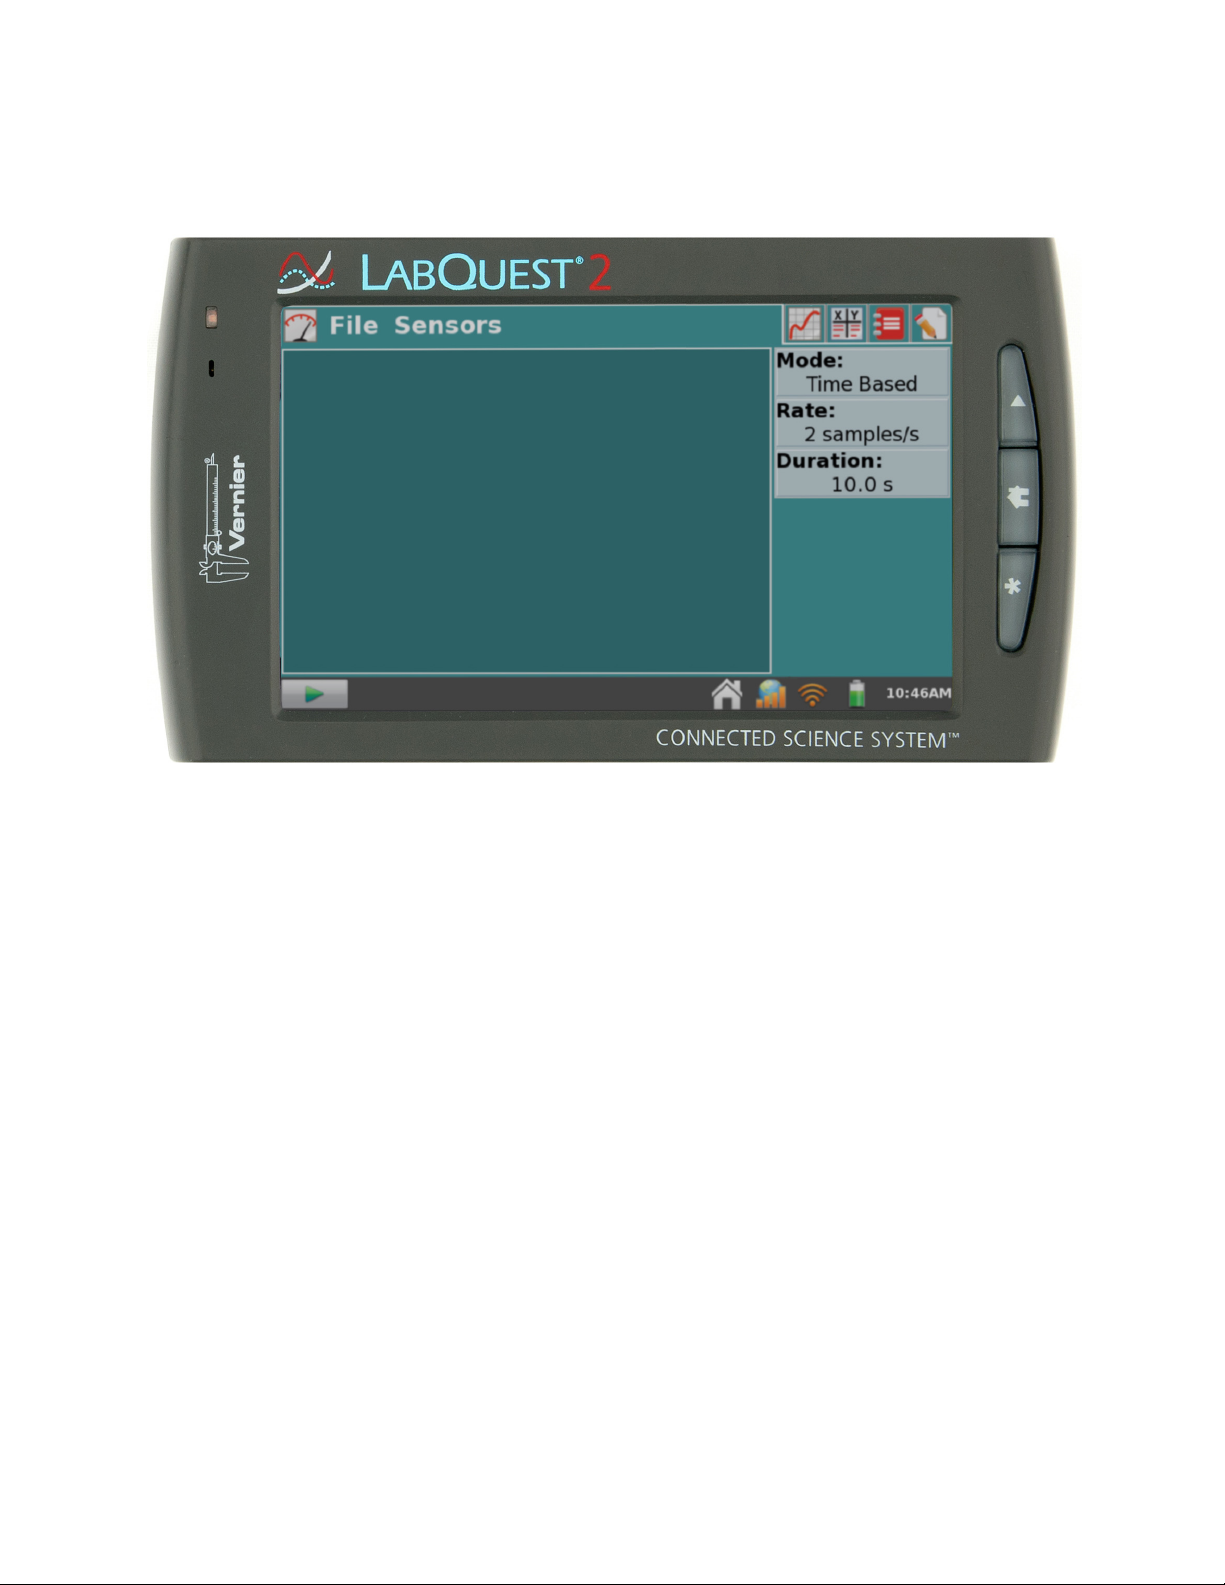
II. LABQUEST® 2 HARDWARE
Once LabQuest is connected to AC power or the battery has charged, press the power button
located on the top of the unit, near the left edge. LabQuest will complete its booting procedure
and automatically launch the LabQuest App by default, as shown above. If the screen
momentarily shows a charge battery icon or does not light after a moment when used on battery
power, connect the power adapter to LabQuest and to an AC power source, then try the power
button again.
Power Button
Power on
turned off to conserve battery power), press and release the power button to turn LabQuest
back on. If LabQuest was off, LabQuest will also complete its booting procedure, which
takes about a minute, and then display LabQuest App.
Sleep/wake
into a sleep mode. Note that sleep mode does not start until you release the power button. In
this mode, LabQuest uses less power but the battery can still drain. This mode is useful if you
are going to return to data collection again soon, in which case waking LabQuest from sleep
is quicker than restarting after shutdown. To wake LabQuest from sleep, press and release the
power button. When LabQuest is left asleep for one week it will automatically shutdown.
Shut down
LabQuest displays a message indicating it is shutting down. Release the power button, and
allow LabQuest to shut down. To cancel the shutdown procedure at this point, tap Cancel.
You can also shut down LabQuest from the Home screen . To do this, tap System and then
tap Shut Down .
Emergency shutdown
LabQuest powers off uncleanly. This is the same as pulling the battery out of the unit while it
is running. This is not recommended unless LabQuest is frozen, as you may lose your data
and potentially cause file system corruption.
—If the screen is off for any reason (LabQuest is off, asleep, or the screen has
—When LabQuest is on, press and release the power button once to put LabQuest
—To shut down LabQuest, hold the power button down for about five seconds.
—If you hold the power button down for about eight seconds,
4
LabQuest®2 – User Manual
Touch Screen
LabQuest has an LED backlit resistive touch screen that quickly responds to pressure exerted on
the screen. LabQuest is controlled primarily by touching the screen. The software is designed to
be finger-friendly. In some situations, you may desire more control for precise navigation. In
such cases, we recommend using the included stylus.
If you are having trouble viewing the color screen or are using LabQuest outside in bright
sunlight, we recommend changing to the High Contrast mode. Tap Preferences on the Home
screen, then tap Light & Power. Select the check box for High Contrast to enable this mode.
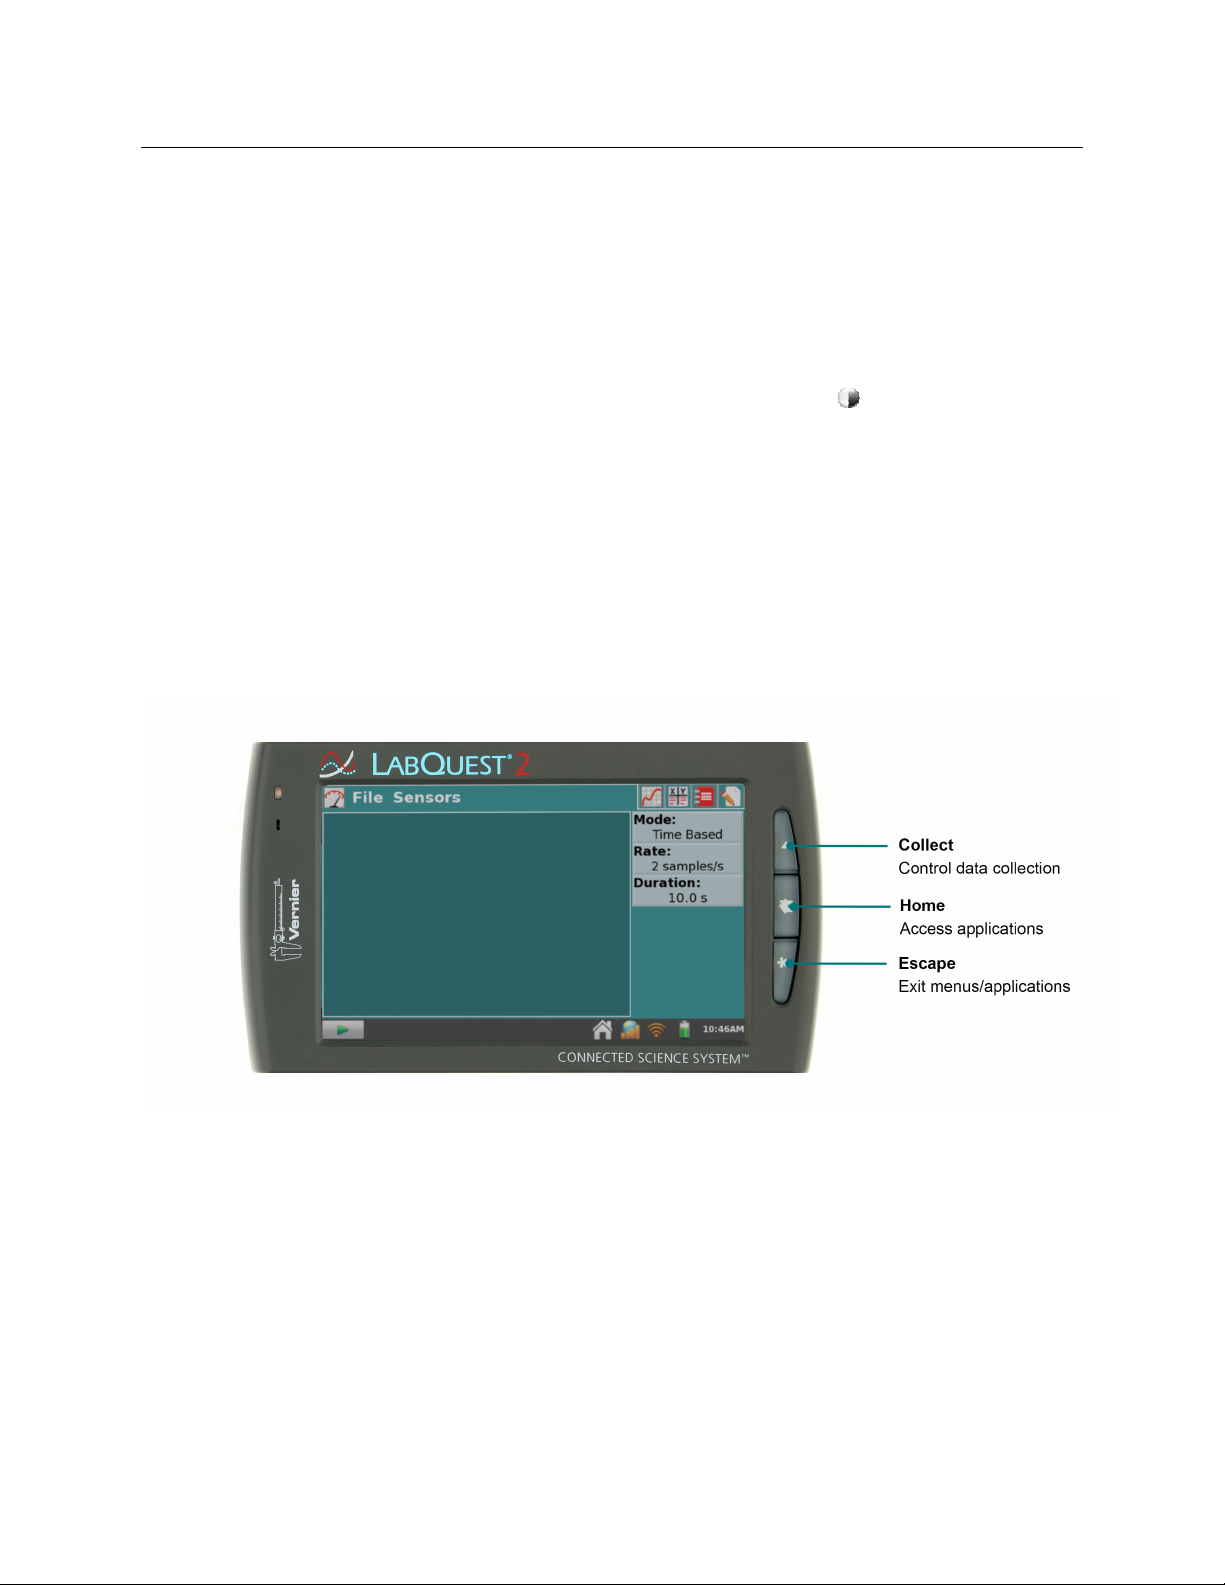
Hardware Keys
In addition to using the touch screen, the three hardware keys can also be used to control your
LabQuest.
Collect
Home
Escape
cancel dialog boxes)
—Start and stop data collection within LabQuest App
—Launch the Home screen to access other applications
—Close most applications, menus, and exit dialog boxes without taking action (i.e.,
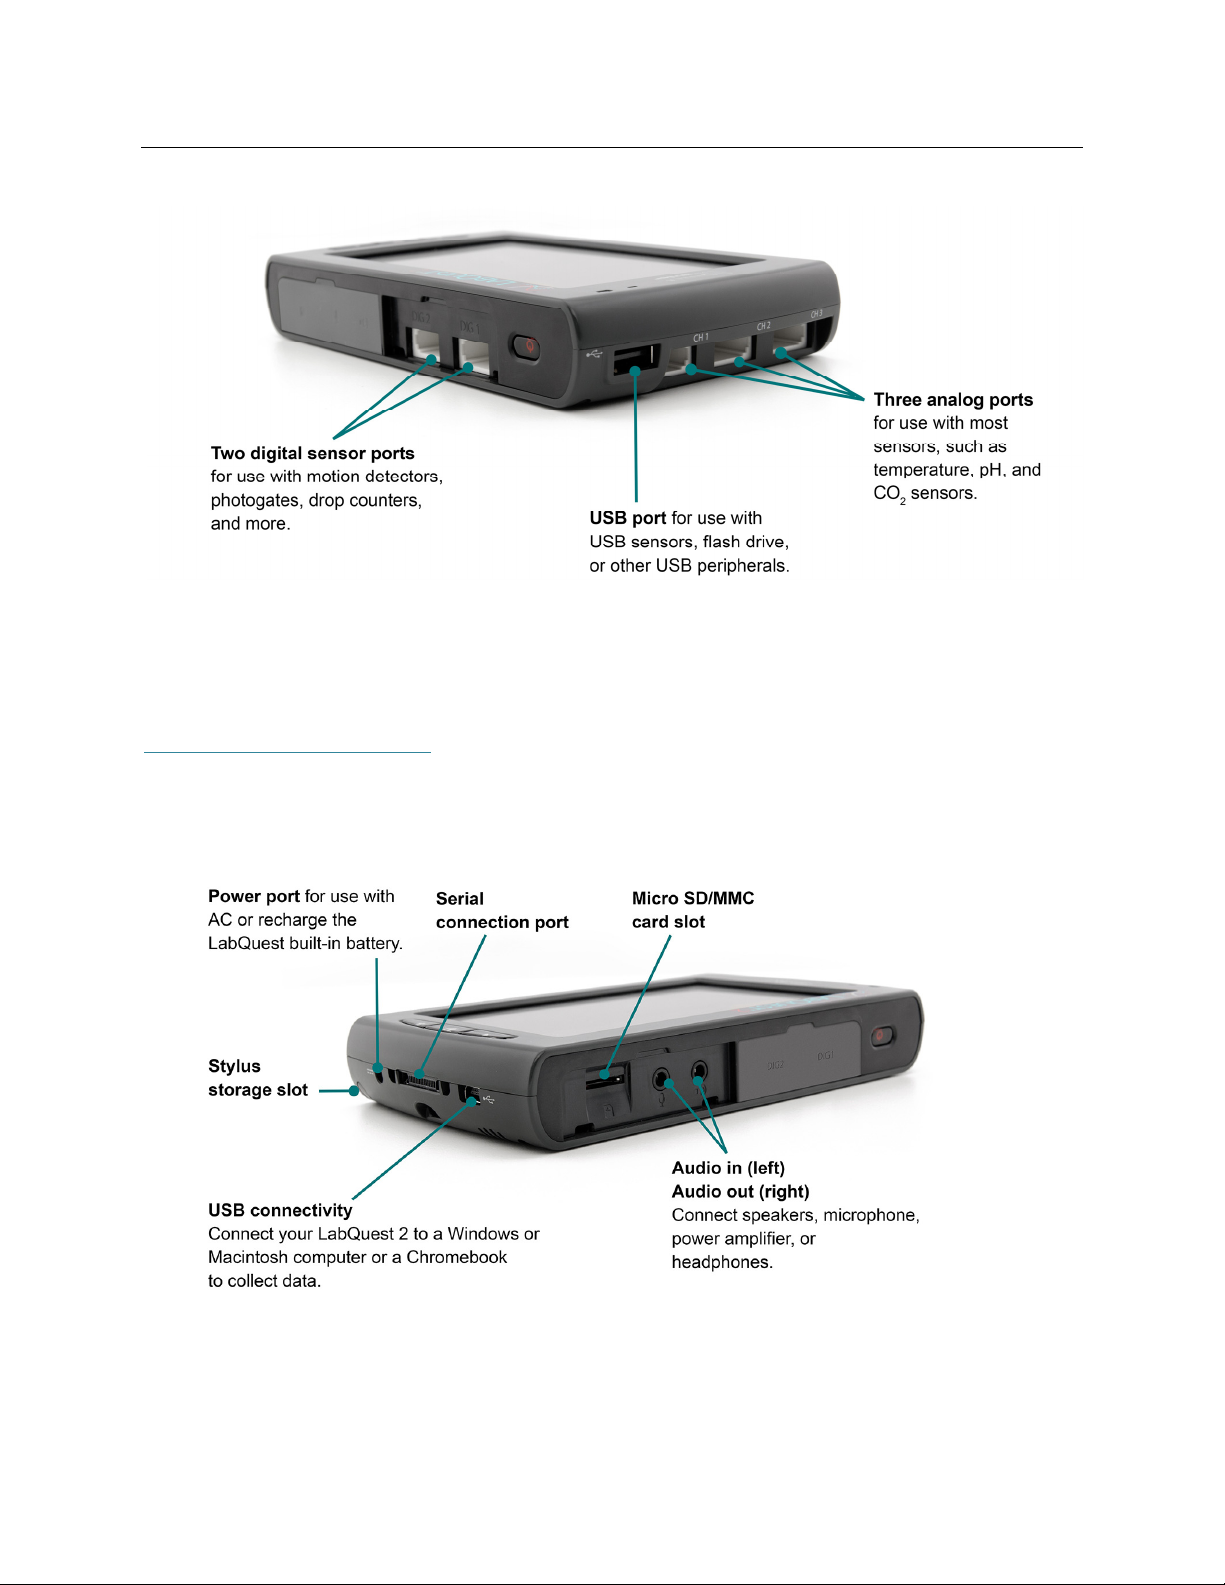
Sensor Ports
LabQuest has three analog sensor ports (CH 1, CH 2, and CH 3) for analog sensors such as our
pH Sensor, Temperature Probe, and Force Sensor. Also included is a full-size USB port for USB
sensors, USB flash drives, and USB printers. In addition to the power button, the top edge of
LabQuest has two digital sensor ports (DIG 1 and DIG 2) for Motion Detectors, Drop Counters,
and other digital sensors.
5
LabQuest® 2 Hardware
Audio ports are also located adjacent to the digital ports, as well as a microSD card slot for
expanding disk storage. On the side opposite of the analog ports, there is a stylus storage slot, an
AC power port for recharging the battery, and a mini USB port for connecting LabQuest to a
computer. In between these ports, there is a serial connection for charging the unit in a
LabQuest Charging Station (order code LQ2-CRG, sold separately) and a stylus tether
attachment point.
6
LabQuest®2 – User Manual
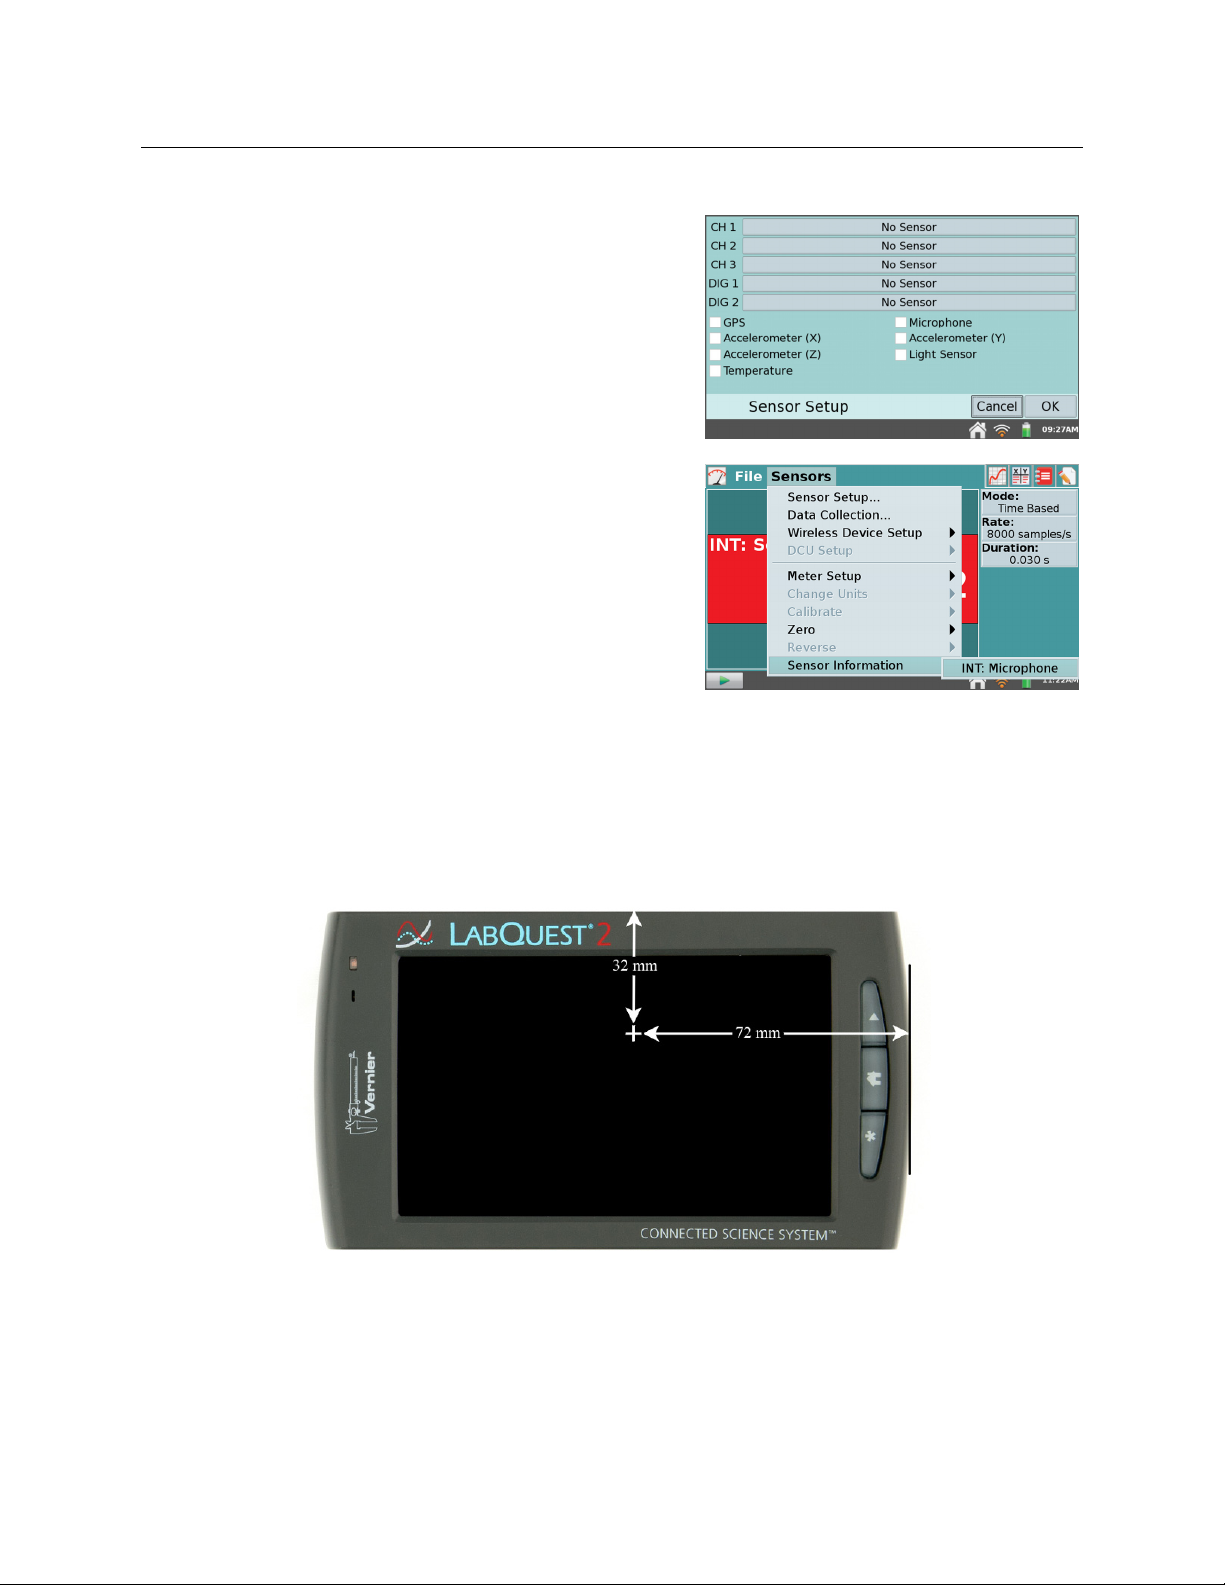
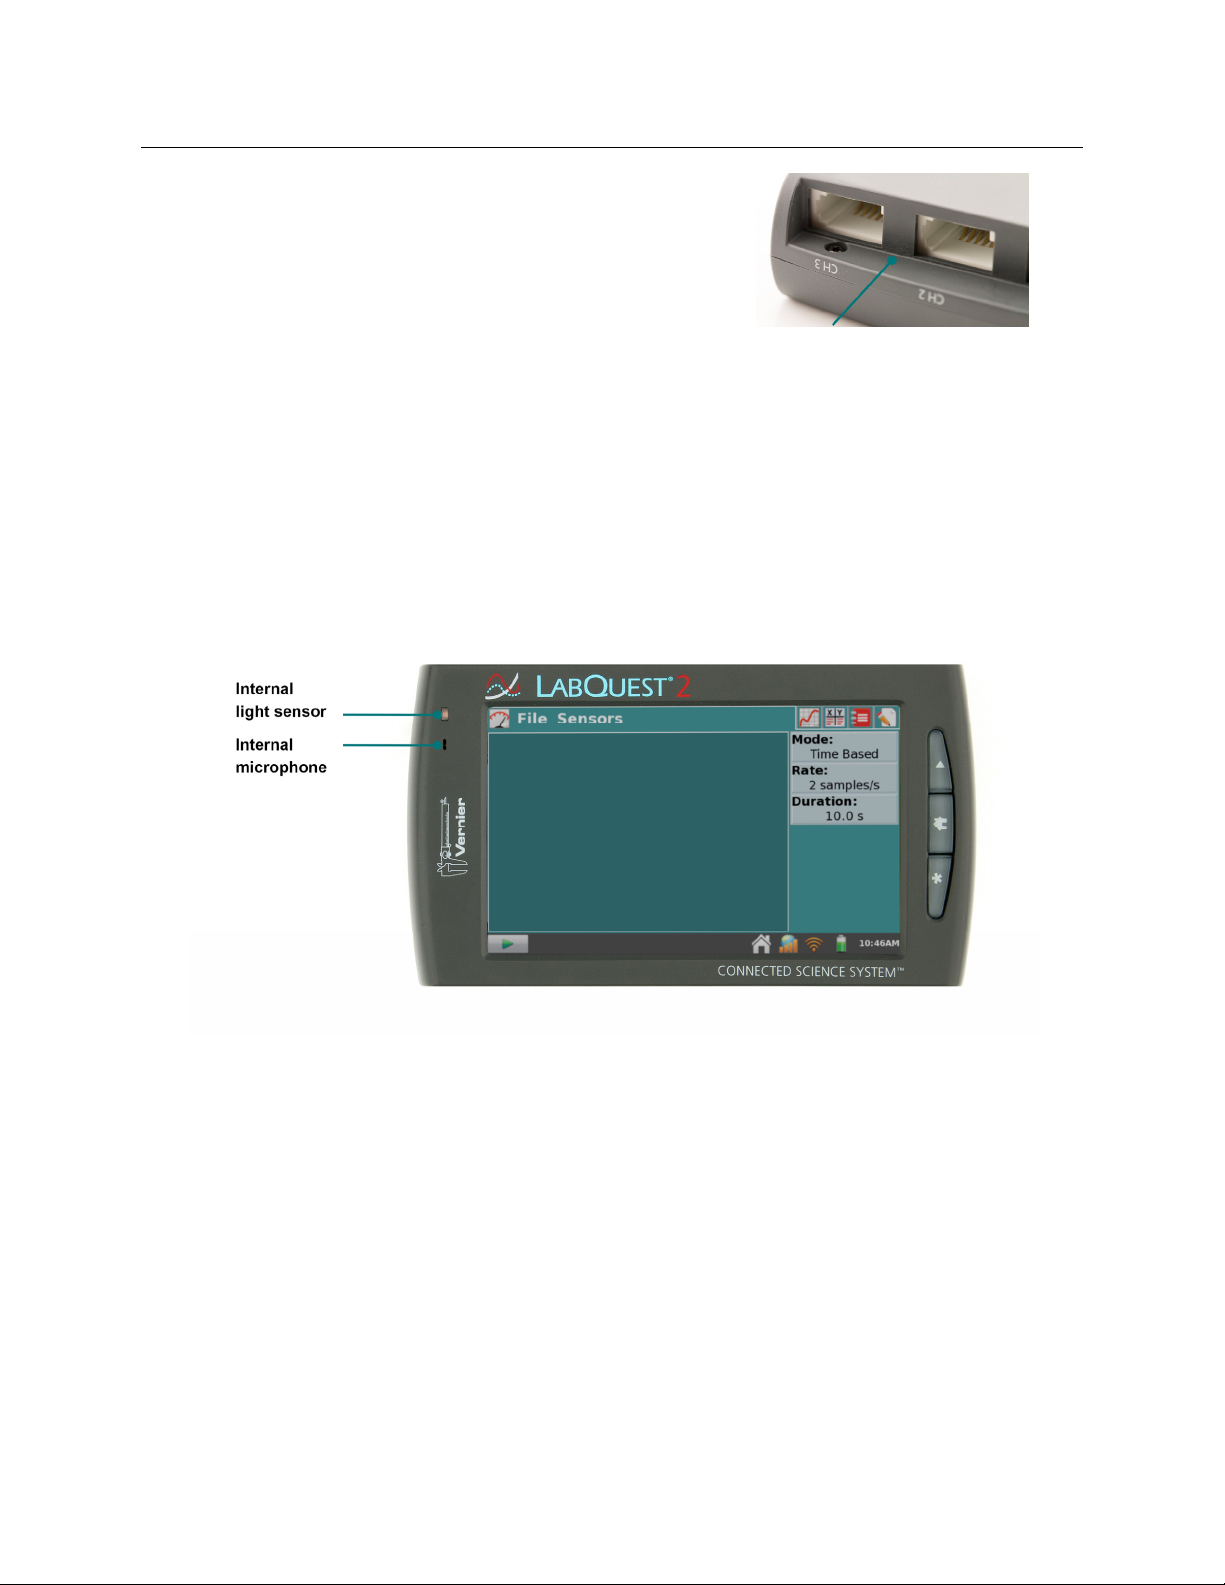
Internal Sensors
LabQuest also has several built-in sensors, including
GPS, microphone, three-axis accelerometer,
temperature sensor, and relative light sensor.
To enable internal sensors within LabQuest App,
choose Sensor Setup from the Sensors menu. Within
the Sensor Setup dialog box, select a check box to
enable the associated sensor. Then tap OK to return to
the LabQuest App Meter screen.
For additional information on internal sensors, enable
the sensor and then choose Sensor Information from
the Sensors menu. Choose the desired sensor from the
list of enabled internal sensors.
GPS—The internal GPS collects latitude, longitude,
and altitude readings, and may be used with other
sensors. You can choose units of decimal degrees,
degree minutes, or UTM.
TIP! It may take up to 15 minutes to acquire an
initial signal outdoors. We do not recommend using
GPS indoors.
Accelerometers—The 3-axis accelerometer measures accelerations up to 2 g in the x-, y-,
and z-axis directions. The sensor is located 72 mm from the docking connector and 32 mm
from the digital port side of the plastic case.
7
LabQuest® 2 Hardware
r
Temperature—The internal temperature senso
monitors ambient temperature. The sensor is
located between CH2 and CH3, in front of the BTA
connectors.
Light Sensor—The internal light sensor is located on the front of LabQuest, to the left of the
screen. This light sensor combines one exposed photodiode (CH0), which is responsive to
both visible and infrared light, and one filtered photodiode (CH1), which is responsive
primarily to infrared light. The CH1 reading is subtracted from the CH0 reading and then
converted to a value in lux that represents illuminance (ambient light level) to approximate
the human eye response. The spectral response range for this sensor is approximately 400–
800 nm.
Microphone—The internal Microphone is located on the front of LabQuest to the left of the
screen, as shown below, and measures waveforms. TIP! This sensor cannot be used with
external sensors.
8
III. LABQUEST® APP
The data-collection and analysis software, LabQuest App, is the heart of LabQuest. When you
turn on LabQuest, the LabQuest App starts automatically. If the LabQuest App is not displayed
on your screen, launch LabQuest App from the Home screen.
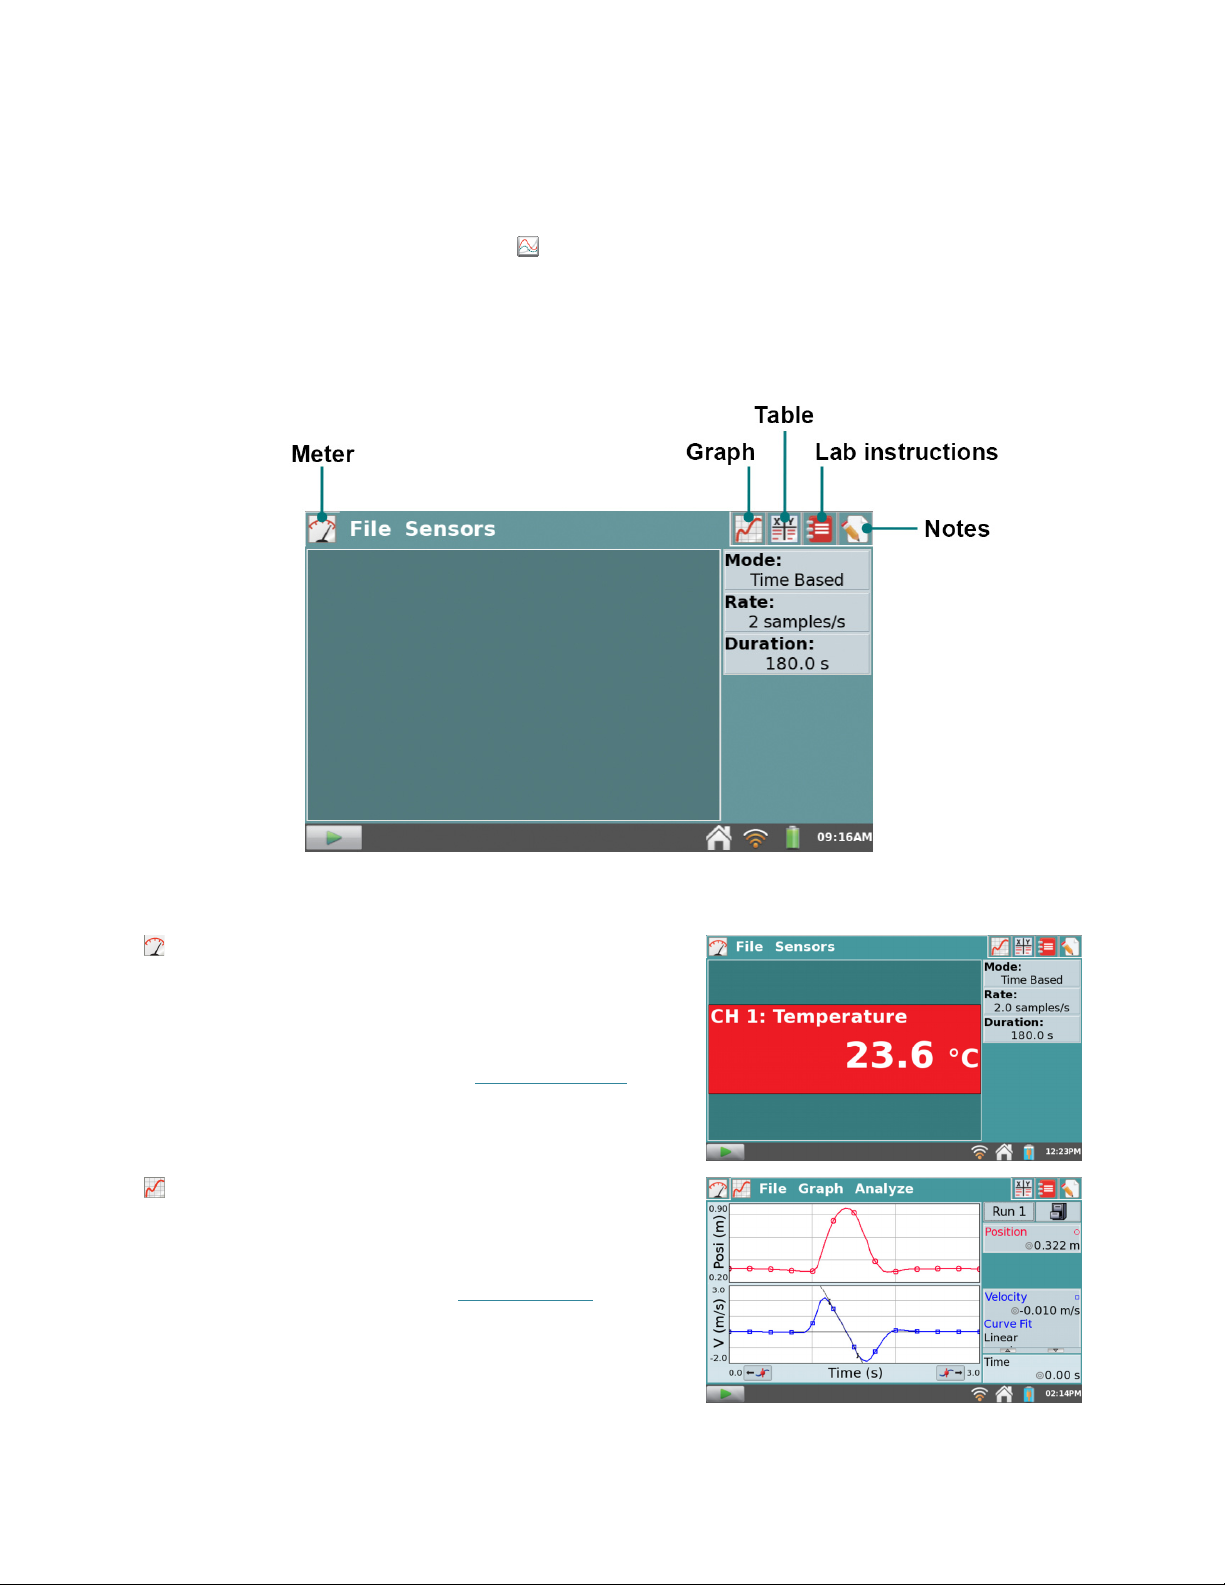
Navigating LabQuest App
LabQuest App has five different screens. Tap on the desired tab to display the associated screen.
LabQuest App
Meter screen
parameters, and see a meter for your connected
sensors.
For a detailed description of how the Meter screen
is used for data collection, see Data Collection.
Graph screen
perform analyses, including curve fits.
For a detailed description of how the Graph screen
is used for data analysis, see Data Analysis
—Set up sensors, set data-collection
—See a graph of your data and
.
9
LabQuest® App
Table screen—See a tabular representation of your
data, create calculated columns, and manually enter
data.
For a detailed description of how the Table screen
is used for data analysis, see Manipulating Data
from the Table Screen.
Lab Instructions screen—Access one of over 100
preloaded experiments for paperless instructions.
For detailed instructions on accessing the preloaded
experiments on LabQuest, see Viewing Vernier Lab
Instructions.
Notes screen—Record observations about your
experiment.
For more information, see Adding Notes to Your
Experiment.
File Menu
A LabQuest App file can contain data-collection settings, graphs, data tables, analyses, and even
notes. These files have a .qmbl extension and can be saved to the internal storage space on
LabQuest or to an external storage device such as a USB flash drive or microSD card.
LabQuest App files can also be opened and manipulated on a computer with Logger Pro
Logger Lite software.
All five tabs within LabQuest App share the same File
menu, which is similar to the File menu on a computer.
From the File menu, you can perform a number of
tasks related to LabQuest App files, such as opening,
saving, and closing files, adjusting file settings,
printing, and more. These are described in more detail
as follows.
New—Choose New from the File menu to reset all
data-collection parameters and sensor calibrations back
to default values. If you have unsaved data, you will be
prompted to either save or discard the data before
continuing.
10
®
3 and
LabQuest®2 – User Manual
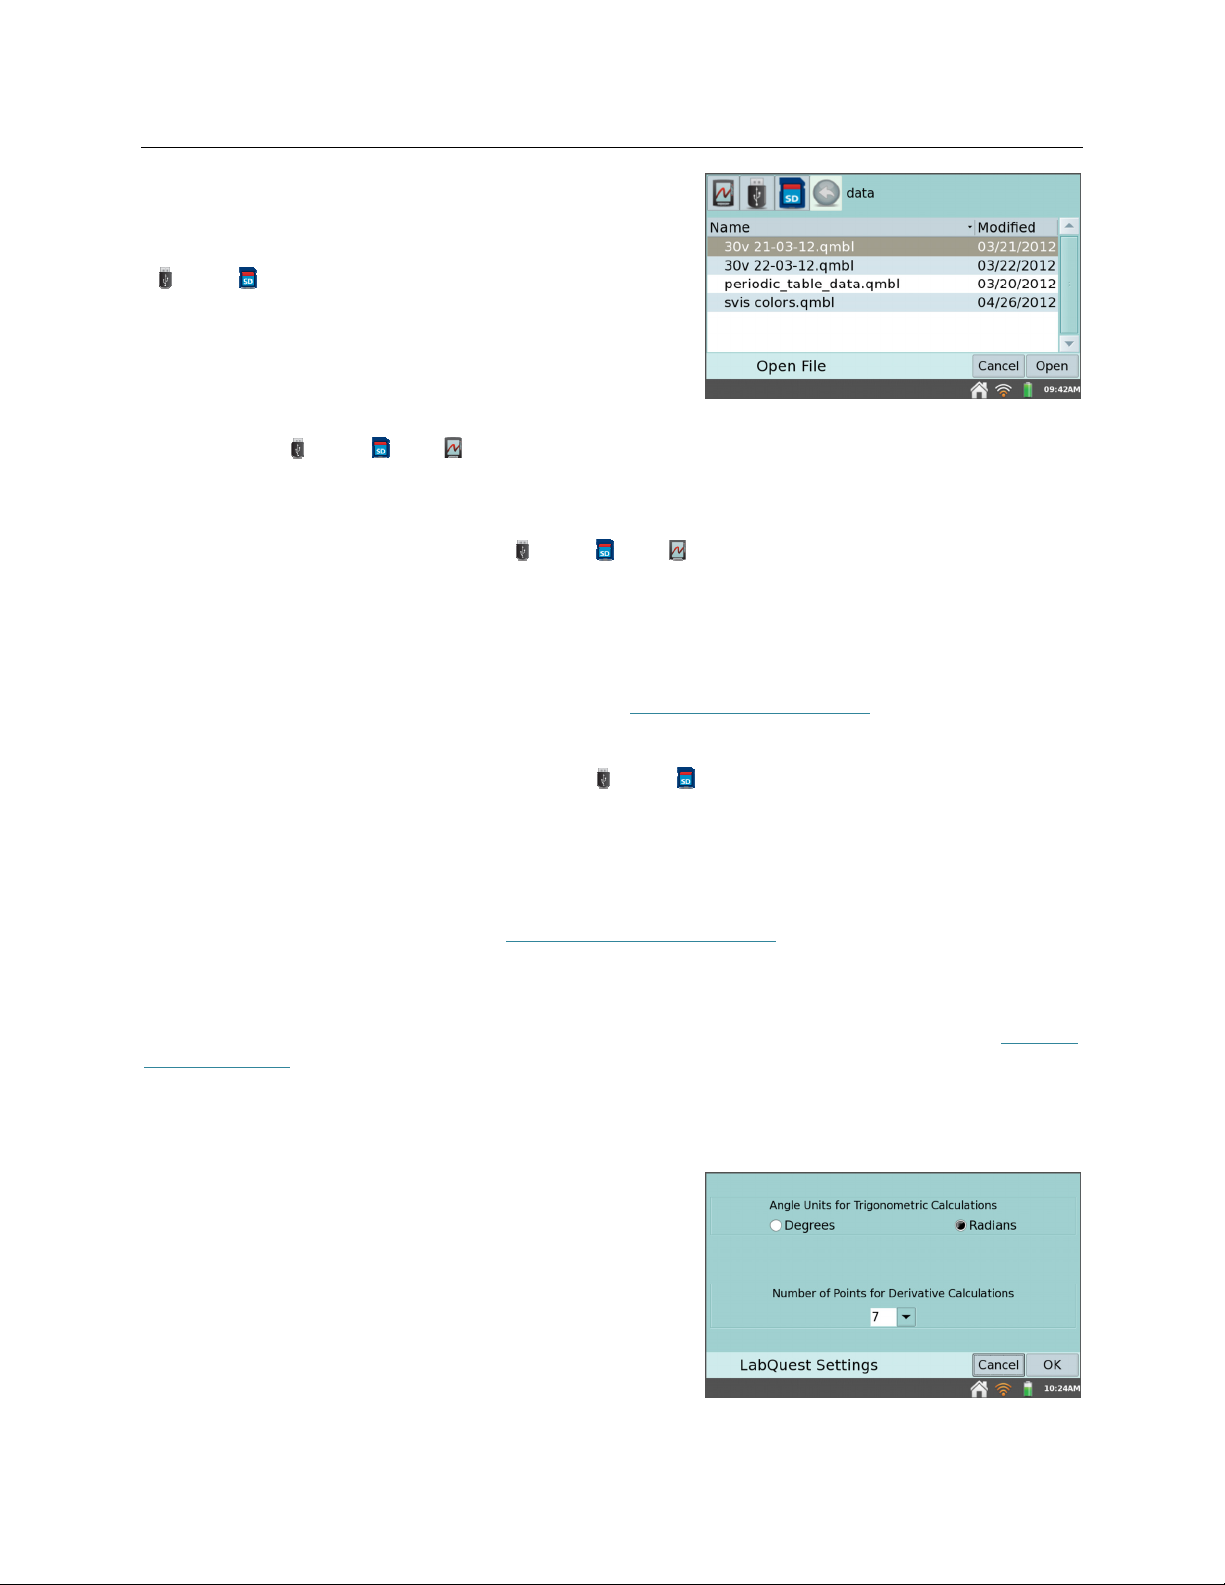
Open
—Choose Open from the File menu to display a
list of files that you have saved on LabQuest. To open a
file, tap the file name, then tap Open. To open a file
from an external storage source, tap the source icon
( USB, SD) to display the files available on that
source, then tap on the file name, and tap Open.
Save
—Choose Save from the File menu to display the Save As dialog box where you can tap on
a source icon ( USB, SD, LabQuest) to select a destination. Tap in the File name field to
assign a name to the file.
Delete
—Choose Delete from the File menu to display a file list similar to that accessible by
choosing open. Tap on a source icon ( USB, SD, LabQuest) to select the source where
the file is located, tap the desired file name, then tap Delete. You can delete only one file at a
time.
Email
—Choose Email from the File menu to email the Data File, Graph, Text File, or screenshot
from the current file when LabQuest is connected to a wireless network with Internet. For
detailed instructions on setting up this feature, see Emailing from LabQuest.
Export
—Choose Export from the File menu to export the current data file in a text format for use
with other applications. Tap on a source icon ( USB, SD) to select a destination, then tap
OK to complete the export.
A typical use of this feature is to export a text file to an SD card or a USB flash drive for further
data manipulation on a computer with a spreadsheet program. The exported file contains all
column values from all runs in the current session, delimited by tabs. For more detailed
instructions on using this feature, see Storing LabQuest App Files.
Print—
Choose Print from the File menu to print the Graph, Table, Lab Instructions, Notes, or
Screen from the current file to a USB or Wi-Fi-enabled printer. You can also save a PDF file on
a USB flash drive or SD card using the Print to File option. For detailed instructions, see Printing
from LabQuest.
Settings
—Choose Settings from the File menu to adjust file settings for the current session.
These settings are specific to and saved within the LabQuest file. These settings return to default
upon choosing New from the File menu.
Angle Units for Trigonometric Calculcations
Calculated columns, curve fits, and modeled
functions may use trigonometric calculations;
choose Degrees or Radians here.
The default is set to radians.
11
LabQuest® App
Number of Points for Derivative Calculations
Calculated columns, curve fits, modeled functions, and even the automatic setup for sensors
(e.g., Motion Detectors) may use numerical derivatives. The algorithm for such derivatives
utilizes a user-defined number of points. The default value of seven points is good for many
experiments, but you may want to choose a larger number for human-scale Motion Detector
experiments (e.g., our Motion Match lab), or a smaller number for cart-based Motion
Detector experiments (e.g., our Impulse and Momentum experiment).
Quit—Choose Quit from the File menu to exit LabQuest App. Since other applications can run
simultaneously with LabQuest App, there is typically no need to quit LabQuest App during
standard use.
Data Collection
Data collection with LabQuest starts from the Meter screen, which is the default screen for
LabQuest App. From this screen, you can view sensor readings updated in real time as well as a
summary of the data-collection settings. Additionally, you can access updated tools to modify
and customize these settings for your particular experiment.
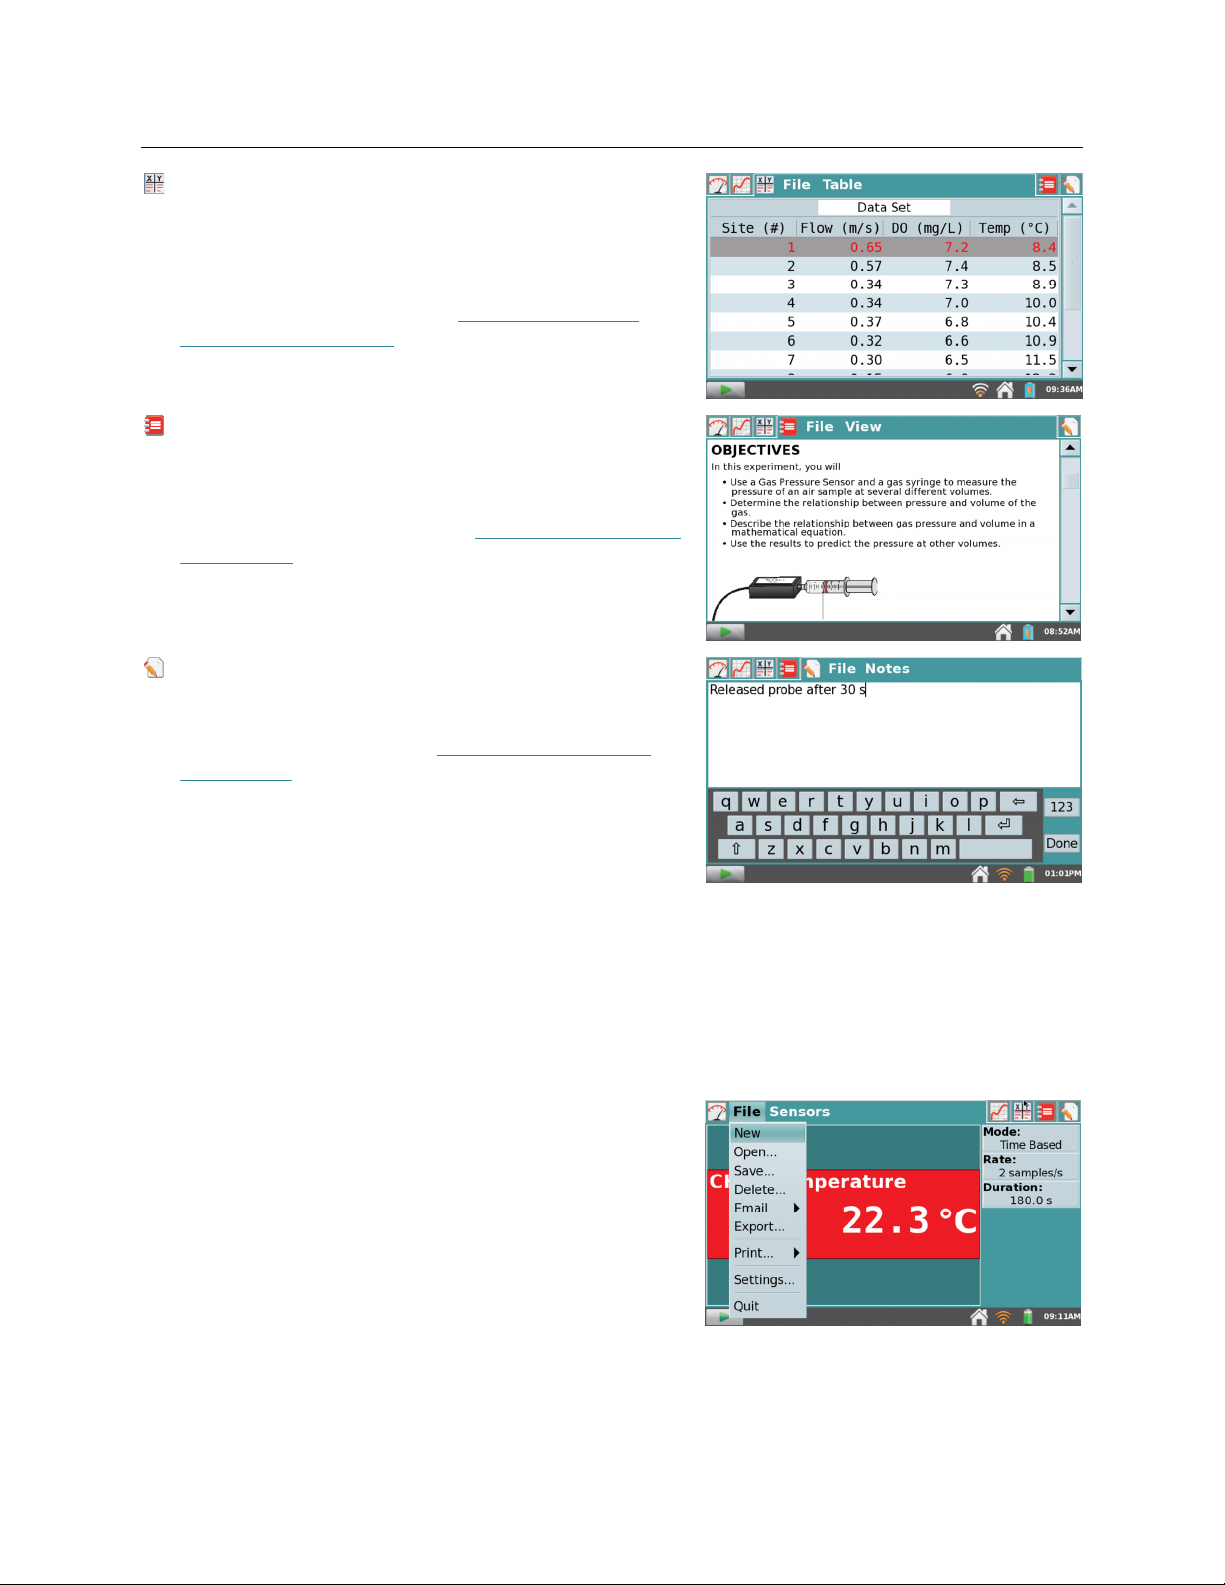
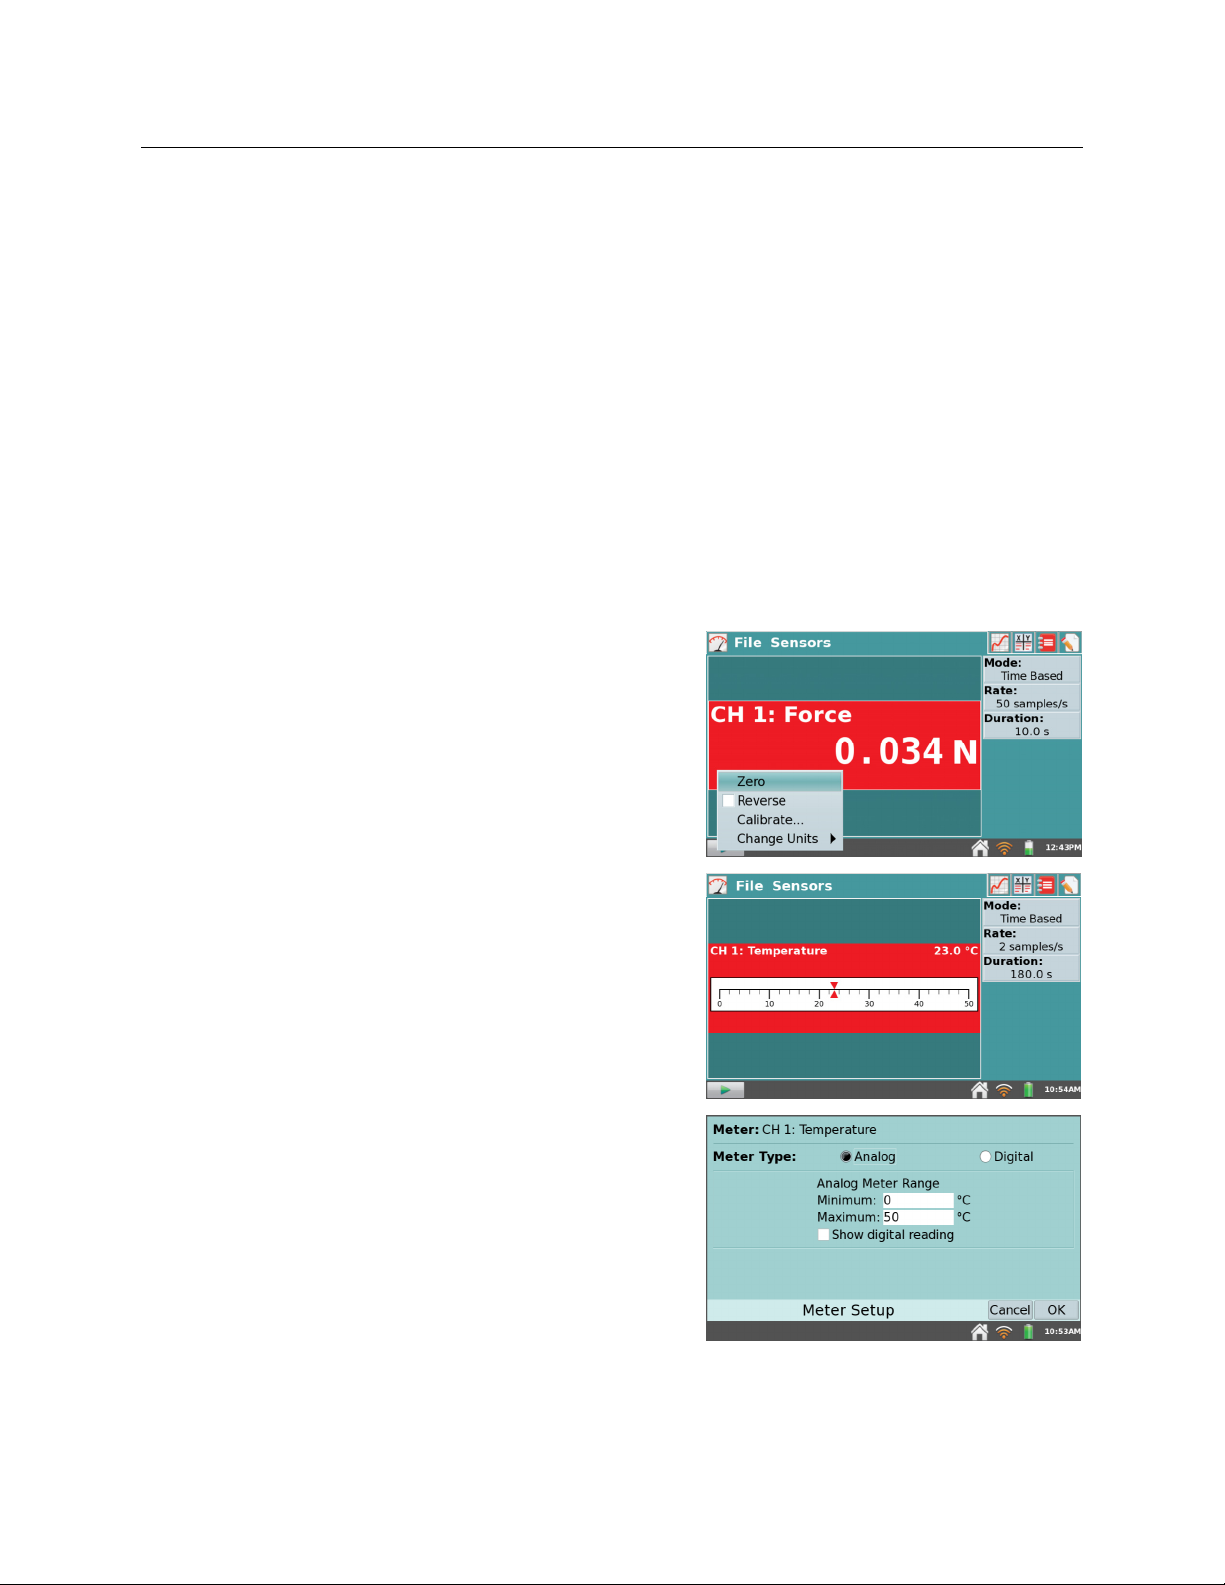
Digital Meters
A digital meter for each connected sensor is shown on
this screen. Tap on a meter to change sensor settings.
The available options will depend on the sensor and
may include options to change units, calibrate, zero,
and reverse the sensor. These options can also be
accessed from the Sensors menu.
Analog Meters
To display an analog meter, choose Meter Setup from
the Sensors menu, or as a shortcut, tap the digital meter
on the Meter screen.
Within the Meter Setup dialog box, enter the minimum
and maximum values for the meter range. If you want
to view both the analog and digital readings for a
sensor, select the Show digital reading check box.
12
LabQuest®2 – User Manual
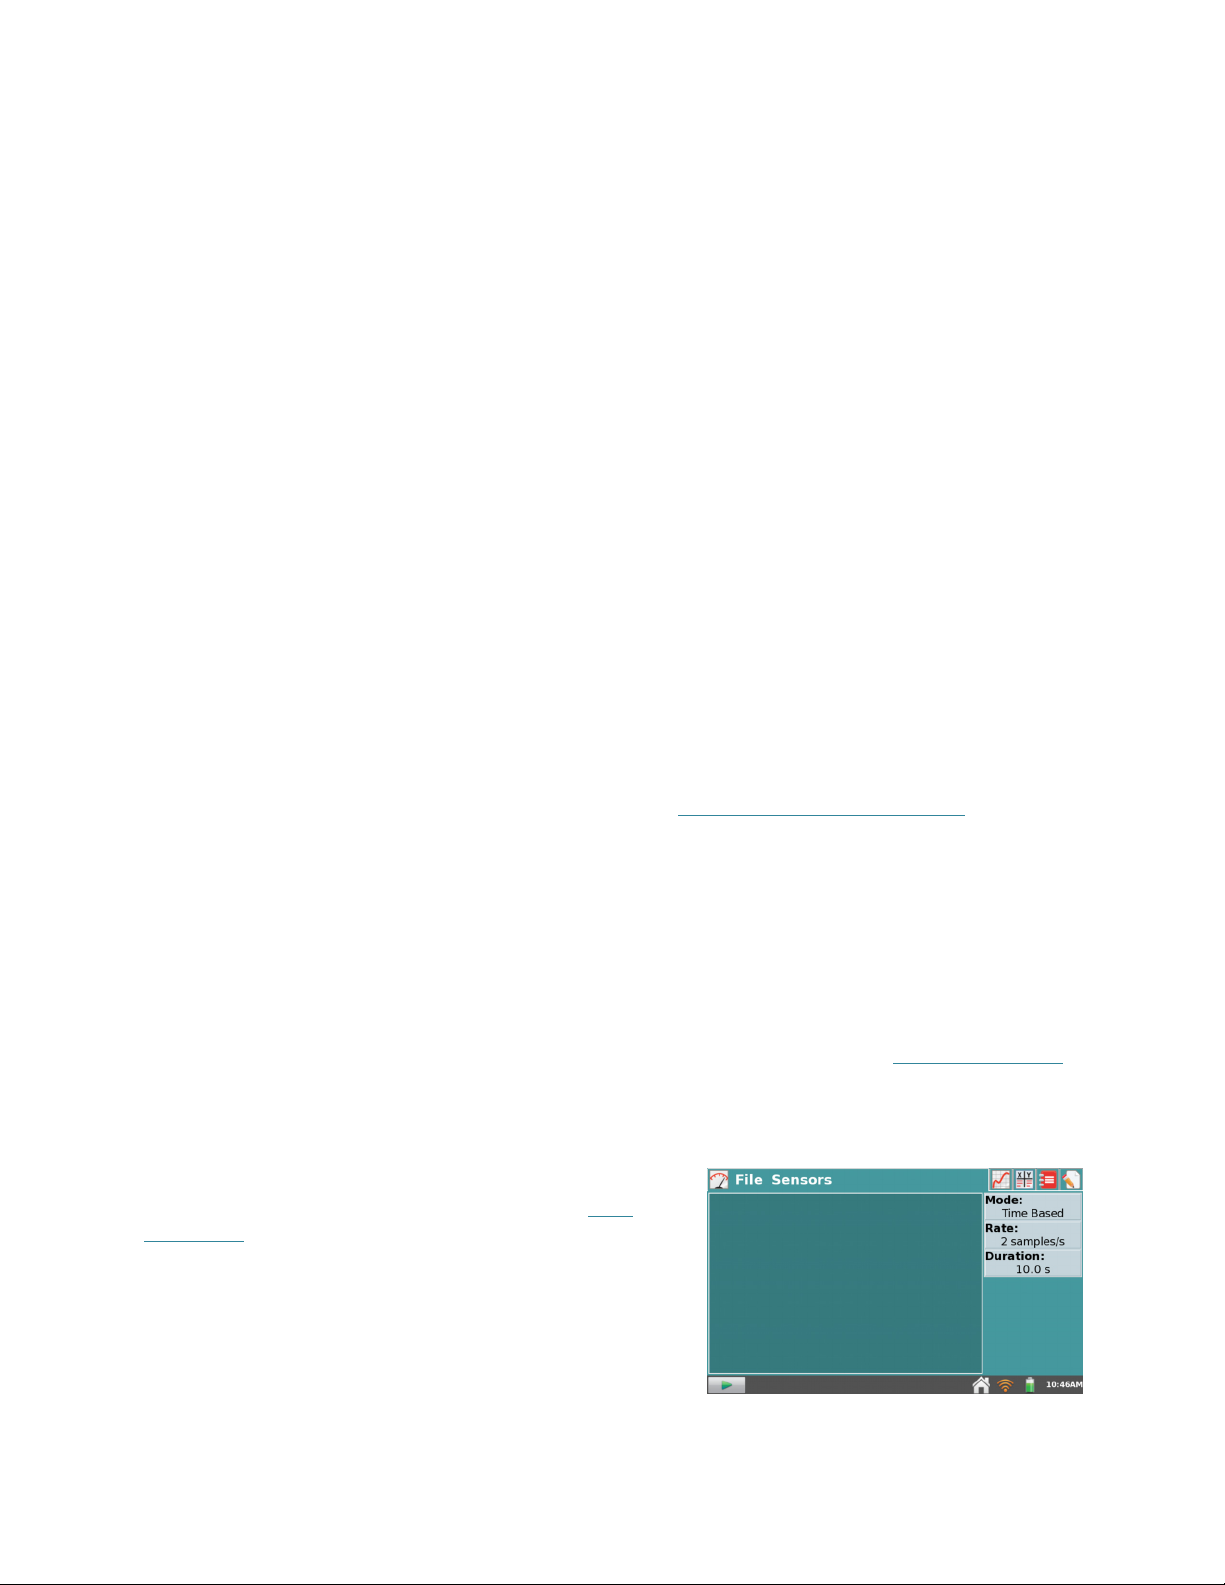
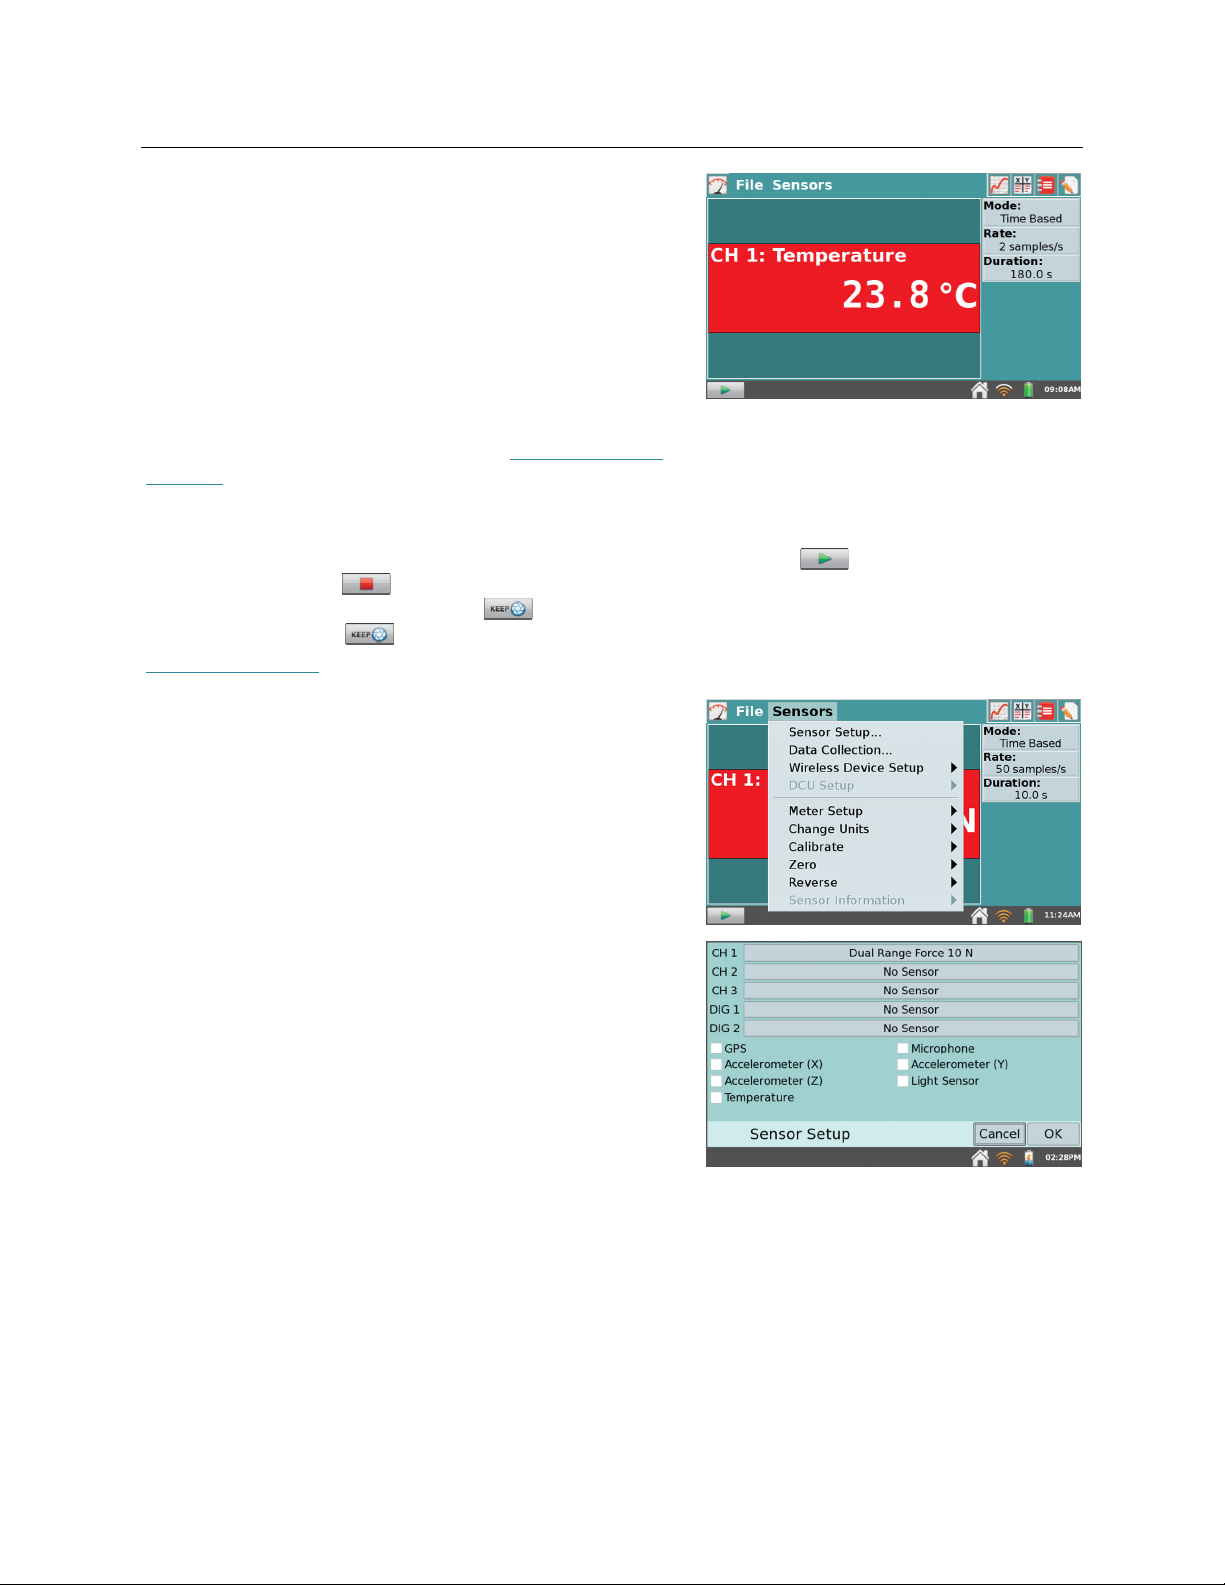
Data-Collection Summary
A summary of the data-collection settings (Mode, Rate,
Duration) is shown in the panel to the right of the
Meter screen. For most sensors, the default datacollection mode is Time Based. The default collection
rate for the connected sensor is automatically set up
when LabQuest identifies the sensor. To modify the
data-collection settings, tap the summary box.
Alternatively, you can choose Data Collection from the
Sensors menu. For detailed descriptions of datacollection modes and parameters, see Data-Collection
Settings.
Data-Collection Controls
To start data collection from any LabQuest App screen, tap Collect . During data
collection, tap Stop to end data collection early. In selected data-collection modes (e.g.,
Events with Entry), a Keep button will appear to the right of the Stop button. In this
mode, you must tap to record the data point in the data table. For more information, see
Events with Entry.
Data-Collection Settings
The Sensors menu provides access to detailed setup
controls. Use this menu to set up internal sensors, nonauto-ID sensors, and wireless sensors. You can also use
this menu to change the data-collection parameters and
adjust sensor-specific settings.
Sensor Setup
—Choose Sensor Setup from the
Sensors menu to view connected sensors. To
manually set up non-auto-ID sensors, tap the field
displaying “No Sensor” for the channel to which
your sensor is connected. Then choose the
appropriate sensor from the list and tap OK.
You can also activate (or deactivate) the internal
sensors from the Sensor Setup dialog box. Select
the check box next to the desired sensor to make
that sensor available for data collection.
13

LabQuest® App
Data Collection—Choose Data Collection from the
Sensors menu to set the data-collection mode and
associated parameters. The parameters listed will
depend on the mode selected. Data-collection
modes include Time Based, Events with Entry,
Selected Events, Photogate Timing, Full Spectrum,
Gas Chromatograph, Drop Counting, and Data
Matrix.
o Mode: Time-Based—Time-based data collection
is the default data-collection mode for most
sensors. In this mode, sensor readings are
recorded at regular time intervals.
Adjustable parameters for this mode include the
rate (or interval) and duration of data collection.
The total number of samples to be collected
based on these parameters will be displayed.
Warning Messages
Under some circumstances, the Rate and Duration fields may be highlighted in yellow or
red. The yellow warning indicates that the rate has been set to a value slower or faster
than what is recommended for the connected sensor, or that the number of samples
could lead to performance issues. You can still collect data using these settings;
however, you may have undesirable results.
The red warning indicates one of the following, and you cannot exit the dialog box until
the warning condition has been resolved:
The rate has been set to a value slower or faster than what a connected device
and/or sensor configuration can support
The number of samples exceeds the storage available
The number of samples exceeds 2000 (for rates faster than 80,000 samples/s)
14

LabQuest®2 – User Manual
Triggering
—Triggering is only available in the
Time Based mode. When enabled, LabQuest
waits for a trigger condition to be met before
recording data collection. To set the trigger
condition, choose the sensor and set the
threshold condition. You can also set the
number of points to be saved before the trigger
condition is met.
Advanced
—The Advanced field has three options that can be independently enabled by
selecting the associated check box.
Oversampling
can be used with datacollection rates less than ten samples per
second. When enabled, the sensor will
sample at a higher rate than the number of
samples per second that you set, and then
LabQuest averages those readings and
records the averages in the data table. This
setting can be used to reduce measurement
noise by combining a burst of readings into
one value. As an example, oversampling
can sometimes reduce the influence of
unseen but real variations, such as as those
from a flickering light source.
Repeat
can be used with data-collection rates less than 250 samples per second.
When enabled, a new data-collection run is started as soon as the current run has
ended. Data for each run is overwritten when a new run is started. This setting is
helpful when doing exploratory investigations.
Enable Data Marking
can be used to mark
points of interest during a time-based data
collection. When enabled, a Mark Data
button will appear during data
collection. Tap to mark that particular
point as a point of interest. After completing
data collection, data marks can be named
using the panel to the right of the graph.
Photogate Mode
is used for photogate experiments that also use a time-based sensor
such as a force sensor. Examples include impulse and momentum and centripetal
force experiments. See Photogate Timing.
15

LabQuest® App
o
Mode: Events with Entry
experiments depend on a quantity other than
time. For example, a Boyle’s law experiment,
investigates the pressure as a function of the
volume of gas. In Events with Entry mode, no
time information is recorded.
Enter a name and units for each independent
variable. You also have an option to average
data over ten seconds and report the averaged
reading.
In Events with Entry mode, a Keep button
appears during data collection. Tap Keep to
record the sensor value (e.g., gas pressure in the
Boyle’s law experiment). In response, LabQuest
prompts you to enter a value for the
independent variable (e.g., gas volume in the
Boyle’s law experiment). Sensor data are
plotted against the independent variable, as
shown in the screenshot to the right.
o
Mode: Selected Events
is similar to Events with Entry, except that
entries of 1, 2, 3... are automatically recorded as
the independent variable. To record time
information in place of an entry value, select the
check box for Use Time Column.
—Sometimes
—Selected Events mode
16
o
Mode: Photogate Timing
—Photogates require a
different set of timing options. When a
photogate is detected, LabQuest enters the
Photogate Timing mode.
You have two options for ending data collection
in this mode: tap Stop, or end collection after a
defined number of events. A block/unblock pair
counts as two events.
Choose the proper Photogate Mode for your
experiment. For more information, see
www.vernier.com/til/3329

LabQuest®2 – User Manual
o Mode: Full Spectrum—When a spectrometer is
detected, LabQuest enters the Full Spectrum
mode. In this mode, Intensity, Absorbance,
Fluorescence, or %Transmittance can be
measured as a function of wavelength.
Detailed instructions for setting up data
collection with spectrometers are included in
each of our spectrometer experiments.
o Mode: Gas Chromatograph—When a Vernier Mini Gas Chromatograph (Mini GC) is
detected, LabQuest enters the Gas Chromatograph mode. In this mode, various
parameters are available for the user to establish a temperature and pressure profile
adequate for the current experiment.
When starting data collection, a set of default
parameters is displayed. Tap the parameter field
to enter a new value, or adjust the default value
using the arrows. These values will be reflected
in the preview of the time-dependent
temperature graph displayed to the right. After
setting the parameters, tap OK to initiate the
Mini GC warm up.
For more detailed information on the Vernier
Mini Gas Chromatograph, see
www.vernier.com/gc2-mini/
o Mode: Drop Counting—This mode is used with the Vernier Drop Counter. When using
this mode, data points are recorded every time a drop is detected by the drop counter.
For information on calibrating a drop counter, see www.vernier.com/manuals/vdc-btd
o Mode: Data Matrix—This mode is helpful for
field work. It provides a way to collect data
referenced to two parameters, such as the
locations of your sampling sites and the dates
they were sampled. You can collect data from
an unlimited number of sensors by swapping the
sensors in and out of LabQuest during data
collection. For more detailed information, see
www.vernier.com/til/2366/
17

LabQuest® App
Wireless Device Setup—Use Wireless Device Setup
to connect to wireless sensors and interfaces, such
as our Go Direct® sensors, Go Wireless® Heart
Rate, Go Wireless Link, or Wireless Dynamics
Sensor System.
o Go Direct…—Choose Wireless Device Setup ►
Go Direct from the Sensors menu to scan for
and select Go Direct senors such as Go Direct
Temperature, Go Direct Force and Accleration,
or Go Direct pH. Select the serial number of
your device from the list, and tap OK. Repeat as
needed to connect up to three Go Direct sensors.
Once connected to a Go Direct device, tap on its
meter and choose Go Direct ► to access
additional setup options.
Choose Device Details to determine the
battery level or to view hardware and
firmware details.
Choose Identify to flash the LED on the
Go Direct sensor to ensure you are
connected with the desired sensor.
Choose Disconnect to end connection to the
sensor.
Some Go Direct sensors have multiple sensor
channels. These sensors have a default
configuration that may not show all available
channels. Choose Sensor Channels to modify
the Go Direct sensor channel configuration as
needed for your experiment.
18

LabQuest®2 – User Manual
o
Go Wireless—
Choose Wireless Device Setup ►
Go Wireless from the Sensors menu to scan for
and select Go Wireless sensors such as
Go Wireless Heart Rate, Go Wireless Temp,
Go Wireless pH, or Go Wireless Link. Select
the name of your sensor from the list, and tap
OK. Repeat as needed to connect up to three
Go Wireless sensors.
Once connected to a Go Wireless sensor, tap on
its meter and choose Go Wireless to access
additional setup options.
Choose Sensor Info to view or change the
device name, determine the battery level, or
view hardware and firmware details.
Choose Identify to flash the LED on the
Go Wireless sensor to ensure you are
connected to the desired device.
Choose Disconnect to end connection with
the sensor.
o
WDSS
—Choose Wireless Device Setup ►
WDSS from the Sensors menu in LabQuest App
to scan for, select, and configure Wireless
Dynamics Sensor Systems (WDSS). If no
WDSS units are found, tap Scan to search for
WDSS sensors again. The scan may take 20 to
30 seconds and may have to be repeated several
times to find your particular WDSS. Once a
scan has found your WDSS, select its name in
the list, then tap OK.
Select which of the five sensors you want for
data collection and tap OK.
To adjust the data-collection parameters, choose
Data Collection from the Sensors menu. See
Data-Collection Settings
for
more information.
TIP! WDSS cannot be set up for remote data
collection using LabQuest. Use Logger Pro® 3
on a computer to set up WDSS for remote use.
19

LabQuest® App
DCU Setup—Connect a Digital Control Unit (DCU)
to one of the LabQuest digital ports. Choose DCU
Setup from the Sensors menu and select the DCU
for setup.
o Test DCU—Manually turn on and off the
digital lines.
o Configure Activation—Use logic statements to
activate digital lines based on sensor readings.
o Start Activation—Apply digital output logic
immediately or only while collecting data.
TIP! Once digital output has been activated,
automatic identification of sensors is disabled
for the port used by the DCU. The LabQuest
App will not detect the removal of the DCU or
the addition of any other digital sensor in that
port. To turn off the digital output and enable
auto-ID, tap File ► New.
Change Units—In some cases, you may have the option to display the sensor data in another
set of units. Choose Change Units from the Sensors menu to select a different set of units.
Choosing a new unit will change all existing data for that sensor to the new unit, as well as
any subsequent data. If this feature is grayed-out in the menu, then the data for that
particular sensor cannot be displayed in another set of units.
Calibrate—Most sensors use a custom factory calibration identified by LabQuest. However,
some sensors do require calibration, and you will use the Calibrate tool accessible from the
Sensors menu. Follow the detailed calibration instructions provided in the sensor booklet
available online at www.vernier.com/support/manuals
Zero—Choose Zero from the Sensors menu to set the current sensor reading to zero. This
adds an offset to the current reading. Not all sensors can be zeroed.
Reverse—Some sensors read both positive and negative values. For example, the Dual-
Range Force Sensor reads positive values when pulled, and negative values when
compressed, by default. Choose Reverse from the Sensors menu to swap the sign of the
readings with respect to the default settings. Not all sensors can be reversed.
Sensor Information—Choose Sensor Information
and select an internal sensor to view sensor detailed
specifications. Sensor Information is only available
when an internal sensor has been set up for data
collection.
For mor information on internal sensors, see
Internal Sensors
20

LabQuest®2 – User Manual
Graph Settings
LabQuest App displays the Graph screen when data
collection begins. From this screen, you can adjust
graph settings. You can choose what is plotted, how the
graph is scaled, and how the data are formatted.
Graph Options—To control how the data are
graphed, choose Graph Options from the Graph
menu. Here you can choose the columns used for
the x- and y-axes and the axes limits. See Adjusting
the Graph View for more information.
Select Autoscale to adjust to the data range after
data collection ends. Autoscale from 0 does the
same, but includes the origin. Manual scaling will
respect values entered in the range limits. To enter
range limits, tap in each field and use the keyboard
to enter numeric values.
The Point Symbols option is selected by default,
and will surround some, but not all, of the points
with a mark (e.g., a circle or triangle). You can
easily identify a trace by the corresponding mark in
the graph legend. Select the checked box to disable
this feature.
The Connect Points option connects data points with straight-line segments. These lines
help the eye follow the data trend, but in some cases are not appropriate. Select the checked
box to disable this feature.
From this screen, you also select the data to be graphed. For the x-axis, choose the desired
column from the X-Axis Column dropdown menu. For the y-axis, select one or more
columns from the run(s) listed under the expanded Graph 1 Y-Axis field.
LabQuest can display a single graph or two graphs sharing a common x-axis and range. Tap
the triangle next to Graph 1 Y-Axis or Graph 2 Y-Axis to show or hide the settings for that
axis. If no column is selected for Graph 2, only one graph will be drawn.
When you are done setting Graph Options, tap OK to return to the Graph screen.
21

LabQuest® App
Data Analysis
You can analyze data from the Graph screen or the Table screen .
Examining Data on the Graph Screen
To examine data on the Graph screen, tap on a data point of interest. The Examine cursor jumps
to the data point with the nearest x-value. Cursor lines highlight the x- and y-axis values, and the
right-side readouts display the associated numerical values of the examined point. You can make
fine adjustments to the cursor location by using the Left Examine Button and Right
Examine Button located on either side of the horizontal-axis label.
In some cases, you may want to examine data for a particular region on the graph. To select a
portion for analysis, tap-and-drag across the desired region. You can adjust the trailing endpoint
of the selected region using the Examine Buttons, if needed. For greater control, you can opt to
use the stylus.
Adjusting the Graph View
You can adjust the graph view in real time during data
collection by applying one of the following actions
from the Graph menu.
Graph Options
—Tap Graph Options to manually
adjust graph settings. To adjust the graph view,
change the values in the Left and Right fields for
the x-axis and y-axis.
Show Graph
—Choose Show Graph from the Graph
menu to quickly jump between displaying one or
two graphs. You can also choose the Full Width
option to remove the data-collection summary box
and maximize the graphs on the screen.
When using spectrometers to collect full spectrum
data, the spectrum is displayed on the graph
background by default. Accordingly, Show
Spectrum is selected under the Show Graph
options. To hide the spectrum, tap on Show
Spectrum to deselect that option.
Autoscale Once
—Choose Autoscale Once from the Graph menu to scale the graph to the data
you have collected so far.
TIP! The graph will automatically rescale larger to show data collected that would
otherwise be off the graph.
Tap on a graph axis label to change the data that are plotted on that axis.
22

Once data collection has ended, zoom options are also
available.
LabQuest®2 – User Manual
Zoom In—
Select a region on the graph, then tap
Zoom In to automatically adjust the axes for
viewing the selected region.
Zoom Out
—Tap Zoom Out to undo a Zoom In and
return the graph axes to the previous settings. If
Zoom In is used several times, Zoom Out will undo
each Zoom In, one at a time.
Collecting multiple runs
Store Run
—You can collect several runs for
comparison. Choose Store Run from the Graph
menu to save the current run and proceed with data
collection. As a shortcut, tap the File Cabinet .
To collect another run, tap Collect. Your new data
set is displayed on the graph. To see your first data
set, tap the Run 2 button to the left of the Filing
Cabinet, and select either Run 1 or All Runs. In this
way, you can gather multiple runs for comparison,
and view just the ones you want.
Striking and Tagging Data from the Graph Screen
To strike or tag data from the graph screen, tap on the
data point or tap-and-drag to select a region of data.
Then, choose the desired tool from the Graph menu
and the action will be applied to the data.
Strike Through Data and Restore Data
—Use these
tools to ignore/restore selected data. Struck data are
ignored for analysis and graphing, and the graph
will update accordingly. To restore all data, tap the
Graph menu and choose Restore Data.
Tag Data
—Use this tool to tag a data point with a comment. After selecting the point and
tapping Tag Data, a large mark (e.g., a circle or square) will be displayed on the graph to tag
the data. To add a comment, tap in the panel to the right of the graph and enter a comment
into the blank field.
23

LabQuest® App
Analyzing Data from the Graph Screen
The Analyze menu on the Graph Screen gives you
access to additional tools such as tangent lines,
integrals, statistics, and curve fits. To apply one of
these tools, choose the desired tool from the Analyze
menu. If prompted, select the desired column.
Upon enabling an analysis tool, a summary of analysis
information is displayed in a panel to the right of the
graph. Scroll arrows will appear, if needed. You can
tap the summary to display the values on a detail dialog
for ease of reading.
The following analysis tools are available from the
Analyze menu.
Tangent—The Tangent mode enhances the
Examine cursor by adding a tangent line and
numeric display of the slope as you tap different
locations on the graph.
Integral—The Integral tool numerically integrates
graphed data. Select a region, if needed, and choose
Integral from the Analyze menu. Enable the tool by
tapping on the displayed sensor or column name.
The integral is drawn and the numeric result is
displayed in a panel to the right of the graph.
Statistics—The Statistics tool displays statistics for
graphed data. Select a region, if needed, and choose
Statistics from the Analyze menu. Enable the tool
by tapping on the displayed sensor or column
name. Descriptive statistics are displayed in a panel
to the right of the graph. If a region is selected,
brackets are drawn to indicate the region used for
calculations.
24

LabQuest®2 – User Manual
Delta—The Delta tool opens a preview window
where you can examine x- and y-deltas. Choose
Delta from the Analyze menu to open the preview
window. Then, tap-and-drag to create a box
overlaid on the graph. The vertical side of the box
yields y, and the horizontal side of the box yields
x. Tap OK to keep these values and display the
box on the Graph screen. To exit the Delta tool
without displaying the box on the Graph screen, tap
Cancel.
Curve Fit—The Curve Fit tool fits a chosen
function to your data. If a region of the graph is
selected, only that region is used for fitting. If there
is no selection, the entire graph is used.
Choose Curve Fit from the Analyze menu. In the
Choose Fit list, choose the desired equation.
LabQuest displays the fit in the preview graph at
the left. The fit coefficients and Root Mean Square
Error (RMSE) are also displayed.
Tap OK to keep this fit and display the curve on the Graph screen. To exit the Curve Fit tool
without applying the curve, tap Cancel.
TIP! The RMSE (root mean square error) is a measure of how well the fit matches the data.
The smaller the RMSE, the closer the data are to the fitted line. The RMSE has the same
units as the y-axis data.
Interpolate—Once you have performed a curve fit,
you can use the Interpolate tool to read values from
the fitted function. Choose Interpolate from the
Analyze menu, then tap on the graph. The lines
associated with the Examine cursor now locate a
position on the fitted function. Coordinates along
the fitted line are shown in the panel to the right of
the graph. One way to determine that LabQuest is
in the Interpolation mode is by the square Examine
cursor.
Model—The Model tool manually fits a chosen
function to your data. Choose Model from the
Analyze menu, then choose the desired model
equation from the Model Equation list. LabQuest
displays the modeled function in the preview graph
at left.
The model parameters (e.g., A, B, and C) are
adjustable. Change them by direct entry or by using
the arrows.
25

LabQuest® App
Tap OK to keep this function and display the modeled function on the Graph screen. To exit
the Model tool without applying the function, tap Cancel.
TIP! If no function appears when modeling, your parameters are likely defining a curve that
is outside of the plot window.
Advanced—Choose Advanced from the Analyze
menu to access advanced analysis tools including a
Baseline Adjustment, Fast Fourier Transform
(FFT), and Peak Integration.
Baseline Adjustment—This tool applies a factor
o
that raises or lowers the x-axis. Because
LabQuest App uses the x-axis as its baseline
when calculating an integral, adjusting the
baseline may result in a better integral. This
tool is typically used when analyzing
Spirometer data.
o FFT—The FFT tool calculates a Fast Fourier
Transform of the selected data. The FFT is
displayed in a separate graph that can be
analyzed. Tap OK to return to the main graph.
The peak frequency will be displayed on the
graph legend. The FFT tool is typically used
when analyzing Microphone data. For more
information, see www.vernier.com/til/2310
o Peak Integration—This tool calculates the integral for a selected portion of a graph. It is
most commonly used with the Vernier Mini GC, but it can be applied to any data plot.
Peak Integration differs from the Integral tool in that it does not use the x-axis as the
baseline. Instead, the integral for Peak Integration is evaluated from the minimum yvalues to the left and right of a selected peak.
Pivot Data—This tool is only available in Data Matrix mode. It transposes the rows
o
(usually graphed as the x-axis and representing the sampling site) with the runs (usually
selected by tapping on the button to the left of the Filing Cabinet and representing the
sampling day). This field data can be viewed as the location changes, or pivoted and
viewed as the day changes.
26

LabQuest®2 – User Manual
Draw Prediction
—The Draw Prediction tool is a
free-hand sketch tool for drawing on the Graph
screen. This can be used for a variety of purposes,
but is most often used to sketch a prediction of how
a graph will appear once data are subsequently
collected.
Choose Draw Prediction from the Analyze menu.
Then, tap-and-drag across the screen for smooth
curves, or tap the screen to connect subsequent taps
with straight-line segments. The Reset button
removes your sketch if you need to start over. Tap
OK to place your sketch on the main graph. To
remove a prediction, choose Draw Prediction again
from the Analyze menu.
Motion Match
—The Motion Match menu item is
only available if a Motion Detector is connected.
Choose between a new Position or Velocity match.
In each case, LabQuest generates a random target
graph for the matching exercise. Only the selected
graph, Position or Velocity, is shown. You may
collect data over the target graph as many times as
you like using the Collect button. To see a new
target graph, choose New Position Match or New
Velocity Match. Remove Match removes the target
graph.
TIP! For additional information on using Motion Detectors, see www.vernier.com/til/5.
Adjusting the Table Screen
In addition to viewing and manipulating data from the
Graph screen, you can also access data from the Table
screen. There are several shortcuts on this screen.
Alternatively, you can also access the fields by
choosing Data Column Options from the Table menu.
Tap Run 1 in the name field to rename the run.
Tap a column header (Time, Position, etc.) to
change the column name, units, or displayed
precision.
27

LabQuest® App
Manipulating Data from the Table Screen
From the Table menu, you can create, modify, or delete
columns of data. The following tools are available
from the Table menu:
New Manual Column—New Manual Column creates
an empty column where you can enter or generate
values directly. You can add a manual column to a
data set that includes sensor data, or you can create
a new data set consisting entirely of manually
entered data.
New Calculated Column—New Calculated Column
creates a new column with values that are based on
other columns by a mathematical formula. Tap the
Name field to enter a name for the new column, tap
the Units field to enter the units, and then select an
equation from the Equation Type list. For example,
you might define a calculated column as the inverse
square of another column. After creating a
calculated column, you can display the calculated
data on a graph, or manipulate it further with
additional calculated columns.
Data Column Options—Use these options to access the fields for setting the column name,
units, and displayed precision. Alternatively, you can access these fields by tapping on the
column name from the Table screen.
Delete Data Column—Use this to delete a manual or calculated column of data. Note that you
cannot delete data collected from a sensor; however, you can hide data using the Strike
Through Data tool.
Delete Run—If you have stored at least one run using the Store Run tool, this option will be
available in the Table menu. Upon choosing Delete Run, tap the desired run name to delete
the run. You will not be able to delete the last data set created.
Clear All Data—This action will clear all data in the table. Upon choosing this option, you
will be prompted to confirm. This option is used when you wish to clear previously collected
data without changing any of the data-collection parameters or sensor setup information.
Strike Through Data and Restore Data—Use these tools to ignore/restore selected data. Struck
data are ignored for analysis and graphing, and the graph will update accordingly. To restore
all data, choose Restore Data from the Table menu. Note that you can also access these tools
from the Graph menu on the Graph screen.
Tag Data—Use this tool to tag a data point with a comment. After selecting the data point
within the table, choose Tag Data from the Table menu. A circle will be displayed on the
Graph screen to “tag” the data. To add a comment, tap the Graph tab, then tap the info panel
to the right of the graph. A list of Data Tags will be displayed. Tap in the blank field to enter
a comment for the tag.
28

LabQuest®2 – User Manual
Edit
—Use this tool to copy and paste values from one location to another. In particular, you
might copy a range of values from the table and paste them into notes on the Notes screen.
Advanced Table Option
When LabQuest is in the Data Matrix mode, an
Advanced Menu option is displayed adjacent to the
Table menu. Choose
Pivot Data
from the Advanced
menu to transpose the rows (usually graphed as the
x-axis and representing the sampling site) with the runs
(usually selected by tapping on the button to the left of
the Filing Cabinet and representing the sampling day).
You can view field data as the location changes or as it
is pivoted to be viewed as the day changes.
Viewing Vernier Lab Instructions
From the Lab Instructions screen, selectable by tapping the Lab Instructions tab , students can
view select experiment instructions from Vernier lab books. LabQuest comes preloaded with
over 100 experiments.
Opening Vernier Lab Instructions
From the Lab Instructions screen, choose View Lab
Instructions from the View menu. This displays a list
of the lab books with select experiments preloaded on
LabQuest. Select the desired book and experiment, and
then tap OK.
In addition to scrolling through the instructions using
the scrollbar at right, you can also zoom in on a
particular portion of the instructions by choosing Zoom
In from the View menu. Choose Zoom Out from the
View menu to restore the previous view. Choose Reset
from the View menu to restore the original view.
To stop viewing a particular experiment instruction,
choose View Lab Instructions from the View menu,
select the file named default.html, and then tap OK.
29

LabQuest® App
Adding Notes to Your Experiment
From the Notes screen, selectable by tapping the Notes
tab , students can enter notes as they perform an
experiment. The menu provides access to standard edit
commands of Cut, Copy, Paste, and Clear All.
Storing LabQuest App Files
LabQuest files have a .qmbl extension
and can be saved to the internal storage
space on LabQuest, or to an external
storage device such as a USB flash drive
or microSD card. LabQuest App files
can also be opened and manipulated on a
computer with Vernier Logger Lite or
Logger Pro® 3 software.
LabQuest can recognize additional
storage space in a connected microSD
card or a USB flash drive. The drive or
card may be formatted in FAT16 or
FAT32 (the most common Windows®
and macOS® formats) for reading and
writing. LabQuest cannot read NTFS or
HFS+ formatted drives.
To save a LabQuest App file, follow these instructions:
1. If saving to an SD card or USB flash drive, make sure the drive is inserted in the appropriate
port on LabQuest. It can take several seconds for LabQuest to recognize the drive.
2. Choose Save from the File menu. This opens a Save As dialog box.
3. Tap on the appropriate icon to select your storage destination.
—LabQuest internal hard drive
—microSD card
—USB flash drive
4. After selecting your destination, tap on the name field and enter the file name. Tap OK.
5. Tap Save to save the file.
TIP! You cannot create directories within LabQuest App, but you can use directories that
already exist on the microSD card or USB drive. We recommend creating any needed folders on
a flash drive or SD card using a computer before you use the drive or card with LabQuest.
30

LabQuest®2 – User Manual
Exporting LabQuest App files
In some cases, you may wish to export the LabQuest App file in a text format (.txt) for further
analysis within a program other than Logger Lite or Logger Pro® 3.
To do this, choose Export from the File menu. Follow steps similar to those described in Storing
LabQuest App Files, but choose Export from the File menu instead of Save As. You must
connect a microSD card or USB flash drive to export a file.
To open the exported .txt file in a spreadsheet program, confirm the program’s file browser is set
to look for all file types. Select your text file.
If you have access to a wireless network with Internet, you can email the data file, graph, text
file, or screenshot. For detailed instructions, see Emailing from LabQuest
31

IV. DATA SHARING: USING LABQUEST® 2
As part of the Connected Science System®, LabQuest 2 serves as a Data Sharing source that can
wirelessly stream sensor data to Vernier Graphical Analysis™ or Graphical Analysis™ Pro
running on computers, Chromebook™ notebooks, or mobile devices such as iOS, iPadOS®, and
Android™ tablets and phones.
How Data Sharing Works
Students in a lab group set up an experiment with Vernier sensors and LabQuest 2.
Students use Vernier Graphical Analysis or Graphical Analysis Pro app to wirelessly connect
to the LabQuest 2 using Wi-Fi.
Experiment data are streamed from LabQuest 2 to each student’s device.
Each lab group member performs an individual analysis of the shared data on their device.
Students can take their data and analysis home for further analysis and lab reports.
Set Up Data Sharing on LabQuest
To set up LabQuest as a Data Sharing source, you will need to connect LabQuest to a Wi-Fi
Network and enable Data Sharing.
Connect LabQuest to a Wi-Fi Network
1. Launch the Connections app from the Home screen.
2. Verify Wi-Fi is enabled (On).
32

LabQuest®2 – User Manual
3. Tap the Network Settings gear on the Connections app to open the Network Configuration
dialog box. The Network Configuration dialog box lists any networks that LabQuest
identifies, as well as an option to join networks manually or create your own network.
4. Select a network.
Existing Network (Infrastructure Network)
To connect to an existing Wi-Fi network, follow these instructions.
a. Locate the network within the list and tap on the
network name to select it.
If prompted, enter your network’s passphrase
and tap Connect.
TIP! If your network requires additional
network authentication information or if you
have an enterprise network that requires a
network certificate, see our website for more
instructions: www.vernier.com/til/2836
33

Data Sharing: Using LabQuest® 2
b
b
. Verify LabQuest is attempting to connect to the
network. The network status should indicate
“Connecting.”
c. Verify LabQuest has successfully connected to
the network. The network status should change
to a numeric IP address.
When LabQuest has successfully connected to
the network, tap OK to return to the Connections
app.
Create a new LabQuest Network (Ad-Hoc Network)
If you do not have access to an existing Wi-Fi network, or are not permitted to access your
school's network, you can quickly and easily set up a network with LabQuest 2.
TIP! Students can connect to a LabQuest Network with their mobile devices. This network will
not support access to the Internet. The email function of LabQuest will not work with a LabQuest
ad-hoc network.
a. Select Create Network.
TIP! If you are in an area with several Wi-Fi
networks, you may need to scroll to the bottom of
the network list to locate “Create Network.”
. Tap the Network Name field and assign a name
to this new network (e.g., Ms. Johnsons
classroom). Then, tap Create.
c. Verify LabQuest is attempting to create a network. The network status should indicate
“Connecting.”
34

LabQuest®2 – User Manual
d. Verify LabQuest has successfully created a
network. The network status should change to a
numeric IP address.
When LabQuest has successfully created a
network, tap OK to return to the Connections
app.
TIP! Some Android implementations have trouble viewing and connecting to ad-hoc networks.
These devices require the use of an existing (infrastructure) network.
Enable Data Sharing on LabQuest
In addition to connecting to a Wi-Fi network, you will need to set up LabQuest as a Data Sharing
Source using the following instructions.
1. Launch the Connections app from the Home screen.
2. To easily identify this LabQuest unit, you can give
the unit a unique name. To do this, tap the Name
field gear.
Tap the Name field to edit the LabQuest name (e.g.,
LabQuest1). Tap Done to save the name.
35

Data Sharing: Using LabQuest® 2
3. From the Connections app, tap the Data Sharing gear
to open the Data Sharing Settings dialog box.
4. Verify Data Sharing is enabled (On).
TIP! If you want to allow students to start and stop
data collection from their computing device, select
the check box to enable this feature.
Tap OK to save the setup.
Restricting Access to the Connections Setup
Once your LabQuest is configured as desired, you can set the preferences to restrict access to the
Connections setup information. This prevents students from inadvertently changing your
network and Data Sharing settings.
1. Tap Preferences from the home screen, then tap Advanced Preferences.
2. Within the Advanced Preferences dialog box, tap the
Network tab.
36

3. Select Connections app lockdown and then tap Edit
Preference.
4. Select the desired setting.
TIP! Changes to the Connections main screen will
not show if the lockdown mode is changed while the
Connections app is running. Tap to close the
application, then launch the Connections app again.
Connect to LabQuest 2 from Your Device
LabQuest®2 – User Manual
After setting up LabQuest as a Data Sharing source, you can then connect to this LabQuest from
your computer, Chromebook™, or mobile device.
Access LabQuest 2 Data Using Graphical Analysis or Graphical Analysis Pro
1. Connect your Chromebook or mobile device to the same Wi-Fi network to which you
connected LabQuest 2.
2. Launch Graphical Analysis on your computer, Chromebook, or mobile device.
3. From the New Experiment dialog, select Data Sharing. If you are using Graphical Analysis
Pro, click or tap the Local tab. Discovered Data Sharing Sources will be listed automatically.
4. Tap the name of the LabQuest 2 source to connect. If your LabQuest 2 source is not listed in
Data Sharing sources, you can connect by choosing Specify Source and manually entering
the LabQuest Data Sharing source address, or by scanning the QR Code.
37

Data Sharing: Using LabQuest® 2
Access LabQuest 2 Data Using the Data Share Web App
1. Launch the Connections app from the Home screen.
2. Connect your mobile device to the same Wi-Fi network to which you connected LabQuest 2.
3. On your computer, Chromebook™, or mobile device, open a supported browser and enter the
Data Sharing Source Address. Alternatively, if you have a QR code reader on your device,
you can access this via the provided QR code.
38

V. USING LABQUEST® 2 WITH A COMPUTER OR CHROMEBOOK™
VIA USB
LabQuest 2 can be used via USB connection with the following software:
Logger Lite—www.vernier.com/logger-lite
Logger Pro® 3—www.vernier.com/lp
Vernier Graphical Analysis—www.vernier.com/ga
Graphical Analysis Pro—https://www.vernier.com/gapro
Collecting Data with Logger Lite, Logger Pro 3, Graphical Analysis, or
Graphical Analysis Pro
LabQuest 2 can be used as a USB sensor interface with a computer or Chromebook. To collect
data, follow these steps:
1. Connect a wired (BTA or BTD) sensor to LabQuest. Note: USB and Wireless sensors cannot
be used when LabQuest is being used as a sensor interface.
2. Connect LabQuest to your computer or Chromebook using the included USB cable. The mini
end of the cable connects to LabQuest and the full-sized end connects to an available USB
port on your computer or Chromebook.
3. Open the data-collection software on your
computer or Chromebook. The software will detect
LabQuest and the attached sensor and display a
graph ready for data collection. LabQuest will
display a screen with two arrows indicating it is
connected to the computer or Chromebook.
4. Click the Collect button in the computer or
Chromebook to start data collection.
Transferring Data from LabQuest to Logger Pro 3 or Logger Lite
Automatically Transferring Data
If you collect data in LabQuest App and subsequently connect LabQuest to a computer, then
Logger Lite or Logger Pro 3 will automatically detect the presence of the remote data and
display a message indicating the data can be retrieved from LabQuest. Follow the onscreen
instructions to download data to the computer.
Manually Transferring Data
To manually transfer saved data from LabQuest (see Storing LabQuest App Files), open Logger
Lite or Logger Pro 3 on your computer, choose LabQuest Browser from the File menu, and then
choose Open. Choose the desired LabQuest file from the displayed list and click Open. Note that
only one LabQuest file can be opened at a time. Once opened on the computer, you may then
choose to save the file as a Logger Lite (.gmbl) or Logger Pro 3 (.cmbl) file by choosing Save As
from the computer software File menu.
39

Data Sharing: Using LabQuest® 2
TIP! If sensors are still connected when a LabQuest file is opened using Logger Pro 3 or
Logger Lite, the sensors will be ignored. To enable the sensors, choose New from the File menu
in Logger Lite or Logger Pro 3.
Another method for manually transferring data from LabQuest to Logger Lite or Logger Pro 3 is
to choose LabQuest Browser from the File menu in the computer software, then choose Import.
Import differs from Open in that only the data in the LabQuest file are added to the current
computer session. You can compile data from multiple LabQuest sessions into a single computer
session for graphing and comparison.
TIP! Compile class results from multiple LabQuest files (or multiple LabQuest units) by
repeatedly importing data into a single Logger Pro 3 or Logger Lite file.
Manually Moving Data from Logger Pro 3 or Logger Lite to LabQuest
Data and/or sensor configurations can be saved to LabQuest from your computer. To do this,
open an existing Logger Lite or Logger Pro 3 file or set up a new file with the desired datacollection settings. Choose LabQuest Browser from the File menu, then choose Save As. Enter a
descriptive filename. Any data, as well as the sensor configuration, will be stored on LabQuest as
a LabQuest file. Any features in the computer file not existing on LabQuest (such as embedded
images, video analysis, graph annotations, or most calculated columns) will be ignored on
LabQuest.
Deleting Data on LabQuest from Logger Pro 3 or Logger Lite
To delete data on LabQuest from Logger Lite or Logger Pro 3, choose LabQuest Browser from
the file menu, then choose Delete. Choose the desired file for deletion from the displayed list and
click Delete.
TIP! Use this feature to mass delete files from LabQuest by selecting multiple files from the
displayed list.
Transferring Data from LabQuest to Graphical Analysis or
Graphical Analysis Pro
Collected data can only be transferred from LabQuest to Graphical Analysis and Graphical
Analysis Pro through wireless Data Sharing via Wi-Fi. You cannot access data saved on
LabQuest 2 through a USB connection.
For more information on Data Sharing, see Data Sharing: Using LabQuest® 2
.
40

VI. EMAILING FROM LABQUEST® 2
If LabQuest is connected to a network with Internet access, you can email your data file, graph,
text file, or screenshot.
To set this up, follow these instructions:
1. Connect LabQuest to a network with Internet access. For detailed instructions, see Connect
LabQuest to a Wi-Fi Network
TIP! A LabQuest Network (Ad-Hoc Network) does not have Internet access. You will need to
join an existing network with Internet.
2. Launch the Connections app from the Home screen.
3. Tap the Email settings gear to open the Email Configuration dialog box.
TIP! If you are not able to access the Email Configuration dialog box, you may need to
update the Connections app lockdown settings. See Restricting Access to the Connections
Setup for more information.
4. Verify email is enabled (On).
5. Enter the email address you want to use with LabQuest.
TIP! This is used to access the outbound email server associated with this email account
required for sending emails. You cannot receive incoming emails on LabQuest 2.
6. Follow the on-screen prompts to register LabQuest with your email provider (e.g., Gmail).
For more information, see www.vernier.com/til/2643
.
41

VII. PRINTING FROM LABQUEST® 2
You can print a graph, data table, lab instructions, your own notes, or the screen as it is currently
displayed in LabQuest App. LabQuest can print to a compatible printer via a USB cable or via a
Wi-Fi network. In addition, if a printer is not available, you can use the Print to File option to
save a PDF file on a USB drive or microSD card to print at a later time. For a list of compatible
printers, see www.vernier.com/til/1659
To print to a compatible printer for the first time, follow the Printer Setup instructions below.
This setup is only required for the first time you use a particular printer. Once a printer has been
installed, LabQuest will store the drivers.
To print from LabQuest App to an installed printer,
choose Print from the File menu then choose the item
that you want to print (Graph, Table, Lab Instructions,
My Notes, or Screen).
TIP! Options for printing Table, Lab Instructions, and
My Notes are not available when those items have no
data to print.
The Print Options dialog box appears where you can
choose the installed printer or Print to File option from
the dropdown list and set additional print settings (add
a title, footer, or print in grayscale).
Printer Setup
1. If printing to a USB printer, connect the printer to the full-size USB port on LabQuest and
turn on the printer.
If printing to a Wi-Fi-enabled printer, verify that LabQuest is connected to the same Wi-Fi
network as the printer. See Connect LabQuest to a Wi-Fi Network
needed.
2. Tap Preferences from the Home screen, and then tap Printers to open the Printer
Configuration dialog box.
42
for more information, if

LabQuest®2 – User Manual
3. Tap Scan for Printers. In response, LabQuest will
search for available printers.
TIP! If LabQuest is unable to locate a desired
network printer, try accessing it directly by tapping
Enter IP Address or Name.
4. Select the desired printer and tap Install.
5. Select a driver for your printer. For more
information on determining which driver you
should select, see www.vernier.com/til/3657
Troubleshooting
Even if a driver is found, printing may still fail due to an incompatible printer. If you are sure
that the printer is compatible and you are still getting an error, it may be caused by one of the
following conditions: out of paper, out of ink/toner, a door on the printer is ajar, a paper jam, or
you may have selected the wrong printer on the Print Options screen.
43

VIII. PROJECTING AND MONITORING STUDENTS’ LABQUEST® 2
DEVICES
Use our LabQuest Viewer software (order code, LQ-VIEW) for Windows® and macOS®
computers or LabQuest Viewer® for iPad® to view and control LabQuest wirelessly from your
computer or iPad. LabQuest Viewer can be used in conjunction with a projector to share the
LabQuest 2 screen with the entire class.
Instructors can demonstrate LabQuest 2 for a class, and students can share or present their work
to fellow classmates.
With LabQuest Viewer, you can:
View and control one or more LabQuest units from a computer or iPad.
Connect to a projector or interactive white board for class demos or sharing.
Monitor student progress on any LabQuest connected to your network.
Create screenshots of the LabQuest screen to copy and paste into lab instructions.
Set customizable permissions that permit viewing without control, or password-protect a
connection.
System Requirements
Windows—Windows 7 (SP1), Windows 8, Windows 8.1, and Windows 10
macOS—macOS X 10.8 or newer
iPad—iOS 8 or newer or iPadOS (any version)
LabQuest Setup
To set up your LabQuest to communicate with LabQuest Viewer App for iPad, or LabQuest
Viewer software on your macOS or Windows computer, follow these instructions.
1. Connect LabQuest to a network. For detailed instructions, see Connect LabQuest to a Wi-Fi
Network
TIP! The Network used for the LabQuest Viewer does not require Internet connectivity.
2. Launch the Connections app from the Home screen.
44

LabQuest®2 – User Manual
3. Tap the Viewer settings gear to open the Viewer Settings dialog box.
4. Enable LabQuest Viewer (On).
5. Select the check box to Allow screen control.
6. Tap OK to exit the LabQuest Viewer settings.
45

IX. ADDITIONAL APPS ON LABQUEST® 2
Several accessory applications can be launched from the Home menu. It is not necessary to quit
LabQuest App to use these accessories; to return to LabQuest App, either close the accessory
using the close button, , in the upper right corner of the screen, or switch to the
LabQuest App by tapping LabQuest App on the Home screen.
Access additional apps and accessories from the Home screen.
Audio Function Generator
From the Home screen, tap Audio Function Generator
to launch this app. The function generator is used to
create waveforms in the audio frequency range. Select
a waveform, frequency, and volume for each channel.
Start and stop using the buttons at the left. The link
between left and right channels is on by default so that
both channels start and stop together. Tap the link icon
to control the channels independently.
Use the sliders to also control frequency. Tapping left
or right of the slider will halve or double the frequency.
A common use of the Audio Function Generator is to create tones and beats for waveform study
using a microphone. For the best waveform quality, connect a powered computer speaker to the
LabQuest audio output jack.
46

Periodic Table
From the Home screen, tap Periodic Table to launch
this app. The Periodic Table contains standard
reference information on the elements. Tap an element
to see details.
Power Amplifier
From the Home screen, tap Power Amplifier to launch
this app. The Power Amplifier app controls the Vernier
Power Amplifier (order code PAMP) used to create
waveforms with up to 10 V amplitude and currents of
1 A. Connect the Power Amplifier to the LabQuest
audio output.
Select the desired output, AC or DC. DC output levels
are limited to 0.2 V steps. AC waveforms include sine,
square, sawtooth, and ramps. Select an amplitude and
frequency using the controls. The frequency can be
changed by factors of two using either the buttons, or
in small steps using the slider. Start and stop the output
using the control on the left.
LabQuest®2 – User Manual
Calculator
From the Home screen, tap Accessories, and then tap
Calculator to launch this app. The calculator is a
standard scientific calculator that uses algebraic
notation. You can copy a calculator result and paste it
into the Notes tab or into a manual column cell.
47

Additional Apps on LabQuest® 2
Camera App
From the Home screen, tap Accessories, and then tap
Camera App to launch this app. The Camera App
works with digital (USB) cameras. See
www.vernier.com/til/3659 for more information
regarding supported digital cameras. Use the Camera
App to view a live image feed from the camera as well
as capture images for later viewing.
Sound Recorder
From the Home screen, tap Accessories, and then tap
Sound Recorder to launch this app. The sound recorder
captures short audio clips, typically for voice notes. To
record a clip, tap the record button . To stop, tap the
square red stop button. Play the clip back using the
green play button. Tap the disk button to save the clip,
which can later be opened using the open file folder
icon. The blank page icon clears out any current audio
clip.
TIP! Use Sound Recorder to quickly make audio notes
on experiments.
Stopwatch
From the Home screen, tap Accessories, and then tap
Stopwatch to launch this app. The Stopwatch is a
simple timer. Tap the start button to begin timing; tap it
again to stop. Subsequent taps will continue to start and
stop the timer. Tap the reset button to return the timer
to zero. The copy button will place the current time on
the clipboard for pasting into the Notes screen, the
calculator, or a manual column cell.
48

X. APPENDICES
Appendix A—LabQuest 2 Technical Specifications
Display
11.2 cm × 6.7 cm (13.1 cm diagonal)
screen
800 × 480 pixel color display at 188 dpi
LED backlight
Portrait or landscape screen orientation
High-contrast mode for outdoor visibility
Processor
800 MHz Application Processor
Connectivity
Wi-Fi 802.11 b/g/n
Bluetooth for WDSS
User Interface
Resistive touch screen
Touch and stylus navigation for efficiency
and precision
Data Acquisition
Minimum Sampling Rate
0.00125 samples/s (800 s/sample)
Environmental Durability
Operating Temperature: 0 – 45°C
Storage Temperature: –30 – 60°C
Splash resistant
Rugged enclosure designed to withstand a
fall from lab bench
Size and Weight
Size: 8.8 cm × 15.4 cm × 2.5 cm
Weight: 350 g
Ports
5 sensor channels
USB port for sensors, flash drives, and
peripherals
USB mini port
DC power jack
microSD/MMC slot
12-bit resolution
Built-in GPS, 3-axis accelerometer ( 2 g),
ambient temperature sensor, light sensor
Audio in and out
Storage
(uncalibrated intensity), and microphone
Maximum Sampling Rate
1 sensor: 100,000 samples/s (0.02 seconds
max)
2 or more sensors: 10,000 samples/s
(0.21 seconds max)
Maximum Samples (standalone)
1 sensor: 2000 samples 20K–100K
samples/s
1 sensor: 14,000–21,000 samples* ≤ 10K
samples/s
2 or more sensors: 12,000–14,000
samples* @ ≤ 10K samples/s
200 MB
Expandable with microSD and USB flash
drive
Power
Rechargeable, high-capacity battery
DC charging/powering through external
adapter (included)
Non-compatible Sensors
LabQuest 2 does not support the following:
Heat Pulser
Vernier Flash Photolysis Spectrometer
*Highest number of samples is for the very first collection after starting LabQuest. The smaller number of samples depends on
the number of previous collections and stored runs during this LabQuest session.
49

Appendices
Appendix B—LabQuest Maintenance
LabQuest Battery
LabQuest uses a high-quality lithium-ion battery. This is the same chemistry used in premium
laptop and cell phone batteries, and you can expect similar performance. There is never a need to
condition the battery by regular full discharge/charge cycles.
Use only the supplied AC adapter or optional Charging Station (order code
LQ3-CRG, sold separately) to charge the LabQuest battery. A replacement adapter can be
purchased from our website (order code LQ3-PS).
The battery takes about 12 hours to completely charge. It is safe to leave the battery charging
indefinitely, and there is no need to fully discharge the battery before charging. Battery life will
depend on the sensors used, but in most cases, you can obtain six or more hours of use before
recharging. We recommend charging LabQuest overnight to start the next day with a full charge.
For use with a computer, either the battery must be charged or LabQuest must be connected to
AC power. LabQuest cannot operate on USB power alone.
When using LabQuest as a standalone device, the screen will dim after a few minutes of no use,
even during data collection. However, LabQuest will not turn itself off until the battery is almost
discharged. Data loss due to a loss of power is minimized through periodic saving of a backup
file.
Battery life depends on the sensors and features used. To optimize day-to-day battery life, set the
screen brightness to the minimum acceptable level, and turn off LabQuest when it is not in use.
Also disconnect any sensors you are not actively using. To access power-saving options, tap
Preferences on the Home Screen, then tap Light & Power.
The long-term life of the battery will vary, but you can expect about three hundred to four
hundred full charge/discharge cycles before the battery will need to be replaced. In this count, a
charge from half-way to a full charge would count as half of a charge cycle. In typical school
use, the battery can last three years or more. Exposure to temperatures over 35°C will
significantly reduce battery life.
As a battery reaches the end of its useful life, the run time will become shorter and shorter and
the battery will begin to swell. Eventually the run time will be too short for your application, and
you will want to replace the battery. Rechargeable batteries are considered a consumable, and as
such, are warranted for one year. A replacement battery
(order code LQ2-BAT). Recycling information is available at www.call2recycle.org.
can be ordered from our website
LabQuest Case and Screen
LabQuest is water and shock resistant. Do not submerge LabQuest in liquids or allow liquids to
sit on the screen for any extended time. Wipe it clean with a damp cloth only; do not use any
solvents including ammonia or glass cleaners.
50

LabQuest®2 – User Manual
Stylus Tether
LabQuest includes a stylus and a tether. If desired, you can attach the tether to the stylus and
LabQuest. Additional styluses are available from Vernier.
LabQuest Software
LabQuest arrives with its own software, LabQuest App, preloaded. The LabQuest App will be
updated from time to time to introduce new features and to improve performance. Most users
will want to run the latest version available.
Free updates with step-by-step instructions are available on our website:
www.vernier.com/downloads/
Screen Calibration
To calibrate the screen, tap System on the Home
screen. Then choose Calibrate Screen.
Follow the on-screen instructions for tapping the plus
sign with the stylus.
If you are unable to access the Calibration tool, press
and hold the Home hard-key, the center of the three
hard-keys located to the right of the screen, until the
Calibration tool is displayed.
Getting Additional Help
For access to user manuals, forums, and our Technology Information Library, please visit our
website at
www.vernier.com/labq2
You may also contact Vernier directly:
888.837.6437
support@vernier.com
51

Appendices
Appendix C—LabQuest Keyboard
LabQuest App automatically displays the keyboard when text can be entered.
Standard
The standard keyboard displays lowercase letters. To
capitalize letters, use the Shift key . To delete the
previous entry, use the Backspace key . To start a
new line, use the Carriage Return . Note that the
spacebar is located to the right of the letter m.
Numeric and special characters
To access the numeric keyboard from the standard
keyboard, tap .
Symbols
To access symbols from the numeric keyboard, tap
.
Special characters
To access Greek characters, superscripts, subscripts, and
additional operators from the numeric keyboard,
tap .
52

LabQuest®2 – User Manual
Appendix D—License Information
This product contains certain open source software originated by third parties that is subject to
the GNU General Public License as published by the Free Software Foundation, GNU
Library/Lesser General Public License (LGPL) and different and/or additional copyright
licenses, disclaimers or notices. These licenses give you the right to redistribute and/or modify
the software.
The software is distributed in the hope that it will be useful, but WITHOUT ANY
WARRANTY; without even the implied warranty of MERCHANTABILITY or FITNESS FOR
A PARTICULAR PURPOSE. See the GNU General Public License for more details.
Complete source code for the open source software is available on request from Vernier
Software & Technology. Contact us at info@vernier.com, or by writing to
Source Code Request
Vernier Software & Technology
13979 SW Millikan Way
Beaverton, OR 97005
USA
Source code will be made available for download, or you may request a CD-ROM of the code. A
shipping and handling fee will be charged for a CD-ROM.
The exact terms of GPL, LGPL, and some other licenses are provided to you with the source
code distribution. You may also read the license at www.gnu.org/licenses
Appendix E—Warranty
Vernier warrants this product (with the exception of the battery) to be free from defects in
materials and workmanship for a period of five years from the date of shipment to the customer.
This warranty does not cover damage to the product caused by abuse or improper use. This
warranty covers educational institutions only.
The LabQuest battery is a consumable, and as such, Vernier warrants this product to be free from
defects in materials and workmanship for a period of one year from the date of shipment to the
customer. For more information about the LabQuest battery, see LabQuest Battery
Appendix F—Curriculum Resources
Vernier offers a complete set of lab books for elementary through college. For more information,
see www.vernier.com/books
53

Appendices
Appendix G—Accessories, Replacement Parts, and Related Products
LabQuest Viewer
Display and control LabQuest on a computer to teach
students how to use LabQuest, demonstrate experiments, or
share class data.
www.vernier.com/lq-view
Also available, LabQuest Viewer® for iPad®
www.vernier.com/lq-view-ipad
LabQuest Charging Station
Charge and store up to four LabQuest 2 interfaces with this
compact and affordable station.
www.vernier.com/lq3-crg
LabQuest 2 Lab Armor
Add extra protection from spills and falls.
www.vernier.com/lq2-armor
LabQuest Battery Boost 3
With the added power of an external battery, data can be
collected for extended periods in the field where AC power
is not available.
www.vernier.com/lq-boost3
LabQuest 4 GB SD Card
Easily add storage to your LabQuest or move files between
LabQuest units and a computer.
www.vernier.com/lq-sd4
Vernier Lanyard
The LabQuest neck strap helps prevent accidental drops
during field studies.
www.vernier.com/lq-lan
54

LabQuest®2 – User Manual
LabQuest 2 Stylus (Set of 5)
Replacement LabQuest 2 styluses (5 pack)
One is included with each LabQuest 2.
www.vernier.com/lq2-styl-5
LabQuest Stylus Tethers (Set of 5)
Replacement LabQuest tethers (5 pack)
One is included with each LabQuest 2.
www.vernier.com/lq-teth-5
LabQuest USB Computer Cable
Replacement LabQuest-to-computer USB cable
The cable has a USB mini-B plug and USB standard-A plug.
One cable is included with each LabQuest 2.
www.vernier.com/cb-usb-mini
LabQuest USB-C Computer Cable
LabQuest to computer USB C cable
The cable has a USB mini-B plug and USB-C plug. This
cable is recommended for computers and Chromebook™
notebooks that only have USB-C ports.
www.vernier.com/cb-usb-c-mini
Replacement Battery for LabQuest 2
Replacement high-capacity, rechargeable, lithium-ion battery
for the Vernier LabQuest 2.
One battery is included with each LabQuest 2.
www.vernier.com/lq2-bat
LabQuest Power Supply
Replacement power supply for the LabQuest
One power supply is included with each LabQuest 2.
www.vernier.com/lq-ps
55

Appendices
Appendix H—Disposal
When disposing of this electronic product, do not treat it as household waste. Its disposal is
subject to regulations that vary by country and region. This item should be given to an applicable
collection point for the recycling of electrical and electronic equipment. By ensuring that this
product is disposed of correctly, you help prevent potential negative consequences on human
health or on the environment. The recycling of materials will help to conserve natural resources.
For more detailed information about recycling this product, contact your local city office or your
disposal service.
Battery recycling information is available at www.call2recycle.org
Do not puncture or expose the battery to excessive heat or flame.
The symbol, shown here, indicates that this product must not be disposed of in a standard
waste container.
Vernier Software & Technology
13979 S.W. Millikan Way Beaverton, OR 97005-2886
Toll Free (888) 837-6437 (503) 277-2299 FAX (503) 277-2440
support@vernier.com
Version 2.8.6
Revised December 2020
Logger Pro, Logger Lite, LabQuest, Connected Science System, LabQuest Viewer, Go Wireless,
Go Direct, Vernier Graphical Analysis, Vernier Graphical Analysis Pro, and other marks shown
are our trademarks or registered trademarks in the United States.
All other marks not owned by us that appear herein are the property of their respective owners,
who may or may not be affiliated with, connected to, or sponsored by us.
www.vernier.com/
56
 Loading...