

Page 1
Vernier
EasyData App
Getting Started
TM
What is EasyData?
What you Need
Quick Start: Graphing Temperature
Quick Start: Graphing a Ball Bounce
How To....
Start and Quit EasyData
Change Sensor Units
Collect Multiple Data Runs
Collect Data: Time Graph
Collect Data: Events with Entry Manually Set Up a Sensor
Connecting Devices
Navigating Menus
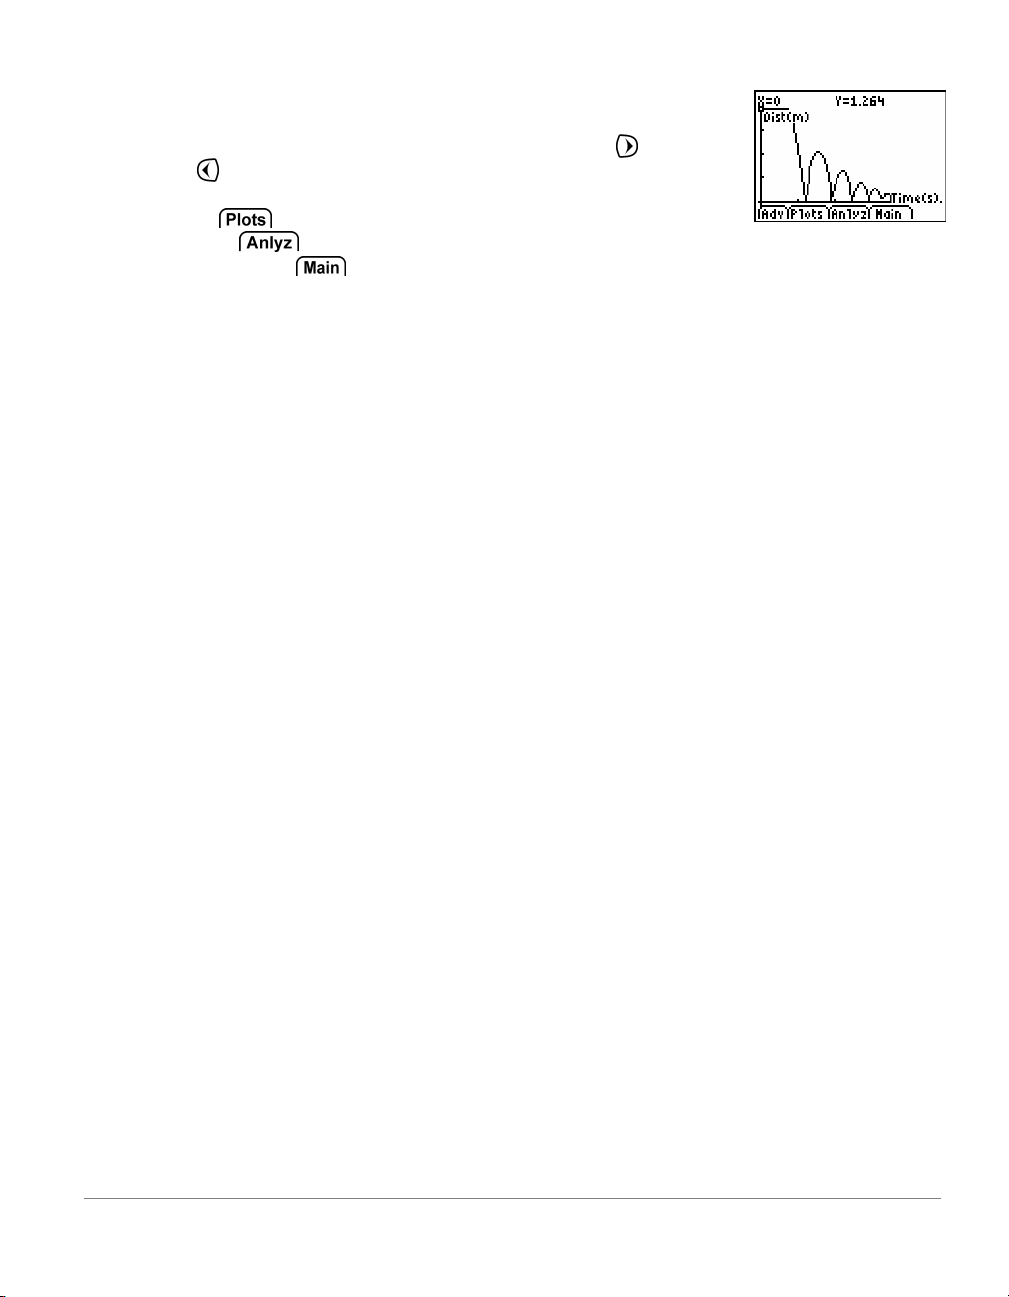
Collect Data: Distance Match
Collect Data: Photogates
Analyze Data
Calibrate a Sensor
More Information
Frequently Asked Questions
Error Messages
Warning Messages
Page 2
What is the EasyD at a Ap p
The EasyData App is a graphing calculator application. It lets you collect, view,
and analyze real-world data on certain TI-graphing calculators using Vernier USB
devices (EasyTemp and EasyLink) and other data collection devices, such as
Texas Instruments CBR 2™ motion detector, CBL 2™ System, or Vernier
Go!Motio n™, and LabPro
®
.
What You Ne ed
Note: In this guidebook, references to TI-83 Plus also apply to the TI-83 Plus
Silver Edition. References to the TI-84 Plus also apply to the TI-84 Plus Silver
Edition.
Hardware and Software Notes
Calculators
TI-84 Plus wit h op erating syst em vers ion 2.3 or
later
-or-
TI-83 Plus wit h op erating syst em vers ion 1.16 or
later
Data Collection Devices:
USB sensors and devices
EasyTemp
EasyLink
Go! Motion (motion detector)
CBR 2 (motion detector)
Standard devices
CBR and CBR 2 (motion detectors)
LabPro
CBL 2
Sensors (from Vernier Software & Technology)
Over 40 sensors available including; Temperature, pH,
Pressure, Motion, Force, Heart Rate, Conductivity,
Dissolved Oxygen and more.
You can download a free copy of the latest operating
system software for your calculator from
education.ti.com/latest.
The TI-83 Plus requires a separate data collection
devic e such as a LabPro or CB L 2.
These devices are designed to connect to the USB
port found on the TI-84 Plus. When using these
sensors , th ere is no need for an y add itional dat acollecti on interfac es.
Using the c alc ulators I/O p or t, these devices can be
used with any of the TI graphing calculators.
For a complete list of sensors, v isit
www.vernier.com/probes/index.html.
EasyData Guidebook 1
Page 3
Connecting devices
There are several data-collection devices that can be used with EasyData.
These devices include the CBL 2, LabPro
®
, CBR™, CBR 2, Go!
™
Motio n, an d
the Vernier EasyTemp and EasyLink. For more information on connecting
data-collection devices, please refer to the device's user guide.
When the calculator detects a data collection device connected to the USB
port, EasyD at a opens automati cal l y an d s tar ts a d efault experim ent
appropri a te for th at dev ice.
Navigating Eas yDa ta m en us
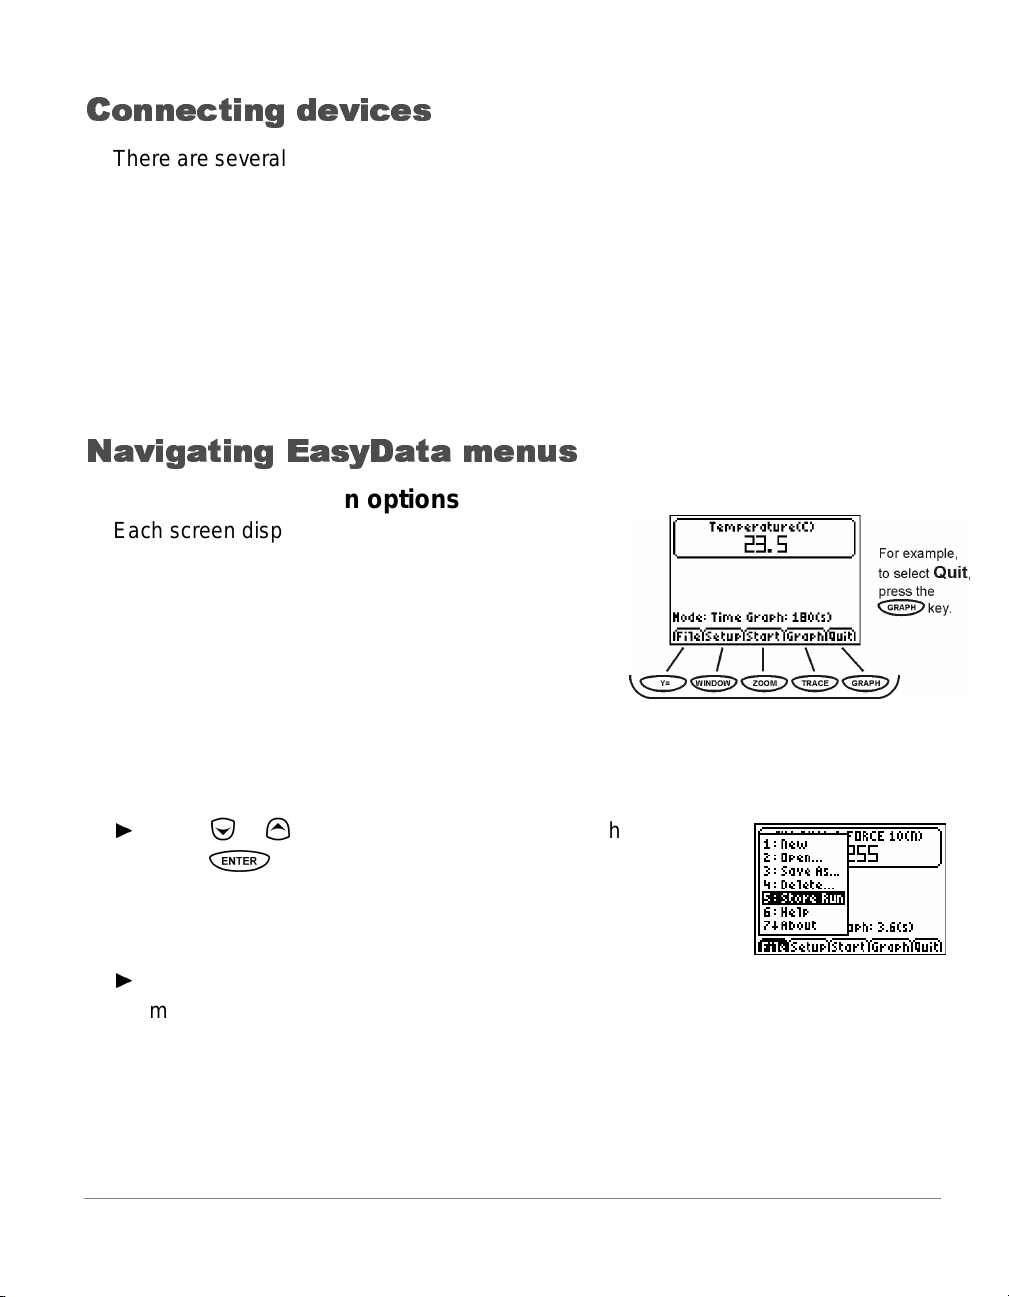
Selecting on-screen options
Each screen displays one or more options along
the bottom of the screen. To select an option,
press the calculator key directly below the option.
Selecting menu items
EasyData menus differ slightly among the types of sensors. You can select menu
items in the following ways:
►
Press or to highlight the menu i tem, and then
press
- or -
►
Press the number key that corresponds to the
menu item.
to select it.
2 EasyData Guidebook
Page 4
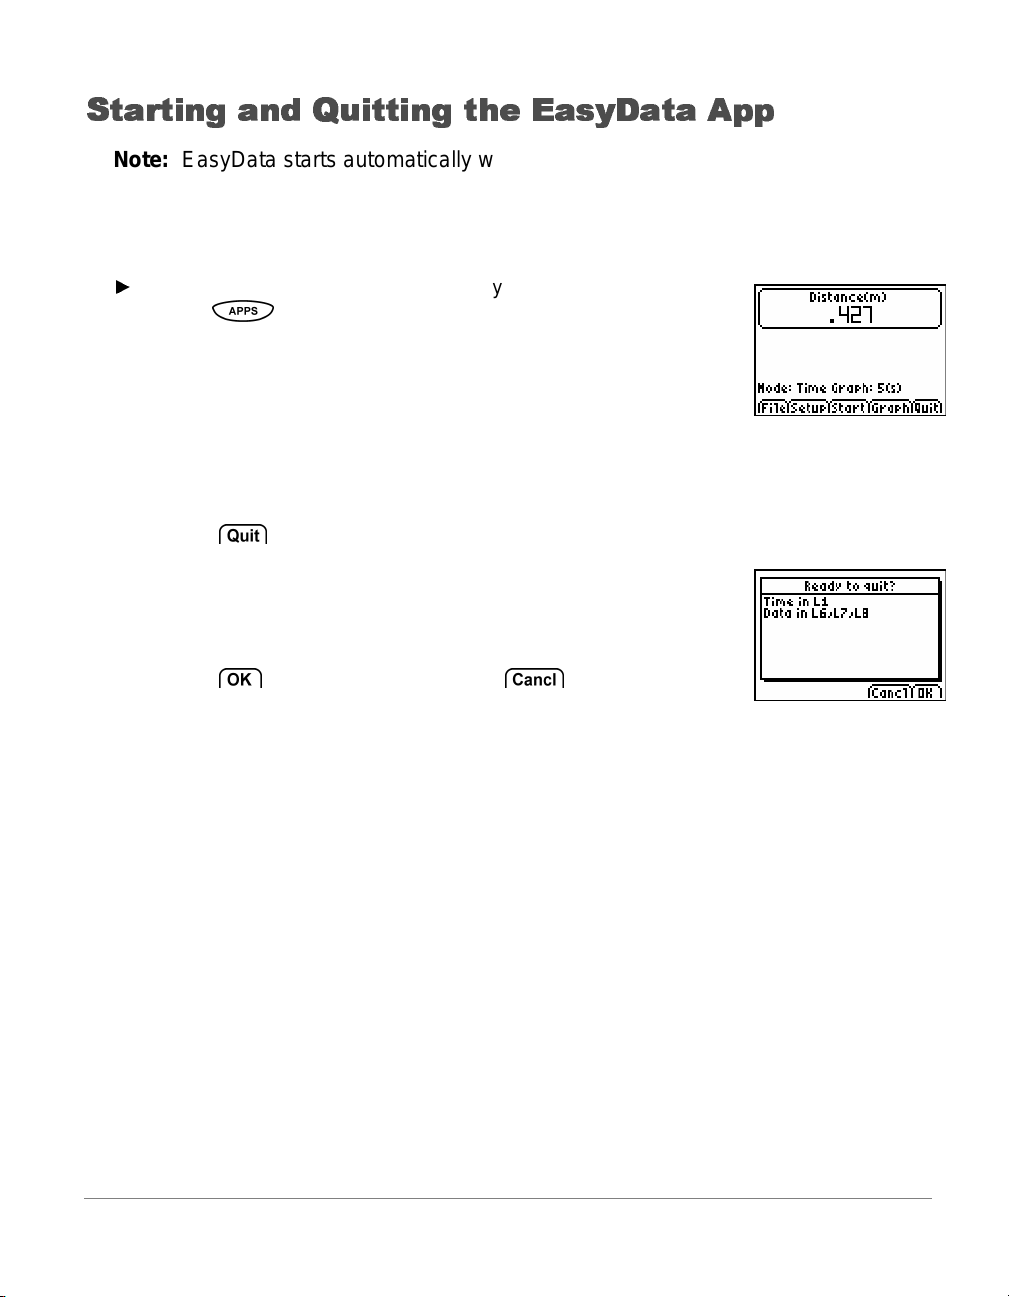
Starting an d Quit tin g th e Ea syDa ta Ap p
Note: EasyData starts automatically when you connect a sensor to the USB port
of a TI-84 Plus calculator that is on the home screen.
Starting EasyData
►
If EasyData is not already running on your calculator,
press
and then select EasyData.
The application’s i nformation screen is displ ay ed for
about three seconds, f ollowed by the main screen.
Quitting EasyData
1. Select from the main screen.
A message notes the lists in whic h the data can be
found.
2. Select
to the EasyData main screen..
to display the li st of available applications,
to quit EasyData, or select to return
EasyData Guidebook 3
Page 5
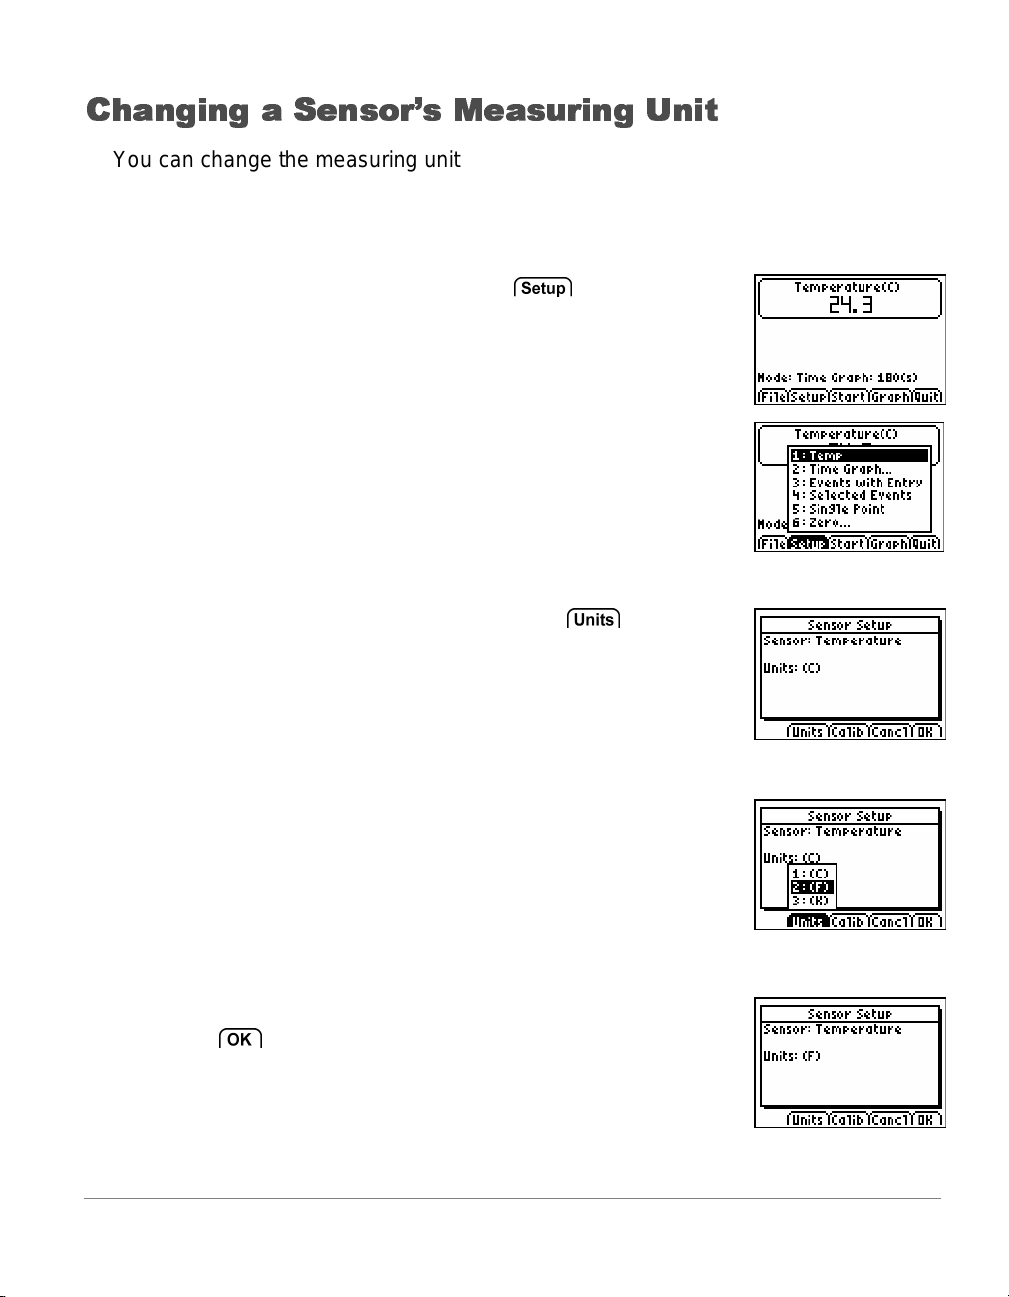
Changing a Se ns or’ s Mea su ring U nit
You can change the measuring unit for a connected sensor. With a temperature
probe, for example, you can change the unit from Celsius (°C) to Fahrenheit (°F).
To change the measuring unit
1. From the EasyDat a m ain screen, select .
Choose the sensor display ed at the top of the menu,
such as Temp for the temperature probe.
.
2. The Sensor Set up scr een is displayed. Select
.
3. A menu is display ed sho wi ng the possible units for the
connected sensor. Select the unit that you want
EasyData to use.
.
4. The Sensor Set up scr een sho ws the sel ec ted unit.
Select
to return to the main screen.
.
4 EasyData Guidebook
Page 6
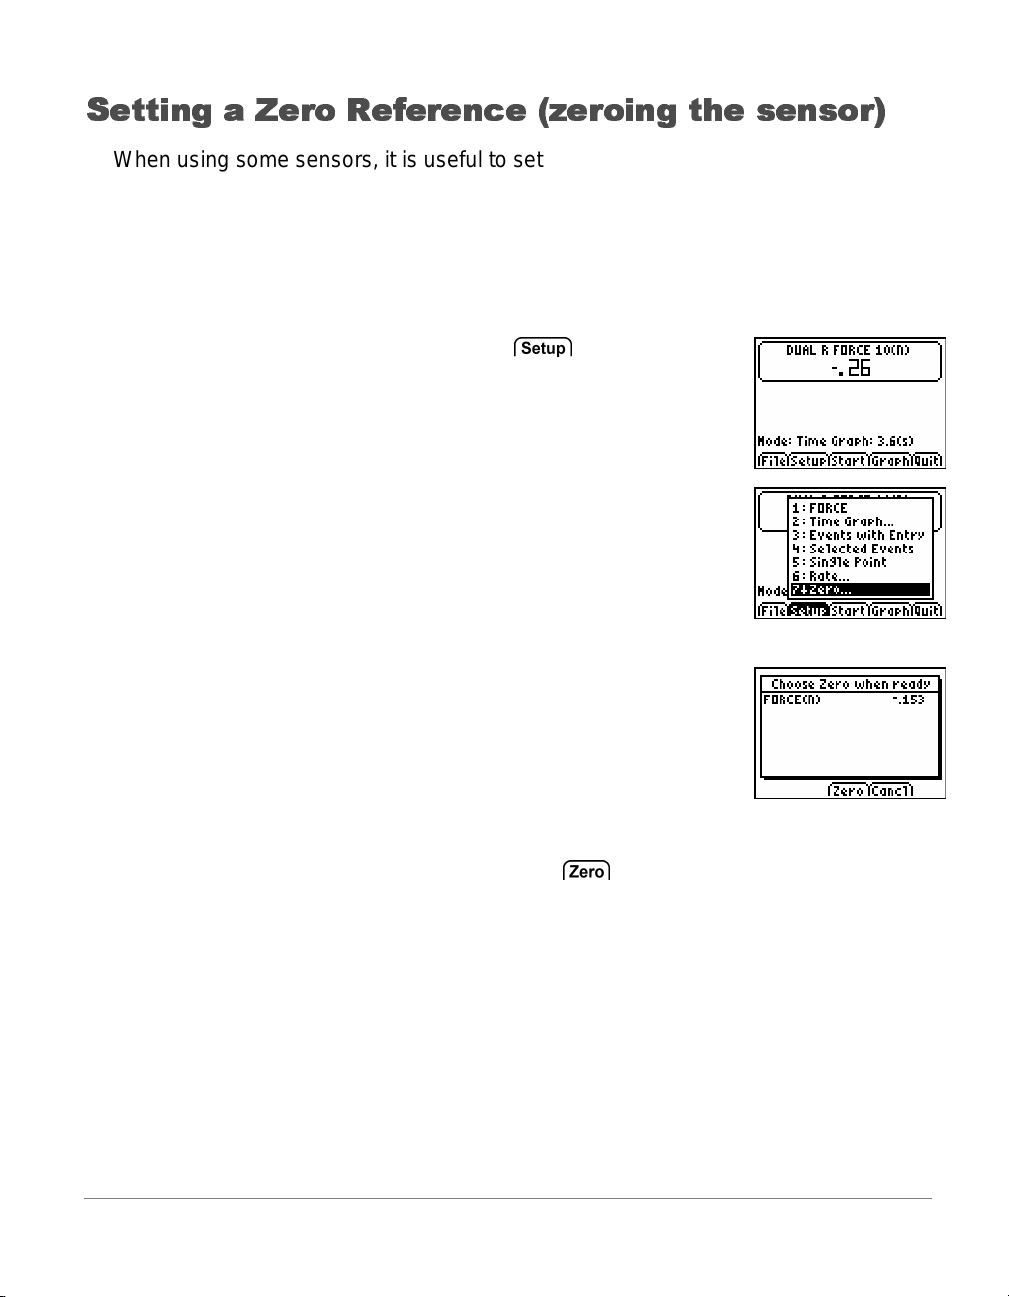
Setting a Zero Ref er en ce (z eroi ng t he s en sor)
When using so me sensors, it is useful to set the sensor to read zero under certain
conditions. With a force sensor, for example, you can set the sensor to read a
value of zero when no force is applied. This is often as helpful, and simpler, than
calibrating the sensor.
To zero sensor readings
1. From the EasyDat a m ain screen, select .
Choose Zero… displayed at the bottom of the menu.
.
2. The Zer o Sensor(s) screen is displayed, with a
continuall y updated sensor reading.
Set up the sensor in the manner t hat you want it to read
zero. For example, remove any mass from a force
sensor.
3. W hen the display ed reading stabilizes, select
You are returned t o the main screen and the sensor’s referenc e is set to z er o.
.
EasyData Guidebook 5
Page 7
Restoring Eas yDa ta Def aul t Settin gs
The default EasyData settings are appropriate for a wide variety of sampling
situations. If you are unsure of the best settings, begin with the default settings,
and then adjust the settings for your specific activity.
1. Make sure an Auto- ID sensor is connected.
2. Select
EasyData restarts in the default data-collection mode, and the default settings are
restored. Note: All unsaved data is also erased.
, from the main screen and choose New.
6 EasyData Guidebook
Page 8
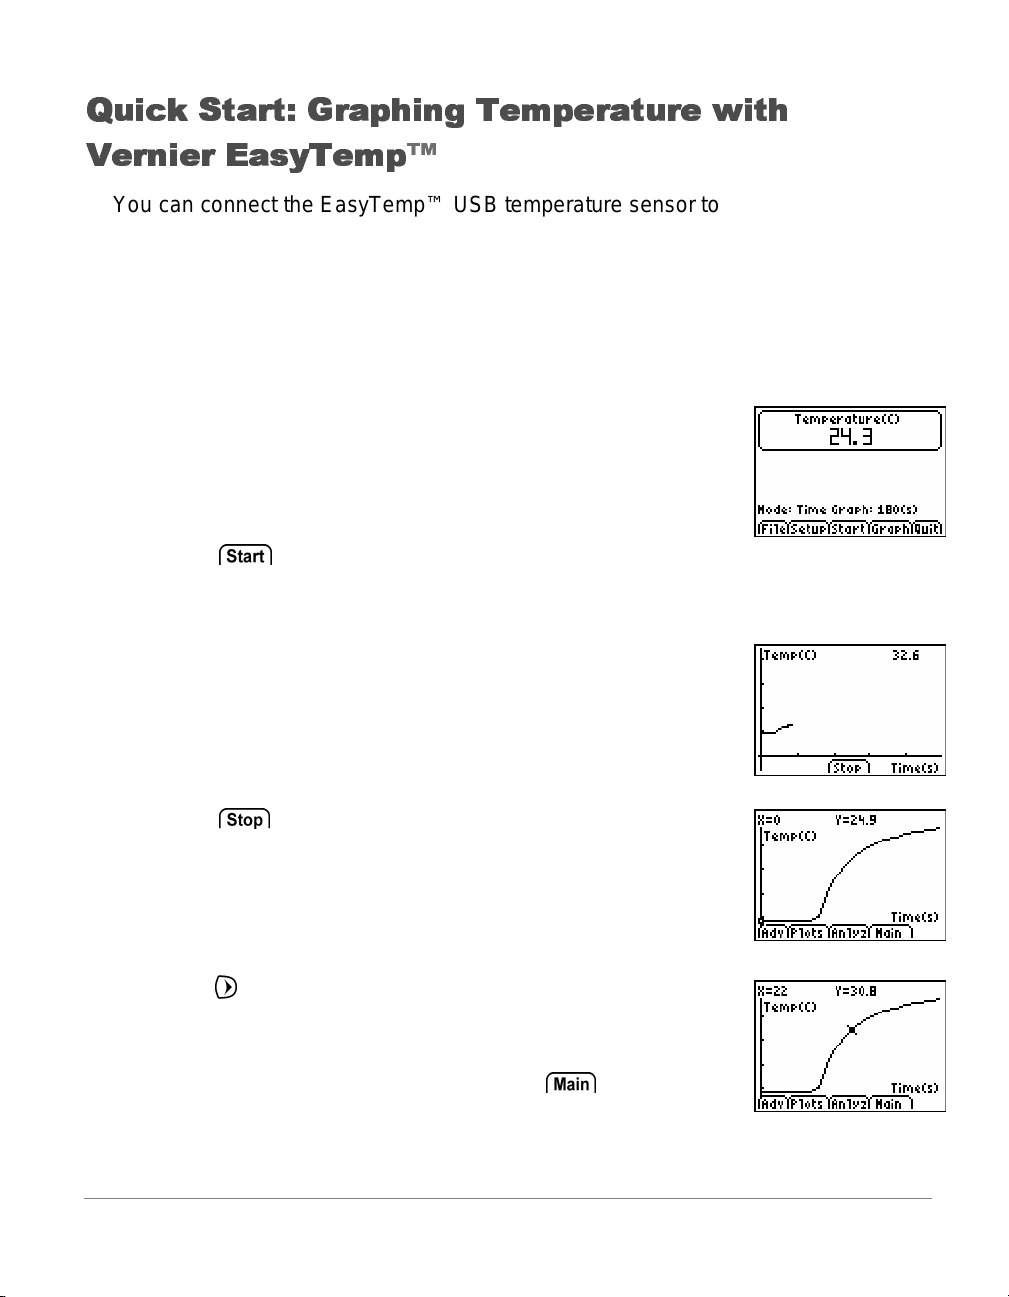
Quick Start: Gr ap hin g Tem p era tu re wit h
Vernier EasyTem p™
You can connect the EasyTemp™ USB temperature sensor to a TI-84 Plus
calculator and use EasyData to watch the effect of holding the sensor in your
hand. This exercise uses the Time Graph mode to collect samples automatically
at regular time intervals.
1. Turn the TI-84 Pl us calculator on, and display the home screen.
2. Connect the EasyTem p sensor to t he c alc ulator.
After a few seconds, the EasyData main screen is
displayed. T he screen shows the cur r ent EasyData
mode and the current sensor reading.
3. Select to start collecti ng data, and then wait five
seconds.
4. Hold the end of the EasyTemp sensor for about 30
seconds.
The graph shows the temper ature as it changes.
5. Select
EasyData displays a scaled graph of the collected
temperatures.
6. Press
note the temperature at each data point.
7. When you finish explor ing the graph, select
return to the EasyData main screen.
EasyData Guidebook 7
to stop collecti ng data
repeatedly to scroll the cursor to the right, and
to
Page 9

8. Select to quit EasyData.
9. Select
A message notes the lists in whic h the data can be
found.
You have completed the Quick Start exercise for collecting t em perature. To learn how to
collect dat a with a m otion sensor, c om plete the Quick Start exercise for collec ting motion
data. The remainder of this guide contains detailed instruc tions and reference information
for using EasyData f eatures.
.
8 EasyData Guidebook
Page 10
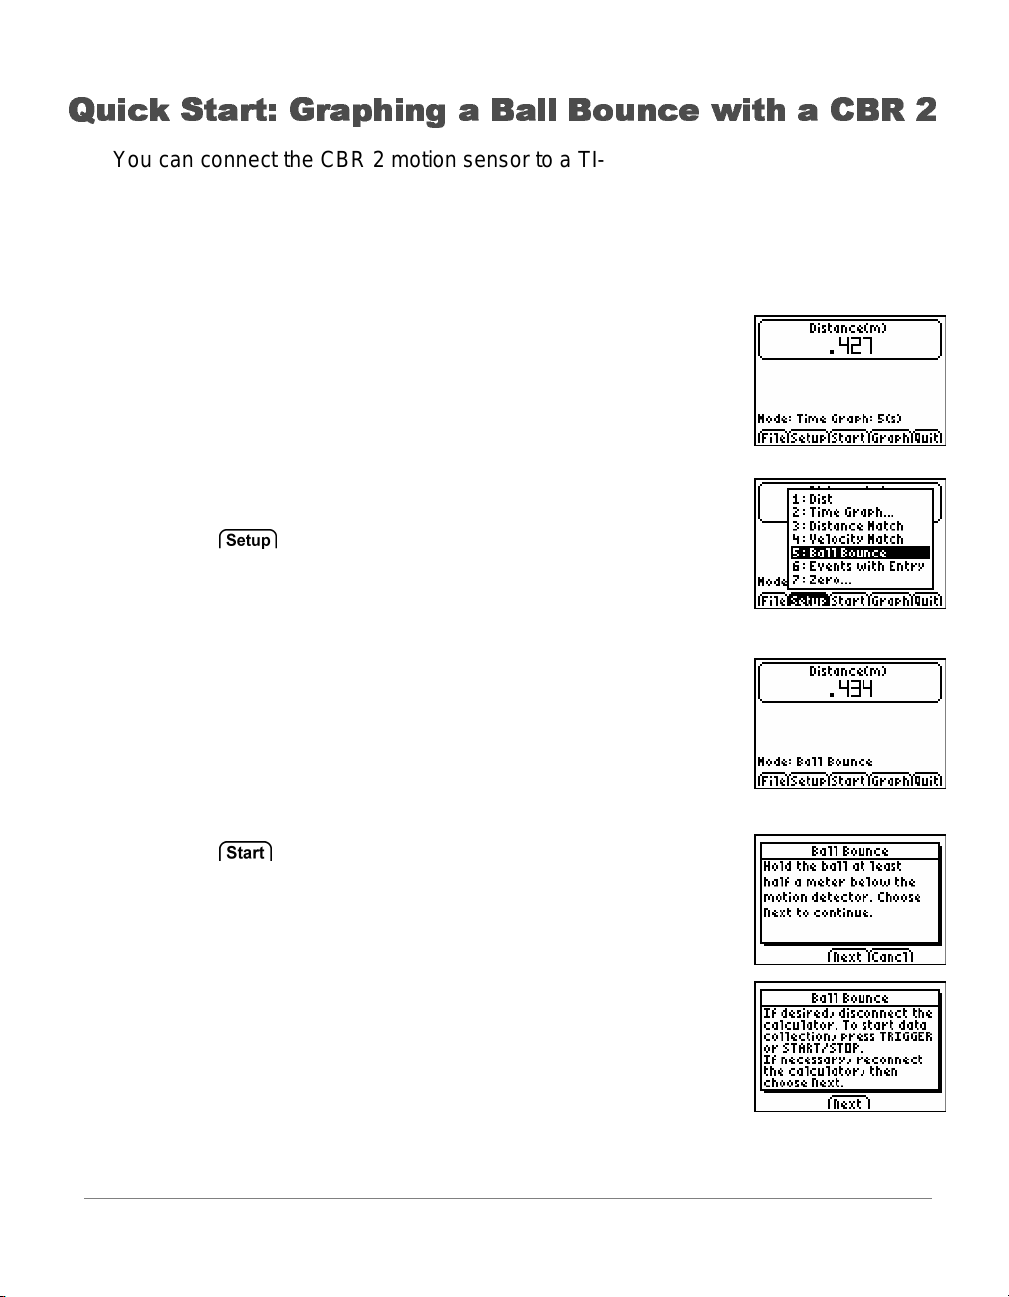
Quick Start: Gr ap hin g a Ball Boun ce wit h a CBR 2
You can connect the CBR 2 motion sensor to a TI-84 Plus calculator and use
EasyData to graph the motion of a bouncing ball. This exercise uses the Ball
Bounce mode to collect samples automatically at regular time intervals.
1. Turn t he TI - 84 Pl us calc ulator on, and display the home screen.
2. Connect t he CB R 2 to the calculator’s USB port.
After a few seconds, the EasyData main screen is
displayed. T he screen shows the cur r ent EasyData
mode and the current sensor reading.
3. Select and choose Ball Bounce.
4. Pic k up a ball and hol d the CBR 2 abov e the ball.
5. Select
Follow the on-screen i nstr uc tions to collect motion data for the
bouncing ball.
to begin data collec tion.
EasyData Guidebook 9
Page 11
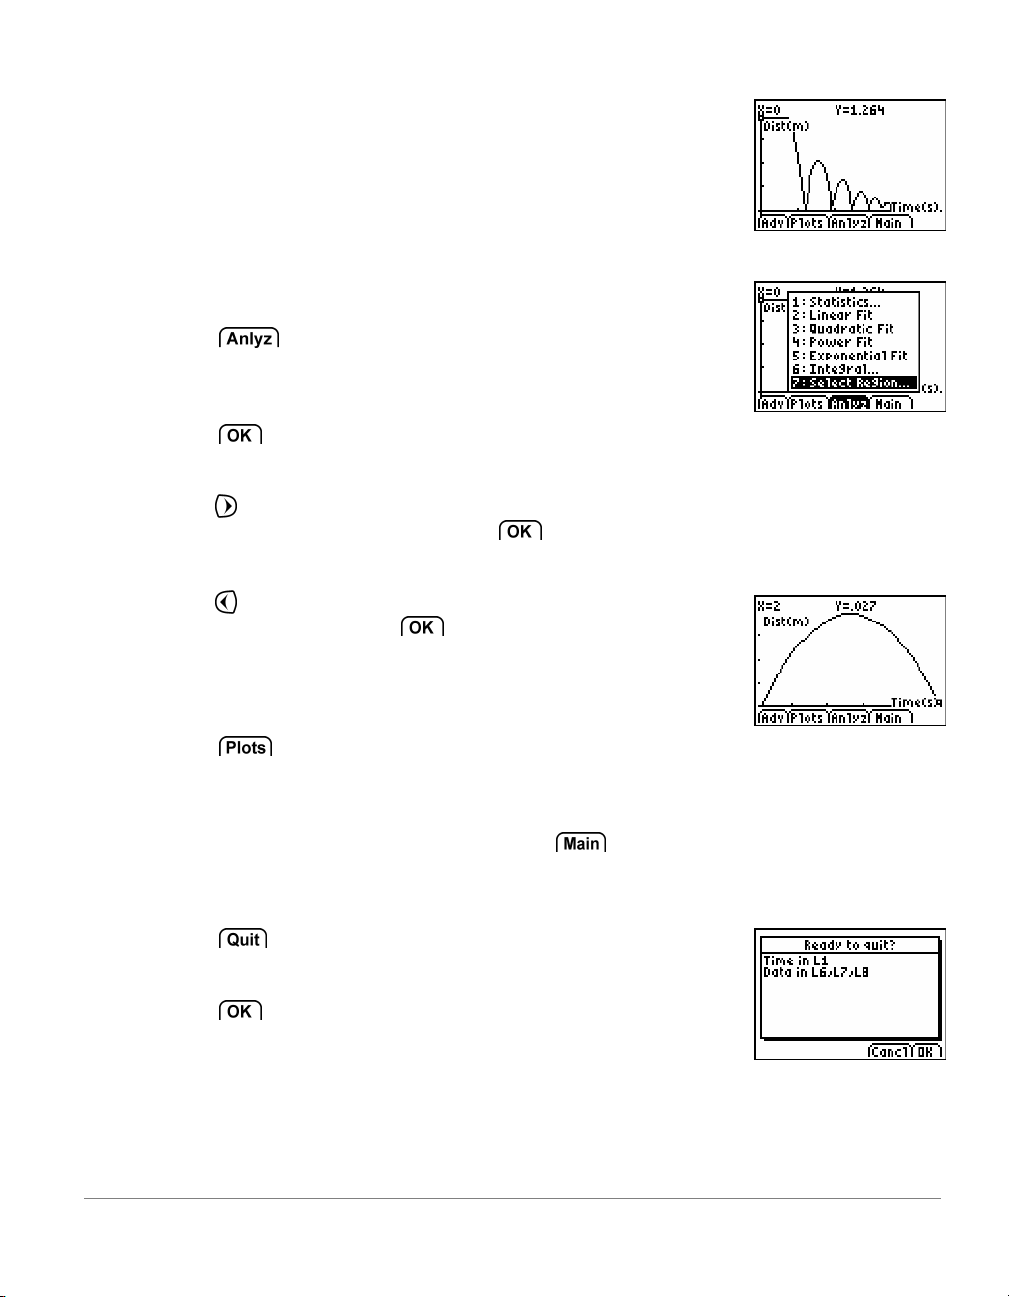
6. Once t he m otion dat a has been tr ansferred, a graph of
the ball’s motion is displayed.
7. Identify a bounce on the graph with a uniform shape to it.
Select
analyze menu.
A Region Select warning message will be displayed.
Select
8. Press
beginning of a uniform bounce. Select
left boundary marker.
Press
the uniform bounce. Select
boundary marker. A graph of the selec ted region will be
displayed.
9. Select
acceleration graphs.
10. When you finish exploring the graphs, sel ec t
to return to the EasyData main screen.
11. Select
data can be found.
Select
You have completed the Quick Start exercise for collecting motion. The remainder of
this guide cont ains det ailed instructions and reference information for using EasyDat a
features.
and choose Select Regi on fr om the
.
repeatedly to scroll the cursor to the
to set your
repeatedly to scroll the cursor to the end of
to set your right
to view the corresponding velocity and
. A message notes the li sts i n whic h the
to quit EasyData.
10 EasyData Guidebook
Page 12
Collecting Multiple D at a Ru ns
In order to compare consecutive runs of data, it is necessary to store your current
data before performing the next data-collection trial. When collecting data with a
single sensor, EasyData will allow you to store two runs of previous data for
comparison and analysis with your current data.
Each time a run is stored, list L3 is copied into L4 and list L2 is copied into L3.
Your independent variable will always remain in list L1 and should be kept
consistent between data-collection trials. To view all data runs on a single graph,
refer to the Graph Features and Analysis section. Keep in mind that storing data is
not th e same as saving data in an experimen t. For inf ormation on saving data,
refer to the Managing Data section.
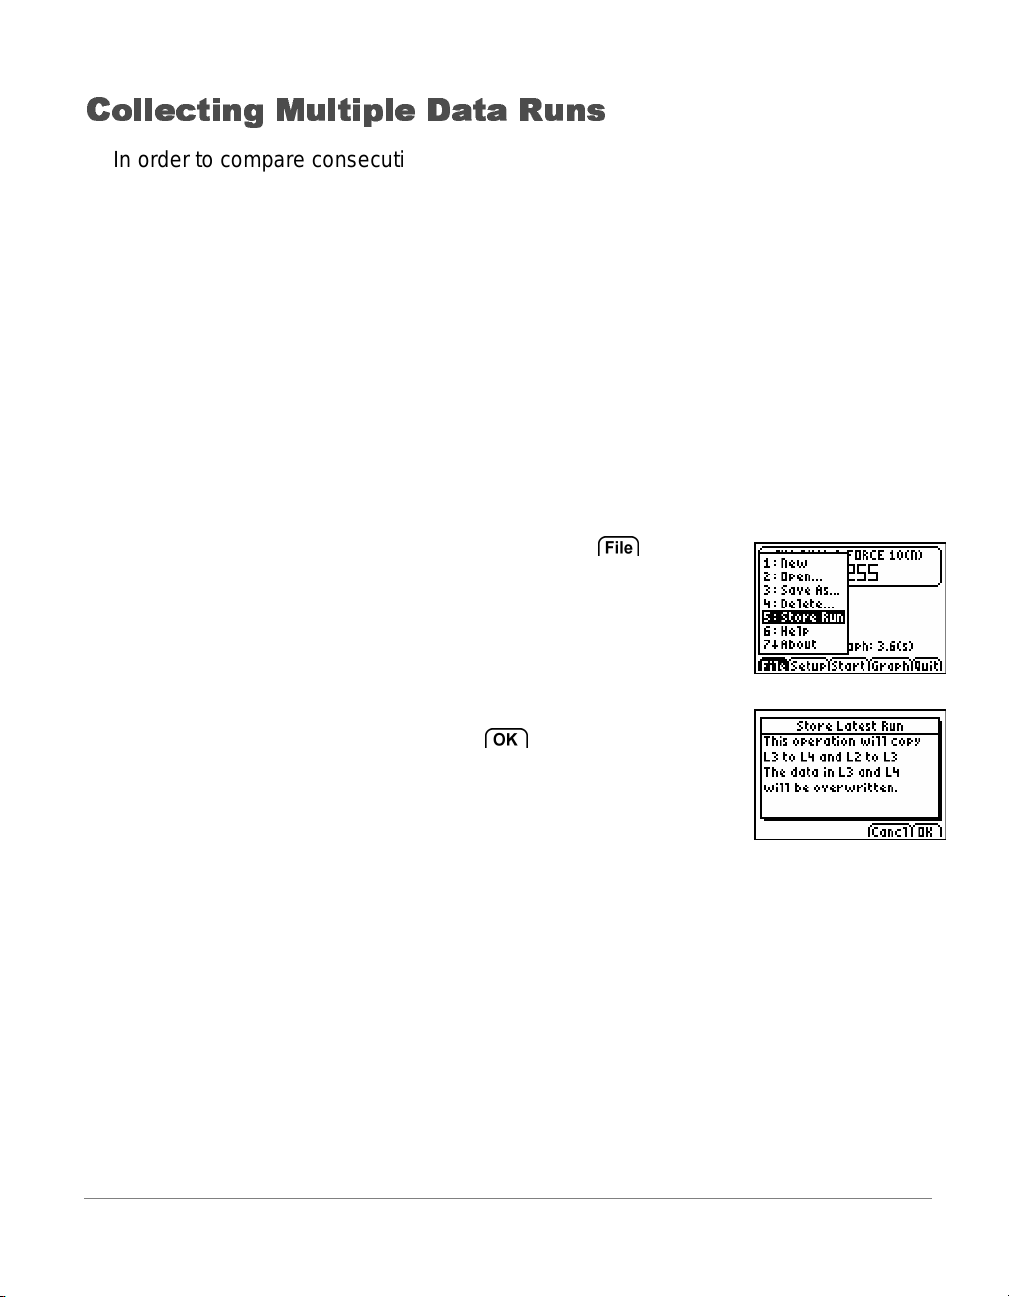
Storing Data
1. W hen data collection has been completed, sel ect ,
and then select Store Run.
2. The St or e Latest Run screen will appear identifying
where the data will be stored. Select
data.
3. You are now ready to collect a new run of data. Note: It is not necessary to store the
data following your third data-collecti on trial.
to store your
EasyData Guidebook 11
Page 13
Data Collectio n Mod es
EasyData has several modes that let you collect data automatically or
manually. The five most common modes are listed below.
In Time Graph mode, EasyData automatically collects a specific
number of samples at regular time interva ls. Yo u set th e interval (in
seconds) and the total number of samples to collect. You can stop the
sampling manually, if you wish.
In Events with Entry mode, you capture samples manually for a set
of events that you define. For example, you might want to collect
Boyle's law data using a gas pressure sensor to sample pressure
readings for corresponding volumes of a container.
In Selected Events mode, you capture samples manually every time
is selected. For example, you might want to collect individual
temperat ur e and pH readings al o ng a str eam bank at differe nt
locations.
In Single Point mode, an averaged reading is collected for each data
collection. A consecutive reading is collected each time a new data
collection is started. This mode is ideal for environmental monitoring
such as stream temperature or pH.
In Rate mode, the rate of periodic data, such as heart rate or soun d
waveforms, is calculated. This mode can be set to collect rate
readings in beats per minute (bpm) or Hertz (Hz). Only select sensors
support rate mode.
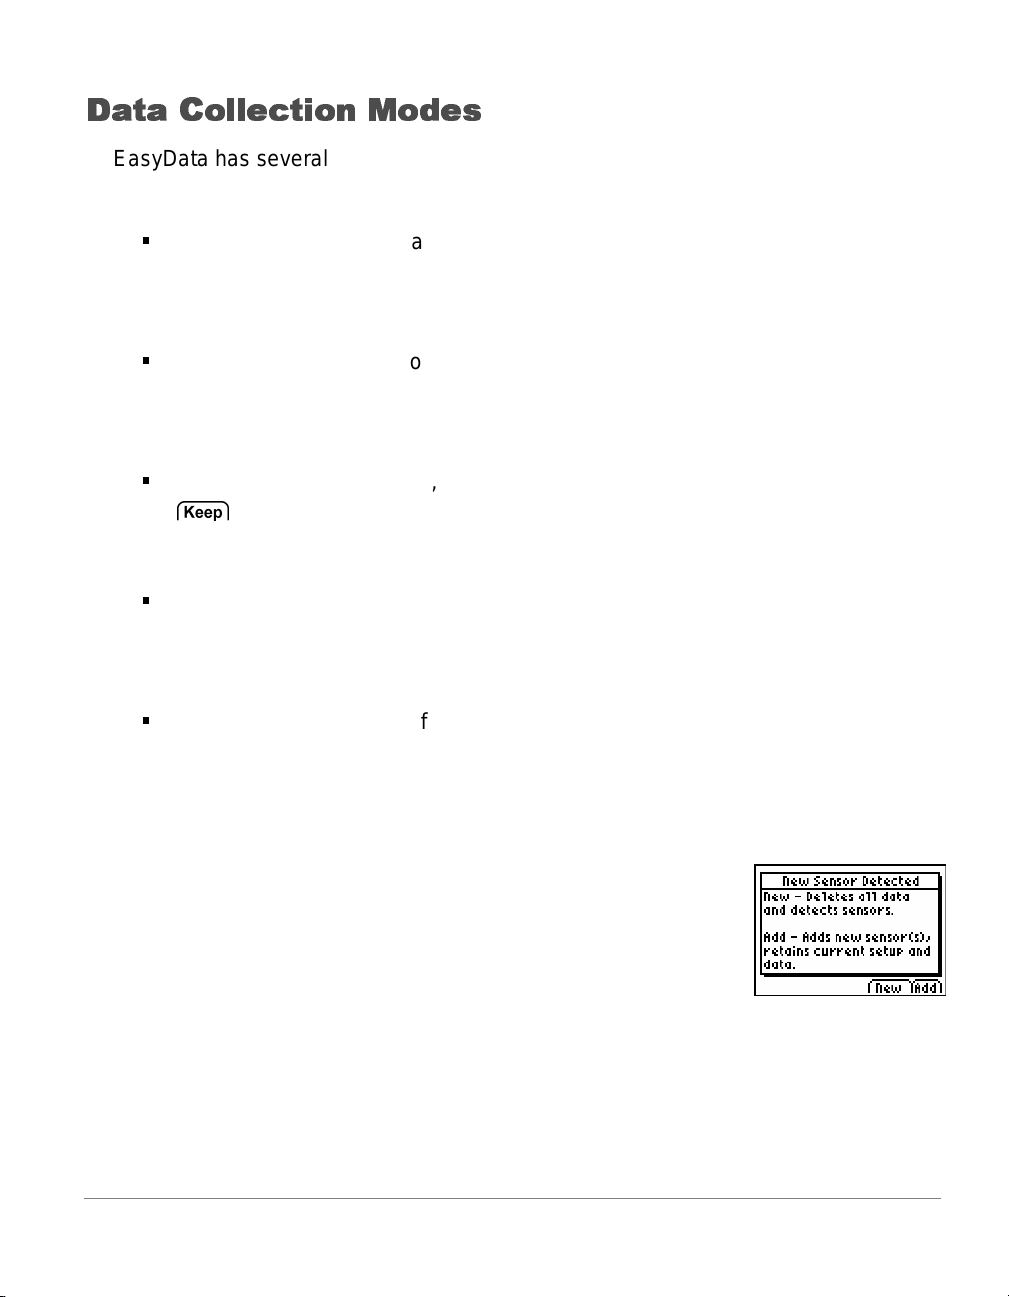
When you change an EasyData mode or se tting, the change
remains in effect until you restore the default settings, or
connect a different sensor. If a new sensor is added, you have
the option of ad di ng the new s e nsor an d ret ai ning the
previously set mode or restoring the mode to the default
settings.
12 EasyData Guidebook
Page 14
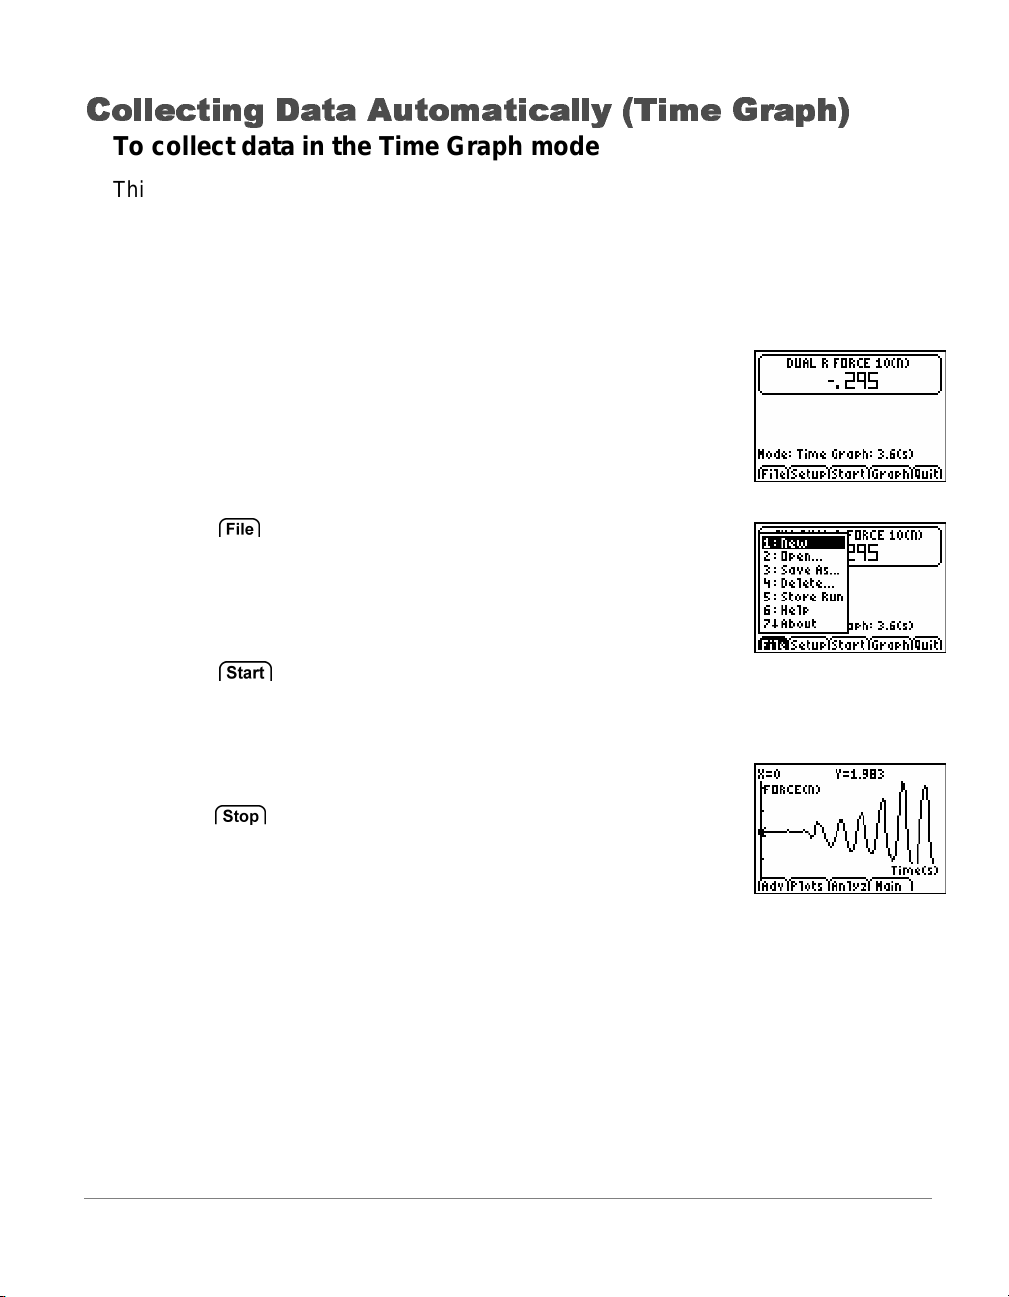
Collecting Dat a Aut om atic a lly (Time Gra ph)
To collect data in the Time Graph mode
This example uses a force sensor connected to an EasyLink and a TI-84 Plus
calculator. Your screens will vary depending on which sensor and data-collection
device is attached.
1. Turn t he c alc ulator on, and start the EasyData app.
After a few seconds, the EasyData main screen is
displayed. T he screen shows the cur r ent EasyData
mode and the current sensor reading. The default mode
for most sensors is Time Graph.
2. Select
and sensor defaul ts.
3. Select
4. Data collection will automatically end when all samples
have been collected. To stop data collection early,
select
When data collection has ended, E asyDat a displays a
graph of the collect ed data.
and choose New to restore data c ollection
to begin collecti ng data.
.
EasyData Guidebook 13
Page 15
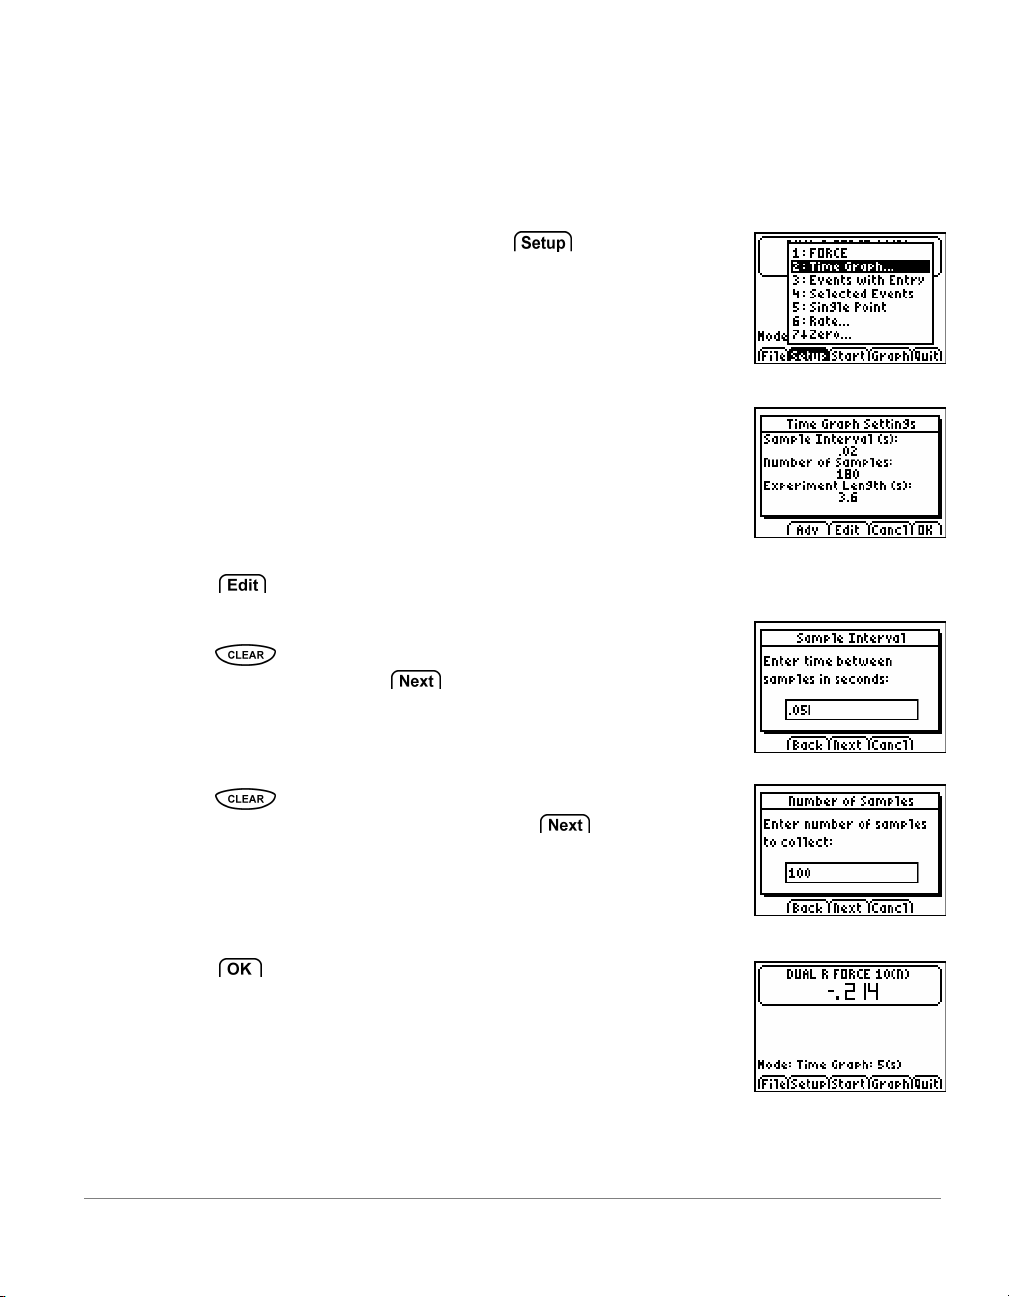
To change Time Graph settings
This example uses a force sensor connected to an EasyLink and a TI-84 Plus
calculator. Your screens will vary depending on which sensor and data-collection
device is attached.
1. From the EasyDat a m ain screen, select , and
then select Time Graph.. to open the Time Graph
Settings wizard.
The current Time Graph settings are displ ay ed.
2. Select
Press
in the new interval. Select
number of samples screen.
Press
type in the new number of sam ples. S elec t
finished to display a summary of the new settings.
3. Select
14 EasyData Guidebook
to enter new Tim e Graph settings begi nning with the sample interval.
to clear the old sampl e interv al and type
to advance to the
to clear the old number of samples and
when
to return to the main screen.
Page 16
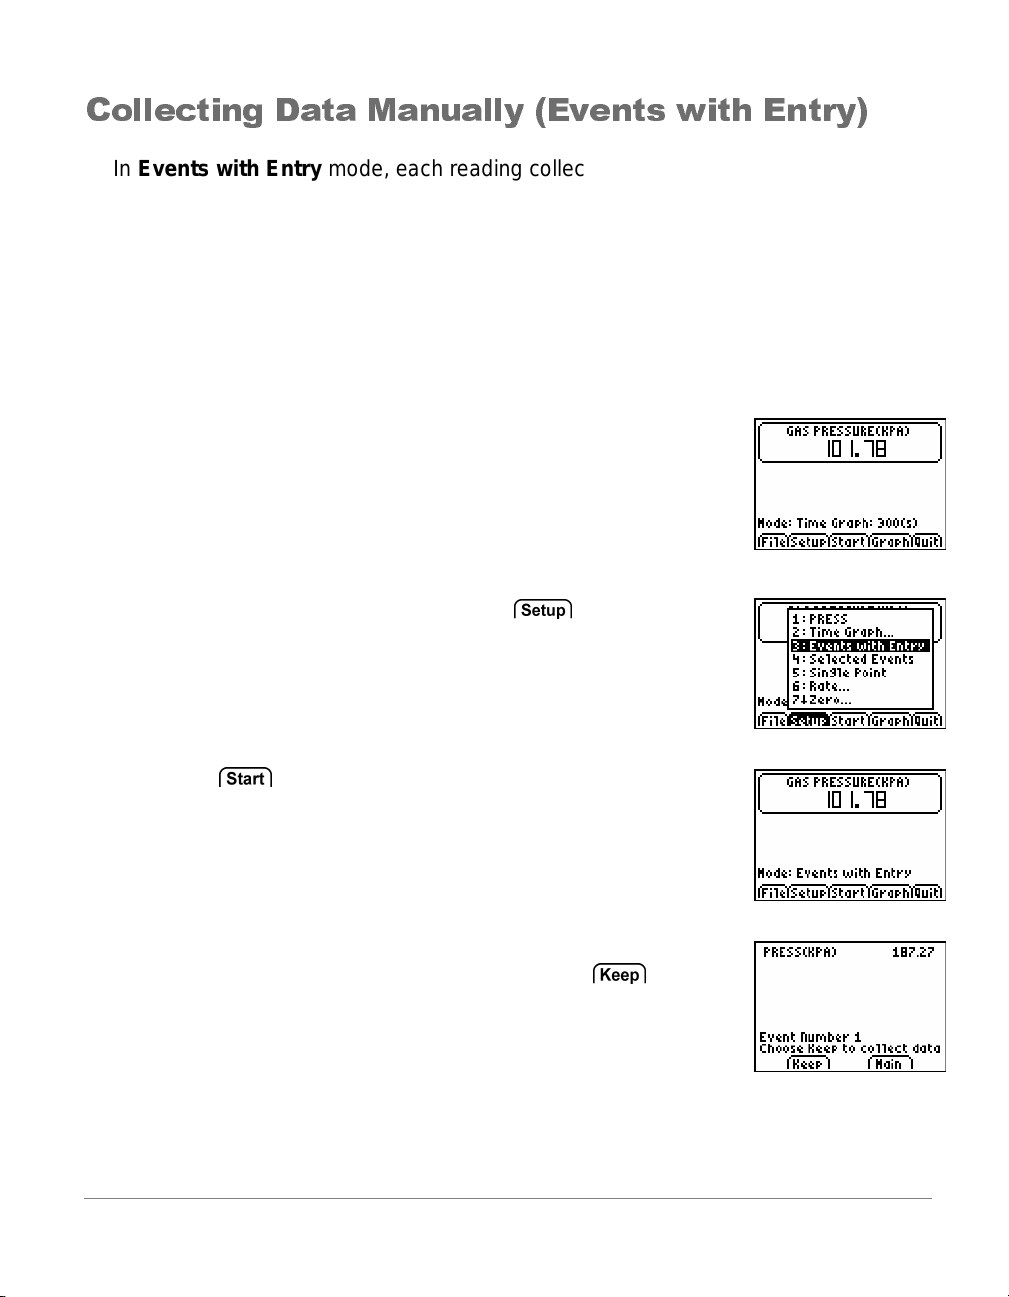
Collecting Data Manually (Events with Entry)
In E vents with Entry mode, each reading collected from a sensor becomes a y
value. After each reading, EasyData prompts you to enter the corresponding x
value.
To collect data in Events with Entry mode
This example uses a gas pressure sensor connected to an EasyLink and a TI-84
Plus calculator. Your screens will vary depending on which sensor and datacollection device is attac h ed .
1. Turn t he c alc ulator on, and start the EasyData app.
After a few seconds, the EasyData main screen is
displayed. T he screen shows the cur r ent EasyData
mode and the current sensor reading.
2. From the EasyDat a m ain screen, select
then select Events with Entry.
3. Select
for you to collect the first sample.
4. W hen you are ready to collect the first sample (y value)
and the displayed reading appears stable, select
to begin collecti ng data. EasyData waits
, and
.
EasyData Guidebook 15
Page 17
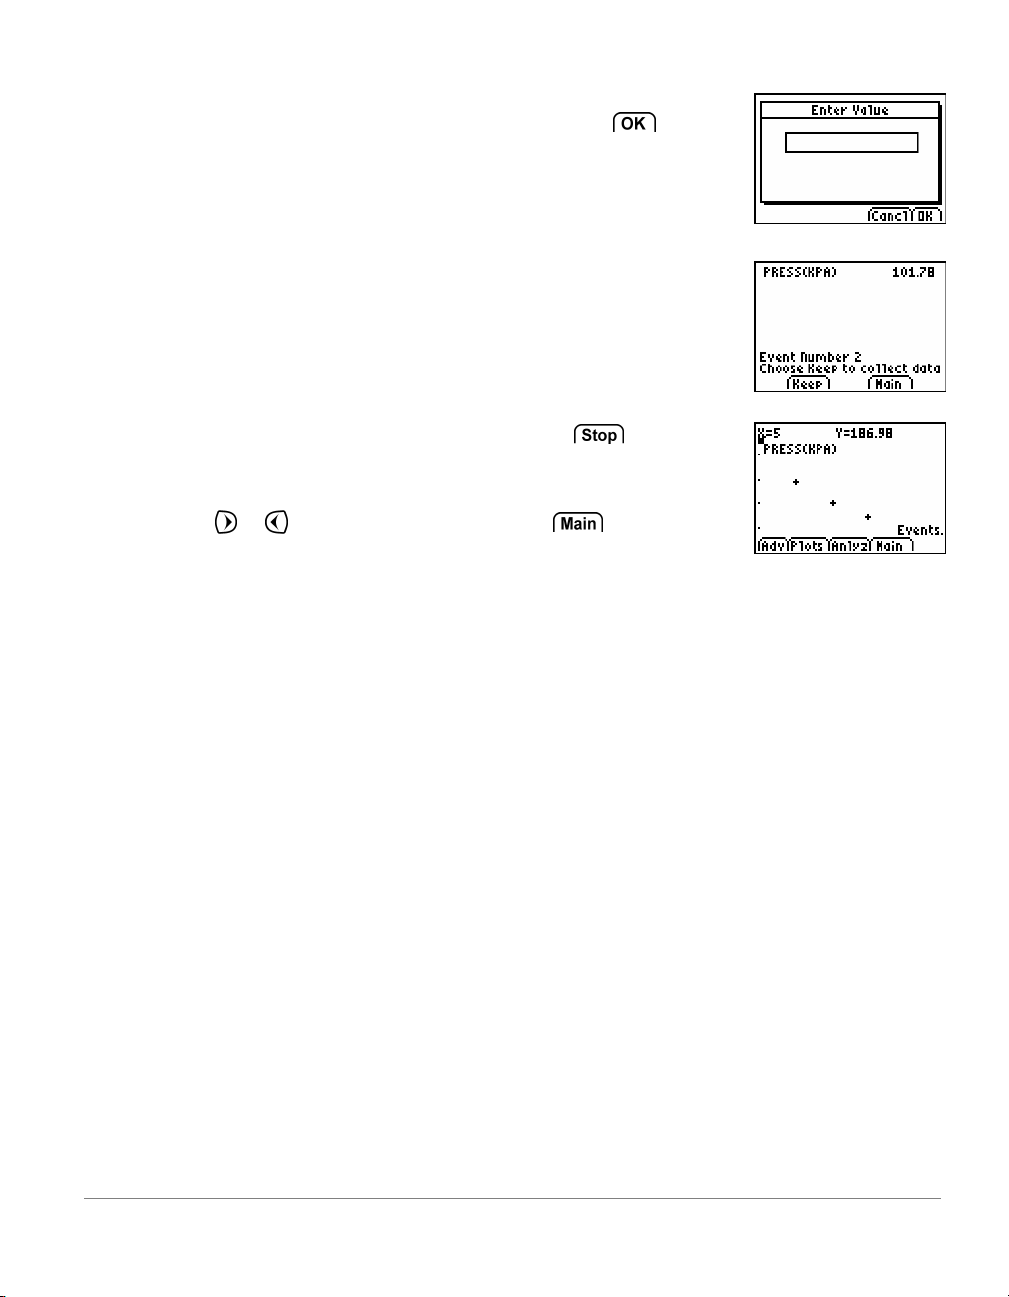
You are prompted to type in an x value that corresponds
to the sample you just collec ted. Enter it and select
to prepare for the next sam ple.
5. Repeat the above step for each additional sample to be
collected.
6. When you have finished col lecting data, select
The data you have collected are displayed as a graph.
7. Press
or to review your data, or select to
return to the EasyData main screen.
.
16 EasyData Guidebook
Page 18
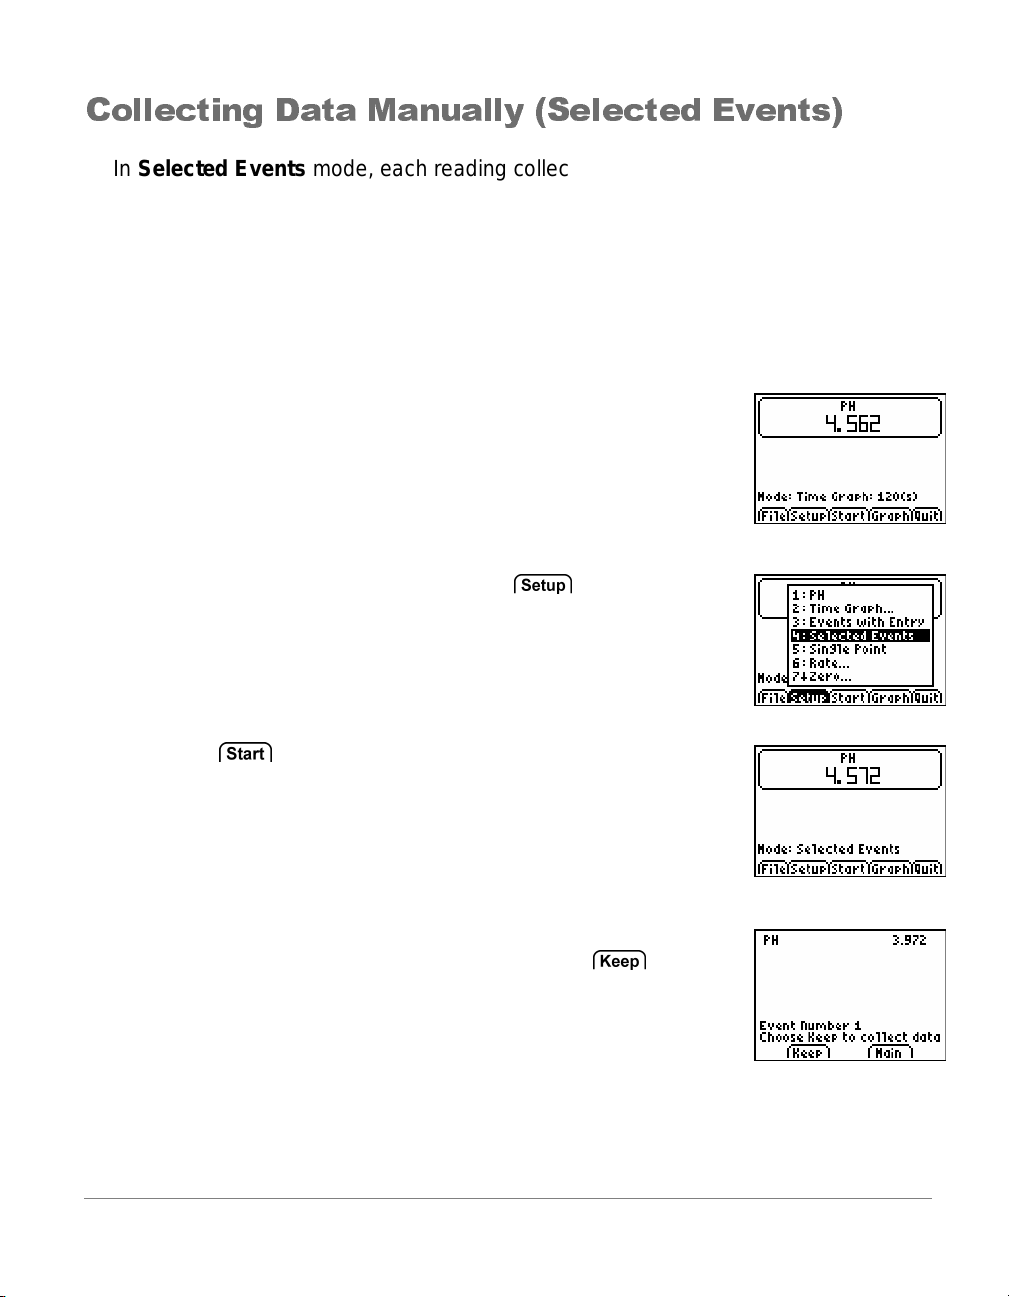
Collecting Data Manually (Selected Events)
In Selected Events mode, each reading collected from a sensor becomes a y
value. EasyData automatically assigns the sample number as the x value.
To collect data in Selected Events mode
This exampl e us es a pH sens or connected to an Eas yLink and a TI-84 Pl us
calculator. Your screens will vary depending on which sensor and data-collection
device is attached.
1. Turn t he c alc ulator on, and start the EasyData app.
After a few seconds, the EasyData main screen is
displayed. T he screen shows the cur r ent EasyData
mode and the current sensor reading.
2. From the EasyDat a m ain screen, select
then choose Selected Events.
3. Select
for you to collect the first sample.
4. When you are ready t o coll ec t t he fir st sample (y value)
and the displayed reading appears stable, select
to begin collecti ng data. EasyData waits
, and
.
EasyData Guidebook 17
Page 19
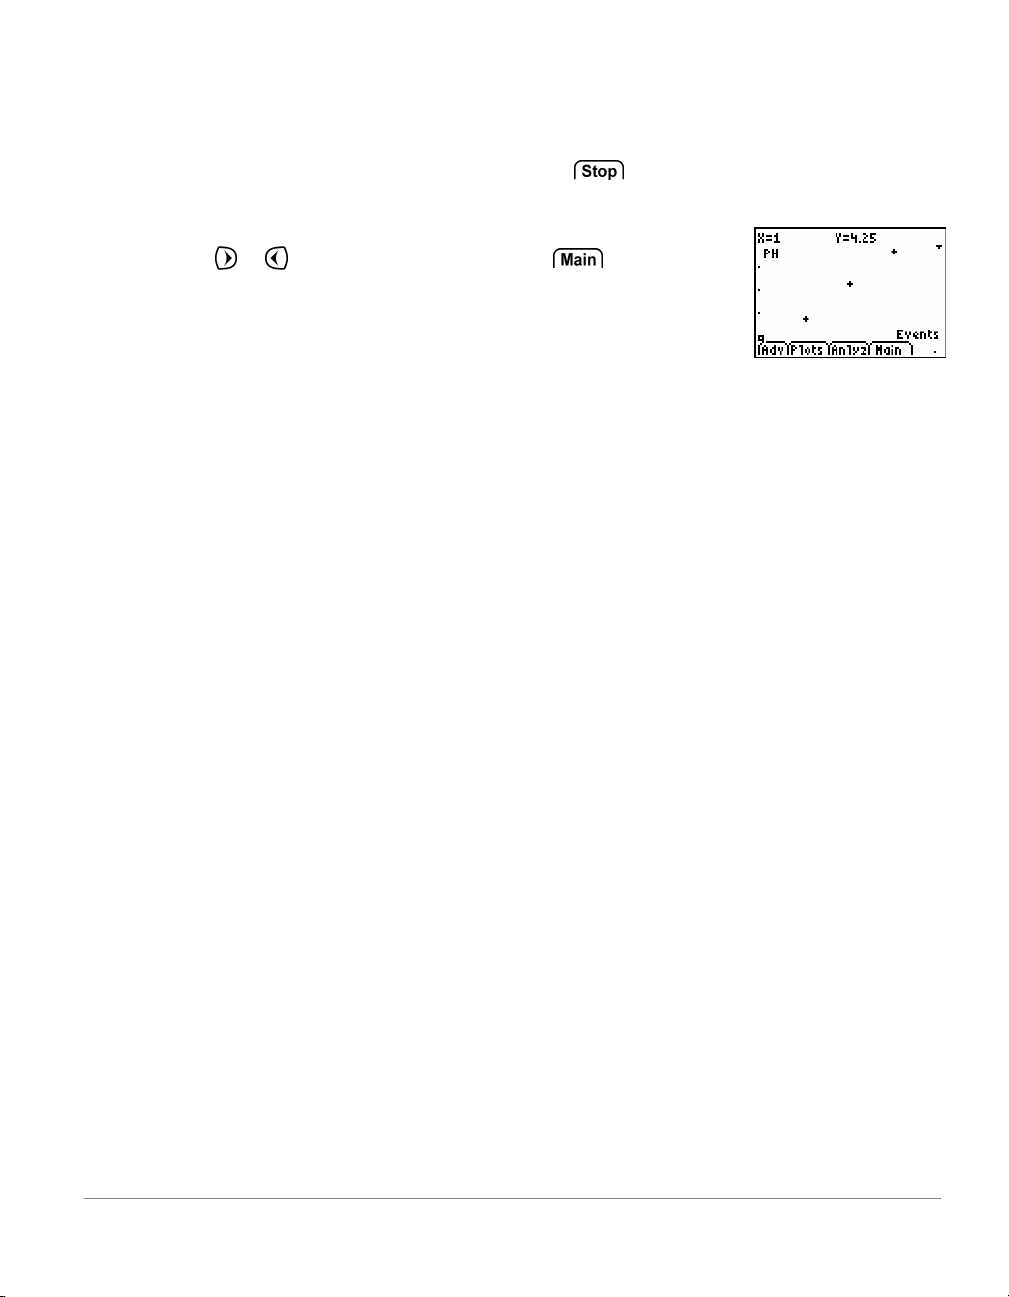
5. Repeat the above step for each additional sample to be collected.
6. W hen you have fi nished collecting data, selec t
.
7. The data y ou hav e c ollec ted are displayed as a graph.
Press
or to review your data, or select to
return to the EasyData main screen.
18 EasyData Guidebook
Page 20
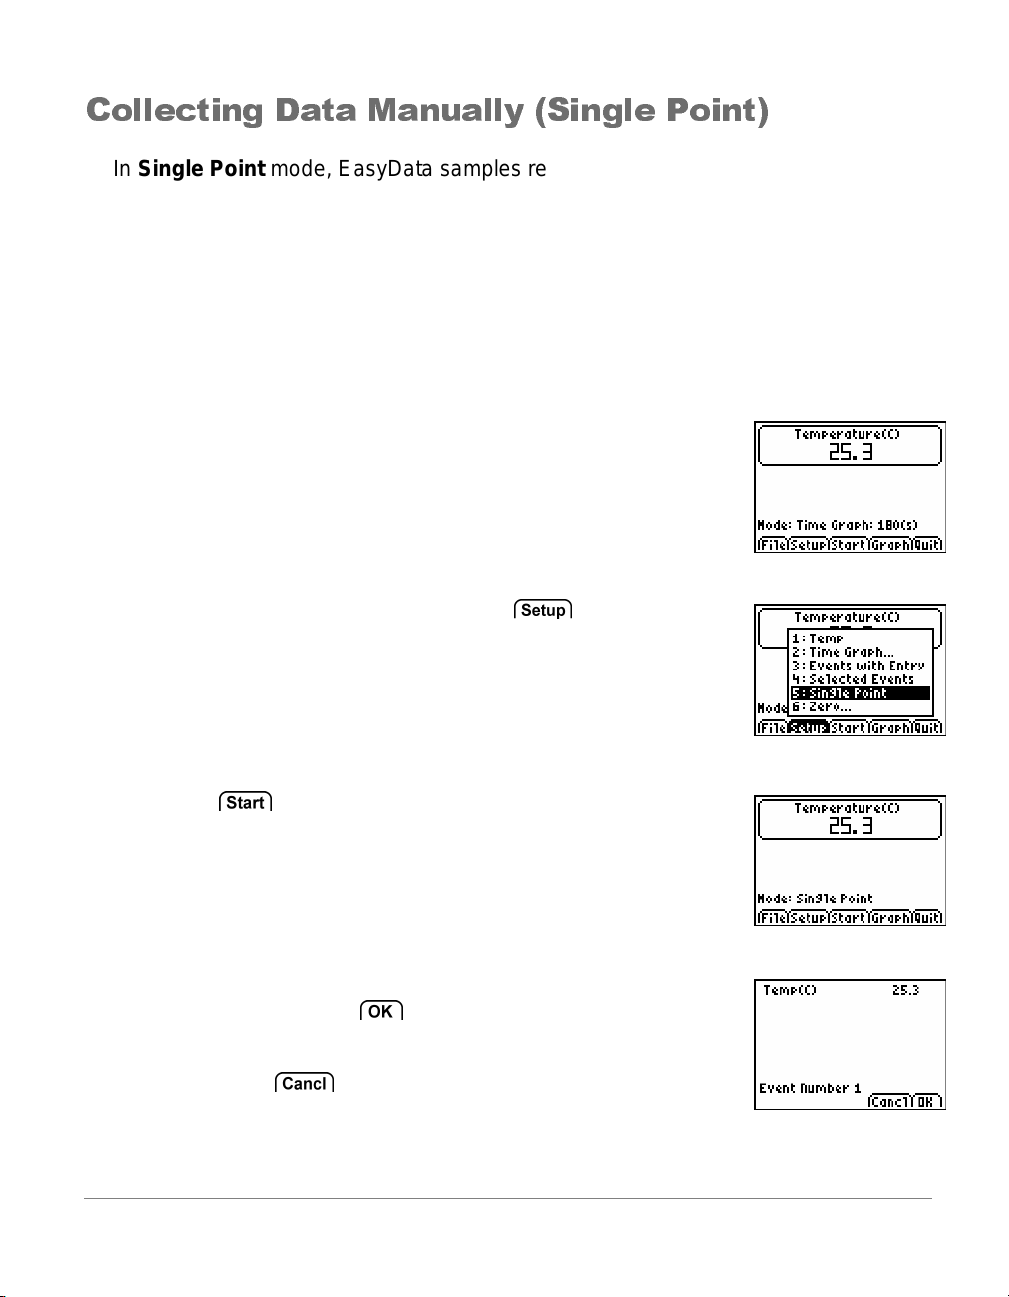
Collecting Data Manually (Single Point)
In Single Point mode, EasyData samples readings from the sensor for a 10
second period. When sampling is finished, the mean reading is calculated and
displayed. Each time a reading is collected, it is stored in memory for future use. If
you wish to clear previously collected data, select New from the File menu.
To collect data in Single Point mode
This example uses an EasyTemp and a TI-84 Plus calculator. Your screens will
vary depending on which sensor and data-collection device is attached.
1. Turn t he c alc ulator on, and start the EasyData app.
After a few seconds, the EasyData main screen is
displayed. T he screen shows the cur r ent EasyData
mode and the current sensor reading.
2. From the EasyDat a m ain screen, select
then select Single Point.
3. Select
data for 10 seconds.
When data collection has f inished, the averaged
reading is displayed.
4. If y ou wish to keep the r eading and prepare EasyData
to take another, select
If you are finished and no other readings are to be
taken, select
5. To collect another reading, repeat Steps 3 and 4.
to begin collecti ng data. EasyData collects
.
.
EasyData Guidebook 19
, and
Page 21

Specialized Data Collection Modes
Using Motion Detectors
In Distance Match mode, Easy Data helps to buil d under s t an di n g o f graphs by
letting you try to create data that matches a predefined graph. The sample interval
and number of samples are preset and cannot be changed. Each of the preset
plots is randomly generated so that students have the option of matching a new
plot every time.
In Ve locity Match mode, students work to match preset plots o f velocity rather
than distance. Interpretation of velocity plots helps to further the understanding of
graphs established during Distance Match. The sample interval and number of
samples are preset and cannot be changed. Each of the preset plots is randomly
generated so that students have the option of matching a new plot every time.
Ball Bounce mode, is a specialized routine to help students understand the
motion of a bouncing ball . When dat a is collected Eas yData adjusts the data, with
respect to the floor, so that each bounce on the distance graph has the same
minimum distance. This helps students to visually connect the data on the graph to
the perceived motion of the ball. The sample interval and number of samples are
preset and cannot be changed.
20 EasyData Guidebook
Page 22

To collect data in Distance Match
This example uses a CBR 2 connected to a TI-84 Plus calculator.
1. From the EasyDat a m ain screen, select , and then select Dist ance Mat ch.
2. Select to begin the activity.
3. Foll ow the instructions displayed in the Graph Match
dialog box. Select
4. A graph of distanc e vs. time is displayed. The graph
should be examined before attempting to match the
graph. When ready to perform the match, select
to begin collecti ng data.
Walk back and forth in front of the motion sensor to
match the displayed graph.
EasyData Guidebook 21
to display the next screen.
Page 23

5. Select to display a new graph to matc h, or sel ec t
to match the same graph already displayed.
When finished, select
to return to the main
screen.
22 EasyData Guidebook
Page 24

To collect data in Velocity Match
This example uses a CBR 2 connected to a TI-84 Plus calculator.
1. From the EasyDat a m ain screen, select , and then select Velocity Match.
2. Select to begin the activity.
3. Foll ow the instructions displayed in the Graph Match
dialog box. Select
4. A graph of v eloci ty vs. time is displayed. The graph
should be examined before attempting to match the
graph. When ready to perform the match, select
to begin collecti ng data.
Walk back and forth in front of the motion sensor to
match the displayed graph.
EasyData Guidebook 23
to display the next screen.
Page 25

5. Select to display a new graph to matc h, or sel ec t
to match the same graph already displayed.
When finished, select
to return to the main
screen.
24 EasyData Guidebook
Page 26
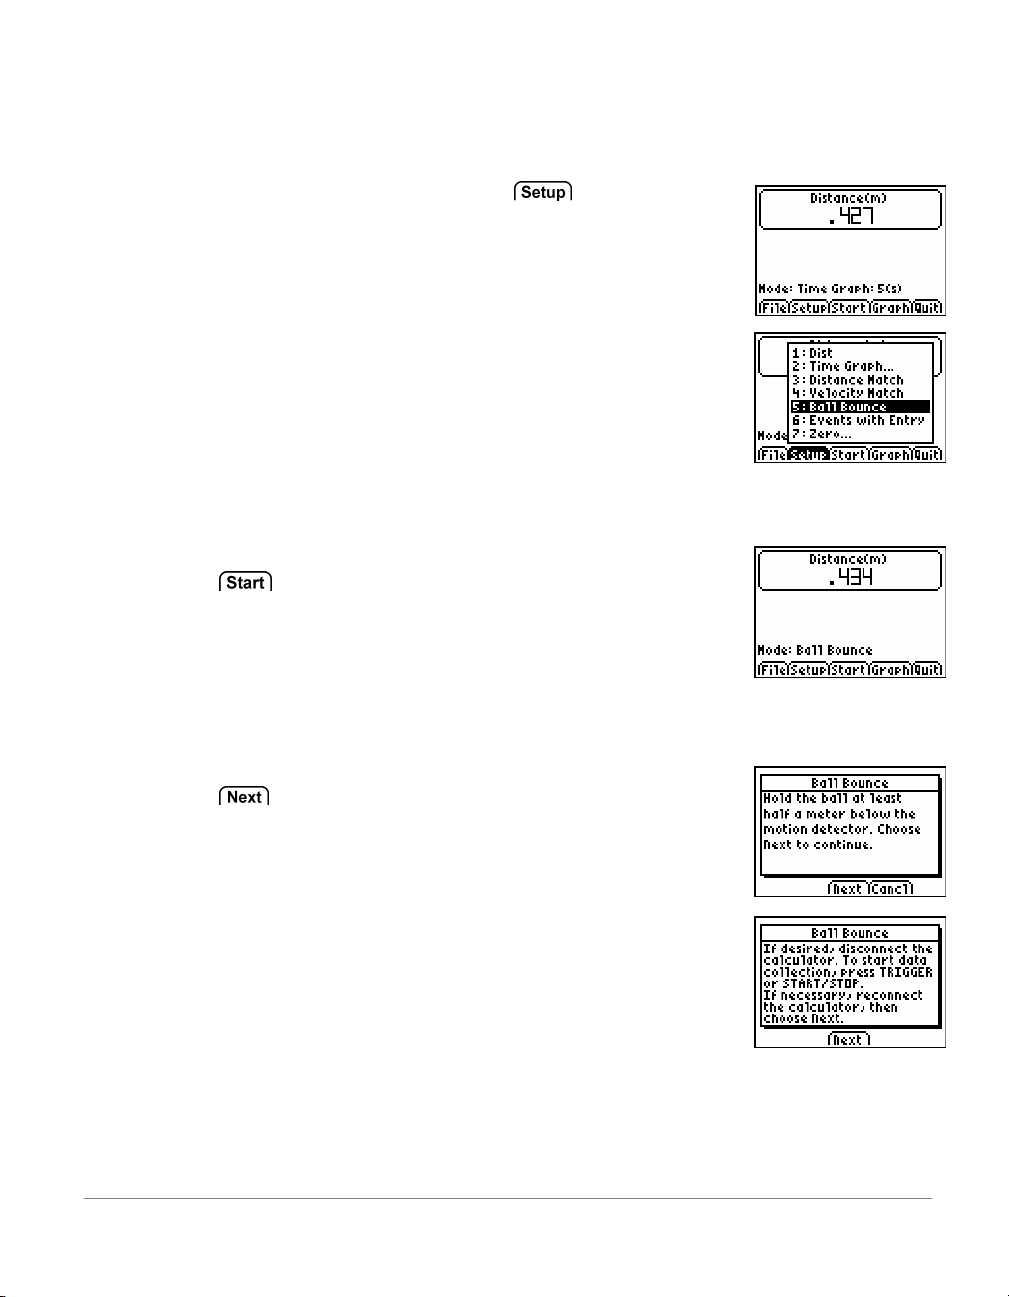
To collect data in Ball Bounce
This example uses a CBR 2 connected to a TI-84 Plus calculator.
1. From the EasyDat a m ain screen, select , and then select Ball Bounce.
2. Pic k up a ball and hol d the CBR 2 abov e the ball.
Select
3. Foll ow the instructions displayed in the Ball Bounce dialog box.
Select
to begin data collec tion.
to display the next screen.
EasyData Guidebook 25
Page 27
4. Once t he m otion dat a has been tr ansferred, a graph of
the ball’s motion is displayed. Scroll through t he
collected dat a points on the graph screen using the
and
Select
or select
finished, select
keys.
to display a plot of velocity or acceleration,
to analyze the displayed graph. When
to return to the main screen.
26 EasyData Guidebook
Page 28

Using Photogates
When a photogate is attached, the r e are four photogate data col lection modes that
can be used. These data-collection modes are only available when a photogate is
set up. Photogates cannot be used in conjunction with any other sensors and must
be connected to the digital (DIG) channels of the LabPro or CBL 2. When using an
older photogate, it may not auto-ID and it will be necessary to set up your
photogate manually.
Once the photogate is set up, the gate status will be displayed in the meter on the
main screen. To test the photogate, block it with your hand; the status should
report as Blocked. Once you remove your hand, it should change to Unblocked.
The default mode is Motion Timing. This mode is appropriate for a picket fence
experiment, a smart pulley, or a user-defined device. Only auto-ID photogates may
be daisy-chained. During operation, times are recorded as leading opaque edges
of a device pass through the photogate beam. These times are used to calculate
distance, velocity and acceleration.
In Gate Timing mode, the time during which one or two photogates are blocked is
measured. Corresponding velocities will be calculated from the measured times
and the width of the object used to block the gate.
In Pulse Timing mode, the time between two blocking events is measured and
stored. If you are using one photogate, the timing starts when the photogate is first
blocked, and it stops when the photogate is blocked again. When two photogates
are used, the timing starts when the first photogate is blocked, and stops when the
second gate is blocked.
In Pendulum Timing mode, the period of an object as it oscillates through the
photogate will be measured .
EasyData Guidebook 27
Page 29

To collect data in Motion Timing mode
This example uses a photogate connected to a CBL 2. During the experiment, a
Vernier Picket Fence is dropped through the photogate.
1. From the EasyDat a m ain screen, select , and
then select Motion Timi ng....
The default Motion Timi ng settings are displayed. The
default devic e should be set as a Vernier Picket Fence.
Select
2. Select
collection device to beep, then drop the Picket Fence
through the photogat e.
3. W hen all eight opaque bars of the Picket Fence have
passed through the photogate beam, data collection will
end. A graph of distance vs. time will be displayed.
4. Select
acceleration graphs.
5. Select
to return to the main screen.
to begin collecti ng data. Wait for the data-
to view the corresponding velocity and
to return to the main screen.
28 EasyData Guidebook
Page 30

Options: To use a device other than a Vernier Pi c k et Fence, sel ec t from the Motion
Timing Settings dialog box and select one of the following.
Pulley (Outside Edge) if you are using a 10-spoke Super Pulley and want to measure
rotational or linear motion based on the outside diameter of the pulley wheel. For example,
rolling the pulley along a table top.
Pulley (Inside Edg e) if y ou ar e using a 10-spoke Super Pulley and want to measure
rotational or linear motion created by a string running through the pulley’s groove. For
example, setti ng up an Atwood’s machine experiment.
User Defined when using a different type of device like a bar tape or a 3-spoke pulley.
EasyData Guidebook 29
Page 31
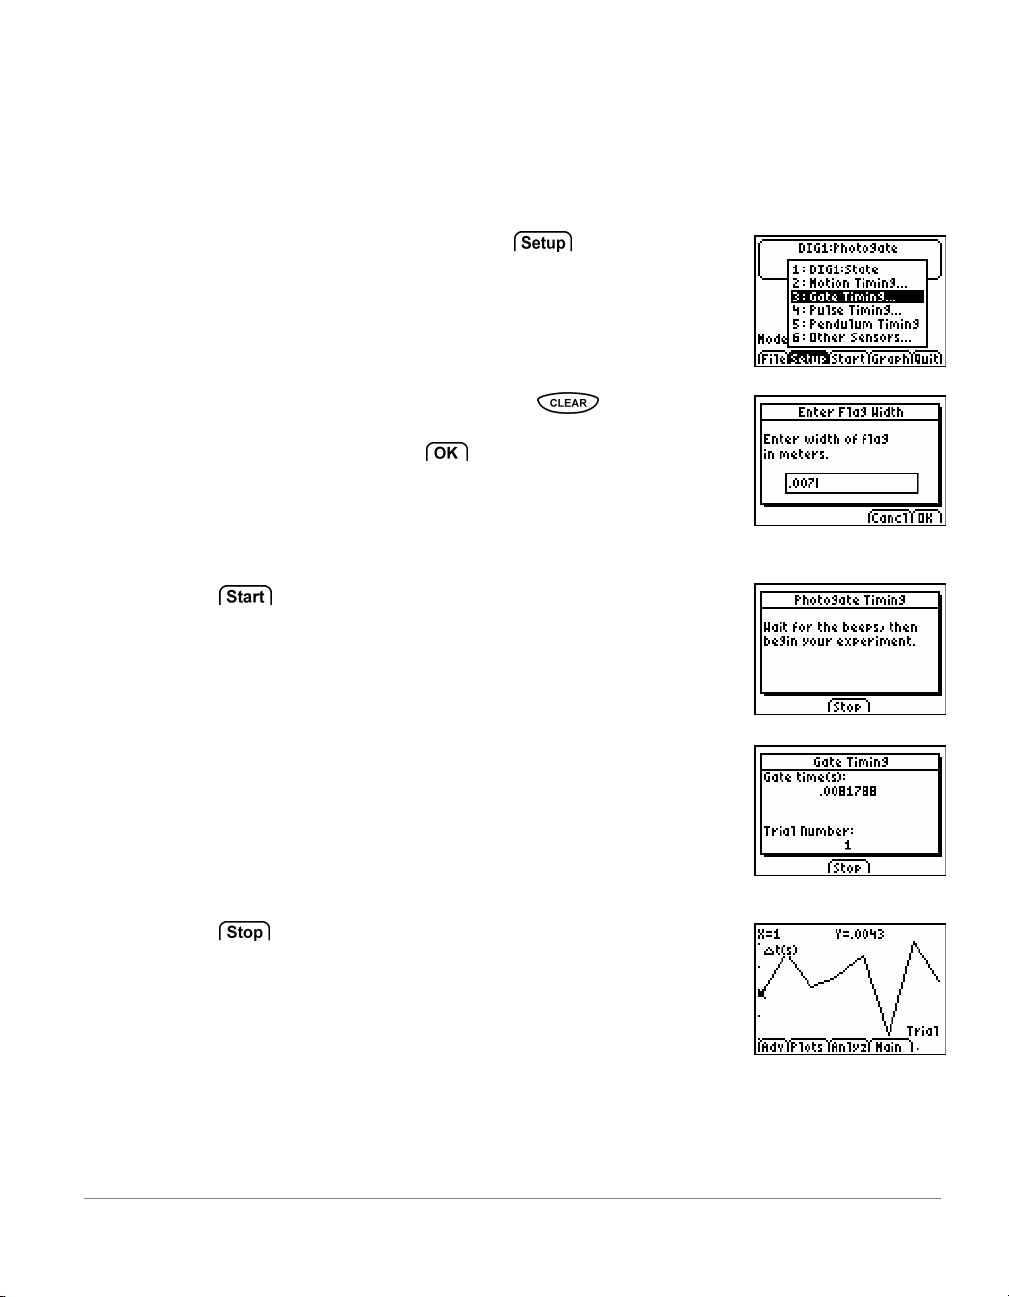
To collect data in Gate Timing mode
This example uses a single photogate connected to a CBL 2. During the
experiment, a regular #2 pencil will be passed through the photogate . Gate Timing
can be used with one or two photogates.
1. From the EasyDat a m ain screen, select , and
then select Gate Timing ....
The Flag Width screen i s di spl ay ed. Pr ess and
type in the width of the objec t t hat will be passing
through the photogat e. Select
screen.
2. Select
to begin collecti ng data. Wait for the datacollection device to beep, then pass the pencil through
the photogate once.
The time the gate is blocked is displayed along with the
trial number. Pass the pencil through the gate several
more times.
3. Select to stop collecti ng data. A graph of time
blocked vs. trial number is displayed.
to return to the main
30 EasyData Guidebook
Page 32
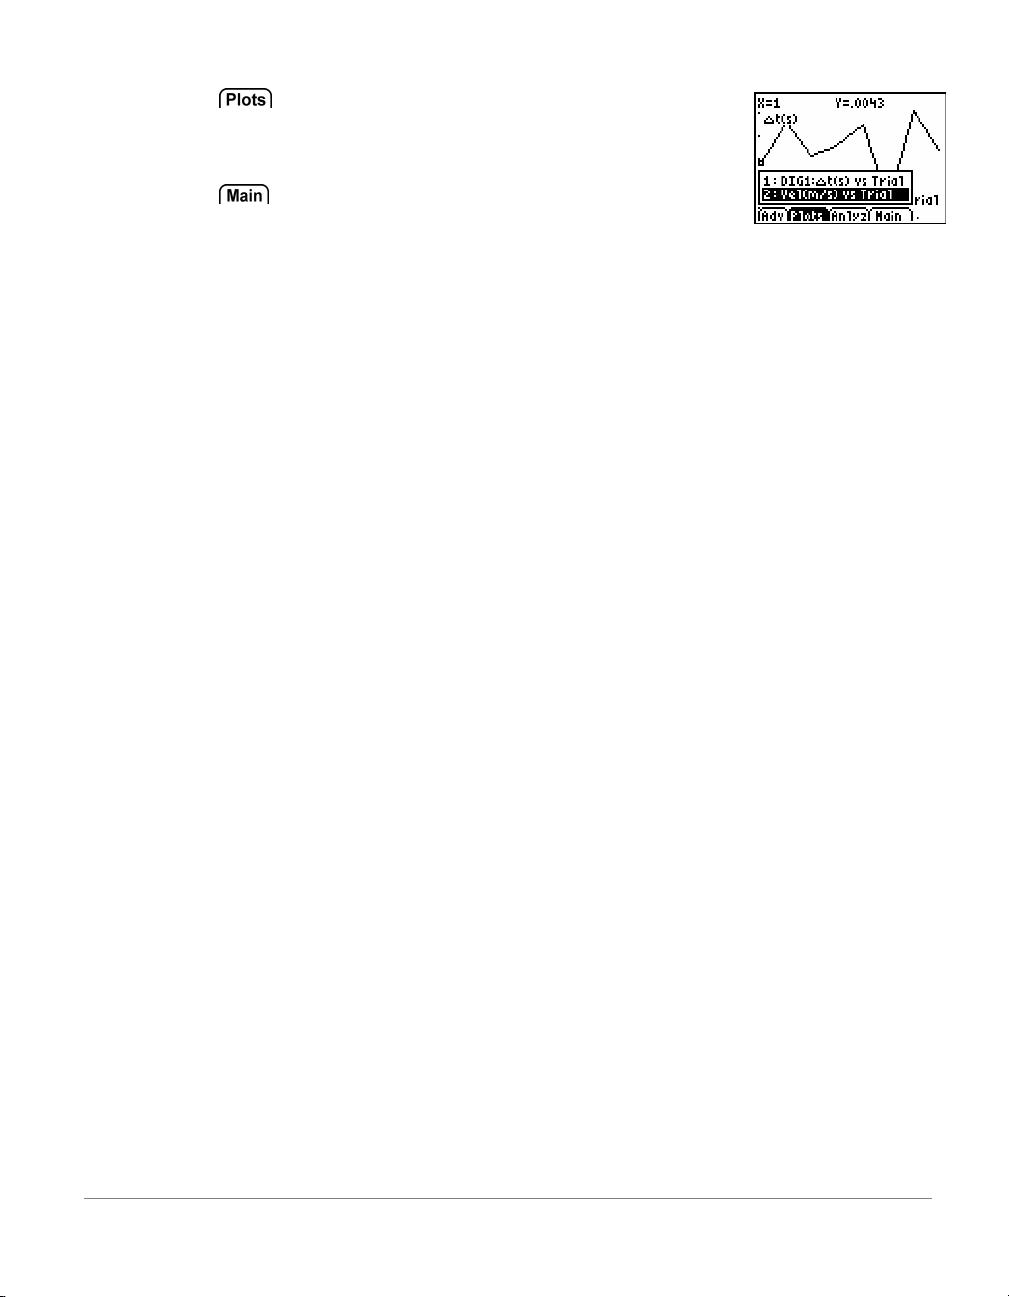
4. Select to view the corresponding velocity graph.
5. Select
Options: When collecting data in Gat e Timi ng m ode, it is possible to use one or two
photogates. The example above describes the use of a single photogate.
to return to the main screen.
EasyData Guidebook 31
Page 33

To collect data in Pulse Timing mode
This example uses two photogates connected to a LabPro. The gates are spaced
0.5 meters apart along a ramp. During the experiment, a cart will be passed
through the tw o ph otogates.
1. From the EasyDat a m ain screen, select , and
then select Pulse Timing....
The Gate Distance is displ ay ed. Press and type
in the distance between the photogates. Select
return to the main screen.
2. Select to begin collecting data. W ait f or the datacollection device to beep, then allow the cart to pass
through each of the photogates.
The time required for the cart to pass from the first to
the second photogate is displayed along with the trial
number. Pick up the cart and place it at the top of the
ramp. Pass it through t he photogates several more
times.
3. Select to stop collecti ng data. A graph of time vs.
trial number is displayed.
to
32 EasyData Guidebook
Page 34

4. Select to view the corresponding velocity graph.
5. Select
Options: When collecting data in Pulse Timing mode, it is
possible to use one or t wo photogat es. The example above describes the use of a two
photogates. W hen performed with a single photogate, tim e is measured bet ween two
consecutiv e bloc k s of the gat e.
to return to the main screen.
EasyData Guidebook 33
Page 35

To collect data in Pendulum Timing mode
This example uses a single photogate connected to a LabPro. During the
experiment, a pendulum bob repeatedly passes through the photogate.
1. From the EasyDat a m ain screen, select , and
then select Pendulum Tim ing....
2. Select to begin collecting data. W ait f or the datacollection device to beep, then release the pendulum so
that the bob passes through t he photogate.
The time required for the pendulum to pass through the
photogate three times (a full period) is displayed along
with the trial number. Allow the pendulum to continue
osc illating to colle c t multip le perio d s.
3. Select to stop collecti ng data. A graph of period
vs. trial number is displayed.
4. Select to return to the main screen.
34 EasyData Guidebook
Page 36

Miscellaneous Data Collection
Titration mode cannot be selected and will only appear if a Drop Counter along
with an analog sensor is being used. When this mode is set all data-collection
settings are preset and cannot be changed.
When the titration mode is started, the LabPro or CBL 2 is instructe d to collect
2500 sampl es from the attached se nsor at a s am p l e inter v al of 1 sample/second.
It is best to set the drop rate of the titrant no faster than 1 drop/second.
To stop data collection, it is best to select
to be collected. When data collection is stopped, first and second derivatives are
calculated. The derivative calculations will only apply to data collected from a
sensor in CH1 of the data-collection device.
To perform a titration without using a Drop Counter, refer to the data collection
mode Events with Entry found earlier in this section.
rather than allow all 2500 samples
Long-Term mode, is automatically set if the sample interval of a Time Graph is
set above 270 seconds or the experiment length exceeds 1800 seconds (30
minutes). When Long Term is set, the data-collection device can be disconnected
from the calculator during data-collection. Once all data has been collected,
reconnect the data-collection device and follow the on-screen instruction to retrieve
the da ta. This mode cannot be used w ith EasyLi nk or EasyTemp.
EasyData Guidebook 35
Page 37

Graph Fe at ure s an d Da ta-A nalysis To ols
After collecting data, EasyData displays a graph of the data, automatically
scaled for easy viewing. The calculator is placed in Trace mode
automatically so you can scroll through the collected data points on the
graph screen using the
are accessible from the graph screen.
Graph Screen Overview
• The x-axis (horizontal axis) is the independent variable. For
example, in Time Graph mode this represents time, or in Events with
Entry mode it is a set of user-defined events.
• The y-axis (vertical axis) is the dependent variable. In all data
collection modes, it is the physical data collected by the attached
sensor.
and keys. Sever al common, data anal y si s tool s
The Advanced menu enables the plotting of
graphs using data collected from previous
data-collection trials, calculated data, data
entered by hand, or derivatives calculated
during titrations.
When multiple sensors, motion detectors, or photogates are used to
collect data, the Plots menu lists all possible data plots that can be
graphed.
36 EasyData Guidebook
Page 38

The EasyData application has many analysis
tools with which to analyze data. Refer to the
Analyzing Data section for more information.
The Main button is used to exit the graph
screen and return to the main screen.
EasyData Guidebook 37
Page 39

Performing Statistics or Integral calculations
Statistic s and I ntegral calculations can be perf ormed over any r egion of the data shown on
a graph. Statistic s and Integral calculations are only allowed on a graph that is displayi ng a
single dependent variable on the Y-axis. Use the choices from the
to display a graph with only a single dependent variable on
the Y-axis.
and menus
1. From the EasyDat a gr aph scr een, select
then choose Statistics.
2. Scroll through the collected data points on the graph
screen using the
the left boundary of t he data to be analyzed and select
. A vertical line representing the left boundary
marker is displayed.
3. Mov e the cur sor to the right boundary of the data to be
selected and select
4. A screen is di splayed with the results of the statistics
calculations. Select
To calculate an integr al instead of statistics, select
and choose Integral, then repeat Steps 2 – 4.
and keys. Move the cursor to
.
to return to the graph screen.
, and
38 EasyData Guidebook
Page 40

Curve Fits
There are four types of c urve fits available in the menu found on the EasyData
graph screen. Each curve fit is unique and designed for a specifi c use. When a curve fit is
selected, it will be performed on all of the displayed data. To fit a curve to a specific region
of data, use the Select Region option to isolate only the data you wish to work wit h. Curve
fits can only be applied t o a singl e data set at a time. For multiple data sets, repeat the
curve fit procedure for each data set being analyzed.
1. From the EasyDat a gr aph scr een, select
then choose one of the four displayed curve fits.
Linear Fit – This fit is calculated in the form y = a*x + b.
Values for a, b, and a curve fit correlation R are
calculated and displayed.
Quadra tic Fit – This fit is calculated in the form
y = a*x^2 + b*x + c. Values for a, b, and c are calculated
and displayed. A minimum of 3 data points is required.
Power Fit – This fit is calculated in the form y = a*x^b.
Values for a and b are calculated and
displayed. A minimum of 2 data points is
required and all data points must be
positive, non-zero values.
Exponential Fit – Th is fit is ca lc ulated in
the form
y = a*e^(-b*x). Values for a and b are
calculated and displayed. A minimum of 2
data points is required and all Y-axis data
must be positive, non-z ero values.
2. The curv e fit c alc ulation is performed and the curve-fit
coeffici ents are displayed. Select
graph screen.
to return to the
, and
EasyData Guidebook 39
Page 41

3. EasyData di spl ay s the c urve fit drawn over the original
data points. Scroll through the collected data points on
the graph screen using the
To move the trace cursor to the curve fit, press
The cursor can now be moved along t he c urve fit.
and keys.
or .
40 EasyData Guidebook
Page 42

Select Region
The Select Region feature is used to isolate a specific and continuous region of a data set.
Data outside of the selected region is permanently delet ed. The selected region is copi ed
from the calculator’s data lists, all list are cl ear ed of data, and then the selected data is
copied back into the lists. Once this feature is used, the data out side your selection is
permanently deleted. It may be wise to use the Save As option from the
performi ng a Select Region.
1. From the EasyDat a gr aph scr een, select
then choose Select Region.
Note: Selecti ng a regi on of dat a c auses the deletion of
all data outside of t he r egion sel ected.
, and
2. Scroll through the collected data points on the graph
screen using the
left boundary of the dat a to be sel ec ted and select
A vertical line representing the left boundary marker is
displayed.
3. Mov e the cur sor to the right boundary of the data to be
selected and select
4. The graph screen is displayed with the selected region of
data. When data analy sis is finished, select
return to the main screen.
and keys. Move the cursor to the
.
.
to
menu before
EasyData Guidebook 41
Page 43

Managing Da ta: Savi ng, Op e ning an d Dele ting
Experiments
Using EasyData it is possible to save your experimental setup along with any
collected data, for later use. When an experiment is saved it includes the current
sensor cali brations, data- collection parameters, a nd any data that had been
collected.
Saved experiments are easy to open and help to save time when repeating
experiments. Calculator memory does have limitations and it is advisable to
routinel y del e te unnecessar y ex p er i ment fi l es. The EasyData applicatio n has be en
designed to allow a maximum of 50 saved experiment files.
Saving an Experiment
1. Select , and then select Save As….
2. Using the calculator keypad, enter a name f or the
saved experiment. The experiment name can include
both letters and numbers, but must be no longer than 8
characters and cannot begin with a numeral.
3. Select
to save the experim ent
42 EasyData Guidebook
Page 44

Opening an Experiment
1. Select , and then select Open….
2. The Open Experiment screen is displayed. Sel ect the
experiment to be opened and t hen select
3. The experiment is opened and you are returned to t he
main screen.
.
Deleting an Experiment
1. Select , and then select Delete….
2. The Del ete Experiment screen is displayed. S elec t t he
experiment to be delet ed and then select
3. A message appear s aski ng if you are sure you want to
delete the experiment. Select
experiment and return to the main screen.
to delete the
.
EasyData Guidebook 43
Page 45

Editing a Sensor ’s Calib ra tion
When EasyData detects a senso r, it auto m atically loads a calibr ati o n for that
sensor. If you wish to edit a sensor’s calibration, you can do so by manually
entering new calibration values or by using either a single-point or two-point
calibration procedur e.
Manually Inputting a New Calibration
1. From the EasyDat a m ain screen, select , and
then select CH1: (or the appropriate channel) .
2. Select
3. Select
calibration methods.
4. Select Manual Entry….
5. The slope f or the current calibration is display ed. Press
slope value and select
.
. A menu is displayed showing the different
to erase the display ed v alue. Type in your new
.
44 EasyData Guidebook
Page 46

6. The intercept for the current calibration is displayed.
Press
new intercept value and select
7. Select
again to return to the mai n screen.
to erase the display ed v alue. Type in your
.
from the Sensor Calibration screen. Select
EasyData Guidebook 45
Page 47
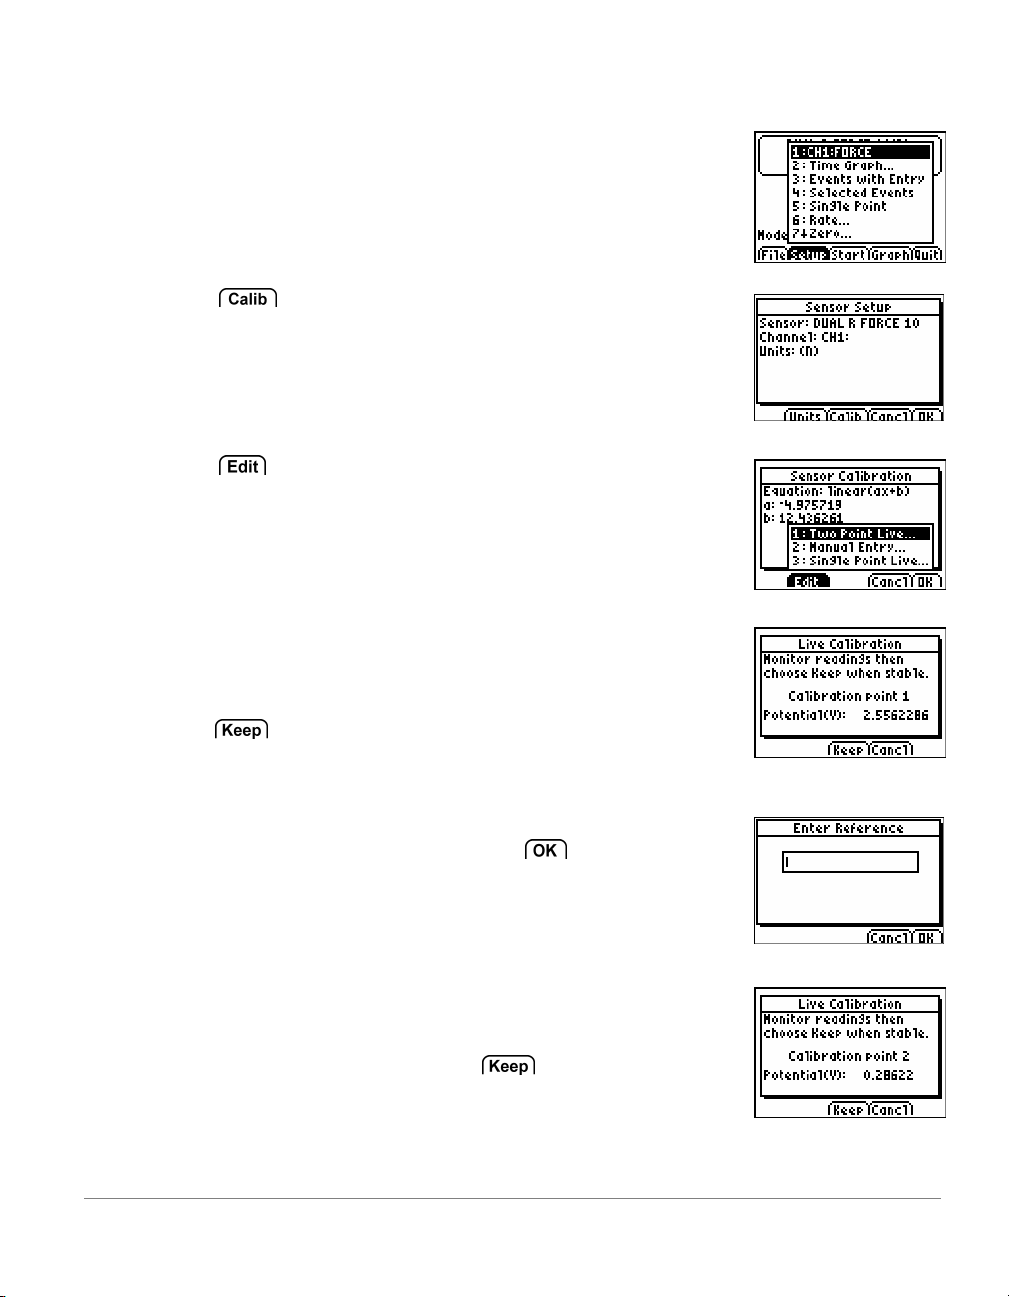
Creating a New Calibration using Two Points
1. From the EasyDat a m ain screen, select Setup, and
then select CH1: (or the appropriate channel) .
2. Select
3. Select
calibration methods.
4. Select Two Point Live….
5. Plac e y our sensor into the necessary condition for the
first calibration point (e.g. a force sensor with no mass
hanging from it or a pH sensor in a pH buff er ) . Monitor
the displayed Potential (V). When the value is stable,
select
6. Enter the known value for the first calibration condition
(e.g. “0” for a force of zer o N), and sel ec t
7. Plac e y our sensor into the necessary condition for the
second calibration point (e.g. a force sensor with a 200
g mass hanging from it). Monitor the displayed Potenti al
(V). When the value is stabl e, select
from the Sensor Setup screen.
. A menu is displayed showing the different
.
.
.
46 EasyData Guidebook
Page 48

8. Enter the known value for the second cali br ation
condition (e. g. 1. 96 N for a 200 g mass), and select
.
9. The Sensor Cal ibration screen will be display ed with
your new calibration slope and intercept values. Selec t
to return to the Sensor Setup screen, and then
select
again to return the main screen.
EasyData Guidebook 47
Page 49

Creating a New Calibration using a Single Point
This calibration method defines a new y-intercept, leaving the existing slope unchanged.
Adjusting a barometer to match the local barometric pressure is a good example of using
the Single Point calibration. The example below is using a force sensor connected to a
LabPro.
1. From the EasyDat a m ain screen, select Setup, and
then select CH1: (or the appropriate channel) .
2. Select
3. Select
calibration methods.
4. Select Single Point Live….
5. Plac e y our sensor into the necessary condition for the
calibration point (e.g. a force sensor with a known mass
hanging from it). Monitor the displayed Potenti al ( V).
When the value is stable, sel ec t
6. Enter the known value for the calibration condition (e.g.
1.96 N for a 200 g mass), and select
48 EasyData Guidebook
from the Sensor Setup screen.
. A menu is displayed showing the different
.
.
Page 50

7. The Sensor Cal ibration screen will be display ed with
your new calibration slope and intercept values. Selec t
to return to the Sensor Setup screen, and then
select
again to return to the main scr een.
EasyData Guidebook 49
Page 51

Manually Settin g up a Sens or
When using a non Auto-ID sensor, it i s necessary to set up the se nsor man u ally
before data can be collected. The procedure for setting up a sensor is slightly
different depending on the type of connector found on the sensor. Analog sensors
(most sensors) connect to one of the analog ports found on the left side of the
LabPro or CBL 2, or to the EasyLink. Digital sensors (photogates and drop
counters) con nect to the digital por ts found on the right si de o f th e Lab Pro or
CBL 2. Follow the appr o pr i at e di r ecti o ns below to manually set up a s ensor.
Analog Sensors
1. From the EasyDat a m ain screen, select , and
then select Other Sensors....
2. The Select Sensor screen is displayed. Choose
Custom Se ns or, and then select
3. Raw Voltage is displayed as the default sensor setup.
Select
to edit the sensor setup.
.
50 EasyData Guidebook
Page 52

4. Press to clear the long sensor name. Type in
the name of the custom sensor, then sel ec t
Press
the short name of the custom sensor, t hen sel ec t
Press
measurement for t he c ustom sensor, t hen sel ec t
5. If the sensor requi r es a special warm-up period, press
new value, then select
about a warm-up tim e, ent er a val ue of 1.
6. The Di spl ay ed Decimal Places screen is displayed.
Choose the number of decim al plac es to display sensor
readings, then selec t
7. From the Sensor Signal Type screen, choose the type
of sensor being set up and then select
most sensors are 0-5 Vol t.
to clear the short sensor nam e. T y pe in
to clear the sensor unit. Type in the unit of
to clear the old warm-up time and type in the
. Note: if you are unsure
.
. Note:
.
.
EasyData Guidebook 51
Page 53

8. From the Conversion Equation screen, c hoose the type
of calibrati on equation to be used and then select
. Note: most sensors use a linear calibration
equation.
9. The Sensor Set up scr een is displayed with updated
informati on pert aining to the custom sensor. Select
to return to the main screen.
Digital Sensors
1. From the EasyDat a m ain screen, select , and
then select Other Sensors....
2. The Select Channel screen is displayed. Choose
DIG/SONIC, and then select
3. The Select Sensor screen is displayed. Choose ei ther
Photogate or Drop Coun ter, and then select
The main screen is displ ay ed with updated information
pertaining to the custom sensor.
.
.
52 EasyData Guidebook
Page 54

Data Collectio n Trigg eri ng
In most cases, data collection is initiated by selecting
set up trigger ing . There are two methods of triggering available, (1) software
trigger and (2) manual trigger. Triggering can only be set when collecting data with
a LabPro, CBL 2, CBR, or CBR 2. The EasyLink and EasyTemp do not support
triggering.
Software Triggering
In software tri gger ing, you choose a measurement reading t hat will trigger data collection,
e.g. when the temperature is increasing and reaches a v alue of 28°C. Follow these steps to
set up a software trigger.
. Another opti on is to
1. From the EasyDat a m ain screen, select
then select Time Graph...
2. The current Time Graph settings are displayed. Select
.
3. The Select Trigger Type screen is displayed. Choose
the appropriate channel, e.g. CH1, and select
, and
.
EasyData Guidebook 53
Page 55

4. The Measurement screen is displayed. Choose whether
triggering shoul d oc c ur when the readings increase or
decrease (Increasing or Decreasing), and select
5. The Tri gger Threshold screen is displayed. Press
to clear the old threshold and type in the new
value, then select
sensor reading, e.g. 28 for 28°C, that will trigger data
collection.
6. The Tri gger P restore screen is displayed. Press
to clear the old prestor e and type in the new value, then
select
all data collect ed before the trigger level is reached,
e.g. 10 for 10%.
7. The updated Time Graph Settings are displayed. S elect
to return to the main screen.
8. EasyData i s now set for triggering. When
selected, data c ollec tion will not begin until the set
trigger value is met
.
. Note: trigger prestore is the percentage of
. Note: trigger threshold is the
is
.
54 EasyData Guidebook
Page 56

Manual Triggering
In manual triggering, data collection starts when the Start/Stop or Trigger button on the
data-collection device (LabPro, CBL 2, CBR, or CBR 2) is pressed. Follow these steps to
set up for manual trigger .
1. From the EasyDat a m ain screen, select
then select Time Graph...
2. The current Time Graph settings are displayed. Select
.
3. The Select Trigger Type screen is displayed. Choose
Manual and select
4. The updated Time Graph Settings are displayed. S elect
to return to the main screen.
5. EasyData i s now set for triggering. Select
follow the on-screen i nstr uc tions when you are ready to
start data coll ection.
EasyData Guidebook 55
.
, and
and
Page 57

Appendix A:
Frequen tly Ask ed Qu esti on s (EasyDa ta FAQs)
Q: May I disconnect a data collection devi ce during data collection safely?
A: No, di sconnecting a data collecti on dev ic e such as CBR 2™ sonic m otion det ec tor, CBL
2™ system, or Vernier E asyT em p™ will r esul t in loss of c ollected data using EasyData App.
Q: What is the recommended amount of calcul ator RAM mem or y for use with the E asyDat a
App.
A: TI and V er nier recommend that you have at least 5000 bytes of fr ee RAM in your
calculator
Q: Can EasyData App be transferred between calc ulators?
A: EasyData can be t ransferred between TI-84 family calculators and TI-83 Pl us calculators.
EasyData can not be transferred to TI-89s, TI-73s, TI- 86, TI- 83, TI-82, Voyage 200, TI-92, TI92 Plus.
Q: What Vernier sensors am I unable to use with EasyData and CBL 2 and LabPro?
A: Blood pr essure, Rotary Motion, Radi ation
Q: What Vernier sensors am I unable to use with EasyData and the E asyLink interface?
A: Blood pr essure, Rotary Motion, Radi ation, Microphone, CO2, Photogate
Q: Can I capture screen shots of EasyData App using TI Connec t soft ware or T I-Navigator?
A: Yes, but only when the App is not actively collecting data (while monitoring on the
EasyData main screen, or during a real-time graph or active data collection).
Q: Why when I select one point for statistics calculations, does it calculate with two points?
A: The select region and statistics feat ur es will select 2 points even if you chose the same
point for the left and right boundaries. If you choose a point previous to t he last point, the
feature will add the point immediately to the right. If you choose the last point, the feature will
add the point immediately to the left.
56 EasyData Guidebook
Page 58

Q: Why will Photogate Auto-ID with LabPr o and not with CBL 2?
A: The firmware of LabPro will allow this to occur and the firmware for CBL 2 will not. With
CBL 2, you may set up the photogat e sensor i n the Other Sensors menu.
Q: I am trying to use TI Connect for Mac® to view my calculator direc tory while I am
connected to a sensor and in EasyDat a A pp, why am I not able to view the calculator
directory?
A: The calculator can only communicat e with one devic e at a time. So, while connected to a
sensor and actively reading data, and while you are in the App, y ou c an not view the
calculator directory. Also, you may have to restart TI Connect f or M ac to vi ew the calc ulator
directory after leaving the App. With that being said, when the App i s not activ ely c ollec ting
data while monitoring on the EasyData main screen, or during a real-time graph or active data
collection, y ou can capt ure a screenshot.
Q: Why won’t my calculator respond to any key presses?
A: Under cert ain conditions the application may appear to be locked up and stop responding
to any key presses. The cal c ulator is stuck in a failed attempt to comm unic ate with a datacollection device. Press
Q: Why does EasyData miss my key presses?
a few times to get the device out of thi s sit uation.
A: The calculator operating system will miss quick key presses if it is buys communicati ng
with a data-collection device. With more active communication comes the increased lik elihood
of missed key presses, particularly if the key is quickly pressed and released. Press and
briefly hold t he key down until the expected action occurs.
Q: Can EasyData communicate with multi ple data-collection devices simult aneousl y ?
A: No. Whenever EasyData first starts, it scans f or devi c es connected to the USB port (if a
USB port is present). If nothing is found it then scans for devic es connected to the I/O port.
EasyData will always find the device connected through the USB port first.
Q: Why aren’t all data-collecti on modes available for all sensors?
A: Not all m odes are c om patible with every sensor. Only the modes that ar e compati ble with
the detected sensor will appear.
EasyData Guidebook 57
Page 59

Q: Why can’t I calibrate my sensor?
A: Not all sensors can be calibrated using the same calibration routine. The available
calibration modes are determined by the detected sensor.
Q: Why does my calculator use up batteries so quickly?
A: The calculator is using battery power any time it is turned on. An application such as
EasyData puts an added load on the batteries when it communicates wit h a c onnec ted datacollection device. USB devices like the EasyTemp and EasyLink draw all of their power from
the calculat or ’s bat teries. In addition, there are some sensors that put an even greater strain
on the batteries.
Q: Why doesn’t EasyData work with my CBR 2?
A: W hen used with a TI -83 Plus or TI-84 Plus calculator, t he CB R and CBR 2 must be
powered by a strong set of batt eri es. If y ou ar e ex periencing problems, replace the batteries in
the CBR or CBR 2.
Q: Why doesn’t EasyData automatically launch when I connect my EasyTemp or EasyLink?
A: Connecting a USB data-collecti on dev ic e will only start E asyDat a if the calculator in on the
home screen.
Q: Why isn’t my salinity sensor working with EasyDat a and an E asyLink?
A: Som e older V ernier Salinity Sensors may not be properly identified by EasyData. To avoid
this problem, star t EasyData and wait until the main screen appears before connecting the
sensor.
Q: Why does my calculator turn off while I am running EasyData?
A: In order to prolong the life of the calculator batteries, EasyData will aut om atically power
down (APD) the calc ulator in times of inactivity. If no keys are pressed and data col lection is
not currently active, the calculator with APD after appr oximately 5 minutes. The cal c ulator will
never be allowed to APD during Two Point Calibrations, Event s wit h E ntry and Sel ected
Events data collec tion, Zeroing or when waiting for a Trigger or digital event.
58 EasyData Guidebook
Page 60

Appendix B: Error Messages
The table below has been included to provide a helpful explanation of the error
messages that may be encountered while using EasyData.
Message Description
The calculat or batteries are too low to safely run
EasyData.
Select
batteries before starting the EasyData app agai n.
The application failed in attempting to communi c ate
with the connected data-collection device.
Make sure all cabl es are proper ly connected and the
data-collection device has power.
Selecting
erase all settings, data, and search for an interface.
The default or request ed plot cannot be shown
because one or more of the lists involved is empty or
the lists involved ar e of dif ferent lengths. All involved
lists must cont ain at least a single data point and be of
the same length.
Collect some data, fill the lists with data outside of
EasyData, or load data from a saved experiment.
to return to the home screen. Replace the
will exit EasyData. Selecting will
The calculat or could not establish a valid connection
to a data-coll ecti on dev ice.
Make sure all cabl es are proper ly connected and the
data-collection device has power, then select
EasyData Guidebook 59
Selecting
will start t he applic ation with no interface connect ed.
will exit EasyData. Selecting
.
Page 61

Message Description
The application enc ountered an error while performing
the requested calculation. Some common reasons for
this error:
A Power curve fit was perf ormed, but not all x and y
values are greater than zero.
An Exponential c urve fit was performed, but not all y
values are greater than zero.
A two-point calibr ation was performed, but the
reference enter ed or m easured voltage was invalid.
Perform the calibration again, making sure the
reference and voltage values are distinct.
A statistics or i ntegr al c alculation resulted in a divide
by zero error. Coll ec t anot her data set and repeat the
calculation.
Either the connected data collection device or sensor
is not supported by EasyData, or the sensor
combination is invalid.
EasyData cannot perform the selected analysis
feature based on the displayed graph.
Select
only a single dependent variable on the Y-axis, then
60 EasyData Guidebook
attempt the anal y si s again.
A minimum of 1600 bytes of free RAM i s required to
start the EasyData application.
Select
deleting or archiving programs, lists, matri c es, and
other calculator variables before restart ing the
application.
or to displ ay a graph which shows
to exit EasyData. Free up RAM by
Page 62
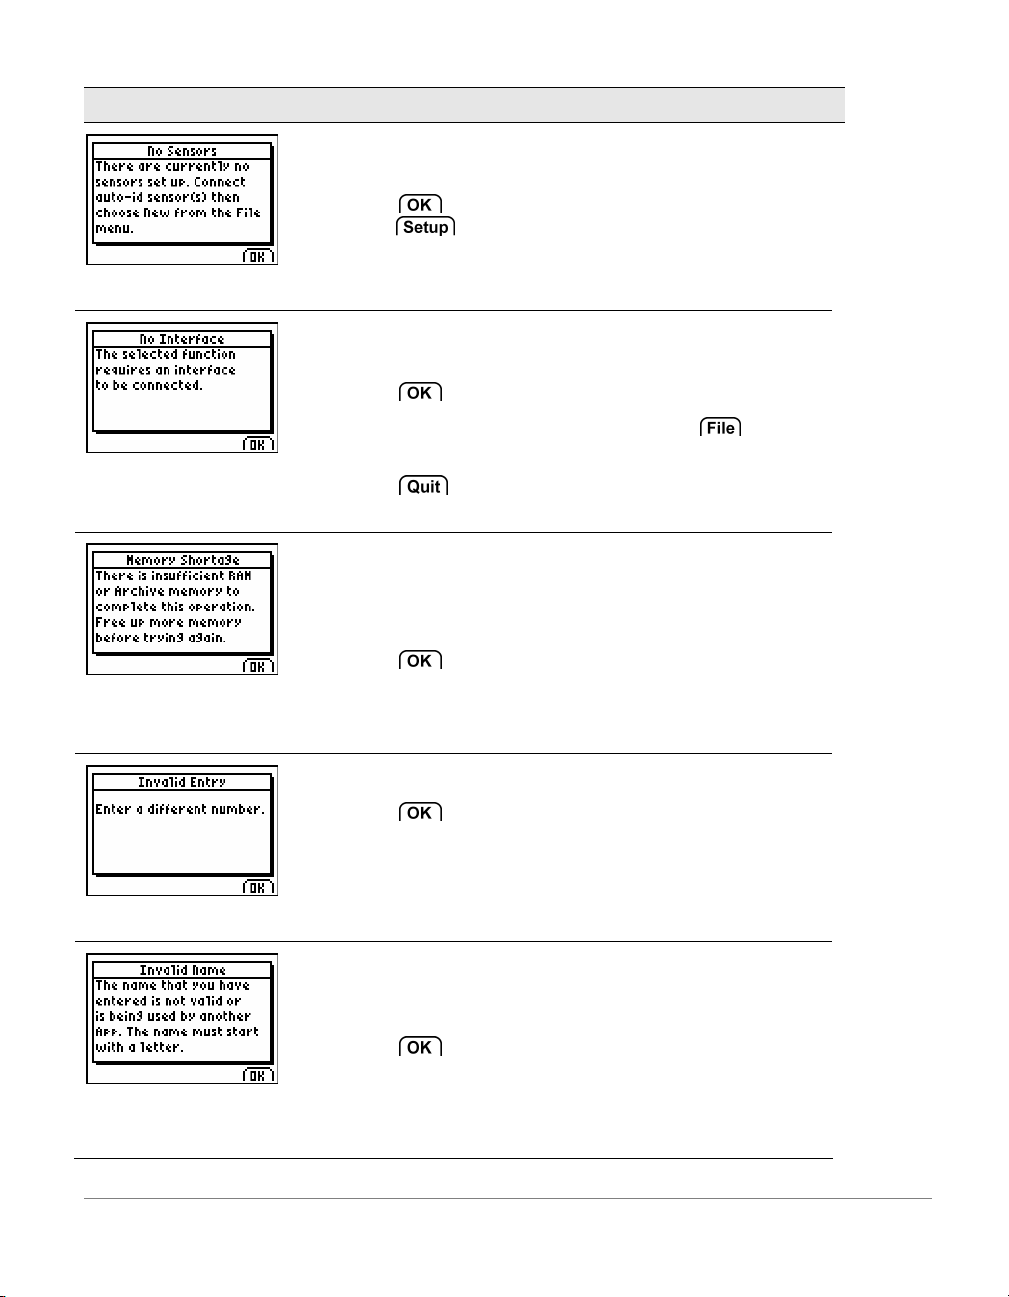
Message Description
EasyData cannot perform the selected operati on
unless a sensor is set up.
Select
select
sensor manually.
EasyData cannot perform the selected operati on
unless a data-collection device is connected.
Select
Connect a data-collection device. Select
choose New.
Select
collection device and then restart EasyData.
There is insufficient calculator memory av ail able to
complete the requested oper ation. Managing
experiment files uses free archive memory and/or
RAM.
Select
deleting lists, matrices, and other calculator variables.
Free up Archive by deleting other applications. Restart
EasyData when memor y has been f r eed up.
The number entered is i nv alid.
and either connect an Auto-ID sensor or
and choose Other Sensors to set up a
and perform one of the f ollowing:
and
to exit EasyData. Connect a data-
to exit EasyData. Free up RAM by
Select
and enter a valid number.
Experiment names m ust start with a letter and cannot
share a name with an existing file (appVar) that was
created by another application.
Select
EasyData Guidebook 61
name.
and enter a different, valid experiment
Page 63

Message Description
The requested analysi s feature requires more data
points than are available in the plotted lists. Quadr atic
curve fits require a minimum of 3 data points. All other
analysis features require a minimum of 2 data points.
Select
repeating anal y sis.
There are 50 experiments already saved on the
calculator.
Select
choose Delete... Select old experiments to delete
before attempting to save an experiment again.
The Select Region, Statistics, and Integral func tion
cannot be performed on data collected using the
Events with Entry data-collection mode. These
functions require well-ordered, independent data to
succeed.
and collect more data points before
. From the main screen, sel ec t and
The Store Run feature is not av ailable when there is
more than one sensor or the connect ed sen sor is in a
channel other t han CH1.
Advanced tri ggering features are only available when
using a LabPro, CBL 2, CBR or CBR 2.
62 EasyData Guidebook
Page 64
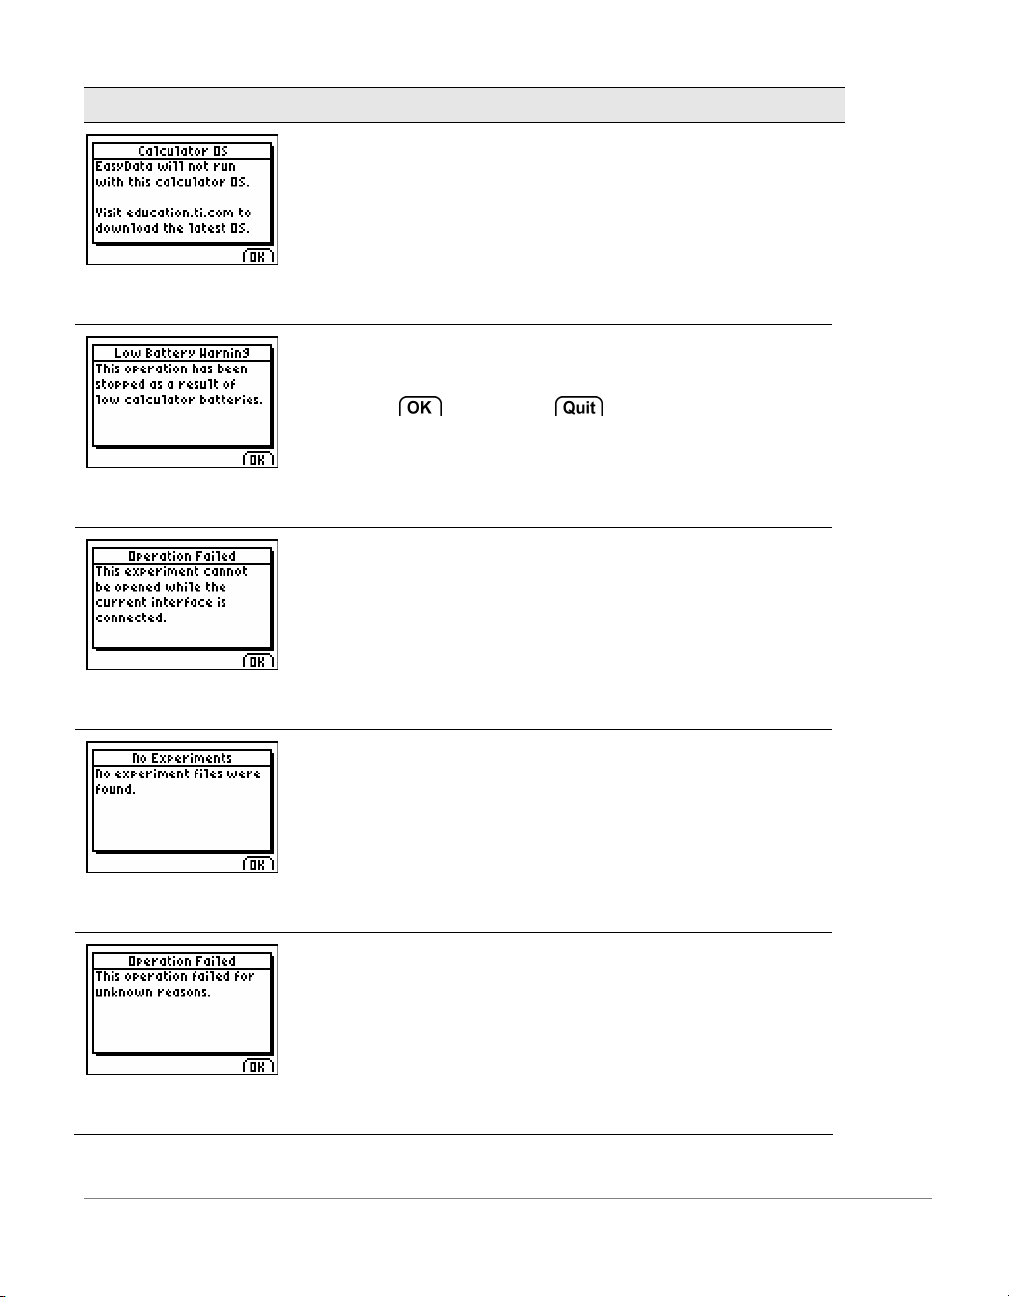
Message Description
The minimum calculat or OS that will support EasyData
is TI-84 Plus OS 2.30 or TI-83 Pl us OS 1.16.
For the latest calculator OS updates, visit
education.ti.com.
The calculat or or CB R 2 batt eri es are t oo low to
continue. All data collected has been preserved.
Select
Replace the batteries in your data-collection dev ic e
and then restart EasyData.
The selected experiment was saved using a datacollection device different than the connected dev ice
and the file cannot be safely opened.
Connect the appropriate device or no device at all,
and then try to open the experiment again.
No experiment files were found in calculator memory.
Save files to the calculator, or transfer files fr om
another calculator before trying to open experiments.
, then select from the main screen.
The selected experiment failed to open due to data
corruption.
Delete the corrupted experiment from calculat or
memory to prevent future problems.
EasyData Guidebook 63
Page 65

Appendix C: Wa rnin g Mes sa ges
The table below explains the purpose and meaning of messages that may
be encountered while using EasyData.
Message Description
A new Auto-ID sensor has been detected.
Select
scan for new sensors.
Select
preserving all existing data and setup informati on.
The application has stored all collected data in the
calculator lists shown.
Select
Selecting
screen.
The Select Region func tion deletes all data outside of
the area selected. All data lists will be affected.
Select
Select
delete all data out si de the selec tion.
EasyData has detected ex isting data which will be
overwritten by the requested data collection.
Select
preserve the data.
Select
to delete all setup inf ormation, data, and
to add the detected sensor while
to exit EasyData.
to return to the EasyData main
to abort this function and preserve data.
to perform the Selec t Region function and
to return to the main screen and
to continue and ov erwrite existing data.
Existing data has been detected and will be
overwritten by the requested data collection. Stor ed
data runs will be preserved.
Select
64 EasyData Guidebook
preserve the data.
Select
to return to the main screen and
to begin and overwri te data not stored.
Page 66

Message Description
The sample interval or # of samples entered is not
supported by the current hardware/software
combination. The closest, ac c eptable value has been
substituted.
Either the connected data collection device or
calculator is running low on batteries. It is
recommended that the batteries be replaced.
Select
loss of data may result.
Select
before restar ting EasyData.
There is less than 5000 bytes of free RAM available to
store data.
Select
the risk of not collecting all requested data points.
Select
to exit EasyData and free up more RAM.
The calculat or and connected data-collection device
do not share a remote data c ollec tion configuration.
When remote or long-term data collection is started,
EasyData assigns a unique ID to both devices. Only
the calculat or and data-collection device that share t he
same ID can be used to retrieve the data.
to ignore this warning and c ontinue. A
to exit EasyData. Repl ac e the bat teries
to proceed with data collection and run
to return to the main screen. S elect
Select
Collected data will be erased.
Select
to the correct data-collection device and restart
EasyData.
The sensor currently connected consumes batter y
power at a higher rate than most sensors.
to ignore the coll ect ed data and continue.
to quit EasyData. Connec t the calculator
EasyData Guidebook 65
Page 67

Message Description
The experiment name entered already is in use.
Select
Select
the new file.
and enter a different experiment name.
to overwrite the existing experiment with
Select
Select to permanently delete the experiment file.
Select
return to the main screen.
to return to the main screen.
to preserve the selected experiment and
An experiment file was f ound in the calculator RAM.
This may be the result of limited archive memory.
EasyData experiments must be in the calculator’s
archived memory to be properly opened.
Select
Select
file to archive memory before restarting EasyData.
Make room in memory as necessary.
The connected data- c ollection device has completed
the requested remote or long-term data collecti on.
to delete the experim ent and continue.
to exit EasyData. Move the experiment
Select
EasyData. Collected data will be erased.
Select
The current data-collection device is currentl y
collecting or c onfigured to collect remote or long-t erm
data. Interfac e st atus and elapsed time are displayed.
Select
already coll ect ed data.
Select
data-collection device. Collected dat a is del eted.
Select
collection. Restar t once data collection has finished.
to ignore the data and continue running
to retrieve the data to the calculator.
to halt data collection and retrieve
to stop data collection and reset the
to quit Easydata and conti nue data
66 EasyData Guidebook
 Loading...