

Page 1
Data Pro
Data Collection using PALM OS Devices,
™
Guidebook
Vernier Sensors, and LabPro
Version 03/31/05
Vernier
Beaverton,
Software & Technology
13979 S.W. Millikan Way
Oregon 97005-2886
(503) 277-2299
Toll-free (888)837-6437
www.vernier.com
info@vernier.com
Page 2

Data Pro Guidebook 2002-2005 Vernier Software & Technology. All
rights reserved. You are entitled to reproduce parts of this book for use in
your school only. No part of this book may be used or reproduced in any
other manner without written permission of Vernier Software except in the
case of brief quotations embodied in critical articles or reviews.
Vernier LabPro and Logger Pro are registered trademarks of Vernier
Software & Technology in the United States of America. PalmOne, Zire,
and Tungsten ar e trademarks of palmOne, Inc. Palm OS a nd HotSync are
registered trademarks of PalmSource, Inc. Data Pro and Graphical Analysis
are copyrighted by Vernier Software & Technology. The term Macintosh is
a registered trademark of Apple Computer, Inc. Windows is registered
trademark of Microsoft Corporation.
Published by
Vernier Software & Technology
13979 S.W. Millikan Way
Beaverton, Oregon 97005-2886
(503) 277-2299
FAX (503) 277-2440
www.vernier.com
info@vernier.com
First Edition 2002
Fifth Printing
Printed in the United States of America
Page 3

Data Pro Guidebook
Table of Contents
Data Pro Guidebook ...........................................................................................3
Introduction.........................................................................................................3
Required Equipment and Supported Palm OS devices............................................................................... 3
Connect Equipment and Load Data Pro onto your Palm OS Device..............4
Install Data Pro Software on your Palm OS device.................................................................................... 4
Tips and Troubleshooting for Data Pro Installation......................................................................... 4
Connect the Equipment............................................................................................................................... 5
Provide Power to LabPro............................................................................................................................ 6
Data Pro Tutorials...............................................................................................6
Overview.......................................................................................................................................... 6
LabPro Tutorial 1: Temperature Measurement with Data Pro ........................7
LabPro Tutorial 2: Non Auto-ID Sensor and Selected Events Mode..............9
LabPro Tutorial 3: Events with Entry and Boyle’s Law................................11
LabPro Tutorial 4: Collect Motion Data..........................................................13
LabPro Tutorial 5: Data Pro as a Stand-Alone Graphing Program..............15
The Data Pro Program in Detail.......................................................................17
Overview.................................................................................................................................................. 17
QUICK START........................................................................................................................................ 17
THE Data Pro Menu................................................................................................................................. 18
THE START OPTION............................................................................................................................. 19
THE SETUP OPTION ............................................................................................................................. 20
Sensors........................................................................................................................................... 20
Data Collection Modes................................................................................................................... 20
Modes Unique to Specific Digital Sensors (Photogate, Radiation Monitor, Drop Counter).......... 24
Calibration of Sensors.................................................................................................................... 25
THE GRAPH OPTION............................................................................................................................ 26
THE ANALYZE OPTION....................................................................................................................... 31
The quit option ......................................................................................................................................... 32
Transferring Graphs and Data to Your Computer..........................................33
Printing Directly from your Palm OS Device ..................................................35
Appendix A: Battery and Adapter Information ...............................................37
Appendix B: Vernier Sensors for Data Pro.....................................................39
Appendix C: Support and Service Information..............................................41
Product Support........................................................................................................................................ 41
International Orders.................................................................................................................................. 41
Product Service......................................................................................................................................... 41
Other Vernier Services ............................................................................................................................. 41
Palm Handheld Information...................................................................................................................... 41
Dana by AlphaSmart Information............................................................................................................. 41
Appendix D: Data Pro Troubleshooting Guide...............................................42
Appendix E: Data Pro Sensor Setup Default Settings...................................43
Page 4

Page 5

Introduction
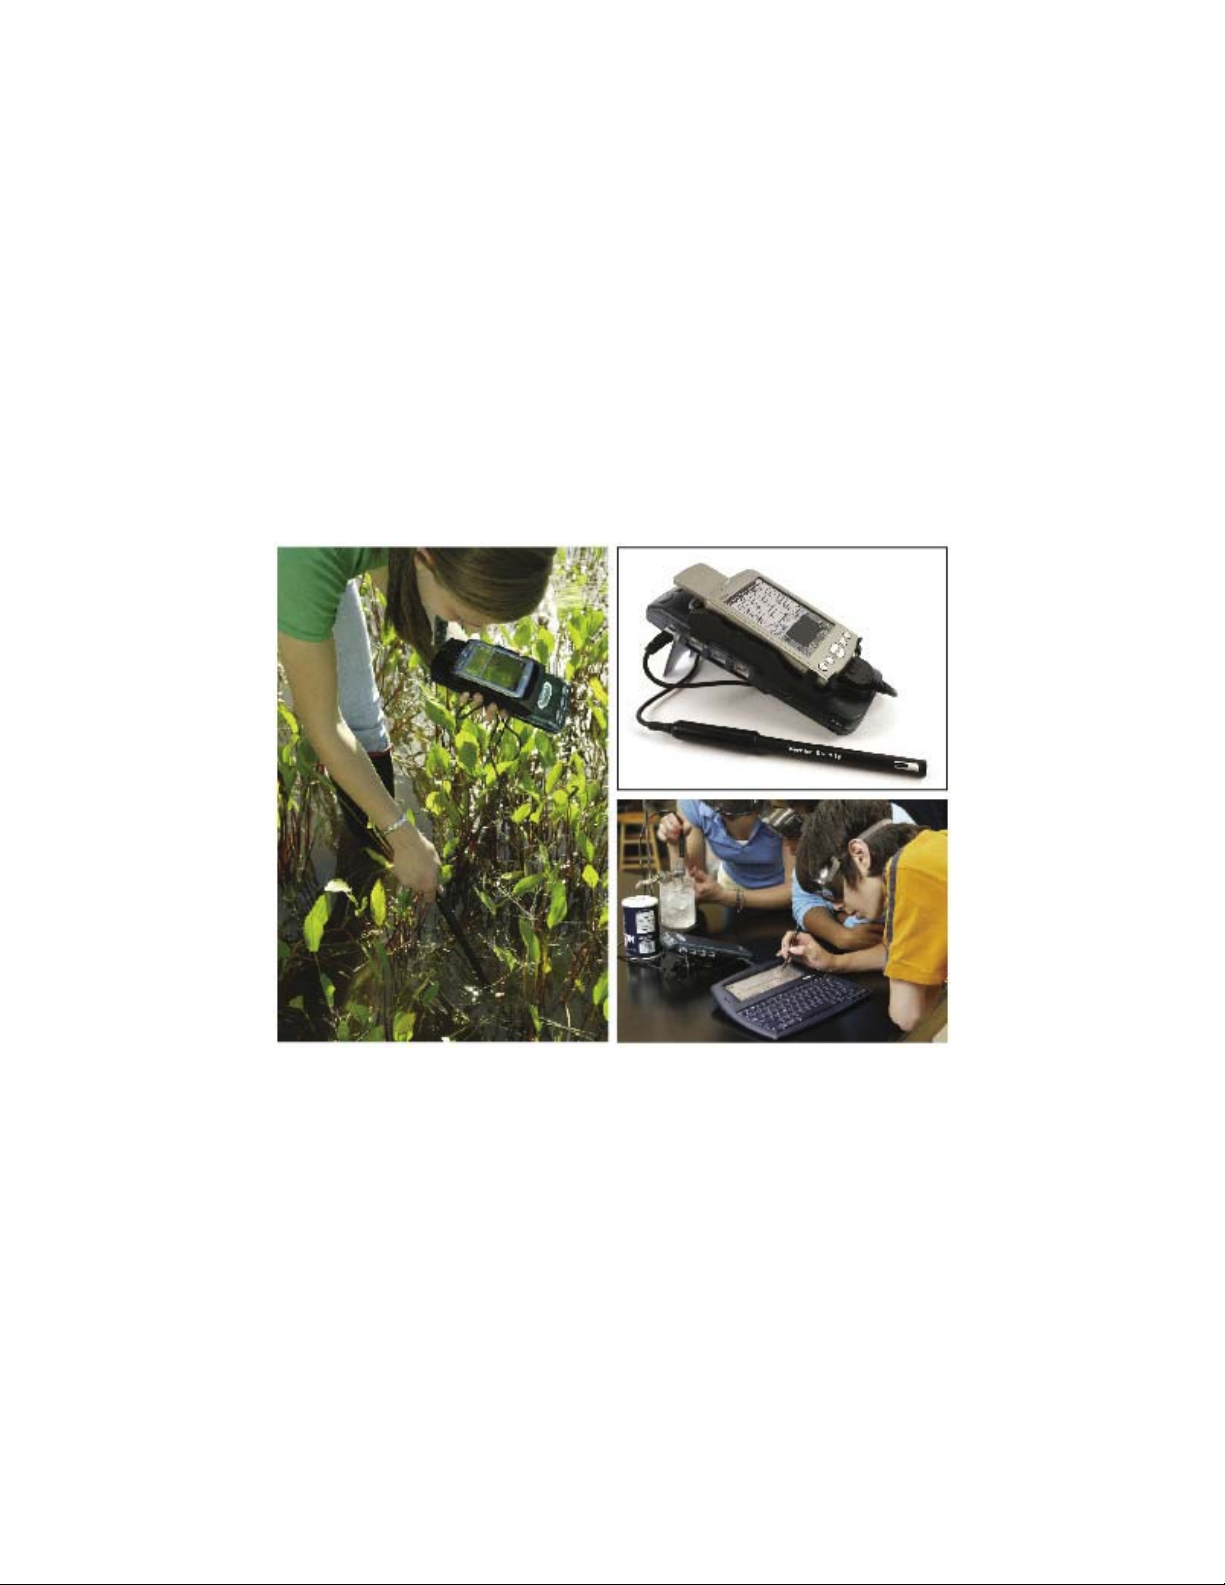
This guidebook provides step-by-step instructions for collecting data using a Palm™
handheld or Dana by AlphaSmart device with LabPro1–a portable data collection device–
and Vernier sensors. The Data Pro software supports all Vernier analog and digital sensors
(except the Rotary Motion Sensor, Blood Pressure monitor, and DCU).
By following this guidebook, you will:
• identify the necessary equipment
• connect the equipment
• load the data collection program, Data Pro, on your Palm OS device
• collect data by following the provided tutorials
REQUIRED EQUIPMENT AND SUPPORTED PALM OS DEVICES
To collect data with a Palm OS® device and a LabPro, the following materials are needed:
• Palm OS Device, Palm OS 4.0 or newer recommended:
− palmOne Universal-connector handheld: m125, m130, m500, m505, or m515
− palmOne OS5 Universal-connector handheld: Zire 71, Tungsten T, Tungsten T2,
Tungsten T3, Tungsten C, Tungsten W, Garmin iQue 3200/3600
− palmOne Multi-connector handheld: Tungsten T5
− Dana by AlphaSmart
• Palm Desktop software (version 4.0 or newer) installed on a Windows or Macintosh
computer
• Palm Handheld Data Collection Package, which includes:
− Data Pro software on CD
− Palm-to-LabPro cable
− Palm-to-LabPro cradle or pouch
Note: The DP-DANA package for Dana includes only the Data Pro software on CD
(the USB cable that is included with either Dana or LabPro is used)
• LabPro System: Includes LabPro interface, AC power supply, LabPro User’s Manual,
Serial and USB cables, and Voltage Probe.
• Vernier Sensors. Sensors can be divided into two basic types—analog and digital.
Examples of analog sensors are Temperature Probes, pH sensors, Force Sensors, etc.
Up to four analog sensors can be connected to LabPro. An example of a digital sensor is
a Motion Detector, Radiation Monitor, Drop Counter, or Photogate. Up to two Motion
1
LabPro can also be used as a calculator or computer interface. Serial and USB cables (to connect LabPro to a
Mac or PC computer) and a calculator link cable are included with LabPro. Further LabPro resources,
LabPro Manual and L abPro Technical Reference Guide, ar e available from Vernier www.vernier.com.
Data Pro 3
Page 6

Detectors or Photogates can be connected to LabPro. It is also possible to use the
Motion Detector with any analog sensor.
Optional (but recommended)
• Four AA batteries for portable data collection.
• Logger Pro or Graphical Analysis (versions 3.1 or newer) software.
Connect Equipment and Load Data Pro onto your Palm OS Device
INSTALL DATA PRO SOFTWARE ON YOUR PALM OS DEVICE
1. Connect a Palm HotSync cradle to your Windows or Macintosh computer, then place
your Palm handheld in the cradle (or simply use a HotSync cable). Turn on your
computer. In the case of Dana by AlphaSmart, simply connect the Dana to your
computer using the USB cable supplied with Dana or LabPro.
2. Perform a HotSync with each Palm OS device into which you wish to install Data Pro.
This step creates a Palm User folder in the Palm Desktop computer software for each
Palm OS device. If you are performing a first HotSync with a new device, you will be
prompted for a username. Give the unit a unique username of up to six characters in
length with no spaces. This simplifies identifying the user folder on the computer.
3. Place the Data Pro CD into the CD-ROM drive.
Windows computers (Windows 95, 98, NT, 2000, ME, or XP)
In many cases, the installation will launch automatically; otherwise, choose
Settings → Control Panel from the Start menu. Double-click on Add/Remove Programs.
Click the Install button in the dialog box.
Macintosh computers (Mac OS 9.1 or newer)
Double-click the Install Data Pro icon on the CD.
4. The Data Pro installers will launch on your computer, and a series of dialog boxes will
step you through the installation. We recommend that you accept the default choices.
When prompted for printer support, select your handheld device (or None).
5. To install Data Pro on your Palm OS device, press the HotSync button on the Palm
cradle or cable (or press the function and sync keys on Dana). Wait for a message on
your device indicating that the process is complete.
6. Check to make sure that Data Pro is correctly installed on your Palm
OS device. Tap the Applications icon on the Palm OS device, and
you should see a Data Pro icon similar to the one shown at the right.
This means you have successfully loaded the Data Pro application
onto your Palm OS device!
Tips and Troubleshooting for Data Pro Installation
1. Did You Install and HotSync Your Current Palm OS Device?
A common error is not to have previously installed Palm Desktop software, or not to have
previously performed a HotSync with the Palm OS device on which you are installing.
4 Data Pro
Page 7

2. Are You Installing Data Pro to Multiple Palm OS devices?
If you have more than one Palm device on which you are installing Data Pro software,
follow the same directions as outlined in the previous section. It is important to have
previously performed a HotSync with each of the Palm devices before running the Data
Pro installer—the HotSync ensures that a user’s folder is created for each of the devices.
When installing Data Pro, a Data Pro folder is created in each of the Palm User folders on
that computer; this way, as you do a HotSync for each Palm device, Data Pro will be
transferred to that Palm device, one at a time.
As an alternative to performing a HotSync with each device, you may beam the necessary
files from one device to another. To do this, however, you must have installed a beaming
utility such as Filez, available from www.palmgear.com, on the sending Palm OS device.
Install Filez, and then beam the following files to the receiving device:
Data Pro
DPsLkUp
DPStrings
Match Pro
MathLib
For Dana users, in addition to the previous five files, you will need to beam the following:
UsbBusDriver.PRC
vUSBLabProDriver.PRC
vUSBPrintDriver.PRC
CONNECT THE EQUIPMENT
Palm Handheld and pouch
1. Insert the bottom end of the LabPro into the top opening of the pouch.
2. Insert the large end of the cable into the lower end of the Palm handheld until it is firmly
in place.
3. Slide the bottom of the Palm handheld into the transparent pocket of the pouch and pull
the elastic band over the top edge of the Palm handheld.
4. Plug the small end of the cable (the serial connector) into the serial socket on the right
side of the LabPro unit.
Palm Handheld and cradle
1. Obtain the black plastic cradle included in this package. Locate the two grooves on either
side of your LabPro interface. Starting at the lower end of the LabPro (with the Vernier
logo), slide the Palm cradle in the grooves of the LabPro until it locks into place.
2. Obtain the Palm-to-LabPro cable included in this package. Insert the flat end of the cable
into the lower end of the Palm handheld until it is firmly in place.
3. Insert the upper end of the Palm handheld under the upper end of the cradle, then press the
lower end of the handheld into the lower end of the cradle, so it fits under the four
latches on the cradle.
4. Plug the small round end of the cable (the serial connector) into the serial socket on the
right side of the LabPro unit.
Data Pro 5
Page 8

AlphaSmart by Dana
1. Obtain the USB cable that is included with either Vernier LabPro or AlphaSmart Dana.
2. Plug the square end of the USB cable (the “B” end) into the USB socket on the right side
of the LabPro unit.
3. Plug the flat end of the USB cable (the “A” end) into the USB socket on the back side of
the Dana unit (labeled as “printer”).
PROVIDE POWER TO LABPRO
Batteries or AC power can power LabPro. To use LabPro with the AC power supply, plug
the round plug on the 6-volt power supply into the side of the interface. Shortly after
plugging the power supply into the outlet, the interface will run through a self-test. You will
notice a series of beeps and blinking lights (red, yellow, then green) indicating a successful
power up. Note: If batteries have previously been installed, this series of beeps and blinking
lights will not occur.
To use LabPro with batteries, remove the battery compartment cover from the underside of
the interface. Insert four alkaline AA batteries and replace the compartment cover. Shortly
after connecting to power, the interface will run through a self-test. You will notice a series
of beeps and blinking lights (red, yellow, then green) indicating a successful power up. If the
self-test is not successful, make sure that the batteries are installed correctly and that they are
still useable.
Data Pro Tutorials
Overview
The tutorials will teach you how to use the Data Pro program. They will explore various data
collection modes using a variety of sensors. There are five tutorials that cover the most
widely used forms of data collection: time graph data collection, Events with Entry data
collection, and using the LabPro as a stand-alone device (without a Palm connected).
• Data Pro can automatically recognize an auto-ID sensor, identify the channel to which it
is connected, load a default experiment appropriate to the sensor, and show the current
reading. It often eliminates the need to go through a sensor setup procedure. This is
covered in Tutorial 1. You will learn how to start Data Pro and deal with possible
problems that may arise. Note: It is important to start with Tutorial 1, as it provides
necessary setup information.
• You may have older sensors that do not have the auto-ID ability. The directions for
setting up older sensors are given in Tutorial 2. You will also learn how to collect data in
the Selected Events mode for any sensors.
• You may not want to take timed data at all. If you wish to record one data point at a
time, Tutorial 3 will guide you through the Events with Entry data-collection mode.
• Tutorial 4 will show you how to set up and collect data with the Motion Detector.
• Perhaps you don’t have a LabPro with you, but want to use Data Pro as a stand-alone
graphing program. Tutorial 5 will show you how this is done.
6 Data Pro
Page 9
LabPro Tutorial 1: Temperature Measurement with Data Pro
A good way to get acquainted with Data Pro is by performing a simple experiment. This
particular tutorial will investigate the response time of a Temperature Probe using the Data
Pro program in Time Graph mode. Just follow the four easy steps and you are on your way
to becoming comfortable with LabPro.
MATERIALS
Palm OS device Vernier Stainless-Steel Temperature Probe
LabPro interface One 250-mL beaker or cup
Data Pro program 100 mL hot water
PROCEDURE
1. Connect the Palm OS device to the LabPro using the interface cable.
2. Plug the Stainless Steel Temperature Probe into Channel 1 of the LabPro.
3. Be sure the LabPro unit is powered (using its AC power supply, or 4 AA batteries).
4. Press the power button on the Palm OS device.
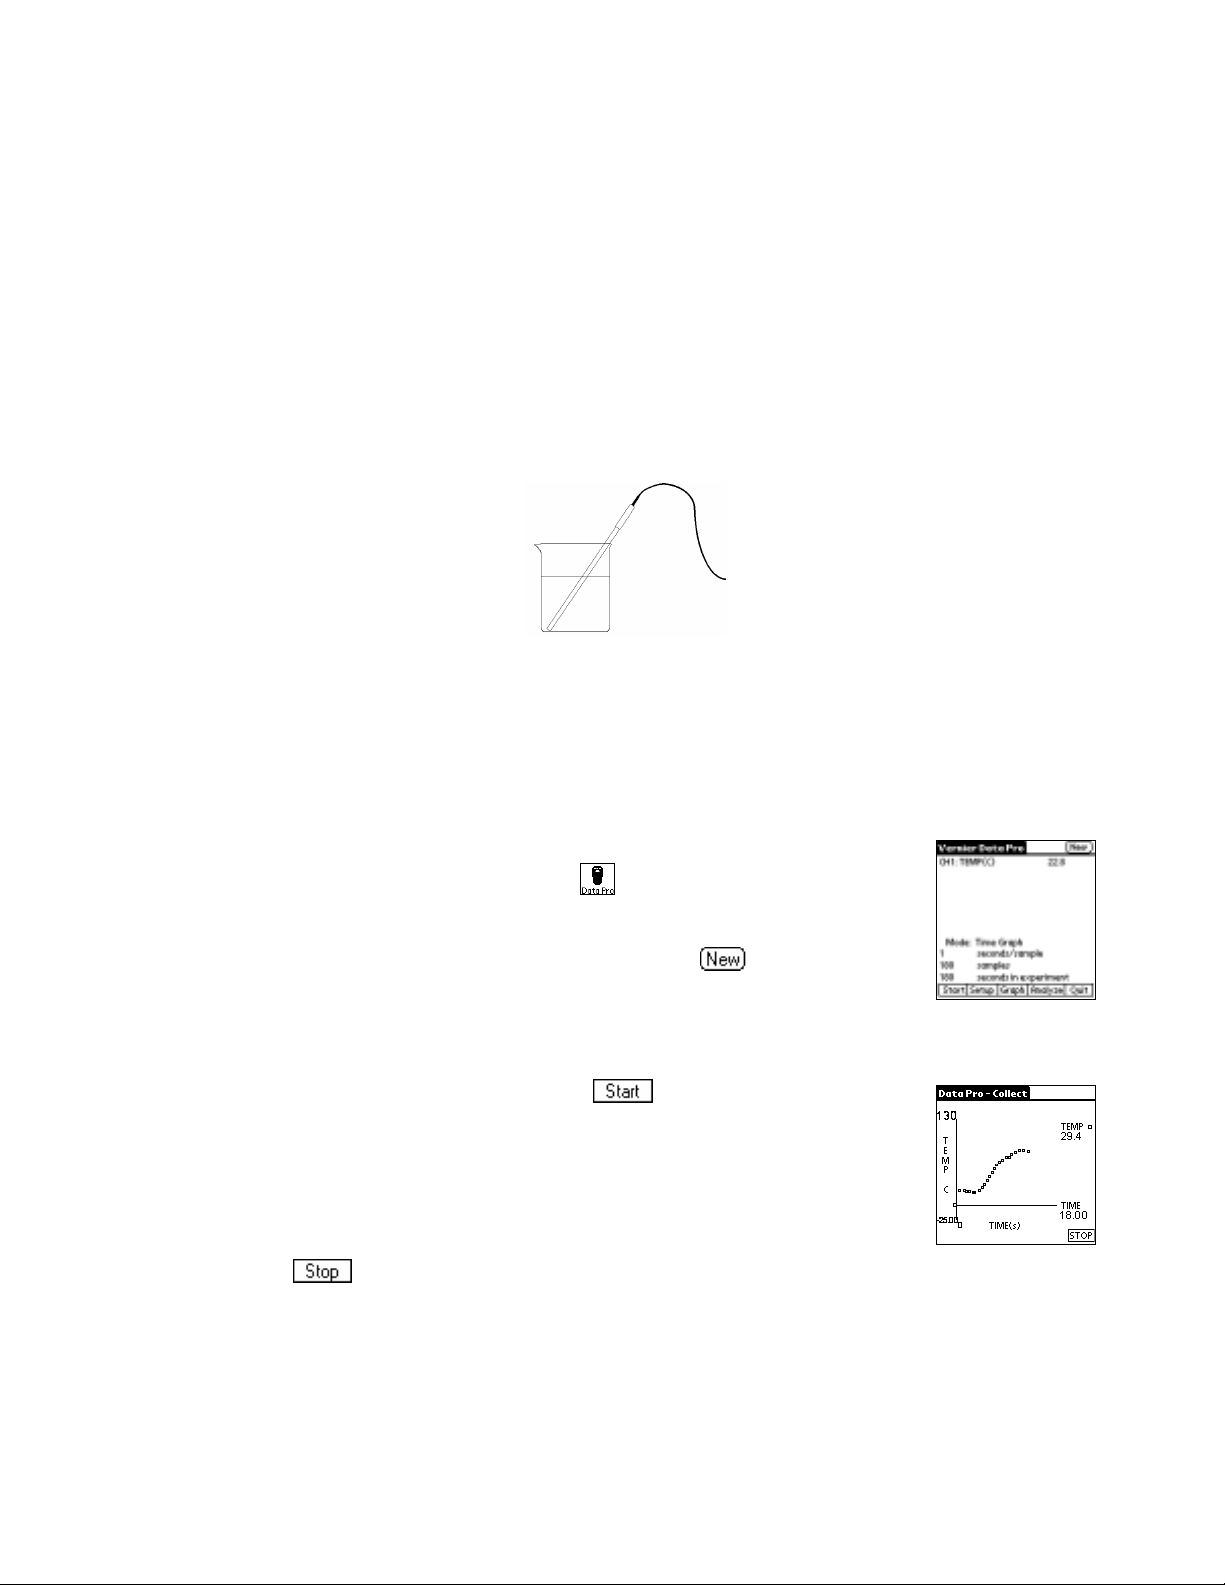
5. To start up the Data Pro program, tap , the Data Pro icon, on the
Applications screen of the Palm OS device.
6. You are now on the Main screen of Data Pro. Tap
to reset the
program. With an auto-ID sensor, Data Pro will identify the sensor and
show correct readings. It also shows the default mode, e.g., Time Graph, and tells the
default data-collection parameters (e.g., 1 second/sample, 180 samples).
7. You are now ready to collect data. Tap
During data collection,
.
you will see the minimum and maximum temperature values displayed
for the y-axis temperature range. In addition, the live reading of the
Temperature probe will be displayed in the upper-right side of the
graph. Wait about five seconds and place the Temperature Probe into
the cup of hot water. Data collection will stop after 180 seconds (or if
you tap
before the 180 seconds has elapsed).
Data Pro 7
Page 10
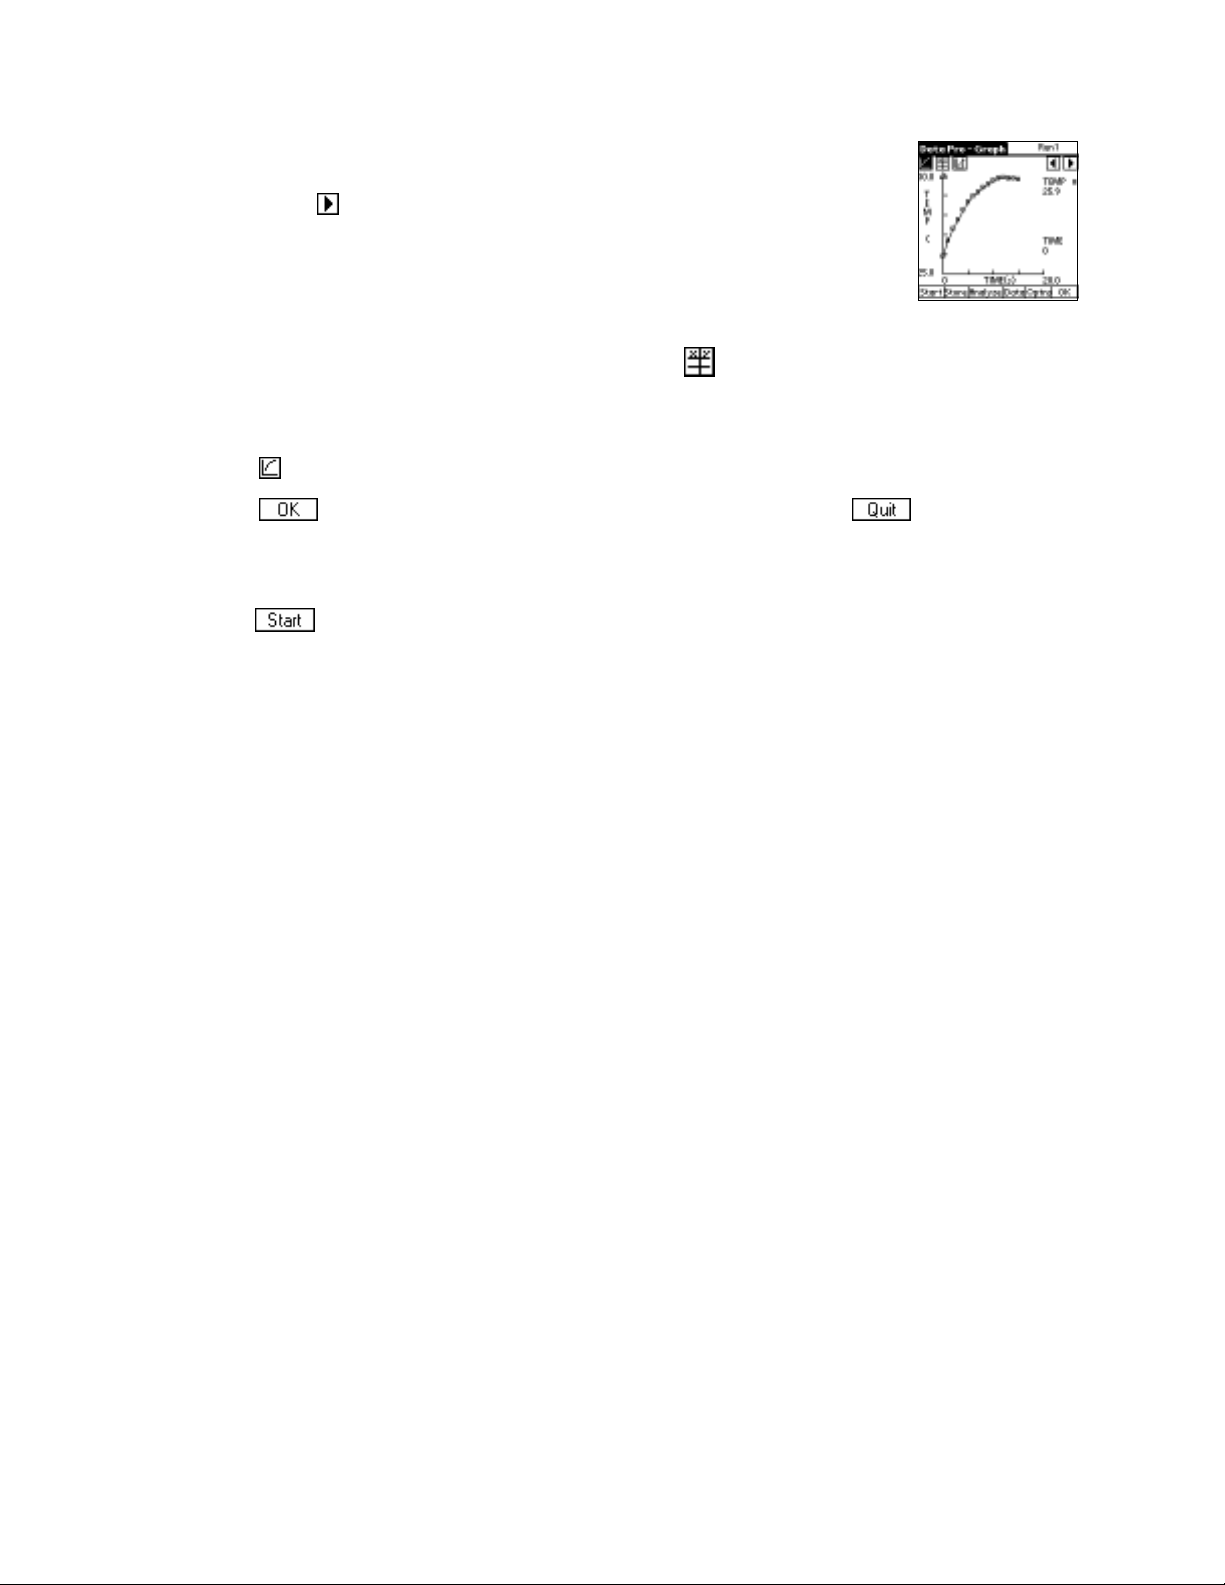
8. After the data collection is complete, an autoscaled graph of the
data will appear. To examine the data points on the displayed
graph, tap or any data point. As you move the examine line,
the temperature values are displayed to the right of the graph.
Move the cursor to find the highest temperature and record the
time value. How long did it take for the Temperature Probe to
stabilize at the water’s temperature?
9. To view data on a data table, you can simply tap , the Data Table toolbar button.
Once you are on the Data Table screen, you can use the scroll bar to the left of the data
table to scroll up and down the data table.
10. Tap , the graph button, to return to the Graph screen.
11. Tap to return to the Main screen to do another tutorial. Tap to exit the
Data Pro program.
To summarize: To collect time-graph data with an auto-ID sensor, you simply start Data Pro
and tap . Other data collection methods, using different modes, will be discussed in
the tutorials that follow.
8 Data Pro
Page 11
LabPro Tutorial 2: Non Auto-ID Sensor and Selected Events Mode
LabPro will automatically identify newer auto-ID sensors; however, you may have a number
of older sensors that you want to use. These are sensors with a 5-pin round DIN plug, which
require a DIN-BTA adapter to connect to LabPro. The DIN-BTA is a small plug with a
5-pin round
these sensors is not a problem, since only a few extra steps are required to get your data.
This tutorial will show you how to set up any non auto-ID sensor (pH is just an example)
and collect data using the Data Pro program in monitor mode. Additionally, the tutorial will
instruct you on the use of the Selected Events mode of Data Pro. Selected Events mode can
be used with all sensors, not just non-auto-ID sensors.
MATERIALS
Palm OS device pH Sensor with a DIN-BTA adapter.
LabPro interface A number of liquids in which to measure
Data Pro program pH (cola or any soft drink, milk, vinegar,
distilled water window cleaner, etc.)
DIN plug on one side, and a white, flat British Telecom plug on the other. Using
PROCEDURE
1. Connect the pH Sensor to the DIN-BTA adapter, then plug the adapter into Channel 1.
Use the interface cable to connect the Palm OS device to the LabPro interface. Firmly
press in the cable ends.
2. Turn on the Palm and start the Data Pro program. If you are on the Main screen, tap
to clear any sensors and default settings. (Or, if you are not on the Main screen,
simply tap Data Pro at the top of screen, and choose New from the pull-down menu.)
You will notice that Data Pro did not recognize your pH Sensor this time. That’s
because you have one of the older, non auto-ID sensors that LabPro cannot detect. It
must be set up manually.
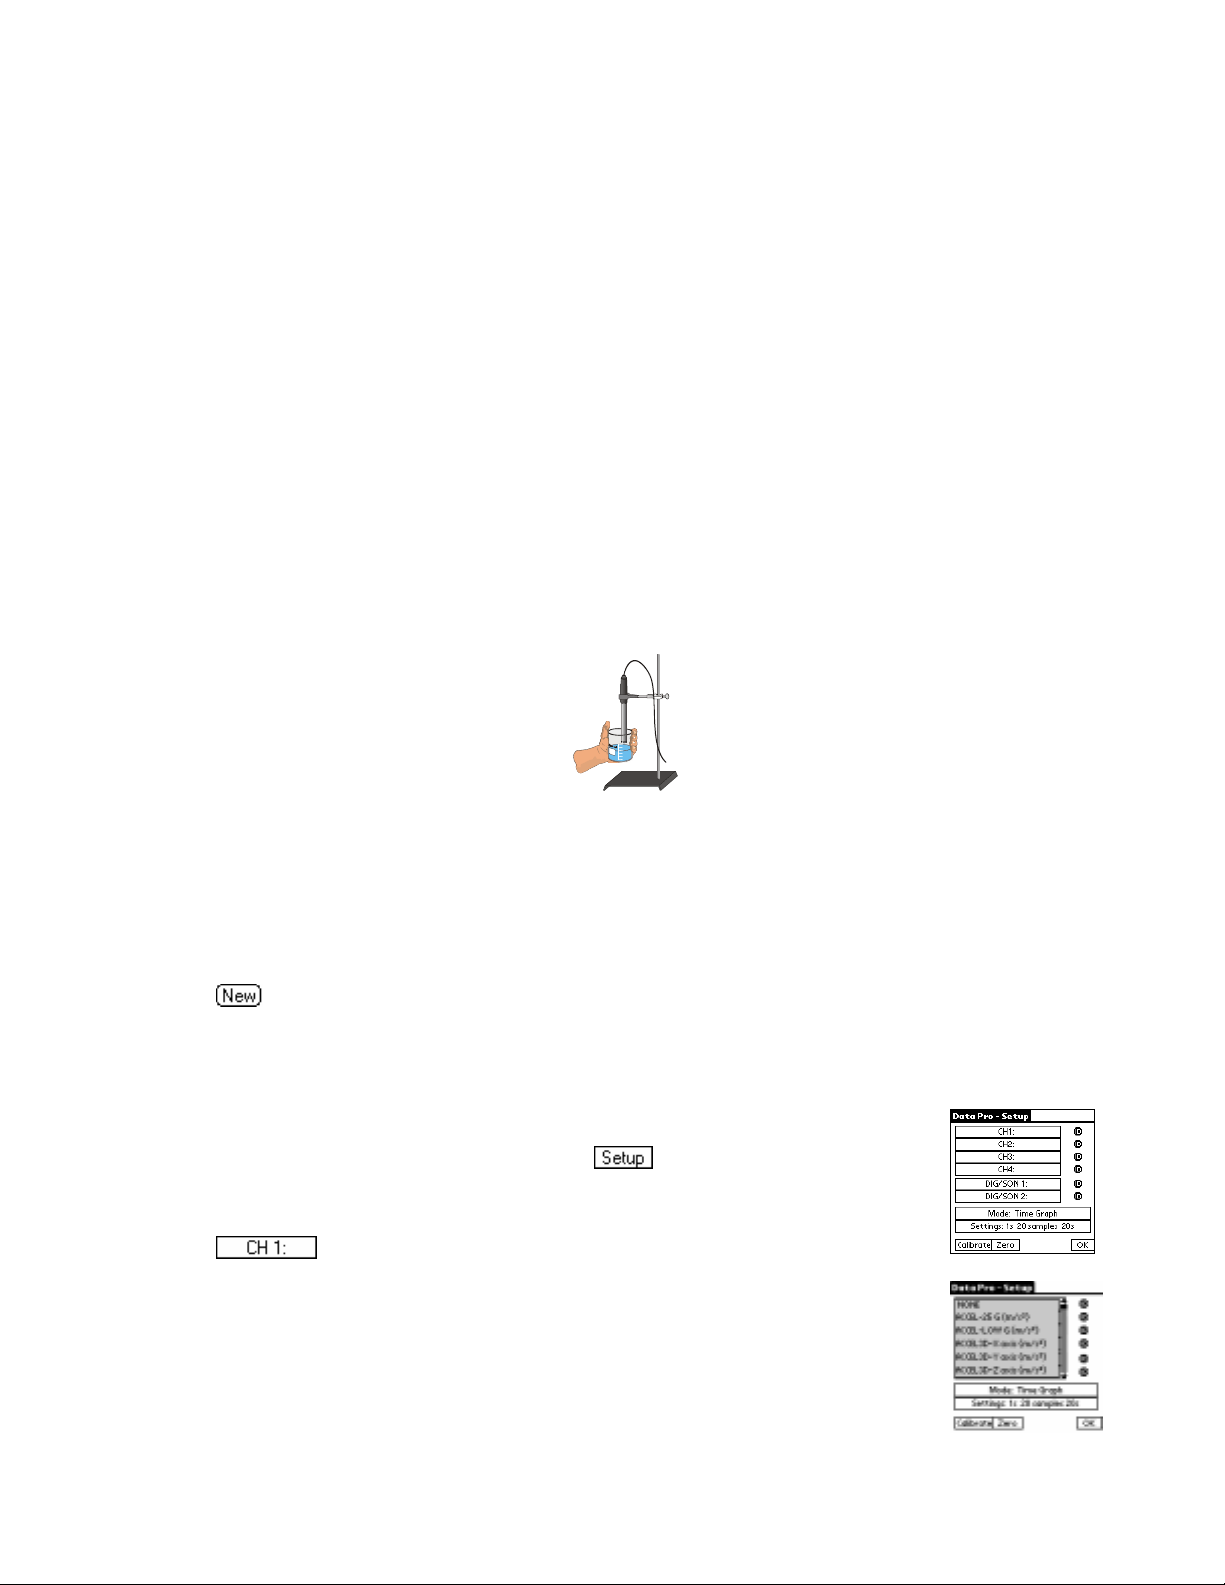
3. To manually set up the sensor, first tap . You should see the Setup
screen shown at the right. Here you can change the sensor and units of
measurement. To add a non-auto-ID pH Sensor to Channel 1, tap
.
4. A list of probes will appear. Use the scroll bar until you reach pH, then
tap pH. By choosing a sensor type, Data Pro loads the default calibration
and data collection rate for that sensor. This manual setup is the same for
all non-auto-ID sensors.
Data Pro 9
Page 12
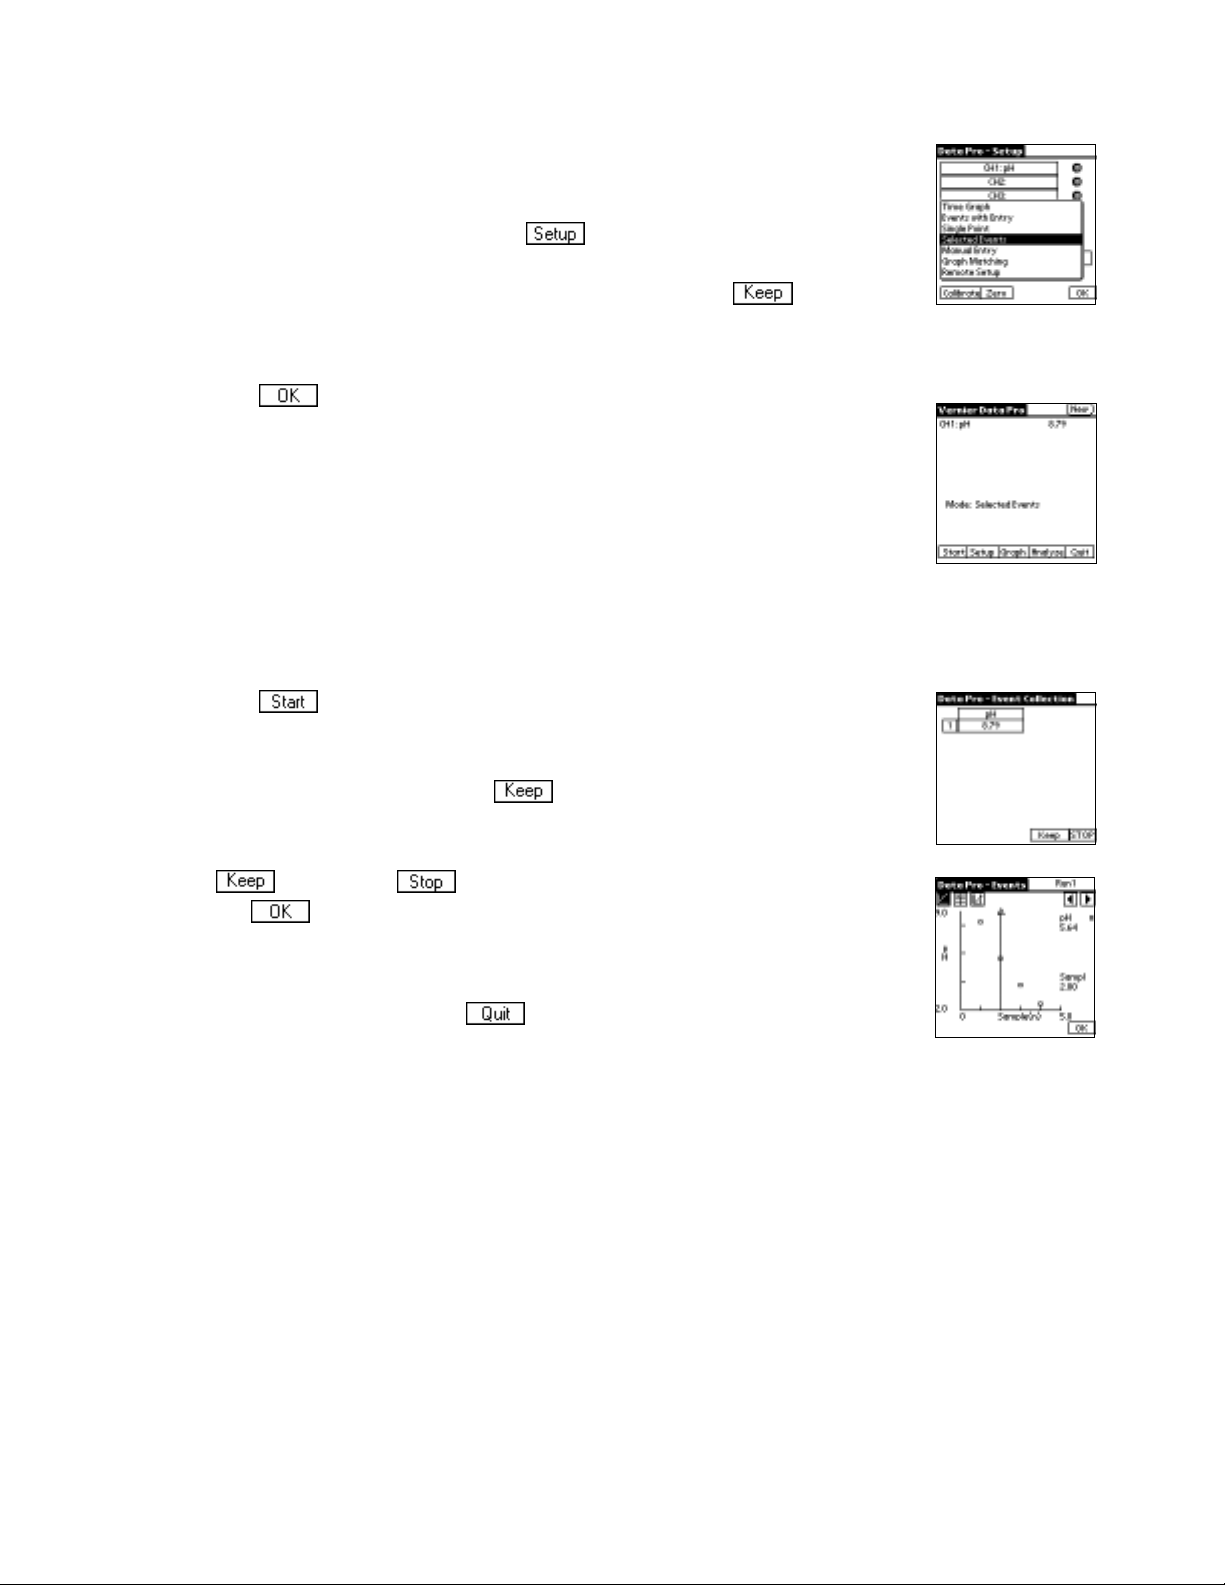
5. Whether or not you are using a non-auto-ID sensor, you now need to
change the data collection mode. While you are on the Setup screen,
let’s change the data collection mode to Selected Events. (If you’re
using an auto-ID pH sensor, tap to reach this screen.) Tap the
Mode: Time Graph button, and choose Selected Events from the list.
This allows you to collect individual readings using a button,
instead of taking time-graph data. It also assigns a sample number (1, 2, 3…) to each pH
reading.
6. Tap to return to the Main screen.
7. The pH Sensor should now be displayed on the Main screen. The pH
value is displayed in the upper right-hand corner, as shown here. Data
Pro acts as a meter on the Main screen, and the screen updates about
once every second. The new data-collection mode is also indicated on
this screen.
8. Remove the pH Sensor from the sensor storage solution bottle by unscrewing the lid.
Carefully remove the bottle, leaving the cap on the sensor body. Rinse the tip of the
sensor with distilled water and place the sensor tip into a beaker containing tap water.
9. Tap to begin collecting data. Take the pH measurement of your
different liquids. Place the tip of the pH Sensor into a liquid to be
sampled. Watch the live reading in the first cell of the displayed data
table. When it stabilizes, tap . This will save the pH value along
with a sample number, 1. Between measurements, rinse the sensor with
distilled water. Switch liquids. Continue to take readings using the
button. Tap when you have finished collecting data, then
tap to view a graph of pH vs. sample (n).
10. When you are done, rinse the sensor with distilled water and
return it to the sensor soaking solution. Stay on the Main screen to
do another tutorial, or tap to exit Data Pro program.
10 Data Pro
Page 13
LabPro Tutorial 3: Events with Entry and Boyle’s Law
The Events with Entry mode collects reading from a sensor each time you tap and
then asks you to enter a corresponding value for that sensor reading (e.g., a volume or a
concentration). This tutorial will guide you through the setup procedure of an experiment
using Events with Entry and investigate the relationship between the pressure and volume of
a gas.
MATERIALS
Palm handheld 20-mL gas syringe
LabPro interface Data Pro program
Vernier Gas Pressure Sensor
PROCEDURE
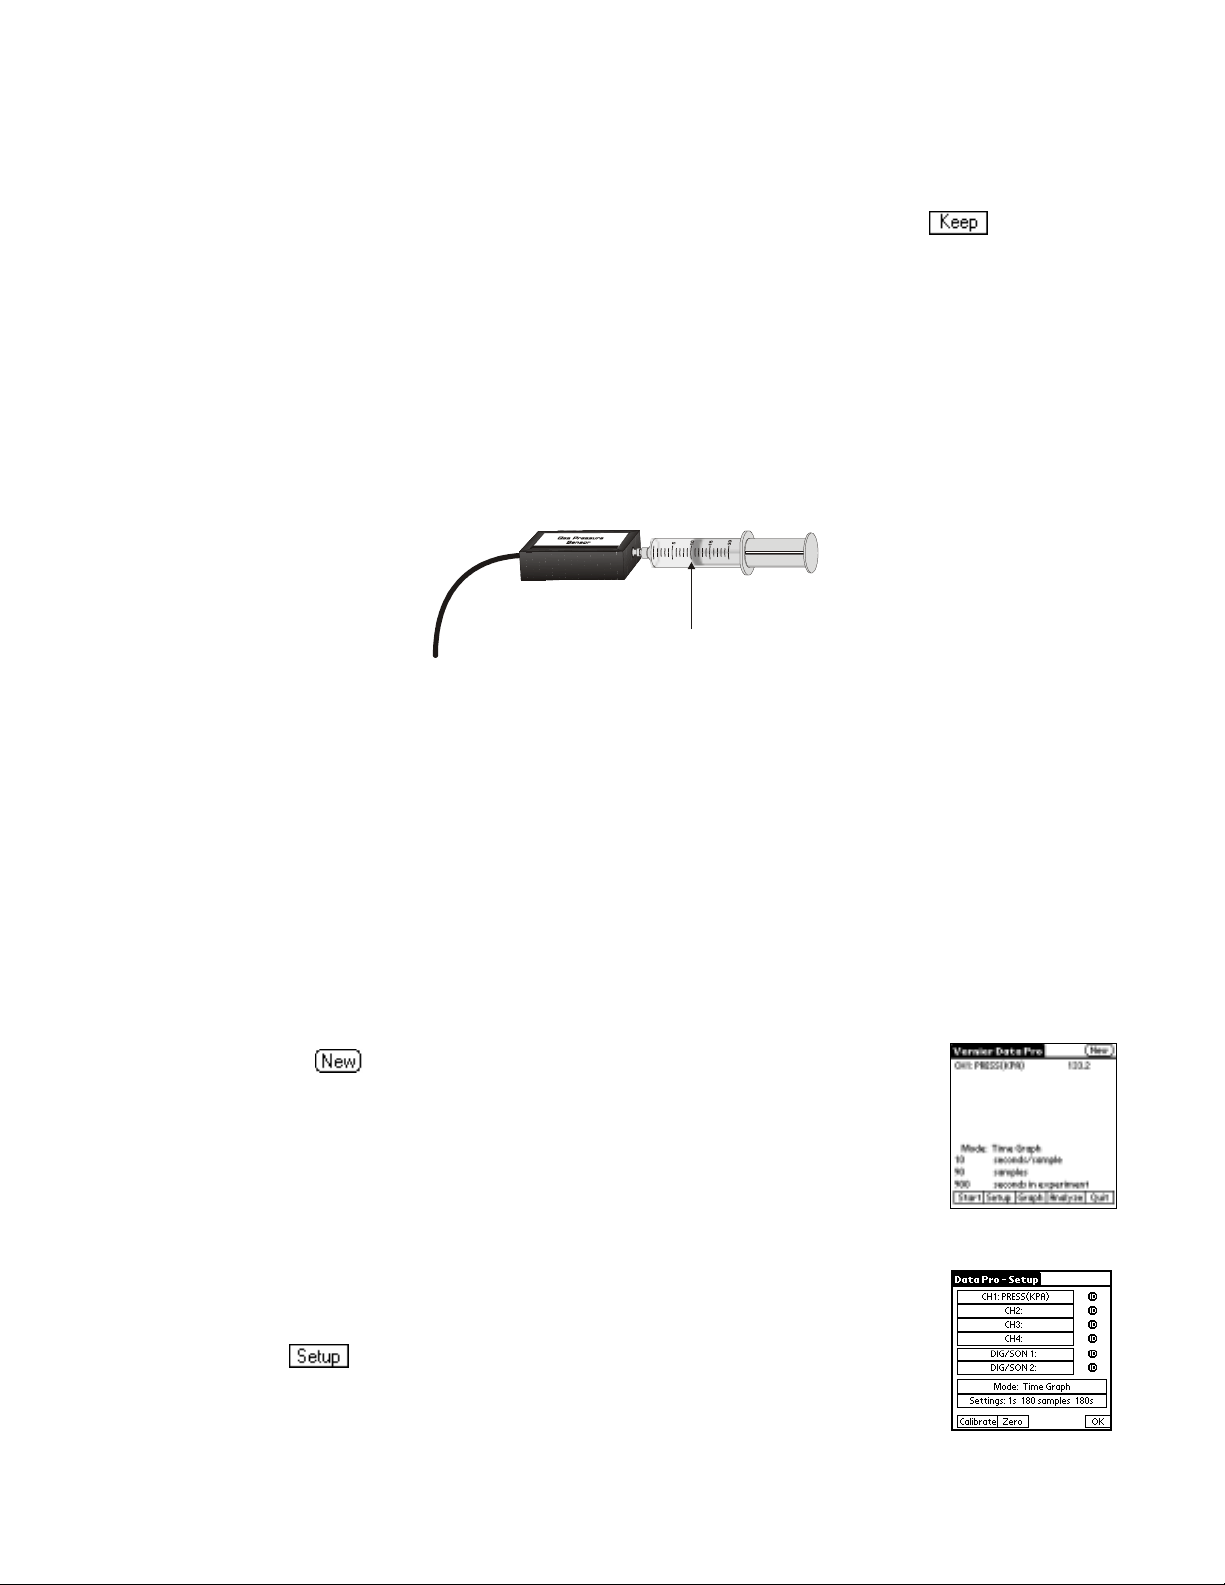
1. Prepare the Gas Pressure Sensor and an air sample for data collection.
a. Plug the Gas Pressure Sensor into Channel 1 of the LabPro. Use the interface cable to
connect the Palm to the LabPro. Firmly press in the cable ends.
b. With the 20-mL syringe disconnected from the Gas Pressure Sensor, move the piston
of the syringe until the front edge of the inside black ring (indicated by the arrow in
the figure shown above) is positioned at the 10.0 mL mark.
c. Attach the 20-mL syringe to the valve of the Gas Pressure Sensor. The Vernier Gas
Pressure Sensors have a white stem protruding from the end of the sensor box—
attach the syringe directly to the white stem with a gentle half-turn.
2. Turn on the Palm and start the Data Pro program. If you are on the Main
screen, tap
to clear any sensors and default settings. (Or, if you are
not on the Main screen, tap Data Pro at the top of screen, and choose New
from the pull-down menu.) Notice how the program automatically
identified the Gas Pressure Sensor (an auto-ID sensor). It displays the
channel it is connected to and the current reading, in units of kPa. Note: If
you are not using an auto-ID sensor, you will need to set it up manually.
See Tutorial 2 for directions on doing this.
3. Set up the Palm OS device and interface for a Gas Pressure Sensor.
a. On the Main screen, a live pressure reading should be displayed for
the Gas Pressure Sensor in
b. Tap
.
CH1 (in units of kPa).
c. On the setup screen (see right), tap the Mode button, and then choose
Events with Entry mode.
Data Pro 11
Page 14
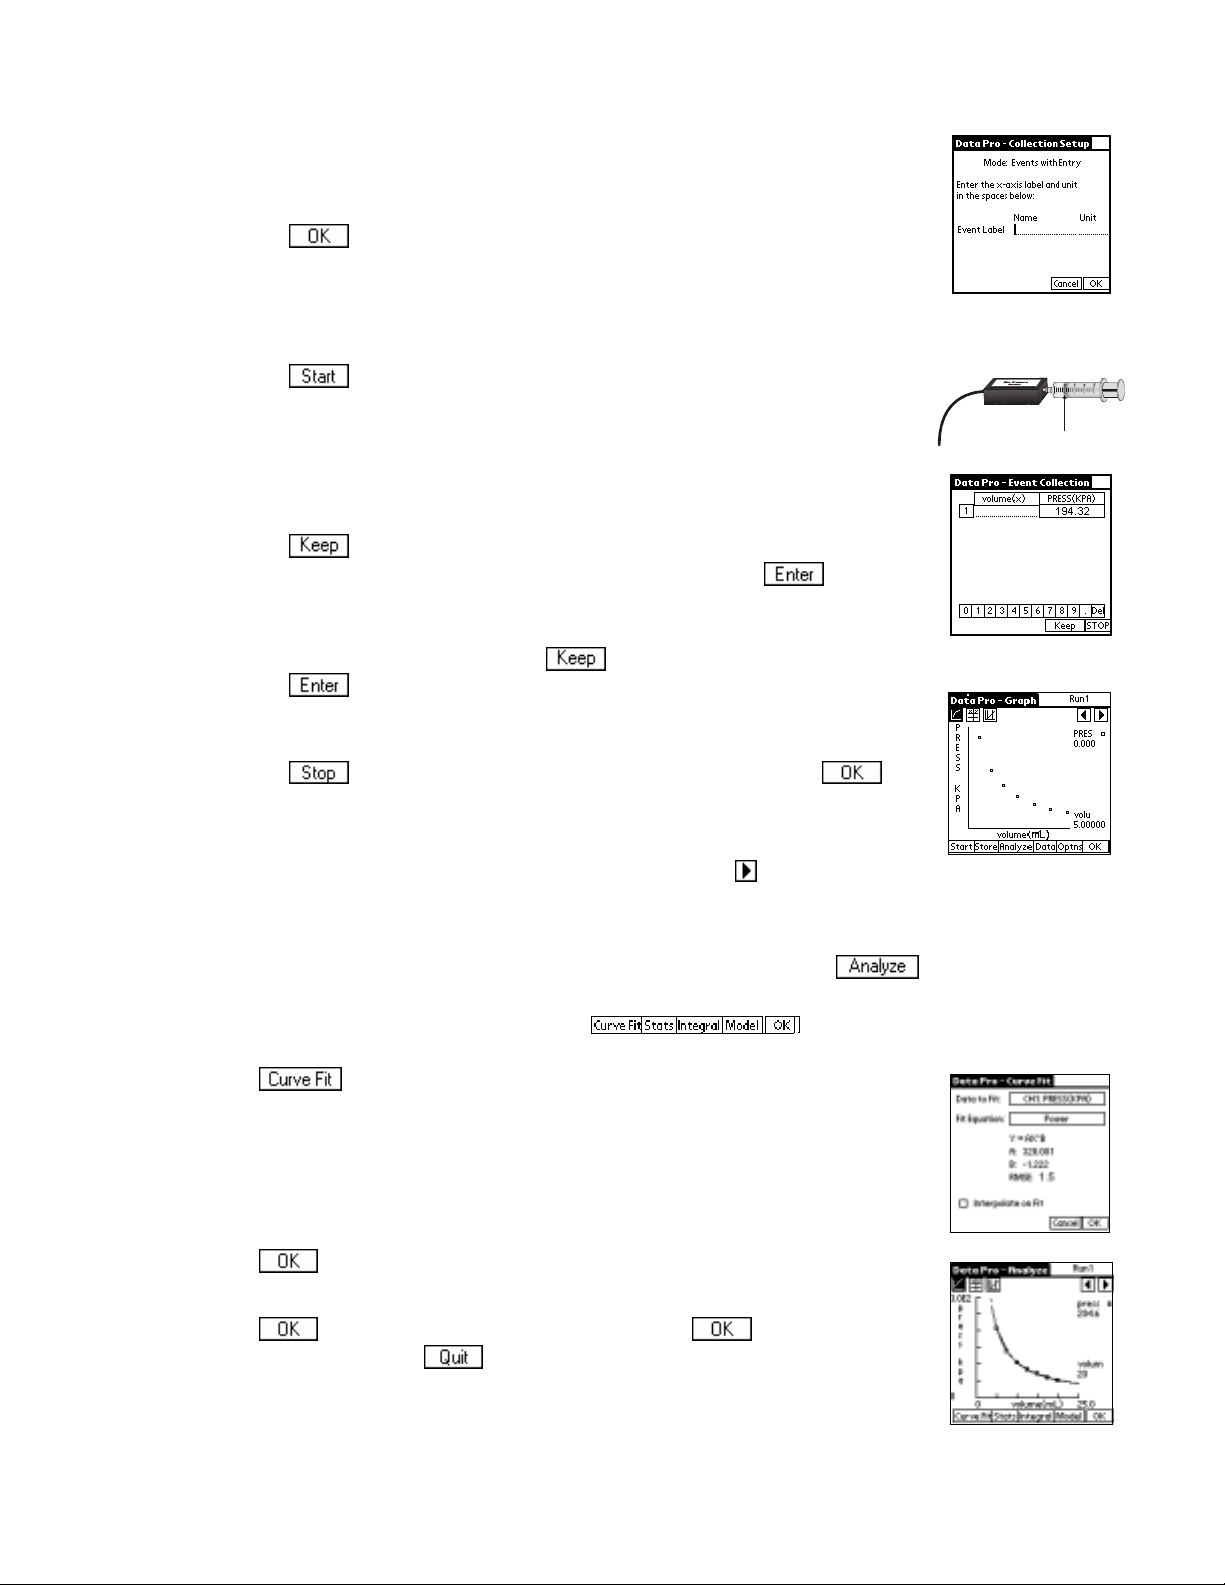
.
d. Enter the x-axis label (Volume) and unit (mL). You can enter this
information using the onscreen keyboard (tap “abc”), or by using the
Graffiti writing area.
e. Tap twice to return to the main screen.
4. You are now ready to collect pressure and volume data. It is easiest if one
person takes care of the gas syringe and another operates the Palm device.
a. Tap to begin data collection.
b. Move the piston so the front edge of the inside black ring (as shown
here) is positioned at the 5.0-mL line on the syringe. Hold the piston
firmly in this position until the pressure value displayed on the Palm
device screen stabilizes (in this example, the number to the right,
194.32 kPa).
c. Tap and enter “5”, the gas volume (in mL) on the screen (using
the numerical keyboard displayed on the screen). Tap to store
this pressure-volume data pair.
d. To collect another data pair, move the syringe to 7.5 mL. When the
pressure reading stabilizes, tap and enter “7.5” as the volume.
Tap .
e. Continue with this procedure using volumes of 10.0, 12.5, 15.0, 17.5,
and 20.0 mL.
f. Tap when you have finished collecting data, then tap to
view a graph of pressure vs. volume.
5. To examine the data pairs on the displayed graph, tap or any data
point. As you move the examine line, the pressure and volume values of
each data point are displayed to the right of the graph.
6. Now you can perform a curve fit on the displayed data. First tap
Notice that the graph still looks the same, but the menu displayed below
the graph has changed, as shown here: .
7. Tap . The Curve Fit screen is displayed. Tap the Choose Equation
button and choose Power. The curve fit statistics for your data are now
displayed for the equation Y = AX^B, where A is a proportionality constant
and B is the exponent of X (volume) in the equation. Note: The
relationship between pressure and volume can be determined from the
value and sign of the exponent, B. RMSE is the root mean square error.
8. Tap to display the regression curve on the graph of pressure vs.
time.
9. Tap to return to the Graph screen, then tap again to return to
the Main screen. Tap
to exit Data Pro.
12 Data Pro
Page 15
LabPro Tutorial 4: Collect Motion Data
The Vernier Motion Detector measures the distance to an object using echoing ultrasonic sound
waves. Data Pro then calculates the velocity and acceleration. This tutorial will show you how to
use a Motion Detector and make a graph of a walking person.
MATERIALS
Palm OS device Data Pro program
LabPro interface Motion Detector
PROCEDURE
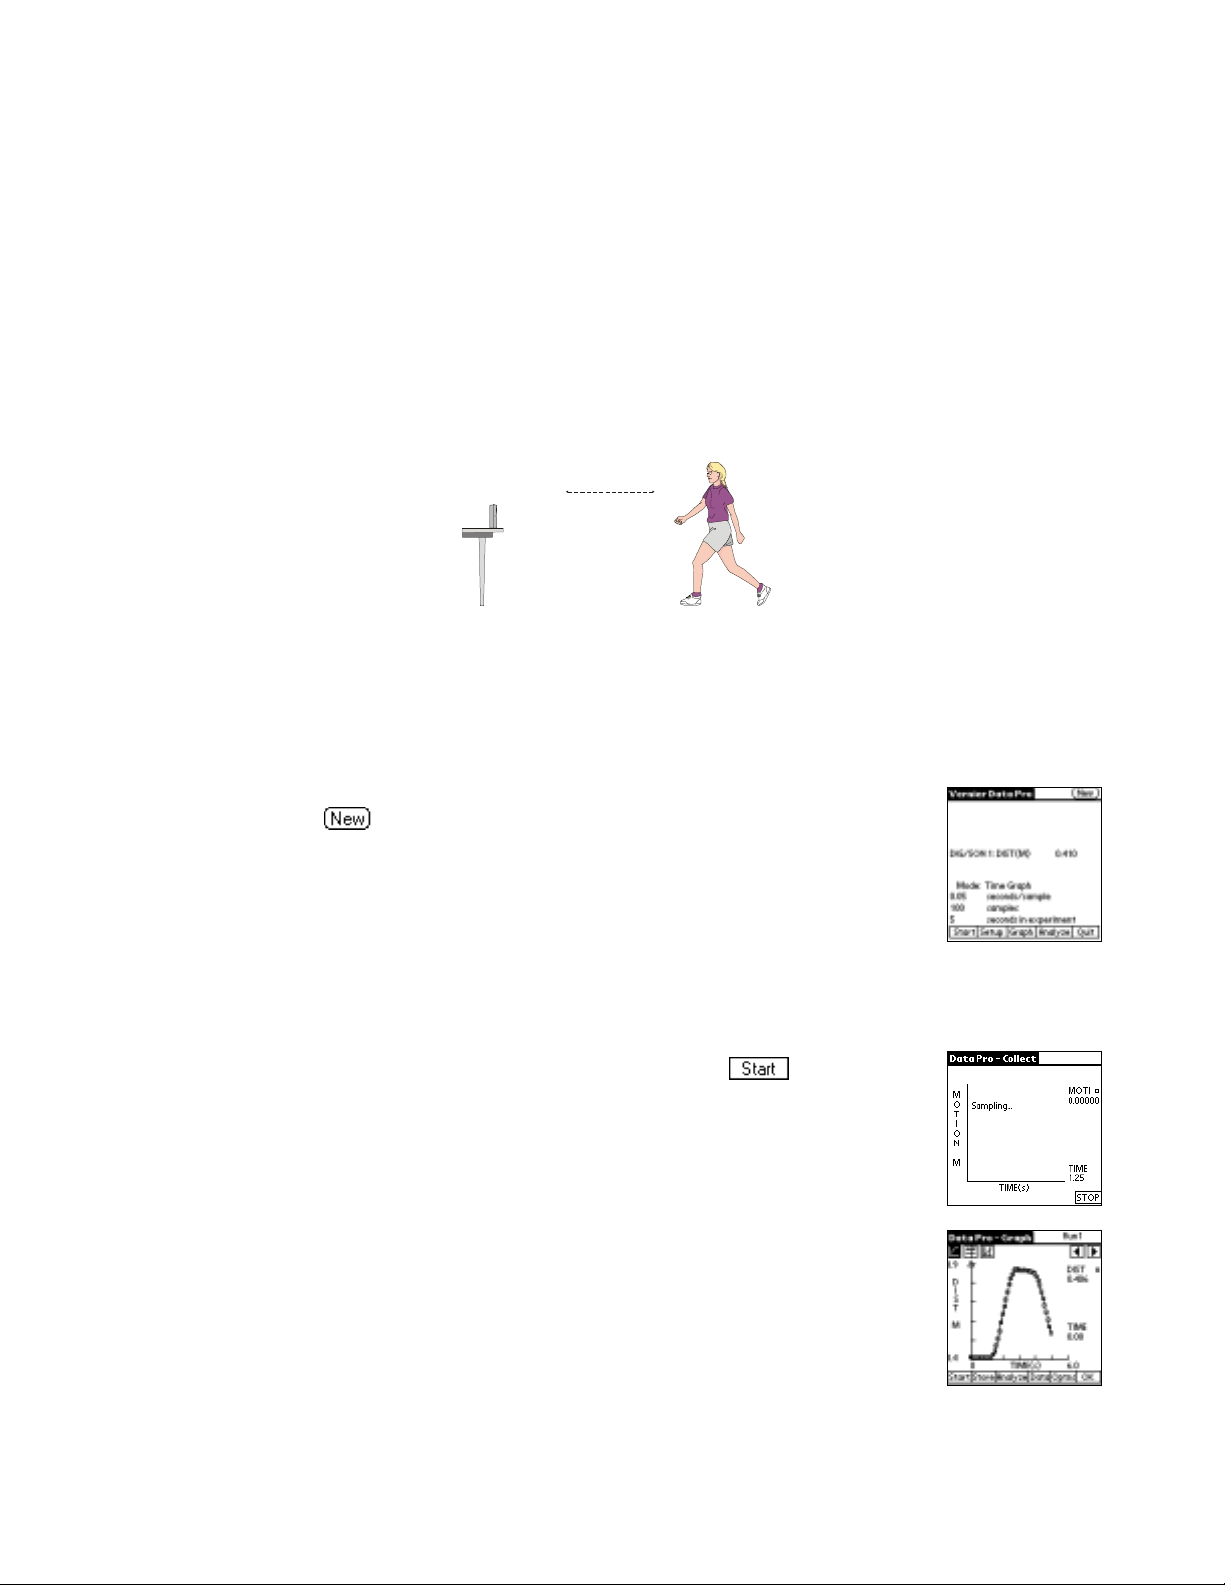
1. Place the Motion Detector so that it points toward an open space at least 4 m long.
2. Connect the Vernier Motion Detector to the DIG/SONIC 1 port of the LabPro interface.
Use the interface cable to connect the LabPro to the Palm. Firmly press in the cable ends.
3. Turn on the Palm and start the Data Pro program. If you are on the Main
screen, tap to clear any sensors and default settings. (Or, if you are
not on the Main screen, tap Data Pro at the top of screen, and choose
New from the pull-down menu.)
4. Slowly move your hand to and from the Motion Detector and watch the
right-hand corner of the screen as Data Pro gives a live readout of the
distance (in meters). Keep your hand at least 0.4 m from the detector; if
you get closer than that the readings will be unreliable.
5. The sensor is set to collect data for five seconds. Tap to collect
data. Or, you can press the left-most key on your Palm OS device to start
collecting data. You will notice a fast clicking sound coming from the
Motion Detector. Wait one second, and then walk slowly away from the
Motion Detector. Stop for a moment, and then walk toward the Motion
Detector. The screen will give a sampling message.
6. After data collection is complete, you will be presented with a graph of
distance vs. time.
walk back and forth
in front of
Motion Detector
Data Pro 13
Page 16

7. Tap the y-axis, and then tap on the velocity column to view a graph of
velocity vs. time.
You will be presented with a velocity vs. time graph.
8. Tap
to return to the Main screen, to do another tutorial, or tap
to exit Data Pro program.
Note: As an Extension of this tutorial, you may want to try selecting a special
mode in Data Pro, Graph Matching. This mode has students match a graph
(like the one shown here) with distance or velocity data collected like you did
in this tutorial. You can select this mode on the Main screen by first tapping
, then tapping and choosing Graph Matching. When
you tap in this mode, a distance vs. time graph like the one shown here
will be displayed, and you can try matching it.
14 Data Pro
Page 17

LabPro Tutorial 5: Data Pro as a Stand-Alone Graphing Program
Using the Manual Entry mode, it is possible to use Data Pro as a graphing program when no
LabPro interface is attached. This way, you can easily create graphs from data you enter, and
use all of the analysis features of Data Pro.
EQUIPMENT
Palm OS device
Data Pro program
PROCEDURE
1. Turn on the Palm and start the Data Pro program. If you are on the Main
screen, tap
to clear any sensors and default settings. (Or, if you are
not on the Main screen, simply tap Data Pro at the top of screen, and
choose New from the pull-down menu.) If you get a message that LabPro
needs to be connected and powered, tap on the Continue button.
2. Tap , then tap . Choose Manual Entry from the
displayed menu.
3. Enter the x- and y-axis labels and units for the data you are going to enter.
a. For the x-axis label, enter the name (Time) and unit (s). You can enter
this information using the onscreen keyboard (tap “abc” on the Palm
entry area), or by using the Graffiti writing area.
b. For the y-axis label, enter the name (Pressure) and unit (atm).
c. Tap .
4. In the Manual Entry table, enter the following x and y values, for each of
the (x,y) ordered pairs: (1, 1.25), (2, 1.30), (3, 1.35), (4, 1.40), (5, 1.45),
(6, 1.50), (7, 1.55), and (8, 1.60). Use the numerical keypad that is
displayed at the bottom of the screen. To enter a value, simply tap the
digits (or decimal point) for the number, and then tap
to enter the
value. The cursor will then advance to the next cell (in the order (X1, Y1),
(X2, Y2), (X3, Y3), etc).
5. Tap when you have finished entering data, then tap to view a
graph of pressure vs. time.
6. If you want to correct an entry, you can tap
an entry to make changes. Tap
to return to your graph.
to see your data table. Tap
7. Now you can perform a curve fit on the displayed data. First tap .
You are now on the Analyze screen. Notice that the graph still looks the
same, but the menu displayed below the graph has changed, as shown
here: has changed.
Data Pro 15
Page 18

8. Tap . The Curve Fit screen is displayed. Tap the Fit Equation
button and choose Linear. The curve fit statistics for your data are now
displayed for the equation, Y = AX + B, where A is the slope value, B is
the y-intercept value, RMSE is the root mean square error, and r is the
coefficient of linear regression.
9. Tap to display the regression curve on the graph of pressure vs.
time.
10. While you are still on the Analyze screen, you can tap to view the
statistics for this data set: mean, minimum, maximum, and standard
deviation values for the data set. Tap to return to the Analyze
screen.
11. Tap to return to the Graph screen, and then tap again to
return to the Main screen. Tap to exit Data Pro.
16 Data Pro
Page 19

The Data Pro Program in Detail
OVERVIEW
This section describes Data Pro in detail. Although the program is designed to enable you to
gather data with one or two pushes of a button, there are a number of options (setting up
sensors, data collection modes, etc.) that may require more detailed explanation.
We recommend that you read this section of the manual in the order it is presented.
QUICK START
The following section illustrates the fastest way to collect data using Data Pro with auto-ID
sensors.
Connect the Palm OS device to the LabPro using the interface cable. Firmly
press in the cable ends.
Turn on the Palm OS device by pressing the power button. To start the Data
Pro program, tap the Data Pro icon on the Applications screen.
This is the Main screen. The top half of the screen shows the current sensor
setup. The bottom half displays the current data collection mode and other
settings (e.g., time-graph settings shown here).
Data Pro will automatically identify auto-ID sensors, display the channel
each is connected to, and display the current reading. Only active channels
will be displayed. Tap to detect the new sensors plugged into the
LabPro. Older sensors that do not have auto-ID need to be set up manually.
The main screen supports a meter mode displaying readings for active probes
every few seconds, as displayed in the right-hand corner.
Note: Anytime you have previously quit the program (by pressing the
button), the next time you restart Data Pro, you will enter the program on the
Main screen, any auto-ID sensor will be identified, as has been done with a
Temperature Probe at the right.
If you tap , Data Pro will start graphing your data. The program will
default to that sensor’s particular Time Graph settings. In this example, you
have a Temperature Sensor, reading in °C, and collecting data as a function of
time for 180 seconds.
Data Pro 17
Page 20

Tip: If at any time you wish to stop the data collection and view what has been collected, tap
.
Tip: You can temporarily leave Data Pro to use another Palm application, such as the calculator,
by going directly to the other application. Do not choose in Data Pro, but just start the other
application. When you want to return to Data Pro, select it from the Application screen. Data Pro
will restart and your data will be intact. You can even leave Data Pro during data collection, and
return after data collection is complete.
When the timed data collection is completed, an autoscaled graph of your
data is shown. Using the and keys on the Palm, you can move the
cursor (a vertical line topped by an arrow) along the graph and get readings
for the x and y readings (time and temperature shown here) for any data
point. Or, you can simply tap anywhere along the curve to advance the
examine cursor.
The remainder of this section focuses on describing all of Data Pro’s options, from setting
up experiments to exiting the program.
THE DATA PRO MENU
When the darkened Data Pro title bar is tapped from any screen, this pulldown menu appears.
Choosing New clears all data and sensor settings. If an auto-ID probe is
connected, Data Pro will then identify it and load the default parameters for
that probe. Tapping
same result.
Selecting Save stores the current data into Palm’s memory. The experiment
in the upper-right corner of the Main screen has the
will be saved with the date and time of your experiment. You may override
the default name before saving. A saved file includes data columns,
including multiple runs, column labels and units, and the data-collection
parameters. Files are saved in a date-time format by default, with a file name
in the form, “
DATA_MoDaYr_HrMi” as shown here.
You can save a maximum of 20 Data Pro files on your Palm OS device.
After you have saved 20 files, you will be advised that in order to open
another file, you need to delete a file first.
Choose Open to call up a list of saved files, such as the list shown at the
right. Tap the saved file you want to open, and it will be loaded into Data
Pro.
Data Pro 18
Page 21

Choosing Delete calls up a list of saved files. Tap on the file you want to delete.
Choosing Beam allows you to send a Data Pro file to another Palm OS device, using its IR port.
1. Choose Beam from the Data Pro menu, to view the available saved data files stored on that
Palm OS device.
2. Align the IR ports of the two Palm OS devices. Both units must be turned on.
3. On the Palm that is sending data, tap the name of the data file you want beamed. On the
receiving Palm, you will be asked if you want to accept the data. You must accept the data to
complete the transfer.
4. After a successful transfer, the data can be viewed by opening the file just like any other
saved file.
Palm Memo Pad provides a place to store general text information. Each
memo can contain up to 4,000 data points. The number of memos you can
store is dependent only on the memory available on your Palm. You can store
large quantities of data this way. When you HotSync with your computer, the
memos will be copied to your desktop software. You can then open a memo,
copy the data to the clipboard, and paste the data into a graphing program.
Select Copy Data to Memo Pad to save your Data Pro data to Memo Pad.
The screen gives the saving status. You will receive a message when saving
is complete.
Select Print Data Table to print all the data values for all columns and all
stored runs. Printing works only if you have a compatible Infrared-enabled
printer. (See the section on printing at the end of this guidebook.)
Select Print Screen to print the Data Pro screen that is currently showing.
Printing works only if you have a compatible Infrared-enabled printer. (See
the section on printing at the end of this guidebook.)
Choose About Data Pro to determine the Data Pro version number, and
choose About LabPro to see the LabPro OS version number.
THE START OPTION
Tap to begin collecting data using the existing sensor setup and data collection mode.
An alternative to tapping
is to press the left-most button (calendar key for the Dana) on
the OS device; this may be more convenient than using the stylus. This button only starts data
collection when
is on the screen and may also be used to stop data collection before
the end of the experiment.
Data Pro 19
Page 22

THE SETUP OPTION
Sensors
Note: When connecting sensors to analog channels, you should use the channels in numerical
order. In other words, connect the first sensor to Channel 1 (CH1), the second sensor to
Channel 2 (CH2), and the third sensor to Channel 3 (CH3). If you are using only one sensor,
it should be connected to Channel 1.
• If the sensor is auto-ID, the channel number and sensor type is automatically displayed
on the main screen. If necessary, change the data collection mode as described in the
following section titled Data Collection Modes. Otherwise, you are ready to collect data.
• If the sensor is not auto-ID, follow the steps below to tell LabPro that the
sensor is connected. On the Data Pro main screen, tap .
To add a non-auto-ID sensor, tap the channel to be set up.
A list of sensors will appear.
Select a sensor or use the scroll bar to scroll the list of sensors.
Once you have selected the sensor you want to use, tap . You will be returned to the
main screen.
Data Pro contains default time graph settings for each sensor. You can change the window in
which the collected data is graphed, and you can change the type of triggering used in the
experiment.
Data Collection Modes
For each Vernier sensor, Data Pro loads a default experiment appropriate for
the sensor. The default data collection mode for all sensors is Time Graph
(collecting data points at a predetermined rate for the appropriate sensor). To
choose another mode, or to change the time graph data collection parameters,
tap from the main screen, then tap
from the setup
screen. The mode button displays the current mode.
Data Pro 20
Page 23

The Time Graph option is used to set the sample interval and number of
data points for a timed data collection. It can also be used to alter advanced
features like live graphs and triggering.
The Collection Setup screen appears when you tap
under the Mode button. The default time interval between samples depends
on the sensor you are using. Use the onscreen keyboard (tap “123”) to enter a
new time interval or number of samples. A maximum of 500 points can be
collected into Data Pro. If it is necessary to collect more points, up to 12 000
points can be collected using remote mode, but the data must be downloaded
into Graphical Analysis or Logger Pro for graphing.
Important: A time graph will be displayed live unless you are sampling at a rate faster than 10
samples per second (time collection interval less than 0.1 seconds/sample). If you are using
multiple sensors and they are identical, all of the data will be displayed live in one graph with the
same axis label. If they are not identical, all sensors will be live, and they will share an axis label
named ALL DATA.
Tap
modify features of your graph. Graph Options allows you
to
to control how your data are plotted. You can set Graph Options either before
data collection has begun, as shown here, or after data collection, by tapping
on the Graph screen.
• Connecting Line: connect data points with lines to create a continuous
plotted line.
• Point Protectors: mark data points with a point protector.
• The Autoscale option quickly resets the axes of the currently
selected graph based on the data. It is an easy way to automatically scale both axes.
Autoscale is the default scaling setting, and will select the axis scales so that all the data
just fits on the graph while still following standard scientific graphing rules.
• The y axis will not necessarily include the origin, so you may want to perform a more
limited autoscale by choosing Autoscale from Zero.
• By choosing Manual, you can choose both endpoints of the axis. Enter the minimum and
maximum values to plot in the text boxes under this option.
Tap for the Triggering Options screen.
Tap the triggering you want. If you select
NONE and then , you will
return to the Collection Setup screen.
Data Pro 21
Page 24

If you choose to trigger on a channel, Data Pro asks you to choose the trigger
is
type.
• INCREASING means that data collection will not start until the sensor
readings (such as light intensity or temperature) increase through the
selected threshold.
• DECREASING means that data collection will not start until sensor
readings decrease through the selected threshold.
Enter the number in sensor units (the threshold) at which you want data collection to begin and
tap
. When the values of the data being collected reach this threshold value, LabPro will
begin storing data.
Write in the number (in percent of the total number of points to be collected) of data you want
the LabPro to prestore and tap . Prestore is the amount of data collected before the
threshold was reached that you want to keep (10 percent, 20 percent, and so on). From the time
the experiment begins until the threshold is reached, LabPro collects data in a buffer. When the
threshold is reached, LabPro begins storing the data it is collecting and discards the data it
collected before the threshold was reached unless a prestore value is entered. Tap twice
more to return to the main screen.
Events with Entry mode is used for titrations, Boyle’s law, and so forth. Data
are collected one point at a time and only when the
button on the Palm
pressed. You are then prompted to enter the corresponding value.
After selecting this mode, Data Pro asks you to enter the label name and unit.
Single Point data collection is used to collect one averaged data point. This mode is very
popular when collecting water quality data. The interface will collect data for 10 seconds and
report a single, averaged value for each sensor on the Palm screen. This value is stored in the
Data Table. You can now tap the
reading. Do this as many times as you want. Tap to quit collecting data. Tap or
button, and collect another single point
to view a graph of single points vs. sample (n). Tap to view the data points in the data table.
You may add more data points after viewing the graph by tapping the Start button again.
Selected Events mode collects data from each channel in response to pressing the button,
but the user does not enter any values; rather, a sample number (e.g., 1, 2, 3…) is assigned to
each data point. When data collection is completed, a graph of data vs. sample (n) is plotted.
Tap
or to view a graph of data points vs. sample (n). Tap to view the data points in
the data table.
Selecting Manual Entry creates a new data pair in which you can manually enter data. Initially,
a screen will be called up prompting you to enter both the x- and y-axis labels and units. This
data can later be accessed by tapping in the Graph screen. Note: You can try out this mode
by doing Tutorial 5: Data Pro as a Stand-Alone Graphing Program.
Data Pro 22
Page 25

Graph Matching presents distance vs. time and velocity vs. time graphs, and
challenges you to match the graph. Tap
and you will be presented with
,
a random distance graph for you to match.
Tapping will start data collection so your data will be graphed in real
time, for 10 seconds.
Tap
new graph to be matched, or tap
showing. Tap
to try matching the same graph, tap to be presented with a
to do a run with no graph initially
to return to Data Pro.
Tap on the y-axis label, DIST (m), to change to a velocity vs. time match. Or,
you can simply tap on the label, (m, or m/s), to change from SI units to
English units (e.g., ft, or ft/s). To change from VEL (m/s) back to distance,
simply tap on the VEL (m/s) label and choose DIST (m) again.
By selecting the Remote mode, the Palm can set up LabPro for remote data collection. LabPro
can be removed from the Palm for data collection, then attached to the computer for data
importing to Vernier Graphical Analysis or Vernier Logger Pro program.
The Collection Setup screen will be presented where you can set up the data
collection parameters.
Follow the instructions to set up your LabPro for remote data collection.
Data Pro 23
Page 26

Modes Unique to Specific Digital Sensors (Photogate, Radiation Monitor, Drop Count er)
ter
Photogates If you first select (or auto-ID) a Photogate as the sensor in DIG/S 1 and/or DIG/S 2,
you will have different data collection modes available to you:
Motion Motion timing mode is used with picket fences, smart pulleys, or other custom
devices with uniformly spaced bars or spokes. Using the number of bars or spokes and the
corresponding distance between them, this mode calculates distance, velocity, and
acceleration values and plots them. When Motion is selected as the mode on the Setup
screen, there are four choices in the Select Device menu (below the Motion choice). They
are: Picket Fence, Pulley 10 Spoke, Pulley 3 Spoke, and Custom.
Gate Gate timing mode can be used with one or two Photogates selected in DIG/S 1 and/or
DIG/S 2.
collecting data, the length of time the gate is blocked is displayed for each blocking event.
You can enter a width (in cm) and the maximum number of events (Max Event). Af
Pendulum Pendulum mode is used with one Photogate only. After setting pendulum mode,
you can set the maximum number of events (Max Event)
passes through the gate is ignored. The next three passes are used to determine a period.
. The first time a pendulum bob
Pulse Pulse mode is used to measure the time between successive blocks of either the same
gate or two gates. You can enter the distance between gates or blocking events (Width, in
cm) and the maximum number of events (Max Event). In two gate mode, the distance
between gates can be entered to calculate a velocity based on the time interval.
Radiation If you first select a Radiation Monitor or Student Radiation Monitor as the sensor in
DIG/S 1 or DIG/S 2, you will have different data collection modes available to you:
Time Graph This mode is similar to the normal Time Graph mode used with other sensors.
The difference is that when you tap on Settings, you can enter a value for Seconds/Interval.
The program counts for this interval time (e.g., 15 seconds) before reporting a value.
Events with Entry This mode is similar to the normal Events with Entry mode used with
other sensors. The difference is that when you tap on Settings, you can enter a value for
Seconds/Interval. The program counts for this interval time (e.g., 15 seconds). After the
number of counts for this interval is reported, you are prompted to enter an entry value (e.g., a
value for distance, in cm, or a value for number of pieces of shielding material).
Drop Counter On the Setup screen you can first select (or auto-ID) a pH Sensor or
Conductivity Probe in CH 1 (a Temperature Probe may be connected to CH 2). When you select
a Drop Counter as the sensor in DIG/S 1 and/or DIG/S 2, the Mode will be displayed as Drop
Counter on the Setup screen.
Calibration of Drop Volume To calibrate the drop volume, tap Setup, then tap Calibrate.
You can manually enter a drops/mL ratio you have previously determined, or you can choose
to Calibrate Now. Follow the on-screen directions, releasing between 9 and 10 mL of titrant
through the Drop Counter slot into a graduated cylinder. A drops/mL value is determined.
Perform a Titration Once you have calibrated (or entered a drop/mL ratio), you can
perform a titration (using a pH Sensor with the Drop Counter, for example). You simply tap
on Start, and adjust the drop rate from the reagent reservoir to about 1 drop per 2 seconds.
Data Pro will take a pH reading with each drop volume measured. When you are finished,
close the valve on the reagent reservoir, and tap Stop.
1st and 2nd Derivatives Once you have observed your pH vs. volume graph, you can also
tap on the y-axis label (e.g., pH), and tap on either 1st Deriv or 2nd Deriv.
Data Pro 24
Page 27

Calibration of Sensors
When a sensor is selected, Data Pro automatically loads the standard calibration settings. Further
calibration is usually not needed.
If you choose to calibrate a sensor, tap on the Setup screen.
There are two ways to calibrate a sensor. The first is to perform a new calibration; the second is
to manually enter the calibration values. The examples shown below are for the pH sensor.
To perform a new calibration for a pH sensor, you will need two solutions with known pH
values: for example, solutions with values of 4 and 10. Follow these steps:
1. On the Setup screen, tap .
If you have more than one sensor connected, then tap the button below
Calibration, and choose which sensor you want to calibrate.
2. The current calibration will be displayed. Tap .
Note: Not all sensors can be calibrated (e.g., Stainless Steel Temperature Probe). If you select a
sensor that cannot be calibrated, Data Pro does not respond when you tap .
3. Put the pH Sensor in the pH-4 solution. Wait until the voltage number on
the screen stabilizes, enter 4 under Value, and then tap
.
4. Rinse and put the pH Sensor into the pH-10 solution, entering 10 instead
of 4, since you are using the pH 10 buffer. After the reading stabilizes, tap
.
5. Tap to return to the Setup screen.
Data Pro 25
Page 28

To calibrate the pH sensor by entering values manually:
1. On the Setup screen, tap .
If you have more than one sensor connected, then tap the button below
Calibration, and choose which sensor you want calibrated.
2. The current calibration will be displayed. Tap
3. Enter the New Slope and New Intercept, then tap
.
The Calibration
.
screen is displayed with the new values. Tap to return to the Setup
screen.
Zero
From the SETUP screen you can zero one or more sensors. After tapping
, a screen will appear with a list of channels. Select any sensor(s) you
want to zero and tap
.
After your sensor(s) has been zeroed, the reading displayed on this screen
should be 0, or very close to 0. Tap to return to the Setup screen.
THE GRAPH OPTION
The Graph screen automatically appears when you are finished collecting
data or when is chosen from the main screen.
Initially all sensor channels are graphed to show that the data have been
collected. You will probably want to select individual channels for viewing.
To view a graph of a specific channel, click on the y-axis. You will be
presented with a menu of the available channels. Tap on a column to view it
in graph form.
If you wish, you can view a graph of all the channels.
Data Pro 26
Page 29

Tap or to examine the data points along the graph. As you move the
vertical line right or left, the time (X) and temperature (Y) values of each data
point are displayed to the right of the graph.
Tapping in the graph screen will take you back to the main screen.
Select Region by tapping in the graph screen to zoom in on a region of interest. This option
may be necessary for curve fitting. Data outside the selected region are not deleted; the
horizontal range of the graph is temporarily changed and only the selected region is used for
curve fitting and statistical analysis.
Data Pro 27
Page 30

• Tap on the part of the graph you want to be your left bound. A vertical line
with a > symbol will appear as your left bound.
• Repeat for the right bound, then tap (the Zoom tool). Note: The Zoom
tool does not appear on the toolbar unless Select Region is being used
(turned on).
• The new graph of your selected region will be displayed.
• You can view the data you have just collected in a Data Table by tapping
or . Important: If you have more than two data columns, you
can display other columns by tapping in the column heading area and
selecting another column. If you have multiple runs stored, a run menu
will appear in the upper right corner. Select the run you wish to view.
Important: Data that have been collected from a sensor (e.g., from a
Temperature Probe), or time data, cannot be edited or deleted. However, you
may edit cells in the Data Table that have values entered manually into them.
This would include values entered during Event with Entry or Manual Entry
modes. For example, a volume reading entered incorrectly during a pH
titration can be corrected by tapping on that cell in the Data Table, and
entering a new value.
Data Pro 28
Page 31

• Calculated Columns Tap
to either modify or add a
calculated column. You will be presented a list of the current calculated
columns to choose from, or you can create a new calculate column. Note:
You are permitted to make a calculated column based on a calculated
column, as long as you don’t exceed 10 columns as the total number of
columns (including data columns collected). You will be warned if you
try to exceed this number of columns.
• If you elect to modify a currently existing calculated column, you will be
taken to a screen where you can choose to edit the column name, unit,
variables, and calculation.
• Tip: Chemistry teachers and students may use the calculated column
feature to create plots of first and second derivatives from pH vs. volume
data, to help determine equivalence points (using the first and second
derivative column equations).
After selecting New Column, you will be taken to a screen where you can
create a new calculated column. Here you are prompted to give the new
column a name and assign it units.
Tapping will call up a list of equations for your new
column. You may be prompted to adjust the coefficients.
Likewise, tapping will call up all available columns for use
as the X variable.
After you have created your new calculated column tap . The new
calculated column will be graphed. Note: The new column you created will
be plotted on the same axis (x- or y-axis) as the column from which it was
created.
Data Pro 29
Page 32

Storing Runs. Normally, a new data collection run overwrites previously
collected data. You can Store your data by tapping . By doing this, your
previous run is saved. A new blank graph will be displayed. You can now
collected additional data without overwriting the stored run.
Tap the menu in the upper right-hand corner of the screen for a list of stored
runs, and then tap on a run to call it up. Important: You can also plot a
graph of all available runs by selecting All Runs from the Run menu.
You can rename a run by tapping . The data table for the run will be called
up. From there, tap , and you will be able to rename the run, delete
it, or delete all existing runs.
Tap
modify features of your graph. Graph Options allows you to
to
control how your data are plotted.
• Connecting Line: connect data points with lines to create a continuous
plotted line
• Point Protectors: mark every data point with a point protector
• The Autoscale command quickly resets the axes of the currently selected
graph based on the data. Autoscale is always the default scaling choice
for Data Pro. Autoscale will select the axis scales so that all the data just
fits on the graph while still following standard scientific graphing rules
• The y axis will not necessarily include the origin, so you may want to
perform a more limited autoscale by choosing Autoscale from Zero
• By choosing Manual, you can choose both endpoints of the axis. Enter
the minimum and maximum values to plot in the text boxes.
Data Pro 30
Page 33

THE ANALYZE OPTION
Tapping on the main or data screens produces a graph of your data
along with a list of analysis options. You can perform a curve fit, model data
with a function other than curve fit functions, determine statistics over a
region of data, and determine the integral over a region of data.
Tapping from the ANALYZE screen produces the Curve Fit screen.
Here you can choose which data to perform the fit on, and select a Fit
Equation.
Tap for a list of the available equations.
Tapping on an equation will automatically calculate the curve fit for your
data. If you select the Interpolate on Fit option, you can read values from the
fitted curve on the graph screen.
Tap To view your graph with a fitted curve. If you have selected the
Interpolate option, you can tap anywhere along the fitted curve and read x
and y values from the screen.
Tap
to calculate the mean, min, max, standard deviation, and number of
data points of a selected region. The numerical results will be displayed. If
you wish to calculate the statistics of a portion of your data, tap , and select
a region. Then tap
Tap
to integrate a section of the graph. The numerical results will be
. No data are deleted in calculating statistics.
presented. If you wish to calculate the statistics of a portion of your data, tap
, and select a region. Then tap .
Data Pro 31
Page 34

Tap to graph the collected data and overlay a graph of a general
equation whose variables can be adjusted.
The equation you choose may use the parameters A, B, C, and D as a
function of x. Enter values in the parameters and tap OK to view the modeled
graph.
THE QUIT OPTION
Tap
to leave Data Pro and return to the applications screen of the Palm. Tapping
will delete any unsaved data and setup, so that the next time Data Pro is launched an auto-ID
attempt will take place.
Data Pro 32
Page 35

D
Transferring Graphs and Data to Your Computer
Now that you have collected data, you can, of course, analyze it with your Palm device. However,
if you wish to analyze the data on a computer or print the data, you will need to use the Palm
HotSync cradle or cable (or USB cable with Dana from AlphaSmart) to transfer the data back to
your computer.
Vernier Logger Pro or Graphical Analysis
software (Versions 3.1 or newer for Macintosh
or Windows) each have a file option for
importing data lists from all of the LabProcompatible Palm devices. Logger Pro is the
best option because it can also be used as a
computer-based data collection program with
LabPro. Either program is a great tool for
directly moving LabPro data from the Palm to
the computer for graphing and printing. Both
are also very good for performing mathematical
modeling and finding the relationships between
variables. Or, if you do not own Logger Pro or Graphical Analysis software, we also include
directions below for importing data into Microsoft Excel, or other spreadsheet programs.
Logger Pro or Graphical Analysis software There are two ways to import the most
recent data from a Palm device using Logger Pro or Graphical Analysis. The first method
is the recommended method:
1. Use HotSync, with Logger Pro or Graphical Analysis Already Running
a. Launch Logger Pro or Graphical Analysis on your PC or Macintosh computer.
b. Connect your Palm handheld to the HotSync cradle/cable. If you are using a
Dana, connect the USB cable to the Dana’s computer port (using the square or
“B” end of the USB cable) and to the computer’s USB port (using the flat or
“A” end of the USB cable).
c. Press the HotSync button
TM
on the cradle/cable. On Dana, press the
function and sync keys.
d. You should get a message on your computer screen indicating that your Palm OS
device and computer are communicating.
e. The data will be imported into the data table object and displayed graphically,
as shown in the screen above.
ata Pro 33
Page 36

2. Select Import From→ Palm Data Pro... from the File Menu
a. Connect your Palm handheld to the HotSync cradle/cable. If you are using a
Dana, connect the USB cable to the Dana’s computer port (using the square or
“B” end of the USB cable) and to the computer’s USB port (using the flat or
“A” end of the USB cable).
b. Press the HotSync button
TM
on the cradle/cable. On Dana, press the
function and sync keys.
c. You should get a message on your computer screen indicating that your
Palm OS device and computer are communicating. When this process is
completed, the data file will be in the Data Pro folder in
the Palm User folder on your computer.
d. Launch Logger Pro or Graphical Analysis on your PC or Macintosh computer.
e. Select Import From→ Palm Data Pro from the File Menu.
f. The data will be imported into the data table and displayed graphically, as
shown on the previous page.
Load Data from Files Saved by Data Pro Perform all the steps in number 2 above, but
select Import From→ Text File from the File Menu. Navigate to the Palm/User
Folder/Data Pro folder and select the saved text file you wish to import.
Load Text Files into other Applications, such as Microsoft Excel The data that you
send to the computer using HotSync can also be loaded into spreadsheet applications,
such as Microsoft Excel. DataProX.txt file is found in Palm/User Folder/Data Pro.)
Use HotSync
a. Connect your Palm handheld to the HotSync cradle/cable. If you are using a
Dana, connect the USB cable to the Dana’s computer port (using the square or
“B” end of the USB cable) and to the computer’s USB port (using the flat or
“A” end of the USB cable).
b. Press the HotSync button
TM
on the cradle/cable. On Dana, press the
function and sync keys.
c. You should get a message on your computer screen indicating that your Palm
handheld and computer are communicating.
When this process is completed, the data file will be stored in the Data Pro folder
in the Palm User folder on your computer, as a text file (DataProX.txt).
d. Launch a spreadsheet application, such as Microsoft Excel. Navigate to the
location of DataProX.txt (in Palm/User Folder/Data Pro) on your computer,
and import the file into spreadsheet application.
Data Pro 34
Page 37

D
Printing Directly from your Palm OS Device
Now that you have collected data and analyzed data on your Palm OS device, you may wish to
print particular screens from Data Pro, including Graphs, Graphs with analysis features
displayed (e.g., curve fits), or even data tables. One way to do this, discussed earlier in this
booklet, is to transfer the data into Vernier Logger Pro or Graphical Analysis computer
software. But if would prefer to print directly from your Palm OS device, Data Pro now
includes support of PrintBoy print engine developed by Bachmann Software and Services.
PrintBoy printing features (by Bachman Software and Services) Data Pro uses the
PrintBoy print engine developed by Bachmann Software and Services. In order to print
directly from a Palm OS device to a printer, the two devices must be able to
communicate. PrintBoy communicates directly to your printer using an infrared (IR) port
(most handhelds have this), USB (used by the Dana from AlphaSmart), Bluetooth, Wi-Fi,
serial or TCP/IP connection. You will need to check your printer to see if it supports
infrared printing, or you can attach a USB cable from Dana. If your printer does not
support infrared printing, you may be able to attach an infrared adapter cable. (Visit
www.bachmannsoftware.com for accessories to allow your Palm OS device to
communicate with your printer.)
Installation of PrintBoy printer drivers During the installation of Data Pro you will be
asked if you would like to install the files needed to support printing directly from your
Palm OS device to a printer. If you would like to use the Data Pro printing feature simply
choose your handheld device that is listed in the Data Pro installation dialog. The proper
files will be copied to each of the Palm user Install folders on your computer. You must
then HotSync your Palm OS device after the Data Pro installation is complete. You will
be able to choose from one of the following printing installation options:
No Printing
Dana Printing
Palm Printing
IMPORTANT: Completing the PrintBoy Installation: After the installation you must
enable PrintBoy by setting a default printer to use. To do this, you will need to run the
PrintSetup application on your Palm OS Device. On your application screen, you should
now see an icon called PrintSetup. Tap this icon to run PrintSetup and tap the Cancel
button on the resulting message box. Select a printer from the drop-down list, and then
tap the Set As Default button. Tap OK several times to complete the installation. Now
you can start Data Pro and use the printing features.
The Generic printer will work for any printer; however, it will only allow you to print
tables from within Data Pro. Any of the other printers support both table and screen
printing. If you would like a wider selection of printers to choose from, visit
www.bachmannsoftware.com to obtain PrintBoy Premium Edition. PrintBoy Premium
ata Pro 35
Page 38

Edition can also allow you to print documents, spreadsheets, presentations, e-mail and
more from your Palm OS device.
Note: The Edit button of the PrintSetup application also allows you to alter the advanced
parameters of PrintBoy, like the connection type. By default, the infrared connection is
enabled.
Printing Tables To print a table at any time you can choose the Print Table option from
the Data Pro menu. When you choose the Print Table option, Data Pro will return to the
Main Screen and begin to format the data in your latest run. A progress indicator will be
displayed. After the formatting is complete, you will be asked to connect your Palm OS
device to your printer. At this point you must align your infrared transmitters, plug in
your USB cable, or otherwise connect your Palm OS device to your printer. Once
connected, press the OK button to send the table to the printer. If you have multiple data
runs in your Data Pro session, the other runs will be formatted and printed in order. Press
the Cancel button at any time to stop the Print Table operation.
Printing Screens (such as Graphs) To print an exact copy of any DataPro screen
choose the Print Screen option from the DataPro menu. Important: When you choose
the Print Screen option, your Palm OS device will immediately attempt to communicate
with your printer. It is important to align your infrared transmitter, plug in your USB
cable, or otherwise connect your Palm OS device to your printer before selecting this
option from the menu. The printed image will be the same size as the screen of your Palm
device.
Some printers or print drivers do not support graphical printing. (If so, you will be shown
an error indicating this limitation.) It is worthwhile to check for updated or newer printer
support at www.bachmannsoftware.com. The PrintBoy Premium Edition from Bachmann
Software gives you access to a wide array of printer types and models.
Data Pro 36
Page 39

Appendix A: Battery and Adapter Information
Operating Power Requirements
• The LabPro is designed to operate with four AA alkaline batteries.
• Factors that affect battery life are the actual time that the LabPro is collecting data and
the amount of current used by connected probes during your experiments.
• To extend battery life in the classroom we recommend that you use its AC power
adapter whenever possible.
• There have been significant improvements in the LabPro OS since it was first
released. You can go to www.vernier.com to update the LabPro OS.
• For long-term experiments out of the classroom, you can connect an external 6-Volt
lantern battery to the LabPro. (See Connecting an External 6-Volt Battery further in
this document.)
When to Replace Batteries
You can quickly check the status of your AA batteries by choosing About from the Data
Pro menu.
Note: Save all collected data before removing batteries. All LabPro setup information
and all collected data are lost if the batteries are removed and the optional AC adapter is
not connected to the LabPro.
Recommended Batteries For LabPro
• Four 1.5-Volt size AA alkaline batteries.
• One 6-Volt lantern type. Note: This is only necessary for long-term experiments
performed outside the classroom that draw large amounts of current (for example,
when using a motion detector). See Connecting an External 6-Volt Battery on the next
page of this manual for instructions.
Installing the AA Batteries
• Holding the LabPro upright, push the latch on the battery cover down with your finger
and pull the cover out.
• Replace all four AA alkaline batteries. Be sure to position them according to the
diagram inside the battery compartment.
• Replace the cover.
Data Pro 37
Page 40

Connecting the Optional AC Adapter
• Connect one end of an approved adapter to the external power input connection
located on the bottom left side of the LabPro.
• Plug the other end of the adapter into an electrical wall outlet.
Approved AC Power Adapters
The LabPro is designed to accept voltage input from an external AC-to-DC power adapter
that provides a regulated 6 Volts DC output when plugged into an electrical wall outlet.
The model IPS power supply is an AC-to-DC power adapter approved for use with the
LabPro. The use of other AC adapters is strongly discouraged.
Connecting an External 6-Volt Battery
• You can purchase an External Battery Cable from Vernier (order code EBC, $6).
• Connect one end of the external battery adapter to the external power input
connection located on the right bottom edge of the LabPro.
• Connect the red lead to the positive (+) terminal of the battery. Connect the black lead
to the negative (-) terminal of the battery.
38
Page 41

Appendix B: Vernier Sensors for Data Pro
Please che ck the Vernier Software & Technology web site www.ve rnier.com for current prices.
Sensor/Probe
3-Axis Accelerometer 3D-BTA
25-g Accelerometer ACC-BTA
Low-g Accelerometer LGA-BTA
Barometer BAR-BTA
Charge Sensor CRG-BTA
CO2 Gas Sensor CO2-BTA
Colorimeter COL-BTA
Conductivity Probe CON-BTA
Current Probe DCP-BTA
Differential Voltage Probe DVP-BTA
Dissolved Oxygen Probe DO-BTA
Drop Counter VDC-BTD
Dual-Range Force Sensor DFS-BTA
EKG Sensor EKG-BTA
Electrode Amplifier EA-BTA
Extra Long Temperature Probe TPL-BTA
Flow Rate Sensor FLO-BTA
Force Plate FP-BTA
Gas Pressur e Sensor GPS-BTA
Hand Dynamometer HD-BTA
Hand-Grip Heart Rate Monitor HGH-BTA
Instrumentation Amplifier INA-BTA
Ammonium Ion-Selective Electrode NH4-BTA
Calcium Ion-Selective Electrode CA-BTA
Chloride Ion-Selective Electrode CL-BTA
Nitrate Ion-Selective Electrode NO3-BTA
Light Sensor LS-BTA
Magnetic Field Sensor MG-BTA
Microphone MCA-BTA
Motion Detector MD-BTD
O2 Gas Sensor O2-BTA
ORP Sensor ORP-BTA
pH Sensor PH-BTA
Photogate VPG-BTD
Radiation Monitor RM-BTD
Relative Humidity Sensor RH-BTA
Respiration Monitor Belt (requires GPS-BTA) RMB
Salinity Sensor SAL-BTA
Sound Level Meter SLM-BTA
Spirometer SPR-BTA
Stainless St eel Temperature Pr obe TMP-BTA
Order Code
Data Pro 39
Page 42

Student Radiation M onitor SRM-BTD
Surface Temperature Sensor STS-BTA
Turbidity Sensor TRB-BTA
Thermocouple TCA-BTA
UVA Sensor UVA-BTA
UVB Sensor UVB- BTA
Voltage Probe VP-BTA
40
Page 43

Appendix C: Support and Service Information
Product Support
Customers in the U.S., Canada, Puerto Rico, and the Virgin Islands
For general questions or technical questions contact Vernier.
phone: (503) 277-2299
toll free: (888) 837-6437
e-mail: info@vernier.com
International Orders
All Vernier Software orders outside the US and Canada (except APO addresses) are
handled by our international distributor, Ed. USA.
(Note that some Texas Instruments Dealers in other countries sell our products.)
Ed. USA, Inc.
5026 Calle Minorga
Siesta Key
Sarasota, FL 34242 USA
FAX: 941-349-2766
Phone: 941-349-1000
E-MAIL: info@vernier-intl.com
Sales in Canada are handled by Merlan Scientific.
Merlan Scientific
247 Armstrong Ave
Georgetown, ON
Canada L7G 4X6
FAX: 800-374-6714
Phone: 800-387-2474
E-MAIL: info@merlan.ca
Product Service
Contact Vernier before returning a product for service.
Other Vernier Services
Visit the Vernier home page on the World Wide Web.
www.vernier.com
Palm Handheld Information
Visit the Palm home page on the World Wide Web.
www.palmone.com
Dana by AlphaSmart Information
Visit the AlphaSmart home page
www.alphasmart.com
Data Pro 41
Page 44

Appendix D: Data Pro Troubleshooting Guide
Screen Explanation
No LabPro Found
Is LabPro powered
and connected to the
Palm?
Did You Install and
HotSync Your Current
Palm OS device?
Not successfully
performing a HotSync
on a Macintosh
computer
I want to Install Data
Pro to Multiple Palm
OS devices
This screen appears when LabPro is not connected to the Palm or
when LabPro needs new batteries.
♦ Check the connection between LabPro and your Palm. Firmly push
in the cable, and then choose Retry.
♦ Check that any other devices that plug into the HotSync port are
disabled. Keyboards are a common example.
♦ If you choose Retry without correcting the problem, the error screen
reappears.
♦ If you choose Continue, then you can continue working in Data Pro
(on collected data, saved data, or in Manual Entry mode) but you
won’t be able to collect new data.
This screen appears when the LabPro is disconnected from the Palm
and used for a different task or when the LabPro loses power. When
the LabPro and Palm are reconnected, the Palm may not recheck the
sensor setup, and this error results.
Select
A common error is not to have previously installed Palm Desktop
software, or not to have previously performed a HotSync with the Palm
OS device on which you are installing.
to perform a new setup.
Palm Desktop Software for Macintosh Computers
Make sure that the HotSync Manager is enabled. Start the Palm
Desktop application. Select the HotSync/Setup… menu and see if
the Enabled button is on.
Installing Data Pro to Multiple Palm OS devices
If you have more than one Palm device on which you are installing
Data Pro software, you will follow the same directions as outlined
in the previous section. It is important that you have previously
connected and done a HotSync with each of the Palm devices
before running the Data Pro installer—the HotSync will ensure
that a user’s folder has been created for each of the Palm devices.
Following the directions in the previous section, a Data Pro folder
will be created in each of the Palm User folders on that computer;
this way, as you do a HotSync for each Palm OS device, Data Pro
will be transferred to that Palm device, one at a time.
42
Page 45

Appendix E: Data Pro Sensor Setup Default Settings
The table that follows shows the default settings used by the Data Pro program as well as the
Quick Setup feature of LabPro. This sensor and calibration information applies only to
Vernier and TI sensors. The use of other manufacturers’ sensors may require calibration or
the input of that sensor’s calibration information into Data Pro.
Note: Default settings apply only when using a single sensor that is connected to Channel 1.
Sensor Name
Dir connect Temp (°C) TEMP(C) -15 110 1 180
Dir connect Temp (°F) TEMP(F) 0 250 1 180
Extra Long Temp (°C) TEMP(C) -50 150 1 180
Short Name
Y-Min
Y-Max
Sample
Interval
(in
seconds)
No. Of
Samples
Stainless Temp (°C) TEMP(C) -20 125 1 180
Stainless Temp (°F) TEMP(F) -5 260 1 180
Thermocouple (°C) TEMP(C) -200 1400 1 180
Surface Temp (°C) TEMP(C) 0 50 1 180
pH PH 0 14 2 60
Conduct 200 (µS) CONDUCT
(MICS)
Conduct 100(mg/l) TDS(MG/L) 0 100 1 180
Conduct 2000(µS) CONDUCT
(MICS)
Conduct 1000(mg/l) TDS(MG/L) 0 1000 1 180
Conduct 20000(µS) CONDUCT
(MICS)
Conduct 10000(mg/l) TDS(MG/L) 0 10000 1 180
Gas Pressure (kPa) PRESS
(KPA)
Gas Pressure (mm Hg) PRESS
(MMHG)
0 200 1 180
0 2000 1 180
0 20000 1 180
50 150 10 90
400 1200 10 90
Gas Pressure (atm) PRESS
(ATM)
Gas Pressure (in Hg) PRESS
(INHG)
Pressure (kPa) PRESS
(KPA)
Data Pro 43
0.5 1.6 10 90
0 65 10 90
0 700 1 180
Page 46

Sensor Name
Pressure (atm) PRESS
(ATM)
Pressure (mm Hg) PRESS
(MMHG)
Bio Pressure (kPa) PRESS
(KPA)
Bio Pressure (mm Hg) PRESS
(MMHG)
Bio Pressure (atm) PRESS
(ATM)
Bio Pressure (in Hg) PRESS
(INHG)
Dual R Force (5N) FORCE(N) -5 5 0.02 180
Dual R Force (10N) FORCE(N) -10 10 0.02 180
Dual R Force (50N) FORCE(N) -50 50 0.02 180
Student Force (N) FORCE(N) -40 10 0.02 180
Short Name
Y-Min
0 700 1 180
0 5200 1 180
76 156 10 90
550 1200 10 90
0.75 1.6 10 90
20 50 10 90
Y-Max
Sample
Interval (in
seconds)
No. Of
Samples
Force Plate (850 N) FORCE(N) -200 800 0.02 180
Force Plate (3500N) FORCE(N) -800 3500 0.02 180
EX Heart Rate (bpm) Heart RT(BPM) 45 170 5 180
HGH Heart Rate (bpm) Heart RT(BMP) 40 170 0.2 180
Heart Rate (bpm) Heart RT(BPM) 45 170 5 180
25G Accel (m/s2) ACCEL
(M/S2)
Low G Accel (m/s2) ACCEL
(M/S2)
Colorimeter ABSOR-BANCE 0 0.6 5 180
CO2 Gas (ppm) CO2 GAS (PPM) 0 5000 10 30
CO2 Gas (ppt) CO2 GAS (PPT) 0 5 10 30
CBL Microphone MICRO-PHONE 0 5 1.00E-04 200
ULI Microphone MICRO-PHONE 0 5 1.00E-04 200
MPLI Microphone MICRO-PHONE -5 5 1.00E-04 200
TI Light Sensor LIGHT 0 1 0.05 180
-250 250 0.05 100
-50 50 0.05 100
44
Page 47

Sensor Name
Short Name
Y-Min
Y-Max
Sample
Interval (in
seconds)
No. Of
Samples
Light 600(lx) LIGHT(LX) 0 600 0.05 180
Light 6000(lx) LIGHT(LX) 0 6000 0.05 180
Light 150000(lx) LIGHT(LX) 0 150000 0.05 180
UVA (MW/M^2) UVA (MW/M^2) 0 2000 1 100
UVB (MW/M^2) UVA (MW/M^2) 0 1000 1 100
D. Oxygen (mg/l) DO(MG/L) 4 12 2 60
EKG EKG -0.5 4 0.01 200
CA ISE (mg/l) CA(MG/L) 0 40000 1 180
NH4 ISE (mg/l) NH4(MG/L) 0 18000 1 180
NO3 ISE (mg/l) NO3(MG/L) 0 14000 1 180
CL ISE (mg/l) CL(MG/L) 0 36000 1 180
Flow Rate (m/s) FLOW RT (M/S) 0 4 1 180
Flow Rate (ft/s) FLOW RT (FT/S) 0 13 1 180
Respiration (bpm) RESP RT (BPM) 0 30 10 180
Turbidity (ntu) TURBID (NTU) 0 50 1 180
C V Current (A) CURRENT (A) -0.6 0.6 0.1 180
C V Voltage (V) VOLTAGE (V) -6 6 0.1 180
Voltage -10 to +10 (V) VOLTAGE (V) -10 10 0.1 180
Voltage 0 to 5 (V) VOLTAGE (V) 0 5 0.1 180
Hi Magnet Fld (mT) MAGNET F(MT) -0.32 0.32 0.05 180
Hi Magnet Fld (g) MAGNET F(G) -3.2 3.2 0.05 180
Lo Magnet Fld (mT) MAGNET F(MT) -10 5 0.05 180
Lo Magnet Fld (g) MAGNET F(G) -100 50 0.05 180
Barometer (kPa) BARO(KPA 80 110 600 180
Barometer (mm Hg) BARO (MMHG) 600 800 600 180
Data Pro 45
Page 48

Sensor Name
Barometer (in Hg) BARO (INHG) 24 32 600 180
Barometer (mBar) BARO (MBAR) 810 1060 600 180
Relative Humidity (%) REL HUM (PCT) 0 100 600 180
Oxygen Gas (%) O2 GAS (PCT) 15 25 15 40
Oxygen Gas (%) O2 GAS (PPT) 150 250 15 40
Custom 0 to 5 (V) CUSTOM 0 5 1 180
Custom -10 to +10 (V) CUSTOM -10 10 1 180
Motion (m) MOTION (M) 0 6 0.05 100
Motion (ft) MOTION (FT) 1 20 0.05 100
Current Probe (A) CURRENT (A) -10 10 0.1 180
Resistance (ohm) RES (OHM) 0 100000 0.1 180
Charge Sensor (nC) CHARGE 0.5(nC) -5 5 .5 120
Charge Sensor (nC) CHARGE 2(nC) -20 20 .5 120
Short Name
Y-Min
Y-Max
Sample
Interval (in
seconds)
No. Of
Samples
Charge Sensor (nC) CHARGE 10(nC) -100 100 .5 120
Hand Dynamom. (N) HAND (N) 0 700 0.125 480
Hand Dynamom. (lb) HAND (LB) 0 150 0.1 500
Hand Dynamom. (kg) HAND (KG) 0 600 0.1 500
ORP (mV) SIGNAL (mV) -400 600 1 180
Relative Humidity (pct) REL HUM (PCT) 0 100 600 180
Salinity (ppt) SAL (PPT) 0 50 1 60
Spirometer (L/s) FLOW (L/s) -4 4 0.04 500
Sound Level SOUND (DB) 0 130 6 100
46
 Loading...