

Page 1
Application Note: OpticMapper
Proper Mapping Techniques
1. Equipment Testing. Before mapping, perform equipment tests using electronics test
load and reference block, as recommended by Operations Manual.
2. Recognize Effects of Soil Condition. In order to generate high quality OM data, it’s
crucial to understand that field history, soil conditions, and equipment settings can affect
estimations of OM from OpticMapper measurements. The most important consideration
is soil moisture: moist soil and organic matter are both darker in color than dry soil and
low OM, which could lead to confusing and erroneous estimations of soil organic matter.
Effective OM field mapping requires consistent moisture levels—of course soils have
natural differences based on soil water-holding capacity--sand will have less moisture,
clay more. What are critical to prevent are management-related moisture
inconsistencies. These can be caused by:
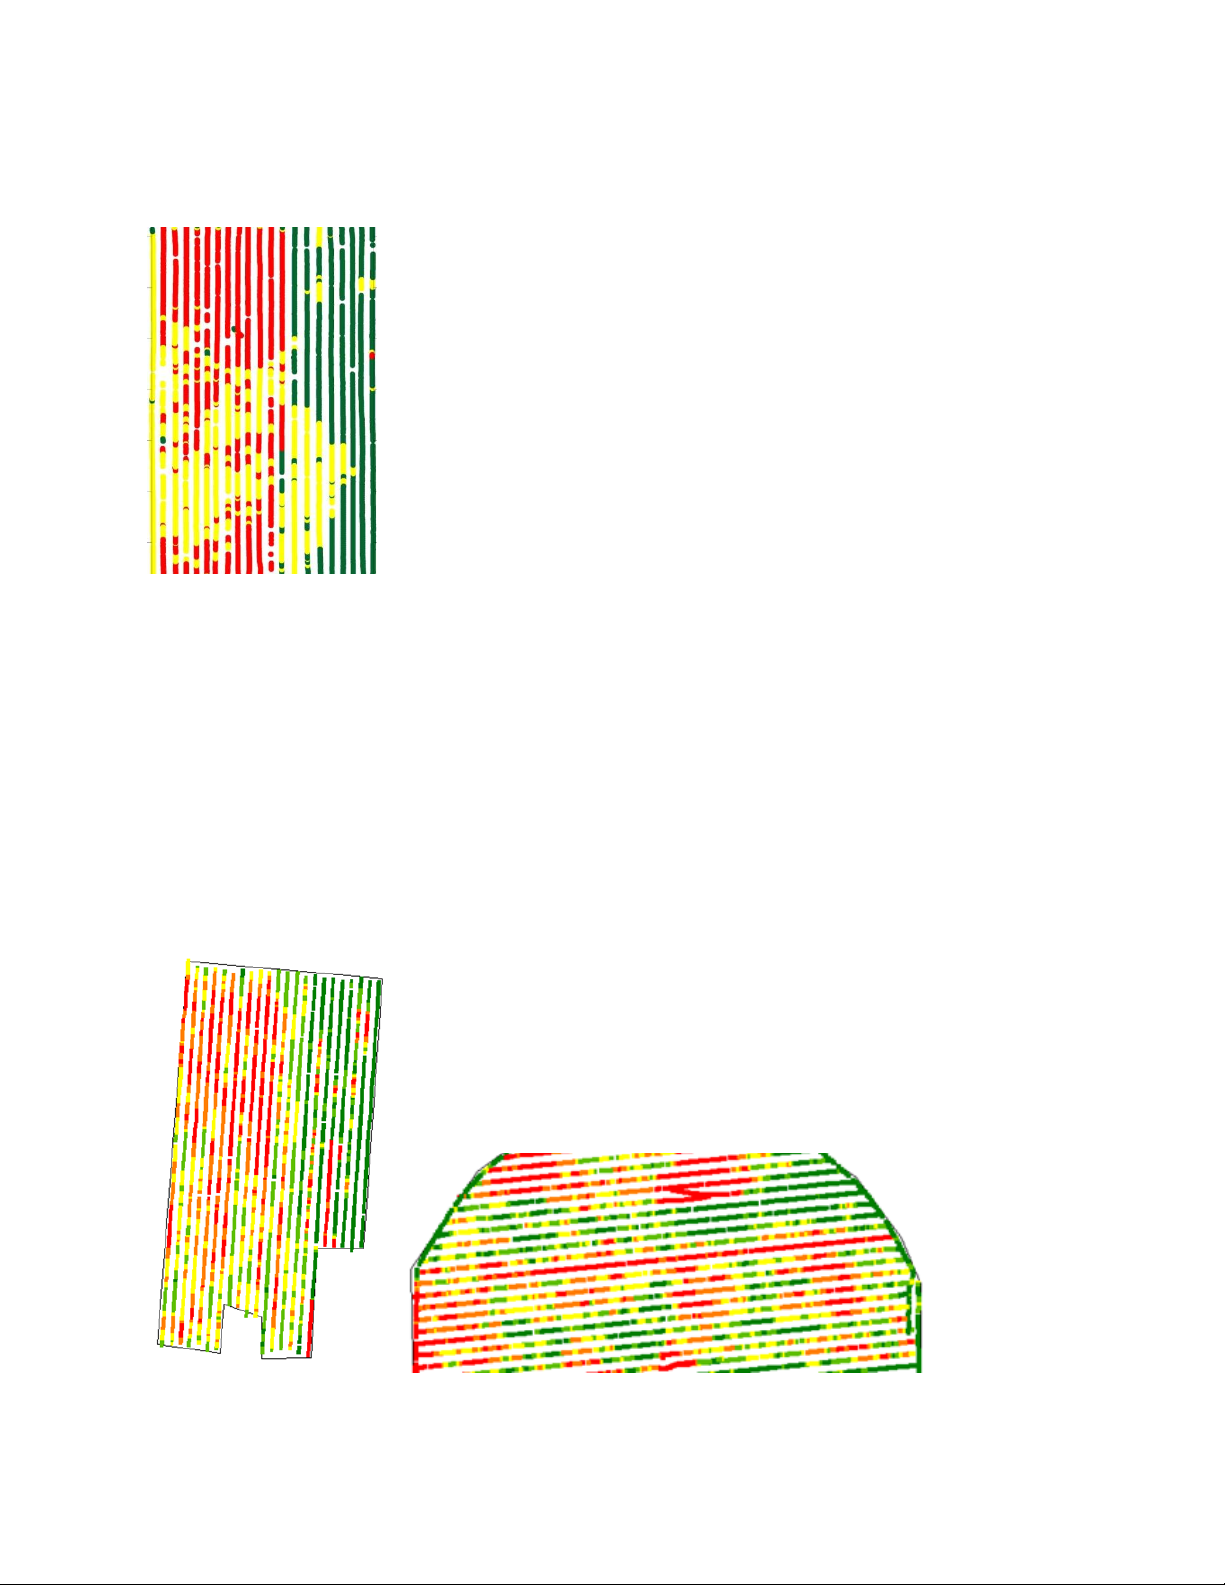
a) A field having two or more moisture conditions, due to tillage, cropping, or irrigation
differences (Figure 1). To avoid these situations, treat each condition as a separate
field: map differing conditions on separate files, and make sure both conditions are
represented with calibration samples.
Figure1. Moisture variation between two fields mapped as one
b) Adjustment of OpticMapper during mapping—changing depth or down-pressure
which causes sensing depth to change (Figure 2). If in-field adjustments are required,
Page 2
begin a new file and make sure both conditions are represented with calibration
samples.
Figure 2. Data shift due to adjustment of OpticMapper during mapping
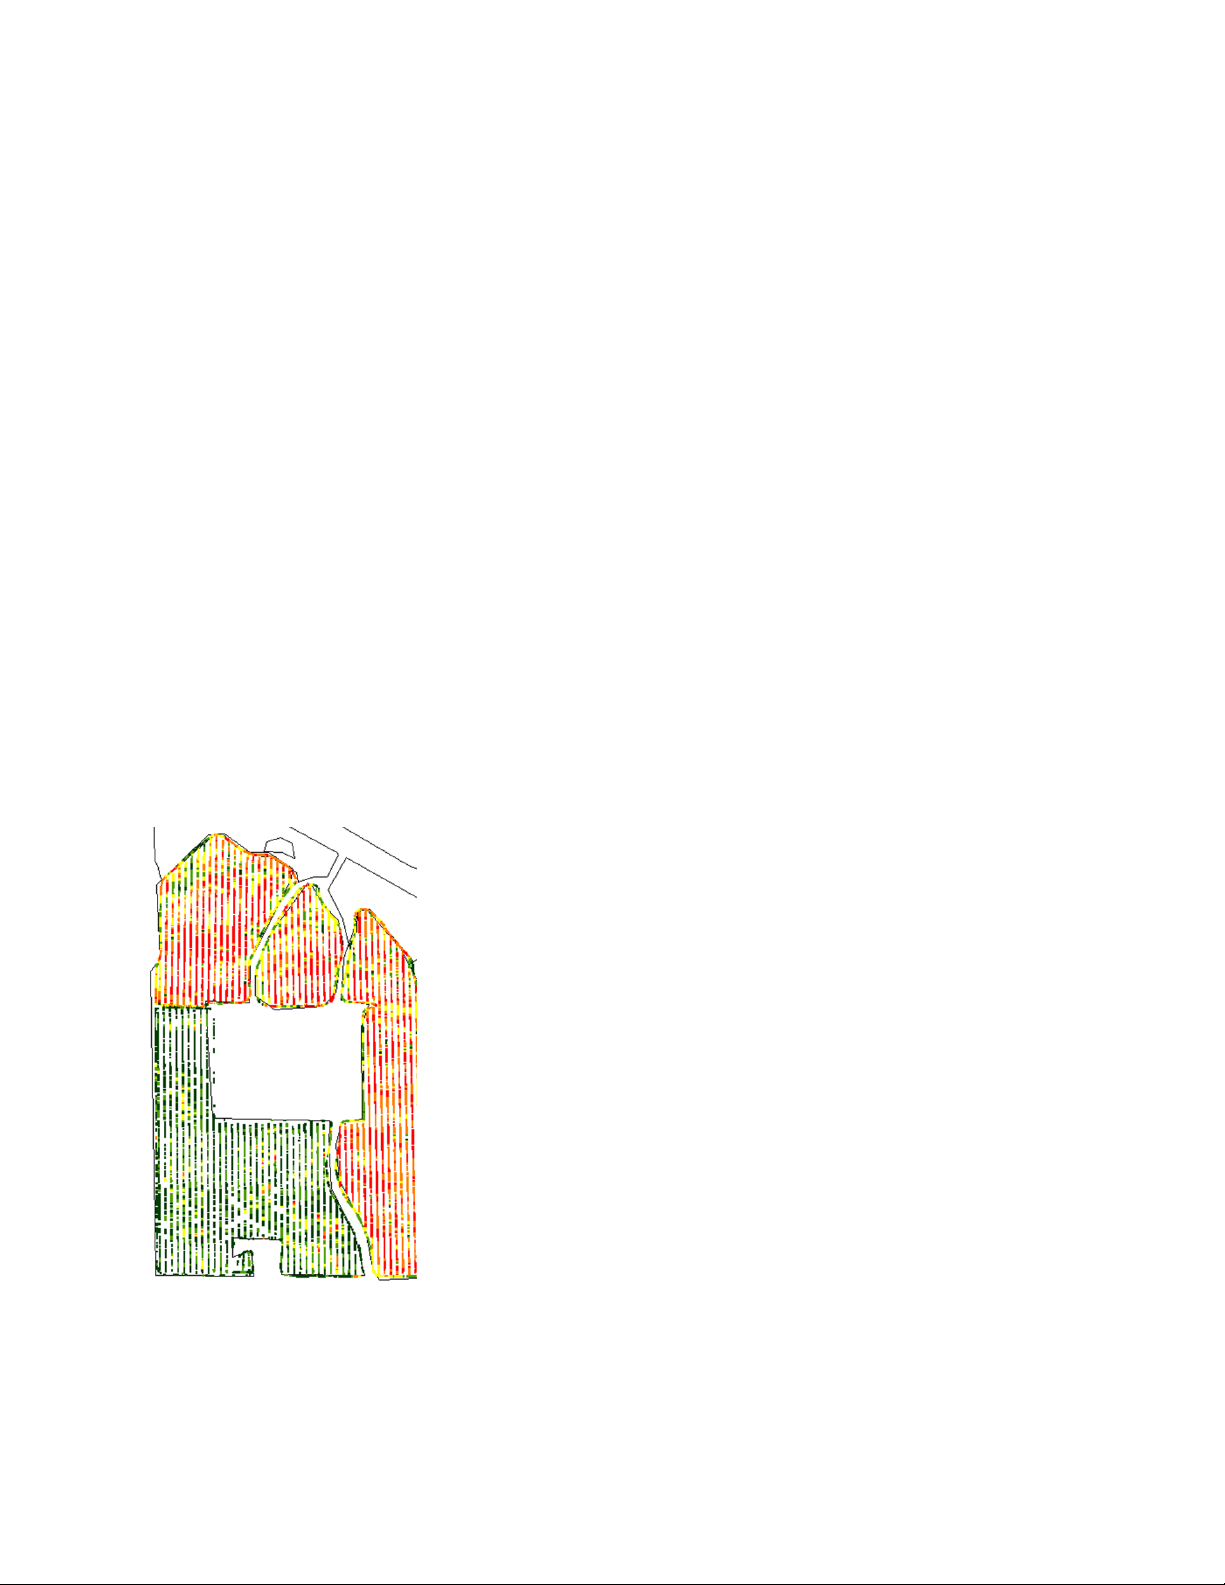
c) Inconsistent row unit penetration—if the OpticMapper encounters a wheel track on
one pass and soft soil the next, there will be a different sensing depth for the two
passes. Similarly, if one pass is in bare soil and the next behind the combine pass with
thick residue, there could be a moisture difference at the sensor operating depth.
These appear as stripes in the map (Figure 3). To avoid, drive at slight angle to
predominate field traffic pattern if possible; this should eliminate streaks/strips, and will
help isolate cause if they occur (Figure 4). If not possible to map at angle, avoid wheel
tracks and heavy residue strips if possible. Move over if necessary—consistent soil
conditions are more important than consistent swath width.
Figure 3. Stripes due to inconsistent penetration or equipment issue
Page 3

Figure 4. Mapping at a slight angle to main fieldwork pattern
Note: Inaccurate estimations of organic matter due to soil moisture conditions
can have serious consequences for applications of nitrogen and population.
3. OM differences due to field history. It’s reasonable to expect fields with different
histories that have been merged to have an actual shift in reflectance and OM.
Differences within merged fields can be due to manuring history, silage production,
long-term no-till, years since native sod, and other factors. In order to develop highquality calibrations to organic matter, make sure fields are thoroughly represented with
calibration samples, especially if smaller fields have been combined into larger fields.
4. Map field using these guidelines:
-use 50-75’ transects
-if field has been cropped differently within past year, map each cropping area
separately
-don’t adjust depth or down pressure in field; start new file if you do
-drive at slight angle to predominate field traffic pattern if possible; this should eliminate
streaks/strips, and will help isolate cause if they occur
Page 4

- if not possible to map at angle, maintain soil and residue consistency for OpticMapper
row unit; avoid wheel tracks and heavy residue strips if possible.
-double back (also called skip-pass) if feasible as shown below (Figure 5); this provides
a more stringent pass-to-pass repeatability test
Figure 5. Double-back or skip-pass method
5. Sample the field using these guidelines
-use Veris SoilViewer software suggested sample locations, if possible
-if setting own points, choose minimum of 4 sample locations based on: well-structured
Optic-Mapper zones of greatest contrast (Figure 6)
-use OpticMapper point data (not contoured or smoothed maps) when selecting points,
since outliers and small areas may be masked by smoothing;
-include contrasting EC zones if possible
-distribute sampling points throughout field
-sample at a consistent depth; 0-6” typical
-for each lab sample, collect minimum of 5 cores within 30 ft radius
-legacy grid sample data can be used, if point sampled (<50 ft radius) and
latitude/longitude are available; calibration to OM cannot typically be accomplished
using zone samples
Page 5

Figure 6. Examples of proper sample selection (left) and improper (right). Problems are:
samples do not represent full field—none north of waterway; samples are at edges, on
transition zones or in ‘noisy’ areas; samples do not represent widest possible range of
values.
 Loading...