

Page 1
Veris NIRS Spectrophotometer
QUICK REFERENCE CARD
(Refer to Operations Manual for complete instructions, including
software installation, safety, maintenance, and troubleshooting.)
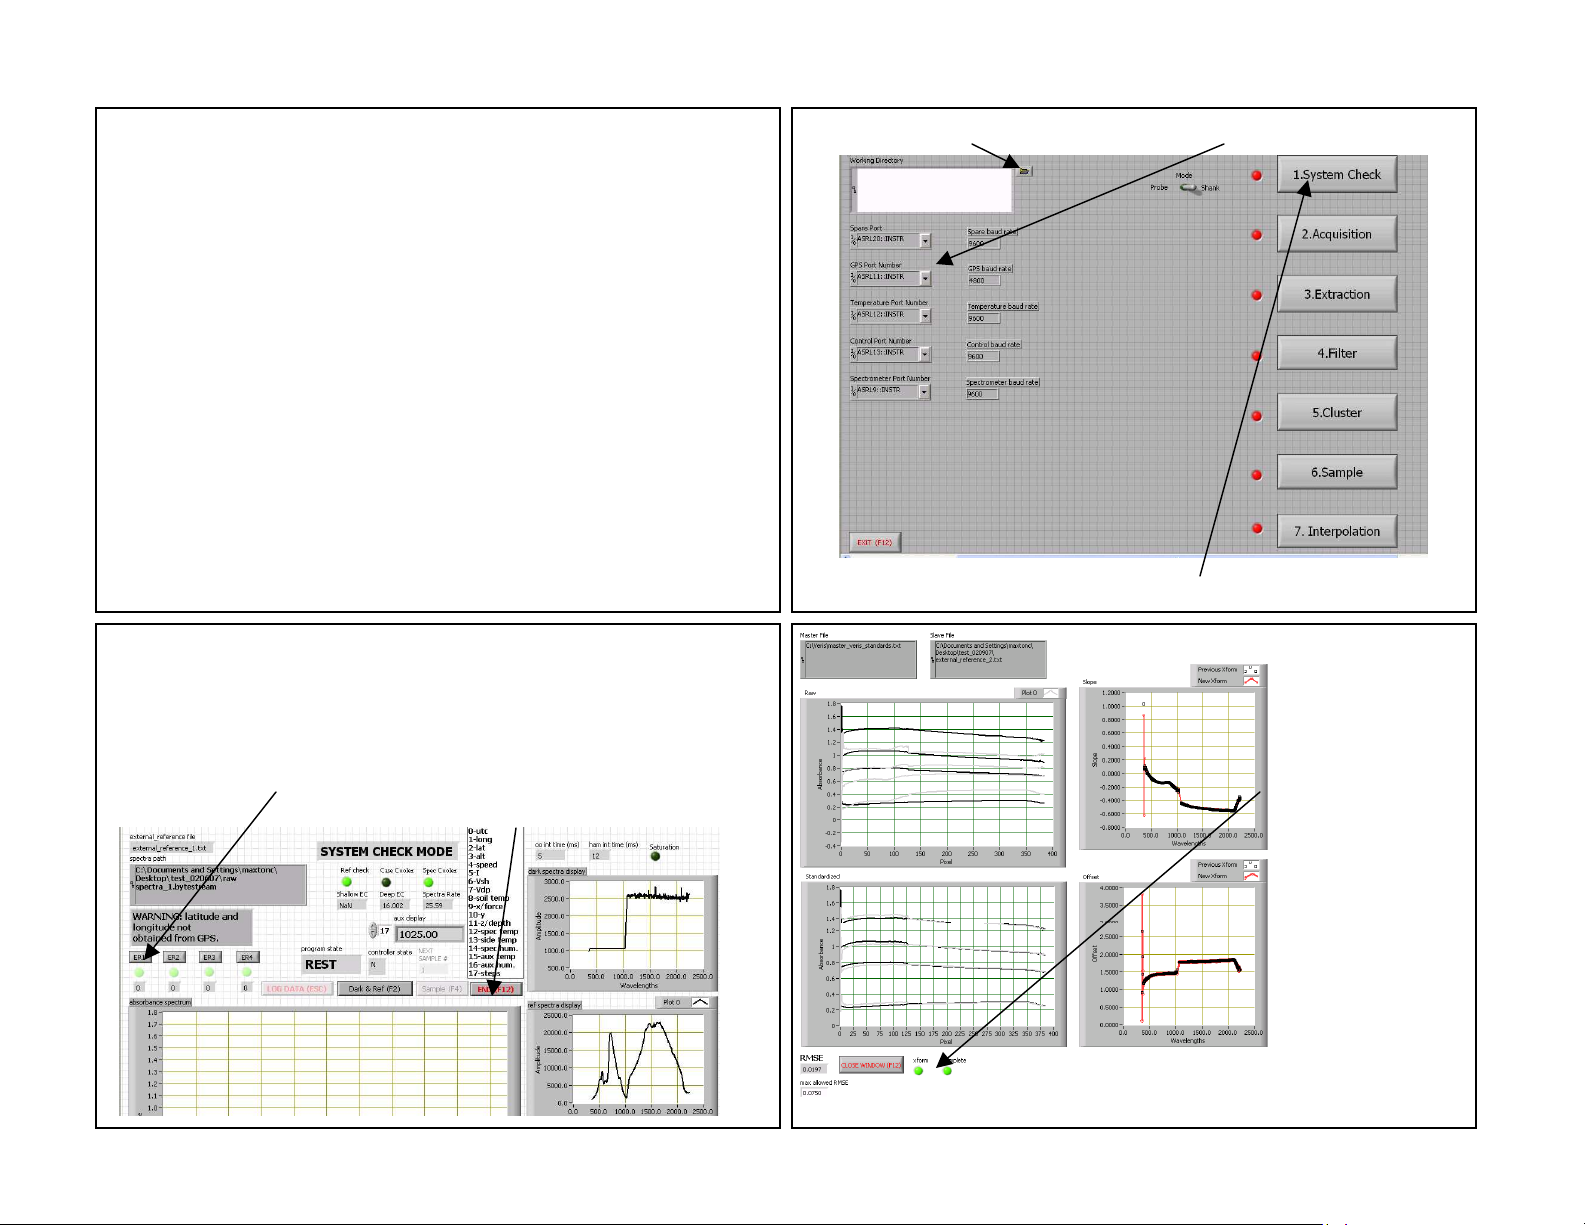
3. Select field folder 4. Set port order (if changed)
1. Start up spectrometers 20
minutes before using. Leave
vehicle running to keep battery
charged. (amperage draw is 10
amps if cooler is running; 1 amp
2. Start software.
Refer to Operating
Instructions for
software installation
procedure.
otherwise)
6. Clean window, and place external references (ER)
against window. Soil may need to be removed from shoe
holes. Press corresponding button when Program State
reads REST. Continue until all ER lights are green or yellow.
7. Press End (F12) to transform.
5. Press System Check button
8. Green light
indicates when
transform is
complete.
READY
TO MOVE TO
NEXT STEP—
DATA
ACQUISITION.
Press Close
Window/F12 to
move back to
main interface
screen.
Page 2
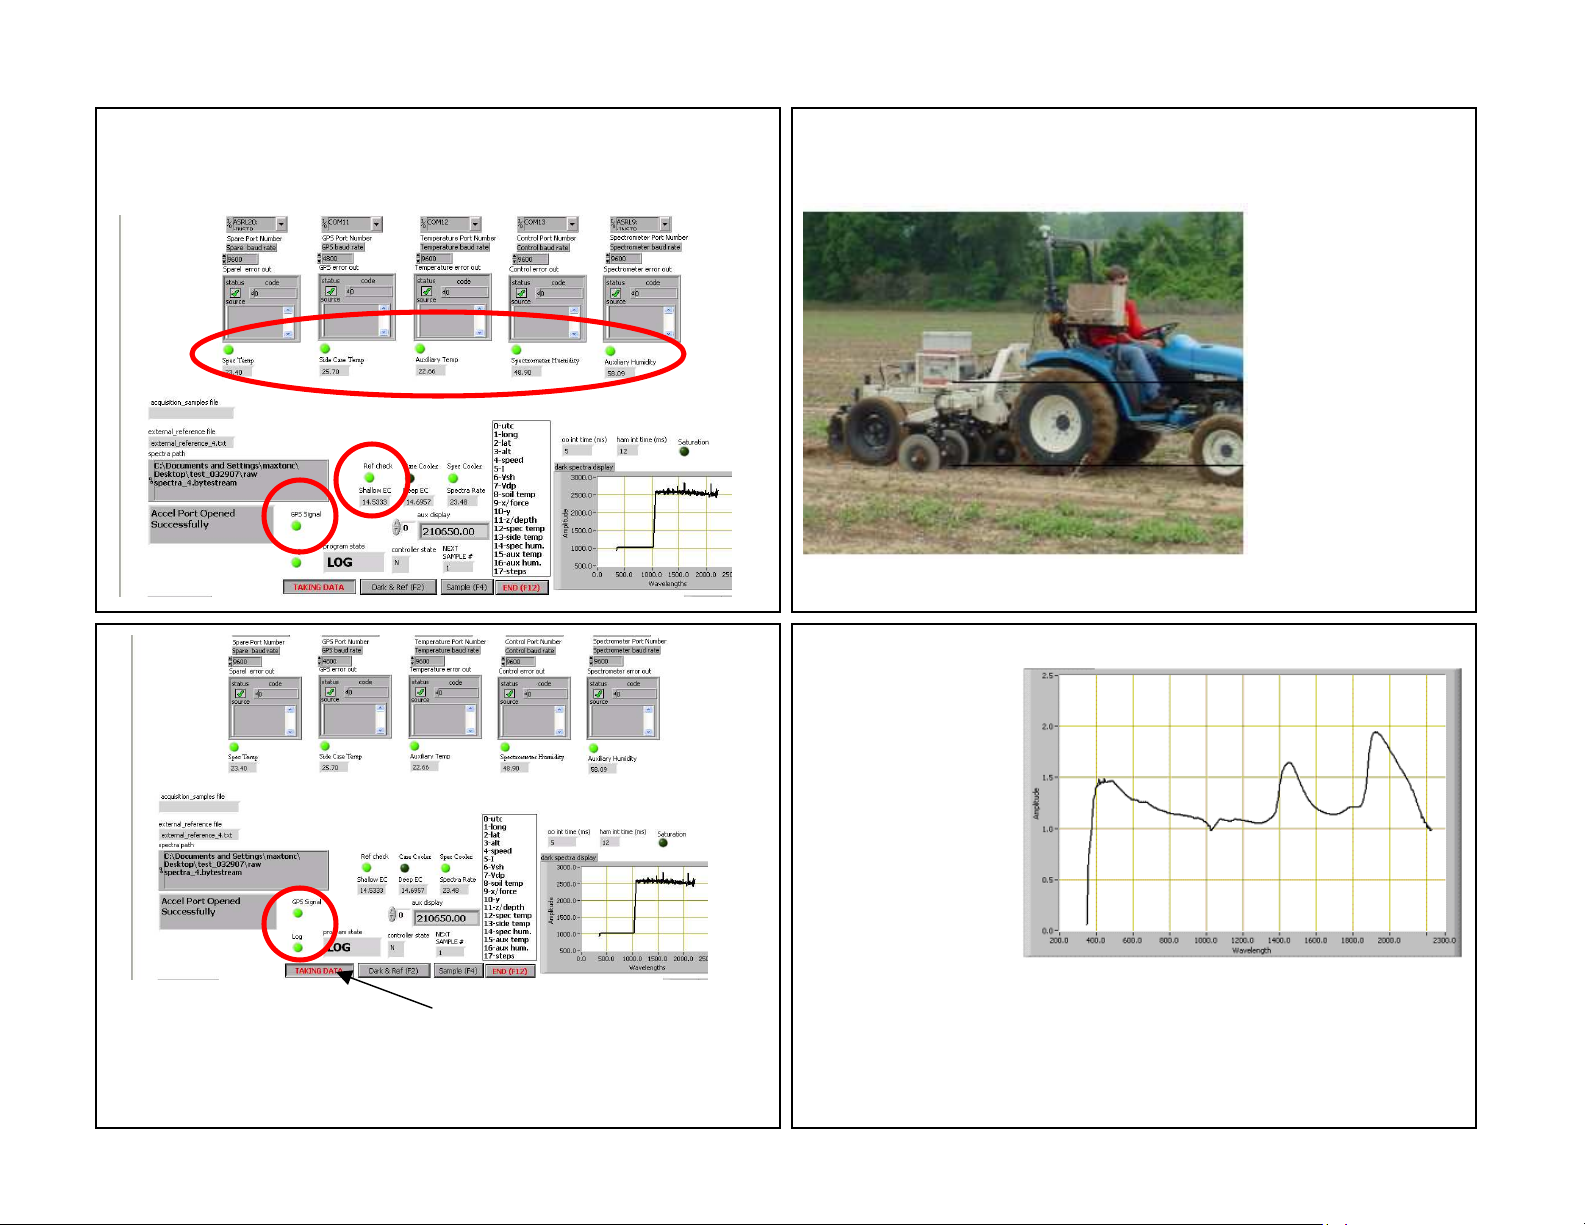
9. Before mapping complete all steps above. Make sure
Reference Check (Ref Check) light is green, all Auxiliary
Case lights are green, and GPS data are being received.
11. Begin mapping: Pressing LOG button or ESC key stores
spectrum data and auxiliary data, which includes EC data,
until LOG button or ESC key has been pressed again. GPS
and Log lights must be green for data to be recorded.
10. Set depth
of EC coulters
approximately
1.5“ in soil.
Make sure the
implement
frame is level.
12. Pull forward
with shank in
ground. The
absorbance
should not rise
more than 0.1. If
absorbance
jumps more than
0.1, readjust
shank so it tilts
back slightly, and
retest.
Page 3

13. While mapping: watch display for following:
-Log light must be green while collecting data; if not green
stop immediately and determine problem
-GPS data light is green
-EC data—no negatives, numbers changing and in normal
ranges
-auxiliary case information—green lights and data
-program is in LOG mode when attempting to collect data
-whenever shank is raised out of the soil, press LOG button
or ESC key to stop logging, re-press LOG button or ESC
key to re-start logging when shank is in soil.
-system will automatically collect a dark and reference
every 10 minutes—the next time the LOG button or ESC
key is pressed after a 10 minute period. Before re-starting
at the end of each round, check to make sure system isn’t
collecting a dark and reference.
14. When all data have been acquired press F12 or End to
return to the main interface screen, shown below. Press #3
Extraction to the bytestream files and apply the appropriate
transform, then output the data into a single text file.
15. After each bytestream file has been extracted, the
message “EOF” will appear. Press enter to continue on to
the next file. Once all the data have been processed,
indicated by a green complete light, click on close window or
F12 to return to main interface.
16. Press #4 on main interface to begin filtering: the spectra
are compressed using principal components compression,
and outliers are removed. Maps of each principal component
(up to 10) are displayed, and the results of the PC analysis
and filtering are output to ASCII formatted files. Press F12 to
return to main interface.
Page 4

17. Press #5 to initiate the clustering program--it will ask if
the settings are correct. The settings are the number of
clusters or sample locations, and the number of PC’s to
use for clustering. By default there will be 3 PC’s used and
15 locations to sample. If more sample locations are
desired, then this can be changed at this time. Up to 10
PC’s can be chosen, however 95% of the data is contained
within the first 3 PC’s. If these settings are acceptable,
then select YES or, to update the settings press NO. If NO
was selected, update the settings and press continue to
begin clustering the data. Once the data have been
clustered, the program status will say done and the
complete light will be lit. Press close window or F12 to
return to the main interface. EC data file is in folder—file is
named ec.txt
18. Press #6 to conduct soil sampling. Navigate to the GPS
coordinates of desired sample locations from previous step,
and press ENTER to record actual sample locations.
19. Once all
the desired
sampled
locations have
been stored,
press close
window or F12
to return to the
main interface.
20. Press #7 to interpolate/average spectra near sampled
locations. Outputs a file named spectra@locations.txt to
the working directory. This file contains the spectra and
auxiliary data for each sampled GPS location. If settings
other than defaults are desired, see Operations Manual for
detailed information. After the interpolation is done the
complete light will be green.
Press close
window or
F12 to return
to the main
interface.
 Loading...