

VeEX VEPAL CX350S-D3.1 User Manual
CX350s-D3.1 e-Manual D07-00-102P RevA01
Page 1 of 109

Table of Contents
CX350s-D3.1 e-Manual D07-00-102P RevA01
Page 2 of 109
1.0 About this User Manual
2.0 Product Introduction
3.0 Safety Information
4.0 Basic Operation
4.1 Compact Platform Overview
4.2 Keypad
4.3 Touch-Screen Display
4.4 Battery
4.5 Connector Panels
4.5.1 Test Ports
4.5.2 Utility Ports
5.0 Home Screen and Menu
5.1 Screen Layout
5.2 Screen Icons
6.0 Setup
6.1 Channel Tables and Locations
6.1.1 Channel Tables
6.1.2 Locations
6.1.3 Test Point Compensation
7.0 Test Applications
7.1 Single Channel Measurement
7.1.1 Analog Channel Measurements
7.1.2 Digital Channel Measurements
7.1.3 Constellation Measurements
7.2 Tilt Analysis
7.3 System Scan

7.4 Spectrum Analysis
CX350s-D3.1 e-Manual D07-00-102P RevA01
Page 3 of 109
7.4.1 Setup
7.4.2 Amplitude Measurements
7.4.3 Ingress Measurements
7.4.3.1 Forward Path Ingress
7.4.3.2 Reverse Path Ingress
7.5 Cable Modem
7.5.1 Setup
7.5.2 Cable Modem Results - DOCSIS 3.0
7.5.3 Cable Modem Results - DOCSIS 3.1/OFDM
7.6 Upstream Signal Generator (USG)
7.7 Installation Check
7.8 Advanced Tools
7.8.1 Return Path Analysis
7.8.1.1 RP Level Measurements
7.8.1.2 RP Constellation Measurements
7.8.1.3 RP Measurement and Troubleshooting
7.8.2 Sweep Operations
7.8.3 Remote Operations
7.8.4 R-Server
7.8.5 RP Balancing
7.8.6 TDR
7.8.6.1 Principles of Operation
7.8.6.2 Setup
7.8.6.3 Operation
7.8.6.4 TDR Profile
7.8.6.5 Typical Fault Displays
7.8.7 DS1
8.0 Tools
8.1 IP Tools

8.1.1 Setup
CX350s-D3.1 e-Manual D07-00-102P RevA01
Page 4 of 109
8.1.2 IP Connection Status
8.1.3 Ping
8.1.4 Trace Route
8.2 NetWiz
8.2.1 Net Wiz Setup
8.2.2 Net Wiz Results
8.3 WiFiWiz
8.3.1 WiFi Procedure
8.4 Advanced
8.4.1 Fiber Scope
8.4.1.1 Automatic Focus Detection and Analysis
8.4.1.2 Main Advantages of Automatic Focus Detection
8.4.1.3 The Importance of Fiber Connector Inspection
8.4.1.4 Fiber Connectors and Test Gear Vulnerabilities
8.4.1.5 About the DI-1000 Fiber Inspection Scope
8.4.1.6 Fiber Connector Inspection Setup
8.4.1.7 Capture Tab (View)
8.4.1.8 Captured Files Tab
8.4.2 Optical Power Meter (OPM)
8.4.2.1 Setting Pass/Fail Limits
8.4.3 WiFi Spectrum Analyzer
8.4.4 Data Card
8.4.5 WiFi inSSIDer
8.4.6 OTDR Viewer
8.5 Web Browser
9.0 Utilities
9.1 About
9.2 Screen
9.3 Bluetooth
9.4 Power

9.5 Backlight
CX350s-D3.1 e-Manual D07-00-102P RevA01
Page 5 of 109
9.6 Global
9.7 Date and Time
9.8 Remote Access
10.0 File Management
10.1 File Manager: Working with Saved Results, Profiles, Images
11.0 Setup - Main Menu
12.0 ReVeal Software
13.0 Warranty and Software
14.0 Product Specification
15.0 Certification and Declarations
16.0 About VeEX
Go back to top

1.0 About This User Manual
CX350s-D3.1 e-Manual D07-00-102P RevA01
Page 6 of 109
Every effort was made to ensure that the information contained in this user manual is accurate. Information is subject to change
without notice and we accept no responsibility for any errors or omissions. In case of discrepancy, the web version takes
precedence over any printed literature.
(c) Copyright 2006-2016 VeEX Inc. All rights reserved. VeEX, VePAL are registered trademarks of VeEX Inc and/or its affiliates in
the the USA and certain other countries. All trademarks or registered trademarks are the property of their respective companies.
No part of this document may be reproduced or transmitted electronically or otherwise without written permission from VeEX Inc.
This device uses software either developed by VeEX Inc or licensed by VeEX Inc from third parties and is the confidential and
proprietary of VeEX Inc. The software is protected by copyright and contains trade secrets of VeEX Inc or VeEX's licensors. The
purchaser of this device agrees that it has received a license solely to use the software as embedded in the device, and the
purchaser is prohibited from copying, reverse engineering, decompiling, or disassembling the software.
This user manual is suitable for novice, intermediate, and experienced users and is intended to help you successfully use the
features and capabilities of the VePAL CX350 test set. It is assumed that you have basic computer experience and skills, and are
familiar with IP and telecommunication concepts, terminology, and safety.
For more technical resources, visit VeEX Inc web site at
If you need assistance or have questions related to the use of this product, call or email our customer care department for
customer support. Before contacting our customer care department, you must have your product serial number and software
version ready. Please go to Settings for details on locating your unit serial number in the menus or locate the serial number on
the back of the chassis. Please provide this number when contacting VeEX customer service.
Customer
Phone: +1 510 651 0505
Email:
Website:
Go back to top Go back to TOC
Care:
customercare@veexinc.com
www.veexinc.com
www.veexinc.com.

2.0 Product Introduction
CX350s-D3.1 e-Manual D07-00-102P RevA01
Page 7 of 109
The VeEX™ VePal CX350s-D3.1 is a next generation test solution for analog and digital cable TV networks. The unit is a
lightweight, rugged and weather resistant instrument featuring Analog and Digital signal level meter capabilities and is equipped
with enhanced spectrum, forward and return path analysis functions. The unit can be equipped with an optional DOCSIS 3.0/3.1
Cable Modem to validate DOCSIS and EuroDOCSIS-based networks. Equipped with an Upstream QAM Signal Generator (USG),
the unit is able to perform advanced reverse path QAM analysis.
Go back to top Go back to TOC

3.0 Safety Information
CX350s-D3.1 e-Manual D07-00-102P RevA01
Page 8 of 109
Safety precautions should be observed during all phases of operation of this instrument. The instrument has been designed to
ensure safe operation however please observe all safety markings and instructions. Do not operate the instrument in the
presence of flammable gases or fumes or any other combustible environment. VeEX Inc. assumes no liability for the customer's
failure to comply with safety precautions and requirements.
Go back to top Go back to TOC
4.0 Basic Operation
CX350s-D3.1 e-Manual D07-00-102P RevA01
Page 9 of 109
4.1 Compact Platform Overview
4.2 Keypad
4.3 Touch- Screen Display
4.4 Battery
4.5 Connector Panels
4.5.1 Test Ports
4.5.2 Utility Ports
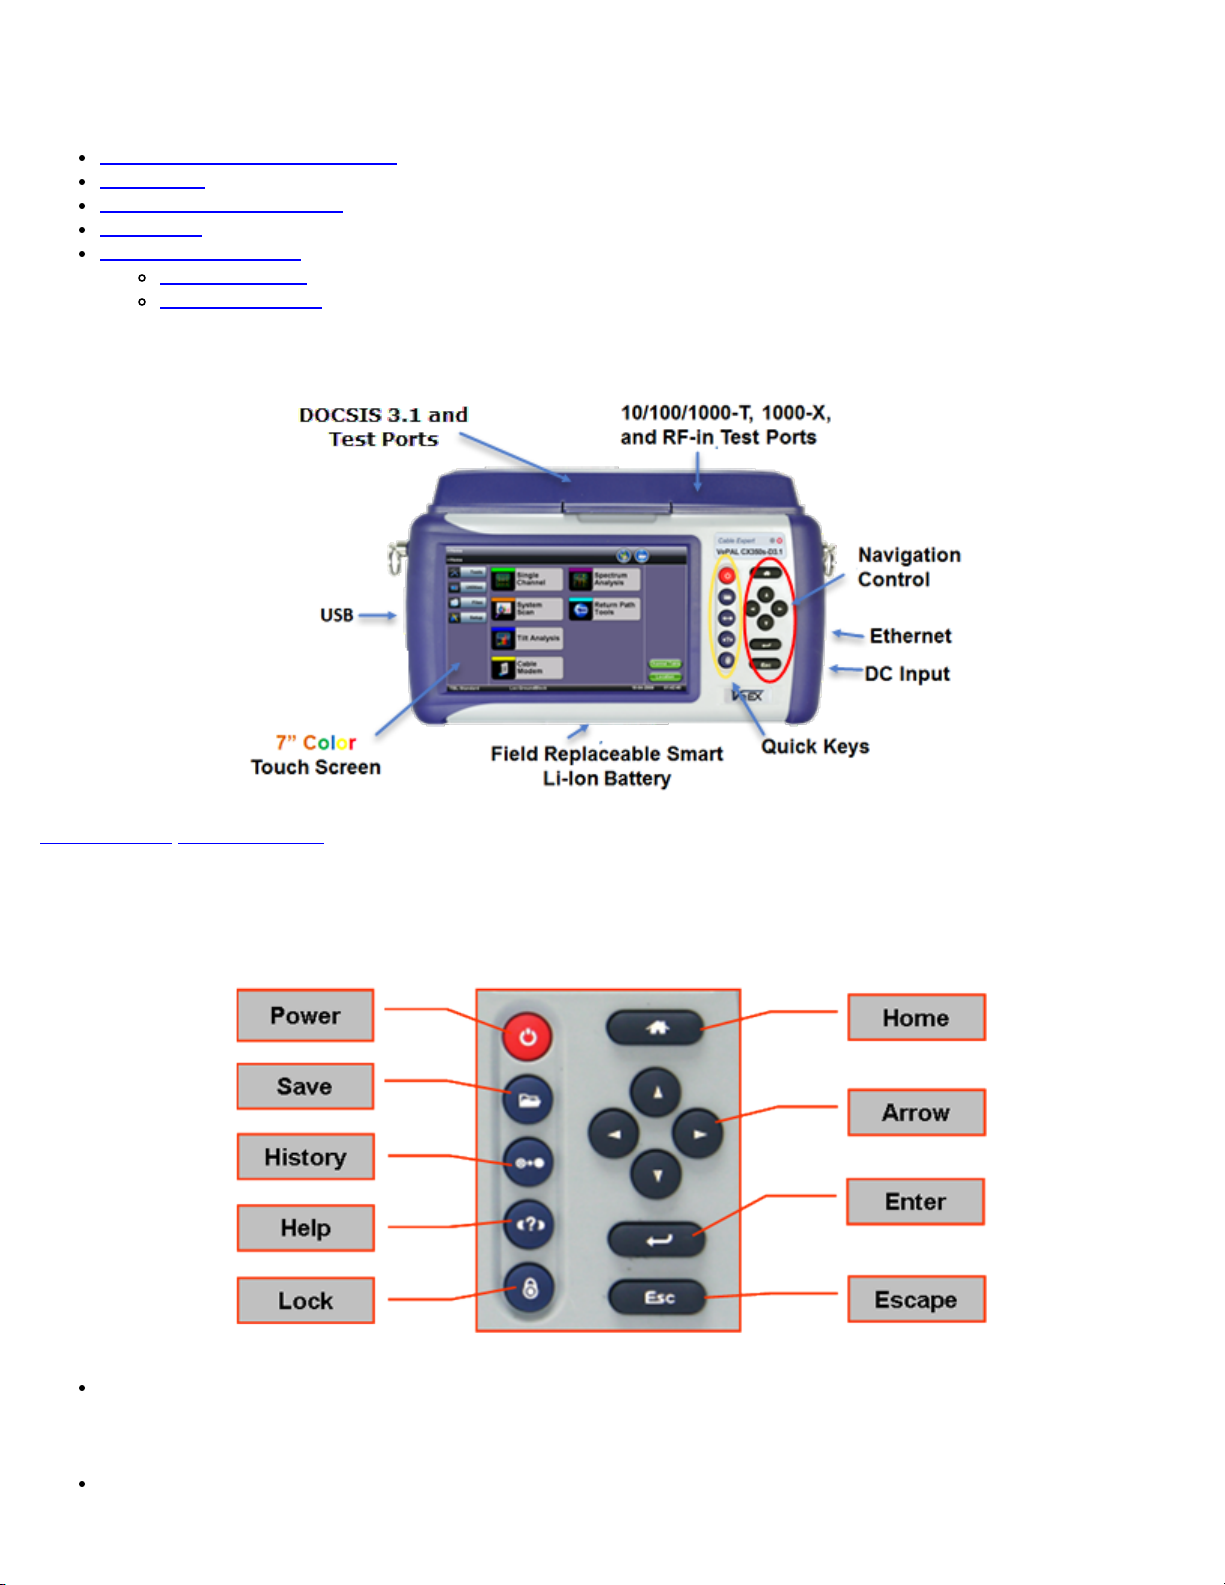
4.1 Compact Platform Overview
Go back to top Go back to TOC
4.2 Keypad
The keypad comprises the following keys:
Power key: The unit is powered on and off from the red key on the keypad. The button is recessed to prevent accidental
power on. Press the key for 3-5 seconds to turn the unit on. To turn off the unit, press the power key for at least 2
seconds. If the unit does not respond, holding the power key down by more than 10 seconds will force the unit to switch
off.
Save key: Saves test results in the unit's memory. If the measurement is still running, it will provide a snap shot the
moment the key is pressed. The Save function provides automatic storage with automatic naming and time stamping
function.

History key: The history key resets any blinking LED due to a history condition.
Help key: The help key brings the user to the online help, regardless of the current user interface location of the unit.
CX350s-D3.1 e-Manual D07-00-102P RevA01
Page 10 of 109
Lock key: Locks the keypad
Home key: Bring the unit to its home menu regardless of its location on the user interface.
Arrow key: The arrow key moves the cursor in any of the four supported directions (left, right, up, down). The arrow key
works in conjunction with the Enter and Escape keys.
Enter key: The enter key provides an enter sequence to the user interface. It is used in non touch screen operation mode
to enter menus and functions.
Escape key: The escape key provides an escape sequence to the user interface. It is used in non touch-screen operation
mode to escape menus and functions.
Go back to top Go back to TOC
4.3 Touch-Screen Display
The LCD supports touch-screen operation. To operate the touch-screen, use the stylus located in the top cover to navigate the
menus and tabs. The unit can also be used in a non touch screen mode i.e. use the arrow, enter, and escape keys to navigate.
The location of the cursor on the screen is indicated by a focus state. The focus state varies depending on the function or
section of the test set. Please observe the following precautions:
Never use excessive pressure on the touch-screen as this may damage its functionality
Never use sharp objects such as a pen, screwdriver etc. as this may damage the surface
Clean the surface of the touch screen using a soft cloth and mild detergent only. Do not use alcohol
Go back to top Go back to TOC
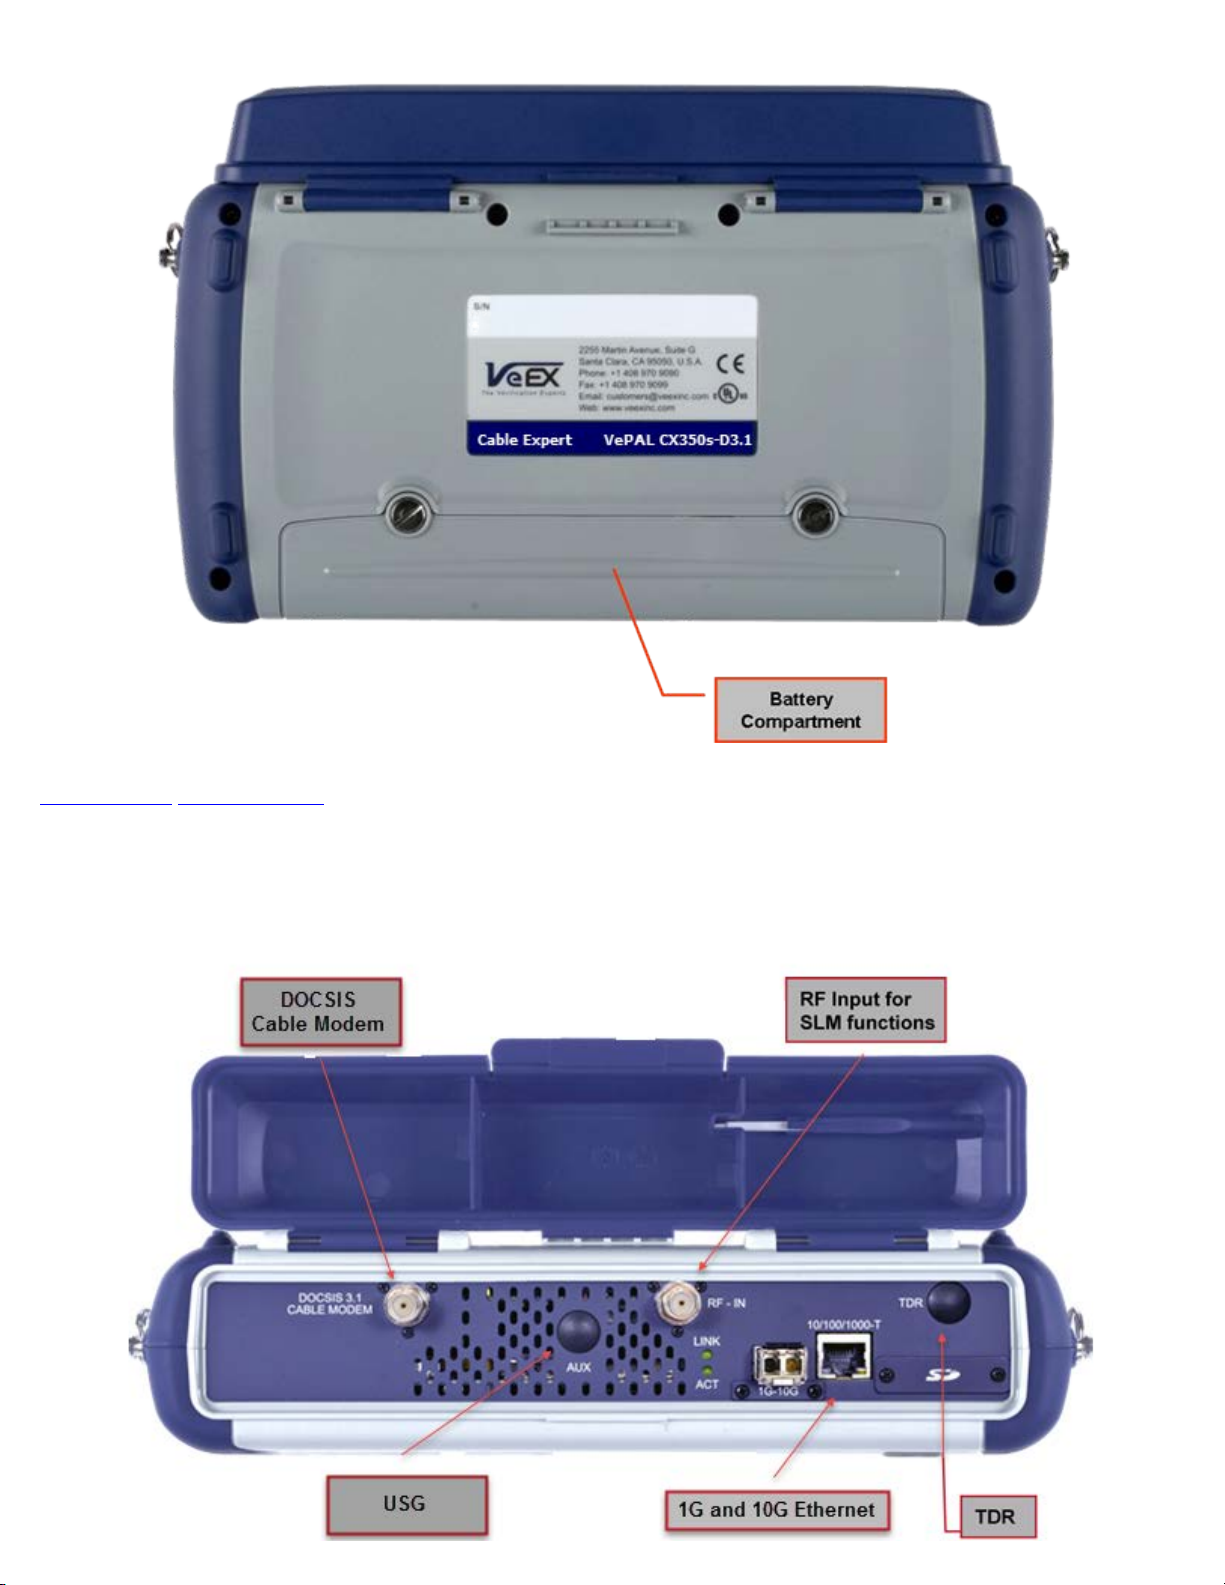
4.4 Battery
The VePAL300 chassis is equipped with an intelligent Li-ion rechargeable battery pack which is located in the rear of the unit.
The battery will be partially charged upon delivery, so it is recommended to charge the battery fully before use. Please charge the
battery at room temperature to preserve its life and to obtain maximum charge. The battery is charged during operation provided
the unit is connected to the AC Mains using the supplied AC adapter. Removing the battery, while the unit is powered on is not
recommended - this may result in damage. Remove the rubber cover on the left side to connect the AC Main adapter to the unit.
Go back to top Go back to TOC
CX350s-D3.1 e-Manual D07-00-102P RevA01
Page 11 of 109
4.5 Connectors and Panels
The connector panel located at the top of the unit comprises the following test ports (some are optional):

4.5.1 Test Ports
CX350s-D3.1 e-Manual D07-00-102P RevA01
Page 12 of 109
Test Ports: To access the test connectors, please open the top cover.
RF-in
"F" Connector, 75 ohms for connection to the CATV network - Provides access to:
Signal Level Meter (SLM) and associated functions
Reverse Path QAM analyzer
Note: Maximum Voltage input is 100VAC, 140VD
Cable Modem:
"F" connector, 75 ohms for connection to the DOCSIS cable modem and standard Upstream Generator function
AUX:
"F" connector, 75 ohms for Upstream Generator equipped with Enhanced Forward Error Correction (FEC) capability
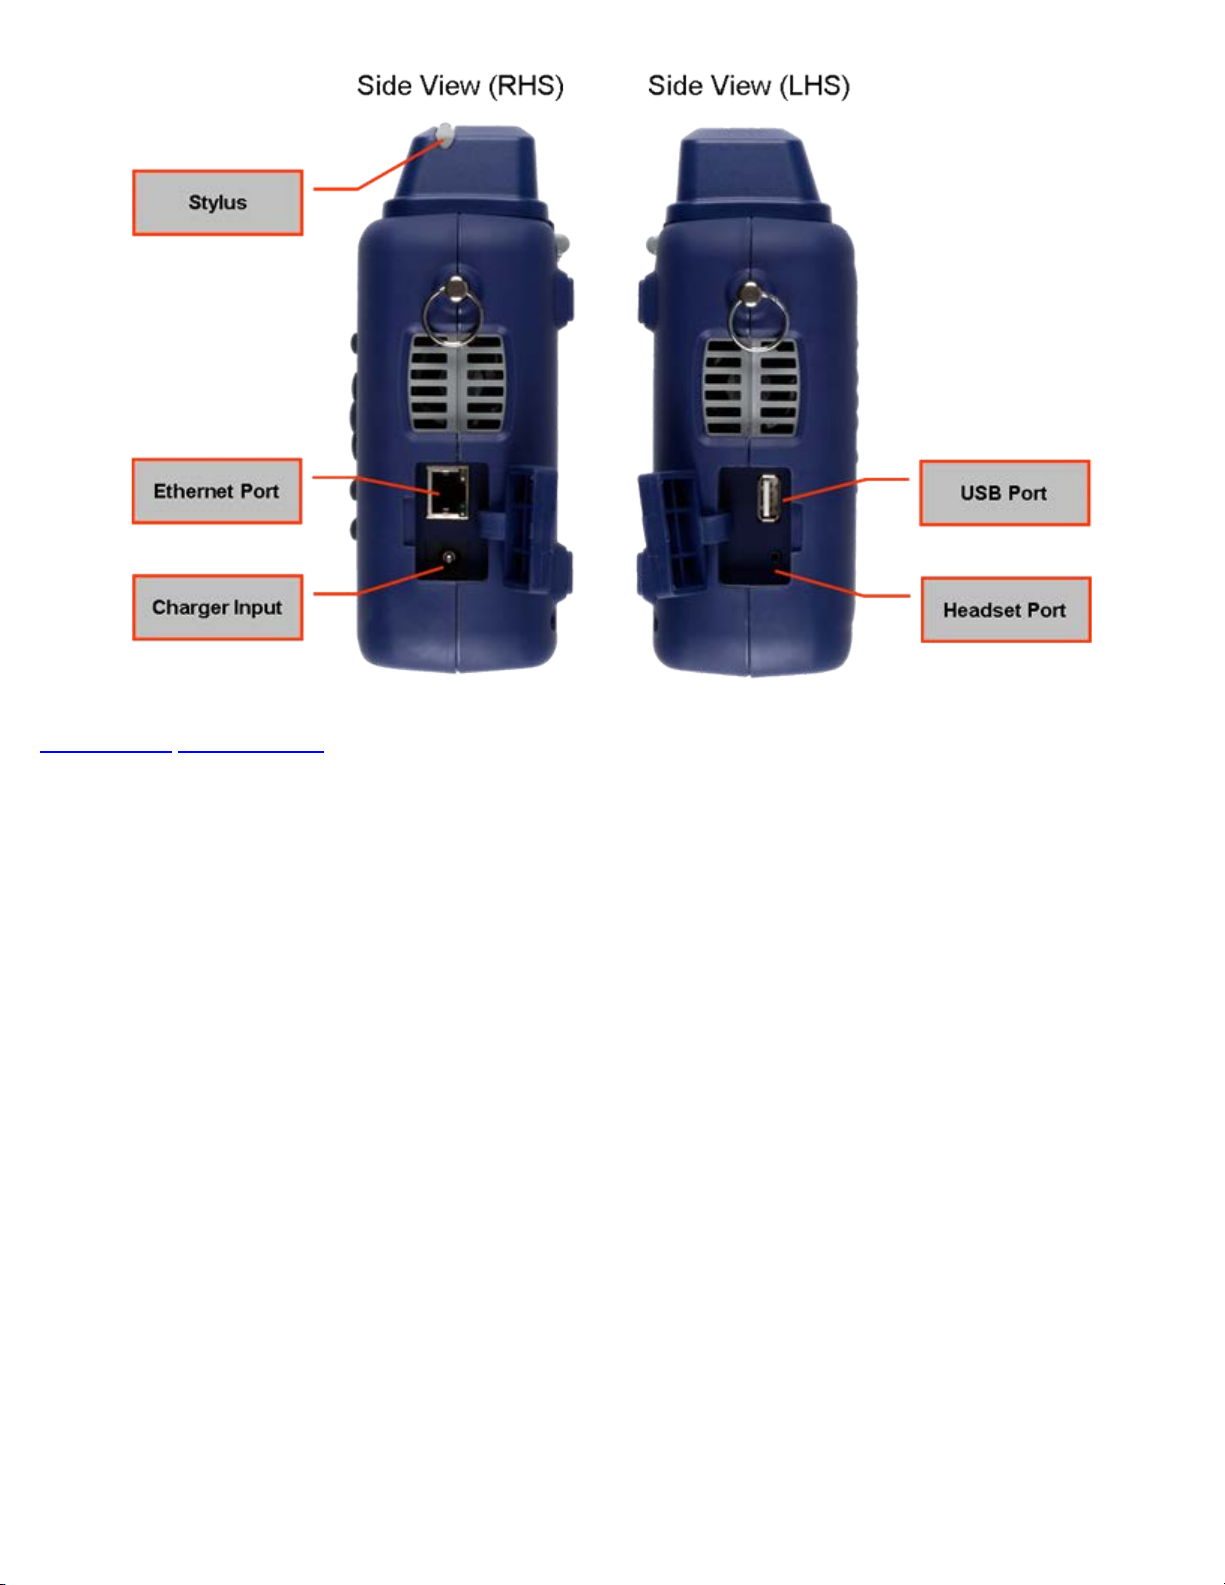
4.5.2 Utility Ports:
The Ethernet and USB ports are located on the left and right side of the unit.
RJ45, 10/100Base- T port:
To access the Ethernet port, remove the protective rubber cover on the right hand side of the unit to expose the
connector. Ethernet applications include:
IP connectivity testing
Net Wiz testing
WiFi Wiz testing
Transfer measurement results and test profiles between the instrument and a computer using ReVeal CX software
Upload/download channel tables between the instrument and a computer using ReVeal CX software
Remote control of the instrument using ReVeal CX software (optional)
USB Port:
To access the USB port, remove the protective rubber cover on the left hand side of the unit to expose the connector. The
USB port supports:
Memory drives
WiFi adapter for WiFi testing application
Digital Fiber Inspection Scope
Optical Power Meter
Go back to top Go back to TOC
CX350s-D3.1 e-Manual D07-00-102P RevA01
Page 13 of 109

5.0 Home Screen and Menu
CX350s-D3.1 e-Manual D07-00-102P RevA01
Page 14 of 109
5.1 Screen Layout
5.2 Screen Icons
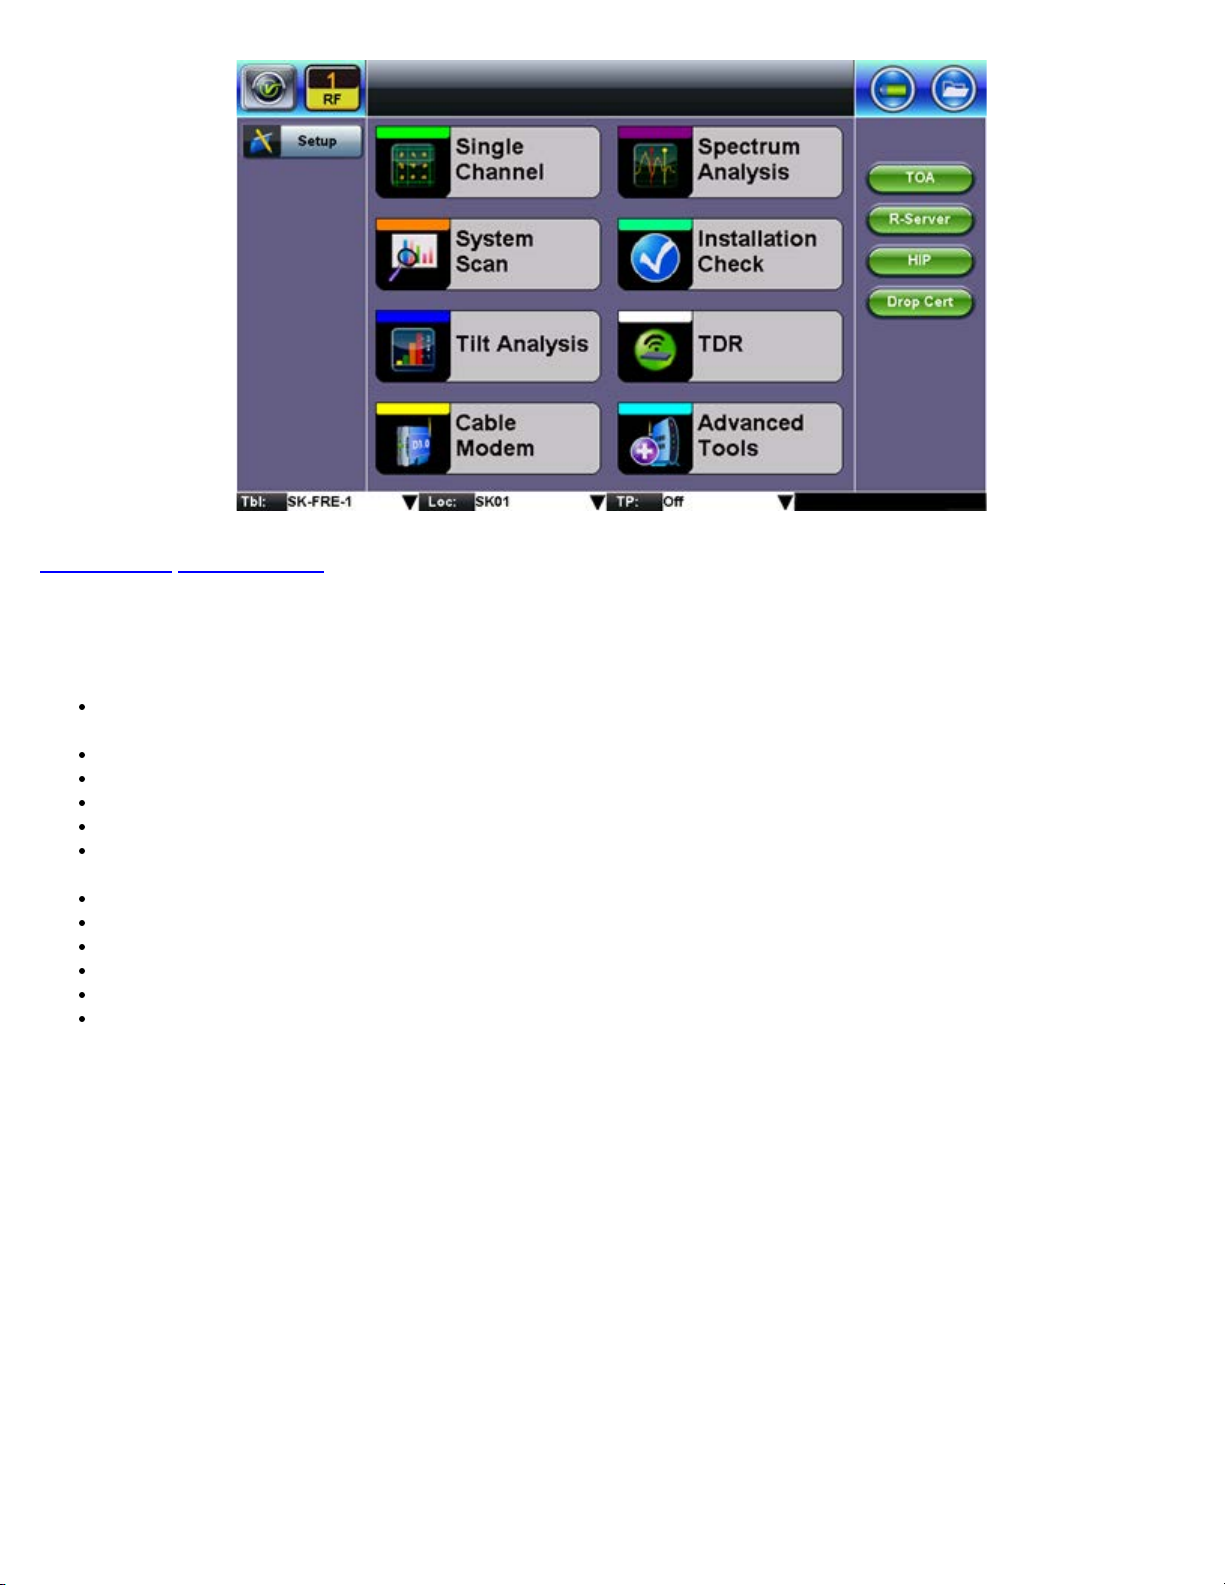
5.1 Screen Layout
The Home menu can be accessed at anytime during operation by pressing the Home key on the rubber keypad. The screen is
divided into three presentation areas:
Left:
'V' Icon - Utilities Menu
Setup
Main Menu
Middle:
Test Applications specific to the test set:
Single Channel
System Scan
Tilt Analysis
Cable Modem
Spectrum Analysis
Installation Check
TDR
Advanced Tools (to access more advanced features):
Return Path Analysis
Sweep Operations
Ethernet Tools
Remote Operations
R-Server
USG+FEC
RP Balancing
HIP
DS1 Tools
Bottom:
Tbl (Channel Table): Select a channel table to test
Loc (Location): Select Location threshold for particular test
TP (Test Point): Select test point compensation
Each of the menus listed above is described in detail in the relevant sections of this manual. Please refer to the
Contents.
CX350s-D3.1 Home Menu
Table of
Go back to top Go back to TOC
CX350s-D3.1 e-Manual D07-00-102P RevA01
Page 15 of 109
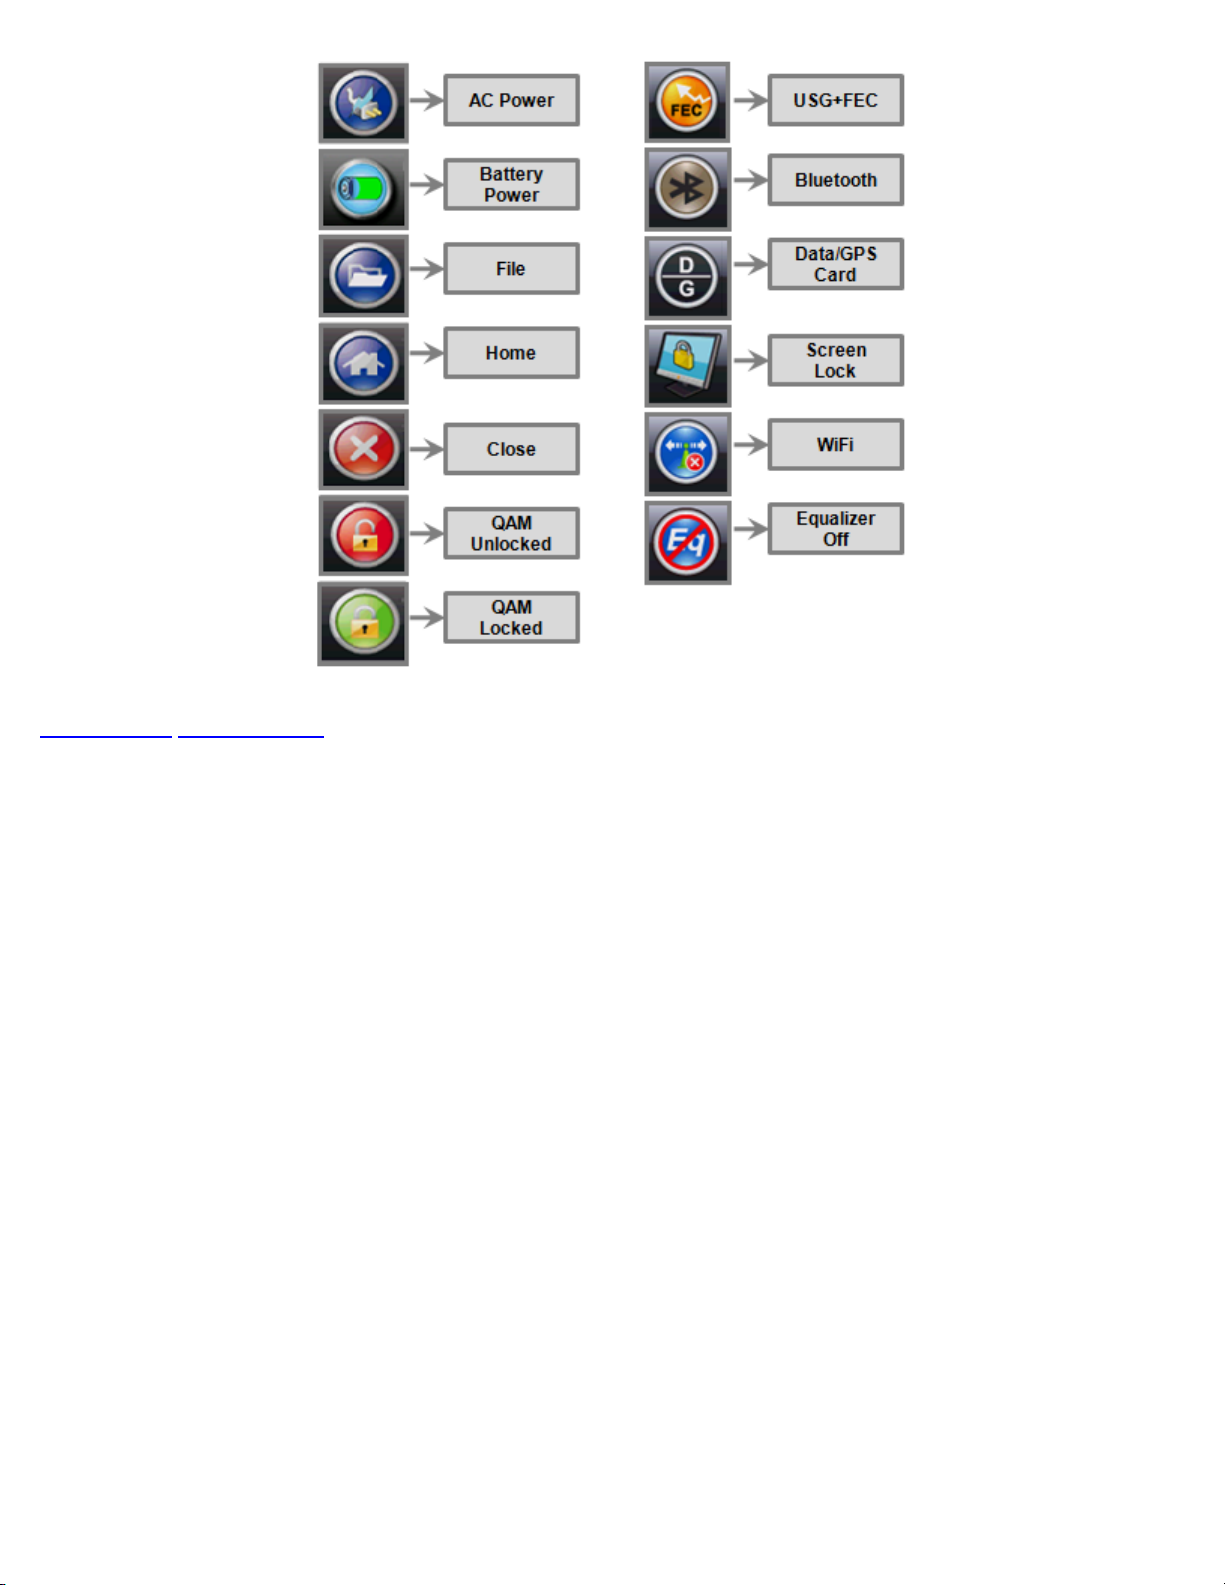
5.2 Screen Icons
The following icons are displayed and located at the top of the screen:
Power: Indicates if the unit is being powered by the internal Li-ion battery or external AC power. Tap the icon for battery
status if running on battery.
File: Provides File Storage Information.
Home: Provides instant navigation back to the main Home menu screen.
Close: Closes screen and returns user to the previous screen.
QAM unlocked: Indicates QAM lock has not been achieved on the digital carrier.
QAM lock: Indicates QAM lock has been achieved on the digital carrier.
(Note: QAM lock is required to make Constellation measurements)
USG+FEC: On or Off.
Bluetooth: Bluetooth detected.
Data/GPS card: Data/GPS card detected.
Screen Lock
WiFi: Unit is connected to WiFi.
Equalizer Off
CX350s-D3.1 Screen Icons
Go back to top Go back to TOC
CX350s-D3.1 e-Manual D07-00-102P RevA01
Page 16 of 109
6.0 Setup
CX350s-D3.1 e-Manual D07-00-102P RevA01
Page 17 of 109
6.1 Channel Tables and Locations
6.1.1 Channel Tables
6.1.2 Locations
6.1.3 Test Point Compensation
Test mode, test port/s and network settings are required prior to performing any measurements or applications.
Go back to top Go back to TOC
6.1 Channel Tables and Locations
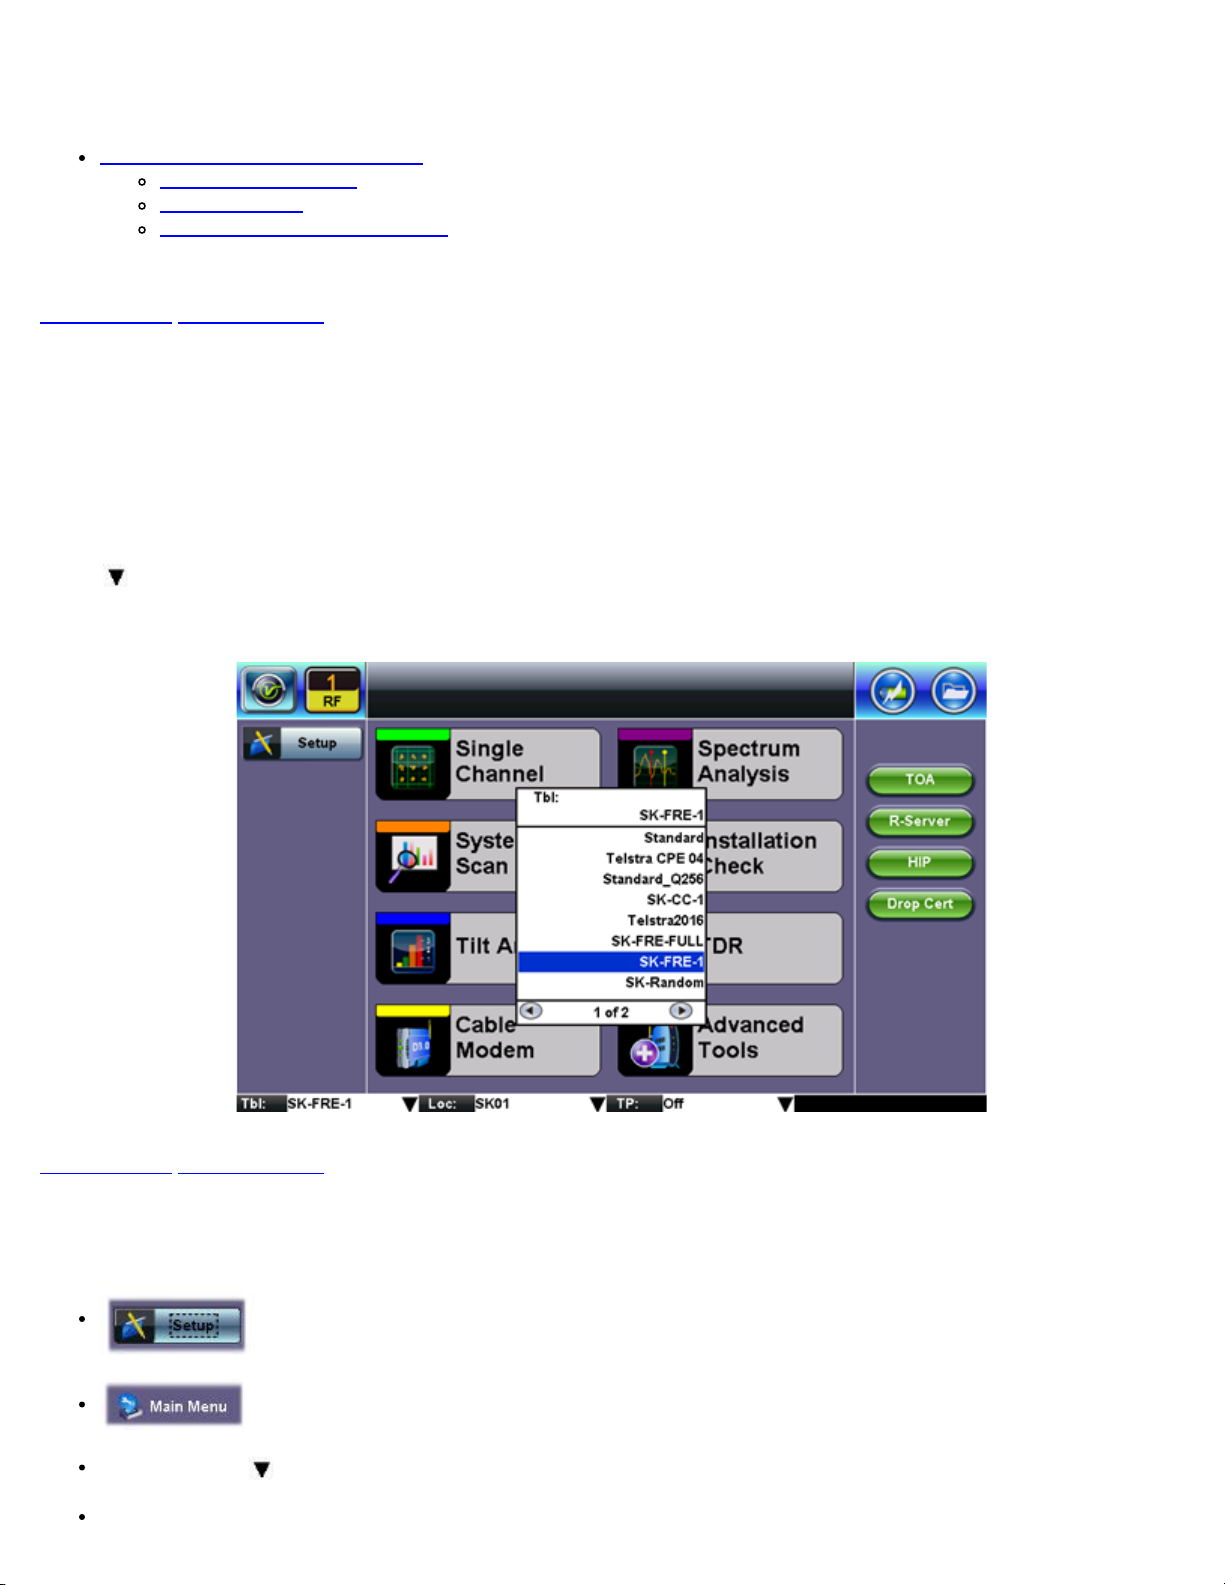
6.1.1 Channel Tables
The unit requires Channel Tables to perform measurements in Single Channel mode. By default, the unit is preloaded with
several channel tables, according to industry standard Annex A, B, and C systems.
Selecting a Channel Table
Tap on
next to Tbl to select a table from the drop-down menu.
Channel Table Selection
Go back to top Go back to TOC
Editing or Creating New Channel Tables
To create new channel tables or edit existing ones, tap on the following:
Setup
Main Menu
Channel Table ( box)
Manage (from drop-down menu)
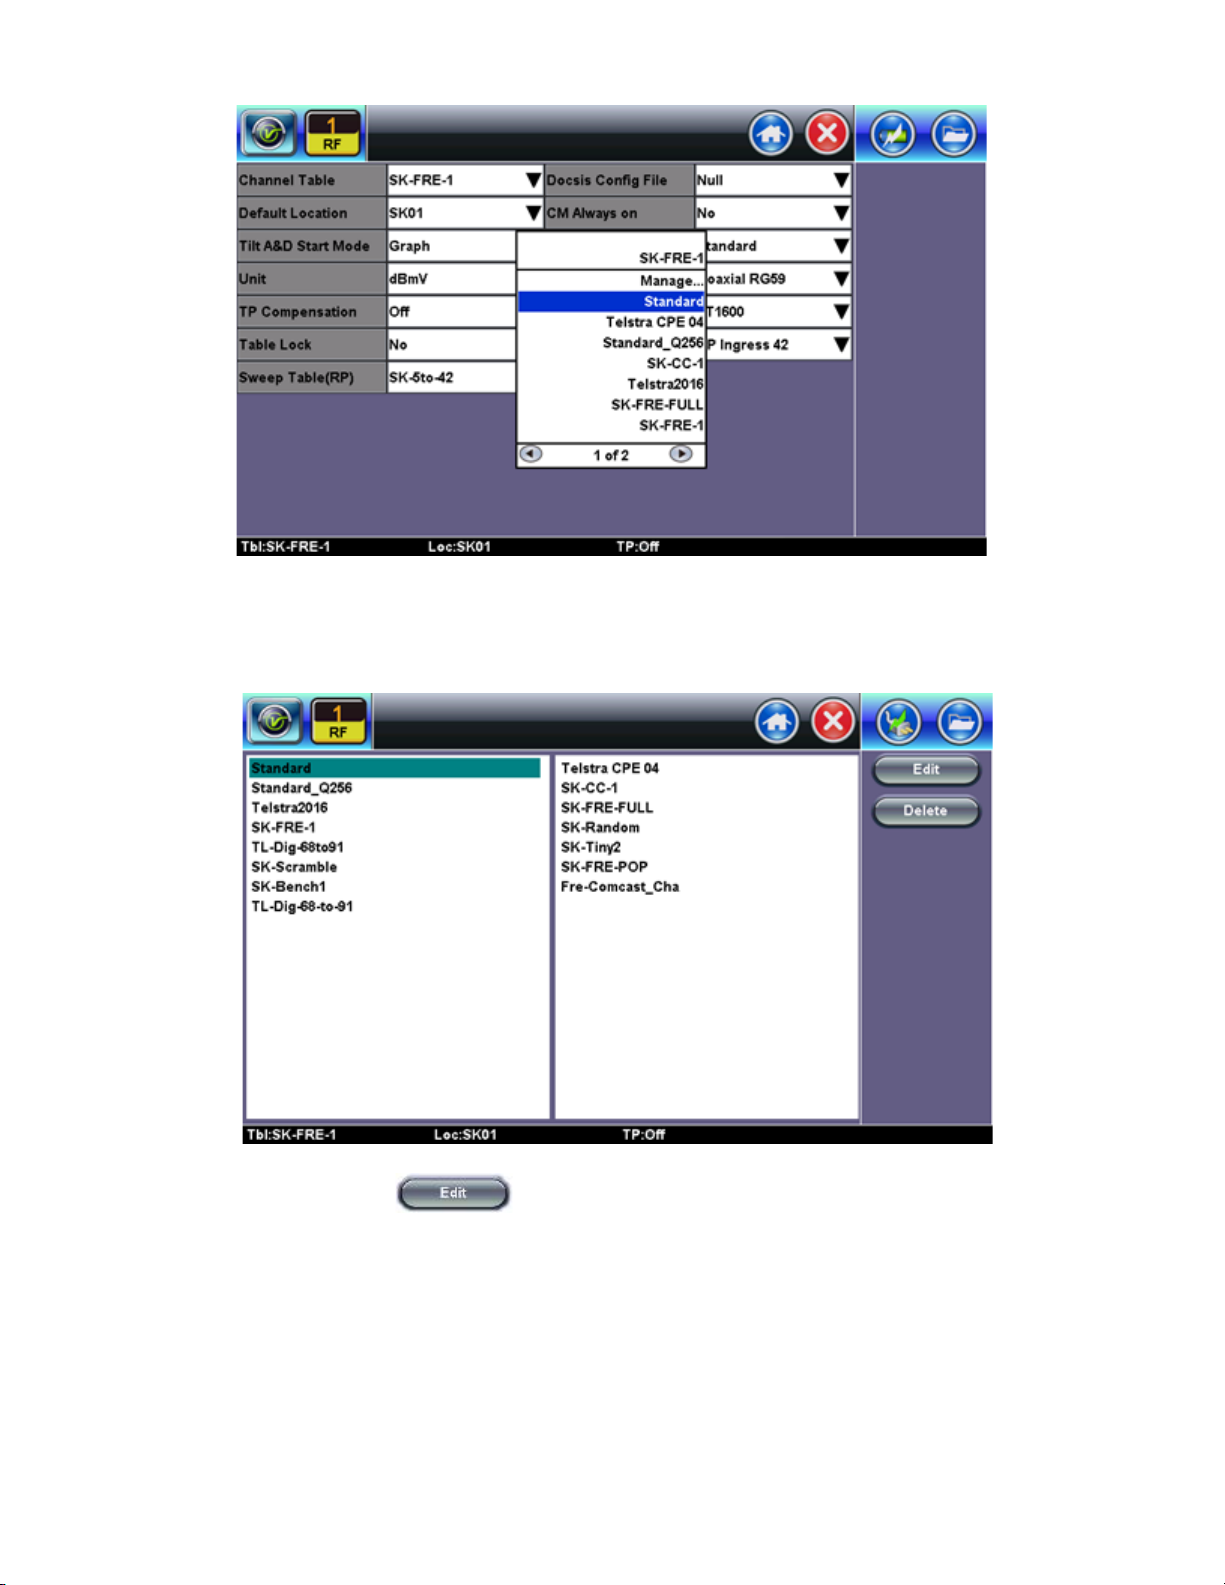
Channel Table Selection
CX350s-D3.1 e-Manual D07-00-102P RevA01
Page 18 of 109
Select a table and press the Edit button .
Channel
Table Selection
Channel Table Editing

Creating Channel Tables with ReVeal CX300
CX350s-D3.1 e-Manual D07-00-102P RevA01
Page 19 of 109
Alternatively, the channel tables can be created and managed using ReVeal CX300 PC software, which is a standard accessory.
Additional tables can be created from a blank table or from existing templates. The test set and the PC software can exchange
the tables for easy update. Please refer to the ReVeal CX300 manual on
www.veexinc.com for more details.
Go back to top Go back to TOC
6.1.2 Locations
Location settings are pre-set measurement thresholds for analog and digital carriers. By default, the unit is pre-loaded with
Groundblock, Set Top Box and Tap locators. When performing a measurement, one of these preset locations can be selected by
tapping the check box.
Location Selection
The measurement thresholds for the preset locations can be edited via the Setup icon and Main menu.
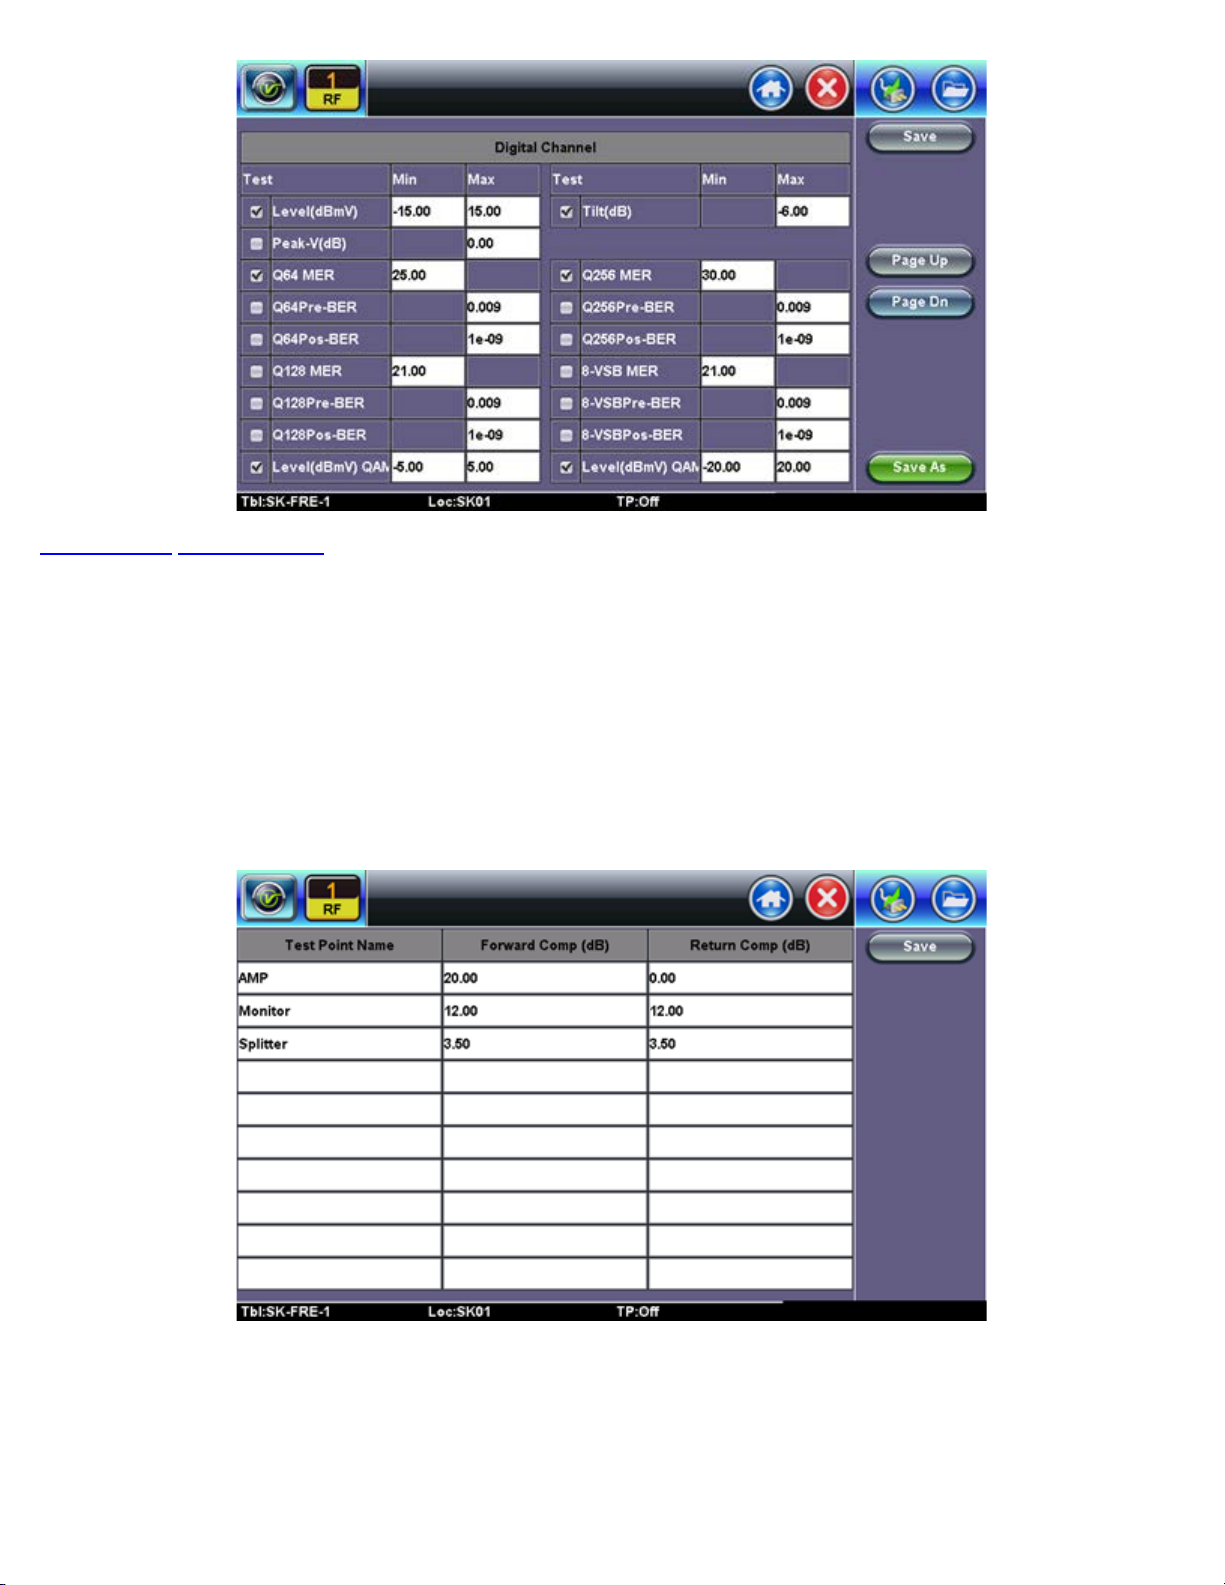
The manage function allows the user to modify the threshold settings for Analog and Digital Channels. Once the new value has
been entered, apply the threshold settings using the check box.
Location Editor
Go back to top Go back to TOC
CX350s-D3.1 e-Manual D07-00-102P RevA01
Page 20 of 109
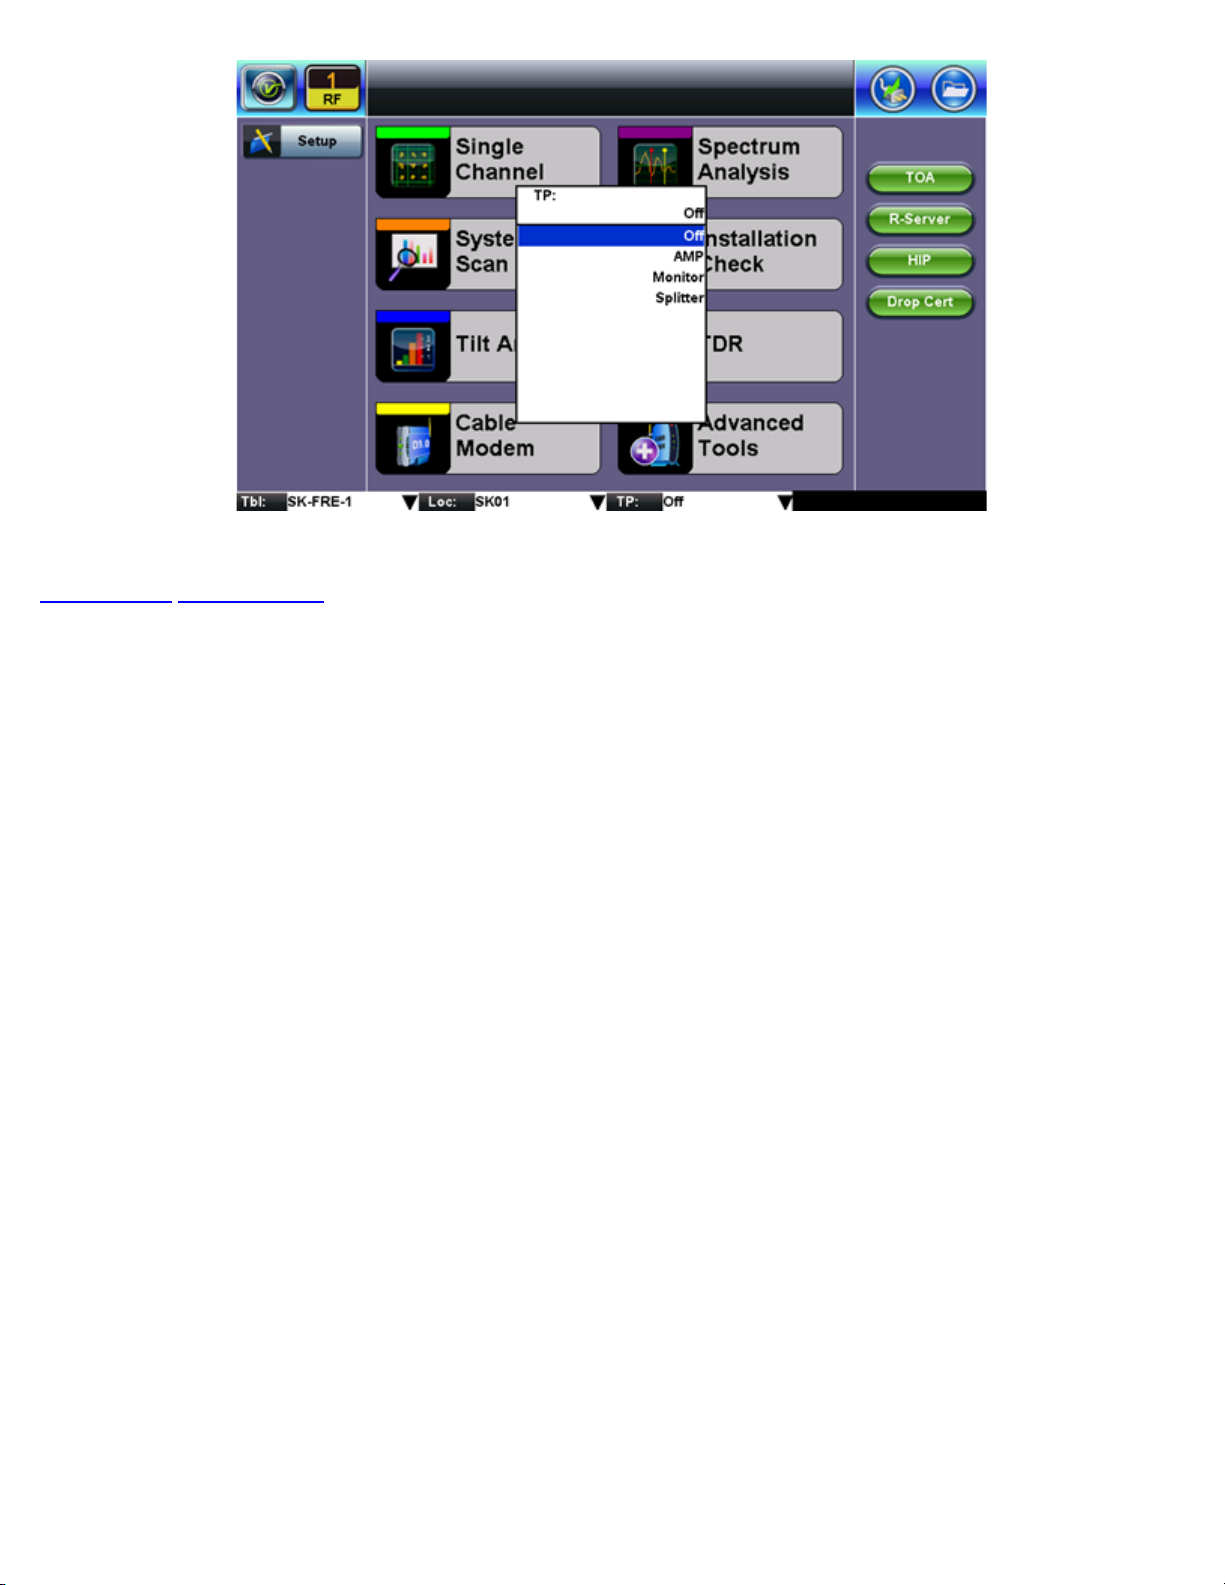
6.1.3 Test Point Compensation
Test point compensation allows the loss at a certain test point to be automatically compensated. When performing a
measurement, one of these preset test points can be selected by tapping the check box. The test set stores 10 sets of TP
compensation value by name.
Forward Comp: applies to all Downstream related measurements, such as Single Channel, Installation Check, and Cable
Modem Downstream Levels.
Return Comp: applies only to Cable Modem Upstream Transmit Levels.
TP Editor
TP Selection
Go back to top Go back to TOC
CX350s-D3.1 e-Manual D07-00-102P RevA01
Page 21 of 109
7.0 Test Applications
7.1 Single Channel Measurement
7.1.1 Analog Channel Measurements
7.1.2 Digital Channel Measurements
7.1.3 Constellation Measurements
7.2 Tilt Analysis
7.3 System Scan
7.4 Spectrum Analysis
7.4.1 Setup
7.4.2 Amplitude Measurements
7.4.3 Ingress Measurements
7.4.3.1 Forward Path Ingress
7.4.3.2 Reverse Path Ingress
7.5 Cable Modem
7.5.1 Setup
7.5.2 Cable Modem Results - DOCSIS 3.0
7.5.3 Cable Modem Results - DOCSIS 3.1/OFDM
7.6 Upstream Signal Generator (USG)
7.7 Installation Check
7.8 Advanced Tools
7.8.1 Return Path Analysis
7.8.2 Sweep Operations
7.8.3 MPEG Operations
7.8.4 Remote Operations
7.8.5 R-Server
7.8.6 TPS Control
7.8.7 RP Balancing
7.1 Single Channel Measurement
Overview:
The Single Channel SLM function performs a level measurement of a user-selected frequency or a channel that is defined in the selected
and active channel table. The contents of the Single Channel screen will depend upon whether the selected channel contains an analog or
digital signal.
In analog mode, both video and audio levels including Video/Audio (V/A) and Carrier to Noise (C/N) ratios are indicated. In digital mode,
the average power of the QAM channel is measured and MER and BER performance and other related parameters are displayed.
The channel to be measured can be entered by either tapping on the Channel box or the Frequency box to the right and use the pop up
keypad to enter the channel number or frequency respectively. After the first channel is entered, use the Arrow Up key or Down key to
scroll through the next or previous channel in the channel table. About 3 seconds after the user releases the Arrow Up or Down key, the
measurement will start. CX380S-D3.1. remembers the last channel measured, and upon entry, the last channel number will be used.
The CX380S-D3.1 supports histogram analysis, which records the current minute by second and past 60 minutes by minute.
Go back to top Go back to TOC
7.1.1 Analog Channel Measurements
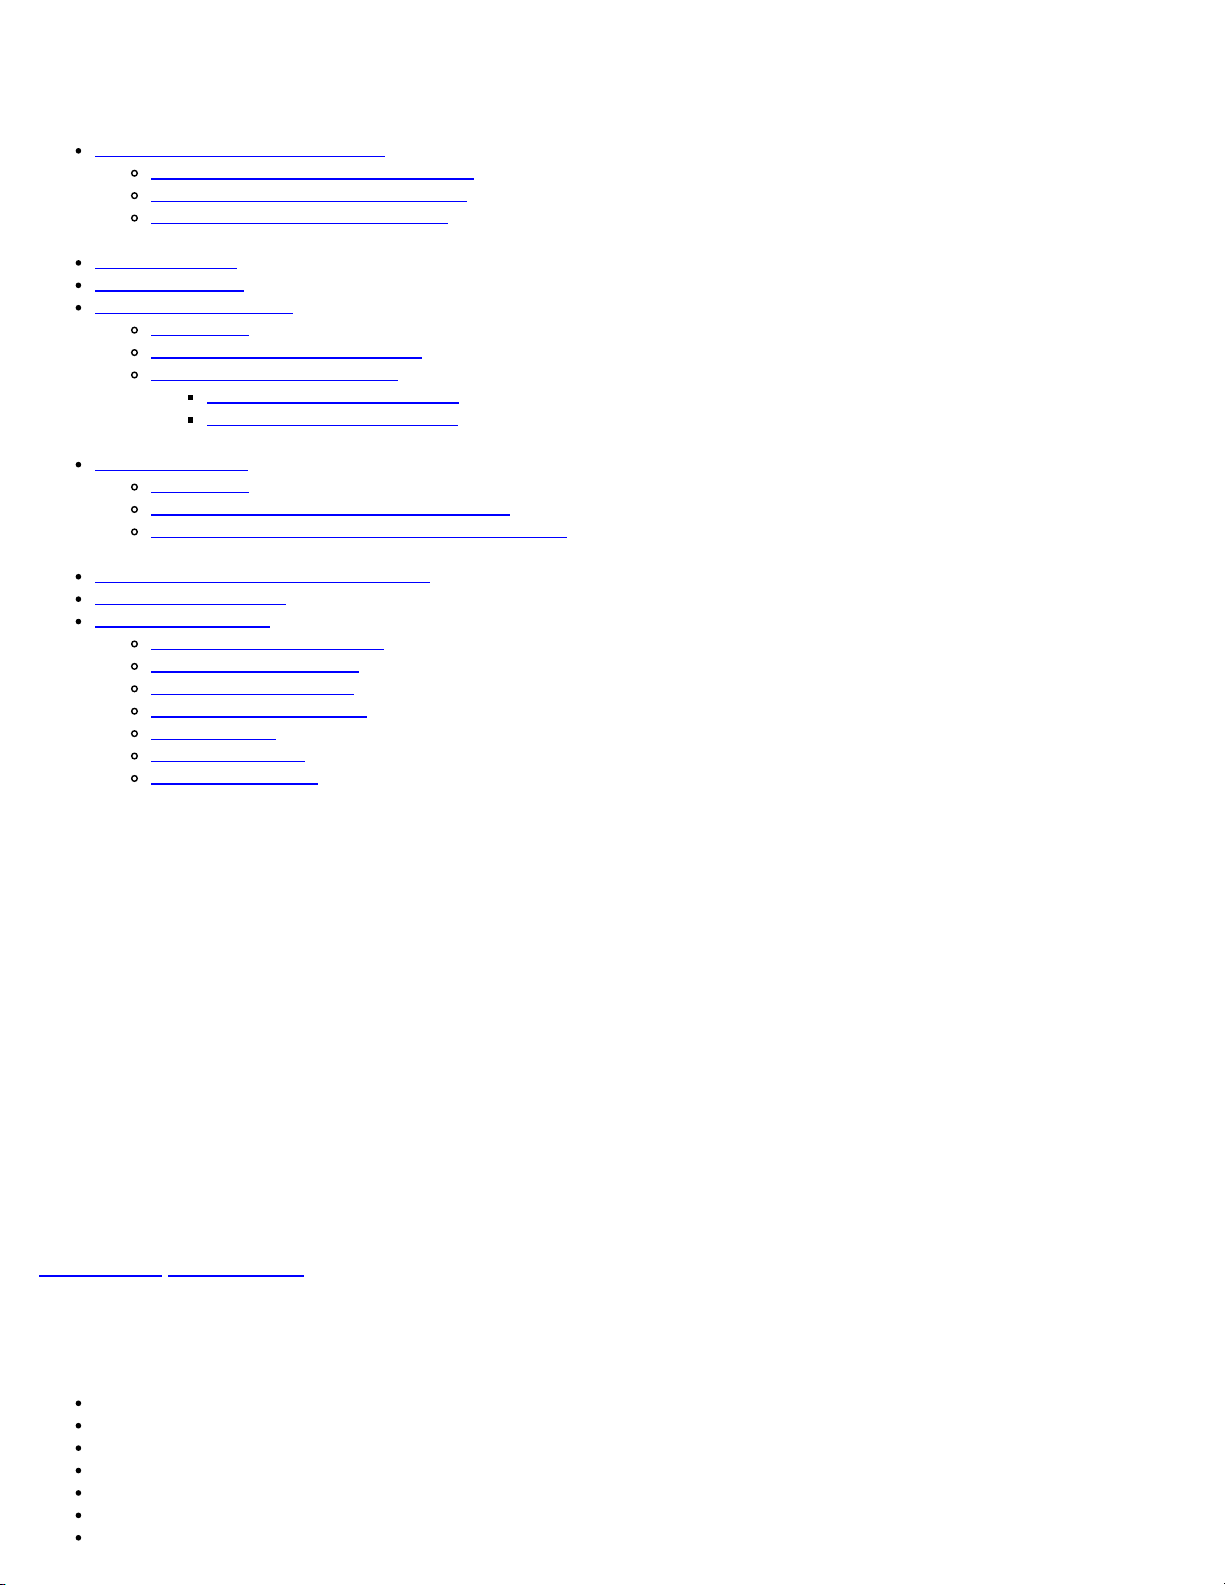
The following measurement information is provided for analog signals:
Channel number (defined in the channel table)
Channel frequency (defined in the channel table)
Video Power Level in dBmV/dBuV including graphic bar indication
Audio1 Power Level in dBmV/dBuV including graphic bar indication
Video/Audio1 ratio in dB
Audio2 Power Level in dBmV/dBuV including graphic bar indication
Video/Audio2 ratio in dB
Max Adjacent Channel in dB
Carrier to Noise (C/N) in dB
HUM in %
Single Channel - Analog Results
Note:
The red blocks indicate the predefined threshold window for the measurement parameter.
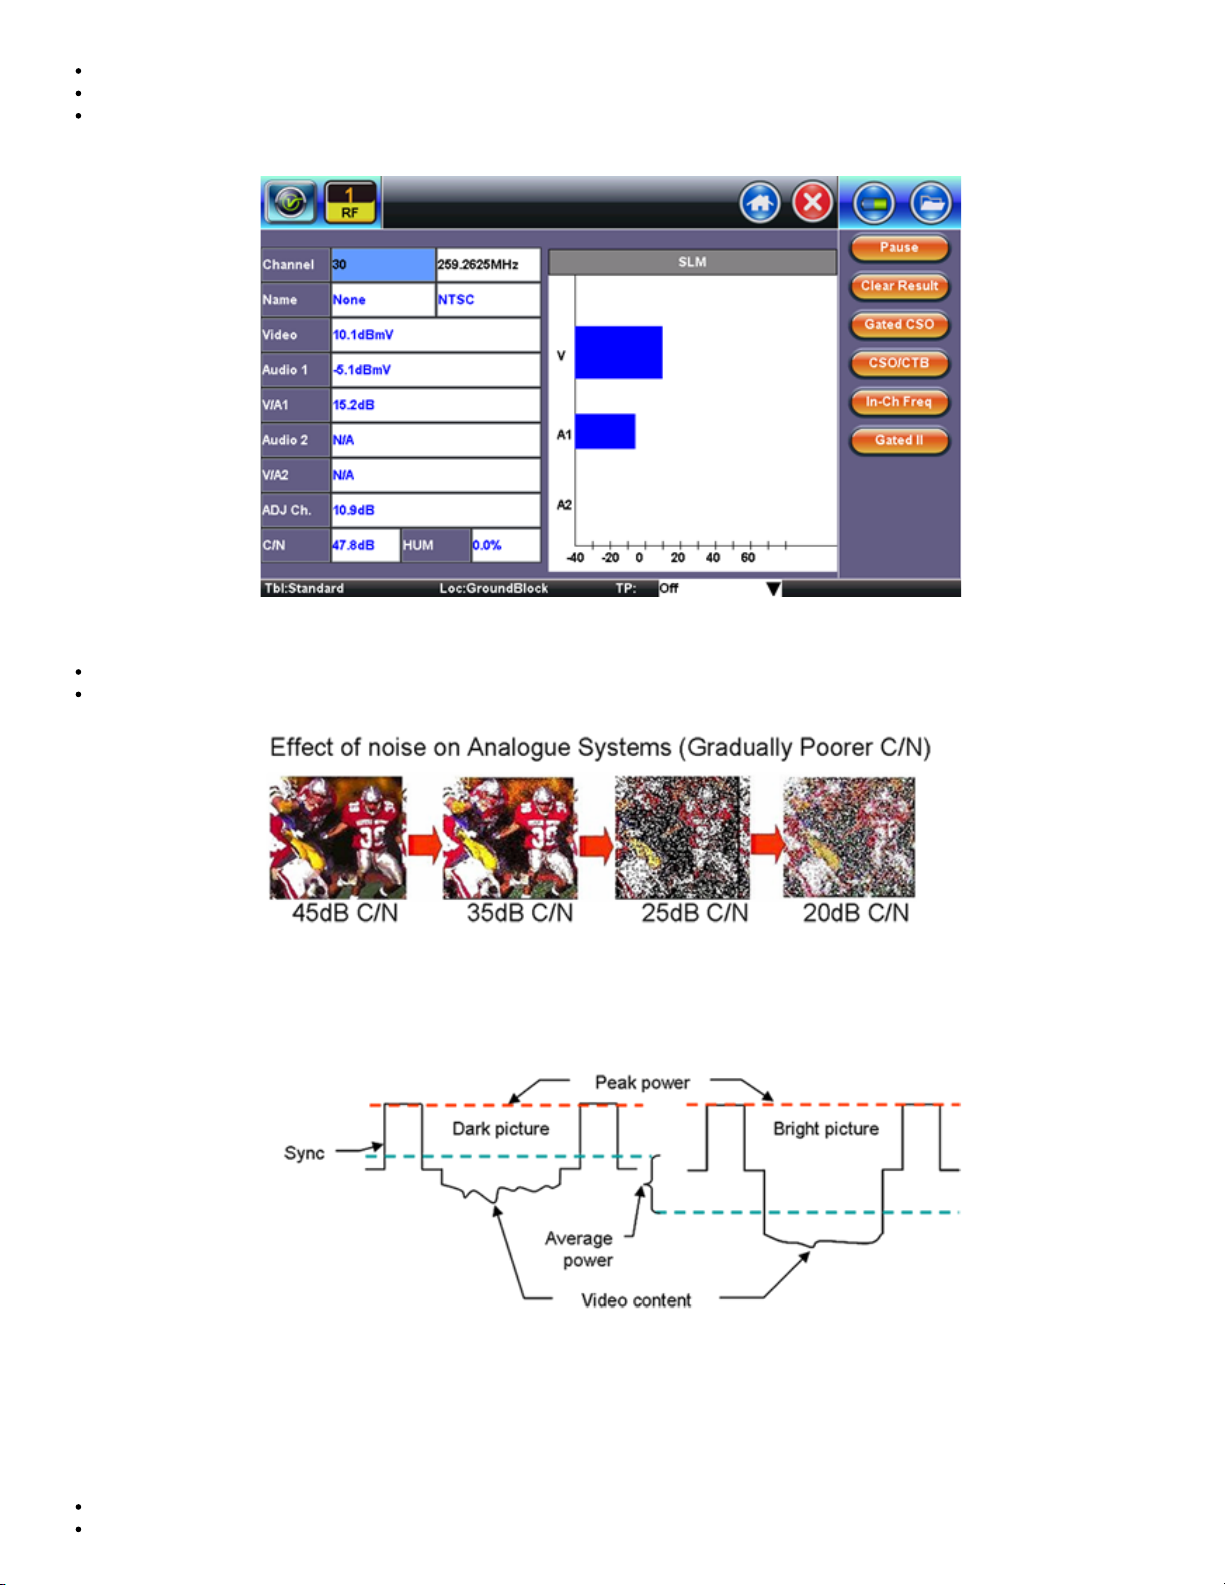
The effect of noise or poor C/N on analog video carriers is described below.
Note: The average power changes depending on the picture content e.g. dark scenes have a higher average power than bright scenes.
Using the sync pulses, the carrier is at its peak power and it does not change from scene to scene therefore peak power has become the
standard for analog video carrier level measurements. The CX380S-D3.1 measures the peak level for analog carrier.
Analog Carriers - Peak Power Measurement
CSO/CTB
The CX380S-D3.1 measures the CSO/CTB by taking the measurement at the programmed frequency offsets of an analog channel’s video
carrier. The frequency offsets can be programmed in Setup Main menu.
The default values are:
CSO-1 offset: 1.25MHz
CSO-2 offset: 0.75MHz
CTB offset : 0 MHz
CSO-3 offset: -0.75MHz
CSO-4 offset: -1.25MHz
The CX380S-D3.1 first measures the signal levels at those frequency offsets of a live carrier then prompts the user to either use a channel
blocker or remove the carrier. The same frequency offsets will be measured after the carrier is removed or blocked and they are used to
compare with the previously measured results with a live carrier to determine the final CSO/CTB values.
Alternatively, the CX380S-D3.1 can measure the CSOs of a live carrier without using a channel blocker or removal of the carrier by
selecting the GATED CSO mode. In this mode, the CX380S-D3.1 measures the noise level at the frequency offsets during the sync pulse
period where the carrier signal is quiet then compare with the measured levels during the non sync pulse period.
Go back to top Go back to TOC
7.1.2 Digital Channel Measurements
When testing a digital channel, the unit first tries to lock onto the QAM signal. Once the QAM signal is locked, the unit starts displaying the
digital measurement results as well as the constellation diagram.
Note: QAM unlock
If the unit is unable to lock onto the digital channel, the following icon is displayed.
Always ensure QAM lock is achieved prior to making Constellation and related digital measurements.
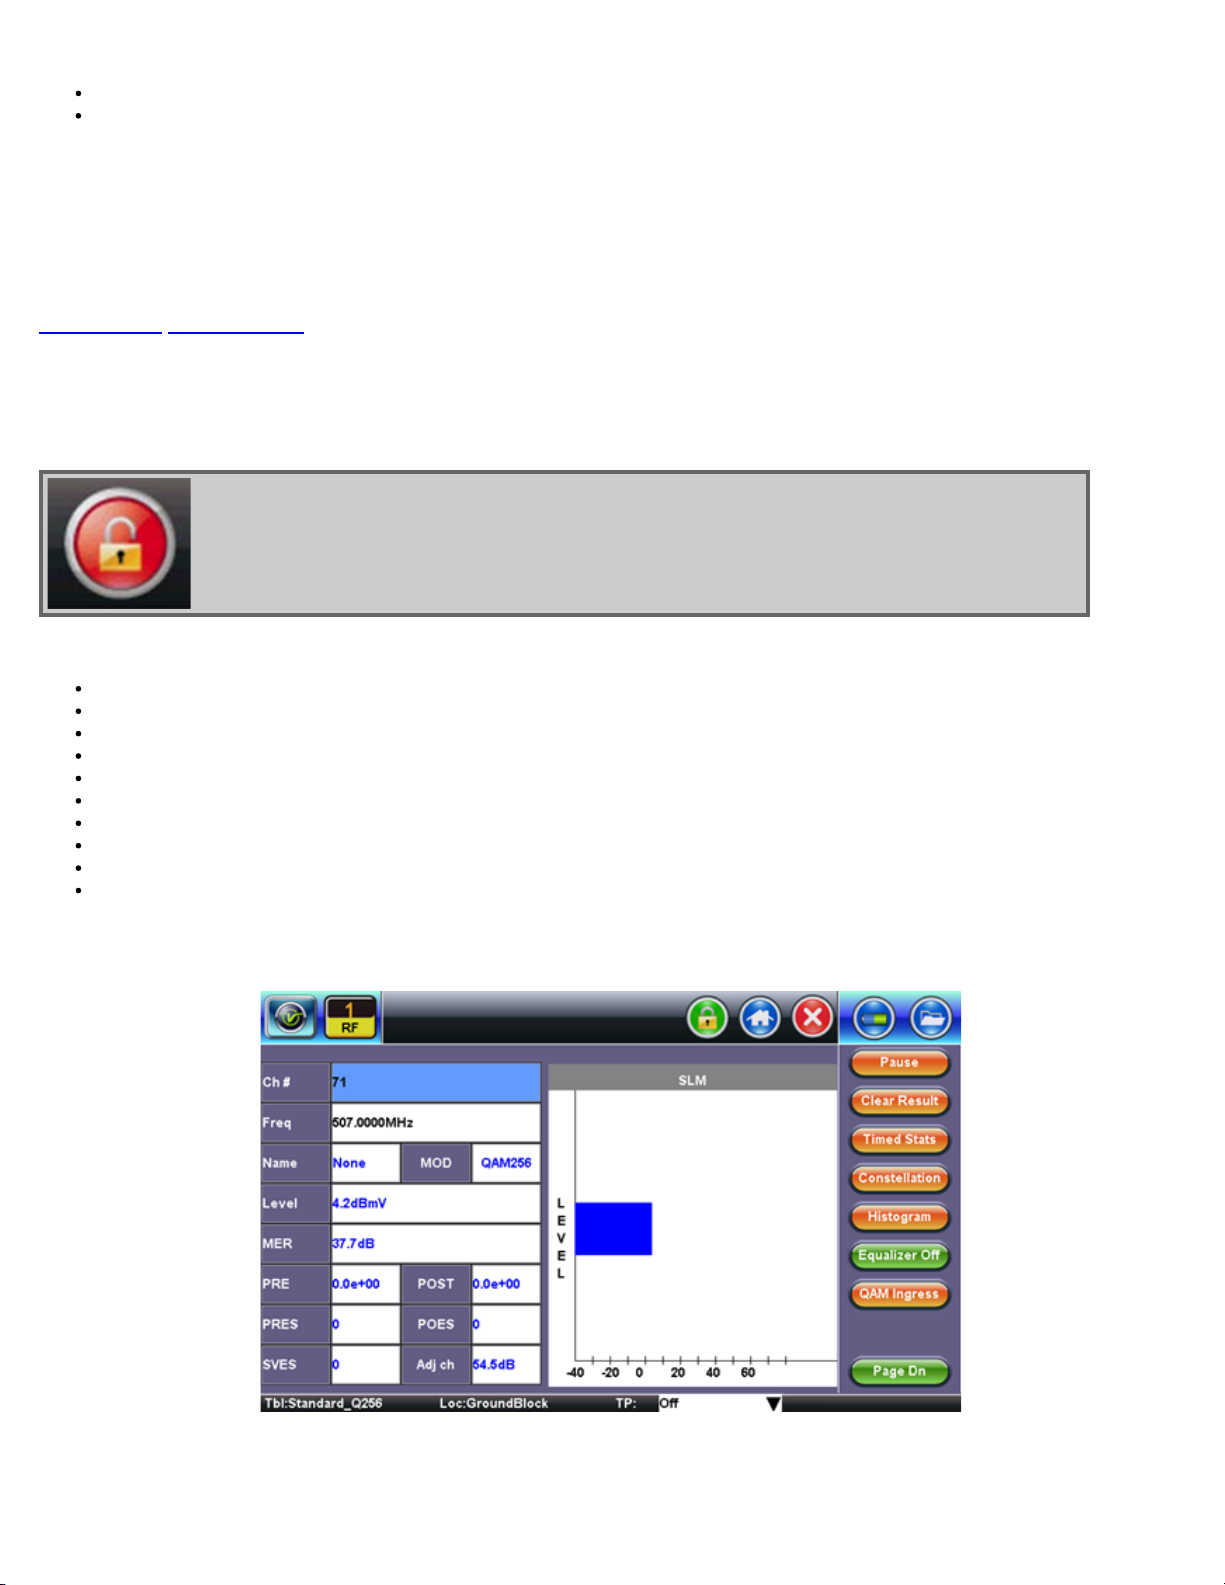
SLM button: The following measurement information is provided for digital signals:
Channel number (defined in the channel table)
Channel frequency (defined in the channel table)
Channel or program name
Modulation type measured
QAM Power Level in dBmV/dBuV including graphic bar indication
Modulation Error Ratio (MER) in dB
Pre BER & Pre Error Second ratio
Post BER & Post Error Second ratio
Severely Error Second count
Max Adjacent Channel Delta in dB
Graphic limit indicators are provided for all graphically displayed signal levels. Numeric data that is outside of limits are displayed in red.
SLM Measurement (Digital Carrier)
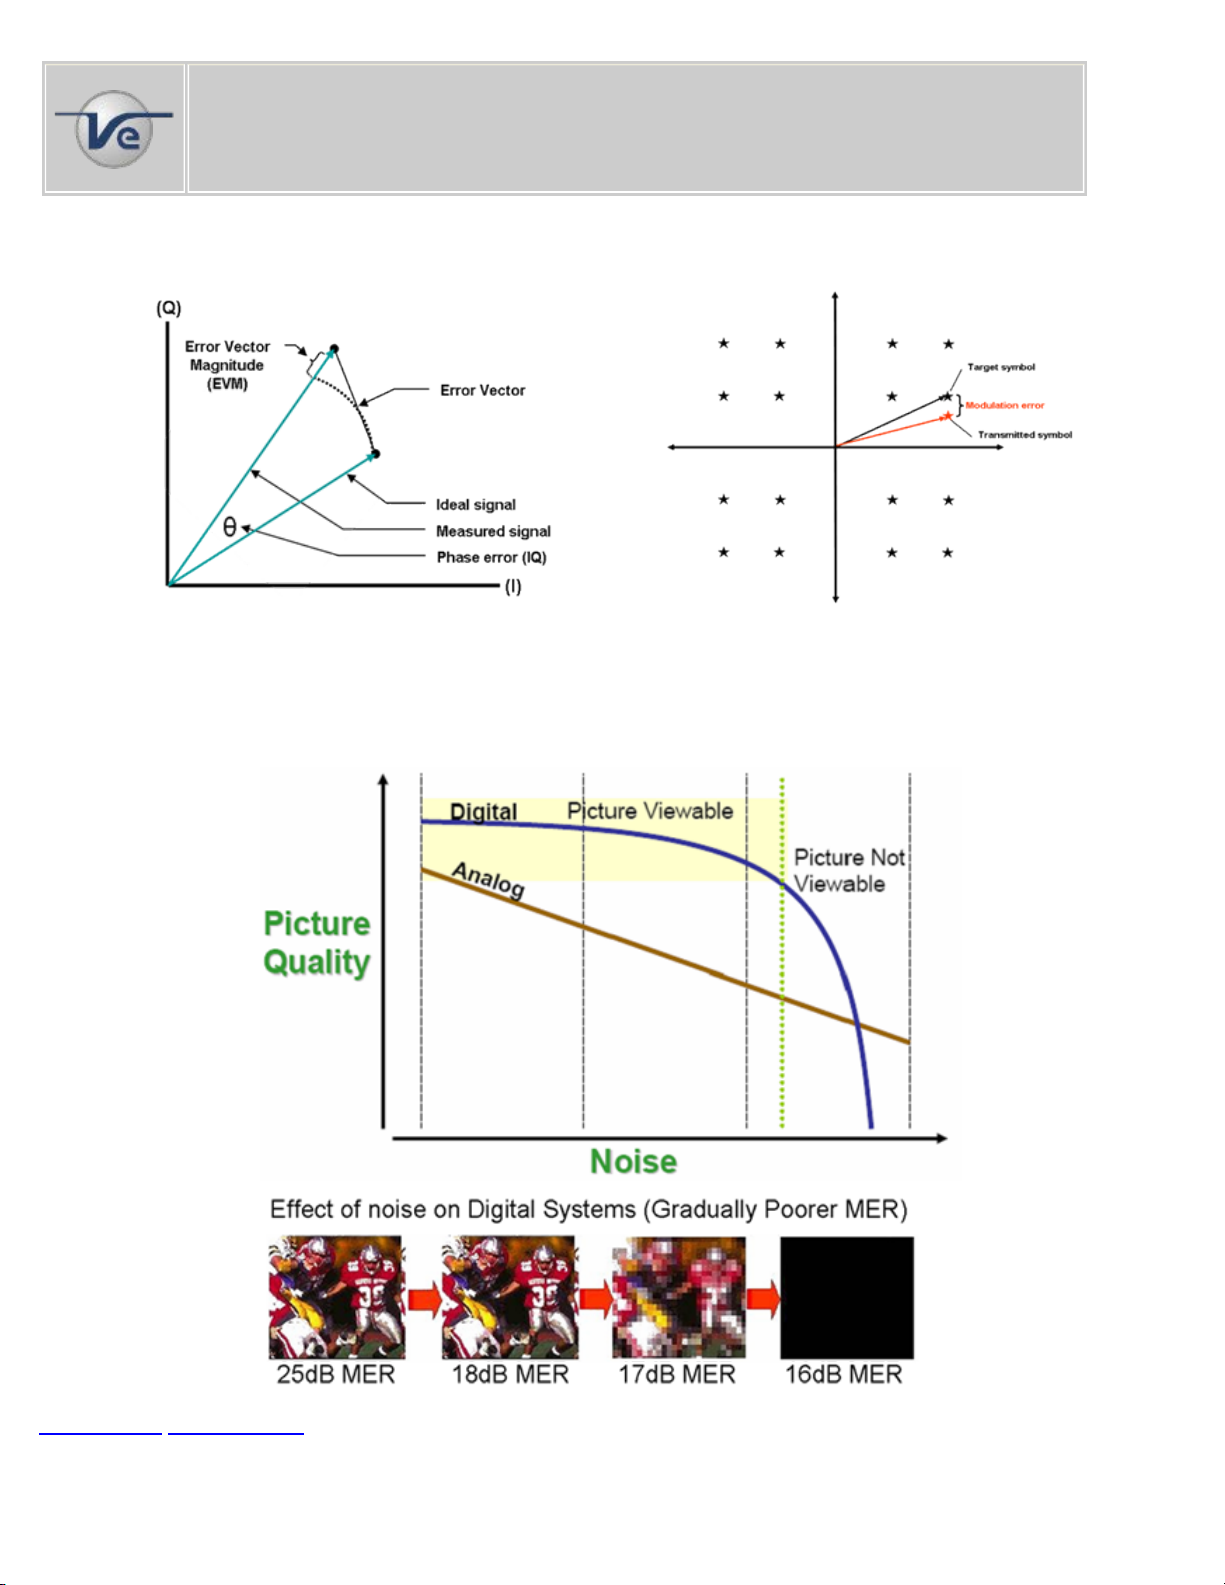
Note: Modulation Error Ratio (MER)
In digital systems, MER is very similar to Carrier to Noise (C/N) in analog systems. MER measures how
tightly symbols are recorded with respect to an optimum location based on the Error Vector Magnitude
(EVM).
Modulation
MER determines how much margin the system has available before a failure can be expected. A poor MER is not noticeable on the
picture up until the point of system failure - this is often referred to as the "Cliff Effect". Ideally you should have at least 4 to 5dB of margin
from the MER where significant errors occur to allow for system degradation. MER measurements are useful for early detection of nontransient (noise) impairments, such as system noise Ingress.
Error Ratio (MER) and Error Vector Magnitude (EVM) Relationship
Cliff Effect - Digital Carriers
Go back to top Go back to TOC
7.1.3 Constellation Measurements
In contrast to the measuring techniques used on digital TV signals transmitted via satellite, a wider and necessary range of measuring
techniques is provided for broadband cable testing. The influences acting on the broadband cable signal, which can be modulated with up
to 256QAM, are more varied and critical than in the satellite domain.
Constellation measurements are an example of such advanced measurements and are an ideal tool to identify QAM modulator problems.
Note: QAM lock
Ensure QAM lock is achieved on the digital carrier prior to making any Constellation measurement.
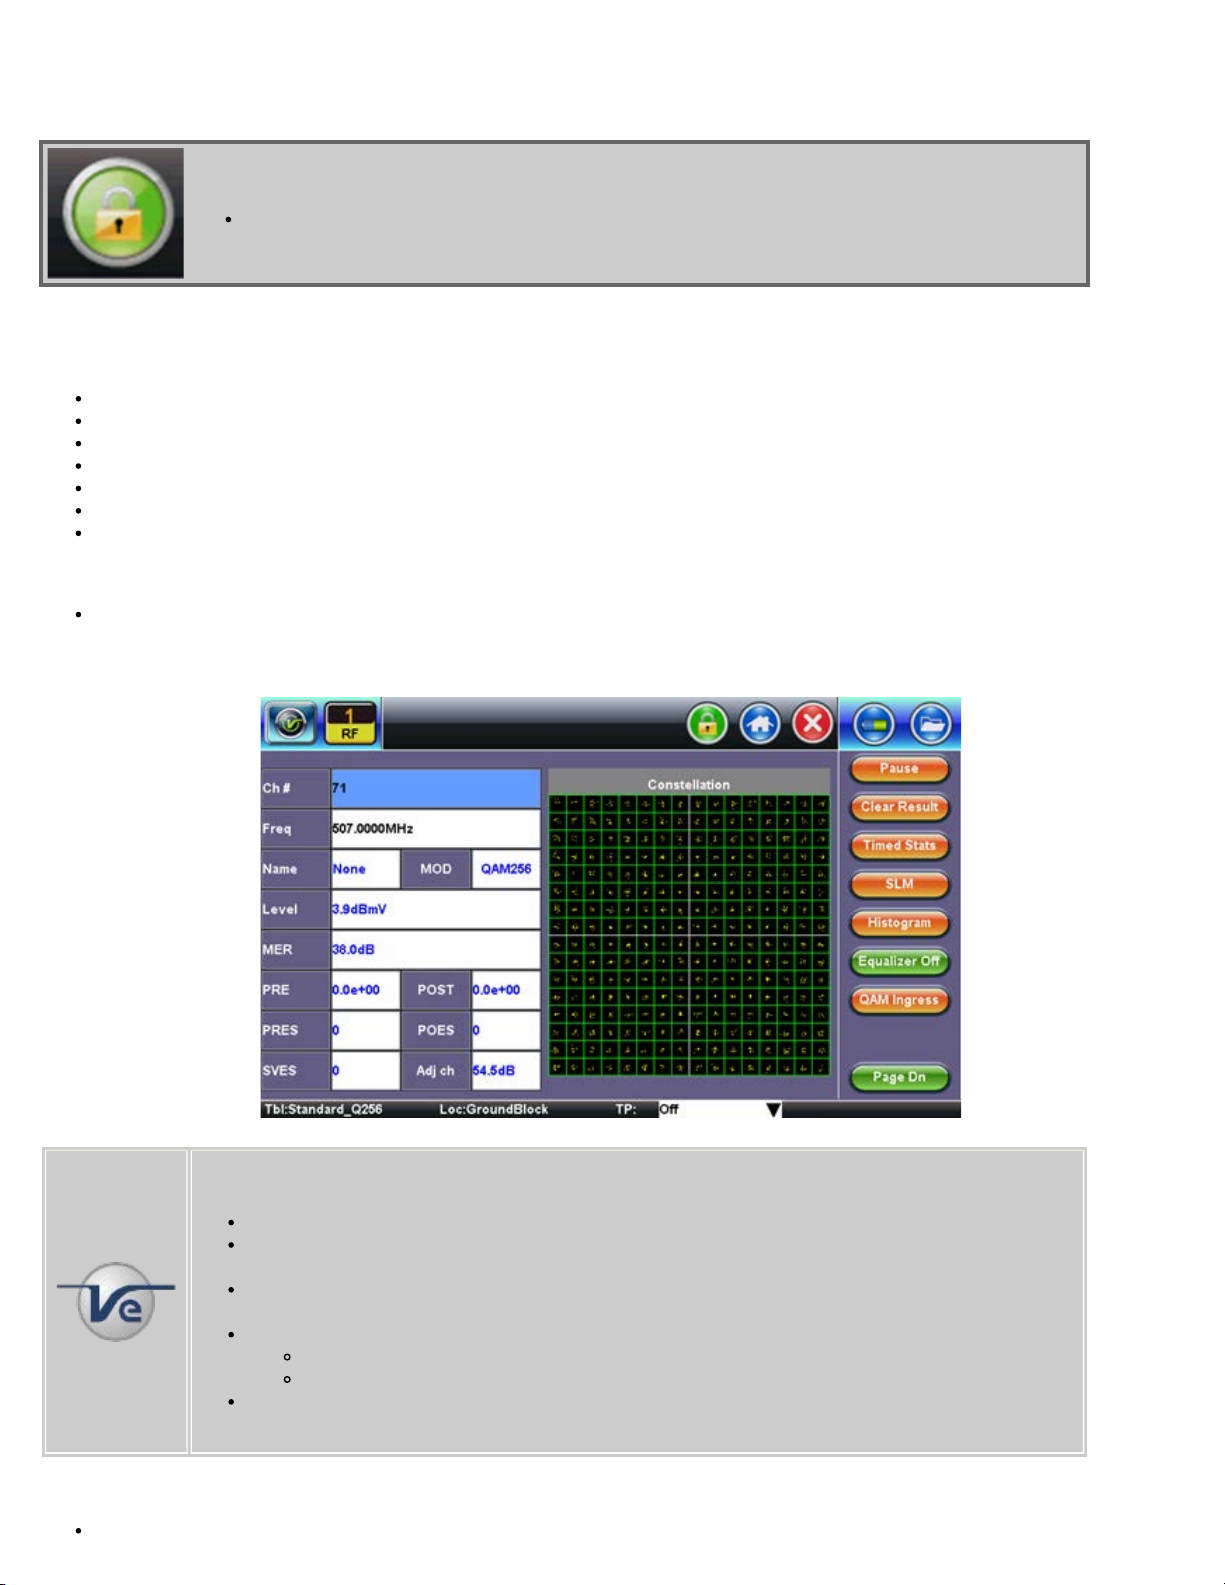
Constellation button:
The following measurements are reported:
QAM Power Level (numeric in dBmV/dBuV)
MER (numeric in dB) is an indication of the operating margin of the system
Pre BER & Pre Error Seconds (numeric) is the error rate of the incoming signal prior to being corrected FEC circuitry
Post BER & Post Error Seconds (numeric) is the error rate of the signal after the FEC has corrected all the possible errors
Severely Error Seconds (numeric)
Max Adjacent Channel Delta (numeric in dB)
Constellation (graphic)
The constellation display supports a zoom function.
For QAM64 and QAM256 modulation, the constellation is split into 4 quadrants for simplified viewing. The user can tap on any of
the four quadrants to zoom into this selected quadrant.
Constellation Diagram - Digital Carriers
Note: Bit Error Rate (BER)
Bit Error Rate (BER) measures how often an error occurs in a given amount of data.
The more errors, the more difficult it is for the FEC circuitry to correct those errors before picture
problems occur.
BER is useful for measuring long term system performance and periodic transient impairments that
can occasionally affect system performance.
BER is usually displayed in scientific notation e.g.;
where 1E-3 means one error in every 1000 bits
where 1E-6 is one error in every 1,000,000 bits
Ideally, the signal should have the highest exponent value - the higher the number, the lower the
errors.
Constellation diagrams
Constellation diagrams are used to graphically represent the quality and distortion of a digital signal.
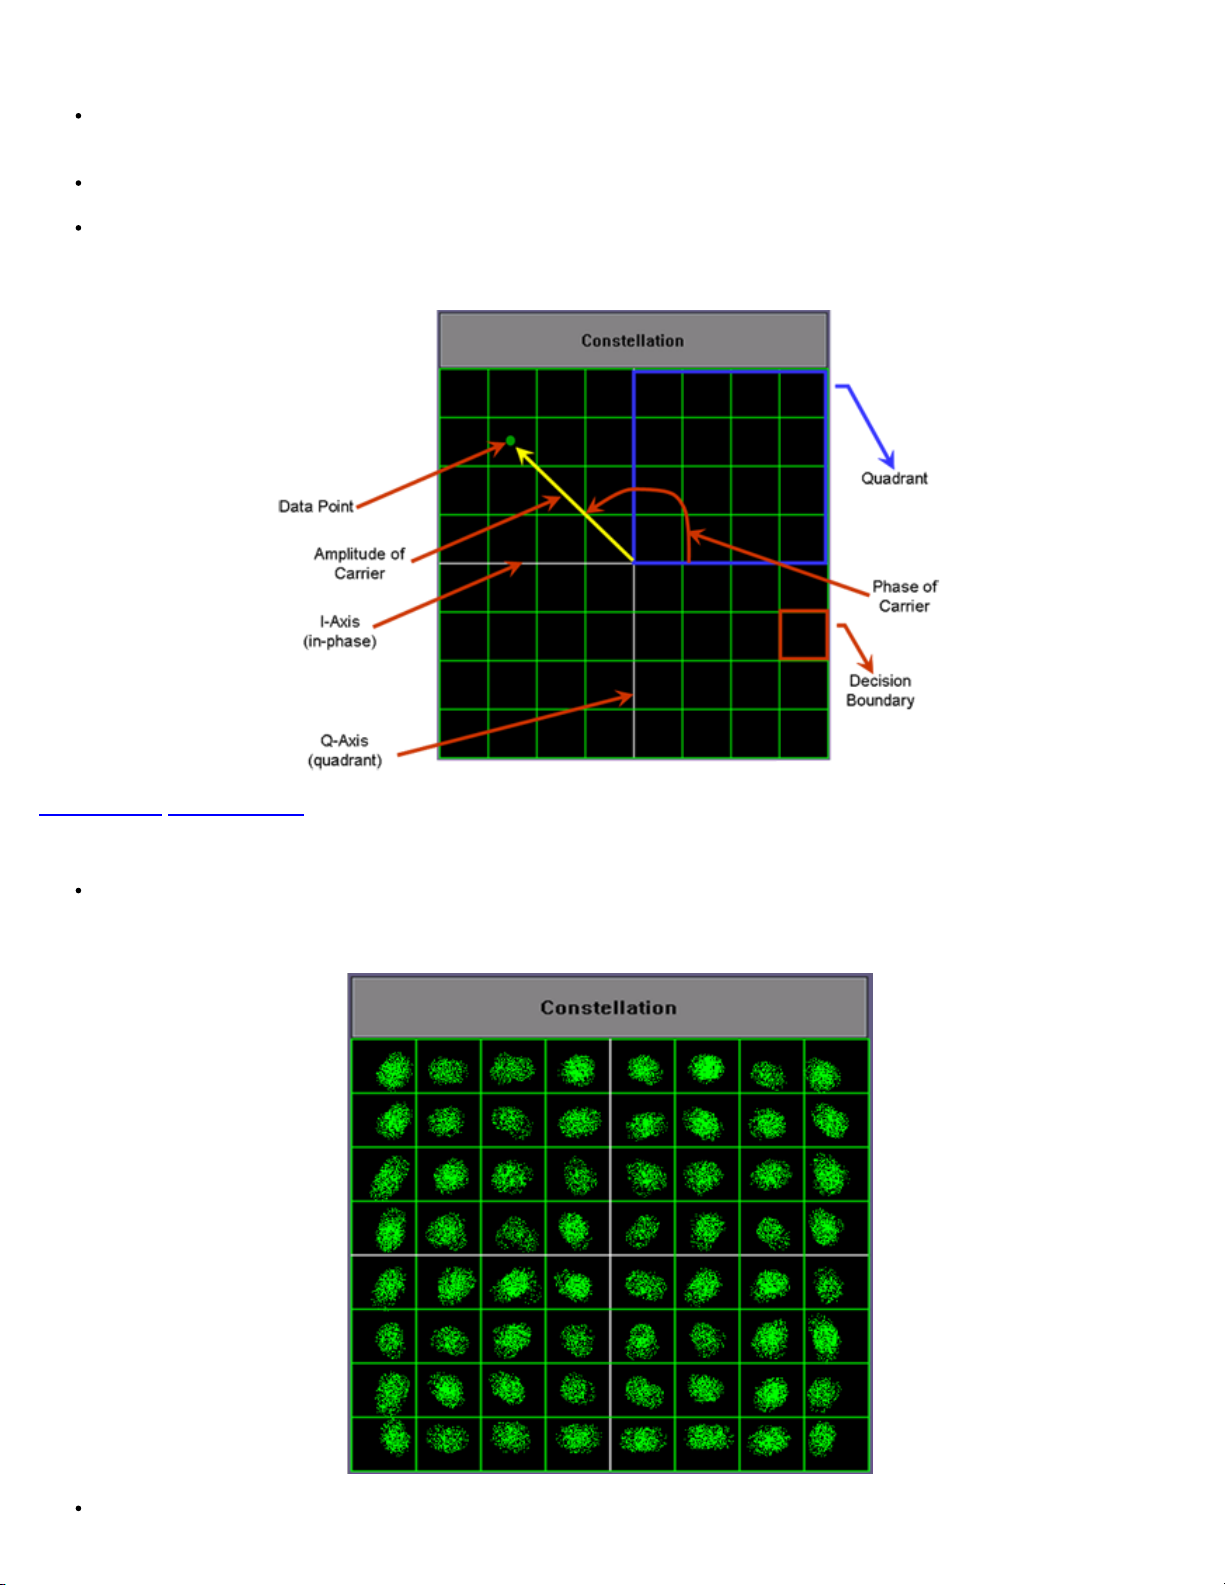
The diagram is an X/Y plot of the I (In-phase) and Q (Quadrature) axis components of the QAM signal and is particularly useful for
viewing impairments due to ingress and/or modulation problems present on the digital signal.
A symbol (essentially a waveform representing one or more bits) should ideally appear as a compact or clean dot in the center of
each symbol box. Decision boundaries exist within the constellation so that if the symbol falls within the boundary, the correct data
is received.
If due to noise or other interference, the symbol falls outside the boundary, the data is in error. Error detection and correction (e.g.
FEC) will attempt to the correct these errors, thus avoiding video impairments.
Observing the symbol's shape and location relative to their ideal positions allows you to draw some conclusions about the nature of
an impairment
Understanding the Constellation Diagram
Go back to top Go back to TOC
The following impairments can be assessed visually:
Gain compression - Pulls the symbol clusters into the center while the middle ones are unaffected. Gain compression can result
from poor or bad amplifiers, IF equalizers and up/down converters.
Gain Compression
Broadband or system noise - Causes symbol clusters to enlarge, which increases the probability of errors. An error occurs when
the dot is pulled across a decision boundary.
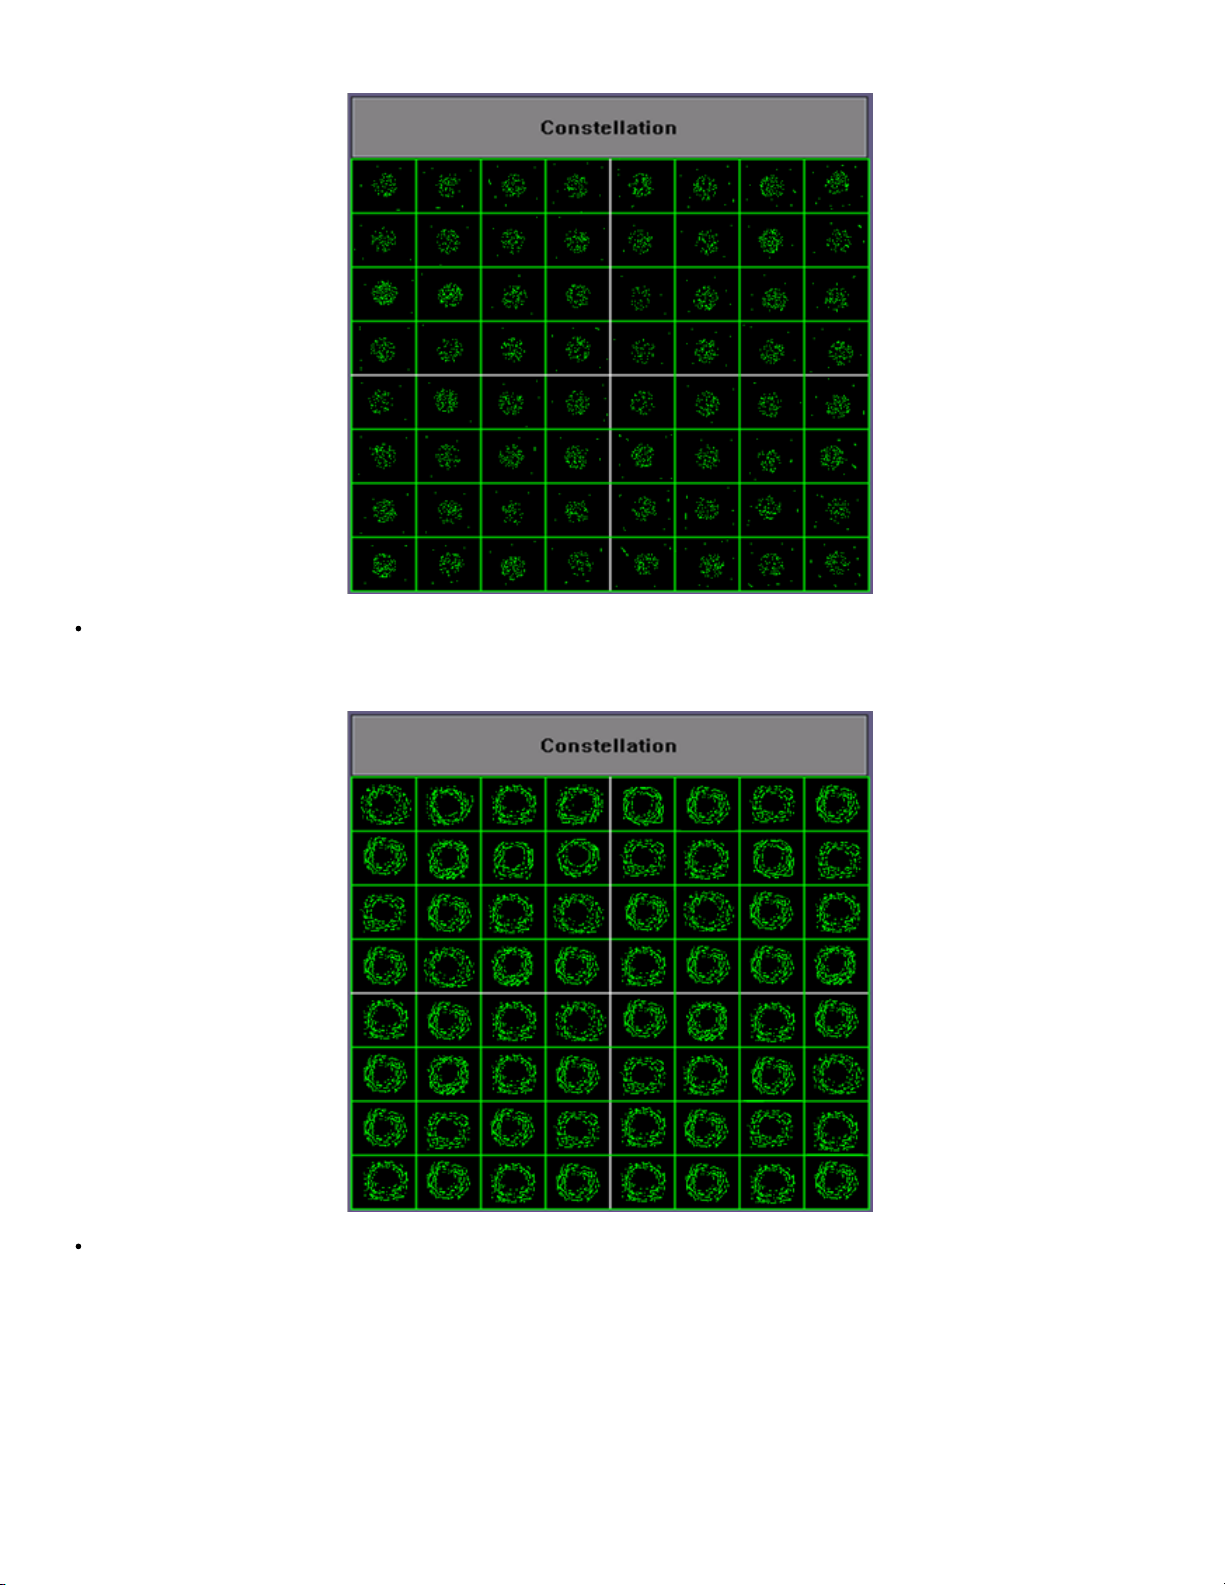
System Noise - Incoherent Interference
Coherent interference - CSO/CTB, spurs or ingress produce symbol clusters with a hole in the center so they appear as "donuts".
This can also be a result of laser clipping or sweep interference.
Coherent Interference
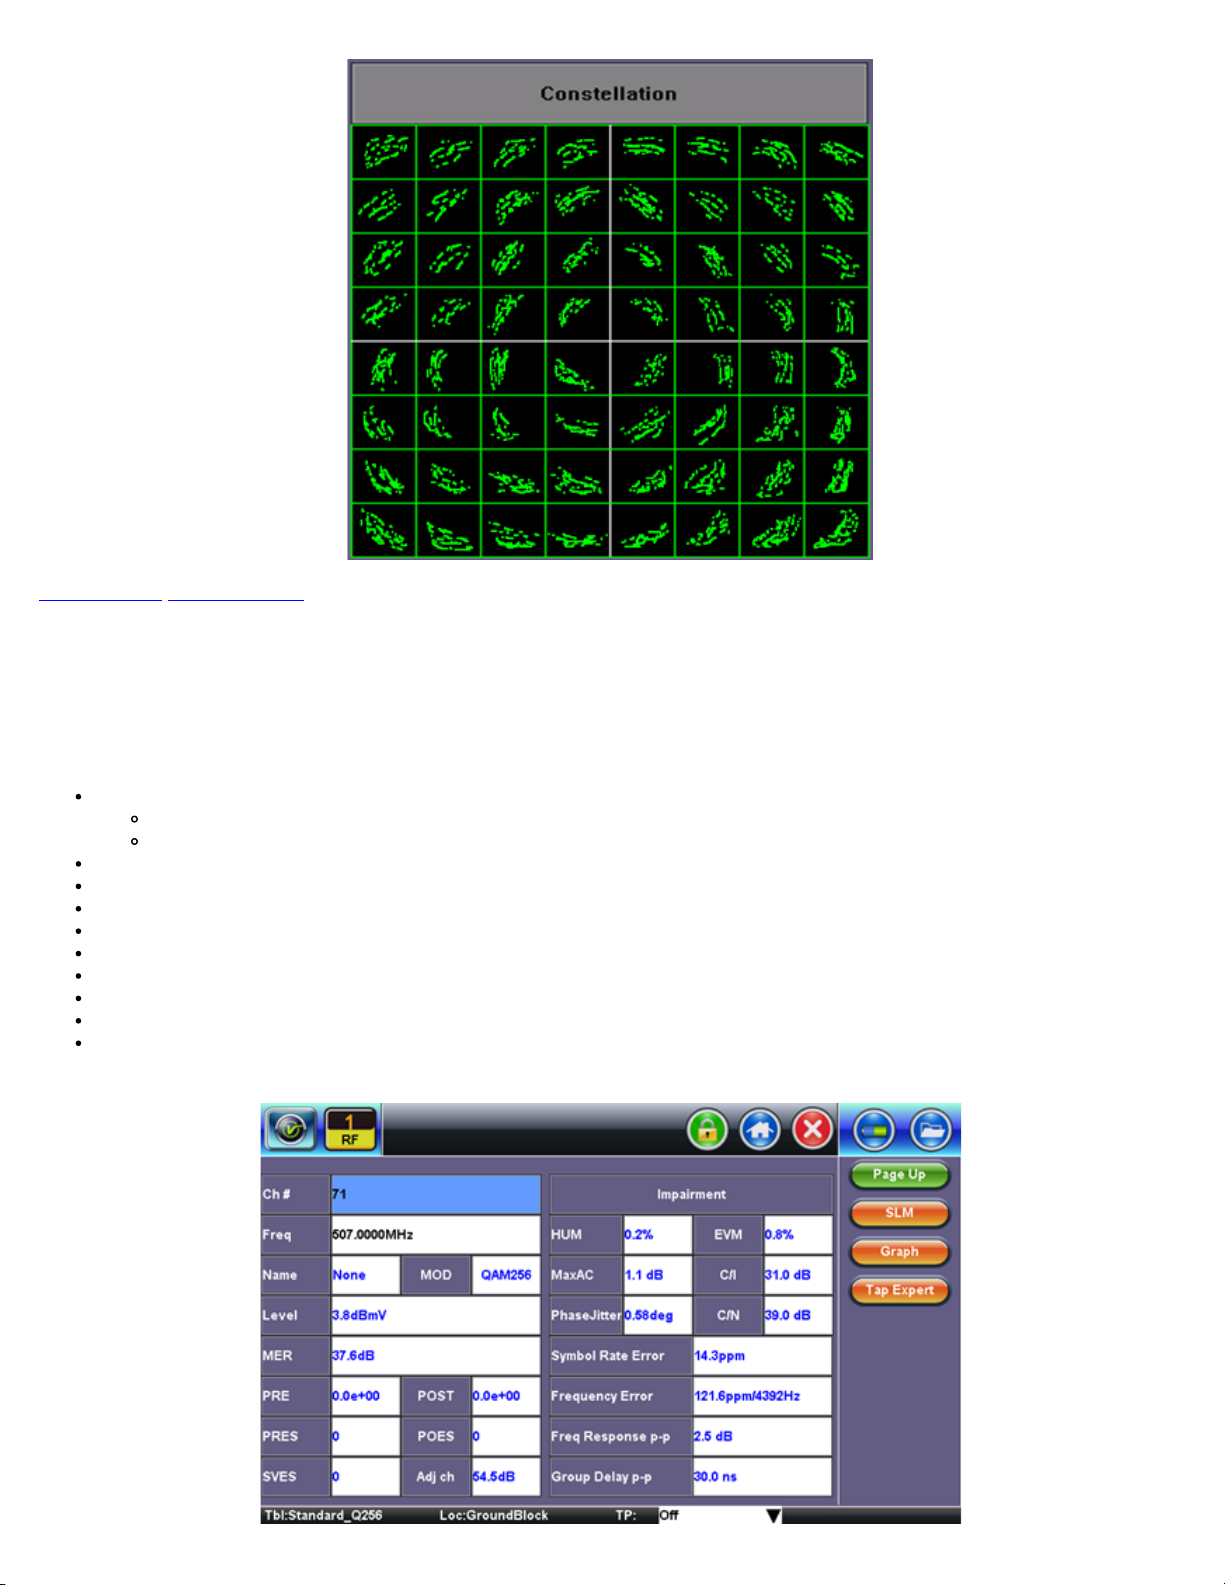
Phase noise - Also known as Phase jitter in a QAM signal, it is caused by transponders in the transmission path or by the I/Q
modulator. Phase jitter is a statistical quantity that affects the I and Q path equally. Phase noise causes the symbol clusters to
appear as arcs, particularly those near the edges of the constellation. Phase noise can also result from faulty headend up/down
converters.
Phase Noise
Go back to top Go back to TOC
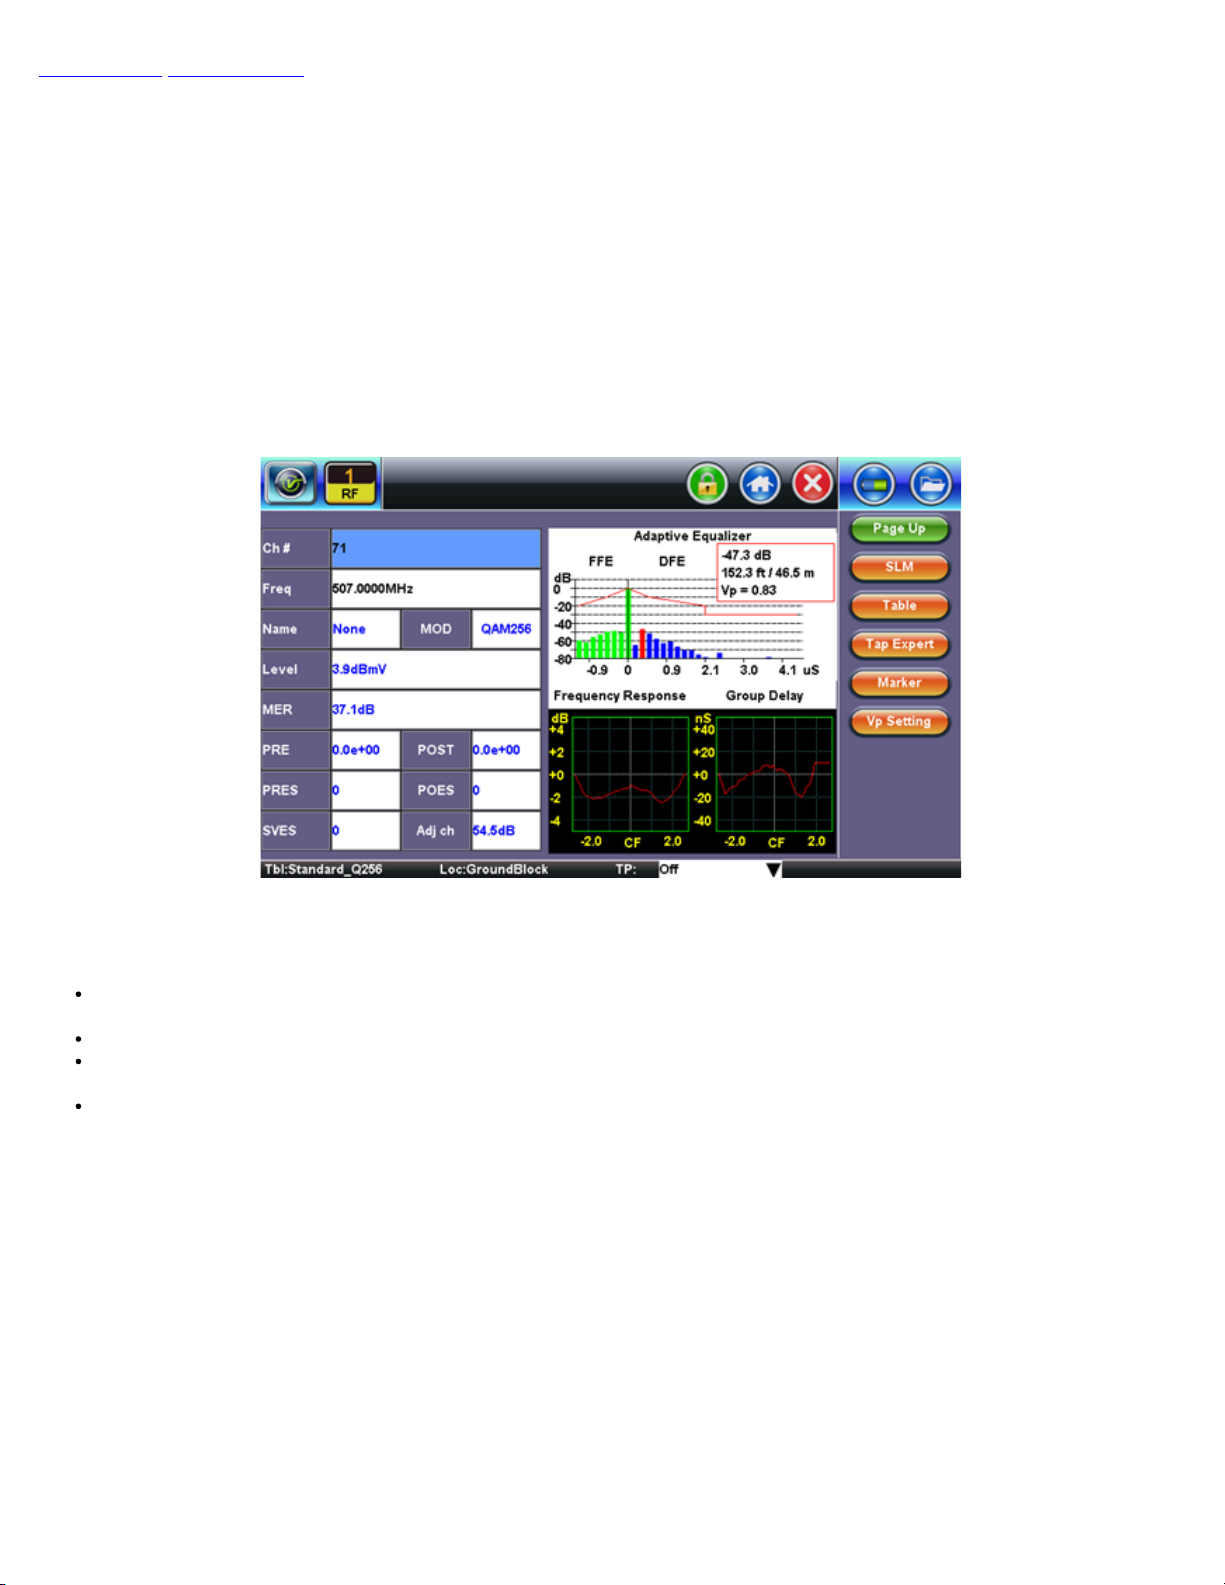
7.1.4 Impairment Measurements
7.1.4.1 Table Mode
In addition to the standard digital carrier measurements, the following impairments are also measured with the optional Advanced Digital
Measurement:
Error Vector Magnitude (EVM) in %
Measurement of modulation quality of the transmitted signal before forward error correction.
Error Vector Magnitude = (maximum symbol magnitude / rms error magnitude) X 100%
Maximum AC (maximum haystack amplitude change/variation)
Carrier to Ingress
Carrier to noise
HUM in %
Phase jitter in degrees
Symbol Rate Error in ppm
Frequency Error in ppm (deviation from nominal preset frequency)
Peak to Peak Frequency Response
Peak to Peak Group Delay
Impairment Table (Digital Carrier)
Go back to top Go back to TOC
7.1.4.2 Graph Mode
The graph mode displays the Adaptive Equalizer Stress. The adaptive equalizer graph is a useful tool for troubleshooting linear distortion.
Overview: Adaptive Equalization
Modern Cable Modems, Set-top-boxes and Cable Modem Termination Systems (CMTS) use advanced Adaptive Equalizer technology to
compensate for complex in-channel frequency response impairments caused by micro-reflections, amplitude ripple and group delay
occurring in the cable network. Signals in a cable system can arrive at the receiver before or after the desired signal. Signals normally
arriving afterwards are either reflections or micro-reflections.
Rather than equalizing the entire upstream or downstream RF frequency spectrum, an adaptive equalizer adjusts its characteristics based
on a single digitally modulated QAM carrier only as channel conditions change. This process maximizes or greatly improves the Modulation
Error Ratio (MER) in the forward or reverse path.
Impairment Graph (Adaptive Equalizer)
Adaptive Equalizer Measurement
The bar graph shows the performance of the Feed Forward Equalizer (FFE) and Decision Feedback Equalizer (DFE) circuitry.
The vertical axis displays the level in decibels (dB), while the horizontal axis displays units of time typically relative to the adaptive
equalizer tap spacing.
Each bar displays a coefficient corresponding to the Feed-Forward Equalizer (FFE) and Decision Feedback Equalizer (DFE) taps.
There are eight coefficients for the FFE and 24 coefficients for the DFE. The 8th coefficient, or the tallest vertical bar, is the incident
signal (main signal path) and it is normally close to 0dB representing unity gain.
If any bar appears above the average noise floor to the right of this incident signal, the problem is related to one or several microreflections.
Interpreting the Adaptive Equalizer Display
 Loading...