

Page 1

CANoe and CANalyzer as Diagnostic Tools
Version 1.6
2020-09-03
Application Note AN-IND-1-001
Author
Vector Informatik GmbH
Restrictions
Public Document
Abstract
This application gives an introduction into working with diagnostics in
CANoe/CANalyzer. It presents the basic technical aspects and possibilities with the
Diagnostic Feature Set, complements the help file of CANoe/CANalyzer and may be
used as a tutorial.
Table of Contents
1.0 Overview ................................................................................................................................... 3
1.1 Introduction ..................................................................................................................... 3
1.2 Diagnostic components ................................................................................................... 4
1.3 “Built-in” diagnostic channel vs. TP DLL and CAPL Callback Interface ............................. 5
2.0 Diagnostics in CANoe and CANalyzer .................................................................................... 6
2.1 Transport Protocol support .............................................................................................. 6
2.2 Diagnostic Descriptions ................................................................................................... 7
2.2.1 CDD – CANdela Diagnostic Description........................................................................... 7
2.2.2 ODX – Open Diagnostic Data Exchange.......................................................................... 7
2.2.3 MDX – Multiplex Diagnostic Data Exchange .................................................................... 7
2.2.4 Basic Diagnostic Description (UDS or KWP) .................................................................... 7
2.2.5 Standard Diagnostic Description ...................................................................................... 8
2.3 Additional Descriptions .................................................................................................... 8
2.4 Trace window .................................................................................................................. 9
2.5 Diagnostic Feature Set .................................................................................................. 10
2.5.1 Interactive Diagnostic Console window .......................................................................... 10
2.5.2 Fault Memory window.................................................................................................... 10
2.5.3 Variant Coding Window ................................................................................................. 11
2.5.4 Diagnostic Session Control window ............................................................................... 12
2.5.5 OBD-II window .............................................................................................................. 12
2.5.6 ECU, gateway or tester simulations using CAPL ............................................................ 12
2.5.7 Test modules using CAPL (CANoe only) ....................................................................... 13
2.5.8 Test Units (CANoe only) ................................................................................................ 13
2.5.9 Symbol Explorer for diagnostics objects and parameters ............................................... 13
2.5.10 Autocomplete Input Assistance for diagnostics .............................................................. 14
2.5.11 Functional Group Requests ........................................................................................... 14
2.6 Access to diagnostics features via COM ........................................................................ 14
2.7 Basic Diagnostic Editor .................................................................................................. 14
2.8 Security Access handling............................................................................................... 14
3.0 First steps............................................................................................................................... 15
3.1 Usage of Diagnostic Descriptions .................................................................................. 15
3.1.1 Add a Diagnostic Description ......................................................................................... 15
3.1.2 Configure the Diagnostic Description ................................................................ ............. 16
3.2 Usage of Diagnostic Console, Session Control and Fault Memory window ..................... 17
3.2.1 Send a diagnostic request and receive a response ........................................................ 18
3.2.2 Read fault memory ........................................................................................................ 18
3.2.3 Functional Group Requests ........................................................................................... 18
Page 2

CANoe and CANalyzer as Diagnostic Tools
Copyright © 2020 - Vector Informatik GmbH 2
Contact Information: www.vector.com or +49-711-80 670-0
3.2.4 Change the session and security level ........................................................................... 18
3.3 Display diagnostic data .................................................................................................. 18
3.3.1 Diagnostic data in State Tracker, Data and Graphics window ........................................ 19
3.3.2 Diagnostic data in panels .............................................................................................. 19
4.0 Using CAPL for Diagnostics .................................................................................................. 20
4.1 Common techniques for Simulation and Tester .............................................................. 20
4.1.1 Usage of the CAPL Browser .......................................................................................... 20
4.1.2 Work with parameters.................................................................................................... 21
4.2 ECU diagnostics simulation ........................................................................................... 22
4.2.1 Necessary preparations ................................................................................................. 22
4.2.2 Add a Network Node to the Simulation Setup ................................................................ 23
4.2.3 Add a database in case of LIN and FlexRay .................................................................. 23
4.2.4 Add a Diagnostic Description and assign it to the network node ..................................... 23
4.2.5 Configure the Network Node in Simulation Setup ........................................................... 24
4.2.6 Add the CAPL Callback Interface................................................................................... 25
4.2.7 Debug level ................................................................................................................... 25
4.2.8 Add a diagnostics request event handler ....................................................................... 26
4.2.9 Create a diagnostic response ........................................................................................ 26
4.3 CANoe/CANalyzer as Diagnostic Tester ........................................................................ 27
4.3.1 Set the diagnostic target ................................................................................................ 27
4.3.2 Create a diagnostic request ........................................................................................... 27
4.3.3 Add a diagnostics response event handler ..................................................................... 27
4.3.4 Negative Response handling ......................................................................................... 27
4.4 Combine Test Feature Set and Diagnostic Feature Set.................................................. 28
4.4.1 Timeout handling ........................................................................................................... 28
4.4.2 Automated diagnostic tests with CANoe ........................................................................ 29
4.5 Using CAPL in the measurement setup ......................................................................... 32
5.0 Advanced examples ............................................................................................................... 32
5.1 ECU simulation of “Response Pending” ......................................................................... 32
5.2 Modifying the length of a diagnostic object ..................................................................... 33
5.3 Fill diagnostic content .................................................................................................... 33
5.4 Fault injection ................................................................................................................ 33
5.4.1 Make request length illegal ............................................................................................ 33
5.4.2 Introduce errors on transport protocol level .................................................................... 34
5.5 Access a node via a gateway simulation ........................................................................ 34
6.0 Common mistakes ................................................................................................................. 35
7.0 Abbreviations ......................................................................................................................... 37
8.0 References ............................................................................................................................. 37
9.0 Additional Resources ............................................................................................................ 38
10.0 Contacts ................................................................................................................................. 38
Page 3

CANoe and CANalyzer as Diagnostic Tools
Copyright © 2020 - Vector Informatik GmbH 3
Contact Information: www.vector.com or +49-711-80 670-0
1.0 Overview
1.1 Introduction
Diagnostics is used to configure, maintain, support, control and extend an ECU before or after it is
installed in a system, e.g. a vehicle. Diagnostics is usually performed in a request – response scheme:
a tester (client) sends a request to an ECU (or even more than one ECU) and the ECU (server)
responds by sending a “positive response message” containing the requested information, or a
“negative response” indicating the reason for the negative response.
The purpose of this application note is to give a general introduction into working with diagnostics in
the Vector tools CANoe and CANalyzer. The basic technical aspects and possibilities (“first steps”)
with the Diagnostic Feature Set will be presented. Examples are used to get the test engineer started
with testing diagnostics in CANoe/CANalyzer.
This document is a complement to the online help in CANoe/CANalyzer and should be used as a
tutorial to learn the “first steps” of the Diagnostic Feature Set. For more detailed information about the
Diagnostic Feature Set, please refer to the CANoe/CANalyzer help file demo applications, both of
which come with a standard CANoe/CANalyzer installation.
Note
The functionality described below refers to CANoe and CANalyzer version 14.0 (unless
otherwise noted – please see the general limitations of CANalyzer in chapter 2.0). The
term “CANoe/CANalyzer” stands for both applications, while the term “CANoe” describes
functionality only available with CANoe.
For older program versions application notes can be requested from the Vector support
(cf. chapter 10.0).
Page 4

CANoe and CANalyzer as Diagnostic Tools
Copyright © 2020 - Vector Informatik GmbH 4
Contact Information: www.vector.com or +49-711-80 670-0
1.2 Diagnostic components
The following table lists the names of the components relevant for diagnostics in CANoe/CANalyzer,
how to activate them and where to find more information.
Component
Description
Activation
More Information
Transport Protocol (TP)
DLLs
Implementation of the
respective Transport
Protocol for CANoe
simulation nodes
See chapter 2.1
Regarding CAN in
folder “User Assistance
| Documents”:
CanTP_Manual.PDF
ISO TP Observer
Displays TP information
in the trace window for
the CAN messages
used by the ISO TP
Menu: “Configuration->
Diagnostics/ISO TP
configuration”, page
“ISO TP Observer”
Online help:
“Diagnostics/ISO TP
Configuration: ISO TP
Observer”
KWP 2000 Observer
Extension of the ISO
TP Observer that
interprets the
transported data
according to Keyword
Protocol 2000
Like ISO TP Observer,
check box
“Interpretation
according to KWP2000”
Online help:
“Diagnostics/ISO TP
Configuration: ISO TP
Observer”
Diagnostics Observer
Extension of the ISO
TP Observer, interpret
the transported data
according to the
available diagnostic
specification(s)
Menu: “Configuration->
Diagnostics/ISO TP
configuration”,
corresponding network
in which Diagnostic
Descriptions can be
loaded
Online help: “Diag. /
ISO TP Obs.:
Diagnostic
Descriptions”
Interactive Diagnostic
Console
Direct sending of
requests defined in a
Diagnostic Description,
display of responses
By assigning a
Diagnostic Description
to any of the available
networks (see
Diagnostics interpreter
above) a corresponding
Diagnostic Console
window is made
available, and can be
accessed via the “View”
menu
Online help: “Diagnostic
Console: Overview”
Fault Memory window
Direct access to an
ECU’s fault memory
By assigning Diagnostic
Descriptions to any of
the available networks
(see Diagnostics
interpreter above) a
corresponding Fault
Memory window is
made available, and
can be accessed via
the “View” menu
Online help: “Fault
Memory window:
Overview”
Diagnostic Session
Control window
Easy switching of the
session state (e.g.
Default, Extended,
Programming), helpful
especially in
combination with
services protected by
security access
By assigning a
Diagnostic Description
to any of the available
networks (see
Diagnostics interpreter
above) a corresponding
Diagnostic Session
Control window is made
available, and can be
accessed via the “View”
Online help: “Diagnostic
Session Control:
Overview”
Page 5
CANoe and CANalyzer as Diagnostic Tools
Copyright © 2020 - Vector Informatik GmbH 5
Contact Information: www.vector.com or +49-711-80 670-0
Component
Description
Activation
More Information
menu
OBD II window
Support of on-board
diagnostics
By choosing the
addressing mode (11
bit Normal or 29 bit
NormalFixed) at the
page “OBD-II
Functionality” (Menu:
“Configuration->
Diagnostics/ISO TP
configuration”)
Online help:
“Diagnostics
Description Settings:
OBD-II Functionality”
CAPL extensions for
diagnostics
Specialized CAPL
functions to access
diagnostics objects
specified via Diagnostic
Description(s)
The extended CAPL
API is available after
assigning at least one
Diagnostic Description
to the CANoe
configuration
Online help:
“Diagnostics: Expanded
Functions in CAPL”
CAPL Callback
Interface reference
implementation
Handles the
communication
between Diagnostic
Layer and
TransportProtocol
Layer in CANoe
Add the include file for
the respective TP into
the simulation or tester
node
Application Note
AN-IND-1-012
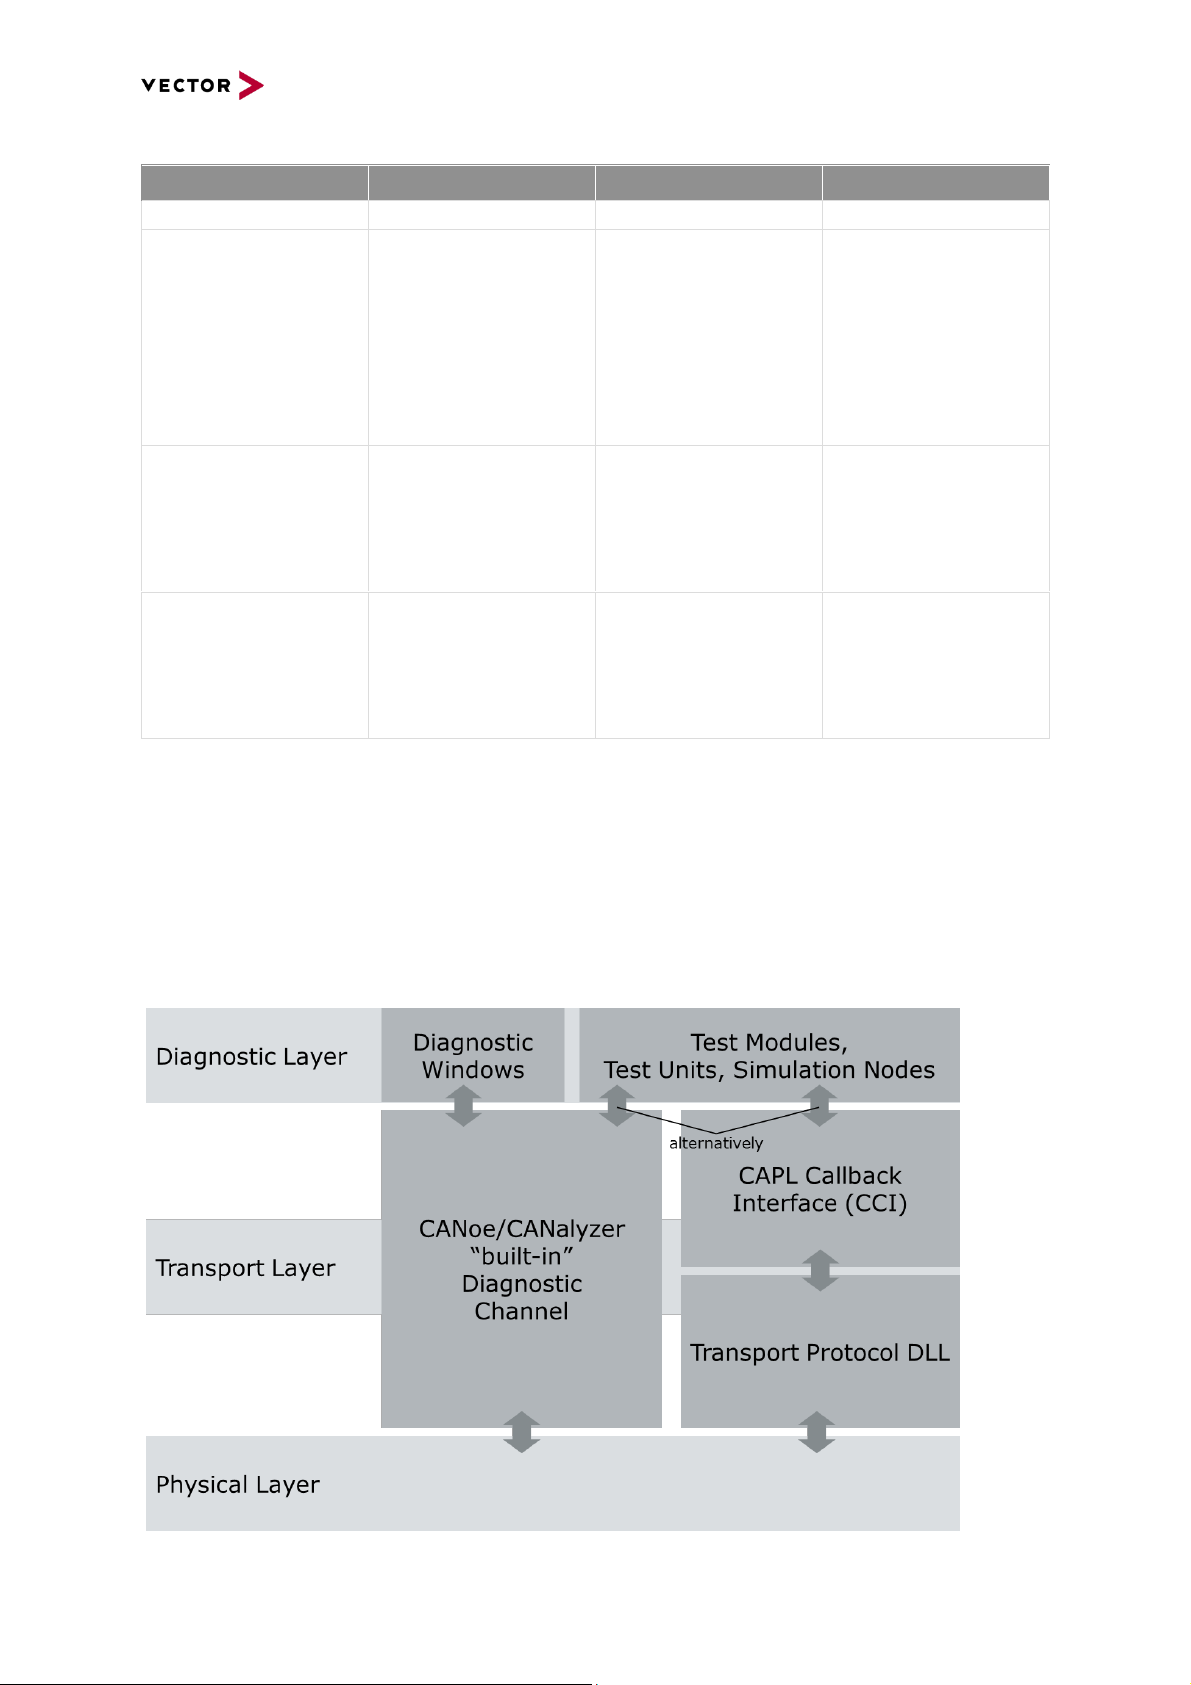
1.3 “Built-in” diagnostic channel vs. TP DLL and CAPL Callback Interface
While CANalyzer only provides the “built-in” diagnostic channel for diagnostic communication, CANoe
offers an additional alternative: The so-called CAPL Callback Interface (CCI) in combination with the
corresponding Transport Protocol (TP) DLL. The CCI acts as a kind of interconnection between
diagnostic layer and TP layer in CANoe.
The diagnostic windows (Diagnostic Console, Fault memory, Session Control and OBD-II window) are
always using the built-in diagnostic channel. Test Modules and Test Units are able to use both ways
alternatively. While CANoe versions up to 9.0 SPx mandatorily need the CCI for simulating ECU
diagnostics, CANoe 10.0 and higher also offers the built-in diagnostic channel for simulation nodes:
Figure 1: Layer model of CANoe
Page 6

CANoe and CANalyzer as Diagnostic Tools
Copyright © 2020 - Vector Informatik GmbH 6
Contact Information: www.vector.com or +49-711-80 670-0
Before setting up a diagnostics configuration in CANoe, you should therefore make up your mind
about the intended use cases. In most cases, the built-in diagnostic channel will be sufficient. The CCI
is only needed if your CANoe configuration needs to be compatible with older CANoe versions or if
you intend to implement some fault injection functionality on TP layer. For more information on the
CCI, refer to the application note AN-IND-1-012.
2.0 Diagnostics in CANoe and CANalyzer
CANoe and CANalyzer can be used in all steps of developing ECUs and performing diagnostics on
them. The following table summarizes the main use cases, the corresponding diagnostic features and
the differences between CANoe and CANalyzer:
Use case
Feature
CANalyzer
CANoe
Analysis of real ECU
communication
ISO TP, KWP2000 and
Diagnostics Observer
Perform diagnostics with
ECUs using integrated tester
functionality
Diagnostic Console
Error search
Fault Memory window
Security access and session
control
Session Control window
On-board diagnostics
OBD II window
Design of the diagnostic
functionality
System / remaining bus simulation
Implementation of diagnostic
functionality in a simulated
ECU
TP DLLs, ECU simulation and
CAPL extensions
Specification-/Integration/Regression tests including
fault injection on TP level
TP DLLs (only necessary if TP fault
injection requested), CAPL
extensions, Test Feature Set (TFS)
2.1 Transport Protocol support
CANoe/CANalyzer supports several automotive protocols. For most of them, a node layer Transport
Protocol (TP) DLL and a corresponding CCI reference implementation exists in CANoe:
Network
Protocol
Interpretation
TP DLL (Node layer)
CCI reference
implementation
CAN
ISO/DIS 15765-2
DoCAN (OSEK TP)
ISO TP
observer
osek_tp.dll
CCI_CanTP.cin
LIN
ISO 17987-2
(LIN TP)
(with option
LIN)
LINtp.dll
CCI_LINTP.cin
K-Line
ISO 14230-2
DoK-Line
K-Line
observer
- (not necessary)
CCI_KLine.cin
(+KLine_Utilities.cin)
FlexRay
ISO 10681-2 Transport
Protocol STD Version
2.2 2008-11-28
FlexRay TP
observer
(with option
Flexray)
FlexRayTPISO.DLL
CCI_FrISOTP.cin
(+CCI_FrCommon.cin)
AUTOSAR Transport
Layer V2.1.1 R2.1 Rev
0014
FlexRay TP
observer
(with option
Flexray)
AutosarFlexRayTP3.dll
CCI_FrAsrTP.cin
(+CCI_FrCommon.cin)
Ethernet
ISO 13400-2
DoIP Packet
Events
DoIP.DLL
CCI_DoIP.cin
Page 7

CANoe and CANalyzer as Diagnostic Tools
Copyright © 2020 - Vector Informatik GmbH 7
Contact Information: www.vector.com or +49-711-80 670-0
DoIP (on UDP + TCP)
observer
HSFZ (on UDP + TCP)
HSFZ
message
observer
DoIP.DLL
CCI_DoIP.cin
SoAd (on TCP)
(with option
Ethernet)
DoIP.DLL
-
The interpretation is typically performed by the TP observer for the respective network. The TP
observer interprets messages sent over the network according to this TP and displays the results in
the Trace window in clear text.
It also includes an implementation of the transport protocol that enables easy sending and receiving of
diagnostic objects. This implementation is realized by a node layer DLL that comes with every CANoe
standard installation and takes care of transport protocol specific functions such as segmentation, flow
control etc. For further explanation on CAN TP and the corresponding osek_tp.dll, refer to [1].
To enable transport layer interpretation, it is needed to activate the ISO TP Observer. Please refer to
the online help in CANoe/CANalyzer on how to activate the observer.
To enable the TP functionality for a simulated node, please refer to paragraph 4.2.
2.2 Diagnostic Descriptions
To work on diagnostics layer in CANoe/CANalyzer, Diagnostic Descriptions have to be assigned to the
configuration. Simple diagnostic descriptions can be defined using CANoe/CANalyzer’s Basic
Diagnostic Editor. If you want to take advantage of the Fault Memory or the Session Control window,
Diagnostic Descriptions in the shape of CDD, ODX (PDX) or MDX files are necessary. All of these
types are referred to as “Diagnostic Descriptions” in this application note. It is possible to mix those file
types within one CANoe/CANalyzer configuration.
2.2.1 CDD – CANdela Diagnostic Description
CANdela Diagnostic Descriptions (CDD) files are databases for diagnostic data, comparable to the
.dbc-file used for CAN messages and signals. The CDD files are created in the Vector tool
CANdelaStudio and can be used in CANoe/CANalyzer for symbolic access and interpretation of
diagnostic services and parameters.
2.2.2 ODX – Open Diagnostic Data Exchange
ODX files (Open Diagnostic Data Exchange) also carry diagnostic data. This data can be divided into
several ODX files and stored in PDX files (ODX archives). Since a single ODX file does not contain
enough information for a diagnostic tester, Vector recommends using PDX (packed ODX) files instead
which contain all relevant single ODX files. The usage of PDX files is similar to the usage of CDD
files.
2.2.3 MDX – Multiplex Diagnostic Data Exchange
MDX files (Multiplex Diagnostic Exchange) is an OEM-specific format carrying diagnostic data as well.
The usage of MDX files is similar to the usage of ODX archive files.
2.2.4 Basic Diagnostic Description (UDS or KWP)
Basic Diagnostic Descriptions are created using CANoe/CANalyzer’s Basic Diagnostic Editor and
therefore can be customized by the user. They are stored as part of the CANoe/CANalyzer
configuration, can be exported and then imported into another CANoe/CANalyzer configuration.
Compared to the above Diagnostic Description formats, they only have limited functionality: since
Basic Diagnostic Descriptions do not contain a fault memory model and also no session model, the
Fault Memory and the Session Control Window is not available when using them. Variants, different
languages, target groups and security access using a Seed&Key DLL are also not available. However,
it is possible to describe simple diagnostic services (UDS & KWP) and afterwards send/receive the
defined requests/responses on CAN, LIN, FlexRay, K-Line and via DoIP using the Diagnostic
Console, CAPL, CAPL test modules/ test case libraries and test units. Additionally, CANoe/CANalyzer
Page 8

CANoe and CANalyzer as Diagnostic Tools
Copyright © 2020 - Vector Informatik GmbH 8
Contact Information: www.vector.com or +49-711-80 670-0
supports symbolic interpretation of the Basic Diagnostics services and their parameters in the Trace
window. Basic Diagnostic Descriptions can also be used as “additional descriptions”, see chapter 2.3.
For simple applications, Basic Diagnostics thus represents an extension to the process-oriented
approach with CANdela Diagnostic Descriptions.
In order to use Basic Diagnostics, you need to add a “Basic Diagnostic Description” (KWP or UDS) to
the CANoe/CANalyzer configuration using the “Diagnostics/ISO TP…” configuration dialog. While
measurement is stopped, you can define/modify the diagnostic services in the Basic Diagnostics
Editor and commit them to the Diagnostic Console. Saving the CANoe/CANalyzer configuration also
commits these changes.
On the same network, you are able to work with ECUs configured using Diagnostic Description files as
well as with multiple Basic Diagnostic Descriptions at the same time. The TP parameters of these
control units must be different though.
2.2.5 Standard Diagnostic Description
A Standard Diagnostic Description only contains services defined in the ISO standards “Unified
Diagnostic Services” (UDS, ISO 14229) or “Keyword Protocol 2000” (KWP2000, ISO 14230). It is
based on the CDD format, does not contain any OEM-specific services and cannot be customized.
Parameter values can only be chosen based on those defined in the respective standard.
UDS and KWP2000 are standard diagnostic protocols used by many OEMs. Please note that most
manufacturers use diagnostics specifications that differ from these standards!
Three “Generic CDDs” are provided. They describe diagnostics on the level of the standards. This has
the following advantages:
> All mechanisms implemented for concrete Diagnostic Descriptions can be applied for the
standard CDDs, though certain restrictions apply, e.g. the parameter definitions cannot be as
precise as for concrete Diagnostic Descriptions.
> It is possible to set the communication parameters in the configuration dialog, removing the
need to enter them in a database or code them into a CAPL program.
> The Diagnostic Console can be used to get fast access to ECUs.
> The interpretation of the transmitted data can also be parameterized with the Diagnostic
Description(s).
You can also look at the standard definitions by opening the generic CDDs [2] with the CANdelaStudio
Viewer application provided with CANoe/CANalyzer.
Note
The below mentioned features can only be used after including a Diagnostic Description
into the CANoe/CANalyzer configuration.
2.3 Additional Descriptions
Diagnostic Descriptions are sometimes provided by an OEM to his suppliers and the supplier either is
not allowed to or does not want to modify it since this file is the reference for testing. However,
especially during development, it is helpful to be able to use services which are not defined in the
original (“Master-“) Diagnostic Description.
For such cases, it is possible to add so-called “Additional Descriptions” to a “Master” Diagnostic
Description. Each “Additional Description” will take over the communication parameters from its
“Master” Description and provide a dedicated Diagnostic Console, in case of CDD, PDX or MDX
descriptions additionally a Fault Memory Window and Session Control Window. Based on the order
defined in the “Diagnostics/ISO TP” configuration dialog, the Diagnostic Observer will use the
Additional Descriptions to interpret diagnostic messages in the Trace Window, trying to apply the
descriptions in top-down order. The order can be changed in the “Diagnostics/ISO TP” configuration
Page 9
CANoe and CANalyzer as Diagnostic Tools
Copyright © 2020 - Vector Informatik GmbH 9
Contact Information: www.vector.com or +49-711-80 670-0
dialog via drag & drop. Also in CAPL programs, these Additional Descriptions can be used as
diagnostic targets.
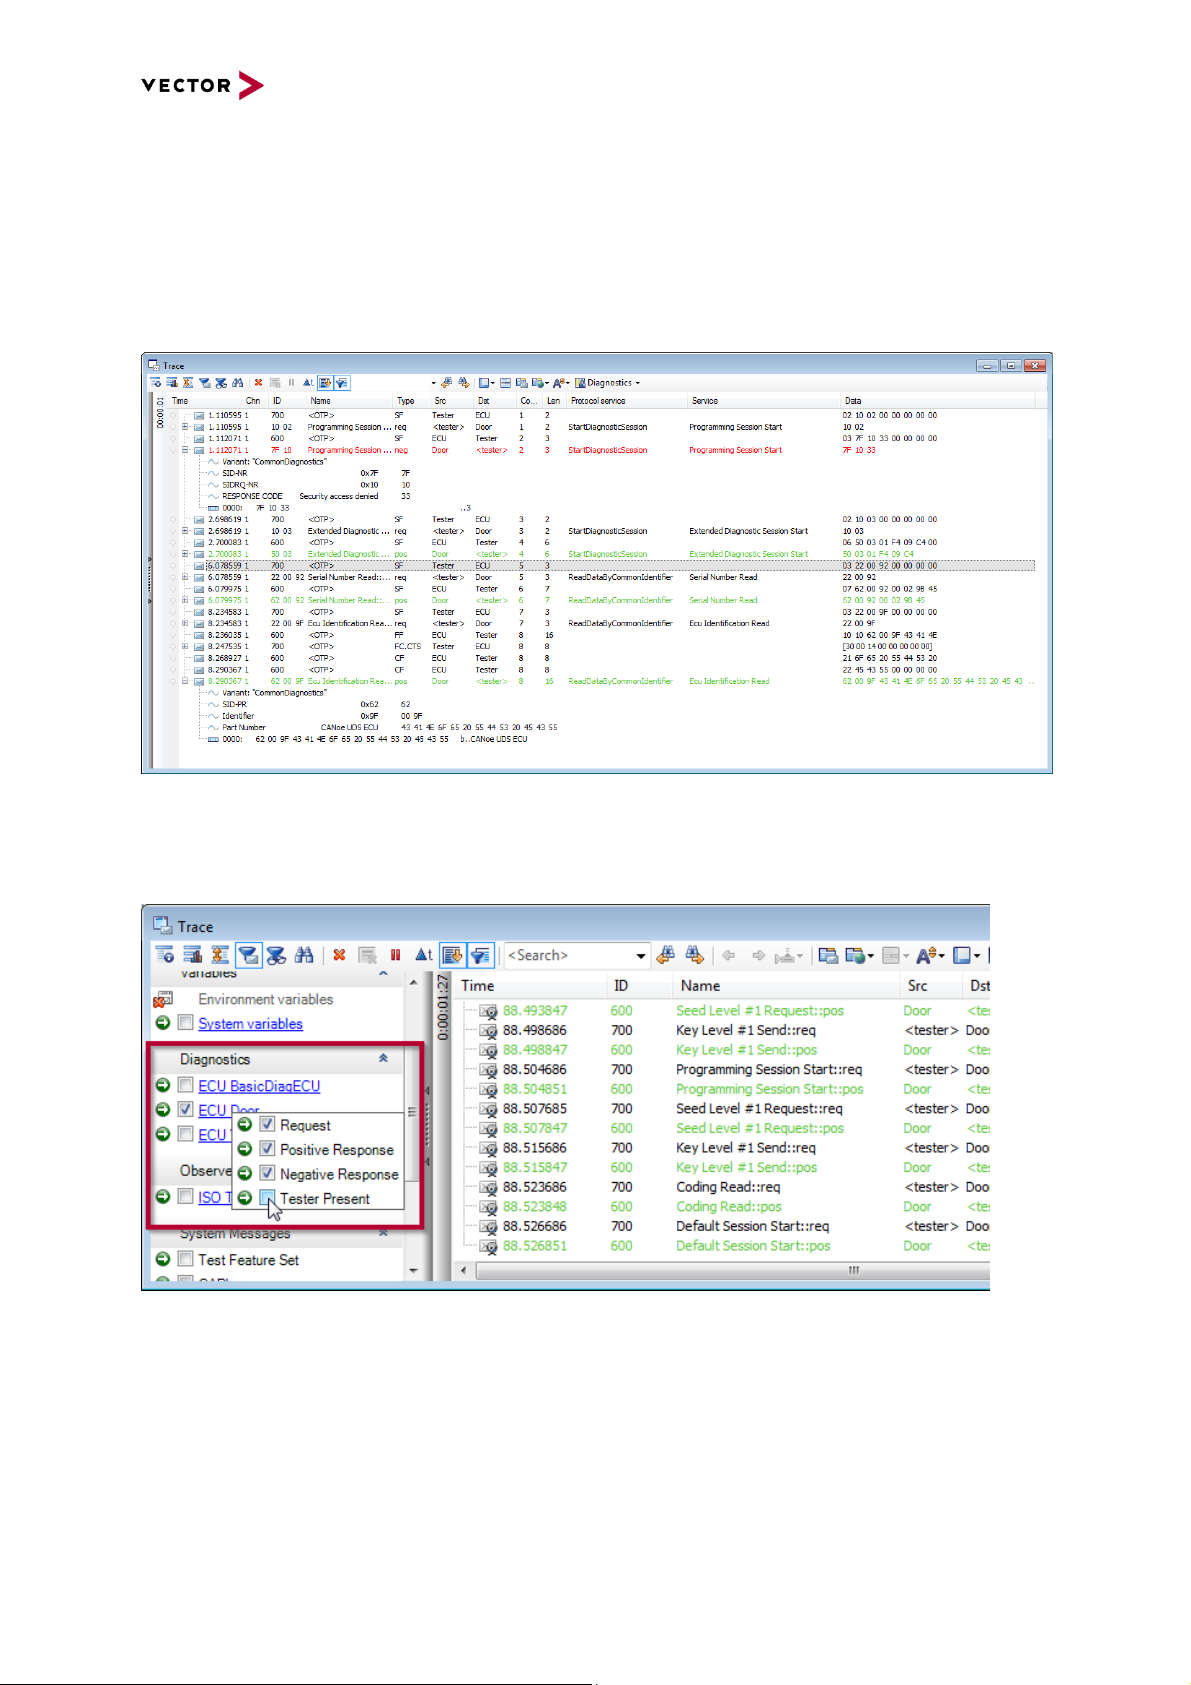
2.4 Trace window
A Diagnostic Description allows tracing diagnostic services (requests/responses) and their parameters
in a symbolic fashion. You can expand the requests/responses in the same way as with ordinary bus
messages:
Figure 2: Trace window
Using the predefined filters of the trace window, you can reduce the amount of displayed data to the
information you are interested in. You can easily e.g. filter out Tester Present messages to a specific
ECU by unchecking the corresponding filter setting:
Figure 3: Predefined filters for diagnostics
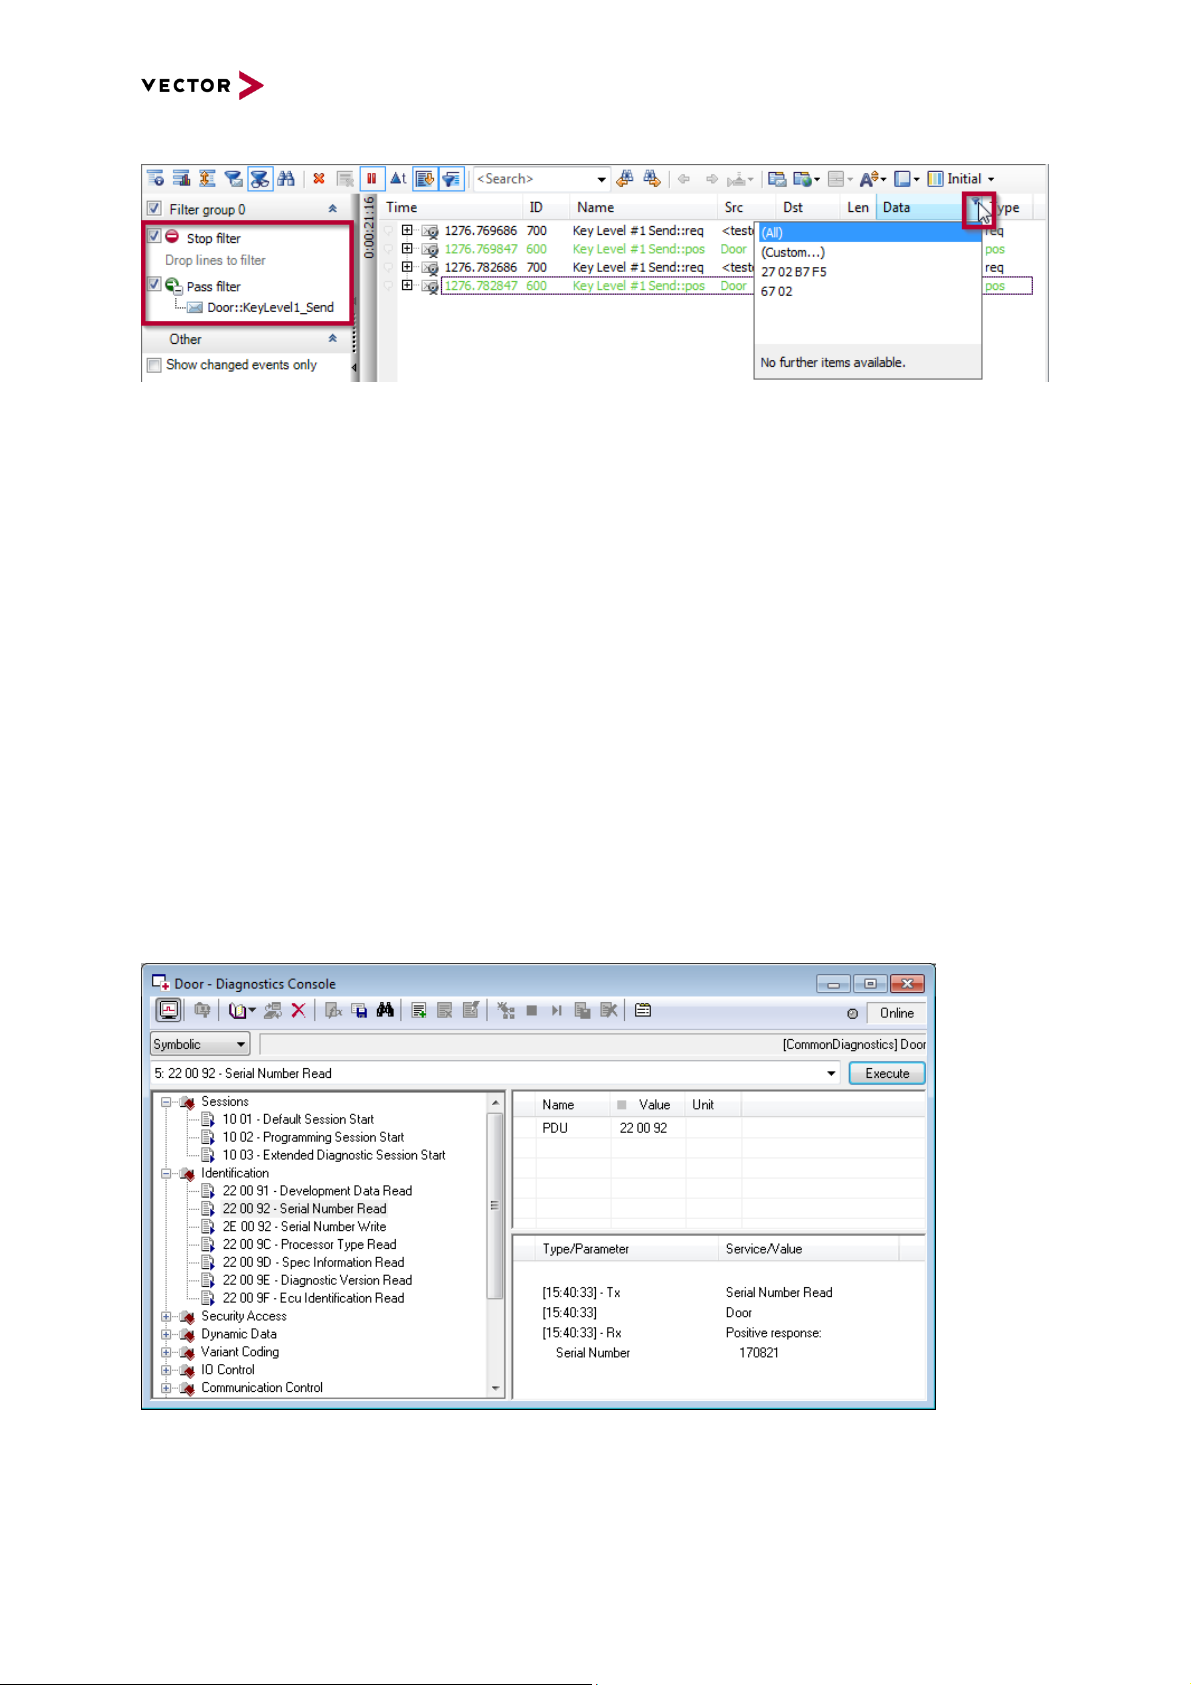
Using the analysis filters and column filters of the trace window, you can either filter out a specific
service (stop filter) or only keep a specific service visible in the trace (pass filter). To add such a filter,
just pause the trace and configure the service by drag & drop of a diagnostic observer event to the
filter on the left. By right-clicking on “Stop filter” or “Pass filter”, you can also add a service from the
Symbol Explorer (menu “Add condition… | Add Diagnostic Service…”). Right-clicking on an already
configured service, you can modify the filter conditions (menu “Edit condition…”) in order to filter only
requests or only responses. Additionally, you may use the column filters to show only specific patterns
in the trace:
Page 10
CANoe and CANalyzer as Diagnostic Tools
Copyright © 2020 - Vector Informatik GmbH 10
Contact Information: www.vector.com or +49-711-80 670-0
Figure 4: Using the column filters of the trace window
2.5 Diagnostic Feature Set
The Vector Diagnostic Feature Set includes several functions that are necessary for development, test
and application of ECUs with/via diagnostics.
Based on the Diagnostic Description, the Diagnostic Console provides interactive access to all
diagnostic services. Diagnostic requests can be selected, parameterised and displayed with their
dedicated response.
The Fault Memory Console provides quick and easy access to the fault memory of an ECU.
With the Session Control window, you can easily change the active session. In combination with a
configured Security DLL, restricted security levels can easily be accessed.
Finally, the OBD-II window allows you to perform On-Board Diagnostics (OBD) according to the SAE
J1979 standard.
Apart from CANoe/CANalyzer the Diagnostic Features Set is also included in the Vector products
CANape MC+D and CANdito. Thereby the complete development process is supported identically.
2.5.1 Interactive Diagnostic Console window
The Interactive Diagnostic Console fetches its information from the Diagnostic Description and
presents an easy way to select a diagnostic request, manipulate its parameters and to send the
request. The response received is presented together with its parameters.
Figure 5: Interactive Diagnostic Console window
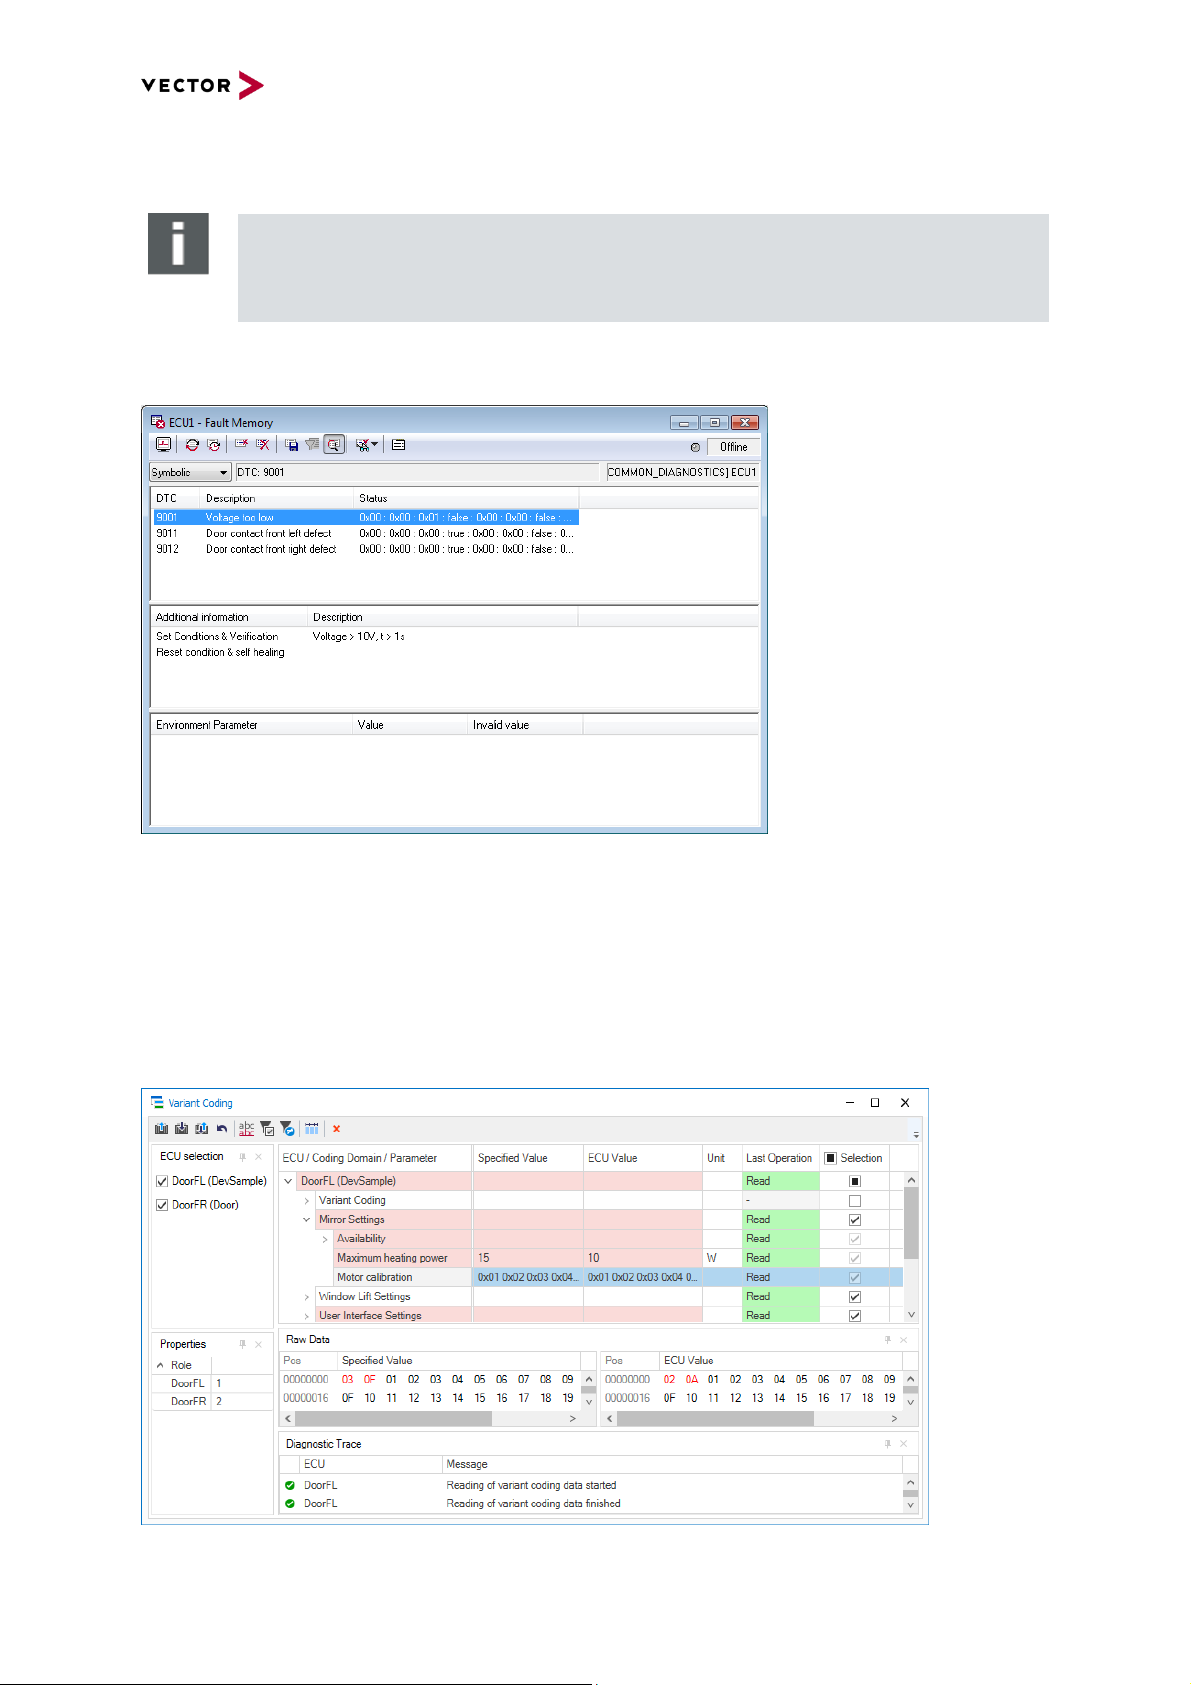
2.5.2 Fault Memory window
The Fault Memory window presents a possibility to read out the fault memory list of an ECU once or
cyclically.
Page 11
CANoe and CANalyzer as Diagnostic Tools
Copyright © 2020 - Vector Informatik GmbH 11
Contact Information: www.vector.com or +49-711-80 670-0
Note
Although with Standard Diagnostic Descriptions (“generic CDDs”) and Basic Diagnostic
Descriptions no Fault Memory Window is available, it is possible to access the fault
memory of an ECU via the Diagnostic Console and via CAPL.
Figure 6: Fault Memory window
2.5.3 Variant Coding Window
The Variant Coding Window is intended to read, write and compare Variant Coding data. Under the
hood, the window takes care about security aspects – i.e. depending on the configured security
source, the variant coding sequence itself is embedded in diagnostic communication sequences
performing e.g. authentication or further security mechanisms.
In order to be able to process variant coding data of an ECU, the corresponding diagnostic description
must be in CDD, ODX / PDX or MDX format and needs to contain variant coding services.
Figure 7: Variant Coding Window
Page 12
CANoe and CANalyzer as Diagnostic Tools
Copyright © 2020 - Vector Informatik GmbH 12
Contact Information: www.vector.com or +49-711-80 670-0
2.5.4 Diagnostic Session Control window
With the Diagnostic Session Control window, the user can easily switch between different session
states like Default, Extended, or Programming session.
In combination with a security DLL assigned to the corresponding Diagnostic Description (see chapter
2.8 for details), it is possible to switch the session state without having to care about the computation
and exchange of security keys. After switching the session state via the Diagnostic Session Control
window, the user can easily execute diagnostic services from the Diagnostic Console which are only
accessible within sessions protected by a certain security level.
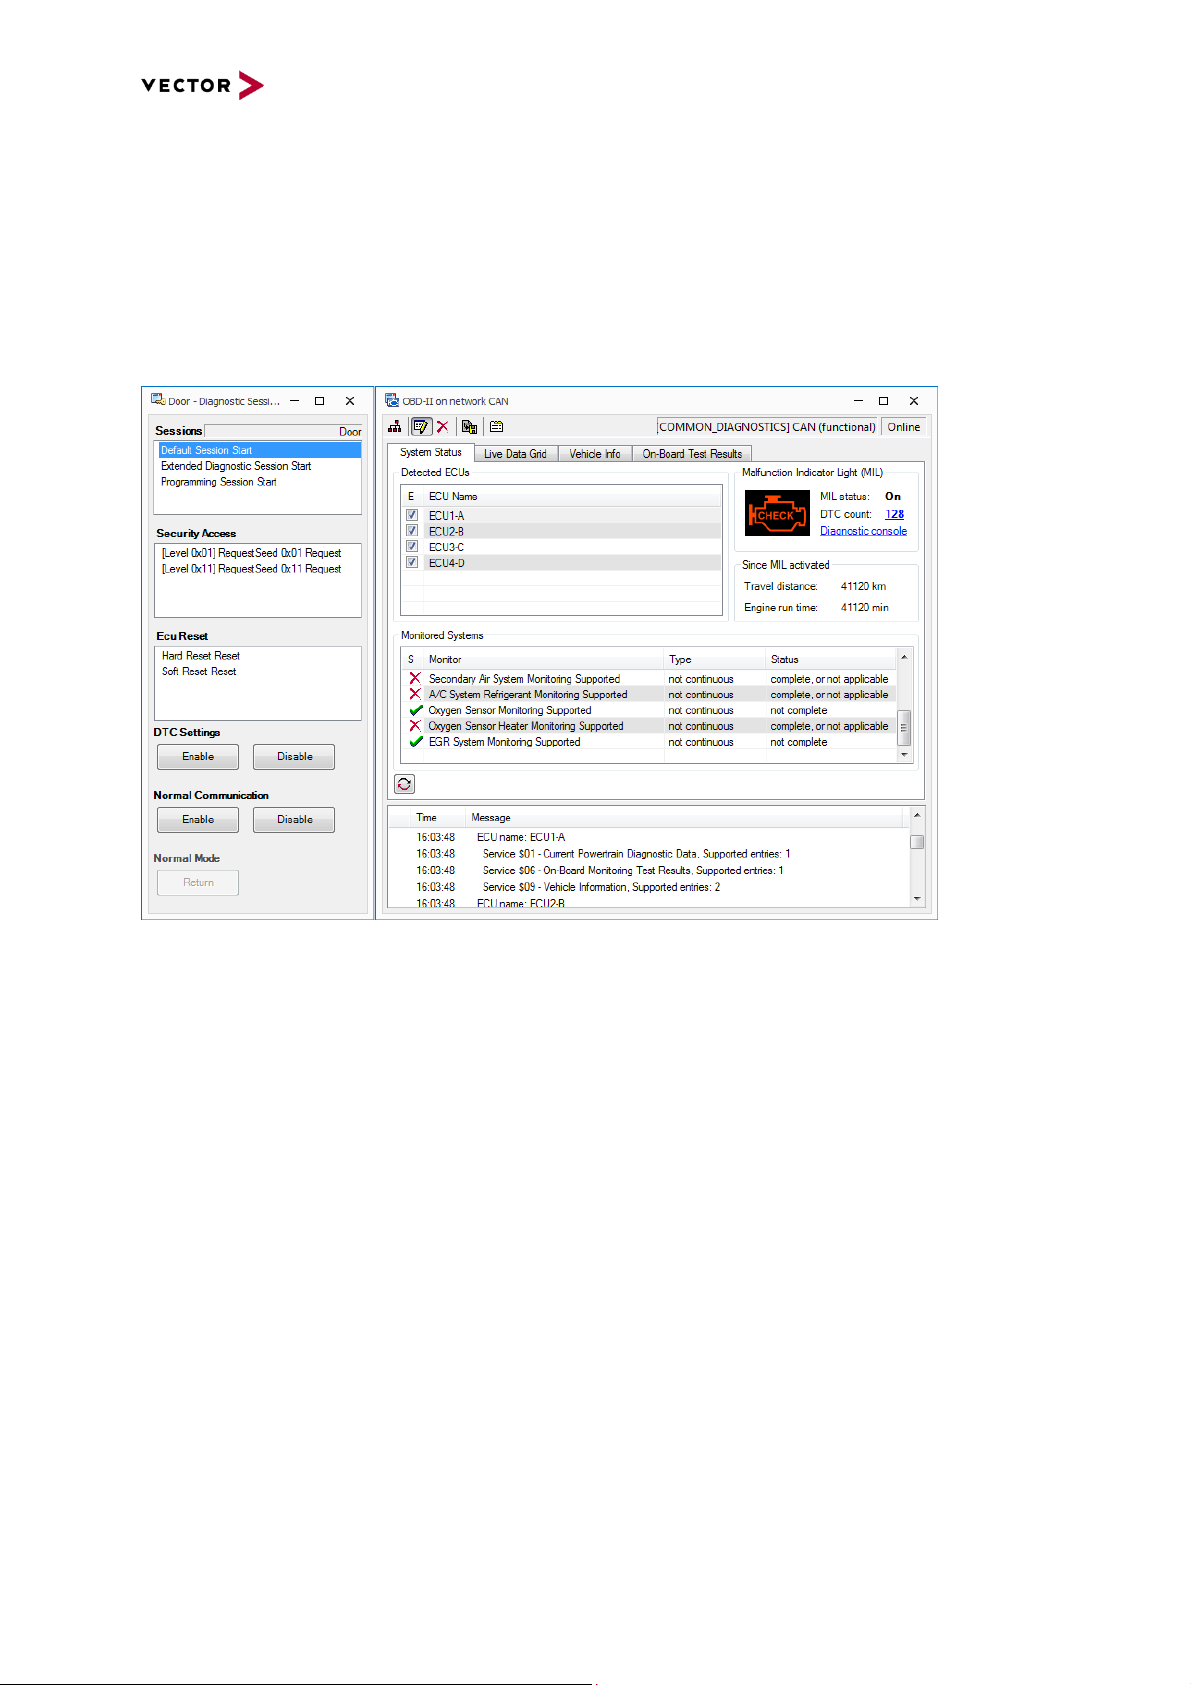
Figure 8: Diagnostic Session Control (left) and OBD-II window (right)
2.5.5 OBD-II window
On-Board Diagnostics, or OBD, in an automotive context, is a generic term referring to a vehicle's selfdiagnostic and reporting capability. OBD systems give the vehicle owner or a repair technician access
to state of health information for various vehicle sub-systems.
OBD implementations use a standardized fast digital communications port to provide real-time data in
addition to a standardized series of diagnostic trouble codes (DTCs), which allow to rapidly identify
and remedy malfunctions within the vehicle.
After configuring 11bit or 29bit Addressing in the “Diagnostics/ISO TP…” configuration dialog for a
network, the OBD-II window plus the corresponding Diagnostic Console and Fault Memory window will
open. Using the OBD-II window by, you can manually start a network scan, so that a request is sent to
all ECUs that will answer with the corresponding responses when they are supported. Based on the
responses the module calculates all available ECUs and the requests supported by them, updating the
corresponding pages “System Status”, “Live Data Grid”, “Vehicle Info” and “On-Board Test Results”.
Additionally, you can send requests using the corresponding Diagnostic Console window as well as
reading the OBD-II related fault memory using the Fault Memory Window for OBD-II.
2.5.6 ECU, gateway or tester simulations using CAPL
CAPL can be used to simulate an ECU, gateway or a diagnostic tester even if no real ECU, gateway
or tester is present. The diagnostics commands in CAPL enable access to the diagnostics services
and data using symbolic names that were defined in the Diagnostic Description. The simulation has to
react on the requests or responses from its counterpart (real or simulated by CANoe) that are received
and processed in appropriate event procedures. It is even possible to implement interactive tester
Page 13

CANoe and CANalyzer as Diagnostic Tools
Copyright © 2020 - Vector Informatik GmbH 13
Contact Information: www.vector.com or +49-711-80 670-0
applications where the user accesses the diagnostic functionality via a GUI (panel). Regarding
gateway simulations, there is a dedicated Application Note on that topic (see chapter 9.0).
Note
CANalyzer provides only limited simulation possibilities. However, for simple use cases, it
is possible to access the diagnostics services and data using symbolic names like in
CANoe and use them in CAPL code.
2.5.7 Test modules using CAPL (CANoe only)
In CANoe, it is possible to implement automated tests that run without user interaction and perform a
sequence of sending requests and processing of responses. The result of such a test can be written to
a report file (in XML/HTML format).
2.5.8 Test Units (CANoe only)
With the Vector application vTESTstudio, you can create tests on a very high level, using many
different ways of describing your tests (with Test Tables, in C++/C#/CAPL or even graphically). From
such a test description, you can generate so-called test units in vTESTstudio which can be executed
directly in CANoe. vTESTstudio offers several high-level commands for diagnostics, making it very
easy e.g. to check the contents of the fault memory of an ECU.
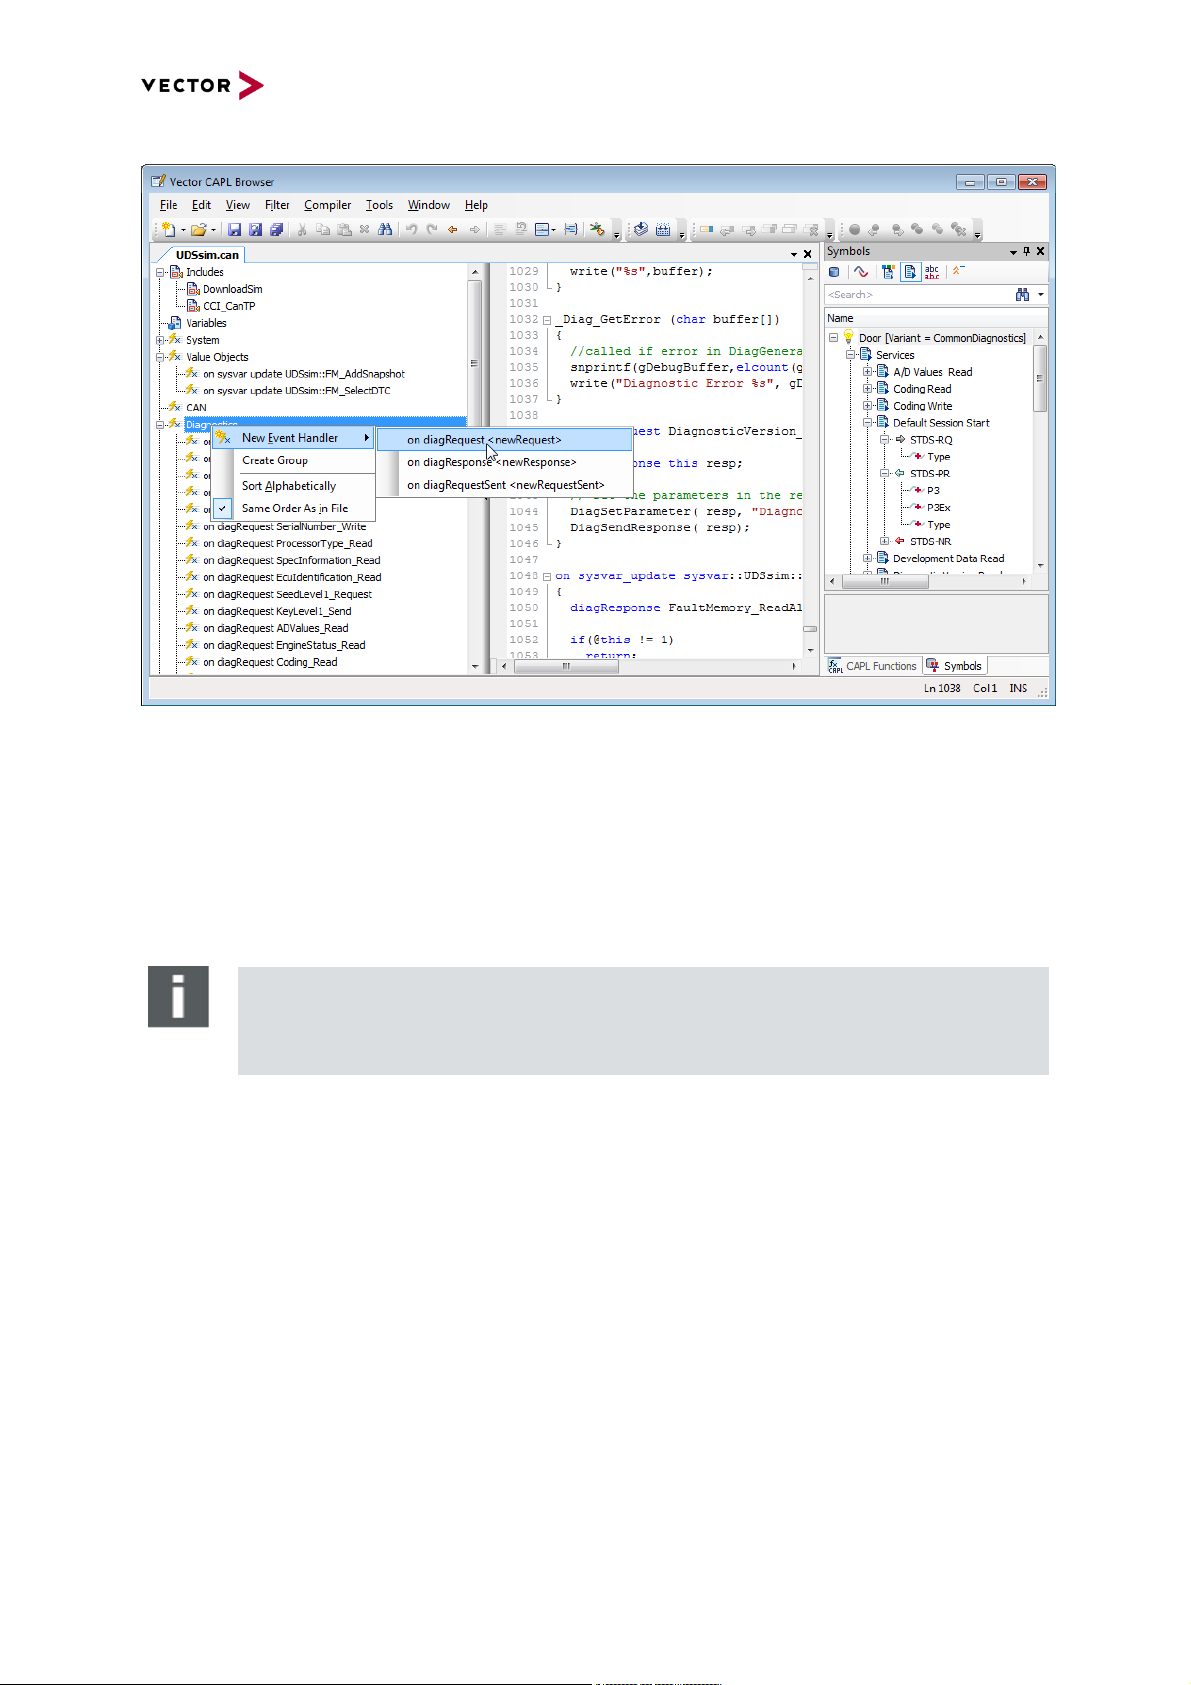
2.5.9 Symbol Explorer for diagnostics objects and parameters
In order to simplify the specification of diagnostics qualifiers for requests, responses and parameters,
these parameters and diagnostic objects - defined in Diagnostic Descriptions - can be inserted into
CAPL code via drag & drop from the Symbol Explorer into the CAPL browser. Simply drag the object
named with the diagnostics primitive, service, parameter or target qualifier and drop it at the current
cursor location into the CAPL program.
Figure 9: Autocomplete Input Assistance and symbolic selection of diagnostic objects and parameters in CAPL Browser
You can switch the display of diagnostic symbols between Diagnostic Classes and Diagnostic
Services. When the “Diagnostic Classes” is chosen, the Symbol Selector will additionally show the
class of a Service, its Primitives and Parameters. This is especially helpful, if an “on diagRequest”
or “on diagResponse” handler shall handle multiple Requests of the same Class:
Page 14

CANoe and CANalyzer as Diagnostic Tools
Copyright © 2020 - Vector Informatik GmbH 14
Contact Information: www.vector.com or +49-711-80 670-0
Example wildcard handler:
on diagRequest Door.EcuReset::*
{
// Handle all Requests dealing with ECUReset (Hard - and Soft-Reset)
}
Additionally, it is possible to switch the display between the names (ODX: “LONGNAME”) of the
diagnostic object and its qualifier (ODX: “SHORTNAME”). Note that if several variants exist in the
Diagnostic Description, the displayed content will depend on the variant chosen in the Symbol
Explorer. The dialog in Figure 9 is also used to select diagnostics parameters to be displayed in data
and graphics windows.
2.5.10 Autocomplete Input Assistance for diagnostics
When using the syntax with ECU Qualifier in DiagRequest/Response Objects (see chapter 4.1.1 for
details), it is possible to use Autocomplete Input Assistance to get some suggestions for valid
diagnostics identifiers. The Input Assistance can be opened automatically by entering text in the
source code or via the key combination <Ctrl>+<Space>.
2.5.11 Functional Group Requests
Selecting “Functional Group Requests” as the Diagnostic Tester usage of a Diagnostic Description,
the diagnostic requests for it will be sent using the transport protocol parameters for functional
requests so that all ECUs which react on this functional request will send responses. The responses
received from the ECUs will be processed individually in the tester, and the interpretation will be based
on the concrete Diagnostic Description for each ECU.
It is possible to open the Diagnostic Console and the fault memory window with a Diagnostic
Description configured for Functional Group Requests. The responses will be displayed in the
console’s trace window, while the DTCs reported will be listed in the fault memory window with their
originating ECU.
2.6 Access to diagnostics features via COM (CANoe only)
The COM server has an additional interface that allows external application written in VisualBasic,
VisualBasicScript etc. to access diagnostics features in CANoe. This allows the simple implementation
of special functionality, e.g. a manufacturer dependent process. More information can be found in the
Technical Reference on the COM interface included in the CANoe online help.
2.7 Basic Diagnostic Editor
Using the Basic Diagnostic Editor, you can describe simple diagnostic services (UDS & KWP) for
control units on CAN, LIN, FlexRay, Ethernet (DoIP/HSFZ) and K-Line.
After adding a Basic Diagnostic Description to the diagnostic configuration in the “Diagnostics/ISO
TP…” configuration dialog, the Basic Diagnostic Editor opens automatically for this Diagnostic
Description. You can then also open the editor in CANoe/CANalyzer via the Diagnostics & XCP ribbon
“Configuration | Basic Diagnostic”.
If you finished editing your Basic Diagnostic Description, you either need to press the “Commit” button
on the Basic Diagnostic Editor or save the CANoe/CANalyzer configuration in order to activate the
editing result e.g. for usage in the Diagnostic Console window.
While the measurement is in progress, editor functions for editing Basic Diagnostic Descriptions are
disabled.
2.8 Security Access handling
In order to execute locked diagnostic functions in the control unit (ECU), the tester requires a key to
unlock the ECU. The key is calculated from a seed which is received from the ECU in a diagnostic
response. The algorithm used to calculate the key can be implemented as a DLL (Security DLL).
Several CAPL functions encapsulate the concrete implementation of the key algorithm in the providerdependent Security DLL. The Security DLL must be configured in the “Diagnostics / ISO TP…”
configuration dialog (Path: <Network> | <Diagnostic Description> | Diagnostic Layer | Security Access
| Seed & Key DLL) for each diagnostics description that shall be used with those CAPL functions:
Page 15

CANoe and CANalyzer as Diagnostic Tools
Copyright © 2020 - Vector Informatik GmbH 15
Contact Information: www.vector.com or +49-711-80 670-0
Figure 10: Configuring the Security Access
For information on requirements on the Security DLL, the corresponding CAPL functions as well as on
usage in older versions, please consult the online help in CANoe/CANalyzer (search for “Seed & Key
DLL / Security Access”).
3.0 First steps
The diagnostic features in CANoe/CANalyzer may be used for either tracing diagnostic communication
on the bus or for acting as a diagnostic tester (via the Diagnostic Console or via CAPL). Furthermore
they provide capabilities for simulating the diagnostic services of an ECU in CANoe.
All these use cases demand that a Diagnostic Description (a diagnostic database) is used, and it may
be necessary to use a Transport Protocol DLL (e.g. osek_tp.dll) to transfer data.
3.1 Usage of Diagnostic Descriptions
3.1.1 Add a Diagnostic Description
Diagnostic Descriptions describe the diagnostic data (services and parameters), i.e. they are
diagnostic databases. Diagnostic Descriptions are added to the CANoe/CANalyzer configuration in the
“Diagnostics/ISO TP Configuration…” dialog.
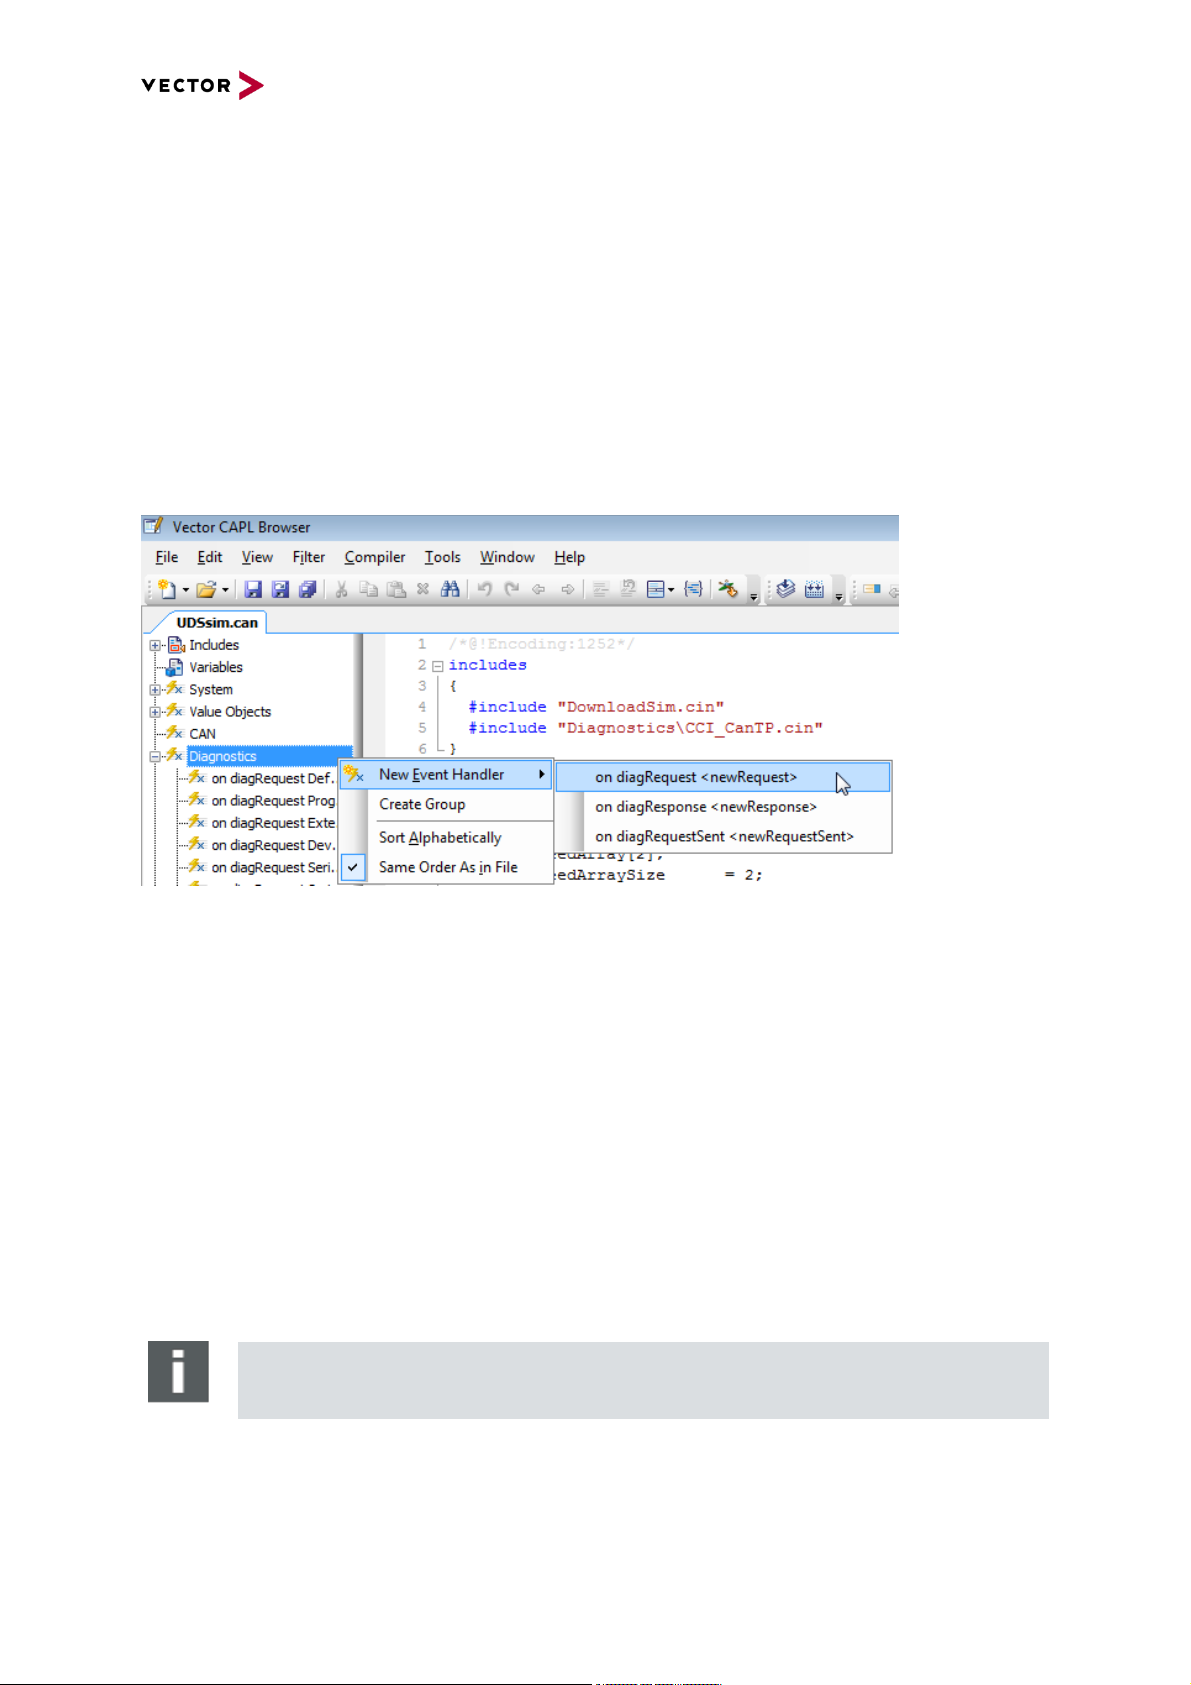
After adding a Diagnostic Description to the CANoe/CANalyzer configuration, there will be additional
event handlers in the CAPL Browser: on diagRequest, on diagResponse and on diagRequestSent:
Page 16
CANoe and CANalyzer as Diagnostic Tools
Copyright © 2020 - Vector Informatik GmbH 16
Contact Information: www.vector.com or +49-711-80 670-0
Figure 11: Adding an "on diagRequest" handler
If CANoe/CANalyzer is connected to a real vehicle with ongoing diagnostic communication it will now
be possible to have symbolic interpretation in the trace window.
When a Diagnostic Description is added to the CANoe/CANalyzer configuration, the Diagnostic
Console, Fault Memory and Session Control windows will appear (they can also be accessed via the
View menu). This makes it possible to select a service in the Diagnostic Console, send the request,
receive the response, and inspect certain parameters.
Note
For Basic Diagnostic Descriptions and Standard Diagnostic Descriptions, no Session
Control Window and no Fault Memory window is available since those Diagnostic
Descriptions do not contain a fault memory model and also no session model.
3.1.2 Configure the Diagnostic Description
After adding a Diagnostic Description to a network in the “Diagnostics/ISO TP” configuration dialog
and selecting the Diagnostic Description or one of its sub-components (e.g. Transport Layer,
Diagnostic layer), you can change the settings for this particular Diagnostic Description.
At first, especially for Basic and Standard Diagnostic Descriptions, you may change the ECU qualifier
of the Diagnostic Description. The ECU qualifier is used as a unique identifier in order to reference this
Diagnostic Description e.g. in a CAPL test module.
Second, you need to choose the “Interface” for this Diagnostic Description. Such a diagnostic interface
contains the communication parameters for a specific network. There may be even more than one
appropriate diagnostic interface for a specific network type defined in a diagnostic description (e.g. for
the network type CAN: “Normal 11bit” and “Extended 29bit free” addressing). On the other hand, an
appropriate diagnostic interface for the chosen network type might be missing in your diagnostic
description. In such a case, CANoe/CANalyzer will generate appropriate default interfaces for this
diagnostic description, indicated by the prefix “{generated}”. For such a generated interface, you need
to define important communication parameters like timeout values or transport protocol parameters in
the “Diagnostics/ISO TP” configuration dialog manually by you own.
Page 17

CANoe and CANalyzer as Diagnostic Tools
Copyright © 2020 - Vector Informatik GmbH 17
Contact Information: www.vector.com or +49-711-80 670-0
For Standard Diagnostic Descriptions or file based Diagnostic Descriptions like CDD, ODX/PDX or
MDX, there are additional settings:
> “Variant” can be modified if the Diagnostic Description contains several different variants and
determines the default variant to be used for interpretation in the trace. CANoe distinguishes
between the “default” variant and the “active” variant. The “active” variant can be dynamically
changed during an active measurement while the “default” variant becomes active at
measurement start. This setting will determine the set of services you see in the Diagnostic
Console, e.g. if the “Common” variant is chosen, the user might not find services that are only
present for other variants.
> “Language” determines the language used for interpretation of the diagnostic services,
provided that the Diagnostic Description contains such information.
> “Target group” additionally restricts the set of services which can be accessed by the user to
those services intended for a specific user group, based on the definition in the Diagnostic
Description. If it is set to “(Display all services)”, there is no limitation.
> “Usage” defines how the diagnostic description is intended to be used. By default, the
Diagnostic Description is used for interpretation in the trace. If you select “Diagnostics Tester”,
you can additionally choose how the requests should be sent by the tester (to a single ECU
via physical addressing or as Functional Group Requests; the latter possibility requires that all
ECUs on the network implement the contents of the Diagnostic Description as a common
subset). Selecting “Simulation by:” (only available for CANoe) will let you choose the node
implementing the simulation code for this Diagnostic Description and enable the simplified
simulation for it, i.e. CANoe will send positive responses for requests defined in this Diagnostic
Description, as long as there are no “on diagRequest” handlers in this node covering those
requests.
Selecting an interface here will determine which TP parameters are available for configuration:
> The “Interface” combo box shows the interfaces defined in the Diagnostic Description. Each
interface defines an addressing mode and address parameters that are used as default. Note
that the addressing mode of an interface cannot be changed – chose a different interface
instead.
> If the “VAG Addons packet“ (version 1.10 or later) is installed, it is possible to select the
interface called "VWTP 2.0 (CANoe)". You then have to enter the correct TP parameters on
the page “Transport Layer (VW TP 2.0)”.
> If the Diagnostic description was added to an Eth network, the corresponding parameters can
be defined on the page “DoIP/HSFZ Settings” or “Socket Adaptor Settings”, depending on the
chosen diagnostic interface (DoIP or AUTOSAR Socket Adaptor).
> If a node from a LIN database file is selected, the corresponding parameters can be defined
on the page “LIN settings”.
> If a node from a FlexRay database is selected, the FlexRay TP parameters can be defined in
the page “FrTP Parameter”.
> Since for MOST ECUs, only interpretation of the diagnosis messages is possible, there are no
dedicated MOST TP parameters for MOST nodes.
For further details of the configuration dialog please refer to the online help.
3.2 Usage of Diagnostic Console, Session Control and Fault Memory window
When you add a Diagnostic Description to your CANoe/CANalyzer configuration and choose “OK”, the
available Diagnostic Windows for that Diagnostic Description will automatically become visible.
Note
For Basic Diagnostic Descriptions and Standard Diagnostic Descriptions, no Session
Control Window and no Fault Memory window is available since those Diagnostic
Descriptions do not contain a fault memory model and also no session model.
Page 18

CANoe and CANalyzer as Diagnostic Tools
Copyright © 2020 - Vector Informatik GmbH 18
Contact Information: www.vector.com or +49-711-80 670-0
3.2.1 Send a diagnostic request and receive a response
You can easily send a request by selecting it in the Diagnostic Console “Explorer-like” tree structure.
The parameters in the request can also be selected in an easy manner by choosing a value in a dropdown menu or writing a value (e.g. a part number of an ECU). The response will be presented
accordingly in this window.
If you do not have a real ECU with implemented diagnostics, you may create a simulated node in
CANoe and implement relevant functionality in CAPL (please see paragraph 4.2).
3.2.2 Read fault memory
With the Fault Memory Window you can easily read out the fault memory of an ECU. Depending on
the Diagnostic Description, a KWP2000 standard request ($18 02) or a UDS request ($19 02) is used
to read out the trouble codes. Additionally, the services specified in the Diagnostic Description can be
used if the manufacturer scheme can be recognized by CANoe/CANalyzer (via the qualifier paths). It
is also possible to specify the requests explicitly.
3.2.3 Functional Group Requests
If you configure “Functional Group Requests” as the tester usage of a Diagnostic Description, it is
possible to send a functional request (“broadcast”) to all ECUs defined on a network with the
corresponding diagnostics channel, e.g. using the Diagnostic Console and the Fault Memory Window.
For proper handling of the responses from the corresponding ECUs (e.g. the display of the responses
in the FGR diagnostic console and the correct handling in CAPL), you need to add a diagnostic
description for the respective ECU(s) which defines both the same FGR address as the FGR
diagnostic description and additionally the ECU’s addresses for “normal”, i.e. physical diagnostic
requests.
3.2.4 Change the session and security level
With the Session Control window, both switching the session and the security level is possible. In
order to be able to use this functionality, you need a diagnostic description which contains the
available sessions and the allowed transitions between them (the “session model”). For switching the
security level, you additionally need to add a Security DLL (sometimes referred to as “Seed & Key
DLL”) to the diagnostics configuration (see chapter 2.8 for details). To change the session or the
security level, simply double-click on the session or security level in the Session Control window. In
case of switching the security level, CANoe/CANalyzer will request the Seed from the ECU, use the
configured Security DLL to compute the key and send the key to the ECU in order to unlock it.
3.3 Display diagnostic data
An important use case is to display data contained in diagnostic requests or responses, e.g. the value
of an ECU’s voltage signal. As a precondition to display this data, the request or response with this
signal value must be received by CANoe/CANalyzer (or generated in case of a CANoe simulation). In
case of a response parameter, this typically implies that the corresponding diagnostic request has to
be sent cyclically. This can be done creating a user-defined message with a specified cycle time in the
Diagnostic Console Window or by using a timer in CAPL. The following example defines a timer which
sends the diagnostic request “DID_Voltage_Read” to the ECU “Door”.
Example cyclic diagnostic request:
Variables
{
mstimer tVoltageRead;
}
on start
{
setTimerCyclic(tVoltageRead, 500);
}
on timer tVoltageRead
{
diagRequest Door.DID_Voltage_Read req;
diagSendRequest(req);
}
Page 19
CANoe and CANalyzer as Diagnostic Tools
Copyright © 2020 - Vector Informatik GmbH 19
Contact Information: www.vector.com or +49-711-80 670-0
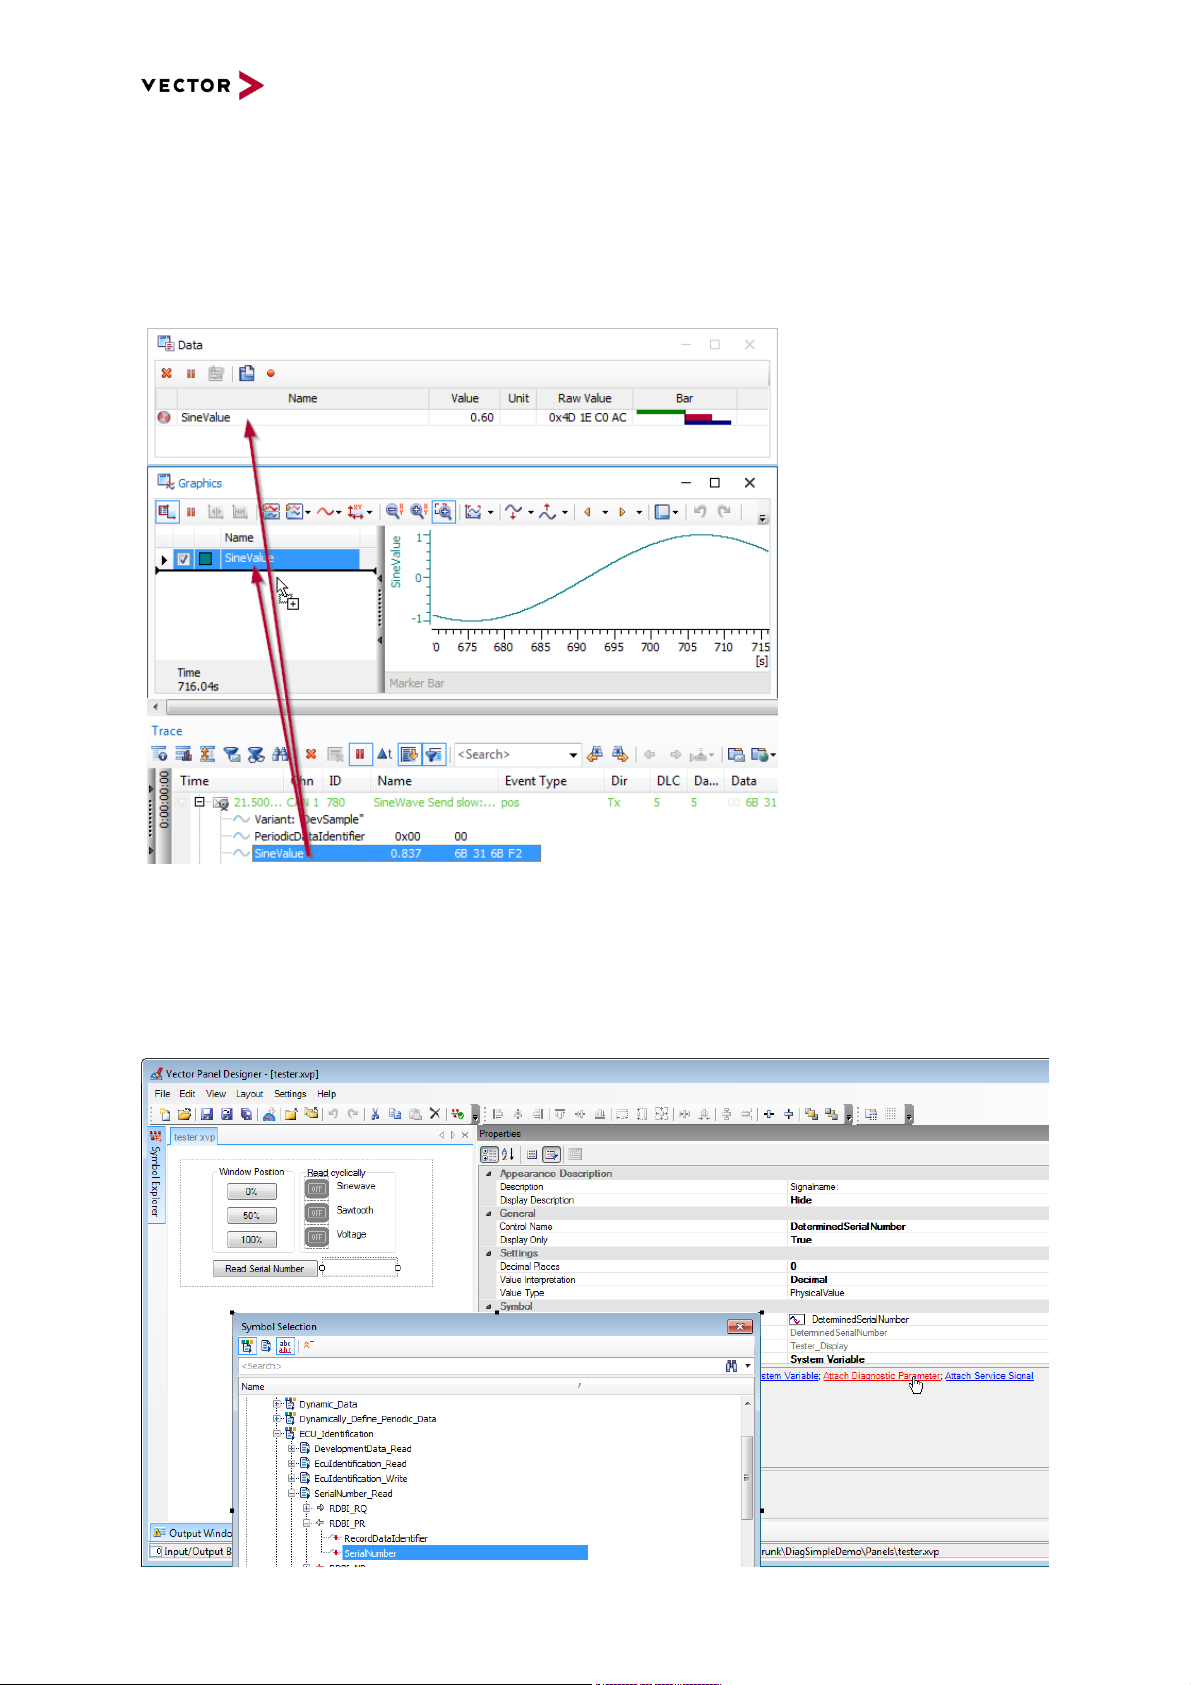
3.3.1 Diagnostic data in State Tracker, Data and Graphics window
Once the diagnostic requests or responses with the parameters to be displayed are recognized and
displayed in the Trace Window, you can add these diagnostic parameters to be displayed in the Data
or Graphics Window by Drag & Drop. The same procedure can be used to display diagnostic
parameters in the State Tracker Window. In Data and Graphics Window, you alternatively can add the
parameters using the Context Menu (right-click and select “Add Diagnostics Parameters…”).
Figure 12: Choosing diagnostic parameters for display in data and graphic window using drag & drop
3.3.2 Diagnostic data in panels
In order to display parameters in a panel, you first need to add an appropriate control to the panel, e.g.
an input/output box. Next, you need to attach a diagnostic parameter to this control by clicking on
“Attach Diagnostic Parameter” in the Panel Editor and selecting the parameter using the symbol
selector:
Page 20
CANoe and CANalyzer as Diagnostic Tools
Copyright © 2020 - Vector Informatik GmbH 20
Contact Information: www.vector.com or +49-711-80 670-0
Figure 13: Attaching a diagnostic parameter to a panel control
Depending on the desired data format and the used control, it might be necessary to convert the
diagnostic parameter value into a system variable in a “on diagResponse” CAPL handler and attach
this system variable to the control instead.
4.0 Using CAPL for Diagnostics
4.1 Common techniques for Simulation and Tester
4.1.1 Usage of the CAPL Browser
Three additional event handlers are present after adding a Diagnostic Description to the
CANoe/CANalyzer configuration: “on diagRequest”, “on diagResponse” and “on diagRequestSent”,
see Figure 14.
Figure 14: Diagnostics Event Handlers
The actual request and response objects as well as their event handlers are accessed through their
service qualifier as described in the Diagnostic Description. There are two alternative ways to declare
diagnostic objects and event handlers, the deprecated syntax and the syntax with ECU Qualifier in
DiagRequest/Response Objects (“new syntax”).
Example (deprecated syntax):
// Request object
diagRequest StartSession request;
Example (new syntax):
diagRequest Door.StartSession request;
Both code snippets initialize the object/variable “request” using the service qualifier “StartSession” as
a request to start the default diagnostic session. Using the deprecated syntax, you need to make sure
to call diagSetTarget(“Door”); or diagInitEcuSimulation(“Door”); before using this object (see chapter
4.3.1). On the other hand, these functions will have no effect on objects declared using the new
syntax.
Note
Mixing both, the deprecated and the new syntax is not recommended by Vector.
Page 21

CANoe and CANalyzer as Diagnostic Tools
Copyright © 2020 - Vector Informatik GmbH 21
Contact Information: www.vector.com or +49-711-80 670-0
Note
In older CANoe/CANalyzer versions, requests and responses were accessed via their
qualifier paths with the syntax <class>::< instance>::<service> which is still working as
well. However, this kind of definition is no longer recommended by Vector.
4.1.2 Work with parameters
The parameters of a diagnostic request or response can be accessed (read and written) symbolically
as they are described in the Diagnostic Description.
Diagnostic parameters are divided into two groups; simple and complex parameters. The two groups
have corresponding Set- and Get- functions. Simple parameters are parameters that have fixed
offsets in the diagnostic object. Complex parameters are parameters that have varying offsets since
they are contained within container parameters, e.g. a list of DTCs (Diagnostic Trouble Codes).
There are three different access modes to access a parameter – by default “physical” is used. The
column “Example” in the following table contains the values returned by DiagGetParameter() for a
parameter which is defined as 4 byte linear data type with IEEE Float (single) encoding and the
conversion formula “phys = 1 / 100 * data”:
Access
mode
Explanation
Example
numerical
Access to the transmitted numerical value.
100.0
physical
Access to the value calculated from the transmitted
numerical value (is also displayed symbolical as text).
1.0
coded
Immediate transformation into a numeric type (up to 32
bit), i.e. floating point values will also be provided in their
internal description (bit form).
1120403456.0
(= 0x42C80000)
Below is an example of a simple parameter that has the name (ODX: “longname”)
“Voltage Terminal 15” (note the blank characters!) in the Diagnostic Description. Since the names are
language dependent, the qualifier (ODX: “shortname”) has to be used (accessible via the symbol
explorer, see chapter 2.5.9) in CAPL, i.e. "Voltage_Terminal_15".
Example simple parameter:
on diagRequest ECU.InputOutput_Read
{
const cNumerical=0;
diagResponse this resp;
// Set simple parameters in response to 0
DiagSetParameter ( resp, "Voltage_Terminal_15", 0 ); // Default: set physical value
DiagSetParameter ( resp, cNumerical, "Interior_Temperature", 0 ); // set numerical value
DiagSendResponse ( resp );
}
Below is an example on how to work with a complex parameter, e.g. a list of DTCs. The DTCs
together with their status masks are grouped in a list called “List of DTC” in the Diagnostic Description.
First of all, some memory has to be reserved for the DTCs. The response object is created with an
iteration counter of 0, i.e. indicating that no DTCs will follow. As a first step, the response object has to
be enlarged, i.e. the iteration counter has to be set to the number of DTCs that should be returned.
Since CANoe/CANalyzer 5.2 this will automatically reserve the requested space, i.e. it is not
necessary to resize the object.
Note that sometimes no iteration counter is specified. In these cases the number of DTCs to follow
would be determined by the actual length of the response; here the total length in bytes has to be
specified for the resize operation.
After enough memory is available, the DTCs can be initialized step by step, i.e. the ECU simulation
sets the parameter for the DTCs it wants to report to the tester.
Example complex parameter:
Page 22

CANoe and CANalyzer as Diagnostic Tools
Copyright © 2020 - Vector Informatik GmbH 22
Contact Information: www.vector.com or +49-711-80 670-0
on diagRequest Door.FaultMemory_ReadAllIdentified
{
diagResponse this resp;
// Set the number of DTCs returned
DiagSetParameter( resp, “NUMBER_OF_DTC”, 2);
// Create memory to hold the DTCs
DiagResize( resp); // Note: NOT necessary anymore since CANoe/CANalyzer 5.2!
// Set complex parameters in response
// Set the first DTC to a hex value
DiagSetComplexParameter ( resp, "List_of_DTC", 0, "DTC", 0xFAFAF );
// Set the status mask of the DTC to true
DiagSetComplexParameter ( resp, "List_of_DTC", 0, "DtcStatusDataType.ConfirmedDTC", 1 );
// Set next DTC
DiagSetComplexParameter ( resp, "List_of_DTC", 1, "DTC", 0xCFCFC );
DiagSetComplexParameter ( resp, "List_of_DTC", 1, "DtcStatusDataType.ConfirmedDTC", 1 );
…
DiagSendResponse ( resp );
}
The following example shows how to set the size of the response if the actual Diagnostic Description
does not contain the parameter “NUMBER_OF_DTC”. In CANoe/CANalyzer versions older than 8.5,
you need to count the amount of needed data bytes this case and fill in this value directly.
Example 2 complex parameter:
on diagRequest Door.FaultMemory_ReadAllIdentified
{
diagResponse this resp;
// Set the number of DTCs returned
DiagResize( resp, 9); // NOT necessary anymore since CANoe/CANalyzer 8.5!
// in this example 9 bytes are needed to transfer the response
DiagSetComplexParameter ( resp, "List_of_DTC", 0, "DTC", 0xFAFAF );
…
}
4.2 ECU diagnostics simulation
4.2.1 Necessary preparations
Note
This chapter only applies to CANoe.
Note
Since CANoe 10.0, including certain callback functions (referenced as the CAPL Callback
Interface, CCI) is no longer necessary to simulate an ECU or a Diagnostic Tester in
CAPL. However, if your configuration needs to run on older CANoe versions, you need to
execute tests including fault injection on TP level, or you need to deal with more complex
ECU simulations like e.g. diagnostics gateways between different networks, using the CCI
still is necessary. Refer to the application note AN-IND-1-012 for details.
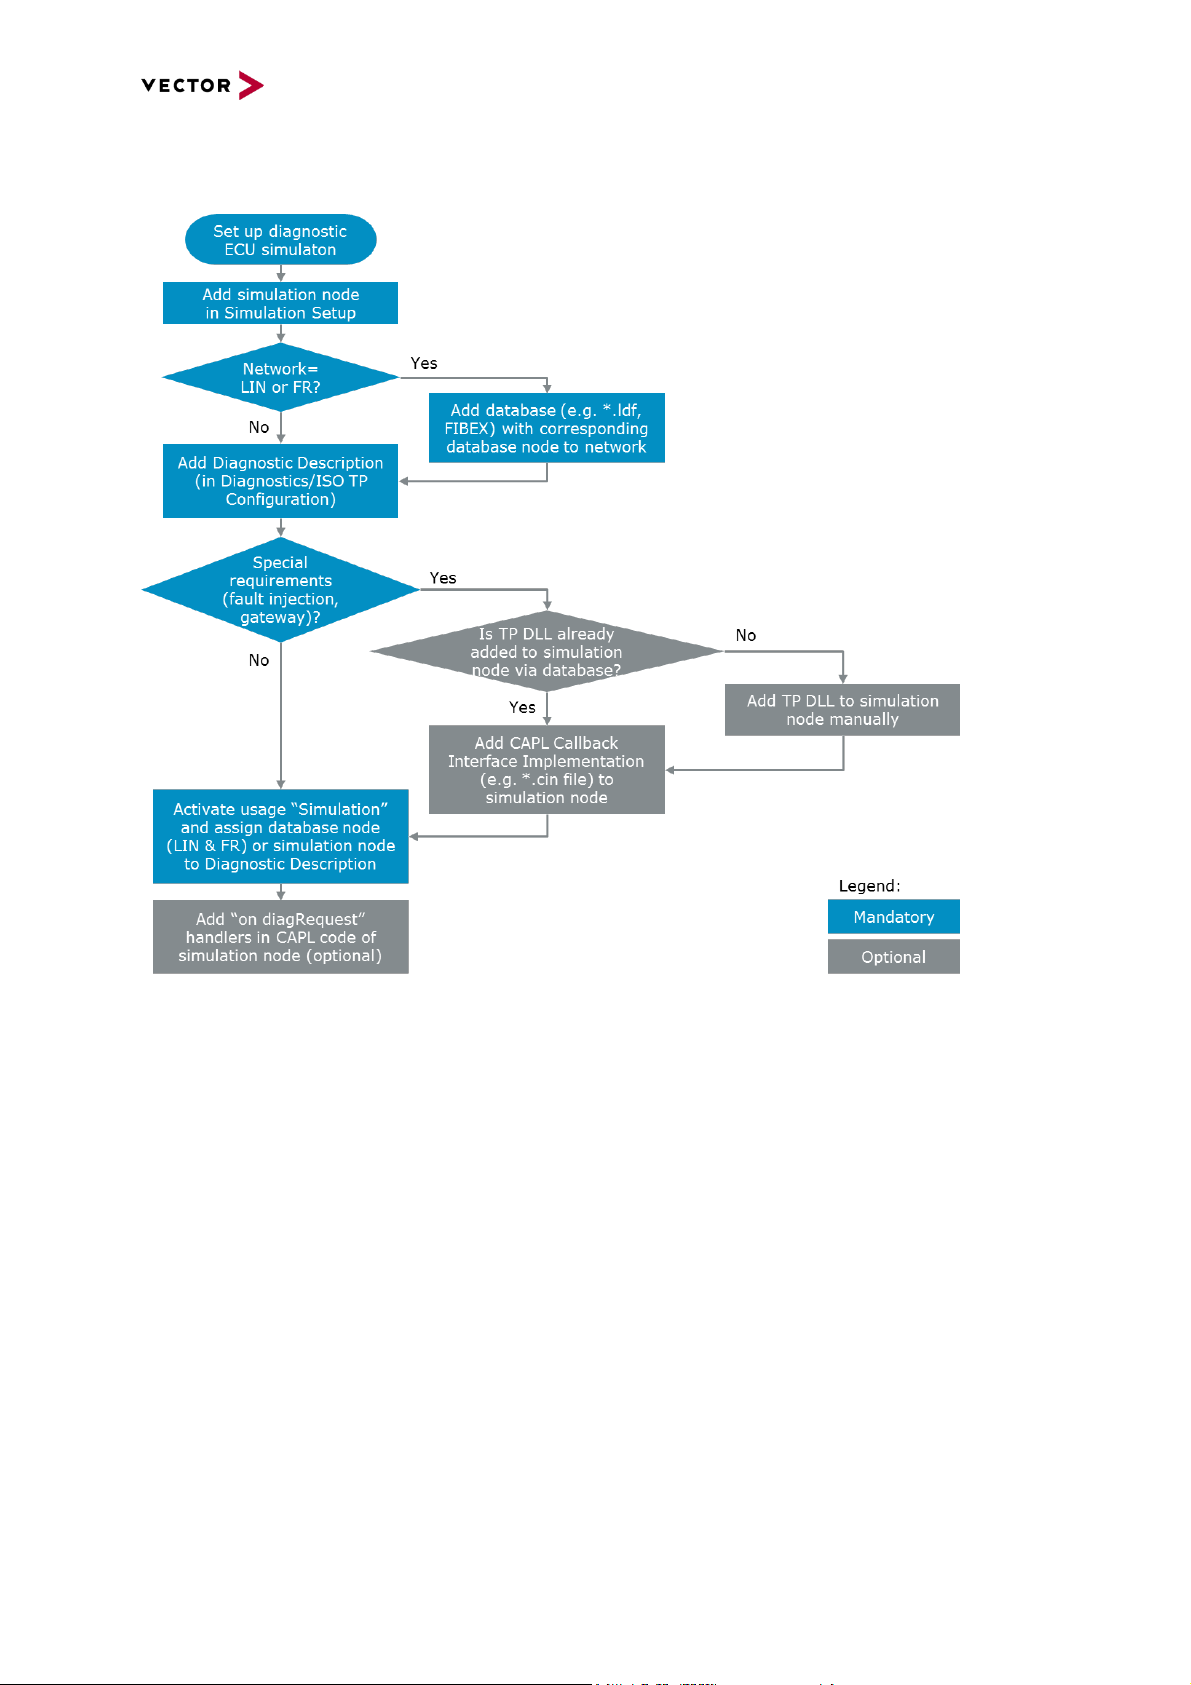
Before you start, it makes sense to analyze the requirements regarding the diagnostics functionality of
the simulated node.
For LIN and FlexRay ECUs, adding a database (*.ldf, FIBEX) is mandatory. After adding a diagnostics
description, for simple diagnostic simulations it is sufficient to activate the usage “Simulation” for this
Diagnostic Description and assign – in case of LIN and FlexRay – the database node of the ECU to it
or – in case of the other networks – the simulation node.
If the requirements regarding the simulated functionality are more complex, e.g. if you want to perform
fault injection or need to simulate gateway functionality, a CAPL Callback Interface (CCI)
implementation is necessary. In case of simple ECU node, the reference implementation provided with
CANoe might be sufficient, but for even more complex use cases, e.g. the implementation of a
gateway, you need to customize this CCI to your needs. If you are using a CCI implementation, you
need to make sure that the corresponding transport protocol nodelayer DLL (TP DLL) is configured as
Page 23
CANoe and CANalyzer as Diagnostic Tools
Copyright © 2020 - Vector Informatik GmbH 23
Contact Information: www.vector.com or +49-711-80 670-0
component to your simulation node. This already might have happened automatically by adding the
database, otherwise you need to add it manually. The following picture illustrates the workflow.
Figure 15: Workflow when setting up a diagnostics ECU simulation
4.2.2 Add a Network Node to the Simulation Setup
As a first step, you need to add a Network Node to the Simulation Setup. In order to do this, right-click
on the bus line in the Simulation Setup window and choose the context menu “Insert Network Node”.
4.2.3 Add a database in case of LIN and FlexRay
For LIN and FlexRay, a database (e.g. *.ldf or FIBEX) containing the corresponding Network Node
must be available for the respective network. Without this network node, it is not possible to add a
Diagnostic Description to a LIN or FlexRay network. If necessary, you may add it using the CANdb++
editor.
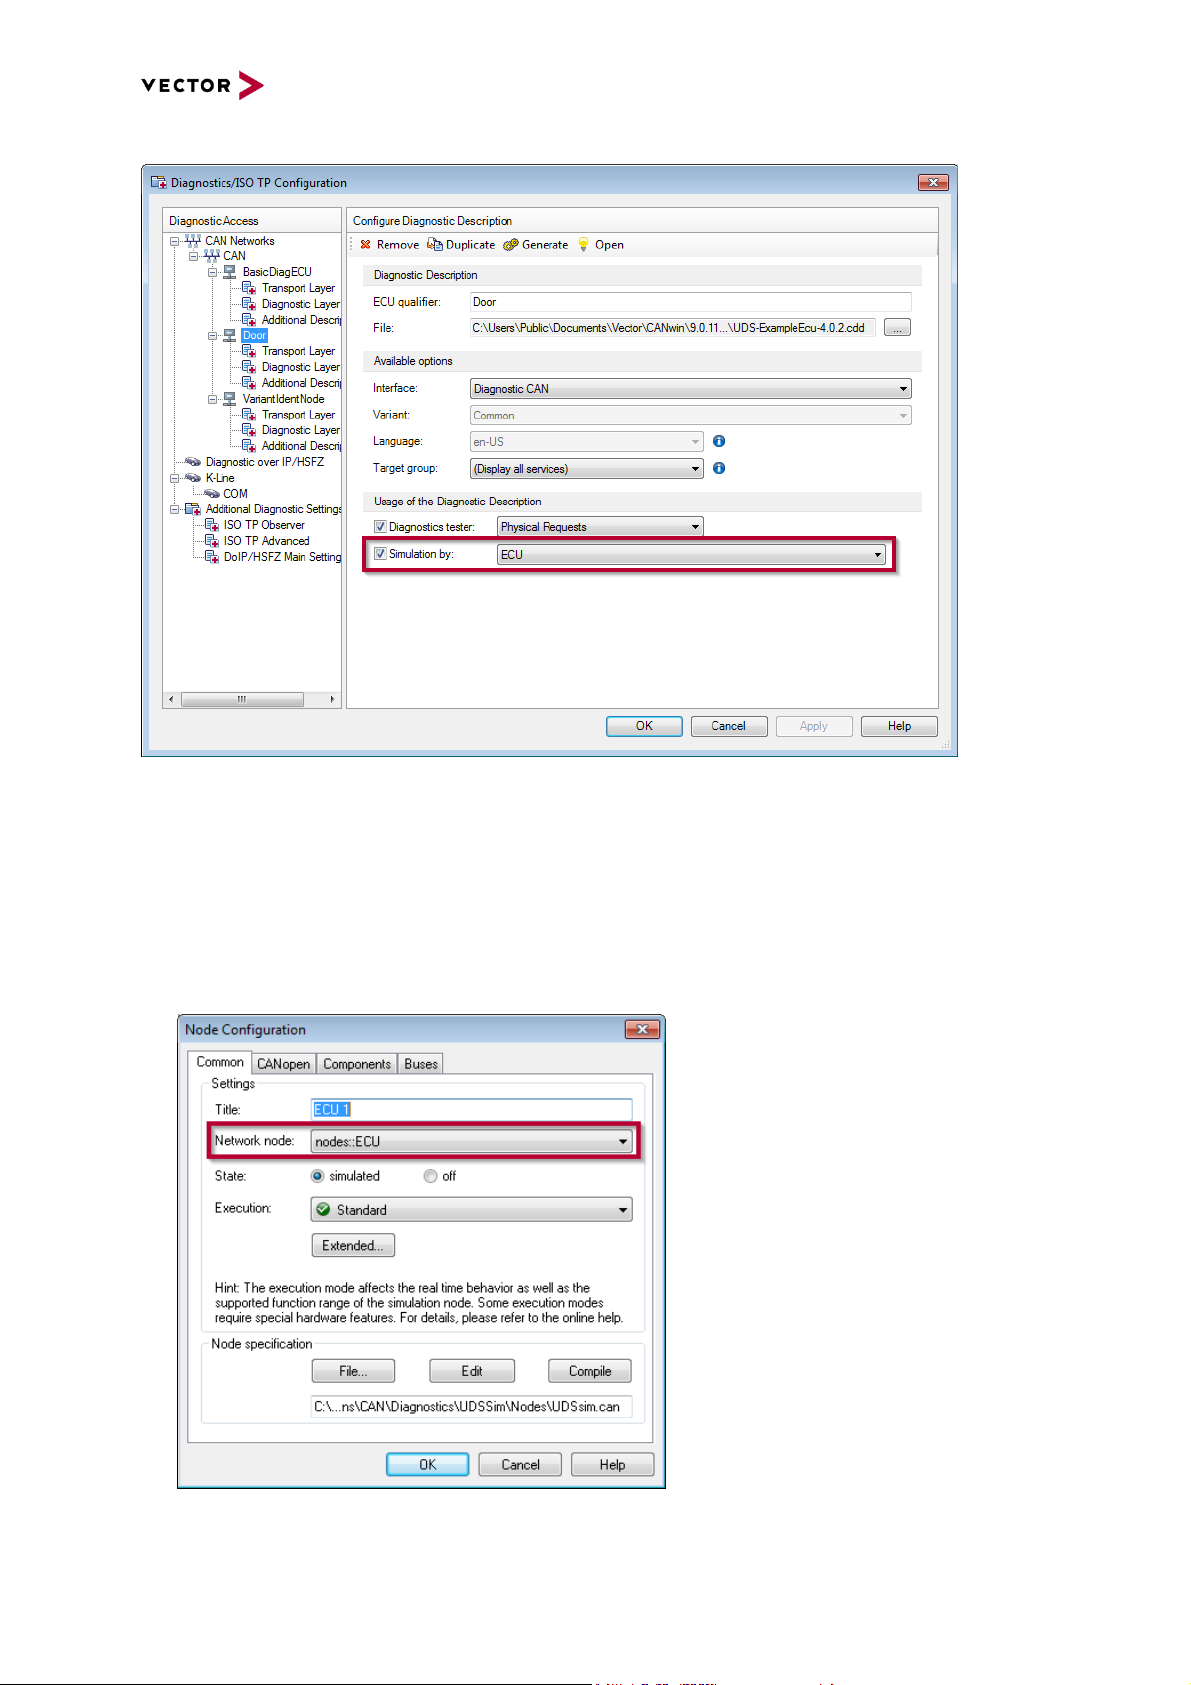
4.2.4 Add a Diagnostic Description and assign it to the network node
Next, you should add a diagnostic description. To do so, select the menu “Diagnostics & XCP |
Configuration | Diagnostics/ISO-TP Configuration…” and add the diagnostic description to the desired
network. Afterwards, you need to check “Simulation by” and select the Network Node from the
database or the simulation node you defined in the first and/or the second step (see sections 4.2.2
and 4.2.3 for details):
Page 24
CANoe and CANalyzer as Diagnostic Tools
Copyright © 2020 - Vector Informatik GmbH 24
Contact Information: www.vector.com or +49-711-80 670-0
Figure 16: Configuring a Diagnostic Description for simulation
4.2.5 Configure the Network Node in Simulation Setup
If you want to add a CAPL Callback Interface (CCI) implementation, at first you need to make sure that
the appropriate TP DLL is added as a component to the Network Node just added to the Simulation
Setup. To do this, perform the following two steps:
1. [If you did not add a database to the network as described in in chapter 4.2.3, you may skip this
step] In the Node Configuration dialog of the Network Node just added to the Simulation Setup,
set the “Network node” to the corresponding node defined in the database and confirm the dialog
with “OK”:
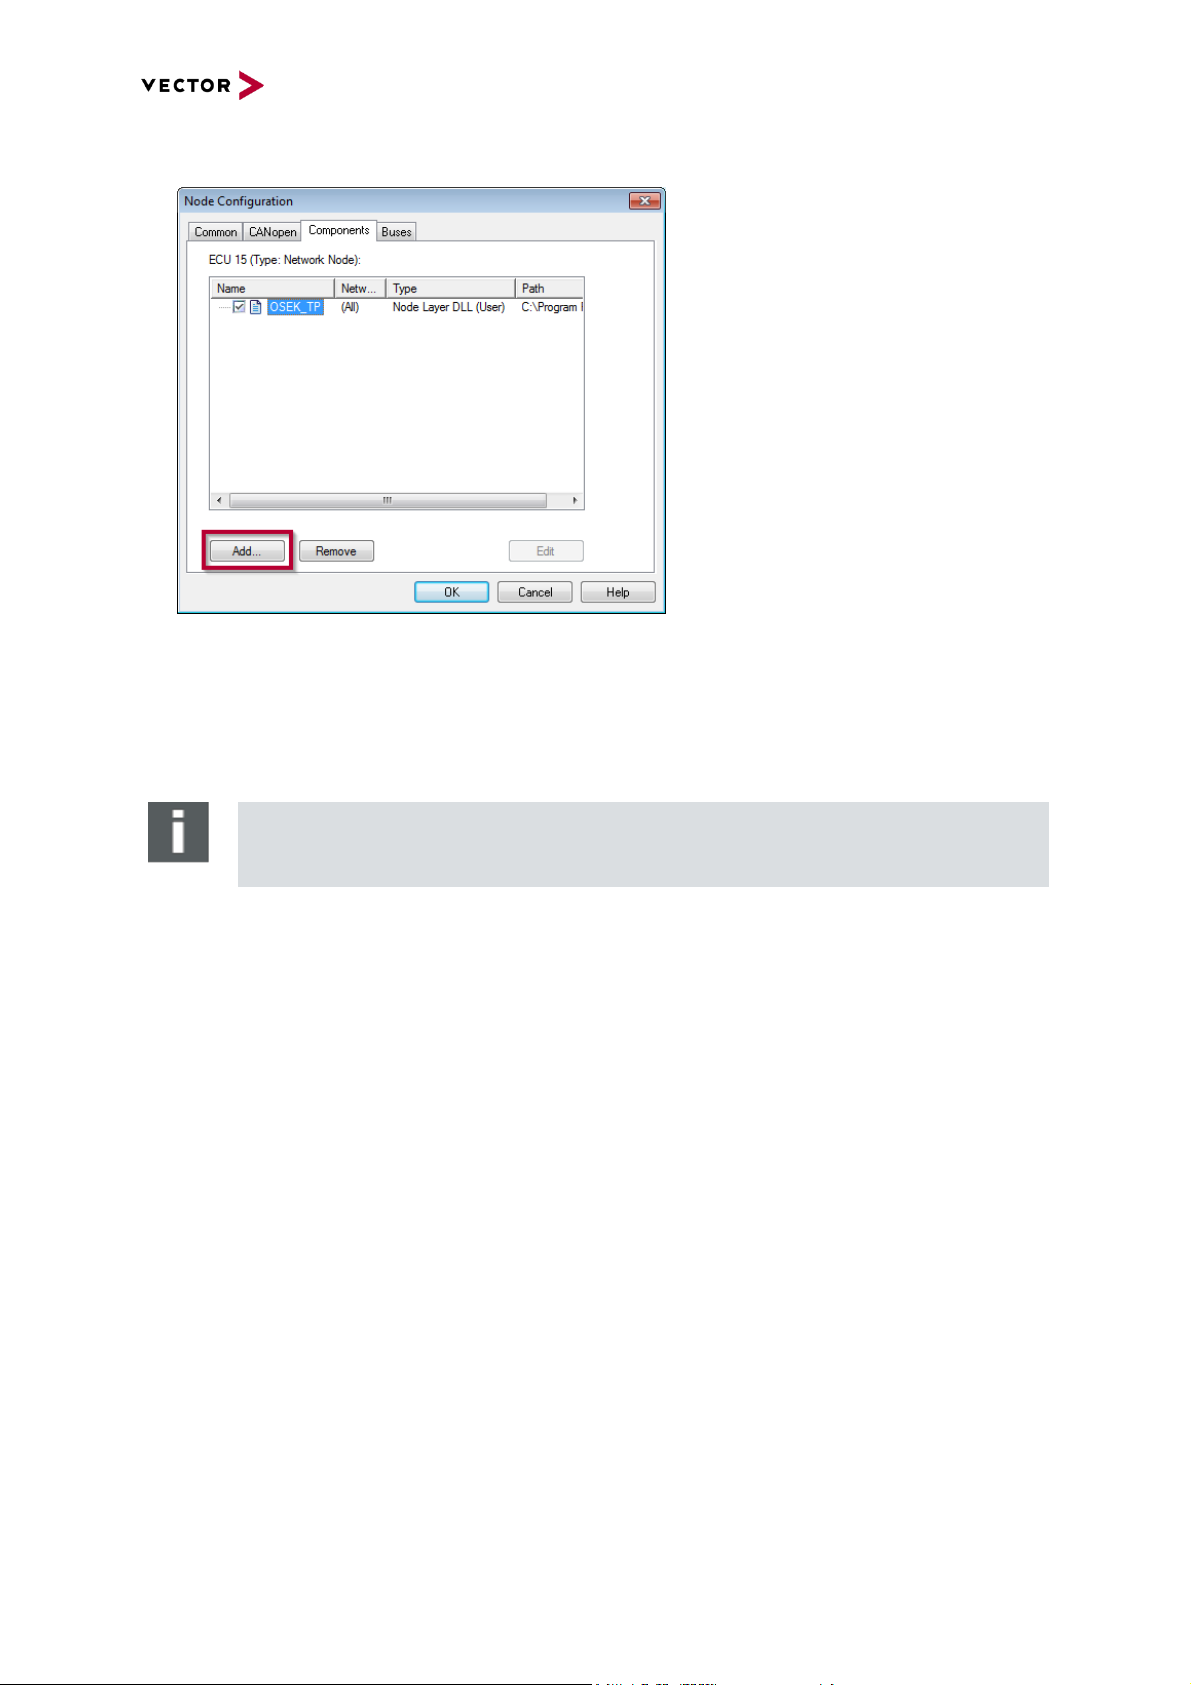
2. Open the Node Configuration dialog of the Network Node again and make sure that in its
“Components” tab, the corresponding TP DLL is configured as a component. If it is not already
configured, add it manually (you can find the TP DLLs in the Exec32 directory of your CANoe
Page 25
CANoe and CANalyzer as Diagnostic Tools
Copyright © 2020 - Vector Informatik GmbH 25
Contact Information: www.vector.com or +49-711-80 670-0
installation):
Using the TP DLLs (overview of TP DLLs see chapter 2.1), it is possible to work with diagnostic
objects in CAPL even if these objects exceed the size of one frame. E.g. a diagnostic response with
24 data bytes is still treated as one object - the diagnostic response. E.g. the OSEK transport protocol
is implemented in a dynamic link library (DLL) named “osek_tp.dll”. In order to use this DLL, you need
to add it as a component to the network node as described above.
Note
The TP DLLs use several callback functions - the so-called CAPL Callback Interface (CCI)
- which need to be implemented in the network node (see section 4.2.6 for details).
4.2.6 Add the CAPL Callback Interface
If you want to use the CAPL Callback Interface, you additionally need to provide certain callback
functions (referenced as the CAPL Callback Interface, CCI) in your CAPL code. For all relevant
automotive networks, reference CCI implementations are available as CAPL include files (*.cin) in the
folder “Reusable\CAPL_Includes\Diagnostics” which is located in the same folder as the Sample
Configurations (see the list of supported TPs and the corresponding DLL and *.cin files in chapter 2.1).
These include files implement the CCI for simple ECU simulations, i.e. they need to be adapted in
case of more complex simulations like e.g. gateways. Refer to the application note AN-IND-1-012 for
details.
4.2.7 Debug level
If using the CCI reference implementations, the amount of errors and warnings written to the Write
Window e.g. by the ISO TP functions can be controlled by a parameter to the function
setWriteDbgLevel(). To set the debug level to verbose use setWriteDbgLevel(1) or to set the debug
level to quiet use setWriteDbgLevel(0).
Example:
on start
{
setWriteDbgLevel(0);
}
Page 26

CANoe and CANalyzer as Diagnostic Tools
Copyright © 2020 - Vector Informatik GmbH 26
Contact Information: www.vector.com or +49-711-80 670-0
4.2.8 Add a diagnostics request event handler
In order to add an event procedure for a specific diagnostic request (e.g. in a simulated ECU), right-
click on “Diagnostics” and select the respective handler under “New event handler | Diagnostics | on
diagRequest <new request>”. This code will be created:
on diagRequest NewRequest
{
}
Use the diagnostics symbol explorer (see chapter 2.5.9) to enter the qualifier path via drag and drop or
type the ECU qualifier and Service qualifier separated by “.”, taking advantage of the Autocomplete
Input Assistance of the CAPL Browser.
Example:
on diagRequest Door.DefaultSession_Start
{
}
4.2.9 Create a diagnostic response
Note
This paragraph only applies to ECU simulations.
Usually a response is sent on reception of the event „diagRequest“, i.e. when the specific request
arrives. By using the keyword „this“ the response object will reflect the request object by referring to
the actual qualifier. Note how the diagnostic response is treated as an object rather than one or
several CAN message(s). Due to the TP functionality a response can be sent in one function call even
if the response object should be segmented (i.e. distributed over several subsequent messages).
Example:
on diagRequest Door.DefaultSession_Start
{
// Create a response to this request
diagResponse this resp;
// Send a positive response
DiagSendResponse( resp);
// For negative responses, use
// DiagSendNegativeResponse(resp, NRC)
}
Page 27

CANoe and CANalyzer as Diagnostic Tools
Copyright © 2020 - Vector Informatik GmbH 27
Contact Information: www.vector.com or +49-711-80 670-0
4.3 CANoe/CANalyzer as Diagnostic Tester
4.3.1 Set the diagnostic target
Note
The function DiagSetTarget() is deprecated. Vector recommends using the syntax with
ECU Qualifier in DiagRequest/Response Objects (see chapter 4.1.1 for details) instead.
Additionally, this paragraph only applies to tester simulations. In an ECU simulation node,
either the new syntax (see above) or DiagInitEcuSimulation() should be used.
If you simulate a diagnostic tester that should send requests and receive responses from a specific
(simulated or real) ECU, you must set the target name in the tester CAPL code – either in the
diagRequest object itself or using the deprecated DiagSetTarget() function. DiagSetTarget() is usually
set in the “on start”-handler of the CAPL code, but may be changed later.
Example:
on start
{
if( 0 != DiagSetTarget( "ECU" )) write( "Error setting target!" ); // deprecated syntax
}
The string “ECU” should be changed to the actual ECU qualifier contained in the Diagnostic
Description. Note that you can edit this ECU identifier in the “Diagnostics/ISO TP Configuration”
dialog.
4.3.2 Create a diagnostic request
To create a request that should be sent (e.g. from a Diagnostic Tester) you can create a function
where you create and send a request.
Example:
StartSession()
{
diagRequest Door.DefaultSession_Start req;
// Send the request as a complete object (TP takes care of segmentation)
DiagSendRequest ( req );
}
4.3.3 Add a diagnostics response event handler
In order to add an event procedure for a specific diagnostic response (e.g. in a simulated Tester),
right-click on “Diagnostics” and select the respective handler under “New event handler | Diagnostics |
on diagResponse <new response>”. This code will be created:
on diagResponse NewResponse
{
}
Use the diagnostics symbol explorer (see chapter 2.5.9) to enter the qualifier path via drag and drop or
type the ECU qualifier and Service qualifier separated by “.”, taking advantage of the Autocomplete
Input Assistance of the CAPL Browser.
4.3.4 Negative Response handling
A request sometimes results in a negative response e.g. if the request cannot be performed by the
ECU. This section describes how to implement a handling for this kind of situation.
The service of the request can be specified exactly, but the service of the response is not clear. To
handle the ambiguity of negative responses, it is suggested to implement an “all-handler”.
Example:
on diagResponse ECU.*
{
// Handle the ambiguity of neg responses by treating them as '*'
Page 28

CANoe and CANalyzer as Diagnostic Tools
Copyright © 2020 - Vector Informatik GmbH 28
Contact Information: www.vector.com or +49-711-80 670-0
if( DiagIsNegativeResponse ( this ) )
{
write( "Received negative response for service 0x%x, code 0x%x",
(long) DiagGetParameter( this, "SIDRQ_NR" ),
(long) DiagGetParameter( this, "NRC" ) );
}
}
A special case of negative response is a response with a code that indicates “I’m busy, I’ll respond
later”. This means that a (hopefully) positive response that should be mapped against the actual
request will follow later. On tester side of CANoe (i.e. using e.g. the Diagnostic Console or when
implementing a Test Module in CAPL), this behaviour is handled automatically. To simulate this
special kind of negative response from a simulated ECU, it is suggested to implement a timer in the
ECU. The simulated ECU first sends a negative response, then starts a timer where the positive
response is sent.
Example:
on diagRequest Door.FaultMemory_ReadAllIdentified
{
// Send neg response with code 0x78 (requestCorrectlyReceived-ResponsePending)
DiagSendNegativeResponse(this, 0x78);
// Optionally set a timer to respond with a positive response later
setTimer(posReq, 1);
// pos resp after 1s
}
4.4 Combine Test Feature Set and Diagnostic Feature Set
Note
This chapter only applies to CANoe.
This document does not cover the Test Feature Set in detail. For details on Test Feature Set please
refer to the online help in CANoe.
A very common diagnostic sequence is to send a request and to wait for a response before continuing
with the next request.
Tester ECU
Send diag request
… Receive request
Wait for response Process request
… Respond to request
Receive response
To be able to use the Test Feature Set in combination with the Diagnostic Feature Set, you can create
a CAPL Test Module instead of an ordinary ECU, and use it as a Diagnostic Tester. In this way you
can use the built-in test functions like TestWaitForDiagnosticResponse() to get a smoother handling of
the request/response scheme.
4.4.1 Timeout handling
The timeout on a diagnostic request can be recognized automatically via the return value of
TestWaitForDiagResponse() function.
Example:
TestWaitForDiagResponse( req, 5000 ); // wait 5s for a response on this request
Page 29

CANoe and CANalyzer as Diagnostic Tools
Copyright © 2020 - Vector Informatik GmbH 29
Contact Information: www.vector.com or +49-711-80 670-0
4.4.2 Automated diagnostic tests with CANoe
Diagnostics tests in CAPL
Create a test case in the TestControl section, e.g. tc_StartSession(), and call this test case from
MainTest(). In tc_StartSession() create a diagnostic request and wait for response until timeout.
Example Diagnostic Tester:
void MainTest ()
{
tc_StartSession ();
}
testcase tc_StartSession ()
{
// Create a request with correct qualifier
diagRequest Door.DefaultSession_Start req;
// Send the request
DiagSendRequest ( req );
// Wait until request has been sent completely (important especially in case of
// segmented messages)
TestWaitForDiagRequestSent( req, 1000)
// Wait 5s for response and evaluate
// Return values of Test Feature Set functions are defined in the help file
if( 1 != TestWaitForDiagResponse ( req, 5000) )
{
// Response not received
TestStepFail( "Start Default Session", "No response received!");
} else
{
// evaluation of response data here
}
}
To produce a response to your Diagnostic Tester it is a good idea to configure a simulated ECU as
long as no real HW is available. Simply add a simulation node to the Simulation Setup, activate the
“Simulation by” setting in the “Diagnostics/ISO TP” configuration dialog and select the simulation node
you just created (see chapter 4.2.4).
In the newly created simulation node you can define answers to diagnostic requests like this:
Example simulated ECU:
on diagRequest Door.DefaultSession_Start
{
// Create a response to this request
DiagResponse this resp;
// Send the response
DiagSendResponse( resp);
}
Diagnostics tests created in vTESTstudio
With vTESTstudio, it is possible to define automated tests using CAPL, C#, Test Tables (see Figure
17) or even graphically and generate so-called Test Units from these tests.
CANoe and vTESTstudio are perfectly matching each other. You can import CANoe’s project settings
including the assigned Diagnostic Descriptions into vTESTstudio and CANoe can execute test units
created in vTESTstudio.
Such Test Units can be executed in the same way like CAPL test modules and will generate Test
Reports as shown below.
With vTESTstudio, checking of e.g. the fault memory contents becomes very easy by just using drag &
drop when creating the tests, reducing the effort for diagnostic test creation tremendously compared to
test creation using CAPL.
Page 30

CANoe and CANalyzer as Diagnostic Tools
Copyright © 2020 - Vector Informatik GmbH 30
Contact Information: www.vector.com or +49-711-80 670-0
Figure 17: Defining diagnostics tests in a vTESTstudio Test Table
The test case above will result in the following test report (extract):
Main Part of Test Case
Timestamp
Test Step
Description
Result
1. Clear fault memory of SUT in order to get a defined precondition: Passed
1.614395
Query fault
memory
Clearing fault memory of target Diagnostic ECU 'SUT'
-
1.618371
DTCs cleared successfully
pass 2. Activate Extended Session: Passed
1.618371
Set P2 to 150ms, P2ex to 2000ms
-
1.618371
Sending request
'//Beispiel_Steuergeraet/CommonDiagnostics/ExtendedDiagnostic
Session_Start/STDS_RQ' ...
-
1.619907
Resume
reason
Resumed on Diagnostics request sent to 'SUT' Elapsed
time=1.536ms (max=10000ms)
-
1.619907
Request sent successfully
pass
Page 31

CANoe and CANalyzer as Diagnostic Tools
Copyright © 2020 - Vector Informatik GmbH 31
Contact Information: www.vector.com or +49-711-80 670-0
1.619907
Receiving diagnostic response
-
1.621395
Resume
reason
Resumed on Diagnostics response from 'SUT' Elapsed
time=1.48801ms (max=10000ms)
-
1.621395
Positive response received.
pass 3. Write Variant Coding while ECU is locked --> Expected result: Security access denied: Passed
1.621395
Sending request
'//Beispiel_Steuergeraet/CommonDiagnostics/Coding_Read/RDBI_
RQ' ...
-
1.623859
Resume
reason
Resumed on Diagnostics request sent to 'SUT' Elapsed
time=2.46399ms (max=10000ms)
-
1.623859
Request sent successfully
pass
1.623859
Receiving diagnostic response
-
1.625287
Resume
reason
Resumed on Diagnostics response from 'SUT' Elapsed
time=1.42801ms (max=10000ms)
-
1.625287
Response received successfully
pass
1.625287
Set P2 to 150ms, P2ex to 2000ms
-
1.625287
Sending request
'//Beispiel_Steuergeraet/CommonDiagnostics/Coding_Write/WDBI
_RQ' ...
-
1.626811
Resume
reason
Resumed on Diagnostics request sent to 'SUT' Elapsed
time=1.524ms (max=10000ms)
-
1.626811
Request sent successfully
pass
1.626811
Receiving diagnostic response
-
1.628287
Resume
reason
Resumed on Diagnostics response from 'SUT' Elapsed
time=1.47601ms (max=10000ms)
-
1.628287
Negative response received.
pass
1.628287
Received primitive can be interpreted as Diagnostic primitive
'WDBI_NR'.
pass
1.628287
Evaluate
Response
[-]
Check of expected
values
Symbol
Op.
Reference Value
Actual
Result
Diagnostic
parameter 'RC'
==
51 (Security access
denied)
51
pass
pass
4. Check whether the corresponding DTC was stored (Variant Coding Illegal Access): Passed
Page 32

CANoe and CANalyzer as Diagnostic Tools
Copyright © 2020 - Vector Informatik GmbH 32
Contact Information: www.vector.com or +49-711-80 670-0
1.628287
Query fault
memory
Reading DTCs from Diagnostic ECU 'SUT'
-
1.629859
Sent at
1.629859
[+]
//Beispiel_Steuergeraet/CommonDiagnostics/FaultMemory_ReadAllIdentified/RDI
_RDTCBSM_RQ
-
1.631287
Sent at
1.631287
[+]
//Beispiel_Steuergeraet/CommonDiagnostics/FaultMemory_ReadAllIdentified/RDI
_RDTCBSM_PR
-
1.631287
Mandatory DTC 0x2 (Diagnostic trouble code 'P000002') found
with matching status.
pass
4.5 Using CAPL in the measurement setup
The “on diagRequest” and “on diagResponse” handlers described in chapter 4.2.8 and 4.3.3 as well
as the “on diagRequestSent” handler can also be used in program nodes in the measurement setup.
This is especially helpful when programmatically analysing large log files in offline mode. Note that in
the measurement setup, it is necessary to add the line “output(this);” in order to forward the event to
subsequent elements, e.g. the trace window. Otherwise the respective event – in the following
example a specific diagnostic response of the Door ECU - is filtered out.
Example:
on diagResponse Door.SerialNumber_Read
{
long serialNo;
serialNo=DiagGetParameter(this, "SerialNumber");
write("Diagnostic response with serial number %d received from Door ECU!", serialNo);
output(this);
}
5.0 Advanced examples
5.1 ECU simulation of “Response Pending”
If an ECU is not able to respond to a request immediately, it can send a negative response with the
response code “requestCorrectlyReceived-ResponsePending” (RCR-RP, 0x78) to indicate that it will
delay the final response. To simulate this behavior in CAPL, the following code pattern can be used:
Example:
variables
{
// ...
BYTE gDelayedResponse[ 500]; // global buffer for one delayed response
dword gDelayedResponseLen = 0; // length of the response stored, or 0 if none
msTimer gDelayTimer; // timer for delayed response
}
on diagRequest ECU.Action1
{
diagResponse this resp;
// Set the parameters in the response.
DiagSetParameter( resp, "Param1", 1);
DiagSetParameter( resp, "Param2", 2);
// Copy the response data into the global buffer for sending later.
gDelayedResponseLen =
DiagGetPrimitiveData( resp, gDelayedResponse, elcount( gDelayedResponse));
// Send “response pending”
DiagSendNegativeResponse( resp, 0x78);
// Start the timer that will initiate the actual sending of the response.
settimer( gDelayTimer, 100);
}
Page 33

CANoe and CANalyzer as Diagnostic Tools
Copyright © 2020 - Vector Informatik GmbH 33
Contact Information: www.vector.com or +49-711-80 670-0
on timer gDelayTimer
{
diagResponse ECU.ActionX dummy;
if( gDelayedResponseLen > 0)
{
DiagResize( dummy, gDelayedResponseLen);
DiagSetPrimitiveData( dummy, gDelayedResponse, gDelayedResponseLen);
// The diagnostics object may now have changed its “type”!
DiagSendResponse( dummy);
gDelayedResponseLen = 0;
}
}
Note that the “type” of the response object in the “on timer gDelayTimer” handler can differ from the
one it is initialized with, depending on the content of the data that is written into the object.
5.2 Modifying the length of a diagnostic object
The length of a diagnostic object, e.g. a diagnostic response, can be resized. This is typically useful
for sending diagnostic responses containing DTCs from a simulated ECU because this kind of
diagnostic response can be of very different length depending on the number of DTCs.
If there is a parameter that specifies the number of simple parameter sequences that follow (e.g.
"NumberOfDTC"), set that parameter to the value you need:
Example:
DiagResponse this resp;
DiagSetParameter( resp, "NumberOfDTC", 12); // 12 sequences follow
DiagResize( resp); // Note: Not necessary anymore since CANoe 5.2
The example above will make room for 12 parameter sequences.
If no such parameter exists, you have to specify the number of bytes to reserve.
Example:
DiagResize( resp, 20); // resize the response to 20 bytes
5.3 Fill diagnostic content
A diagnostic parameter can be set directly via raw bytes instead of using symbolic values. This can
also be useful for simulating errors in e.g. diagnostic responses.
Example:
char ECUpartNo[25] = "030821111A";
byte inbuffer[25];
// Convert from char array to byte array
for(i=0;i<25;i++) inBuffer[i] = ECUpartNo[i];
// Set the parameter's raw byte representation in the response.
DiagSetParameterRaw(resp, "Partnumber_for_ECU", inBuffer, 25);
5.4 Fault injection
To verify how the ECU reacts on e.g. an incorrect diagnostic request the parameters of the request
can be manipulated by using the function DiagSetPrimitiveData(). This function can also be
used to patch the content directly to simulate an error in the ECU implementation.
You can declare an object with
diagRequest Door.SineWave_Send_once req;
and it will hold a buffer with the whole "bus message" (i.e. what will be transported over the bus as
data, including service and subfuction IDs). If you put different data into the object with
DiagSetPrimitiveData, it might no longer belong to the class “STORED_DATA”, but may be any other
"type" of response, or even something unspecified.
5.4.1 Make request length illegal
// Set length of request object to an incorrect value to check ECU action
Page 34

CANoe and CANalyzer as Diagnostic Tools
Copyright © 2020 - Vector Informatik GmbH 34
Contact Information: www.vector.com or +49-711-80 670-0
// Length differs from Diagnostic Description
DiagResize( req, 2);
If this request is sent, the transport layer will operate correctly, i.e. the data will be transferred
correctly.
5.4.2 Introduce errors on transport protocol level
It is possible to test the ECU’s capacity to cope with errors on the transport layer when using the
CAPL Callback Interface (CCI).
Example:
The tester claims to send the full data (e.g. 10 bytes), but stops sending after the first frame, i.e. the
Consecutive Frames are not sent:
_Diag_DataRequest( BYTE data[], DWORD count, long furtherSegments) {
if( gAbortAfterFF) { // Using a flag to trigger fault injection
CanTpFI_Enable( gHandle); // Activate fault injection functionality
// gHandle contains the handle of the TP connection
CanTpFI_SendXByte( gHandle, 1, 8, -1); // Send only 1 byte but fill First Frame to DLC 8
gAbortAfterFF = 0; // Do this only once
}
CanTpSendData(gHandle, data, count);
}
For more details on the fault injection feature of the OSEK_TP.DLL, please cf. [1], chapter “Fault
Injection”; for more information on the CCI, refer to the application note AN-IND-1-012 for details.
5.5 Access a node via a gateway simulation
> In order to access a node using the diagnostics features of CANoe, it is possible to introduce a
simple TP-level gateway simulation in the setup. The diagnostics description file can be
configured to use standard ISO TP data transfer on CAN. Assign the Diagnostic Description to
the CAN bus the gateway is attached to, not to the gateway node itself.
> In the simulation setup, configure the gateway node to use the ISO TP DLL for CAN
(OSEK_TP.DLL) and the TP DLL for the corresponding network (e.g. LINtp.DLL for LIN), i.e.
load these DLLs under “modules” or configure a database.
> The gateway simulation has to receive requests sent on the CAN bus (by the Diagnostic
Console or fault memory window, real nodes, simulated nodes, test modules, etc.), and send
the data on the LIN bus. The same approach has to be used for responses from the LIN to
CAN.
> Note that the “bus context” is set to the bus where the data has been received on, and that the
context has to be switched to the other bus before forwarding the data.
> In case of LIN, the gateway simulation has to act as the LIN master node.
The following implementation of a TP-level gateway simulation can be used as an example (the
settings in “on start” have to be adapted in most cases).
variables
{
char gECU[10] = "Gateway";
long gNAD; // node address of target node in LIN network
long gCanTpHandle; // handle of the CanTp connection
dword gLinBusContext;
dword gCanBusContext;
}
on start
{
// !!!Adapt the parameters in this function!!!
gCanTpHandle = CanTpCreateConnection(0); // 0 = Normal mode
CanTpSetTxIdentifier(gCanTpHandle, 0x400);
CanTpSetRxIdentifier(gCanTpHandle, 0x200);
gNAD = 1;
gCanBusContext = GetBusNameContext("CAN");
gLinBusContext = GetBusNameContext("LIN");
setWriteDbgLevel(0);
Page 35

CANoe and CANalyzer as Diagnostic Tools
Copyright © 2020 - Vector Informatik GmbH 35
Contact Information: www.vector.com or +49-711-80 670-0
}
CanTp_ReceptionInd (long handle, byte data[])
{
// This function returns the data received
writeDbgLevel(1,"%s: CanTp_RecepionInd", gECU);
setBusContext(gLinBusContext);
LINtp_DataReq(data, elcount( data), gNAD);
}
LINtp_DataInd(long count)
{
/* This function returns the number of data received */
byte rxBuffer[4096];
writeDbgLevel(1,"%s: LINtp_DataInd", gECU);
LINtp_GetRxData(rxBuffer, count);
setBusContext(gCanBusContext);
CanTPSendData( gCanTpHandle, rxBuffer, count);
}
LINtp_ErrorInd(int error)
{
}
CanTp_ErrorInd( long connHandle, long error)
{
}
6.0 Common mistakes
Problem
Why are the Diagnostics request or Diagnostics response event categories not
available in the symbol explorer of the CAPL browser?
Solution
You must add a Diagnostic Description to your CANoe/CANalyzer configuration,
see paragraph 3.1.1 on how to do that.
Problem
Why is the diagnostic request that I send (from CAPL) not visible in trace?
Solution
You must assign the Diagnostic Description to the actual ECU (or bus) that the
request is directed to. Additionally, the transport layer communication
parameters (e.g. on CAN the CAN IDs for request, response and – if used –
functional requests) need to be set correctly in the “Diagnostics/ISO TP”
configuration dialog.
If you can use the console, the Diagnostic Description is already correctly
assigned and make sure the trace window’s predefined filters are configured to
show diagnostic events.
Problem
Why is the following system message displayed in the Write window:
„System OSEK_TP ECU: Could not find mandatory callback function
OSEKTL_ErrorInd!“
Solution
Not the complete set of OSEKTL_ callback functions is found. You have
forgotten to include the indicated mandatory callback function into your
simulated ECU.
Page 36

CANoe and CANalyzer as Diagnostic Tools
Copyright © 2020 - Vector Informatik GmbH 36
Contact Information: www.vector.com or +49-711-80 670-0
Problem
Why is the following system message displayed in the Write window:
„System DiagCreate Request: Accessing CANdelaLib lead to an error, e.g.
exception, not found.“
Solution
A request could not be created because it is missing in the Diagnostic
Description or you selected a different variant in the “Diagnostics/ISO TP…”
configuration dialog. The request could be incorrectly defined in CAPL – check
the request qualifier with the qualifier you can copy via drag & drop from the
symbol explorer.
Problem
Why is the following system message displayed in the Write window:
“System Request services with complex/uncertain parameters are not
supported!”
Solution
When initialising the Diagnostic Console, all defined requests are inspected. But
since the Diagnostic Console is currently not able to create requests if they
contain complex parameters, those requests are filtered out of the display, i.e.
they cannot be sent directly from the console (but you can send them directly by
entering the raw bytes in the edit line of the console). This does not have
anything to do with the access in CAPL; except that using the Diagnostic
Console to find the qualifier path of the service does not work here, since the
service will not be listed in the Diagnostic Console tree. (Note that the symbol
explorer (see chapter 2.5.9) will display these requests and their parameters
too.)
Problem
Why is my simulated ECU marked with “OSEK_TP” in the simulation set-up?
Solution
Nodes that use the transport layer functionality in CANoe (i.e. segmentation and
other transport layer functions typically needed for diagnostics) must have this
node layer module assigned to them. CANoe needs this information in order to
use the DLL file that implements the transport protocol. You can either inform
CANoe via the .dbc-file (please see help file how to do this) or via the
configuration dialogue of the node itself in simulation set-up. Consult paragraph
4.2.4 for details.
Problem
Why does the Trace window display: “Unknown action::Unknown instance”?
Solution
Data bytes sent or received cannot be found in the Diagnostic Description.
Correct either your CAPL or your Diagnostic Description. This behaviour could
also occur if the ECU implementation (software) does not comply with the
specification, i.e. the ECU diagnostic response contains data bytes that are not
described in the Diagnostic Description.
Problem
Why is the value of a diagnostics parameter always written as 0, even though
no warning message (like “parameter not found”) is printed in the write window?
Solution
In the following typical statement
Write( "%d", DiagGetParameter( object, "Parameter"));
the double type return value of the access function (cf. CAPL reference) is
treated as a long argument, which will lead to printing 0 in most cases. It is
necessary to cast the value or use a float format:
Write( "%d", (long) DiagGetParameter( object, "Parameter"));
Write( "%g", DiagGetParameter( object, "Parameter"));
Page 37

CANoe and CANalyzer as Diagnostic Tools
Copyright © 2020 - Vector Informatik GmbH 37
Contact Information: www.vector.com or +49-711-80 670-0
Problem
The following code leads to an error like “[DiagGetParameter(double)]
Accessing CANdelaLib leads to an error. Parameter 'SerialNumber' not found!”,
although a parameter with this identifier is available for that service:
testcase TC_SerNumberRead()
{
DiagRequest SerialNumber_Read req;
double Serial;
DiagSendRequest(req);
TestWaitForDiagRequestSent(req, 1000);
TestWaitForDiagResponse(req, 1000);
Serial=DiagGetParameter(req, "SerialNumber");
//...
}
Solution
If you want to access the Parameters of the Response to a Request, the
function DiagGetRespParameter() needs to be used:
testcase TC_SerNumberRead()
{
DiagRequest SerialNumber_Read req;
double Serial;
DiagSendRequest(req);
TestWaitForDiagRequestSent(req, 1000);
TestWaitForDiagResponse(req, 1000);
Serial=DiagGetRespParameter(req, "SerialNumber");
//...
}
7.0 Abbreviations
API Application Programming Interface
CAPL CAN Access Programming Language
CCI CAPL Callback Interface
CDD CANdela Diagnostic Description
DBC DataBase for CAN
DFS Diagnostic Feature Set - diagnostic support in CANoe/CANalyzer
DIS Draft International Standard
ECU Electronic Control Unit
DLL Dynamic Link Library
DTC Diagnostic Trouble Code
ISO International Organization for Standardization
ODX Open Diagnostic Data Exchange
OEM Original Equipment Manufacturer
SP Service Pack
TFS Test Feature Set - test support in CANoe
TP Transport Protocol
8.0 References
The documents mentioned here are part of the documentation that is included with every CANoe
installation. They can be found from Start menu/Programs/CANoe/Help, or as files directly.
[1] ISO/DIS 15765-2 Transport Protocol documentation: Doc/CanTP_Manual.PDF
[2] Generic CDDs implementing standards: Exec32\StandardCDDs\GenericKWP.cdd
Page 38

CANoe and CANalyzer as Diagnostic Tools
Copyright © 2020 - Vector Informatik GmbH 38
Contact Information: www.vector.com or +49-711-80 670-0
Exec32\StandardCDDs\GenericUDS.cdd
9.0 Additional Resources
VECTOR APPLICATION NOTE
AN-IND-1-002 Testing with CANoe
AN-IND-1-004 Diagnostics via CANoe Gateways
AN-IND-1-012 CAPL Callback Interface in CANoe
10.0 Contacts
For a full list with all Vector locations and addresses worldwide, please visit http://vector.com/contact/.
 Loading...