

Page 1

Varian Analytical Instruments
NOTICE: This document contains references to Varian.
Please note that Varian, Inc. is now part of Agilent
Technologies. For more information, go to
www.agilent.com/chem.
2700 Mitchell Drive
Walnut Creek, CA 94598-1675/usa
PolyView2000™
©Varian, Inc. 2002 03-914774-00:Rev. 4
Operation Manual
Page 2
Trademark Acknowledgment
Microsoft, Windows, Windows 95, Windows 98, Windows NT, and
Windows 2000 are registered trademarks of Microsoft Corporation.
Other brand and product names are trademarks or registered
trademarks of their respective holders.
9065 PolyView Users
Please see the PolyView Operator’s Manual, 03-914738-00.
Page 3

Table of Contents
Overview................................................................................................... 1
PolyView2000 Functions .....................................................................................................2
Plotting a Chromatogram ..............................................................................................2
Examining and Analyzing Spectra ................................................................................3
Building, Editing, and Searching Spectral Libraries......................................................3
Determining the Purity of a Chromatographic Peak .....................................................3
Purity Evaluation by Multicomponent Analysis .............................................................4
Preparing Reports of Diode Array Data ........................................................................4
Recalculating the Peak Sense Events in a Diode Array Raw Data File .......................4
Quantitative Analysis by Multicomponent Analysis.......................................................4
Creation of Reduced Data Files....................................................................................5
PolyView2000 Windows ......................................................................................................5
Plot Window ..................................................................................................................7
Spectra Manager Window.............................................................................................8
Library Manager Window ..............................................................................................9
Reports Window..........................................................................................................10
Peak Sense Window ...................................................................................................11
MCA Window ..............................................................................................................13
PolyView2000 and Other Star Workstation Applications...................................................14
Operation................................................................................................ 17
Configuring PolyView2000 Windows.................................................................................18
Tutorial: Configuring PolyView2000 Windows...................................................................19
Plotting a Chromatogram...................................................................................................25
Tutorial: Plotting a Chromatogram.....................................................................................26
Examining Spectra from a Chromatogram ........................................................................35
Tutorial: Spectral Plots ......................................................................................................36
Tutorial: Spectral Math Functions......................................................................................41
Performing Library Functions ............................................................................................47
Tutorial: Creating a Library ................................................................................................50
Tutorial: Building and Editing a Library..............................................................................52
Tutorial: Conducting a Spectral Library Search.................................................................57
Reporting Data...................................................................................................................61
Tutorial: Making a Report ..................................................................................................62
Tutorial: Viewing and Printing of an Existing Report .........................................................69
Determining Peak Purity....................................................................................................71
Purity Parameter .........................................................................................................71
PolyView2000
TM
i
Page 4

Tutorial: Purity Parameter Plots.........................................................................................73
Tutorial: Peak Purity Survey Report ..................................................................................76
Performing Peak Sensing..................................................................................................77
Tutorial: Building a Peak Sensing Method ........................................................................79
Tutorial: Conducting Peak Sensing ...................................................................................81
Tutorial: Troubleshooting Peak Sensing............................................................................85
Automating PolyView2000 Operations..............................................................................90
Using On-Line Help ...........................................................................................................90
Tutorial: Using On-Line Help .............................................................................................91
Quantitative Analysis by MCA ...........................................................................................92
Tutorial: Using the MCA Window for Quantitative Analysis...............................................93
Tutorial: Automating the Quantitative Analysis..................................................................98
Purity Evaluation by MCA............................................................................................... 100
Tutorial: Using the MCA Window to Evaluate Purity ...................................................... 100
Creating Workstation Channels...................................................................................... 102
Library Searches ................................................................................. 105
Peak Sensing ....................................................................................... 109
Aurora................................................................................................... 115
Appendix A........................................................................................... 117
Interactive Reports.......................................................................................................... 117
Appendix B........................................................................................... 133
Non-Interactive Reports.................................................................................................. 133
ii 03-914774-00:4
Page 5
Overview
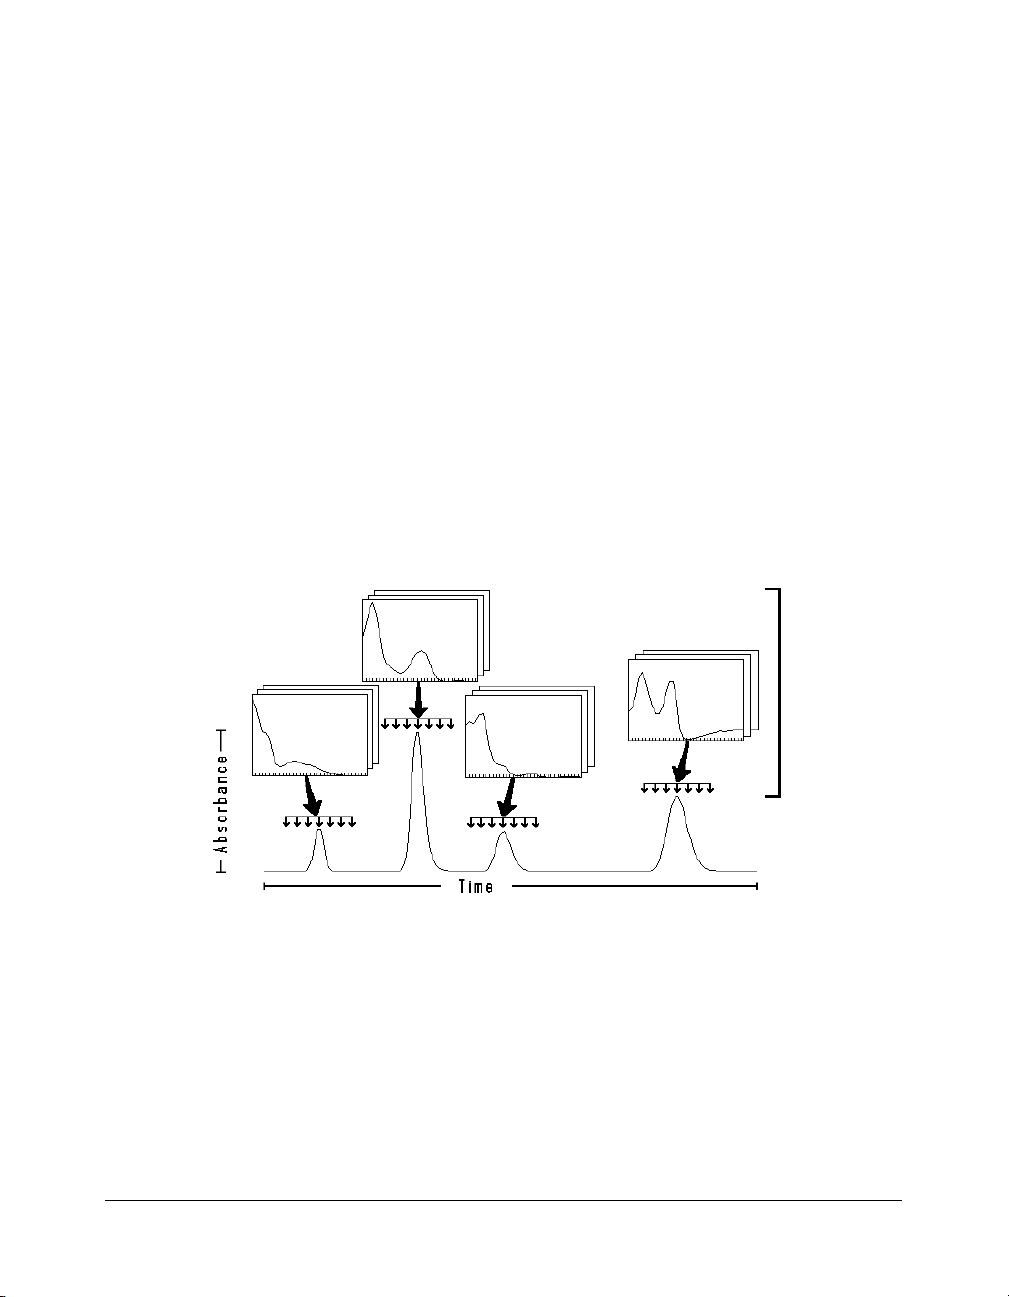
The PolyView2000™ Spectral Processing application, in
conjunction with the Varian Star Workstation, provides post-run
analysis of data from the 330 and the 9065 Diode Array
Detectors. Unlike other chromatographic UV absorbance
detectors that provide data in two domains, time and
absorbance, the Diode Array Detectors yields data in the
additional domain of wavelength.
Complete
Spectral
Data
PolyView2000
TM
Domains of 330 Diode Array Data
While the data from a diode array detector is obviously more
complex than a typical UV absorbance detector, this complexity
can provide the chromatographer with considerably more
information as well, when it is presented in an easily
understandable form.
1
Page 6

The PolyView2000 application is designed to handle this more
complex data structure, enabling the user to extract a spectrum
from any point in time within a chromatogram, or to generate an
absorbance chromatogram at any wavelength (or set of
wavelengths) within the wavelength range of the Diode Array
detector. In this way, PolyView2000 can provide the user with
qualitative information regarding an eluting compound. When
PolyView2000 is used to generate an absorbance
chromatogram, the Diode Array detector functions in much the
same way as any other UV absorbance detector, yielding a
concentration profile that changes with time. When
PolyView2000 is used to examine UV absorbance spectra, this
information, in conjunction with the retention time of the eluting
compound, provides qualitative information that can be used to
identify the compound of interest. In addition, the MultiComponent Analysis process (MCA) combines accurate
quantitative analysis and purity evaluation, even in cases of
coelution.
PolyView2000 Functions
The principal functions of the PolyView2000 Spectral Processing
application are described in the following paragraphs.
Plotting a Chromatogram
The PolyView2000 application can provide plots of absorbance
as a function of time at any of the available wavelengths within
the range of the Diode Array Detector. While the absorbance
chromatogram is the mainstay of chromatographic analysis, and
as such, is often the starting point within the PolyView2000
application, UV absorbance chromatograms are not the only
plots provided within PolyView2000. Additional treatments of the
330 data are also available, including plots of Purity
Parameter™, absorbance ratios, wavelength maxima, and
absorbance maxima. Just as an absorbance chromatogram
provides absorbance as a function of time, these other
parameters are also generated as a function of time. The results
are a series of time dependent profiles that provide qualitative
information on the spectral characteristics of eluting peaks. All
chromatogram plots can be obtained both interactively and under
automation.
03-914774-00:4
2
Page 7

VERVIEW
O
P
OLYVIEW
2000 F
UNCTIONS
Examining and Analyzing Spectra
As mentioned earlier, through the PolyView2000 application, all
of the spectra that constitute a raw data file are available for
examination and analysis. Spectra can be viewed individually, or
up to seven spectra can be overlaid and viewed at the same
time. This spectral plot can be expanded to visually show
detailed information about spectra. In addition, these spectra can
be operated on arithmetically, enabling you to create a
composite spectrum that is the sum or difference of several
spectra. Most spectral functions are performed interactively, but
reports comparing sample spectra to reference spectra are
produced as part of the library search and MCA automated
commands.
Building, Editing, and Searching Spectral Libraries
A particularly useful feature of PolyView2000 is the ability to
create and maintain libraries of spectra. Within a spectral library,
you can archive those spectra that are relevant to a particular
chromatographic application. PolyView2000 can then provide
ordered searches of these libraries, comparing a spectrum of
interest within a chromatogram to the spectra stored within one
or more spectral libraries. Library building and editing are
interactive tasks. Library searching can be performed
interactively or under automation.
PolyView2000
TM
Determining the Purity of a Chromatographic Peak
Co-elution is often a problem with samples composed of
structurally similar constituents. PolyView2000 provides several
means of determining the purity of a chromatographic peak by
displaying the spectral characteristics across the width of the
peak. As an example, the Purity Parameter of a UV spectrum
uniquely distinguishes it from other similar spectra. By plotting
the Purity Parameter as a function of time, slight differences in
the UV spectra across a peak can be determined, indicating the
presence of impurities. Similarly, absorbance ratio and
wavelength maxima plots can be used to indicate spectral
dissimilarities across the width of a peak.
3
Page 8

Purity Evaluation by Multicomponent Analysis
Multicomponent Analysis also provides a powerful tool to assess
the spectral homogeneity of a peak or the presence of
unexpected impurities. All purity features are available both
interactively and under automation.
Preparing Reports of Diode Array Data
An important function of PolyView2000 is the ability to generate
reports that contain the results of the data analyses. These
reports are available in a variety of formats and cover most of the
operations that are possible with PolyView2000. You can
generate reports while working at the Star Workstation itself
(interactive reports) or at the end of a run and some time later in
an automated fashion (non-interactive reports).
Recalculating the Peak Sense Events in a Diode Array Raw Data File
Associated with every UV absorbance chromatogram obtained
with the Diode Array detector is a series of peak sense events.
These events mark important points within a chromatogram, and
include peak start, peak end, peak apex and peak upslope and
downslope. At times, the peak sense events that are calculated
and set at the time of acquisition of a diode array data file may
need to be redetermined. PolyView2000, in conjunction with the
Method Builder application of the Star Workstation, provides the
ability to recalculate these peak sense events.
Quantitative Analysis by Multicomponent Analysis
By integrating a group of fused peaks at each wavelength, one
obtains an Area Spectrum. This Area Spectrum is the baselinecorrected spectrum of an elution fraction. If the spectra of all
components are known, the Area Spectrum can be decomposed
by a simple mathematical process known as Multicomponent
Analysis. This process is routinely used in spectrophotometers.
In PolyView2000, this process is used to obtain precise
quantitative results from overlapping peaks.
03-914774-00:4
4
Page 9
Creation of Reduced Data Files
PolyView2000 can reduce a data file to a few channels of data
corresponding to time-programmed wavelengths or wavelength
ranges, while preserving full spectra for the events detected by
peak sensing. These channels can also be created while
preserving all spectral data. These files can be created both
interactively and under automation.
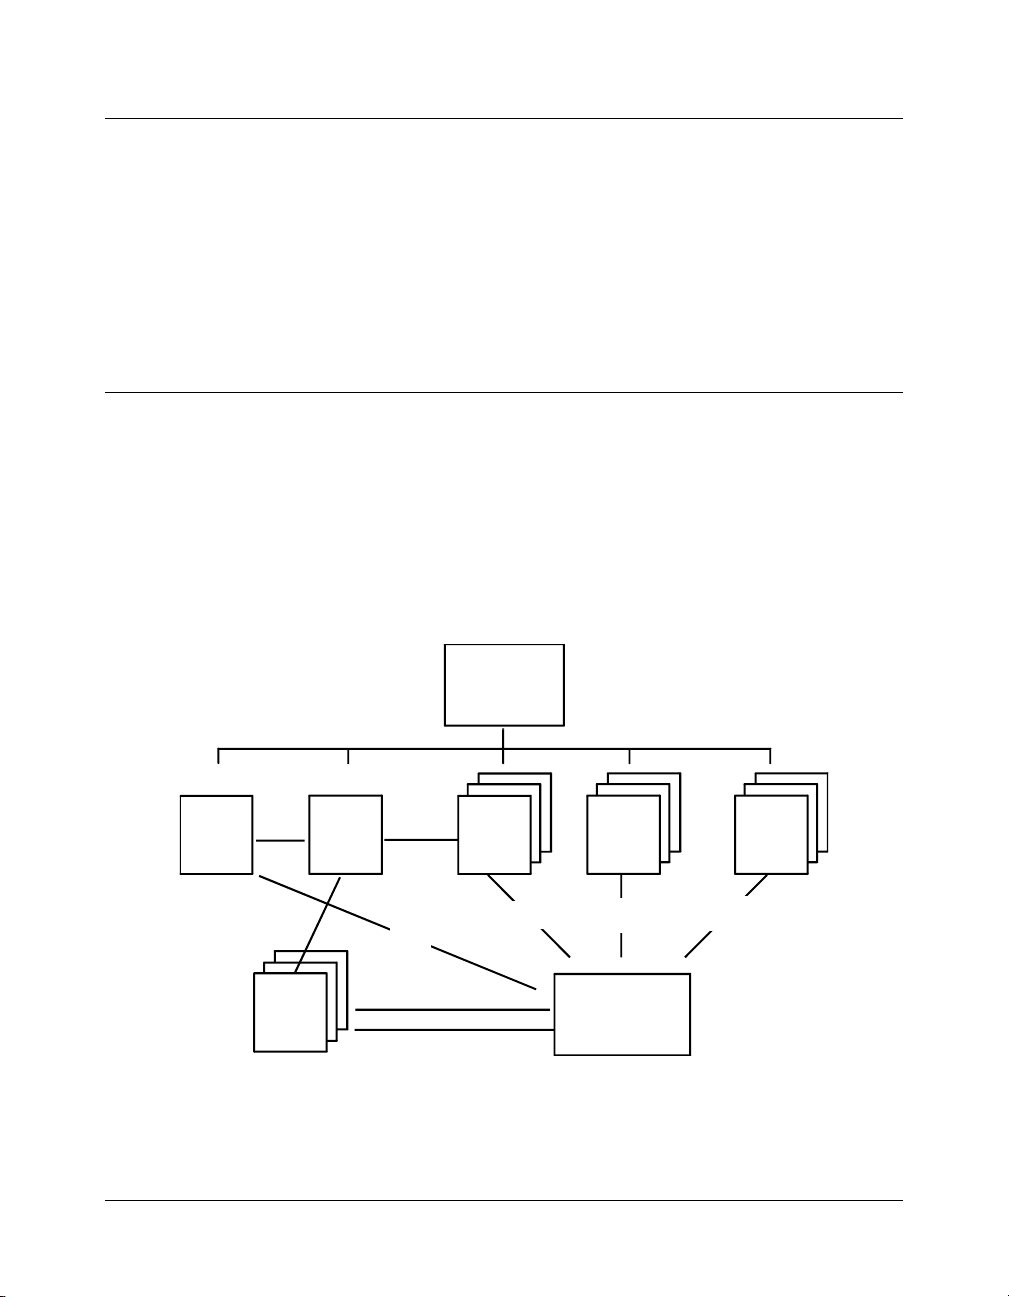
PolyView2000 Windows
The PolyView2000 Spectral Processing application is organized
into several distinct child windows within the PolyView2000 main
application window. These include the Plot window, Spectra
Manager window, Library Manager window, Reports window,
Peak Sense window, and the MCA window. The following
illustration shows the organization of the PolyView2000 windows
and the transfer of data between the windows. Multiple copies of
several of the windows are available as indicated.
P
OLYVIEW
O
2000 W
VERVIEW
INDOWS
Manager
Window
PolyView2000
Library
TM
Poly View
Main Application
Window
Spectra
Spectra
MCA
Window
Spectra
Manager
Window
Spectra
.LBR
Files
.LBR Files
.RUN Files
Plot
Window
.RUN
Files
.RUN, .MTH
Perm anent
Disk Storage
Organization of the PolyView2000 Windows
Peak
Sensing
Window
Files
.SRP,.MTH
Files
Reports
Window
5
Page 10
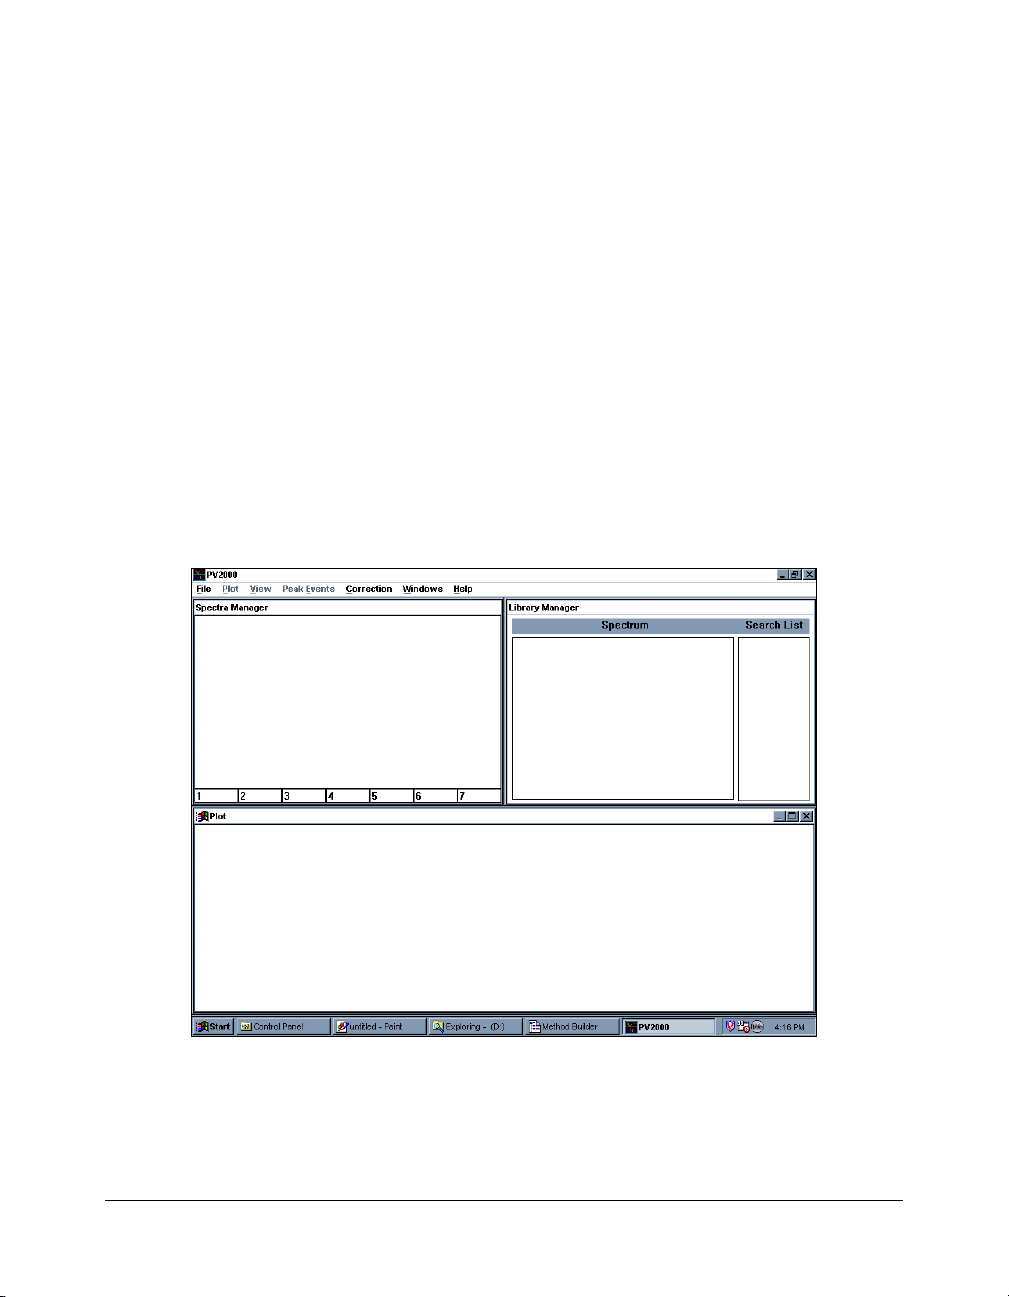
The three windows used most in PolyView2000 functions are the
Plot, Spectra Manager, and Library Manager Windows. When
PolyView2000 is first started, the screen is split between these
three windows.
You will find that many of the data analyses performed using
PolyView2000 requires only these three windows and you will
not need to alter the screen configuration or create additional
windows. Of course, if your work requires the use of additional
windows, they are easily created and the screen configuration
can be easily altered. Following is a brief description of the six
PolyView2000 windows. For more detail on the functions
available in each and the operation of On-Line Help, refer to the
operation section.
PolyView2000 Configuration Upon Start-Up
03-914774-00:4
6
Page 11
VERVIEW
O
P
OLYVIEW
2000 W
INDOWS
Plot Window
The Plot window is used to plot chromatograms from diode array
raw data files (.RUN files). The plots can display the absorbance,
Purity Parameter, absorbance ratio, absorbance maxima or
wavelength maxima, each as a function of run time. Once
displayed, regions of the plot can be enlarged (zoomed) and a
variety of spectral correction methods can be selected. Only one
chromatogram at a time can be displayed in the window.
However,
at the same time for comparison of different .RUN files or to
compare different plot conditions on the same .RUN file.
Additional features in the plot window include the ability to
display peak events (peak start, peak end, apex, etc.) and to
transfer selected spectra from the displayed raw data file to the
Spectra Manager window.
several plot windows can be displayed on the screen
PolyView2000
TM
The Plot Window
7
Page 12
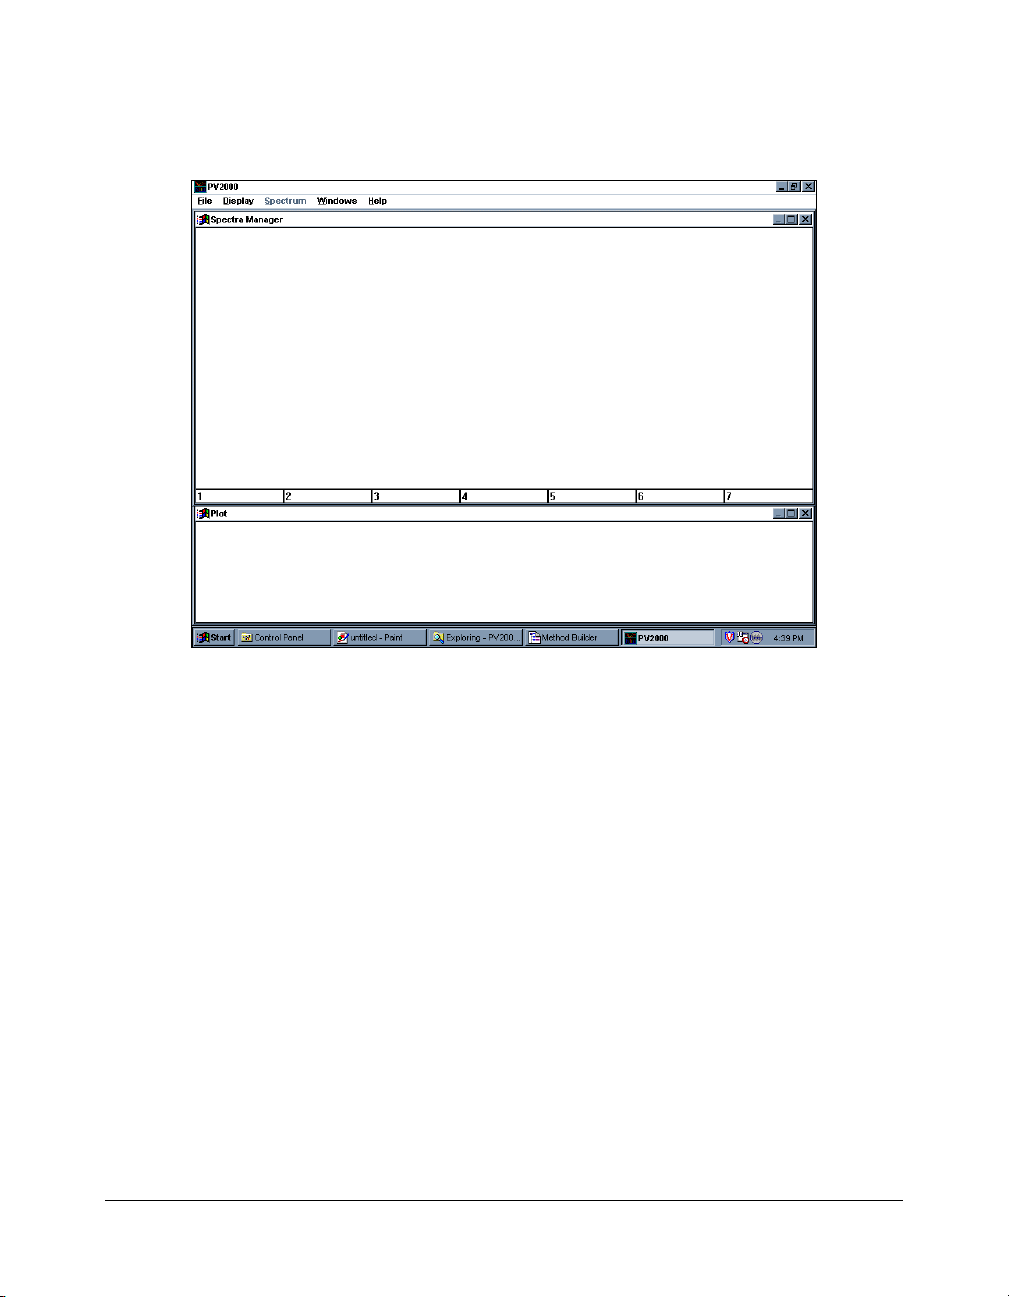
Spectra Manager Window
The primary function of the Spectra Manager window is the
display and analysis of UV spectra from selected points in a
chromatogram. A single spectrum can be displayed or up to
seven spectra can be overlaid. Information about the spectra,
such as compound name, operator, and method name, can be
added or edited in this window. This information becomes a part
of that particular spectrum record and is transferred with it
between the various PolyView2000 windows.
The Spectra Manager Window
A number of data analysis functions can be performed in the
Spectra Manager window such as the calculation of Purity
Parameters, the determination of their statistics, and the
arithmetic combination of spectra. Also, the wavelength range
over which the Purity Parameter is calculated can be optimized.
Several different reports of the spectra and the spectral analyses
can be prepared and printed directly from the Spectra Manager
window. From this window, spectra can be transferred to the
Library Manager window for use in spectral library functions.
03-914774-00:4
8
Page 13

VERVIEW
O
P
OLYVIEW
2000 W
INDOWS
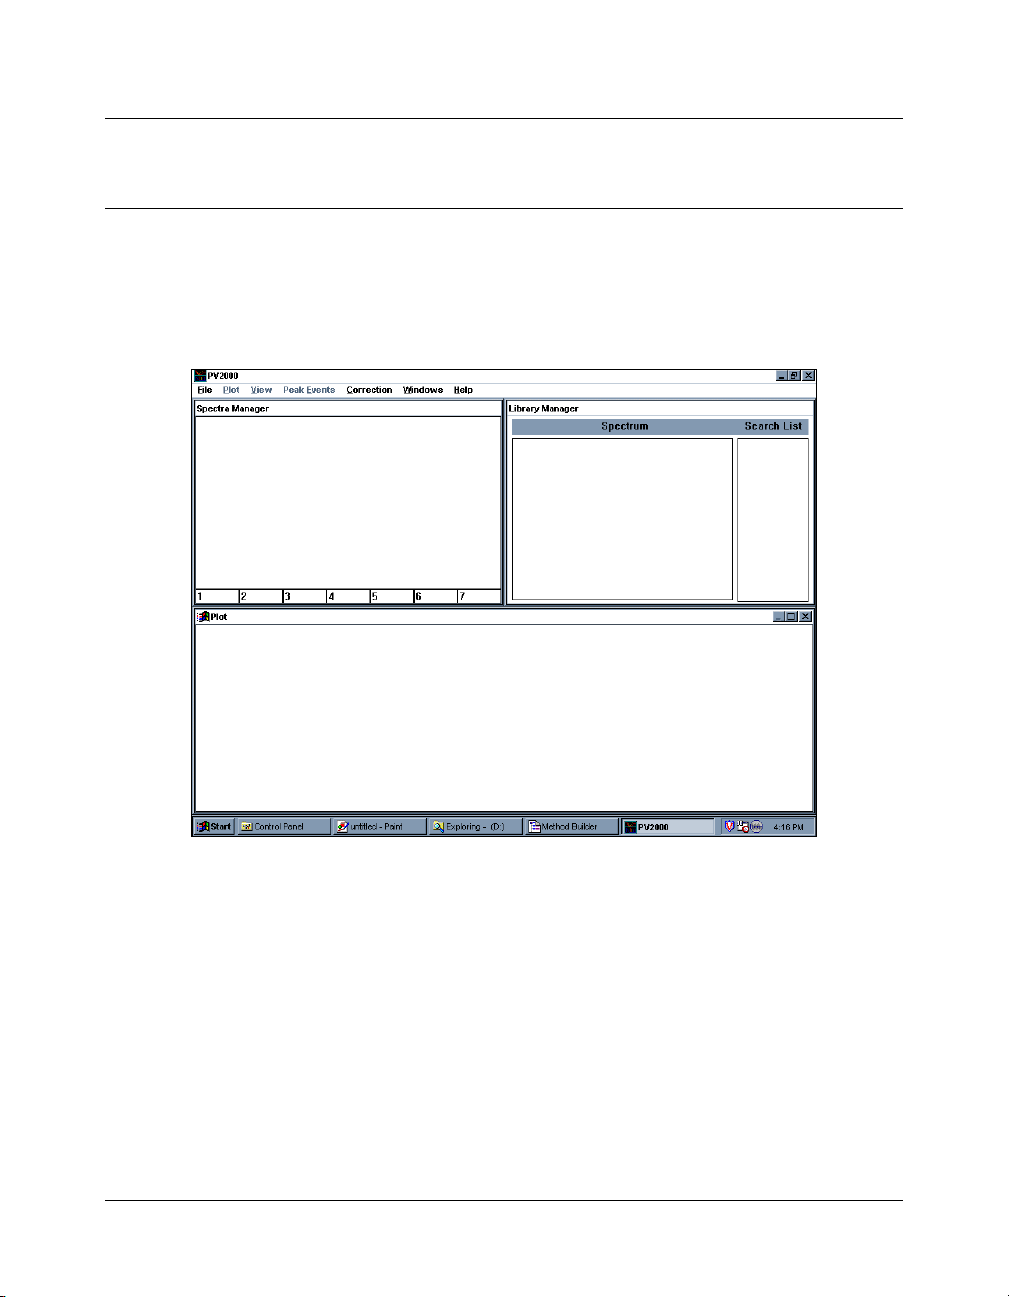
Library Manager Window
A variety of spectral library functions are performed within the
Library Manager window. These include building and editing
libraries, conducting library searches, and preparing reports of
the search results. Any spectrum transferred into the Library
Manager window from the Spectra Manager is held in a
spectrum register. The Library Manager window has the ability to
hold only one spectrum. Information about the spectrum (name,
operator, etc.) can be added to this spectrum in the same
manner as it was in the Spectra Manager window. In addition,
the Library Manager provides for the management of disk
libraries of up to 120 spectra each. Library management
functions include adding, editing, and deleting spectra in
libraries. Additionally, key word searches of the contents of a
library can be made to quickly locate a selected spectrum. In
addition to the library management functions, library searches
are performed in the Library Manager window. To conduct a
search, a spectrum is transferred from the Spectra Manager
window into the Library Manager window. One or several disk
libraries are specified and the search is conducted based on a
number of
retention time, and wavelength. The search results are ordered
according to the similarity between the target spectrum and the
match spectrum from the library. Reports can then be printed to
document the results of the library search.
selectable criteria including Purity Parameter,
PolyView2000
TM
9
Page 14
The Library Manager Window
Reports Window
A wide variety of printed reports can be prepared in
PolyView2000. Most operations within PolyView2000 windows
can be documented through an “interactive” report obtained
either by selecting Print... from the File menu or by selecting the
Print pushbutton appearing in many of the dialog boxes. This is
just one way to obtain a printed report. Reports can also be
prepared in an automated, unattended fashion. In PolyView2000,
a separate window, the Reports window, is used to prepare and
manage these reports. The Reports window is not activated at
the time of start-up and must be created using the New Reports
Window command item under the Window menu. A variety of
different reports can be prepared in this window including
chromatograms, library searches, peak purity surveys, and
tables of data characterizing the peak events in a data file. The
contents of a report are first specified in the Method Builder
application and then prepared in the Reports window. Once
prepared, the report is saved as a disk file. It can then be loaded
in the Report Window, viewed on the screen, edited, printed, or
exported in a variety of formats to other windows applications.
03-914774-00:4
10
Page 15
The Reports Window
P
OLYVIEW
O
2000 W
VERVIEW
INDOWS
PolyView2000
TM
Peak Sense Window
A number of functions within PolyView2000 require peak
detection to determine the various peak events (peak start, peak
end, inflection points, and apices). For instance, to provide
efficient spectral correction to account for mobile phase
absorbance, the peak start and ending points must be accurately
determined. This ensures that the spectra obtained for an eluting
peak accurately reflect the compound of interest, free from
background interference. At the time of data collection,
PolyView2000 peak sensing is automatically performed on diode
array files, provided a PolyView2000 section is included in the
Workstation method file (.MTH) under which the data is
collected. However, if no PolyView2000 section was included or
if the peak detection was not accurate (as indicated by
misplaced peak events or baseline), then peak sensing may
need to be repeated.
11
Page 16
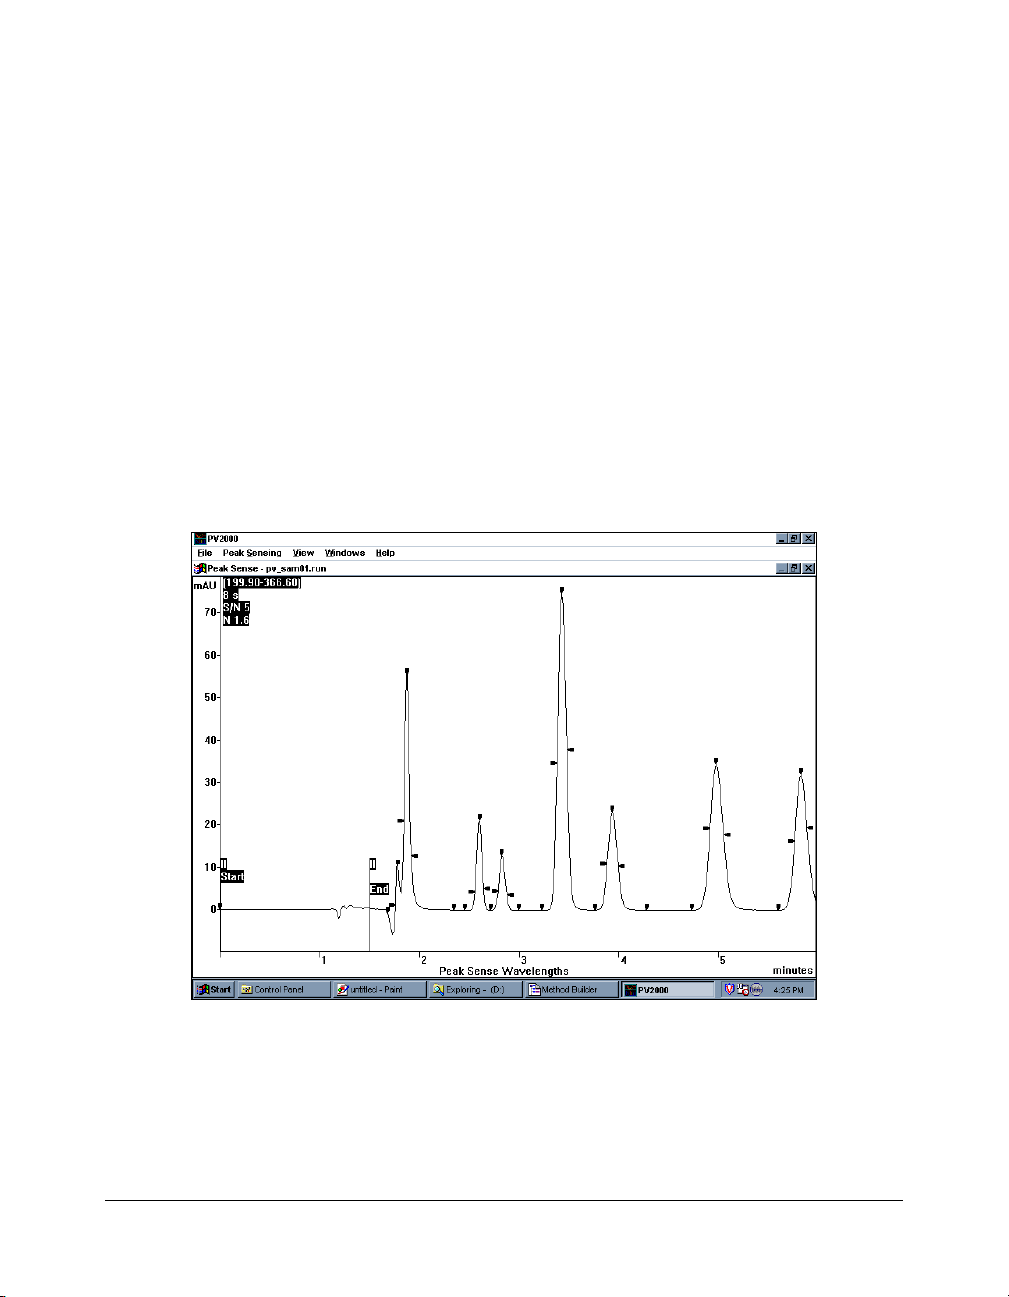
The Peak Sense window is used to perform a peak sense
recalculation on a raw data file. Like the Reports window, the
Peak Sense window must be created using the New Peak
Sense Window menu item under the Windows menu. In the
Peak Sense window, the absorbance chromatogram is displayed
at the wavelength used for peak sensing. To perform peak
sensing, the method to be used (wavelength, peak width, etc.) is
specified in the Method Builder application and then
used in the
Peak Sense window. Additional features include the ability to
view and edit the noise data acquired by the Workstation during
the diode array monitor period. The noise data is used in
conjunction with the S/N ratio parameter to detect peaks, and
editing of this data may be required in cases where there was
excessive detector noise during the monitor period.
The Peak Sense Window
03-914774-00:4
12
Page 17
VERVIEW
O
P
OLYVIEW
2000 W
INDOWS
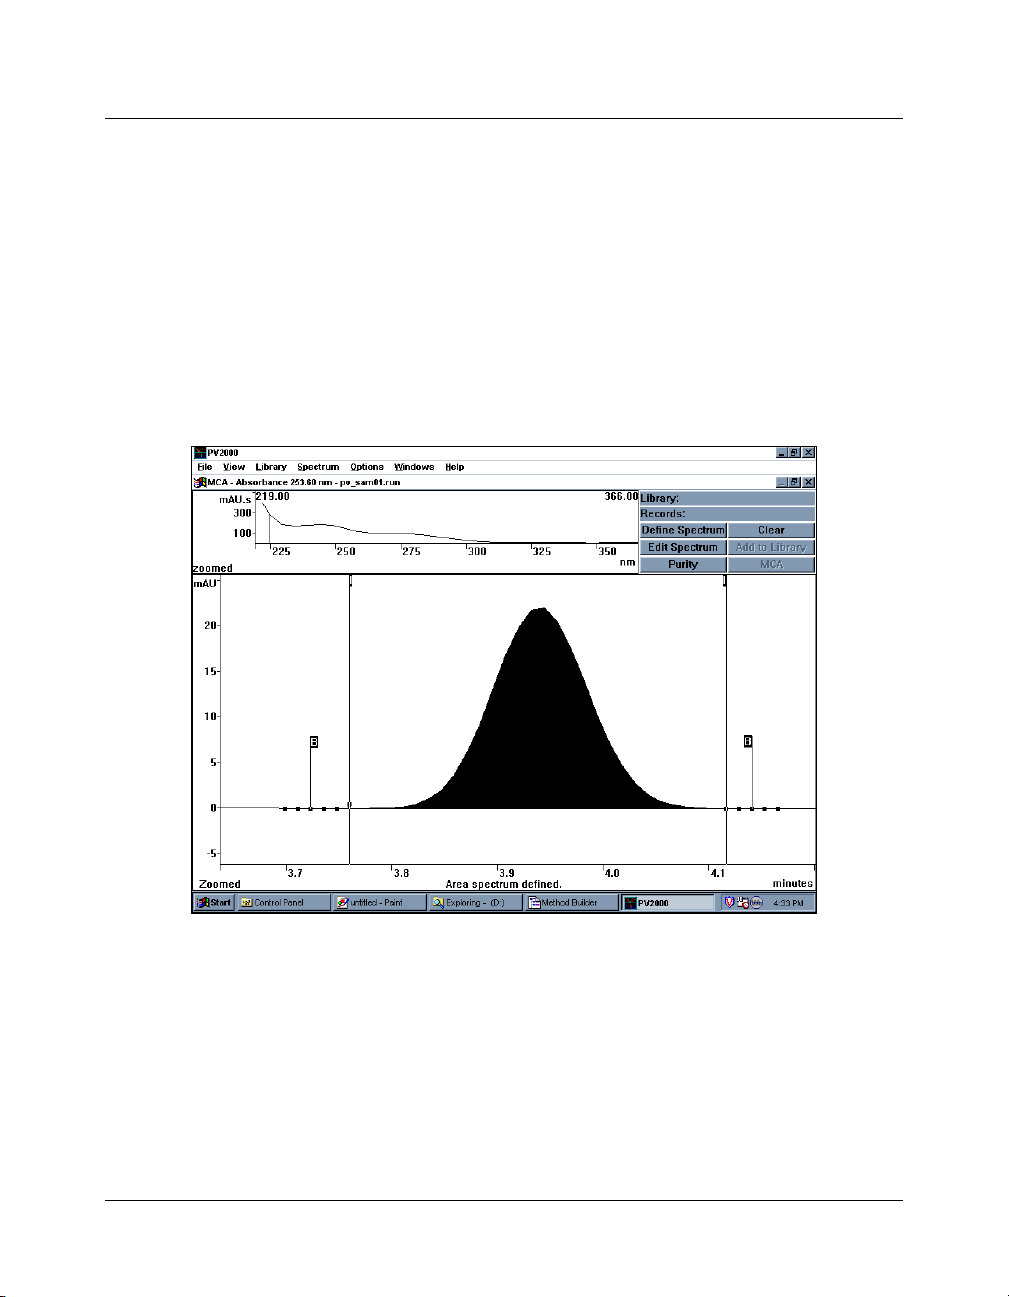
MCA Window
The Multicomponent Analysis window contains all the functions
required to perform MCA Quantitative Analysis and Purity
Evaluation. The MCA window is composed of 3 areas. The
bottom half displays a Chromatogram at a user selectable
wavelength, which is used to select the integration limits. The
upper right quarter contains 6 push buttons that implement the
main commands, and the upper left quarter shows the spectrum
of the integrated chromatogram region.
PolyView2000
TM
The MCA Window
13
Page 18

PolyView2000 and Other Star Workstation Applications
The PolyView2000 application software is integrated into the
Star Workstation to enable the Star Workstation to conduct
automated tasks that include PolyView2000 functions. For
instance, at the end of a chromatographic run, the Star
Workstation can automatically conduct PolyView2000 peak
sensing on the .RUN data file and prepare selected
PolyView2000 reports, all without your actually having to start
the PolyView2000 application.
Upon installation, a PolyView2000 Icon is added to the Star
Workstation’s Star Tool Bar. PolyView2000 interacts with two
other Star Workstation applications, Method Builder and System
Control/Automation. The .MTH file is used to specify the peak
sensing conditions (wavelength, peak width, etc.) or the type of
reports needed. Method Builder is used to build and manage the
.MTH files that are used to perform these functions. In
PolyView2000, the Method Builder application can be accessed
directly, without going through the Star Tool Bar. When accessed
in this manner, after the method editing session is completed
and the Method Builder application is closed, control is returned
to PolyView2000, right where you left off.
NOTE: See the Data Acquisition with LC Control Operation Manual for more
details on the functions and operation of the Method Builder application.
The other Star Workstation application that interacts with
PolyView2000 is System Control/Automation. However, the
interaction is not readily apparent to the user, as it involves
internal processing within the Star Workstation via the AutoLink
protocol. When a diode array detector is operating under the
control of the System Control/Automation application, post-run
PolyView2000 processing and reporting is performed on any
diode array file based on the PolyView2000 section in the active
method. If no PolyView2000 section exists in the method, default
peak sensing conditions are used, and no reports are created.
03-914774-00:4
14
Page 19

VERVIEW
O
P
OLYVIEW
2000
AND OTHER STAR WORKSTATION APPLICATIONS
The results of the peak sensing and/or reporting performed
under System Control/ Automation are exactly the same as if
these functions had been performed interactively in
PolyView2000. System Control/Automation is also used if a
series of .RUN files need to have peak sensing or reporting
repeated on them. In this case, the recalculation capability of
System Control/Automation is used to conduct
PolyView2000
peak sensing or reporting on a series of .RUN files.
NOTE: See the Data Acquisition with LC Control Operation Manual for more
details on the operation of the System Control/Automation application.
PolyView2000
TM
15
Page 20

Page 21

Operation
The functions and operation of PolyView2000 are described in
this section. PolyView2000 is a very powerful software program
and often there are several different ways to accomplish the
same task. It is not the purpose of this section to fully describe
every operation available within PolyView2000. Rather, the
primary functions will be described along with a series of short
Examples to assist you in getting started using PolyView2000; in
particular, learn to use the On-Line Help which contains both
Reference and Procedural information. This may help you to
accomplish a particular function in a different way than that
described in the Tutorials. Use the commands that are best
suited to your particular needs or application. The primary
PolyView2000 functions covered in this section are:
PolyView2000
TM
• Configuring PolyView2000 Windows
• Plotting A Chromatogram
• Examining Spectra from a Chromatogram
• Performing Library Functions
• Reporting Data
• Determining Peak Purity
• Purity Parameter
• Performing Peak Sensing
• Automating PolyView2000 Operations
• Using On-Line Help
• Quantitative Analysis by MCA
• Purity Evaluation by MCA
• Creating Workstation Channels
17
Page 22

Following the description of each of these functions, one or more
Tutorials are presented to help you get started. Read the
functional description section, work through the Tutorials, and
then refer to the section or On-Line Help if further information is
needed on a particular window or menu item.
Configuring PolyView2000 Windows
PolyView2000 operates under Microsoft Windows Multiple
Document Interface (MDI). The MDI tracks and reflects changes
in the menus associated with each child window within a main
application window. The menu at the top of the main application
window changes as the nature of the active child window
changes. For example, within the PolyView2000 main application
window, if you move from a child window that is used to manage
spectra, to a child window used to manage libraries, spectrumspecific menus will be replaced with library-specific menus.
When a number of child windows are present in the main
application window, a child window is made the active window
by moving the mouse cursor to that window and clicking on its
title bar. The title bar changes color (or contrast) to indicate that
it is now the active window. The menu names and items
reflecting the functions and operation of the active child window
are then displayed within the menu bar of the main application
window at the top of the screen. Organization of the child
windows within the main application window can easily be
accomplished using the commands under the Window menu.
Individual windows can be created, hidden from view, recalled,
and arranged in a variety of different configurations. In addition,
all of the window sizing controls are available as they are in most
Windows applications.
NOTE: If you require further explanation of the operation of the MDI within
Windows, or additional detail on Microsoft Windows itself, refer to the
Star Workstation Operation Manual, or the Microsoft Windows User's
Guide.
03-914774-00:4
18
Page 23
T
UTORIAL
: C
ONFIGURING POLYVIEW
Tutorial: Configuring PolyView2000 Windows
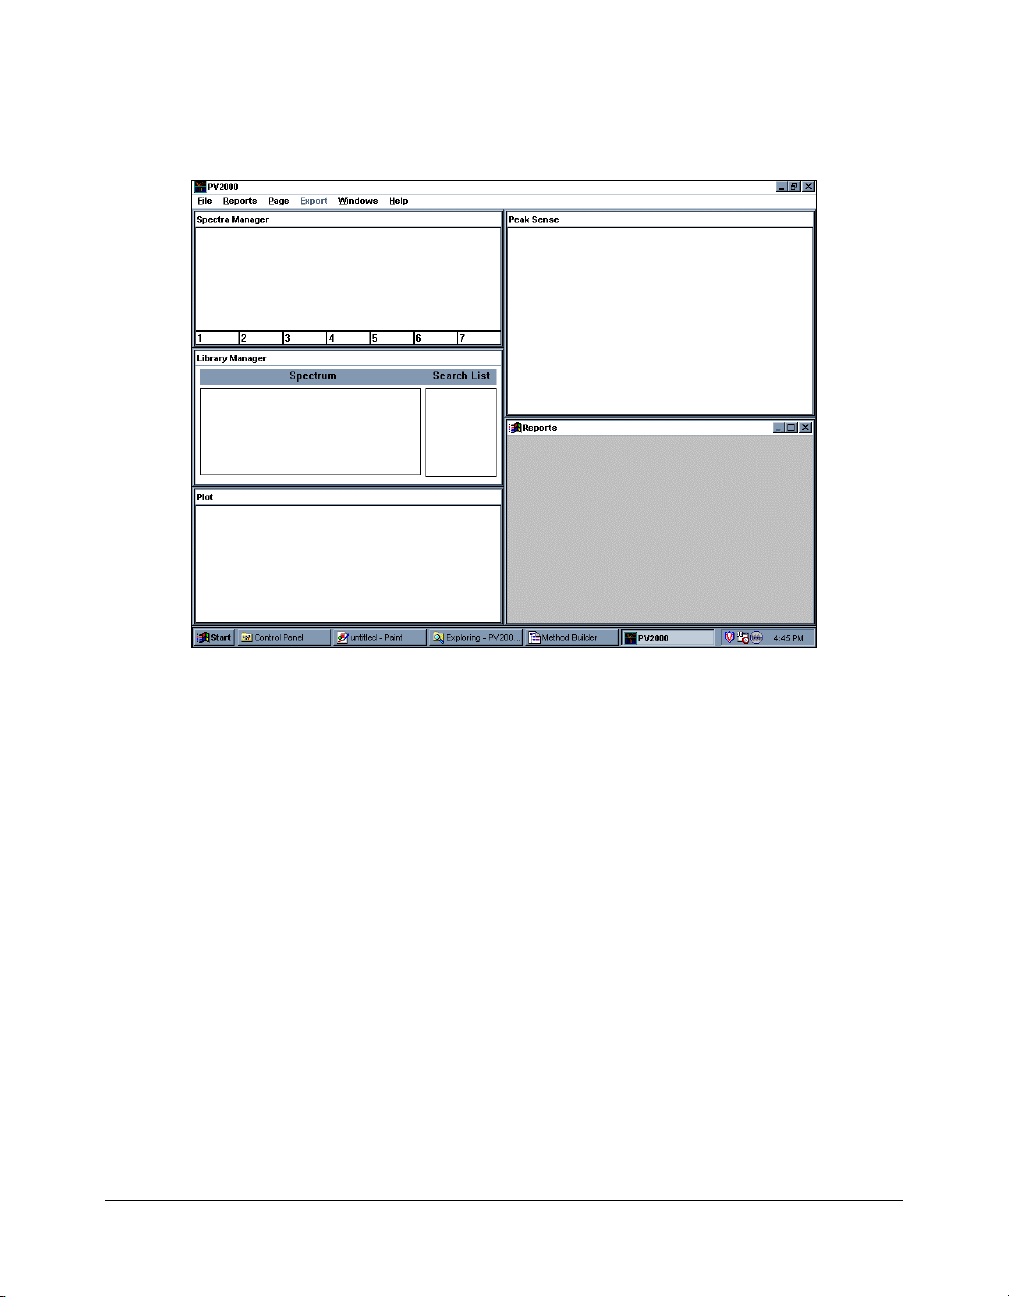
On the Star Tool Bar, double-click on the PolyView2000 icon.
The application opens with the screen split between the Spectra
Manager, Library Manager and Plot windows with the focus on
the Plot Window.
PERATION
O
2000 W
INDOWS
PolyView2000
TM
PolyView2000 Configuration Upon Start-Up
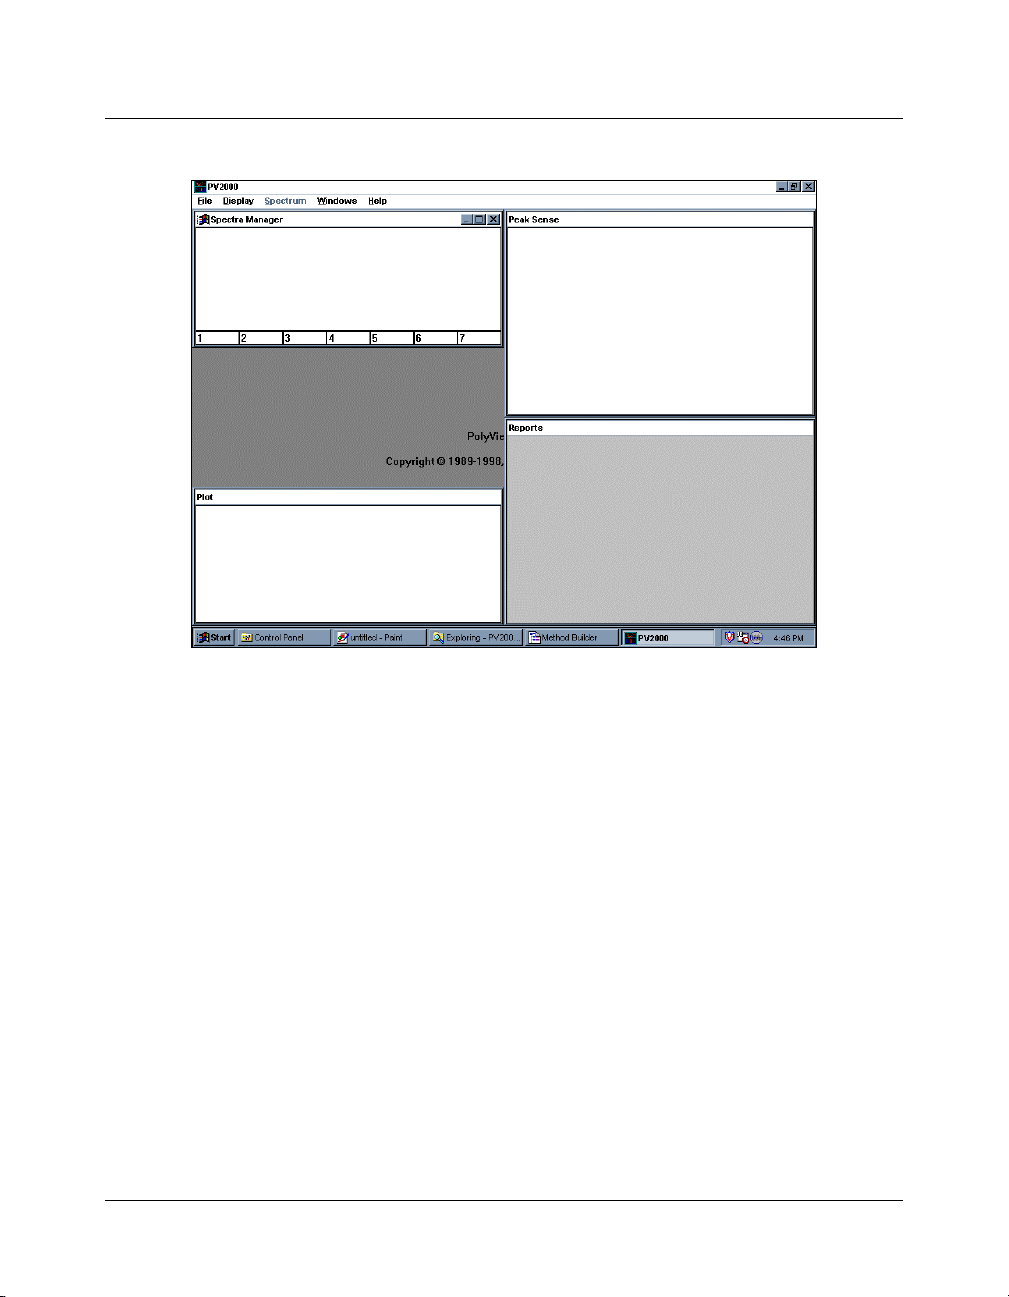
All of the windows can be sized using the border controls and the
sizing control in the upper right corner of each child. In addition,
the main application window can be sized using its borders and
controls when it is not maximized. The one restriction is that all
the child windows must always remain within the confines of the
main application window. Practice some of these window sizing
functions and make the screen appear as shown below.
19
Page 24
PolyView2000 Window Configured to Increase
Spectra Manager Area
The number and type of windows displayed within the
PolyView2000 main application window are controlled using the
Window menu. This menu is visible and available at all times.
• Create a Reports window by selecting New Reports
Window under the Window menu.
• Repeat this process, but this time select a Peak Sense
window. These windows, like all the others, can be moved
and sized to any configuration desired using standard
Windows methods. But, don't do that now. There is a much
easier way as you will see in a minute.
Any of the currently active windows within PolyView2000 can be
instantly accessed and displayed full screen.
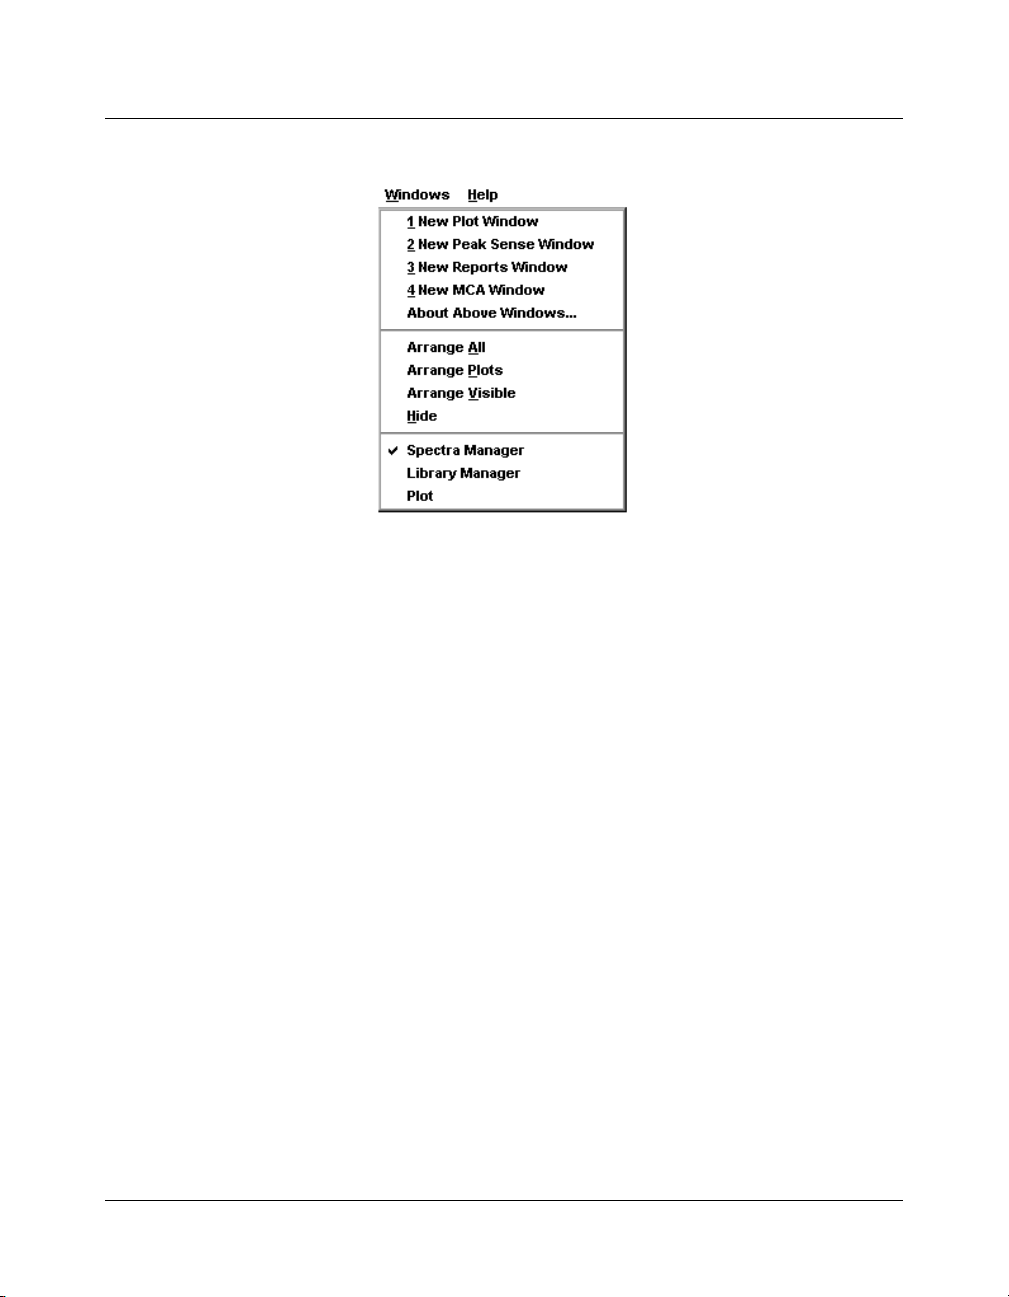
• Drop down the Window menu and note that the five
PolyView2000 windows are listed at the bottom of the menu.
03-914774-00:4
20
Page 25
T
UTORIAL
: C
ONFIGURING POLYVIEW
2000 W
Windows Menu Listing the Currently Active Windows
• Click on Spectra Manager in the Window menu and note that
this window is brought forward.
• You may maximize any window to the full size of the
PolyView2000 window simply by double-clicking on the title
bar of the window you wish to maximize. Try this now, to
maximize the Spectra Manager window.
PERATION
O
INDOWS
PolyView2000
TM
• Any of the open windows can be accessed instantly in this
manner. Multiple copies of the Plot, Peak Sense, and
Reports windows can be active simultaneously and all of
these multiple copies will be listed under the Window menu.
This allows you to rapidly select from a number of
chromatograms that may be currently active within
PolyView2000.
A rapid method is provided that allows you to view all the
currently active windows.
• Drop down the Window menu and select “Arrange All”. The
screen is split between all the windows under the Window
menu.
21
Page 26
Screen Split Among Five PolyView2000 Windows
• Individual windows can be hidden from view also. Click on
the title bar of the Library Manager window to make it the
active window, drop down the Window menu and select
Hide. Notice that the Library Manager is hidden from view,
but it is not removed from the list of active windows (i.e., it
still appears in the list under the Window menu).
03-914774-00:4
22
Page 27
T
UTORIAL
: C
ONFIGURING POLYVIEW
PolyView2000 with Library Manager Hidden from View
PERATION
O
2000 W
INDOWS
PolyView2000
TM
• Now, the remaining windows can be organized. Select
“Arrange Visible” under the Window menu and note that the
screen is partitioned between the four remaining visible
windows.
23
Page 28

PolyView2000 Screen Split Between the Four Visible Windows
• In this way the screen can be rapidly configured to meet the
needs of the PolyView2000 function you are performing.
• Also try “Arrange Plots”.
Except for the Spectra Manager and Library Manager windows,
the individual child windows within PolyView2000 can be closed.
• Drop down the Window menu and select Arrange All.
• Close the Reports, Plot, and Peak Sense windows by
double-clicking in their Control Menu boxes. Note that the
Control Menu box does not appear in a window's title bar
until that window has been selected as the active window by
clicking within it. You may go ahead and double-click where
the Control Menu box would be and the window will be both
selected and closed at the same time.
• Drop down the Window menu and note that these three
windows are no longer listed. It is important to remember the
difference between a window that is merely hidden and one
03-914774-00:4
24
Page 29

that is closed. All data in a window is lost when it is closed,
but simply hiding the window does not destroy the data.
• Close PolyView2000 by double-clicking on the Control Menu
box in the main application window.
Plotting a Chromatogram
With the PolyView2000 application, raw data files transmitted
from the Diode Array detector and collected at the Star
Workstation can be plotted, examined on the display screen of
the Star Workstation, and then printed out. The Plot Window,
within the PolyView2000 main application window, is used to
perform these functions. There are a variety of different plot
types available in PolyView2000, each expressing the raw data
in a different format. See On-Line Help (Help:Plot Manager) for
an explanation of the different types of plots available and their
uses. In the following Tutorial, the basics of chromatogram
plotting are covered. In subsequent Tutorials, some of the more
functional aspects of the chromatogram plots, such as their use
in the determination of peak purity, will be addressed.
PERATION
O
P
LOTTING A CHROMATOGRAM
NOTE: It is not the purpose of this Tutorial to cover every possible function in the
Plot window. However, the basic functions are covered. For information
on those functions not covered, such as those under the Peak Events
menu, refer to On-Line Help.
In the following Tutorial, some of the files in the EXAMPLES directory will
be modified and/or created. Prior to performing this Tutorial, you should
ensure that you are working with original copies of the data files called
for. If you are not sure whether these files have been modified by
previous use of the Tutorial, reinstall the PolyView2000 software from the
CD using your serial number.
PolyView2000
TM
25
Page 30
Tutorial: Plotting a Chromatogram
On the Star Tool Bar, double-click on the PolyView2000 Spectral
Processing icon. The application starts with the screen split
between the Spectra Manager, Library Manager and Plot
windows with the focus on the latter. To plot a chromatogram:
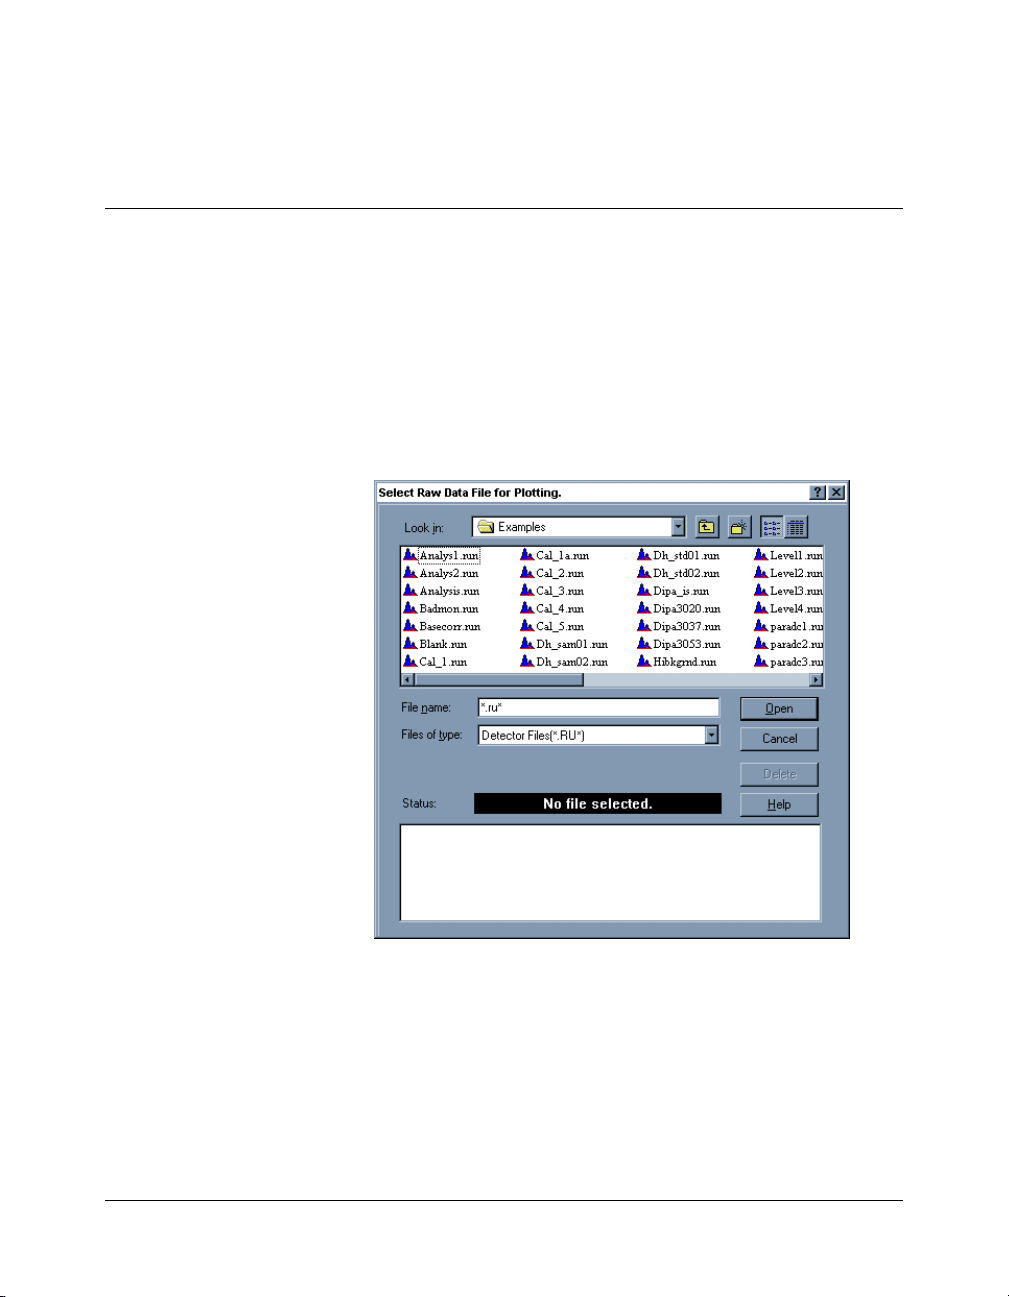
• Drop down the File menu and select Open File... . A dialog
box is displayed that lists directories and files with the
extension .RUN. Press the “Help” button for more
information on the operation of file selection dialog boxes.
File Selection Dialog Box
• Select the EXAMPLES directory from the list and note that
the Path field should display: C:\Star\Examples.
• Click once on a .RUN file. Try BASECORR.RUN. Notice that
the fields at the bottom of the screen fill with information
about this file. The Status field indicates that a valid file has
been selected. If you had selected a non-diode array file, an
error message in red would have been displayed instead.
03-914774-00:4
26
Page 31

PERATION
O
T
UTORIAL
: P
LOTTING A CHROMATOGRAM
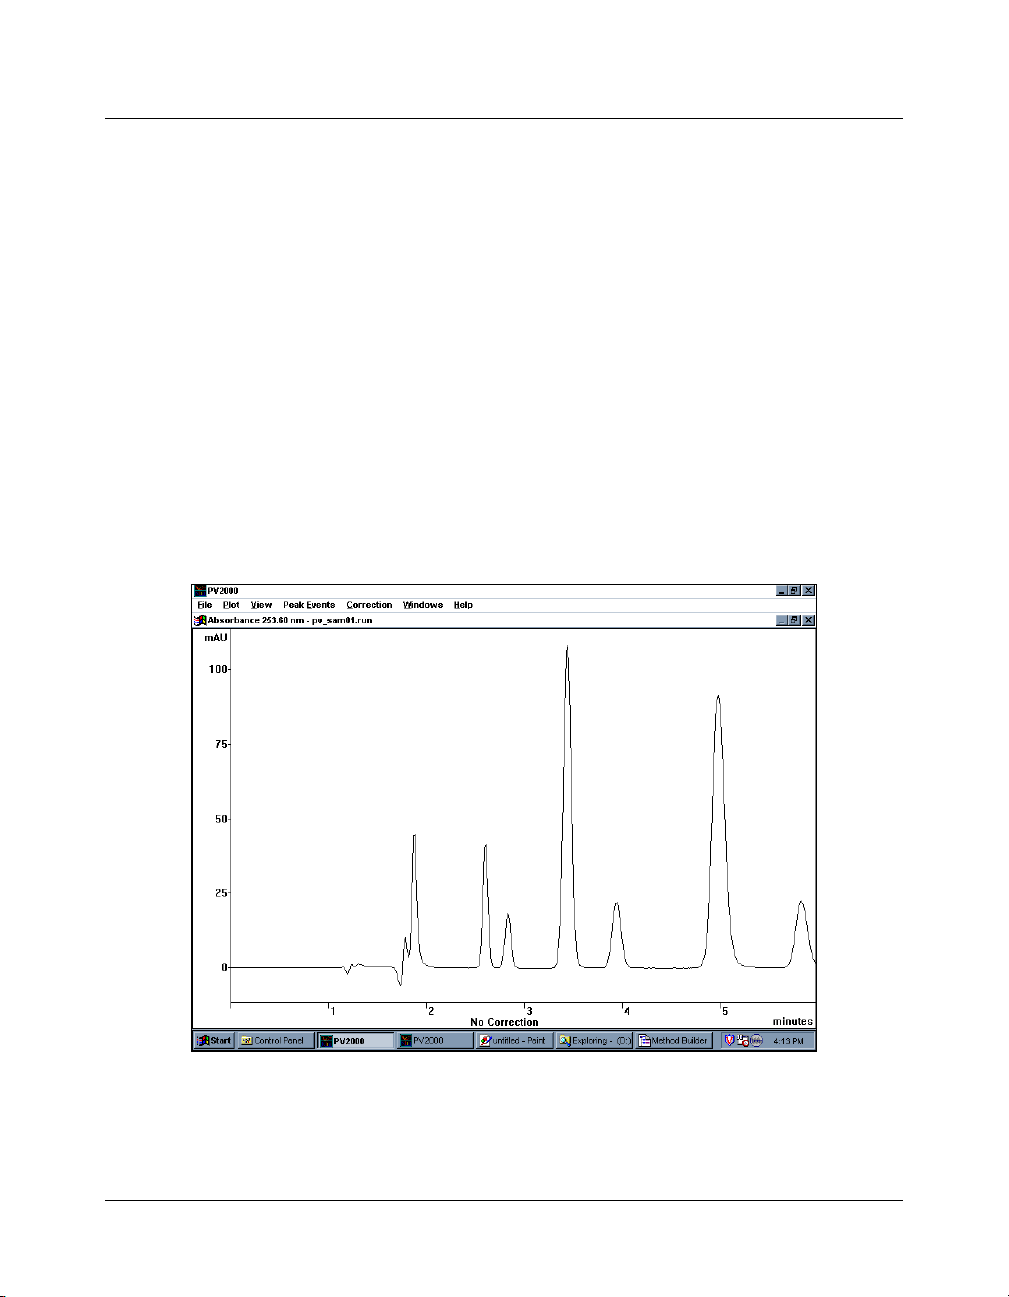
• Click on OK to accept this file. The absorbance
chromatogram at 253.6 nm is plotted in the Plot window at
the bottom of the screen. The plot is autoscaled on the Yaxis and is plotted from time 0.0 to the end of the run
• Use the Select Plot Parameters command in the Plot menu
to plot the absorbance at 210 nm instead. If the plot goes off
scale, double click to the left of the absorbance scale when a
double headed arrow appears.
PolyView2000
TM
BASECORR.RUN in the Plot Window
Many PolyView2000 functions can be performed with the window
in this configuration, but there are many ways to alter the viewing
of the chromatogram. Maximize the Plot window (click on the box
with a solid line above it in the upper right hand corner of the
Plot window). This enlarges the chromatogram to full screen.
27
Page 32

Full Chromatogram
More detail in the chromatogram can be seen by utilizing the
zoom functions. Zooming in PolyView2000 is accomplished by
the drag method, the same as in the Interactive Graphics
application.
• Using the mouse, position the cursor below the baseline just
to the left of the peak at 7.2 minutes. Press the left mouse
button and hold it down as you drag the mouse diagonally
toward the upper-right portion of the peak. The portion to be
zoomed will appear in reverse video and when the mouse
button is released, the plot will be zoomed.
03-914774-00:4
28
Page 33

T
UTORIAL
Plot Window Zoomed in on a Peak
PERATION
O
: P
LOTTING A CHROMATOGRAM
PolyView2000
TM
• The plot can be zoomed again to observe even more detail.
Try zooming the top portion of the peak.
• Pressing the Escape (ESC) key during the drag process
aborts the zoom process.
To restore the scaling in effect prior to the latest zoom, drop
down the View menu and select Previous. The plot is returned to
the full peak. Selecting Previous again restores the zoomed top
portion of the peak and thus functions as a toggle to switch
between two zoom selections.
The full time range can be restored by positioning the cursor just
below the time axis and double-clicking with the left mouse
button. Note that the cursor changes to a double-headed arrow
indicating that the plot will be restored to its full X-axis scaling.
Similarly, the full Y-axis scaling can be restored by doubleclicking the mouse with the cursor positioned to the left of the Yaxis. Both can be restored simultaneously by double-clicking in
the lower left corner. Try these functions now and restore the
29
Page 34

scaling to its original setting when the chromatogram was first
displayed.
NOTE: Chromatogram zooming can also be controlled using the commands under
the View menu. See On-Line Help (Help:Commands) for an explanation of
these menu items.
To change the plot configuration (type, wavelength, etc.), drop
down the Plot menu and click on the Select Plot Parameters
menu item. This displays a dialog box that is used to specify the
type of plot and features. The X and Y scales can be set here,
the peak events can be turned on and off, and the wavelength
range can be selected. Many of these features will be covered in
future Tutorials.
The Select Plot Parameters Dialog Box
For this exercise:
• Change the events list box in the lower right corner to Draw
Apex Events.
• Set the wavelength range to 220-366 nm using the
Wavelength Range scroll boxes by either scrolling to the
proper number or typing the number. Type the left hand
lower wavelength first and then the right hand higher
wavelength.
03-914774-00:4
30
Page 35

PERATION
O
T
UTORIAL
: P
LOTTING A CHROMATOGRAM
NOTES: For many PolyView2000 functions where either a single wavelength or a
wavelength range can be set, setting the right hand scroll box with cause
both boxes to have the same wavelength. Setting the right hand scroll
box will not effect the left hand box. Therefore, to set a single
wavelength you only need to set the right hand scroll box.
Checking the “Save as default parameters dialog” check box will save
this plot type and condition (except time and scale ranges) and make
them the default conditions for any plot windows created later, even in
other sessions of PolyView2000. Do not check it at this time.
• Click on the OK pushbutton. The chromatogram will be
plotted using the average absorbance in the range of
220.00-366.00 nm with only peak apex events drawn. Notice
that the original absorbance scaling was maintained.
To autoscale, simply double-click in the left margin of the Plot
window. To prepare for the next step, zoom in on the peak at
19.3 minutes.
PolyView2000
TM
BASECORR.RUN Displayed at 220.00-366.00
31
Page 36

When spectra are extracted from a chromatogram,
PolyView2000 automatically corrects them for background
absorbance. Several different types of correction are available
and are set in the Correction menu.
The default is baseline but other types are available, including
the selection of one or more spectra in the file to use as a
reference to which all others are corrected. The current
correction method is indicated below the time axis. Let's try that
function now:
• Drop down the Correction menu and select Reference. A
dialog box appears that prompts you to select the reference
spectra.
• Move the cursor to any point of the chromatogram left of the
peak at 19.3 minutes, and press the left mouse button once.
A vertical line is drawn to indicate the reference spectrum.
Define another reference spectrum right of the peak, then
press OK to indicate that you are done defining the
reference spectra. The baseline is redrawn to indicate the
change. The correction is interpolated between reference
spectra, and uses the outermost reference spectra to correct
spectra extracted from the corresponding regions. The
correction method can easily be changed to a different mode
by making a
different selection in the Correction menu.
03-914774-00:4
32
Page 37

T
UTORIAL
: P
LOTTING A CHROMATOGRAM
BASECORR.RUN with Reference Correction
PERATION
O
PolyView2000
TM
• Make the correction method Peak Start and note that the
red lines under each peak originate from the peak start event
and project horizontally.
The effect of the baseline
will
be demonstrated in the next Tutorial.
correction mode on extracted spectra
Associated with each .RUN file is information that describes the
conditions under which it was collected (date, time, etc.). Within
PolyView2000, some of this information can be viewed and
edited.
• Under the File menu, select Edit File Information. A dialog
box will appear that allows you to edit selected fields. Fields
that can be edited are enclosed in boxes and they are edited
by standard Windows techniques.
33
Page 38

The Edit File Information Dialog Box
• Type your name in the Operator field and add any comments
into the Notepad.
• Click on OK to write the new information into the disk file for
BASECORR.RUN.
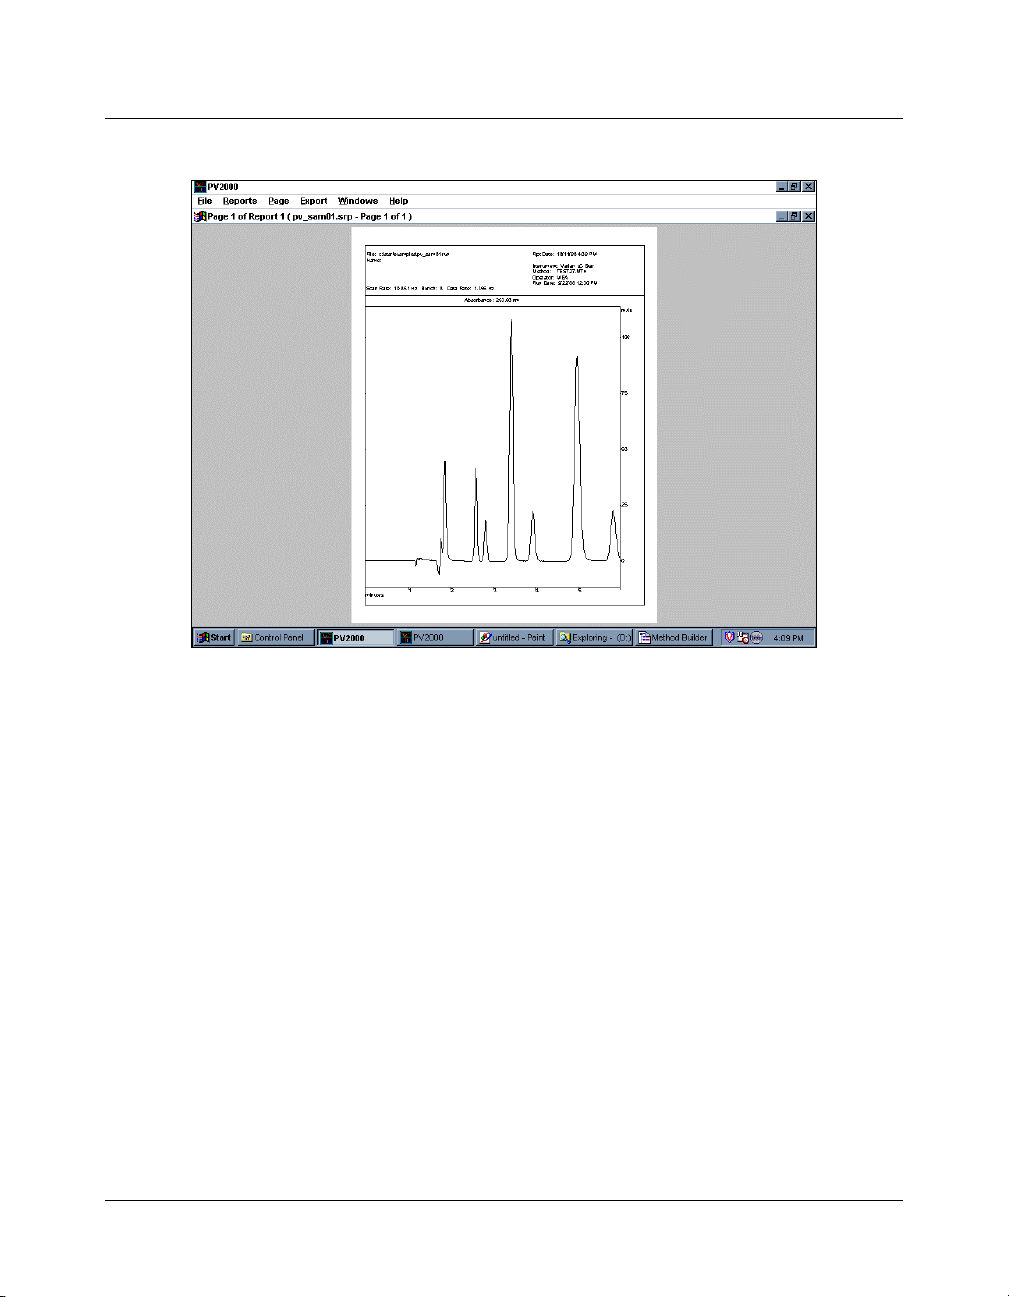
To print a chromatogram from PolyView2000, select the Print
Plot command under the File menu and the chromatogram will
be printed on the current Star Workstation printer. See Appendix
A for an example of this interactive plot report.
Close PolyView2000 by double-clicking on the Control Menu box
in the main application window.
03-914774-00:4
34
Page 39

E
XAMINING SPECTRA FROM A CHROMATOGRAM
Examining Spectra from a Chromatogram
The primary advantage of a diode array detector such as 330 is
the availability of spectra at all points in the chromatogram.
These spectra provide valuable qualitative data on the nature of
an eluting peak. Using the PolyView2000 advanced baseline
correction routines, the spectra extracted from a chromatogram
are free of errors due to any background solvent absorbance and
reflect only the spectra of the eluting compound. Within
PolyView2000, the primary spectra handling utilities are provided
in the Spectra Manager window. This window provides a
temporary storage location for up to seven UV spectra. The
spectra that are held in these spectrum registers are available for
a variety of spectral processing and reporting functions. In
addition, the window serves as a temporary storage location for
spectra before they are transferred to the Library Manager
window for inclusion in a disk library or as the target of a library
search.
The spectral processing functions available include the
calculation of Purity Parameter statistics, the optimization of
Purity Parameter spectral ranges and the arithmetic combination
of spectra. Details on these functions can be found in On-Line
Help (Help:Commands:Spectrum).
PERATION
O
PolyView2000
TM
The following two Tutorials cover the Spectra Manager functions.
As you are going through these Tutorials, keep in mind that there
may be more than one way to perform many of these functions.
An attempt has been made to present the most straightforward
method. With experience, you may find that an alternate way of
accomplishing the function may be more suited to your
application. Feel free to explore these alternate command paths.
35
Page 40

Tutorial: Spectral Plots
On the Star Workstation Star Tool Bar, double-click on the
PolyView2000 Spectral Processing icon. The application starts
with the screen split between the Spectra Manager, Library
Manager and Plot windows with the focus on the latter.
Configure the screen to display the Spectra Manager window
and the Plot window.
PolyView2000 Screen without Library Manager
Plot out the data file BASECORR.RUN from the EXAMPLES
directory in the Plot window at 210 nm with Apex and Inflections
events displayed (see the Tutorial: Plotting a Chromatogram).
Spectra are extracted from the chromatogram and transferred to
the Spectra Manager window by clicking the mouse at the
desired point in the chromatogram. Try that now:
03-914774-00:4
36
Page 41

O
T
UTORIAL
: S
PECTRAL PLOTS
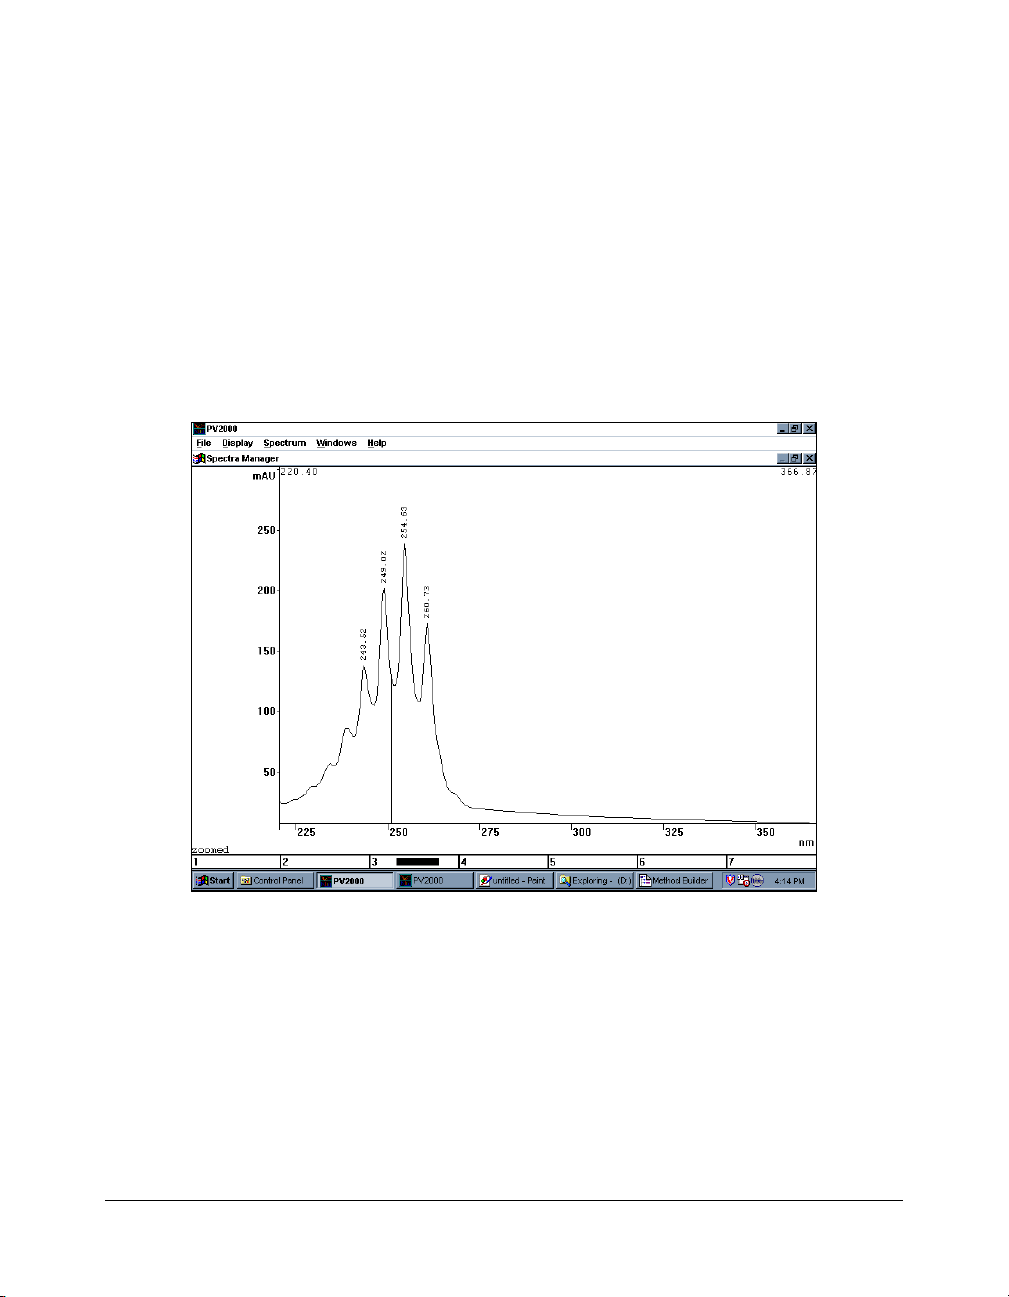
• Zoom in on the peak at 7.3 minutes and extract three
spectra at the apex and the front and back inflection points.
Notice that each time you click on the chromatogram, a
spectrum for that peak appears in the Spectra Manager
window and the point in the chromatogram where the
spectrum was extracted is marked with a corresponding
colored line. Move the cursor to the Spectra Manager display
and zoom on the spectra until your screen should look
similar to the figure below.
PERATION
PolyView2000
Overlaid Spectra, and Markers on the Chromatogram
The graphics display in the Spectra Manager window is
controlled through a set of commands in the Display menu. Try
some of these now:
• First, click on the title bar of the Spectra Manager window to
make it the active window.
TM
37
Page 42

Normalized Spectra
• Drop down the Display menu and select Normalized. Notice
that the three spectra are now normalized over their entire
wavelength range. You can compare them over a limited
range by zooming on the range as shown. This allows you to
compare their shapes.
• Drop down the Display menu again and select Single Plots.
In this mode, only one spectrum is displayed at the time.
Use the numbered colored buttons at the bottom of the
Spectrum Manager Window to choose which spectrum you
want to display.
The wavelength scale for the Spectra Manager window is
variable depending on the wavelength of data that was collected.
For the 9065, this is 190 to 367 nm (the limits of the 9065 diode
array detector). For the 330 Diode array detector, this is the
range over which the data was taken. If spectra from different
diode array runs are compared where the range of wavelengths
for the data is different, the widest range needed to encompass
all of the data is used. When the spectra is zoomed, the entire
screen is considered the working range. The wavelength flags
03-914774-00:4
38
Page 43

PERATION
O
T
UTORIAL
: S
PECTRAL PLOTS
that appear at the top of the Spectra Manager display indicate
this range. This is the range considered when normalizing plots
and in performing some of the math functions addressed in the
next Tutorial. The range can be quickly altered by zooming in the
Plot window. Try that now:
• Zoom (using the click and drag method) the Spectra
Manager window in the region between 250 and 300 nm.
The seven numbered boxes at the bottom of the Spectra
Manager window screen represent the seven spectra storage
registers in this window. When a spectrum is in one of the
spectrum registers, a colored rectangle appears in the box. A
filled rectangle means that the spectrum is currently displayed,
while an empty rectangle indicates that the register position
contains a spectrum but it is not currently displayed. You can
turn on and turn off which spectra are displayed by clicking in the
numbered boxes containing spectra.
Try that now. Point to the second box and click the mouse.
Notice that the first spectrum was turned off, since Single Plots
was selected. If Multiple Plots had been currently selected, this
action would simply turn on and off that particular spectrum.
Double-clicking on a particular box calls up that spectrum for
editing. This feature will be covered in the Tutorial:Building and
Editing a Library.
Spectra can be removed from the Spectra Manager window
using the controls under the Spectrum menu.
Drop down the Spectrum menu and select Delete Displayed
Spectra.
NOTE: All spectra in the display area are removed. A deleted spectrum is
actually removed from the window and cannot be recalled without going
back to the Plot window and extracting it again.
• Drop down the Spectrum menu and select Delete All
Spectra. Note that all of the boxes at the bottom of the
screen are empty, indicating that there are no spectra left in
the window.
PolyView2000
TM
39
Page 44

Now let's utilize the display functions you have learned to
address a practical problem: the determination of peak purity.
Using these spectrum display controls, you can quickly compare
different spectra from within one eluting peak for an indication of
peak purity.
• In the Plot window, open PV_SAM01.RUN and zoom in on
the fourth peak in the chromatogram at 3.45 minutes.
• Transfer spectra from the front and back portions of this
peak to the Spectra Manager window.
• In the Spectra Manager window, configure the display for
Multiple plots, 190.00-366.60 nm and Normalized.
(Remember to click on the title bar to activate the Spectra
Manager window.)
• Turn on both spectra and note that they do not overlay
perfectly, indicating the presence of co-eluting compounds in
what appeared to be a single homogeneous peak. While
visual overlays like this are useful for peaks with substantial
impurities, numerical approaches, detailed in the next
Tutorial, are less subjective and can be statistically
validated.
• To see the results of this exercise on a pure peak, repeat
this on the peak eluting at approximately 5.0 minutes and
observe how well the spectra are overlaid.
To print reports of spectra extracted from a chromatogram, click
on the Spectra Manager title bar, then drop down the File menu
and select Print Spectra. The report will either be a single
spectrum report (if the window currently is displaying one
spectrum) or a spectral overlay, if multiple spectra are currently
displayed on the screen. (See Appendix A for example of the two
types of reports).
Do not close PolyView2000. Instead, go on to the next Tutorial.
03-914774-00:4
40
Page 45

Tutorial: Spectral Math Functions
A variety of spectral processing functions are available in the
Spectra Manager window that help in the evaluation of spectral
.
data
• Using the procedures from the previous Tutorial, transfer two
spectra from the upslope and downslope portions from the
impure peak at 3.45 minutes in PV_SAM01.RUN to the
Spectra Manager window.
• Configure the window to display multiple plots between 190
and 367 nm with the ‘Normalized’ setting. The vertical lines
in the Spectra Manager window correspond to the Purity
Parameter calculated for each spectrum.
T
UTORIAL
PERATION
O
: S
PECTRAL MATH FUNCTIONS
PolyView2000
Upslope and Downslope Spectra
from the Peak at 3.45 Minutes in PV_SAM01.RUN
TM
41
Page 46

• Display the numerical value for these Purity Parameters by
dropping down the Spectrum menu and selecting View
PuPs. In the dialog box, you can change the wavelength
range for the Purity Parameter calculation and the values are
instantly recalculated.
NOTE: In PolyView2000, Purity Parameter is often abbreviated PuP.
• Close the Purity Parameters dialog box by double-clicking on
its Control menu box.
The Purity Parameter in PolyView2000 is a primary means to
distinguish between different spectra. However, the ability to
discriminate between spectra is highly dependent on the
wavelength range over which the calculation is made.
PolyView2000 provides a means to optimize the wavelength
range used in this calculation. Drop down the Spectrum menu
and select Optimize PuP. Notice that the cursor is replaced with
the hourglass, indicating that the Star Workstation is calculating.
Following completion of the calculation, select Yes in the
informational pop-up and the wavelength range in the Spectra
Manager window is set to the values that result in the optimum
separation of Purity Parameter values for the displayed spectra.
03-914774-00:4
42
Page 47

T
UTORIAL
: S
PECTRAL MATH FUNCTIONS
Screen Display Following Optimization of the Purity Parameter
PERATION
O
PolyView2000
TM
The optimum range for your spectra may not exactly match that
shown, since it is dependent on exactly where in the peak that
the spectra were extracted.
The Optimize PuP function is particularly useful for determining
the proper wavelength range to use in assessing peak purity
using Purity Parameter plots (see Determining Peak Purity on
page 71).
For the next two exercises, replace the spectra in the Spectra
Manager window with three spectra corresponding to the
upslope, downslope, and apex of the pure peak at 5.0 minutes in
PV_SAM01.RUN. Configure the Spectra Manager window to
display Multiple Plots, Normalized in the range 190-367 nm. The
screen should appear as shown below.
43
Page 48

Screen Display of the Three Spectra
Extracted from the Peak at 5.0 Minutes in PV_SAM01.RUN
The statistical variation in the Purity Parameters for a number of
spectra can be calculated.
• Drop down the Spectrum menu and select Do Statistics.
• A dialog box appears that lists all the spectra in the window,
their correlation values, average and standard deviation.
Initially, the wavelength range is set to what is selected in
the spectrum window. Statistics over alternate ranges can
also be calculated.
03-914774-00:4
44
Page 49

T
UTORIAL
The Purity Parameter Statistics Dialog
PERATION
O
: S
PECTRAL MATH FUNCTIONS
PolyView2000
TM
• Check the Accumulate Info box, change the wavelength
range to 220-366.6 nm, and click on the Calculate
pushbutton. Data for the new range is added to the original
data.
• Try several more ranges and note that the statistics report
lengthens. The entire report can be viewed using the
scrolling controls to the right of the report.
• Select the Print pushbutton to obtain a printed report of the
calculations (see Appendix A for an example of the PuP
statistics report) for an example of the PuP statistics report).
• The Purity Parameter statistics can be used to help in
deciding the significance of subtle differences in values
among several different spectra and for establishing
expected correlation values for library searches.
• By entering a Purity parameter target and/or a standard
deviation in the fields composing the PuP Target group, you
can express the purity parameter statistics relative to a
standard. If filled, the Name field will be added to the report.
45
Page 50

• Close the Statistics dialog box by double-clicking on its
Control menu box.
Spectra can be combined arithmetically in the Spectra Manager
window.
• With the screen configured as above, drop down the
Spectrum menu and select Do Arithmetic. The Spectra
Arithmetic dialog box will appear with all current spectra
displayed.
The Spectra Arithmetic Dialog Box
• Edit the factor fields just to the right of each spectrum by
replacing the 0.0 with 0.333.
• Set the wavelength range to 190-367 nm and select
Compute.
• The spectrum that appears in the large graphics display is
the average spectrum, since factors of 0.333 were used for
each of the three source spectra. From here, the calculated
spectrum can be sent to the Library Manager or the next
storage location in the Spectra Manager.
Close the PolyView2000 application by double-clicking on the
Control Menu box in the main application window.
03-914774-00:4
46
Page 51

PERATION
O
P
ERFORMING LIBRARY FUNCTIONS
NOTE: Spectra arithmetic functions are particularly useful for preparing spectral
libraries which contain averaged spectra resulting from several different
injections. To do this, transfer apex or area spectra from several different
injections of a standard solution to the Spectra Manager window.
Average the spectra using the spectra arithmetic functions and transfer
the resulting spectrum to the Library Manager for inclusion in the library.
Performing Library Functions
PolyView2000 incorporates extensive Spectral Library functions.
These capabilities allow the user to match spectra resulting from
the injection of unknown samples with reference spectra
archived in spectral libraries. The Library functions in
PolyView2000 include the ability to build a library from a .RUN
file, edit the library records, search the list of library entries for a
specific name or key word associated with the record, and
conduct spectral searches of the library. Spectral searches can
either involve searching the library for a specific spectrum picked
from a .RUN file or searching a .RUN file for a specific spectrum
from the library. Initially, the library search can be narrowed
down by restricting the retention time and Purity Parameter
match windows. Then, the library spectra that meet these first
criteria are considered and their spectral similarity with the target
spectrum is quantified, providing “Dissimilarity” and “Similarity”
indices. The library operations are some of the most complex in
PolyView2000. They routinely involve the use of three different
windows (Plot, Spectra Manager, and Library Manager) with
movement of data (spectra) between the three windows.
PolyView2000
TM
Like similar operations in other related disciplines (Mass
Spectrometry, Infrared Spectrometry), the library functions in
PolyView2000 provide qualitative information about an eluting
peak by correlating an unknown “target” spectrum with a known
reference spectrum. In UV spectrometry, this task is somewhat
more difficult, since the information content of UV spectra is low
(nearly identical spectra can be obtained from different
compounds) and the spectra obtained can be influenced by a
number of factors (pH, ionic strength, detector non-linearity,
mobile phase absorbance, etc.). Consequently, care must be
taken in the interpretation of data from a Diode Array Detector.
At best, the spectral correlations obtained from library searches
should be used as a means to confirm the identity of an eluting
47
Page 52

peak after taking into account other criteria such as the retention
time comparison with a known standard. In very few cases is it
possible to draw conclusions about the identity of an unknown
based on the UV spectrum alone without reference to a known
standard. The quality of library matches will depend greatly on
the conditions under which the library spectra were saved. It is
important to use the same HPLC conditions when constructing a
library as are to be used in the analysis of unknowns, particularly
if the analytes are sensitive to minor solvent effects. Care must
be taken to insure that the detector and other components of the
system are in good working order to obtain the best library
search results. If in doubt about the quality of the spectra
contained in one of your libraries, it is probably best to reinject
known reference standards and obtain new spectra.
NOTE: For a detailed discussion on how library searches are conducted in
PolyView2000 and how to interpret the results of a library search, see
Library Searches on page 105. for an example of the PuP statistics
report.
In the following Tutorials, the primary library functions will be
covered. Initially, you must “Create” a library disk file for storage
of spectra. A Tutorial will be presented on Building and Editing
that covers the techniques available to place spectra in a library
and to add information to each library record that is helpful in
characterizing it. PolyView2000 provides extensive editing
capabilities for management of your disk libraries. Only the
primary capability of locating a particular library record and
editing its information section will be covered in this Tutorial. In
the last Tutorial, the spectral search capabilities will be covered.
It is important to keep in mind that the results actually obtained in
library searches depend heavily on the nature of the analytes
and the analytical conditions. It is important for each user to
develop criteria based on their particular application for the
interpretation of library search results.
The Tutorials are based on hypothetical standard and sample
chromatograms. The Standard (PV_STD01.RUN) contains
several peaks for which spectra have been archived in the
spectral library provided with PolyView2000 (PV_STD01.LBR).
In the Tutorial, you will be asked to create your own library and
to store spectra in it from PV_STD01.RUN. Your library should
be nearly identical to the one provided (PV_STD01.LBR). Next,
03-914774-00:4
48
Page 53

PERATION
O
P
ERFORMING LIBRARY FUNCTIONS
you will be asked to determine if the peaks in the Hypothetical
sample (PV_SAM01.RUN) match the peaks in the standard.
Both the library you build and the one provided will be searched.
PolyView2000 can have different types of libraries. Because of
the way the spectra are stored in a library, spectra collected with
different wavelength ranges and different bandwidths MUST be
stored in different libraries. (Data collected at different data rates
can be stored in the same library because data rates do not
effect spectral characteristics.) For example, data collected with
a wavelength range of 200 to 400 nm could not be stored in a
library with data collected over a wavelength range 200 to 500
nm. Also, data collected from 2 different diode arrays, e.g. the
9065 and the 330, cannot be stored in the same library.
Even though data with different acquisition parameters must be
kept separate in different libraries, any library can be used to
with any spectrum. The wavelength ranged searched with the
wavelength range of overlap between the particular library and
the target spectrum. For example, if the library has a wavelength
range from 250 to 400 nm and the spectrum was taken from 300
to 450 nm, the target spectrum will be reduced to a spectrum
from 300 to 400 nm and the library search will occur.
PolyView2000
TM
Therefore, it is desirable for most standards which will be used in
a library to take data with the same wavelength and bandwidth.
49
Page 54

Tutorial: Creating a Library
From the Star Tool Bar, double-click on the PolyView2000 icon.
PolyView2000 will open with the three primary windows
displayed.
• Click on the Library Manager title bar to make it the active
window and select Create Library under the Library menu.
• In the file selection dialog box that is displayed, select the
EXAMPLES directory(double-click on it) and then edit the
File name field to assign a name for the library you are about
to create. Name the library MYLIB.LBR and select OK. If the
file already exists, you need to delete it first. This can be
done by pressing the Cancel button, then executing Library:
Open to select MYLIB.LBR, then Library: Delete to delete it.
After the name for the new library is selected, the required disk
file is created and the library becomes the Current Library in the
Library Manager window. A dialog box is displayed that allows
you to add information to the library header. In the dialog box,
add whatever information you like to the three fields and select
OK.
The Edit Library Information Dialog
Don't close PolyView2000. Instead, go on to the next Tutorial.
03-914774-00:4
50
Page 55

PERATION
O
T
UTORIAL
: C
REATING A LIBRARY
NOTE: It is important to distinguish how the Library Manger addresses different
libraries. All libraries are maintained as disk files just as any other DOS
file in the Star Workstation. The Library Manager maintains a list of those
.LBR files to address during searches, called the Search List. In addition,
one library can be designated as the “Current Library” for the Library
Manager window. The Current Library is the one that is currently open
for adding, editing, and deleting spectra, and is listed in the title bar of
the Library Manager window. Libraries are added to the search list using
the Add to List command in the File Selection dialog box. Also, when a
new library is created, it becomes the current library and is added to the
search list. A shortcut to making one of the libraries in the search list into
the Current Library is to double-click on its name in the search list.
PolyView2000
TM
51
Page 56

Tutorial: Building and Editing a Library
Be sure to complete the previous Tutorial on creating a library.
The screen should now display the three primary PolyView2000
windows and MYLIB.LBR should be the only library in the
Search List in the Library Manager window.
To place a spectrum into a library, you must first extract it from
the .RUN file and transfer it to the Spectra Manager window.
• Click on the title bar of the Plot window to make it the active
window.
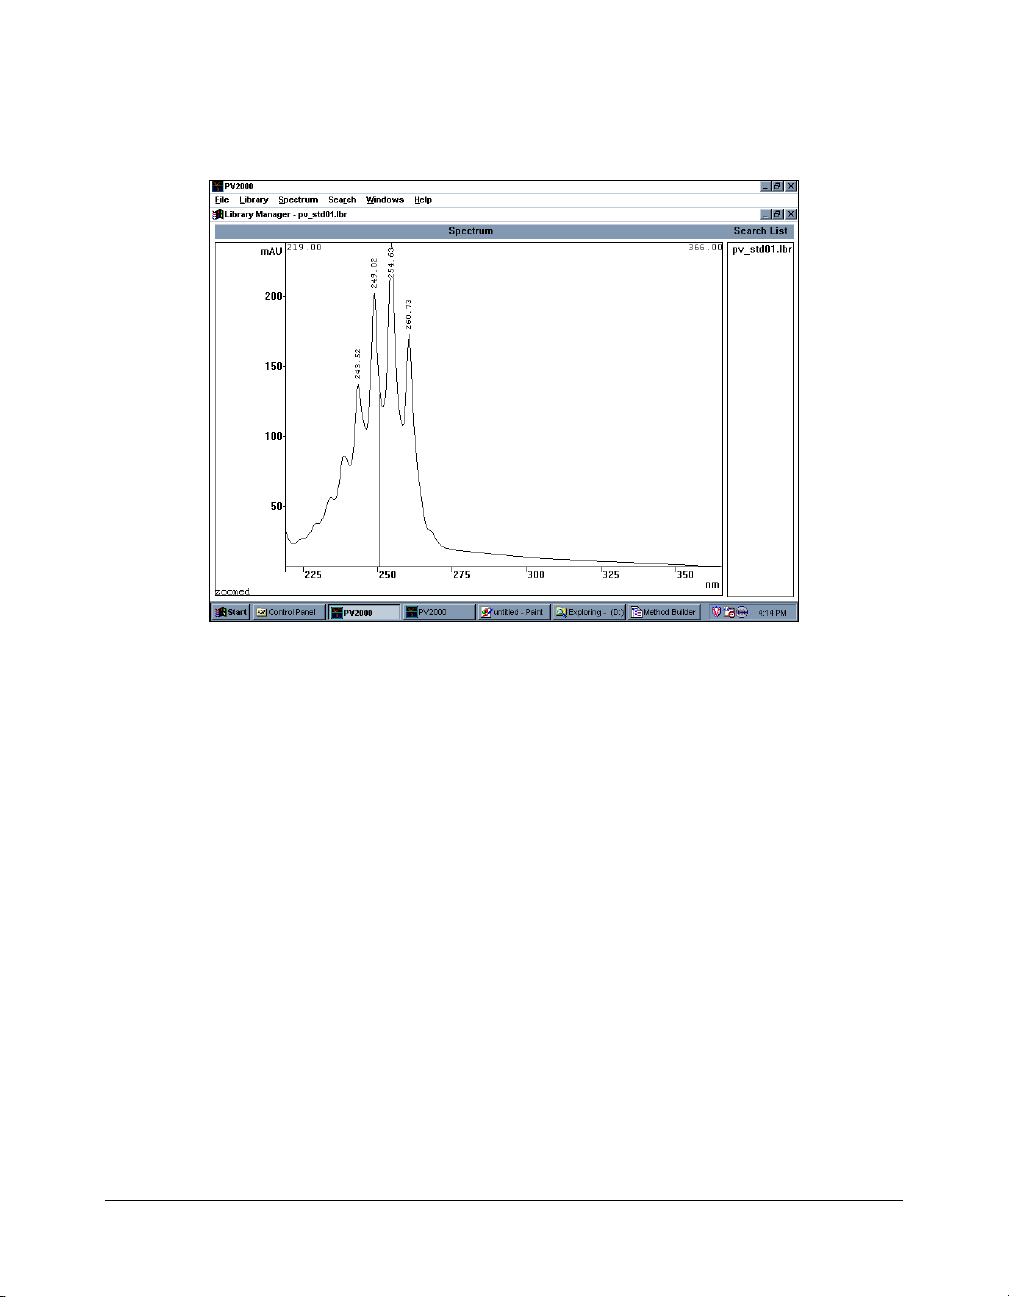
• Plot out the absorbance chromatogram of PV_STD01.RUN
at 253.6 nm (refer to Plotting a Chromatogram on page 2.
• Transfer a spectrum from the apex of each peak to the
Spectra Manager window Examining Spectra from a
Chromatogram on page 35.
Screen Configuration for Building a Library File
03-914774-00:4
52
Page 57

PERATION
O
T
UTORIAL
: B
UILDING AND EDITING A LIBRARY
• Click on the title bar of the Spectra Manager window to make
it the active window.
• Select Edit Spectra in the Spectrum menu.
A dialog box is displayed, that allows you to view and edit a
variety of information that is attached to each spectrum in the
Spectra Manager. This information, along with the spectrum itself
constitutes the “Spectrum Record” that can be transferred
between the various PolyView2000 windows and becomes a
permanent part of the disk file when it is stored in the Library.
The number in the upper left corner of the dialog box indicates
which of the seven spectrum registers you are currently viewing
and editing.
PolyView2000
TM
The Edit Spectra Dialog Box
• Initially, change the Valid wavelength range to 200-366.6 nm
(select Edit in the Valid Wavelength range box and set the
new range in the small dialog box that appears).
53
Page 58

• Add or alter any information you would like in the five edit
fields (Name, Note, Operator, Method and Instrument).
Name the peak Compound #1.
• Once this has been completed, you can obtain a printed
report of the spectrum and its associated information. Select
the Print pushbutton and wait for the report to be printed.
Select Next to access the next spectrum in the Spectra Manager
window. Note that you must verify the edited changes. Select
Yes. Continue editing the spectrum information sections for each
of the six spectra in the Spectra Manager window. At this point in
the Tutorial, all of the spectra and their associated information
sections are temporarily stored in the Spectra Manager window.
They are not yet part of the library.
After the last spectrum in the Spectra Manager window has been
edited, select Quit. You are now ready to begin adding these
spectra to the library (MYLIB.LBR).
• In the Spectra Manager window, select Single Plots under
the Display menu. The spectrum in register position #1 is
displayed.
• Next, select To Library Manager under the Spectrum menu.
The displayed spectrum in the Spectra Manager window is
transferred to the single spectrum register in the Library
Manager window (i.e., it becomes the Current Spectrum in
the Library Manager). Add it to the Library by selecting Add
Spectrum to Library in the Library menu.
NOTE: In PolyView2000, multiple spectra can be transferred from the Spectra
Manager window to the Library Manager window and added to the
current library in a single step.
• To add the other spectra in the Spectra Manager window to
the library, go back to the Spectra Manager window and
select Multiple Plots under the display menu. Then, click on
the boxes under the spectra to de-select spectrum # 1 and
select spectra #2 through #6.
• Next, select To Library Manager under the Spectrum menu.
You will be told that since multiple spectra are selected, you
cannot change the Library Manager’s current spectrum, and
03-914774-00:4
54
Page 59

PERATION
O
T
UTORIAL
: B
UILDING AND EDITING A LIBRARY
asked if you want to add the 5 selected spectra to the
current library. Answer Yes.
NOTE: After the transfer of multiple spectra, a small message window informs
you of the success of the operation and disappears after a few seconds.
You can close this message window earlier by pressing the Enter key or
clicking on the window.
At this point, the library should contain spectra for all the peaks
in PV_STD01.RUN. In the Library Manager window, select
Select/Edit Library Record under the Edit menu. Notice that all of
the spectra added to the library are listed.
A library can be searched for key words (in the Name and
Notepad fields of each record) as a rapid means of locating a
desired record. Try that now:
• Select Change Parameters.
• Type a key word in the Search Text field that can be found in
the Name or Notepad fields of only one of the records.
PolyView2000
TM
• Check the Search in Name and Search in Notepad boxes
and select Do Search.
Notice that the list of records is updated to include only those
with the specific key word. The other records are still in the
library, but are not displayed in the list.
Individual records in the library can be edited or deleted.
• First, list the entire library by doing a key word search with
only a space (use the space bar) in the Search Text field.
Then, select one of the records from the list in the List
Library Records dialog box by pointing and clicking with the
mouse.
• Select Edit Record. A dialog box appears that is very similar
to the Edit Spectra dialog box in the Spectra Manager
window. This is your interface to the actual data stored on
disk in the library. You can alter the information stored for
that particular spectrum or delete the record from the library
altogether. For more information on the functions available in
this dialog box, press the “Help” button.
55
Page 60

MYLIB.LBR after addition of spectra
The Edit Library Records Dialog Box
03-914774-00:4
56
Page 61

PERATION
O
T
UTORIAL
: C
ONDUCTING A SPECTRAL LIBRARY SEARCH
• Select Quit to close the dialog box.
Don't close PolyView2000. Instead, go on to the next Tutorial to
learn how to conduct spectral library searches.
NOTE: In the above description on building a library, the information associated
with each spectrum (Name, Operator, etc.) was added to the spectrum in
the Spectra Manager window prior to its transfer to the Library Manager.
Alternately, this information could have been added after the spectrum
was transferred to the Library Manager window. The spectrum
information fields are accessible after the spectrum becomes a part of
the disk library and this information could have been edited after all
spectra were in the library (see the above Tutorial). Also, the information
is accessible when the spectrum is the Current Spectrum in the Library
Manager window (i.e., after it is transferred from the Spectra Manager
window but before it is added to the library). To access the Current
Spectrum in the Library Manager, select Edit Spectrum under the
Spectrum menu. When the desired information has been added, the
spectrum can be added to the library directly. In building libraries, use
whatever method seems the most straightforward for editing the
information associated with the spectra and adding them to the library.
Tutorial: Conducting a Spectral Library Search
The first step in conducting a library search is to extract a
spectrum for the peak of interest from the .RUN file.
• In the Plot window, select Open File under the File menu.
• In the file select dialog box, locate PV_SAM01.RUN and
double-click on it. The file will be plotted in the window and
for this Tutorial, the default plot conditions can be used.
• In the Spectrum Manager, select Delete All Spectra in the
Spectrum menu, then set the Display mode to Single Plot.
• The target spectrum for all library searches is the Current
spectrum in the Library Manager window. The spectrum is
transferred to this window in the same manner as was used
in the previous Tutorial (i.e., by transfer through the Spectra
Manager window). Using the cursor, extract the apex
spectrum from the peak at 5.0 minutes and transfer it to the
Spectra Manager window. Activate the Spectra Manager
PolyView2000
TM
57
Page 62

window and select To Library Manager under the Spectrum
menu. You will not be asked if you want to add the spectrum
to the current library because the Spectrum Manager was in
the 'Single Plot' Display mode.
In the Library Manager, a search list of disk libraries must be
built. The library you created in the previous Tutorial should
already be listed in the search list. Let's add the library provided
with PolyView2000.
• Click on the Library Manager title bar to make it the active
window and select Open Library under the Library menu.
• Select PV_STD01.LBR from the list and activate the Add to
List pushbutton. Click on the Cancel pushbutton to close the
dialog box. Note that it becomes the current library and is
added to the Search List.
Screen Configuration for Library Search
To send a single spectrum to the Library Manager without being
asked about adding it to the library, set the Spectra Manager to
the 'Single Plot' mode.
03-914774-00:4
58
Page 63

PERATION
O
T
UTORIAL
: C
ONDUCTING A SPECTRAL LIBRARY SEARCH
NOTE: Management of the contents of the Search List is accomplished with the
controls under the Search menu. For more information on the use of
these controls, refer to On-Line Help (Help:Commands:Search). Also,
any of the libraries in the list can be designated the Current library by
double-clicking on its name in the list. That library is then opened for
editing. Note that the Current library is always listed in the title bar of the
Library Manager window.
Now that the target of the search is the Current Spectrum in the
Library Manager, and the search list of libraries is built, you can
conduct the search.
Select Search for Spectrum under the Search menu.
The Library Search dialog box is displayed that is used to set the
search parameters and display the results. Refer to Library
Searches on page 105 for more information on the way in which
library searches are conducted and search parameters are set.
The Library Search Dialog Box
PolyView2000
TM
59
Page 64

For now, simply change the wavelength range to 200-366.6 nm
and leave all the other controls at their default settings. Select
the Search pushbutton. The search is conducted and, after a
short period of time, the results are displayed on the screen.
Results of a Library Search
Following the search, a wide variety of additional functions are
available. Using the controls in the list box at the bottom of the
screen, view the entire library search text report. This report lists
the best 5 library matches (sometimes fewer if there were not 5
library spectra that met the retention time and Purity Parameter
criteria.) and the search conditions, followed by the information
pertaining to the target and match spectra. This report can be
printed (Print List) and an example is shown in Appendix A.
Other controls in the dialog box enable you to access all of the
matches individually (Next and Prev) and obtain a detailed report
for each (see Appendix A as an example).
NOTE: The library search results are ranked in order of decreasing similarity.
For a discussion of the indices used to quantify the match between two
spectra, see Library Searches on page 105, or refer to On-Line Help.
03-914774-00:4
60
Page 65

Reporting Data
PERATION
O
R
EPORTING DATA
By default, the result of the search (if successful) is to display the
target spectrum overlay with the best match. Since these two
spectra are often very close, their difference is displayed as a
spectrum in the lower portion of the spectrum plot. To not display
this difference, click on the check box titled Difference to
uncheck it. This provides you with a larger size spectral overlay.
When you are finished using this particular target spectrum,
close the search dialog box by double-clicking on its Control
Menu box. To search any of the other peaks in the
chromatogram, simply transfer a spectrum from the peak to the
Library Manager (through the Spectra Manager window) and
select Search for Spectrum. Try that now. Determine the name
of the compound eluting at 8 minutes in PV_SAM01.RUN by
searching the two libraries.
Close PolyView2000 by double-clicking on the Control Menu box
in the main application window.
PolyView2000
TM
PolyView2000 has two modes of operation: the interactive
mode where the user is actually sitting at the Star Workstation,
and the non-interactive mode, where functions and reports are
generated automatically using a set of pre-defined conditions
contained in a PolyView2000 reports method. Most of the
windows and dialog boxes in PolyView2000 permit you to
document your work through an interactive printed report (select
either the Print command under the File menu or the Print
pushbutton in dialog boxes). Examples of these reports are
presented in Appendix A. Most of the functions (and reports)
that can be performed interactively can also be conducted in the
non-interactive mode. In Automating PolyView2000 Operations
on page 90 you will learn how to automate these data processing
and reporting functions. In PolyView2000, your primary control
over these non-interactive reports is through the Reports
window. Non-interactive reports are specified using the Method
Builder application (see the LC Star Workstation Manual) which
can be accessed directly from the Reports window in
PolyView2000. When the Method Builder application is accessed
in this manner, control is passed directly back to PolyView2000
when it is closed. Once a report method is specified, the report
can be generated and stored as a disk file. Then, you can view
61
Page 66

or print the report at some later time. The following Tutorial is
broken into two parts. The first part covers the viewing and
printing of an existing report file on the disk. The second part
covers the specification and generation of a report file.
NOTE: In the following Tutorial, some of the files in the EXAMPLES directory will
be modified and/or created. Prior to performing this Tutorial, you should
ensure that you are working with original copies of the data files called
for. If you are not sure whether these files have been modified by
previous use of the Tutorial, re-install PolyView2000 from the CD.
Tutorial: Making a Report
The first step in making a report is to construct a report method
in the Method Builder application.
Activate the Reports window (if not already active).
Drop down the Reports menu and select Edit Method.
The Method Selection dialog box allows you to create a new
method or edit an existing method. Let's create a new method.
The Method Selection Dialog Box
03-914774-00:4
62
Page 67

PERATION
O
T
UTORIAL
: M
AKING A REPORT
Select the New Method pushbutton and accept the default bus
address of 4, the address used in collecting the Example data
files. Control is transferred to the Method Builder application and
the window used to specify reports is displayed.
The PolyView2000 Reports Method Window
NOTE: For more details on the operation of the Method Builder application, refer
to the Data Acquisition with LC Control Operation Manual.
PolyView2000
TM
The Report Method dialog box is used to manage the list of
report types called for in the .MTH file. First, let's call for the
generation of a Single Plot report.
Select Add and a list of the reports that can be generated is
shown.
Reports that can be generated automatically
63
Page 68

Select the Single plot report and press OK. Note that a dialog
box is displayed that allows you to specify the parameters for the
report.
Single Plot Report Parameters
Leave the Plot type at Chromatogram (the default), set the
wavelength range to 220-311 nm, and leave the Time and Scale
ranges at their default settings.
These parameters will generate a report of the entire data file
using the average absorbance from 220 to 311 nm with the
absorbance range autoscaled.
Click on Done at the bottom of the window. Notice that the Single
Plot is included as the first report specified.
03-914774-00:4
64
Page 69

O
T
UTORIAL
: M
AKING A REPORT
A Single Plot Report was added to the Report List
Now, let's include a library search in the report.
Click on Add and select Library Search.
Note that the Select Library File dialog box is displayed. You now
specify the libraries that you want to use for a library search.
Once you have specified the library, you can specify the
parameters to use in conducting an automated library search.
Let's duplicate the search that was conducted in the Tutorial,
Conducting a Spectral Library Search.
PERATION
PolyView2000
TM
Leave the Report Type set to Short Graphics.
Set the wavelength range to 190-366.6` nm and leave all of the
other fields at their default settings.
Now, build a list of libraries to search.
Select Add Library and the Library Select dialog box is displayed.
Select MYLIB.LBR. Select Open and the library will be added to
the search list. Repeat this for the PV_STD01.LBR file.
Back in the Report Method window, select Add to append the
Library Search report to the list of reports.
65
Page 70

The Library Search Report, showing
the list of libraries to be searched
NOTE: Once a series of reports have been entered into the list, the controls in the
Report Method window are then used to manage the list. You can edit or
delete selected reports and rearrange the order that the reports will be
generated (and appear in the disk file). For details on the operation of these
list management controls, see On-Line Help (search for Report Method).
Now that the types of reports have been specified, you need to
assign the .MTH file a name and save it to the disk.
Drop down the File menu and select the Save As command.
In the dialog box, assign it the name MYMETH. You do not need
to add the .MTH extension. It is automatically added to the
method name.
Close the Method Builder application by clicking on the Control
Menu box in the main application window.
03-914774-00:4
66
Page 71

PERATION
O
T
UTORIAL
: M
AKING A REPORT
When the Method Builder application is exited, control is
returned to PolyView2000, just where you left off (in the Reports
Window). You can now generate a report using the .MTH file you
just created. To generate the report, you must specify the .RUN
file that is the source of the raw data, the .MTH file that will be
used to process the data, and the .SRP file that becomes the
disk file containing the report.
Drop down the Reports menu and select Create Report.
Report Creation Dialog Box
PolyView2000
TM
Press Select Data File and choose PV_SAM01.RUN as the raw
data file from which to construct the report.
Press Select Methods File and choose MYMETH.MTH as the
method to construct the report.
Press Select Reports File, type MYREPORT into the File name
field and select OK..
Press OK to start the report generation. A dialog box is displayed
that informs you of the progress. After the report is completed, it
is automatically displayed in the Reports window. It can now be
accessed or printed just as any other existing report file.
67
Page 72

MYREPORT.SRP displayed in Reports Window
Close PolyView2000 by clicking on the Control Menu box in the
main application window.
NOTE: The above Tutorial covered the building of a new report generation
method. PolyView2000 also allows you to edit an existing report method
by selecting Edit Method under the Report menu and specifying an
existing .MTH file in the File Select dialog box. You can then add new
report types to the file or edit the ones already in the .MTH file.
You may also extract the report method directly from an existing .SRP
file even if the original .MTH file used to generate it doesn't exist on the
disk. To do this, select Edit Current Method under the Report menu. The
dialog box that appears allows you to generate a .MTH file with the same
root as the .SRP file. You may choose another name if desired.
03-914774-00:4
68
Page 73

T
UTORIAL
: V
IEWING AND PRINTING OF AN EXISTING REPORT
Tutorial: Viewing and Printing of an Existing Report
If you have not already executed the previous Tutorial, do so to
create a report file.
If PolyView2000 is not already running, start PolyView2000 now.
• Select New Reports Window under the Windows menu.
To view a report file, select Open Report under the Reports
menu and select MYREPORT.SRP from the EXAMPLES
directory. Notice that as you select the disk file, the pages in the
report are listed. This enables you to confirm the contents of the
report before it is called into the window. Select OK to confirm
your selection.
PERATION
O
PolyView2000
TM
Report window displaying an .SRP file
69
Page 74

The first page of the specified report is displayed in the window.
Initially, it is displayed in color, and the full page is reduced in
size to fit within the window. Access the next page of the report
by selecting Next Page under the Page menu. The commands
under this menu can be used to access or delete sequentially the
individual pages in the report. The Next Page and Previous Page
commands can also be given through the Page Up and Page
Down keys in the numeric keypad of your keyboard. The report
can be viewed in monochrome by selecting that mode under the
Page menu.
Library Search Report Zoomed in
Next, drop down the Report menu and select View Page List.
This allows you to view the method that was used to generate
the report and the resulting pages. Any of the individual pages
can be accessed by selecting them from the page list and
03-914774-00:4
70
Page 75

selecting the View Page pushbutton. Select a page of the Library
Search Report.
Particular details in the report can be viewed by moving the
cursor to the desired region of the report by a click and drag
operation of the mouse. Zoom in on the region of the report
dealing with a library match. Notice that the remainder of the
report can still be accessed using the scrolling controls at the
bottom and right of the screen. Clicking the left mouse button
anywhere within the report un-zooms the display.
Drop down the File menu and select Print Page. The currently
displayed page is printed on the Star Workstation printer. If
desired, all the pages in the report can be printed using the Print
File command in this menu.
Determining Peak Purity
A primary feature of a Diode Array Detector such as 330 is the
ability to provide information on the purity of chromatographic
peaks. These peak purity determinations are made by assessing
the degree of difference in the UV spectra across the width of a
peak. There are a number of mathematical parameters that can
be used to compare spectra. The Purity Parameter used in
PolyView2000 is perhaps the most sensitive to minor co-eluting
impurities (contaminants) within a peak of interest (the analyte).
PERATION
O
D
ETERMINING PEAK PURITY
PolyView2000
TM
Purity Parameter
For a given wavelength range, the Purity Parameter is the
average wavelength weighted by the square of the absorbance.
2
∑
.
A
PuP
ii
(@λλ )
=
∑
Absorbance A wavelength
2
A
i
ii
Consequently, by examining the Purity Parameter values across
a peak, you can quickly determine the presence of contaminants.
Rather than examining a table of Purity Parameter values,
PolyView2000 provides the ability to plot the Purity Parameter as
a function of time. If the peak is free of co-eluting compounds,
the Purity Parameter will not change over the course of the peak
and it will appear with a flat top. However, if impurities are
present, the top of the peak will slope, indicating that the Purity
71
Page 76

Parameter is not consistent across the width of the peak. In
addition to the Purity Parameter, other qualitative parameters
associated with UV spectra can be plotted and provide
information on peak purity, including the wavelength of maximum
absorbance and the ratio of absorbances at two different
wavelengths. Like the Purity Parameter plot, a flat topped peak
indicates that the parameter is not changing with time and
provides a measure of peak homogeneity.
The accuracy of all the measures of peak purity are dependent
on a number of factors. There must be some degree of
separation between the analyte and contaminant to create a
difference in the UV spectra across the width of the peak. If the
two (or more) compounds exactly co-elute, then the UV spectra
will not change across the peak and it will appear to be pure.
Care must be taken to maximize the efficiency of your HPLC
system. A Diode Array Detector cannot
make up for low
efficiency columns and/or inadequate separation techniques. In
addition, the degree of difference in the UV spectra between the
analyte and the contaminant will have a profound effect on the
peak purity determination. If spectral differences are small, it will
be very difficult to determine impurities. However, the Purity
Parameter is very sensitive to even slight spectral differences
and this will not often be a problem for PolyView2000. A final
consideration in peak purity determinations is the wavelength
range used in specifying the plots. It is possible for the spectra of
an analyte and a contaminant to be very similar over a certain
portion of the UV spectrum and different over another portion. It
is important to carefully consider the wavelength range used to
assess peak homogeneity. To assist you in selecting the proper
wavelength range for plotting the Purity Parameter, you can use
the optimization routine in the Spectra Manager under the
Spectrum menu.
PolyView2000 provides several ways to construct Purity
Parameter plots. They can be plotted interactively in the plot
window or generated automatically in a non-interactive report. In
addition, the non-interactive Peak Purity Survey report presents
the same information in a slightly different format. In this report,
the Purity Parameters of all spectra within a peak are compared
with the Purity Parameter of the apex spectrum and, if different,
the peak is marked. With experience, you will find the technique
that best suits your application.
03-914774-00:4
72
Page 77

In the previous tutorials, you have already learned the
techniques that are required to conduct these Peak Purity
determinations. The basic technique for plotting a .RUN file was
covered in Plotting a Chromatogram on page 25 and preparing
non-interactive reports was covered in Reporting Data on page
61. Consequently, the details of these operations will not be
covered here. Instead you will be asked to refer to these
previous tutorials. The data file used in this tutorial,
PV_SAM01.RUN, has several
obvious as you work through this tutorial.
Note that Multicomponent Analysis can be also used to assess
the purity of a peak, as detailed in Purity Evaluation by MCA on
page 100.
Tutorial: Purity Parameter Plots
The first step is to configure your screen to compare two plots.
• At the Workstation Star Tool Bar, open PolyView2000 by
double-clicking on the PolyView2000 icon.
PERATION
O
T
UTORIAL
impure peaks that should become
: P
URITY PARAMETER PLOTS
PolyView2000
TM
• Configure PolyView2000 with only the Plot window active,
hiding both the Spectra Manager and Library Manager
windows.
• In the Plot window, plot out PV_SAM01.RUN at 254 nm.
• Drop down the Plot menu and select Duplicate Plot Window.
Wait for the plot to appear and then select Arrange Visible
under the Window menu.
Your screen should display two identical plots of the file. This is
the most convenient screen configuration for determining peak
purity because you can view the absorbance chromatogram in
one window and the purity information in another.
73
Page 78

Duplicated Plot Window
You must now specify the Purity Parameter plot.
• With the focus on the bottom window, drop the Plot menu
and select Plot Parameters.
• Specify a Purity Parameter plot with a wavelength range of
200-366 nm. Accept the defaults for all of the other
parameters.
The Purity Parameter is now plotted as a function of time
between the upslope and downslope inflection points of each
peak. Notice that the peak at 3.5 minutes has a sloping top,
indicating that the Purity Parameter is changing across the width
of the peak.
03-914774-00:4
74
Page 79

T
UTORIAL
PERATION
O
: P
URITY PARAMETER PLOTS
Purity Parameter Plot indicates impure peak
at 3.5 minutes
You can easily verify the spectral dissimilarities in the impure
peak by transferring the upslope and downslope spectra to the
Spectra Manager window. In either Plot window, extract spectra
corresponding to the upslope and downslope of the peak at 3.5
minutes. Activate the Spectra Manager window and observe the
differences in the two spectra.
NOTE: The peak at 3.9 minutes in PV_SAM01.RUN also has a significant
impurity that can be clearly detected by plotting the Purity Parameter
over the range of 224-278 nm.
Don't close PolyView2000. Instead, go on to the next tutorial.
PolyView2000
TM
75
Page 80

Tutorial: Peak Purity Survey Report
The Peak Purity Survey report is a non-interactive report and
therefore must be specified in the Method Builder application.
• Call up the Reports window and create a new report method
(see Tutorial: Making a Report on page 62).
• In the Method Builder application, select Add and set the
type of report to Peak Purity Survey and Say OK.
In the dialog box, you can specify the conditions for report
generation. For an example of a peak purity survey report, see
Appendix B.
• Set the PuP Interval field to 2 nm.
• Set the wavelength range to 200-367 nm and leave all other
parameters at their default conditions.
• Select Done and assign the report method the name of
PURITY.MTH. (Use the Save As command under the File
menu.)
• Close the Method Builder application by clicking on the
Control menu in the main application window.
Now, let's use the report method to determine peak purity on a
file. Back in the PolyView2000 Reports window, create a report
of the data file PV_SAM01.RUN using the PURITY.MTH method.
Call the report file PURITY.SRP (see Tutorial: Making a Report
on page 62). The report displays the absorbance chromatogram
(at the wavelength used for peak sensing) with impure peaks
shaded. (Note that the peak at 3.5 minutes is indicated as being
impure.
03-914774-00:4
76
Page 81

PERATION
O
P
ERFORMING PEAK SENSING
Peak Purity Survey Report showing
impure peak at 3.5 minutes
Close PolyView2000 by double-clicking on the Control Menu box
in the main application window.
Performing Peak Sensing
Several functions within PolyView2000 rely on an accurate
determination of peaks in a chromatogram. To provide corrected
spectra that accurately reflect eluting peaks, the baseline profile
must be determined with precision. Also, many of
PolyView2000's automated functions require the determination
of peak placement within a chromatogram. It is the job of the
peak sensing algorithm to accurately determine where a baseline
segment starts and stops and where eluting peaks are located.
PolyView2000
TM
77
Page 82

There are a number of user-selectable parameters that must be
set to insure accurate peak sensing. As with most data systems,
including the Interactive Graphics application in the Star
Workstation, you must set the peak width and S/N value (the
threshold parameter) according to the peak width and size you
expect. In addition, since you are dealing with multi-channel
data, in PolyView2000 the wavelength used for peak sensing
must be specified. A single wavelength or a wavelength range
can be specified. All of the peak sensing parameters can be time
programmed to accommodate changing conditions over the
course of a chromatographic run.
Like the reports method, a separate portion of the Star
Workstation .MTH file is set aside for the PolyView2000 peak
sensing method. This enables peak sensing to be performed
automatically under the control of the System
Control/Automation application. Along with this, the Method
Builder application is used to specify and manage the peak
sensing method. Within PolyView2000, a separate window is
provided in which to manage the peak sensing functions. In this
Peak Sense window you can view a chromatogram at the peak
sensing wavelength, view and alter the detector noise monitor
data, access the Method Builder application, and conduct peak
sensing on a file.
The following tutorials cover the basic operations of constructing
a peak sensing method and performing peak sensing on a data
file. In the last tutorial, the procedure for defining a new noise
monitor will be covered.
NOTE: For more detailed information on peak sensing in PolyView2000,
including procedures to follow for troubleshooting peak sensing, refer to
Peak Sensing on page 109.
In the following Tutorial, some of the files in the EXAMPLES directory will
be modified and/or created. Prior to performing this tutorial, you should
ensure that you are working with original copies of the data files called
for. If you are not sure whether these files have been modified by
previous use of the Tutorial, reinstall the PolyView2000 software from the
CD using your serial number.
03-914774-00:4
78
Page 83

T
UTORIAL
: B
UILDING A PEAK SENSING METHOD
Tutorial: Building a Peak Sensing Method
From the Star Workstation Star Tool Bar, double-click on the
PolyView2000 icon to activate the application.
Drop down the Windows menu, activate a New Peak Sense
Window and maximize it.
You are now ready to build a new peak sensing method.
• Under the Peak Sensing menu, select Edit Method.
• To define a new .MTH file, select New Method in the dialog
box. Accept the default bus address (all methods sections
are attached to an address, used under automated
operation). Control will be transferred over to the Method
Builder application and the Peaksense Time Program dialog
box will appear. In this window, the default peak sensing
time program is in the list box at the bottom of the window.
The operation of the edit controls in this window is similar to
other windows within the Method Builder application. Modify
the Peak Sensing Method as follows.
PERATION
O
PolyView2000
TM
The Peak Sense Time Program Window
79
Page 84

• Click on the first line 0.00 Peaksense..., and alter the
wavelength range fields to 273-273 nm. Note that, unlike
previous versions of the Method Builder, the numbers
change immediately in the Method listing and that there is no
Change button. However, the parameters do not actually
change in the method until you save the method.
• Click on the second line 0.00 S/N Threshold... and change
the S/N value to 6.
• Click on the third line 0.00 Inhibit Integrate... and change the
end time to 2.00 minutes. This ensures rejection of the
region containing the void peak.
• Then, click on Add twice. This creates two new lines in the
method.
• Click on the second of the new lines and change the event to
Peaksense, the time to 16.0, and the wavelength range to
215-215.
• Click on the first of the new lines and change the event to
S/N Threshold, the time to 19.5 and the S/N value to 10.
Your screen should look like the following.
The New Peak Sensing Time Program
03-914774-00:4
80
Page 85

PERATION
O
T
UTORIAL
: C
ONDUCTING PEAK SENSING
Next, assign a name to the method and save it to the disk.
• Drop down the File menu and select Save As.
• Save your method as PSENSE.MTH in the EXAMPLES
directory.
• Close the Method Builder application and note that control is
passed back to PolyView2000 right where you left off.
Don't close PolyView2000. Go on to the next tutorial to learn how
to use the method you built to perform peak sensing.
NOTE: The above tutorial covered the building of a NEW peak sensing method.
PolyView2000 also allows you to edit an existing peak sensing method
by selecting Edit Method under the Peak Sensing menu and specifying
an existing .MTH file in the File Select dialog box. Control is transferred
to the Method Builder application with the specified .MTH file already
loaded. It can then be edited and saved for use later.
A similar feature allows you to extract the peak sensing method directly
from an existing .RUN file even if the original .MTH file used to generate
it doesn't exist on the disk. To do this, select Edit Current Method under
the Peak Sensing menu. The dialog box that appears allows you to
generate a .MTH file with the same root as the .RUN file. Simply select
OK in the dialog box that appears and control will be transferred to the
Method Builder application with the .MTH file just created loaded into the
window. If a file by that name already exists on the disk in the current
directory, you will be given the opportunity to verify your selection to
prevent inadvertently overwriting it.
Tutorial: Conducting Peak Sensing
To begin this tutorial, your screen should be configured as in the
last tutorial, with a single Peak Sense window. The task will be to
perform peak sensing on BASECORR.RUN using the method
you built in the last tutorial. Drop down the File menu and select
Open File. Select BASECORR.RUN in the EXAMPLES directory
and then OK. The file is plotted in the window.
PolyView2000
TM
81
Page 86

BASECORR.RUN in Peak Sense window
NOTE: The peak events are displayed in both the Peak Sense window and the
Plot window (optional). These events are color coded as follows: WhiteApex, Red-Peak Start, Yellow-Peak End, Purple-Inflection points, Dark
Blue-Valley points, and Lt. Blue-Shoulder. The placement of peak events
in a chromatogram indicates how well the peak sensing method was
tailored to the actual chromatogram. For more information on how
PolyView2000 conducts peak sensing and how to assess peak sensing
results, see Peak Sensing on page 109.
Now, let's perform the peak sensing operation. Select Do Peak
Sensing under the Peak Sensing menu. In the dialog box, select
the file you created, PSENSE.MTH, in the EXAMPLES directory.
Notice that the peak sensing method is listed on the screen.
Select OK. Peak sensing is automatically performed.
03-914774-00:4
82
Page 87

PERATION
O
T
UTORIAL
: C
ONDUCTING PEAK SENSING
Often, the peak sensing method you specify cannot be executed
exactly as it is called for in the .MTH file. For instance, timeprogrammed changes in peak sense parameters (wavelength,
peak width, etc.) cannot be made within a peak. When this
occurs, a dialog box appears that informs you of this situation.
This is the case for the BASECORR.RUN file and the View Peak
Sense Log dialog box is displayed on the screen. The Peak
Sense Log shows the original method you specified, the resulting
method (as executed), and the reasons why it was modified.
After viewing the information, select Quit.
PolyView2000
TM
Peak Sense Log showing changes to method
Following the peak sensing function, the display is updated to
reflect the new peak sense results.
83
Page 88

New Peak Sense Results
The chromatogram display in the Peak Sense window is very
similar to the display in the Plot window, but it only displays the
time-programmed absorbance specified in the Peak Sensing
Time Program. Flags at the top part of the screen indicate where
time-programmed peak sense events were executed. By
default, the whole file is displayed and automatically scaled. You
can use the mouse and the View menu to modify the time and
amplitude settings.
Close PolyView2000 by double-clicking on the Control Menu box
in the main application window.
03-914774-00:4
84
Page 89

PERATION
O
T
UTORIAL
: T
ROUBLESHOOTING PEAK SENSING
Tutorial: Troubleshooting Peak Sensing
Attached to all .RUN files is noise data transmitted to the Star
Workstation from 330 when it is in the MONITOR state, just prior
to the start of the run. During the peak sensing operation,
PolyView2000 determines the level of chromatographic noise
from this monitor data and differentiates peaks from noise using
the S/N ratio you set in the peak sensing time program.
Occasionally, the run monitor associated with the .RUN file may
not be accurate, possibly due to the presence of a late eluting
peak from a previous run or a gradient program that had not yet
stabilized prior to the run monitor period. PolyView2000 provides
the ability to redefine the data used as the noise monitor in these
situations and this function will be illustrated here. Configure
PolyView2000 with a single Peak Sense window and call up
BADMON.RUN from the disk.
NOTE: See Peak Sensing on page 109 for more information on how PolyView2000
conducts peak sensing and how to set the peak sensing parameters.
PolyView2000
TM
BADMON.RUN showing no detected peaks
85
Page 90

If the file is in the original state, you will notice that the peak
sensing function did not detect any peaks and the noise value at
the upper left corner of the screen is very high. If this is not the
case, this tutorial has already been executed on the file; restore
the file to its original state by executing the Remove User
Monitor command in the Peak Sensing menu.
You can examine the run monitor:
• Drop down the File menu and select View Run Monitor. You
will see that several high absorbance spikes occurred during
the monitor.
The Run Monitor dialog box
• Using the wavelength control, you can view the run monitor
data at any of the diodes which were used to collect the
data. Select Quit to close the dialog box.
If a file has a noise monitor that is corrupted or inappropriate, like
BADMON.RUN, you can select a portion of the baseline in the
chromatogram to be used for the noise calculation. This is called
the User Monitor and after it is specified, peak sensing is
automatically repeated.
• Drop down the Peak Sensing menu and select Define User
Monitor.
03-914774-00:4
86
Page 91

PERATION
O
T
UTORIAL
: T
ROUBLESHOOTING PEAK SENSING
The controls in the dialog box that appears are used to select a
portion of the file as the noise monitor.
PolyView2000
TM
The Define User Monitor dialog box
• Select a portion of the baseline between 0 and 1 minute
using the click and drag method. When you do this, the plot
will zoom and a message will be displayed in the Number of
Points field. If the piece of baseline is too large, Too many
points will be displayed and you will need to select a smaller
portion of the baseline until the proper number of points is
selected. Use Select from Left Edge. Try for a number
between 26 and 74. When assigning the User Monitor, be
sure to use a flat portion of the baseline, free from eluting
peaks. To autoscale the plot after selecting a new region,
double-click left of the Absorbance axis, where the cursor
becomes a double-headed vertical arrow.
87
Page 92

Section of Baseline chosen as User Monitor
• After the number of points is refined, select OK and peak
sensing will automatically be performed using this new
monitor.
When the plot is displayed, you will note that normal peak
detection has occurred (see the following figure). Also, the new
noise value is displayed in the upper left corner of the screen.
The new monitor data can be viewed in the same manner as
before. This time, select View User Monitor under the File menu.
The dialog box that is displayed is very similar to the View Run
Monitor dialog box.
03-914774-00:4
88
Page 93

T
UTORIAL
PERATION
O
: T
ROUBLESHOOTING PEAK SENSING
PolyView2000
TM
BADMON.RUN with proper Peak Sensing
after definition of a User Monitor
Close PolyView2000 by double-clicking on the Control Menu box
in the main application window.
89
Page 94

Automating PolyView2000 Operations
One of the primary features of the PolyView2000 Spectral
Processing Application is the ability to conduct automated
analyses of the spectral data from the 330 or 9065 diode array
detectors. Instead of having to process the data manually after it
is collected, the Workstation has the ability to perform many of
these functions automatically, immediately after data collection.
The PolyView2000 functions that can be performed in this
manner include peak sensing to locate the peaks in a
chromatographic run and any of the non-interactive reports. The
functions in the non-interactive reports allow you to perform
sophisticated analyses of diode array spectral data in an
automated fashion.
You can automatically add PolyView2000 functions to the
processing of a diode array data file at the end of each
chromatographic run by adding a PolyView2000 method
associated with the detector (by means of the bus address) will
be executed. During an automated sequence of injections, the
PolyView2000 reports that are generated are written to a
permanent disk file with a .SRP extension. These reports will
also be printed automatically if the Automated Printing is enabled
in System Control (at the bottom of the Automation menu). If you
don't wish these reports to be printed automatically, simply
disable the autoprint function. The .SRP files will still be
generated and will be available for viewing in the Reports
window. In addition to the generation of PolyView2000 report
files during live runs, these .SRP files can be generated during a
Recalculation sequence in System Control.
Using On-Line Help
There are three ways to access On-Line Help in PolyView2000:
the F1 key, the Help menu, and the Help push button which is
present in most dialog boxes.
03-914774-00:4
90
Page 95

Tutorial: Using On-Line Help
Pull down the Help menu. Select Using Help to display the
information file provided with Windows. Learn the basics, then
close the Help window. Also try Index, Commands, Keyboard,
Procedures.
Select the MCA Manager window, then press the F1 key. The
Help window appears, displaying information relevant to the
MCA Manager. Maximize the Help window. Note that the
abbreviation MCA is underlined with a dotted line. This indicates
a defined term. Move the cursor over the word MCA. Note that
the cursor turns to an index. Click the mouse, and the definition
is displayed as a pop-up definition. Click again, and the pop-up
disappears. Now move down to terms with a solid underline.
These represent Hypertext jumps, which means that selecting
such an item by a single click will send you to another topic. Try
Computing Area Spectra. You can come back to the previous
topic using the Back pushbutton above the help text.
T
UTORIAL
PERATION
O
: U
SING ON-LINE HELP
PolyView2000
TM
You can also print any topic by using the Print Topic command in
the File menu of the Help window.
Display the Preferences dialog box by pulling down the File
menu and selecting Preferences. Press the Help pushbutton.
Maximize the Help window and scroll through the information.
There is such a Help pushbutton in most dialog boxes in
PolyView2000.
Try a keyword search. Press the Index button in the Help
window, and start typing a keyword, for example Purity. Note that
as you enter more characters, a list of keywords is scrolled to the
point where it best matches what you requested.
91
Page 96

The Keyword Search Dialog Box
Now select one of the keywords and press the Display button
inside the dialog box (or press the Enter key).
Quantitative Analysis by MCA
Multicomponent Analysis is a proven technique, routinely used in
spectrophotometry to determine the composition of a mix of
known components in unknown amounts. In PolyView2000, an
original adaptation of the technique provides easy quantitative
analysis of groups of up to six overlapping peaks, regardless of
the chromatographic resolution (J. Chrom, 631 (1993) 15-21).
This requires that the components have different enough
spectra. If this is not the case, the report will let you know. The
one-page MCA report provides amounts, peak profiles, and an
evaluation of the quality of the decomposition. MCA can be
invoked interactively or under automation.
In PolyView2000, you can also define a peak as an internal
standard to refine the quantitation results. This process is
documented in On-Line Help and is only available in the noninteractive MCA report. You can obtain such reports interactively
by using the PolyView2000 Reports window to create and
display a report including MCA commands specifying the use of
the Internal Standard.
03-914774-00:4
92
Page 97

PERATION
O
T
UTORIAL
: U
SING THE
MCA W
INDOW FOR QUANTITATIVE ANALYSIS
Tutorial: Using the MCA Window for Quantitative Analysis
Create an MCA window, using the New... command in the
Windows menu. The MCA window will automatically fill up the
PolyView2000 workspace.
PolyView2000
TM
The MCA Window
Pull down the File menu and select Open File. Select
DIPA3020.RUN in the EXAMPLES directory. A chromatogram is
displayed on the bottom half of the window. It contains one major
peak of DIQUAT, which we will use as a reference.
93
Page 98

To integrate this peak, press the Define Spectrum pushbutton.
Click in front of the peak, on the peak start marker at about 1.8
minutes, then double-click on the peak end marker at about 3.3
minutes. This defines integration limits and baseline correction
spectra for this peak (for more details, see On-line help on
computing Area Spectra). A dialog box requests you to provide
information to be saved along with this spectrum. Enter Diquat in
the peak name field, 10 for the Amount and ug for the unit (Note
that the flow rate was read from the file). Press OK after all the
fields have been updated. The MCA window now shows the area
spectrum and the integrated region is highlighted.
The Amounts Dialog
03-914774-00:4
94
Page 99

T
UTORIAL
: U
SING THE
MCA W
PERATION
O
INDOW FOR QUANTITATIVE ANALYSIS
PolyView2000
TM
The MCA window, showing the
integrated region and the Area Spectrum
Create a new library, using the Create Library command in the
Library menu. Name it PQDQ.LBR. We will now compute area
spectra and add them to this library.
Add the spectrum to the library by pressing Add To Library.
Now repeat the process with DIPA3037.RUN. The compound
name is Paraquat, the amount 10 and the unit ug. Add the
spectrum to the library. Create a new library, PQ.LBR, and press
Add to Library again. At this point, you have created 2 libraries:
PQDQ.LBR contains Paraquat and Diquat spectra, while
PQ.LBR contains Paraquat only.
Now repeat the integration process described in step 3 with
DIPA3053.RUN. This is an unknown mix, so do not enter any
values in the Amount and Unit fields. Instead, just press OK.
95
Page 100

Pull down the Library menu and select Open Library. Select
PQDQ.LBR.
Press the MCA button. Press OK in the dialog box requesting
additional parameters. This displays an MCA Report in a
Preview window. This report has 3 main components: the
Spectrum Analysis, the Plot Analysis and the Error Analysis. You
can use the mouse to zoom in on a particular region of the
report. To do this click on the left mouse button and drag to
highlight the area of interest. Double-click to restore. Note that
the right half of the Spectrum Analysis provides quantitative
results, while the right half of the Plot Analysis provides
qualitative results such as retention times and resolution. The
Error Analysis compares the residual error in each point of the
chromatogram to the noise. See On-Line Help, Interpreting MCA
reports for more details. Press Print Page if you want to obtain a
hardcopy, then Delete Page to terminate the Preview.
The MCA Report Parameters
NOTE: The MCA process uses up to six spectra from the library which match
the specified time range. If more than six spectra fit in the range, only the
closest to the center of the range are used. As all component spectra
must be independent, avoid placing multiple copies of the same
spectrum in a library.
When only one component is specified, the best match in the time range
is determined based on spectral comparison, not retention time.
03-914774-00:4
96
 Loading...