

Page 1
Hyperion Fluorometer
Operating Manual
Document Ref:
Date:
This document was prepared by the staff of Valeport Limited, the Company, and is the property of the
Company, which also owns the copyright therein. All rights conferred by the law of the copyright and by virtue
of international copyright conventions are reserved to the Company. This document must not be copied,
reprinted or reproduced in any material form, either wholly or in part, and the contents of this document, and
any method or technique available therefrom, must not be disclosed to any other person whatsoever without
the prior written consent of the Company.
Valeport Limited
St Peters Quay
Totnes
Devon, TQ9 5EW
United Kingdom
As part of our policy of continuous development, we reserve the right to alter, without prior notice, all
specifications, designs, prices and conditions of supply for all our equipment.
0901814c
Monday, October 15, 2018
+44 1803 869292
sales@valeport.co.uk | support@valport.co.uk
www.valeport.co.uk
Tel:
e mail:
Web:
Page 2

Table of Contents
© 2018 Valeport Ltd
Page 2
Table of Contents
..................................................................................................................................... 31. EU Declaration of Conformity - CE Marking
..................................................................................................................................... 52. Introduction - Hyperion Fluorometer
.................................................................................................................................... 52.1. Fluorophore & Nomenclature
..................................................................................................................................... 63. Sensors
.................................................................................................................................... 63.1. Fluorometers
3.1.1 Safety Statement
.................................................................................................................................... 6
3.1.2 Chlorophyll a
.................................................................................................................................... 6
3.1.3 Fluorescein
.................................................................................................................................... 7
3.1.4 Rhodamine
.................................................................................................................................... 7
.................................................................................................................................... 83.2. Linear Observation Range
.................................................................................................................................... 93.3. Quenching
.................................................................................................................................... 103.4. Turbidity
3.4.1 Safety Statement
.................................................................................................................................... 10
..................................................................................................................................... 114. Data Acquisition
.................................................................................................................................... 114.1. Setting the Gain
.................................................................................................................................... 134.2. Output Rate
.................................................................................................................................... 134.3. Functional Check
..................................................................................................................................... 175. Operation with MIDAS CTD+
..................................................................................................................................... 186. Electrical
.................................................................................................................................... 186.1. Connector Pin-Out
..................................................................................................................................... 197. Communications
.................................................................................................................................... 197.1. Data Output Formats
.................................................................................................................................... 207.2. Operating Modes
7.2.1 Mode C - Continuous
.................................................................................................................................... 20
7.2.2 Mode M - Continuous Measurement
.................................................................................................................................... 20
.................................................................................................................................... 217.3. Hash (#) Codes
..................................................................................................................................... 228. Physical Characteristics
.................................................................................................................................... 228.1. Dimensions
..................................................................................................................................... 239. Care and Maintenance
..................................................................................................................................... 2410. Software - DataLog x2
..................................................................................................................................... 2511. Ordering and Part Numbers
Page 3
© 2018 Valeport Ltd
EU Declaration of Conformity - CE Marking
Page 3
1. EU Declaration of Conformity - CE Marking
Page 4

© 2018 Valeport Ltd
0901814c - Hyperion Fluorometer
Page 4
Please note: Any changes or modifications to the product or accessories supplied, that are not
authorised by Valeport Ltd, could void the CE compliance of the product and negate your authority
to operate it. This product has demonstrated CE compliance under conditions that include the use of
shielded cables. It is important that you use shielded cables compliant with the product’s
conformance, to protect from potential damage and reduce the possibility of interference to other
electronic devices.
Page 5

© 2018 Valeport Ltd
Introduction - Hyperion Fluorometer
Page 5
2. Introduction - Hyperion Fluorometer
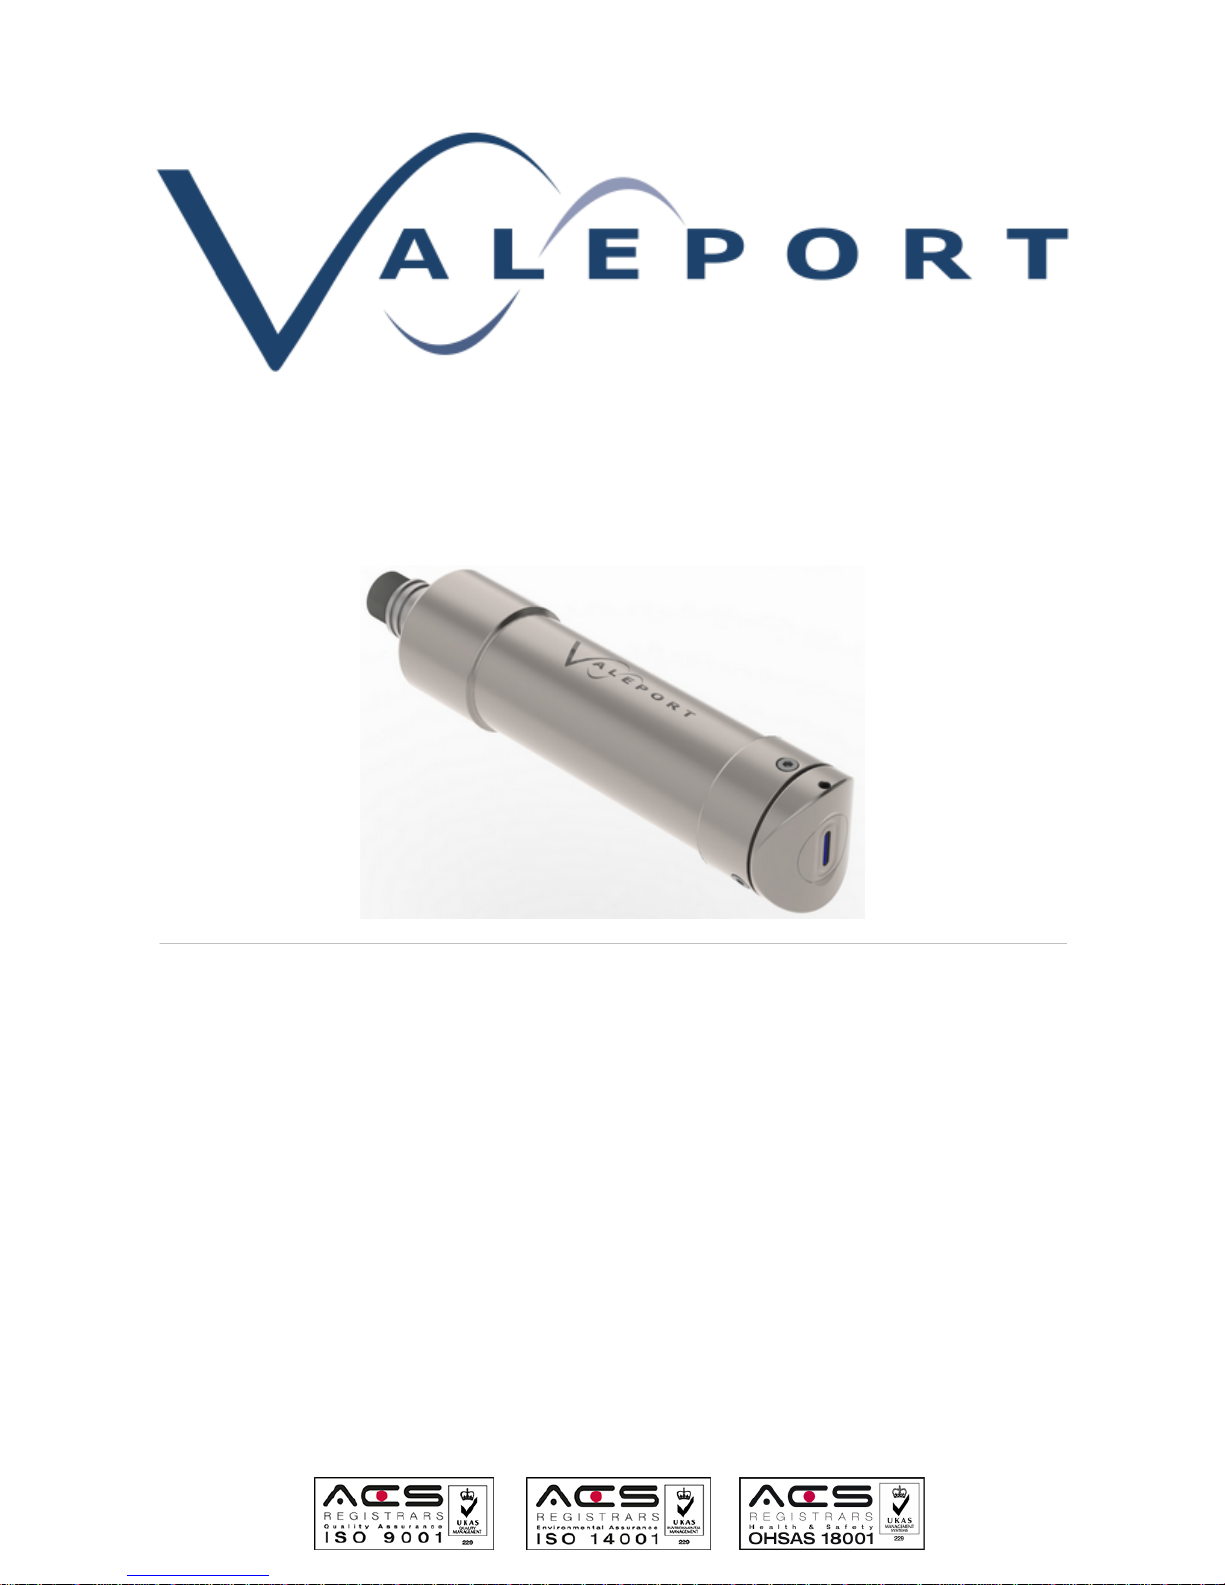
Valeport’s Hyperion Fluorometer sensor range delivers high performance measurements of
Chlorophyll a or Fluorescein in a compact & robust package ideal as a standalone sensor, for ROV
and AUV integration or used as part of a multi-sensor array and data logger.
Offered as standard in a 6000m depth rated, Titanium housing the Hyperion Fluorometer has a wide
range (9-30V DC) isolated power supply, data output up to 32Hz and RS232 communications.
The Hyperion is an accurate single channel detector which can be used for many different
fluorophores. It is designed for integration into systems providing electrical power and delivers a
signal that has been correlated to a known concentration of fluorophore.
2.1. Fluorophore & Nomenclature
“C”
Chlorophyll
“F”
Fluorescein
"R"
Rhodamine
More Fluorophores will become available in the Hyperion family of products - please check with
Valeport for availability.
Other optical, non-fluorescent technology:
“T”
Turbidity
Page 6

© 2018 Valeport Ltd
0901814c - Hyperion Fluorometer
Page 6
3. Sensors
An optical sensor must be kept clean to operate correctly. Ensure that the SWiFT is power down
before cleaning the sensor.
Use warm soapy water with a soft bristled brush to remove any light fouling
For heavy fouling use a solvent (e.g Isopropyl alcohol) and a soft bristled brush
Always rinse thoroughly after every use in clean, fresh water.
3.1. Fluorometers
3.1.1. Safety Statement
A Hyperion Fluorometer is classified as Risk Group 1 under standard 62471. As the type is classified as
Risk Group 1 solely due to radiation in the visible band a hazard label is not required. However,
· the LED used is in excess of the Exempt Group and that the viewer- related risk is dependent upon
how the user installs and operates the equipment.
· the exposure hazard value (EHV) for a Hyperion Fluorometer in terms of distance is 320mm
Never look directly into the Hyperion aperture
3.1.2. Chlorophyll a
Performance
Excitation:
470 nm
Detection:
696 nm
Dynamic Range:
0-800 µg/l
2 gain settings: 0-40 and 0-800 (software controlled)
Instrument
Detection limit:
0.025 µg/l*
Actual
Detection limit:
0.025 µg /l**
Linearity:
0.99 R
2
Response Time:
0.03 to 2 sec
* 3x SD in RO water
** calibrated against Chlorophyll a in acetone solution
Page 7

© 2018 Valeport Ltd
Sensors
Page 7
3.1.3. Fluorescein
Performance
Excitation:
470 nm
Detection:
545 nm
Dynamic Range:
0-500 ppb
2 gain settings: 0-25 and 0-500 (software controlled)
Instrument
Detection limit:
<0.01 ppb*
Actual
Detection limit:
0.03 ppb**
Linearity:
0.99 R
2
Response Time:
0.03 to 2 sec
* 3x SD in RO water
** Calibrated against Fluorescein solution
3.1.4. Rhodamine
Performance
Excitation:
520 nm
Detection:
650 nm
Dynamic Range:
0-1000 ppb
2 gain settings, 0-50, 0-1000 (software controlled)
Instrument
Detection limit:
<0.01 ppb*
Actual
Detection limit:
0.06 ppb**
Linearity:
0.99 R
2
Response Time:
0.03 to 2 s
* 3x SD in RO water
** Calibrated against Rhodamine solution
Page 8
© 2018 Valeport Ltd
0901814c - Hyperion Fluorometer
Page 8
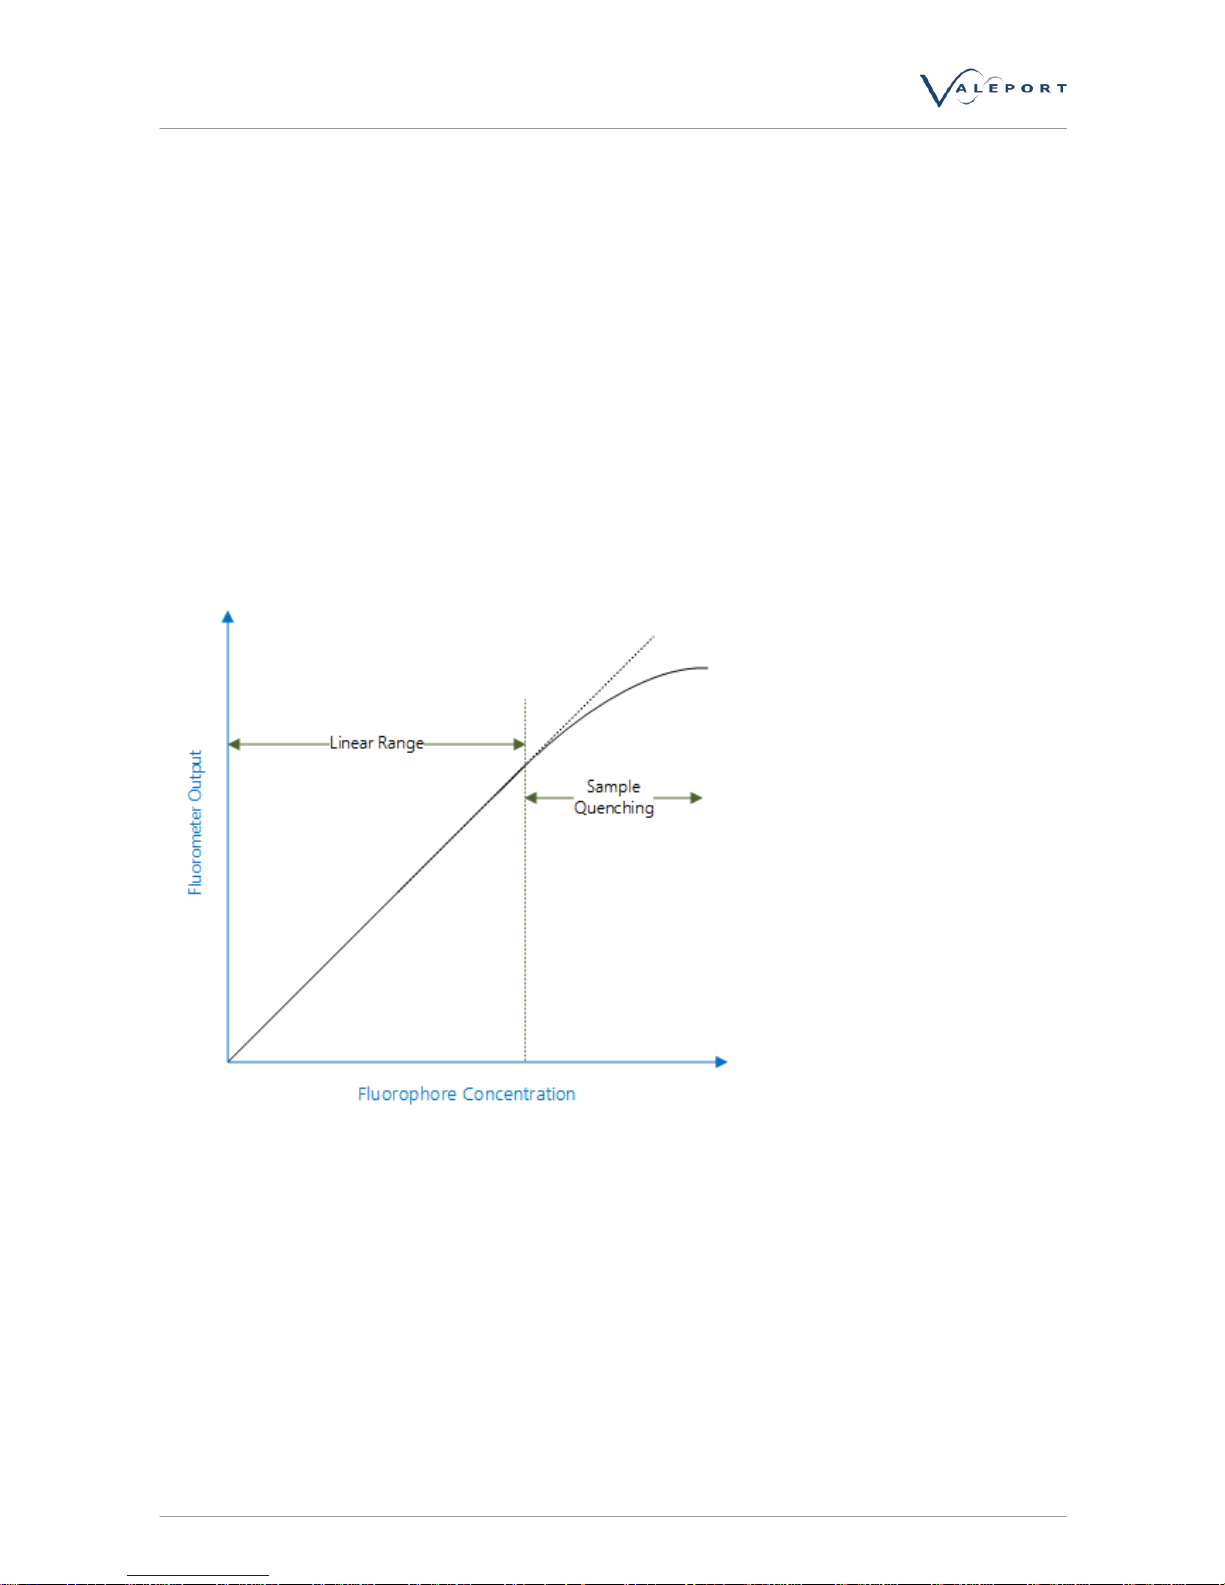
3.2. Linear Observation Range
The linear range is the concentration range for which the fluorometer signal is directly proportional to
the concentration of the fluorophore. The linear range starts at the minimum detection limit (MDL)
and extends to the upper limit of the instrument (dependent on fluorophore properties, optical filters,
LED power, sample volume and optical path length).
Hyperion Fluorometers have a calibrated linear response for 2 gain settings (e.g. the ranges 0-40 µg/l
(G5) and 0-800 µg/l (G1) for chlorophyll a). At higher concentrations, unlike analogue devices which
generally flat-line at full-scale deflection (e.g. FSD 5V) the Hyperion will continue to output a signal
which increases with concentration (i.e. meaningful data), though which is no longer guaranteed to
be linear.
At very high fluorophore concentrations, signal quenching can occur, whereby the instrument output
does not increase linearly with fluorophore concentration (roll-off) and may decrease at even higher
levels.
To perform a quick linearity check, dilute the sample 1:1 with RO water. If the reading decreases by
50%, the sample is in the linear range. If the reading decreases by less than 50% or even increases,
the sample is above the linear range.
Page 9

© 2018 Valeport Ltd
Sensors
Page 9
3.3. Quenching
Quenching refers to the reduction in fluorescence of a fluorophore. Several processes can result in
quenching:
1. Chloride is known to quench quinine sulphate and Fluorescein. It is, therefore, advisable to
prepare any fluorophore solutions with RO* or DI** water.
2. Temperature quenching - as the temperature of the sample increases, the fluorescence decreases,
that is, fluorescence is sensitive to temperature. In order to improve accuracy, measure the sample
at different temperatures and derive corrections for changes in temperature.
3. Photo-bleaching (or fading) is the (permanent) degradation of a fluorophore molecule by light
resulting in lower signal levels. Photo-bleaching is dependent on exposure (intensity of light and
duration) and wavelength (UV is more damaging than longer wavelengths). Use of more robust
fluorophores is recommended to avoid photo-bleaching.
* Reverse Osmosis
** De-Ionised
Page 10

© 2018 Valeport Ltd
0901814c - Hyperion Fluorometer
Page 10
3.4. Turbidity
Valeport's Turbidity technology is essentially two sensors in one. The first is a “classic” nephelometer,
using a 90° beam angle for turbidity levels between 0 and 2000 NTU. The second sensor uses optical
backscatter - OBS (~120° beam angle) for turbidity levels beyond 10 000 NTU. Both sensors output
data simultaneously, at a programmable rate, so there is no need to switch ranges as conditions vary.
Intelligent sampling and the use of a 24 bit ADC eliminates the need to switch gain. The optical head
is very compact, measuring just 20mm diameter and is rated to full ocean depth.
Excitation\Detection:
850nm
Linear Range:
Nephelometer 0 to >1 000 NTU - linear response
Optical Backscatter: 0 to 6 000 NTU - linear response
(>6,000 NTU has a non-linear monotonic response that allows derivation
of higher values using look-up tables)
Minimum Detection
Level
0.03 NTU
3.4.1. Safety Statement
Valeport's turbidity sensor uses a near Infra Red (NIR) LED operating at 850 nm with a reflector
producing a fairly narrow output beam. As the photo-response of the eye is low at 850 nm the blink
reflex and iris contraction reflex are not activated. NIR LEDs generally produce very low levels of
radiation and pose no threat to the human eye. A photometric test report was commissioned by
Valeport in accordance with BS EN 62471. For this the LED was set to 25 times the operational power
and the sensor was classified as exempt. However, it is best practice to avoid extended exposure to
the LED and it is recommended not to look directly into the sensor windows.
The Turbidity sensor is classified EXEMPT under the standard 62471.
As a Hyperion Turbidity instrument is classified as EXEMPT a hazard label in not required.
Never look directly into the Hyperion aperture
Page 11

© 2018 Valeport Ltd
Data Acquisition
Page 11
4. Data Acquisition
Hyperion Fluorometers are designed for both static monitoring and profiling operations either as a
standalone instrument or as part of a profiling multi sensor instrument.
The Fluorometer should be mounted with the window on the front face of the instrument and
therefore, the beam of excitation light directed into the water body to be analysed. During the
synchronised observation period ambient light is measured while the Hyperion LED is off and the
fluorescence signal of the fluorophore when the LED is on in order to cancel out the ambient light
effects.
If very high ambient light levels are encountered, e.g. bright sunlight, in shallow water where there is a
light coloured \ reflective bottom, the receiver may become saturated and return negative number
results. If this happens some form of shading will be required and the sensor not mounted so it
points directly at the bottom.
4.1. Setting the Gain
The Hyperion is set to the default range, for its specific analyte, before leaving Valeport.
The default range for any analyte w ill be its low range and, therefore, the instrument w ill be set to
maximum sensitively and gain. This w ill allow the measurement of low concentrations of the analyte.
Within this range there w ill be a linear response over 3 orders of magnitude
For Example:
in the case of Chlorophyll the default range is: 0.025 µg/l (MDL) to 25.0 µg/l (FSD)
In the case of Fluorescein the default range is: 0.01 ppb (MDL) to 25 ppb (FSD)
If high fluorophore concentrations are encountered, the range should be set to the non default
setting to allow a linear response over a far wider range.
The gain can be set as part of the setup wizard in DataLog x2:
Page 12

© 2018 Valeport Ltd
0901814c - Hyperion Fluorometer
Page 12
For dye tracing applications, we
recommend using the Hyperion at
the default range, that is, high
gain\sensitivity to reduce the quantity
of dye required and, therefore, the
visibility / load on the environment
and or disposal costs.
Turbidity
There is no gain setting for Turbidity. Both nephelometer and OBS data are exported to file. Beyond
2000 NTU the OBS sensor data should be used.
Page 13

© 2018 Valeport Ltd
Data Acquisition
Page 13
4.2. Output Rate
The signal output can be configured between 0.5 Hz and 32 Hz (free running) using software control.
The unit is factory pre-set to the maximum synchronous averaging period (0.5 Hz or 2 secs) in order
to be able to resolve the minimum detection limit.
Fast data rates should only be used w here good signal levels are encountered, otherwise features
may be lost in the background noise. In very low signal conditions, signal:noise ratio issues w ill,
therefore, limit the maximum vertical speed and resolution w hen running profiles.
4.3. Functional Check
To perform a functional test connect the Hyperion to both pow er and PC using the supplied Y
cable.
Run DataLog x2, available from the Valeport Website as a free download - www .valeport.co.uk/
Products/DataLog x2
Connect the Hyperion to DataLog or Terminal x2 using the connect w izard:
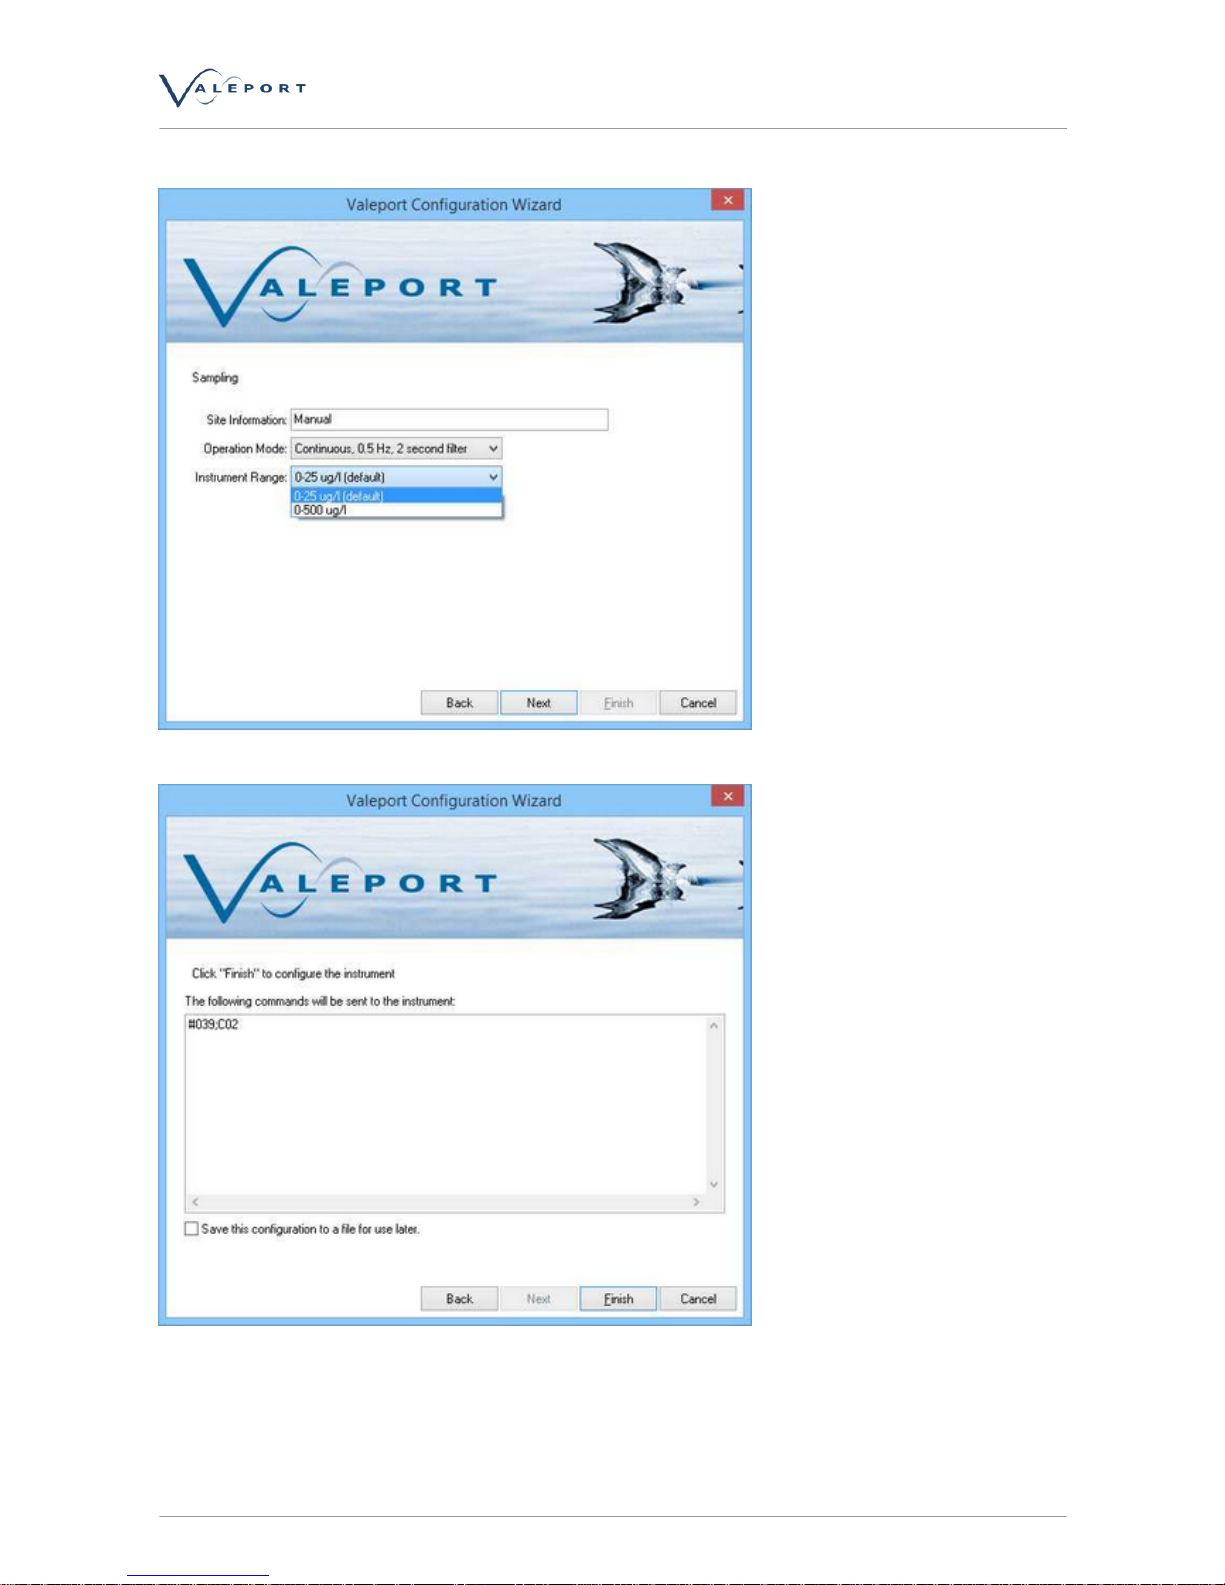
Once connected, use the Configure w izard to set the instrument up:
Select your Comm Port, then select Next:
Page 14

© 2018 Valeport Ltd
0901814c - Hyperion Fluorometer
Page 14
Leave this dialogue in its default settings, then select Next:
The x2 program will now interrogate the instrument and get the settings and display them, then
select Next:
Page 15
© 2018 Valeport Ltd
Data Acquisition
Page 15
Set your operational mode and Instrument Range setting, then select Next:
If there are any new settings to be up loaded to the instrument pressing Finish will send them:
Page 16

© 2018 Valeport Ltd
0901814c - Hyperion Fluorometer
Page 16
Check that data is being received (field 4) see Data Output Format
Now check the following:
The LEDs are on and light is being emitted from the fibres.
The magnitude of the data received increases when the supplied fluorescent target is held at 45° to
the sensor window:
By altering the angle of the target the magnitude of the reading should change thereby showing the
correct operation of the sensor.
If the test target is missing then a piece of good quality white paper can be used.
Page 17

© 2018 Valeport Ltd
Operation with MIDAS CTD+
Page 17
5. Operation with MIDAS CTD+
If the Hyperion Instrument is used with a MIDAS CTD+ it should be configured using DataLog x2
software as follows:
Baud Rate:
38400
Mode:
Continuous
The MIDAS CTD+ must be configured using DataLog Pro ver 04007125F1 or later
Page 18

© 2018 Valeport Ltd
0901814c - Hyperion Fluorometer
Page 18
6. Electrical
Voltage:
9 - 30V DC isolated
Power:
40mA @ 12V DC
6.1. Connector Pin-Out
Pin
Function
1
RS232 GND
2
Tx 232 out from SVS (485A)
3
Rx 232 in to IPS (485B)
4
+V(8-20V)
5
/Enable 485
6
-V
Note: to enable RS485 comms, link pins 1 and 5.
Page 19

© 2018 Valeport Ltd
Communications
Page 19
7. Communications
The instrument will operate in real time, with setup performed by direct communications with PC
before and after deployment.
Both RS232 and RS485 outputs are available, selected by command code.
RS232 data may be taken directly into a PC over cables up to 200m
RS485 is suitable for longer cables, up to 1000m, and allows for multiple addressed units on a single
cable.
Baud Rate
2400 - 115200
Protocol
8 data bits, 1 stop bit, No parity,
No flow control
7.1. Data Output Formats
The Hyperion outputs a single NMEA style data telegram
Example: $PVHYP,01,01,1234.45, 1.2345, 01, C02,*7F
Where:
Field
Number
Description
Type
Description
1
NMEA Header
String
Valeport HYPerion
2
Instrument ID
Integer
3
Parameter ID
Integer
1 = Chlorophyll a
2 = Fluorescein
3 = Rhodamine
4
Parameter
Mean
Float
5
Parameter SD
Float
6
Parameter Units
Units
ug/l for Chlorophyll a
ppb for Fluorescein
7
Operating
Mode
String
C02 (default)
8
Check Sum
An exclusive OR sum between all characters between the '$'
and the '*'of the string
Page 20

© 2018 Valeport Ltd
0901814c - Hyperion Fluorometer
Page 20
7.2. Operating Modes
Hyperion can operate in a number of modes.
The set up of these modes uses a macro like format where a command C02 or M32 (# not required)
will set the unit into a particular mode and set multiple filter settings appropriately for that mode and
update period.
Other operational modes and filter settings are available - please contact Valeport with your
specific requirements.
7.2.1. Mode C - Continuous
Mode C is the default setting for Hyperion.
In this mode the instrument will be set into a continuous out put cycle of appropriately meaned and
filtered data.
Mode C02 (C zero 2) will output a reading every 2 seconds. This is the maximum synchronous
observation measurement period.
Mode C04 (C zero 4) will output a reading every 4 seconds but that will be a mean of 2, 2 second
synchronous observation measurement periods.
7.2.2. Mode M - Continuous Measurement
Mode M will perform a measurement and data output at the rate specified up to 32Hz.
Filter settings are appropriately set for the update rate.
M1 performs continuous measurements at 1Hz
M2 performs continuous measurements at 2Hz
...
M32 performs continuous measurements at 32Hz
The filter time can be adjusted by using the #222;x command but must be followed by #028 to start
the instrument off again and not an M command because that will reset the filter setting to the
default for that update rate.
Page 21

© 2018 Valeport Ltd
Communications
Page 21
7.3. Hash (#) Codes
Hash codes are used to configure the instrument. They can be applied using a Terminal program or
DataLog x2 software
# Code
Variable
Description
#001
address_485
Sets the address value for addressed system
#002
address_485
Reads the address value for addressed system
#005
address_mode
Turns on or off address mode 0 = Off 1 = On
#006
address_mode
Reads address mode on or off
#015
last_measure
Request last measurement
#022
cal_date
Reads ASCII string of the last cal date
#028
run
Place unit into run mode
#032
version
Reads the firmware version of the instrument
#034
serial_number
Reads the serial number of the instrument
#037
site_info
Enter site information
#038
site_info
Read the site information
#039
set_sampling_mode
Set sampling mode without running
#040
last_sampling_mode
Read last sampling mode
#059
baud_rate
Baud rate. 2400,4800,9600,19200,115200 or 230400
#082
rs_485_selected
Selects if in RS485 mode. Usually done with control line
#083
rs_485_selected
Read status
#102
user_output
Enter output item
#103
user_output_dummy_out
Read output item
#104
user_format
Enter 'c' style format string
#105
user_format_dummy_out
Read format string
#126
parameter_id
Read parameter id
#128
parameter_units
Read units
#222
averaging_constant
Set the number of samples to average
#223
averaging_constant
Read the averaging length
#401
fluoro_gain
Report Fluorometer gain
Page 22

© 2018 Valeport Ltd
0901814c - Hyperion Fluorometer
Page 22
8. Physical Characteristics
Materials:
Titanium with glass window
Polymer optical fibre
Depth Rating:
6000m
Dimensions:
40mmØ x 179.5mm (including connector)
Weight
0.50 kg (in air)
0.26 kg (in water)
Operating Temperature:
60°C max (without damaging the instrument)
8.1. Dimensions
Page 23

© 2018 Valeport Ltd
Care and Maintenance
Page 23
9. Care and Maintenance
In order to be able make accurate and repeatable measurements, the sensor window must be
kept clean.
Cleaning should be performed using warm soapy water and optical tissue, then rinse with clean
water.
Note:
Organic solvents should not be used to clean the Hyperion.
Strong acids and bases should be avoided.
If fouling of the window is considerable, the unit should be returned to Valeport for servicing.
Page 24

© 2018 Valeport Ltd
0901814c - Hyperion Fluorometer
Page 24
10. Software - DataLog x2
The Hyperion Fluorometers are supplied with DataLog x2 windows software
DataLog x2 Real Time Display
Charting is only possible once data is being recorded
Page 25

© 2018 Valeport Ltd
Ordering and Part Numbers
Page 25
11. Ordering and Part Numbers
Fluorometer
Part No.
DESCRIPTION
0901001-C
Hyperion-C, Chlorophyll a Fluorometer.
Titanium housed, 6000m rated,
Supplied with:
- 0.5m interface cable
- DataLog x2 software
- Manual and transit case
0901001-F
Hyperion-F, Fluorescein Fluorometer.
Titanium housed, 6000m rated,
Supplied with:
- 0.5m interface cable
- DataLog x2 software
- Manual and transit case
0901001-R
Hyperion-R, Rhodamine Fluorometer.
Titanium housed, 6000m rated,
Supplied with:
- 0.5m interface cable
- DataLog x2 software
- Manual and transit case
Non Fluorometer
0901001-T
Hyperion-T, Turbidity Sensor.
Titanium housed, 6000m rated,
Supplied with:
- 0.5m interface cable
- DataLog x2 software
- Manual and transit case
 Loading...