

Unity Opto Technology MVL-5C4SO Datasheet
T-1 3/4 (
φφ
5mm)
HIGH POWER AlInGaP LED LAMPs
MVL-5C4SO
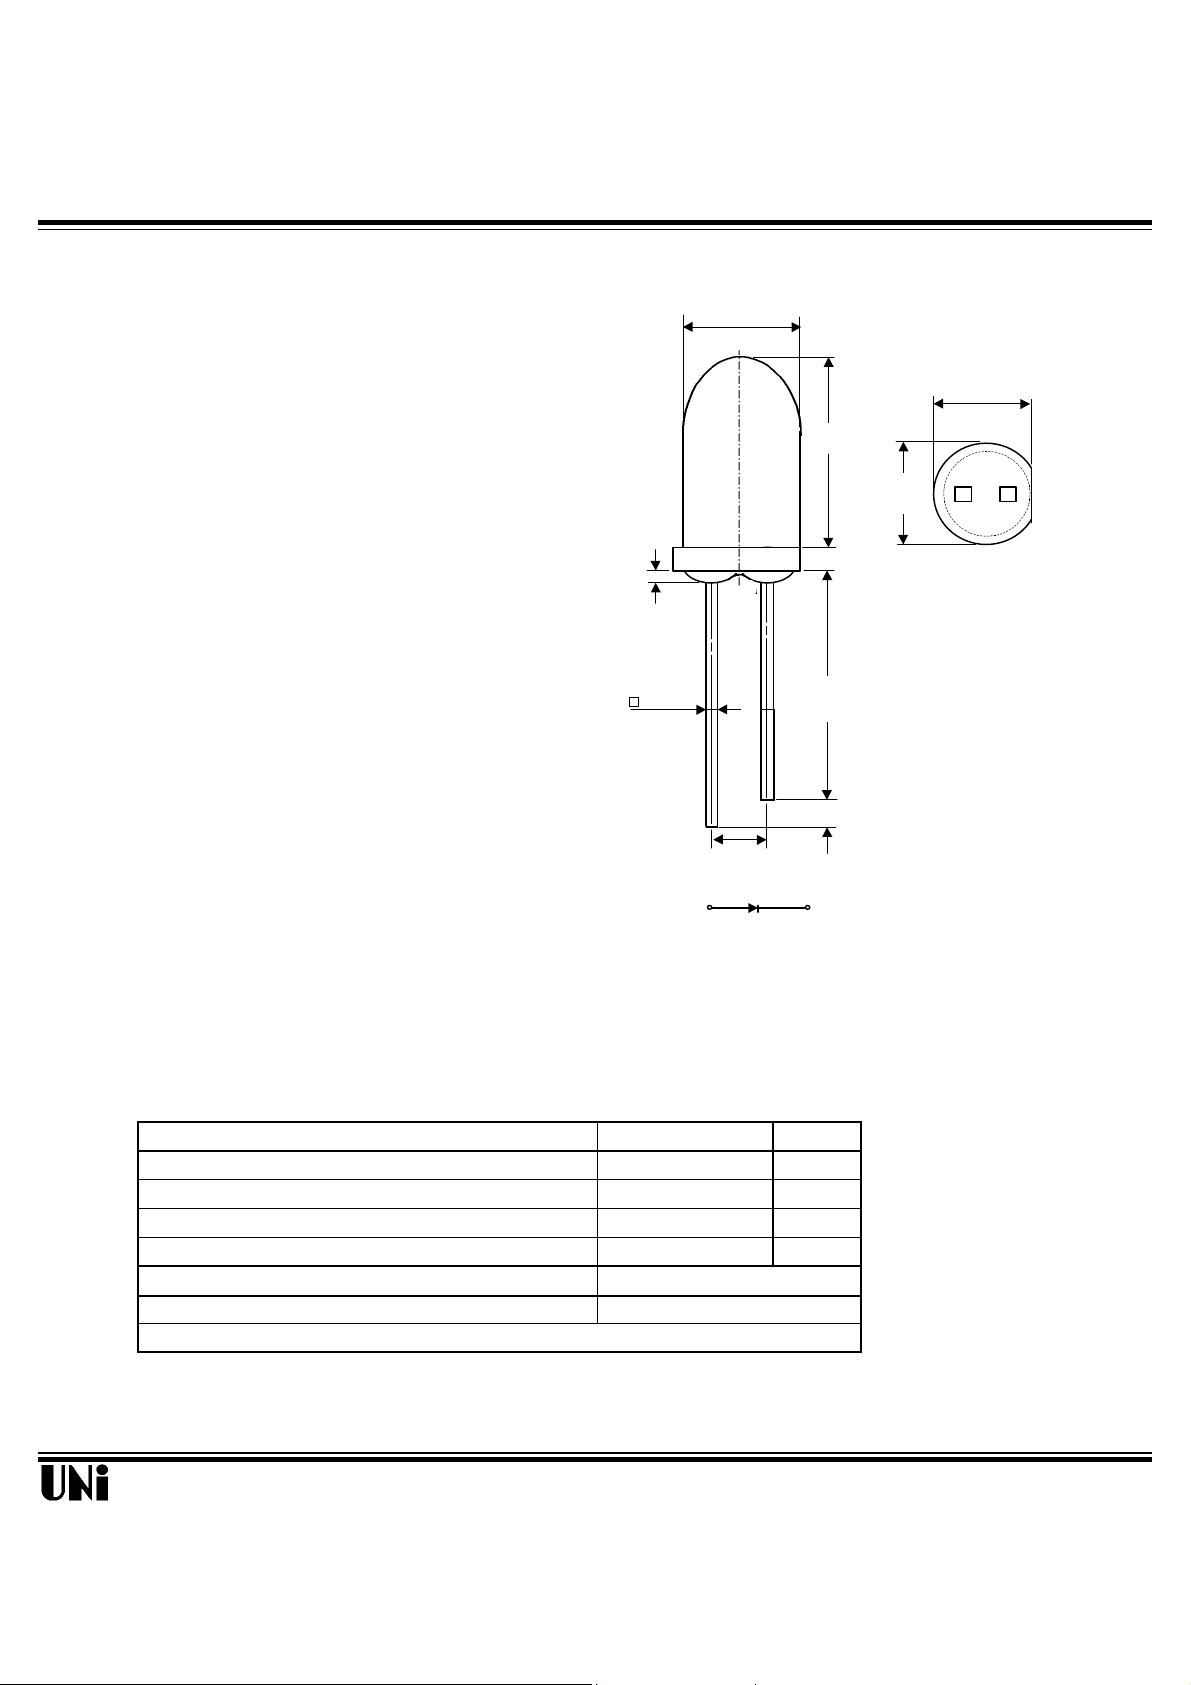
Description Package Dimensions
SEE NOTE 2
The MVL-5C4SO utilizes the latest absorbing
substrate Aluminum Indium Gallium Phosphide
(AlInGaP) LED technology. This LED material
has outstanding light output efficiency over
a wide range of drive current. The package is T-1 3/4
(5mm) water clear standard type.
φ5.00
(.200)
7.60
(.300)
Unit: mm ( inches )
5.40
(.213)
5.60
(.220)
Features
l Ultra - brightness
l Low power consumption
l TTL compatible
l Reliable
Absolute Maximum Ratings
Power Dissipation mW
Peak Forward Current(1/10 Duty Cycle100µs pulse )
Continuous Forward Current mA
Reverse Voltage V
Operating Temperature Range
Storage Temperature Range
Lead Soldering Temperature 1.6 mm from body for 5 seconds at 260oC
25.40 MIN.
0.50 TYP.
(.020)
2.54TYP.
(.100)
A
Notes :
1. Tolerance is ± 0.25 mm (.010") unless otherwise noted.
2. Protruded resin under flange is 1.5 mm (.059") max.
3. Lead spacing is measured where the leads emerge from the package.
(1.000)
SEE NOTE 3
@ TA=25oC
Parameter Unit
Maximum Rating
125
100
mA
50
5
-40oC to +100oC
-40oC to +100oC
C
1.00
(.040)
1.00MIN.
(.040)
Unity Opto Technology Co., Ltd.
09/06/2000
MVL-5C4SO
Optical-Electrical Characteristics @ T
A
V
F
R
d
0
° 10° 20°
Forward Current I
F
(mA)
FORWARD VOLTAGE
Parameter Test Conditions Symbol Min . Typ . Max . Unit .
Luminous Intensity IF=20mA I
Forward Voltage IF=20mA V
Reverse Current I
VR=5V
Wavelength IF=20mA λp/λ
600 1500 - mcd
- 1.9 2.4 V
- - 100
- 610/605 - nm
Spectral Line Half Width IF=20mA ∆λ - 20 - nm
Viewing Angle
IF=20mA
2θ
1/2
- 30 - deg.
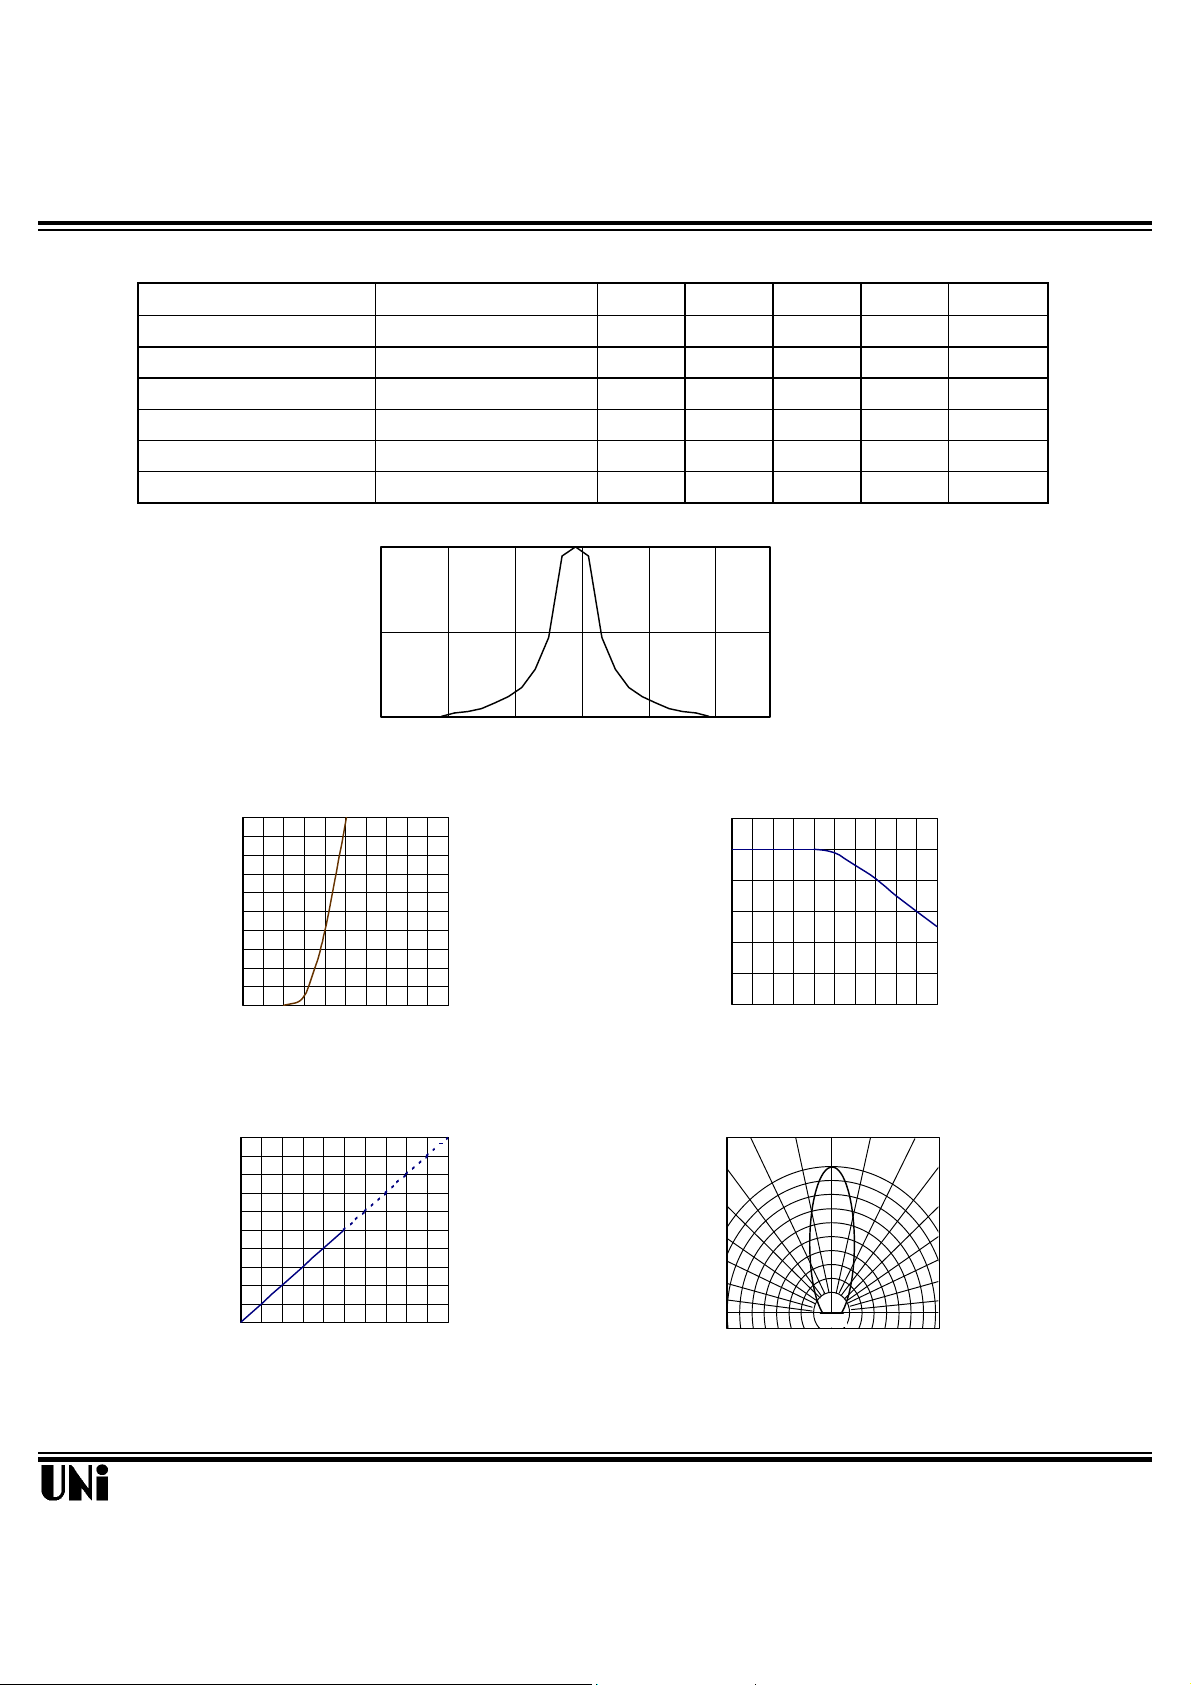
Typical Optical-Electrical Characteristic Curves
1
0.5
Relative Intensity
0
540 565 590 615 640 665
Wavelength (nm)
FIG.1 SPECTRAL DISTRIBUTION
50
40
30
20
10
Forward Current (mA)
0
1.2 1.6 2.0 2.4 2.8 3.2
Forward Voltage (V)
FIG.2 FORWARD CURRENT VS.
60
50
40
30
20
10
0
0 20 40 60 80 100
Ambient Temperature TA (
o
C)
FIG.3 FORWARD CURRENT
VS. AMBIENT TEMPERATURE
=25oC
µA
Relative Radiant Intensity
FIG.4 RELATIVE RADIANT INTENSITY
Unity Opto Technology Co., Ltd.
5
4
3
2
1
0
0 20 40 60 80 100
Forward Current (mA)
VS. FORWARD CURRENT
1.0
0.9
0.8
0.5 0.3 0.1 0.2 0.4 0.6
FIG.5 RADIATION DIAGRAM
30°
40°
50°
60°
70°
80°
90°
09/06/2000
 Loading...