

Page 1

Table of Contents
Preface
Introduction ........................................................................................................xi
PowerColor ColorSync Separator ........................................................................xi
PowerColor Press Edition ..................................................................................xii
How to Use This Manual ..................................................................................xiii
Typographical Conventions ..............................................................................xiii
Related Documentation ....................................................................................xiii
Chapter 1: Installation
Configuration Requirements ............................................................................1-1
Host Computer ............................................................................................1-1
Scanner ........................................................................................................1-1
Setting Up and Installing PowerColor..............................................................1-2
Installing on an Apple Macintosh..............................................................1-2
Configuring Your Monitor for PowerColor............................................1-2
Installing the PowerColor Software ......................................................1-3
Assigning Memory to PowerColor..........................................................1-5
Installing on a Windows PC........................................................................1-6
Configuring Your Display ......................................................................1-6
Installing the PowerColor Software ......................................................1-6
Table of Contents iii
Page 2

Chapter 2: Getting Acquainted
Overview of the Scanning Process ....................................................................2-2
Launching PowerColor ....................................................................................2-2
Setting Preferences ............................................................................................2-3
Changing Screen Gamma ................................................................................2-6
Making an Overview..........................................................................................2-7
Image Selection Tools ......................................................................................2-8
Creating Regions ..............................................................................................2-9
Images and Memory..................................................................................2-10
Region Names............................................................................................2-11
Working with Regions ....................................................................................2-12
Activating Regions ....................................................................................2-12
Adjusting the Queue Manager Window ....................................................2-13
Manipulating Regions in the Queue Manager ........................................2-14
Saving the Queues ....................................................................................2-14
Previewing Regions....................................................................................2-15
Dynamic Operations in the Queue Manager............................................2-16
Transforming Images................................................................................2-16
Viewing an Image in Detail ......................................................................2-17
Updating Images ............................................................................................2-18
Updating Automatically ............................................................................2-18
Updating Manually....................................................................................2-18
Saving and Recalling Settings........................................................................2-19
iv PowerColor User Guide
Page 3

Chapter 3: Correcting Images with
PowerColor Photo/RGB Mode
Using the RGB Probe ........................................................................................3-2
RGB Probe Window Configurations............................................................3-2
Setting Highlight and Shadow..........................................................................3-4
Using the Gray Eyedropper..........................................................................3-7
Adjusting Tonal Range in Basic Mode ............................................................3-8
Adjusting Tonal Range in Expert Mode..........................................................3-10
Using the RGB Controls ..................................................................................3-12
Adjusting Colors ........................................................................................3-12
Correcting Colors..................................................................................3-13
Manipulating the Histograms ............................................................3-14
Using the ColorSync Profiles ..........................................................................3-15
Storing ColorSync Profiles ..................................................................3-15
Using Profiles ......................................................................................3-16
Table of Contents v
Page 4

Chapter 4: Correcting Images with
PowerColor Press/CMYK:
Production Mode
Understanding the CMYK Probe........................................................................4-1
Probe Location ............................................................................................4-1
Displaying Density Values............................................................................4-2
Displaying Color Plates................................................................................4-2
CMYK Values Before and After Corrections..................................................4-2
Selecting Fixed Reference Points ................................................................4-3
Using Production Color Controls......................................................................4-4
Production Mode Workflow ........................................................................4-4
Setting Highlight and Shadow Points ..............................................................4-6
Setting Dot Limits..............................................................................................4-9
Setting an Image’s Tone..................................................................................4-10
Adjusting Color in Tone Regions ........................................................4-10
Correcting Color Casts..........................................................................4-10
Setting Multiple Gray Points................................................................4-11
Making Selective Color Corrections................................................................4-12
Selecting Colors to be Corrected ..........................................................4-12
Using the Sliders to Correct Individual Colors....................................4-13
vi PowerColor User Guide
Page 5

Chapter 5: Correcting Images with
PowerColor Press/CMYK:
Expert Mode
Calibrating PowerColor Press ..........................................................................5-1
Understanding Calibration..........................................................................5-1
Preparing the Target for Output..................................................................5-2
Setting Up the Gray Balance ............................................................................5-5
Editing the Gray Balance Table ..................................................................5-6
Controlling Dot Gain ........................................................................................5-7
Setting Dot Gain ..........................................................................................5-7
Using Tone Controls........................................................................................5-10
Removing Color Casts..........................................................................5-10
Tone Curves..........................................................................................5-11
Using the Gray Eyedropper ..................................................................5-12
Setting Highlight and Shadow Points ............................................................5-13
Automatically ......................................................................................5-13
Manually ..............................................................................................5-13
Using Gradation Controls ..............................................................................5-16
Understanding Gradation..........................................................................5-17
Working with Gradation Curves................................................................5-20
Using Negative Slope Detection ................................................................5-21
Working with the Gradation Table............................................................5-22
Determining Black Generation ................................................................5-23
Table of Contents vii
Page 6

Chapter 6: Unsharp Masking
Applying Unsharp Masking ..............................................................................6-1
Controlling USM in Tonal Regions ............................................................6-2
Manually Adjusting the Region Control Bars ......................................6-4
Controlling Edges between Tonal Regions............................................6-4
Using the Unsharp Masking Curve ............................................................6-5
Applying Descreening........................................................................................6-6
Descreening options ....................................................................................6-6
Customizing the Descreening Function......................................................6-7
Chapter 7: Scanning Images to Disk
Reviewing Scan Settings ..................................................................................7-1
Checking Toolbar Parameters ....................................................................7-2
Scan Type................................................................................................7-3
Scan Mode ..............................................................................................7-3
Line Screen ............................................................................................7-4
Sampling ................................................................................................7-4
Using the Resolution Lock Tool ............................................................7-4
File Size ..................................................................................................7-4
Width and Height ..................................................................................7-4
Scale........................................................................................................7-5
Naming Final Scans ....................................................................................7-5
Performing Final Scans ....................................................................................7-6
Scanning Images Individually....................................................................7-6
Batch Scanning All Images ........................................................................7-6
Pausing or Stopping the Scanning Process................................................7-6
Chapter 8: Tips and Tricks
Tips and Tricks ..................................................................................................8-1
viii PowerColor User Guide
Page 7

Preface
Page 8

Page 9

Introduction
PowerColor is a powerful scanning software package for the UMAX Technologies,
Inc. scanner. With its many flexible features, PowerColor enables you to perform
complex color corrections and to make professional RGB or CMYK color separations from your scanned images quickly and easily.
Because it manipulates 16-bits per channel color data directly on the host computer, PowerColor gives you the opportunity to preview changes during the initial
scanning process without additional prescanning. PowerColor also provides
instant CMYK feedback on your image transformations, so you can see the results
of your changes immediately.
For performing CMYK separations, PowerColor offers the ease and automation of
ICC profiles with our ColorSync Separator, as well as high level control with the
PowerColor Conventional Separator.
PowerColor and ColorSync (Macintosh)
The Macintosh version of PowerColor is fully ICC compatible with the use of 16bits per channel input, output, and display profiles. Output profiles can be either
RGB or CMYK, allowing for flexible color matching for a wide variety of output
devices.
Preface xi
Page 10

PowerColor includes the following features:
• Multiple, independent scan regions
• Color, range, and gradation control for individual scan regions
• Image manipulation tools, including rotation, cropping, and unsharp
masking
• Flexibility in setting lpi, dpi, size, and scale for individual scan regions
• Scanning to commonly used file formats
• Use of standard ColorSync ICC profiles (Macintosh only)
PowerColor Press
PowerColor Press is a high-end CMYK separator based on a density-to-dot color
engine. This software is intended for use by those who understand the concepts
behind color separation and reproduction as they relate to offset printing.
PowerColor Press offers sophisticated, advanced features for creating high-end
color separations, including:
• Selective color correction
• Automatic adjustments for wanted and unwanted colors
• Two operation modes for general production and expert work
• Input/output three-color and four-color density range gradation control
• Cast correction with diffused highlight and shadow settings
• UCR/GCR gradation control
• User definable dot gain
• User definable gray balance
xii PowerColor User Guide
Page 11

How to Use This Manual
This manual explains how to install PowerColor and guides you through the
functions of the software. It contains all the information you need to begin using
PowerColor with your scanner. Once you have installed the software, this manual
will help you understand the process and tools for scanning, color correction, and
image manipulation.
Typographical Conventions
The following typographical conventions are used throughout this guide:
Menus and menu options, dialog box selections, on-screen messages, and keyboard keys appear in bold: e.g. Manual Update, Preview, etc.
Note: Notes provide useful information about
the current topic.
Related Documentation
This guide assumes that you are familiar with the Macintosh or Microsoft
Windows interface and operating system. For detailed information on your computer and its interface, refer to your computer’s installation guide. For details on
using your scanner, refer to the Umax Technologies, Inc. Installation and
Operation Manual provided with your scanner.
Preface xiii
Page 12

Page 13

Installation
1
1
Page 14

Page 15

his chapter describes the configuration requirements for PowerColor and
T
guides you through the software installation process for both the Macintosh
and Windows platforms.
Configuration Requirements
Before installing PowerColor, make sure your system meets the minimum configuration requirements indicated below.
Host Computer
In order to take full advantage of the PowerColor software,
your host computer must meet the following minimum requirements:
Macintosh
®
• Macintosh
sor installed
• 24-bit color display adapter
PowerPC 8100 computer or better with floating point coproces-
• 17" or larger high-resolution monitor (1024 x 768 dpi)
• 64 MB RAM available (128 MB recommended)
• System 7.5 or higher
Windows PC
• Pentium class computer running at 266 megahertz or above
• 24-bit color display adapter
• 17” or larger high-resolution monitor (1024 x 768 dpi)
• 32 MB RAM available (64 MB recommended)
• Windows NT 4.x or Windows 95/98
Scanner
PowerColor works with the UMAX Technologies, Inc. series of scanners.
For details on connecting your scanner to your host computer, refer to your
scanner’s user guide.
Chapter 1: Installation 1-1
Page 16
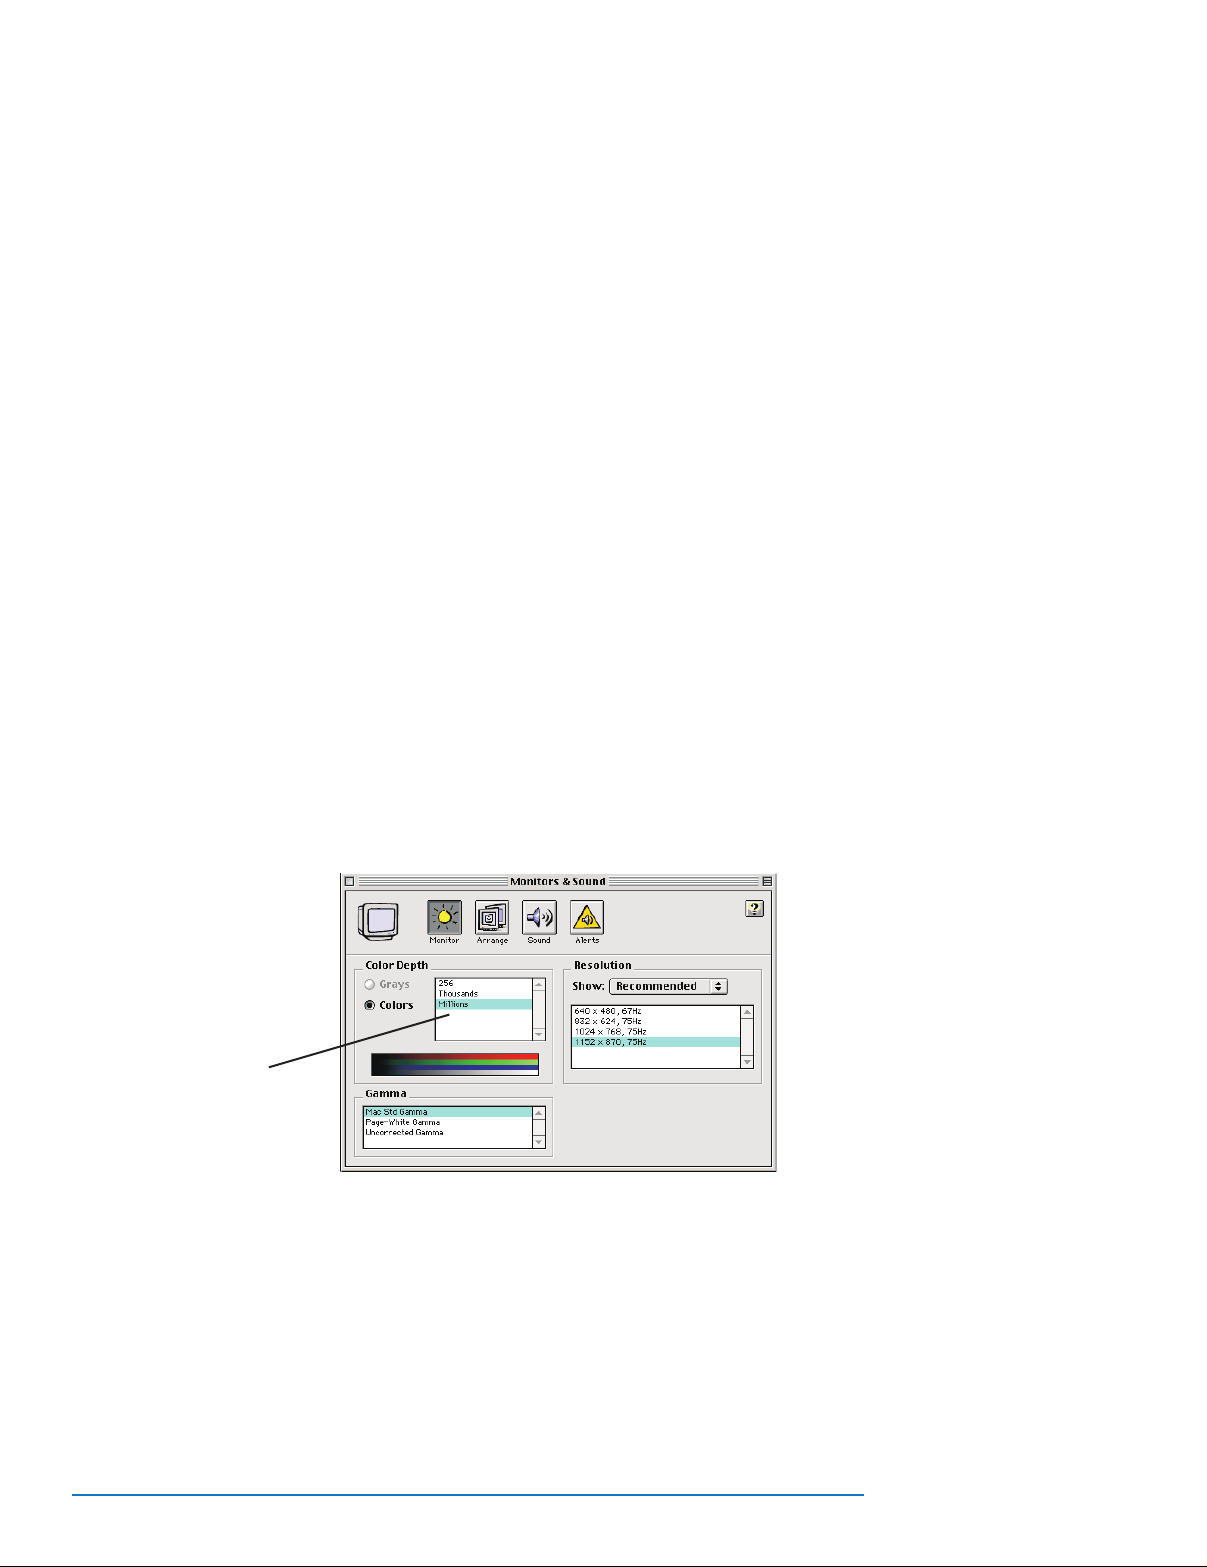
Figure 1–1
Monitors control
panel.
➀
–Millions setting.
Setting Up and Installing PowerColor on
an Apple Macintosh
This section gives instructions for installing PowerColor on an Apple Macintosh
computer. For installation on a computer running Microsoft Windows, turn to
page 1-6.
Configuring Your Monitor for PowerColor
PowerColor Needs to run in 24 or 32 bit color mode. To configure your monitor
for PowerColor, follow the steps below:
1. Open Control Panels in the Apple menu.
2. Open the Monitors control panel and set your monitor to millions of colors
(see Figure 1–1).
➀
1-2 PowerColor User Guide
Page 17
Figure 1–2
PowerColor installer
splash screen
Installing the PowerColor Software
To install the PowerColor software, proceed as follows:
1. Insert the PowerColor CD into your CD-ROM drive and double-click on the
Installer icon.
2. Click on Continue... in the PowerColor installer splash screen.
Chapter 1: Installation 1-3
Page 18
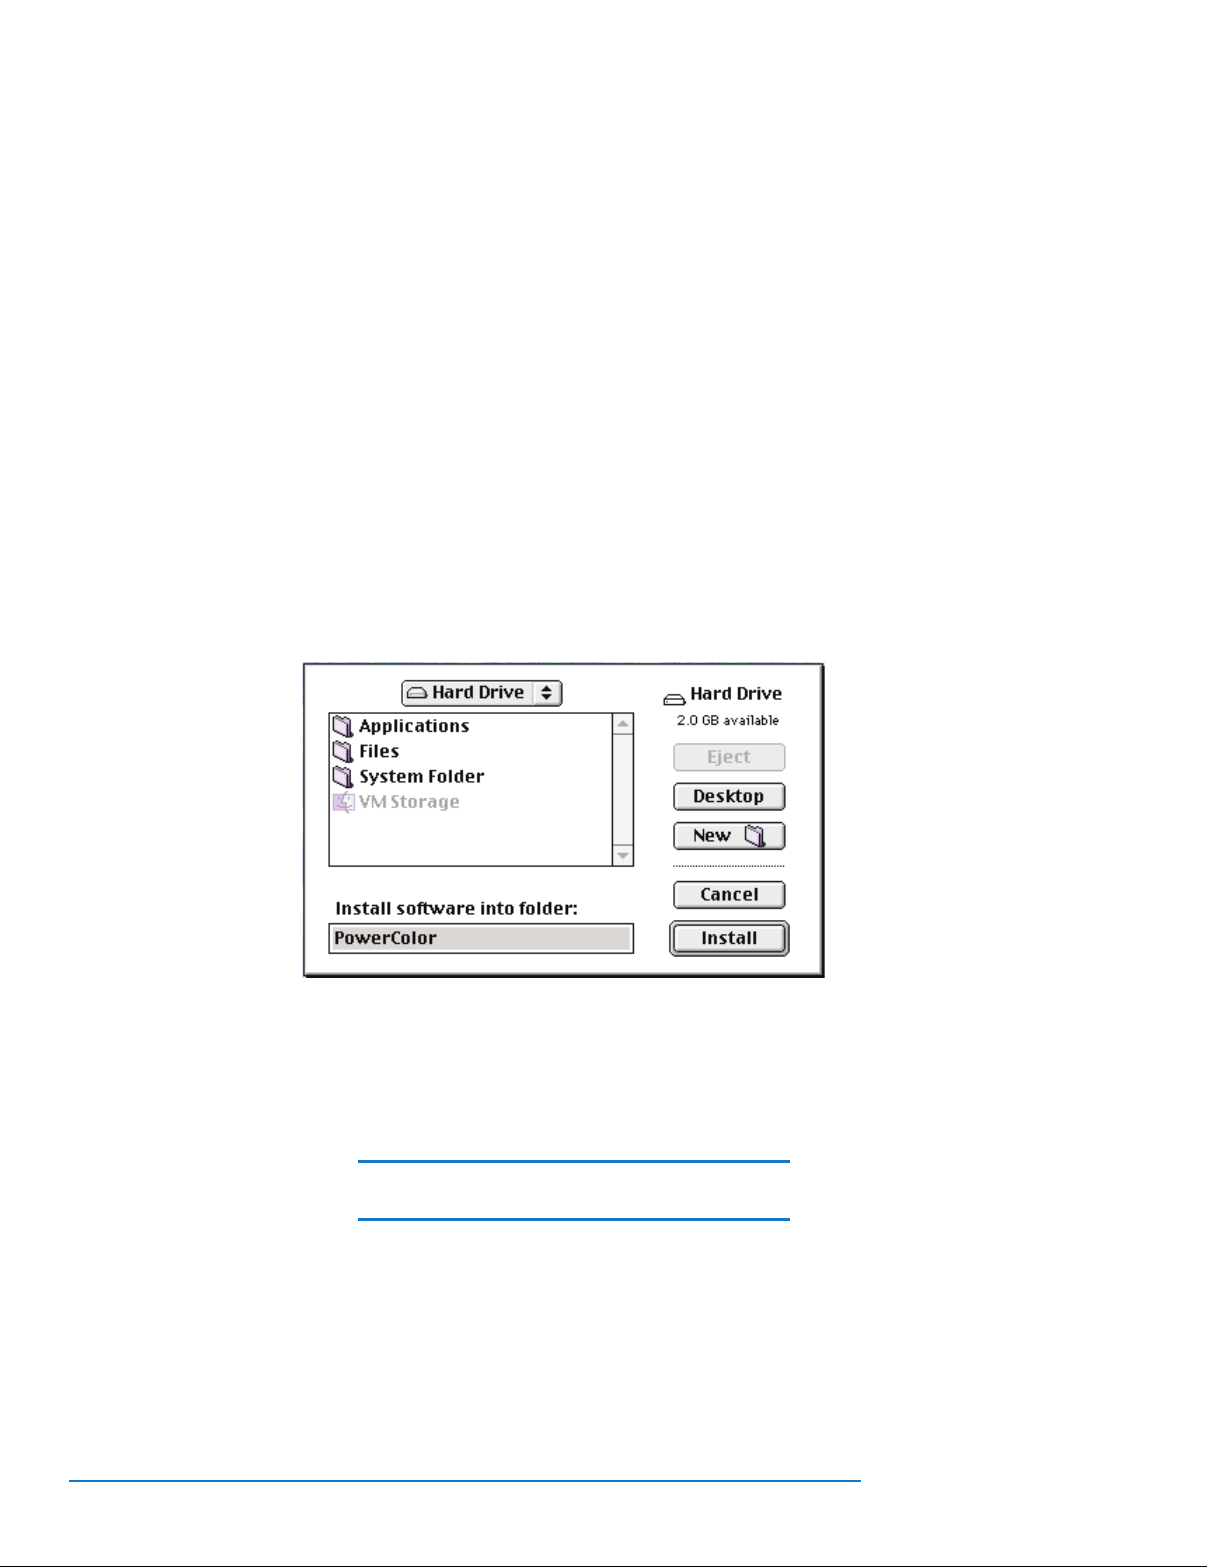
Figure 1–3
Installation destination window
3. Read and adhere to License Agreement. Click the agree button to continue.
4. Click the box next to Standard to install the Application and ColorSync
Profiles. If you choose to install just one component, click on the arrow to
the left of the box for separate component installation options. After selecting your installation options, click the install button to continue.
5. If you want to change the location in which PowerColor will be installed,
follow these steps:
• Click on the Install Location drop down menu.
• Choose Select Folder in the drop down menu.
• In the destination window that appears, select the destination disk and
folder of your choice for PowerColor.
Note: To install PowerColor, you must have at
least 10 megabytes of free hard drive space.
• Highlight the folder where PowerColor will reside and click on Install.
6. Follow the screen prompts to complete installation and exit the installer
Installation of your PowerColor software is now complete.
1-4 PowerColor User Guide
Page 19

Figure 1–4
PowerColor Get Info
dialog box
Note: If you are reinstalling or upgrading from a
previous version of PowerColor, before launching the application, delete all PowerColor
Preferences files (located in the Preferences
folder within the System Folder). PowerColor
will create a new preferences file the first time
you launch it.
Assigning Memory to PowerColor
To increase the amount of memory assigned to PowerColor, proceed as follows:
1. Select the PowerColor application icon in the PowerColor folder and choose
Get Info from the File menu (+I).
2. In the PowerColor Info dialog box that appears, under Memory
Requirements make sure the Preferred size is set to at least 32 MB. If possible, increase the RAM for PowerColor to 64 MB.
3. Close the PowerColor Info dialog box.
Chapter 1: Installation 1-5
Page 20

Setting Up and Installing PowerColor on
an Windows NT and Windows 95/98
This section gives instructions for installing PowerColor on a PC running
Microsoft Windows 95, 98 or Windows NT. For installation on an Apple
Macintosh, turn to page 1-2.
Configuring your display for PowerColor
PowerColor needs to run in 24 or 32 bit color depth. To configure your display
settings for PowerColor, do the following:
1. Right click on a clear area of your Windows desktop. Choose Properties from
the pop-up window that appears.
2. The Windows Display Properties window will appear. Choose the Settings Tab.
3. In the Color Palette section of the Settings window, choose 24 bit or 32 bit color.
Installing PowerColor
To install the PowerColor software, proceed as follows:
1. Insert the PowerColor CD into your drive and double-click on the Setup icon.
2. The PowerColor installer will launch. You will be asked to specify the location
3. After you have selected the install location, click OK to have the software
1-6 PowerColor User Guide
in which PowerColor should be installed. Use the standard Windows dialog
box to specify a location, or use the default location of:
c:\Program Files\PowerColor
installed to the specified directory.
Page 21
Getting Acquainted
2
2
Page 22

Page 23

owerColor provides a powerful and flexible software interface between your
P
Computer and UMAX Technologies, Inc. scanner. The software offers a wide
array of professional scanning and image manipulation tools with all the convenience and user friendliness of the standard Macintosh or Microsoft Windows
interface, including drop-down menus, multiple windows, point-and-click controls, and keyboard shortcuts.
This chapter covers the following topics:
• Overview of the scanning process
• Launching PowerColor
• Setting Preferences
• Changing Screen Gamma
• Making an Overview
• Image Selection Tools
• Creating Regions
• Working with Regions
• Updating Images
• Saving and Recalling Settings
For details on correcting scanned images, see Chapters 3–6. How to use the
Queue Manager and scan images to disk is discussed in Chapter 7.
Chapter 2: Getting Acquainted 2-1
Page 24

Overview of the Scanning Process
Preparing scans with PowerColor is a simple process with many tools for an efficient and organized workflow. Summarized below are the basic steps in the
PowerColor process:
1. Generate an overview scan of the entire scanning bed:
2. Define regions as desired and add them to the Queue Manager.
3. Select an image from the Queue Manager and perform the desired image
corrections while verifying the results visually and numerically on-screen.
4. Scan the final images to disk using the desired output and file formats.
Launching PowerColor
To launch the application, double-click on the PowerColor icon in the
PowerColor folder, or, if using Windows, click on your Windows Start menu, then
choose PowerColor from withn the UMAX program group. When the application
opens, the menu bar, blank Overview window, Queue Manager, Control Bar and
Toolbar are displayed (see Figure 2–1). These are the tools with which you can
access all of PowerColor’s commands and functions.
Figure 2–1
PowerColor menus:
Toolbar, Control Bar
and Queue Manager
2-2 PowerColor User Guide
Page 25
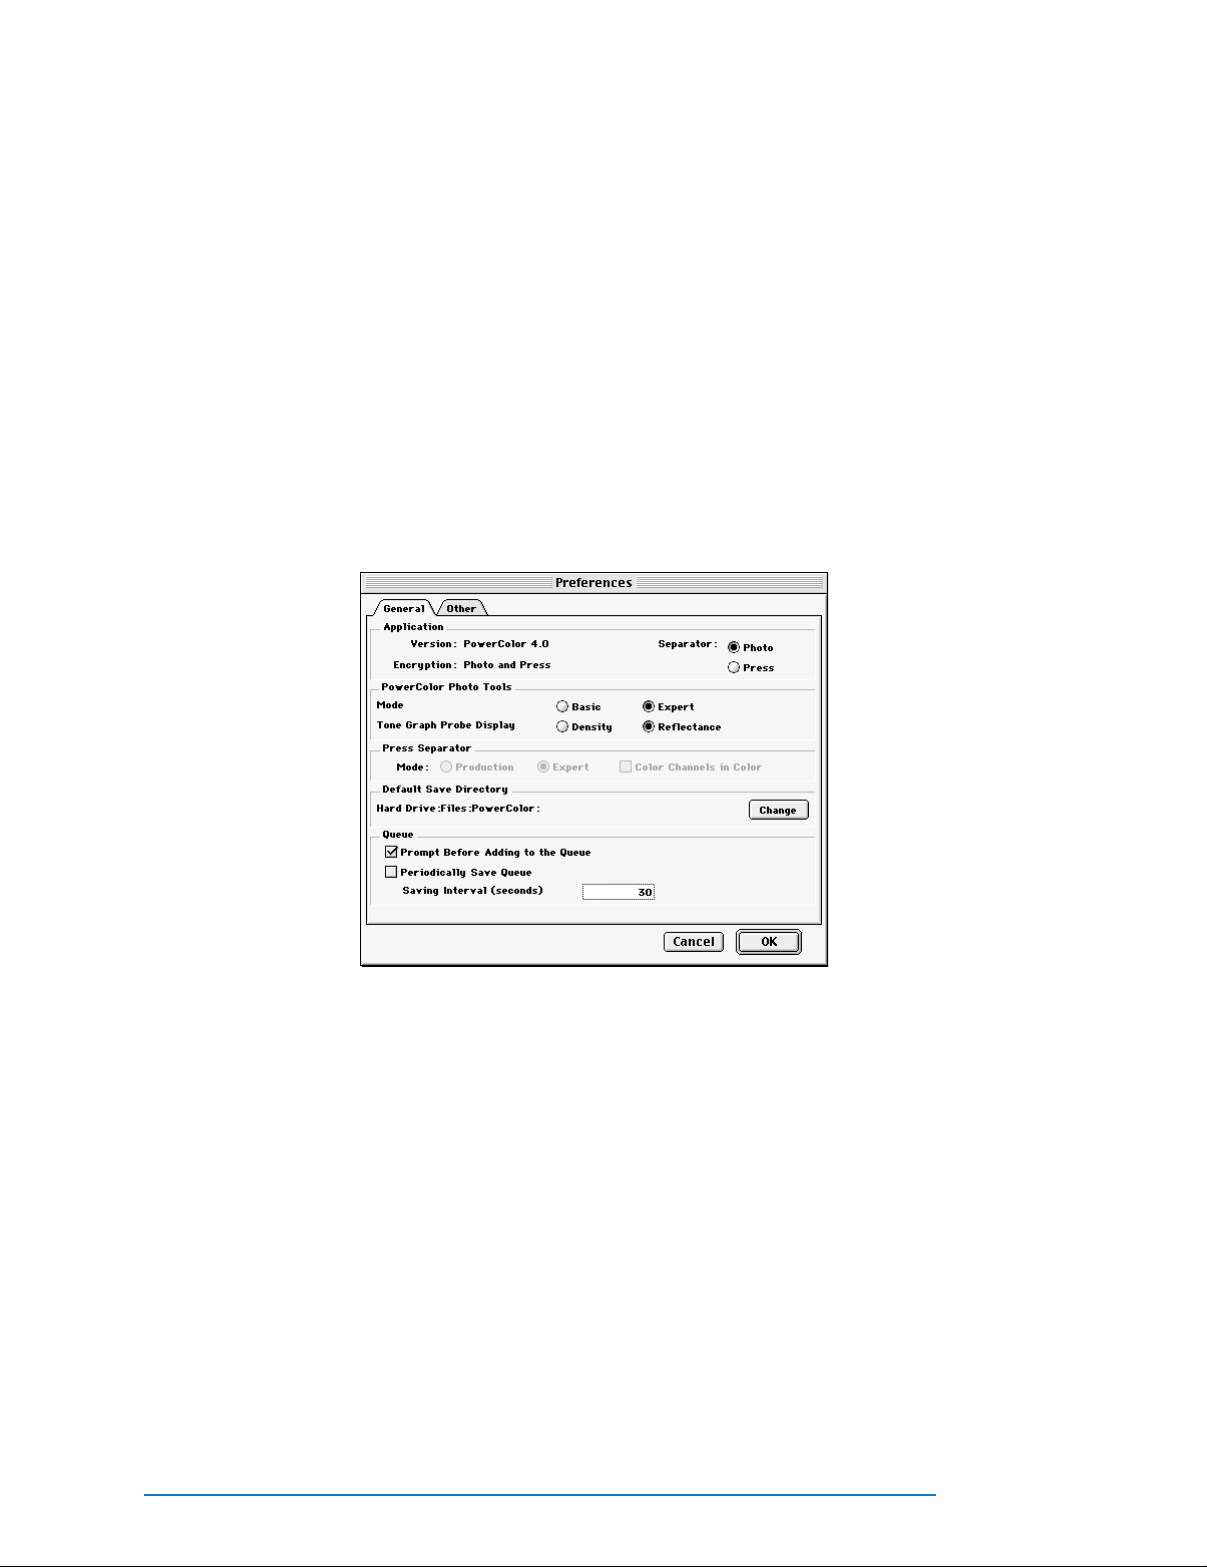
Figure 2–2a
Preferences window,
General components
Setting Preferences
Before you begin scanning, check PowerColor’s preferences to be sure the options
you need will be available.
Preferences are set in the Preferences window (see Figure 2–2). To open this
window, select Preferences from the Edit menu.
The components of the Preferences, General window, are defined as follows:
• Application: The static fields in this section describe the software revision
number and type of encryption (if any). This area is also used to toggle
between the ColorSync and PowerColor Press by selecting the desired radio
button.
• PowerColor Photo : This section allows you to set the mode of operation as
well as the type of information to be displayed in the expert tone graph.
• PowerColor Press: This section allows you to set the type of separation tools
to be used with PowerColor Press. Production mode provides an “all-in-one”
color correction window suitable for most general scanning work. In Expert
mode, all of PowerColor’s sophisticated image correction features are available separately.
• Default Save Directory: Allows navigation to volumes mounted on
workstation or available network or servers.
• Prompt Before Adding to Queue: toggles a prompt before file names are
added to the queue for final scan.
Chapter 2: Getting Acquainted 2-3
Page 26
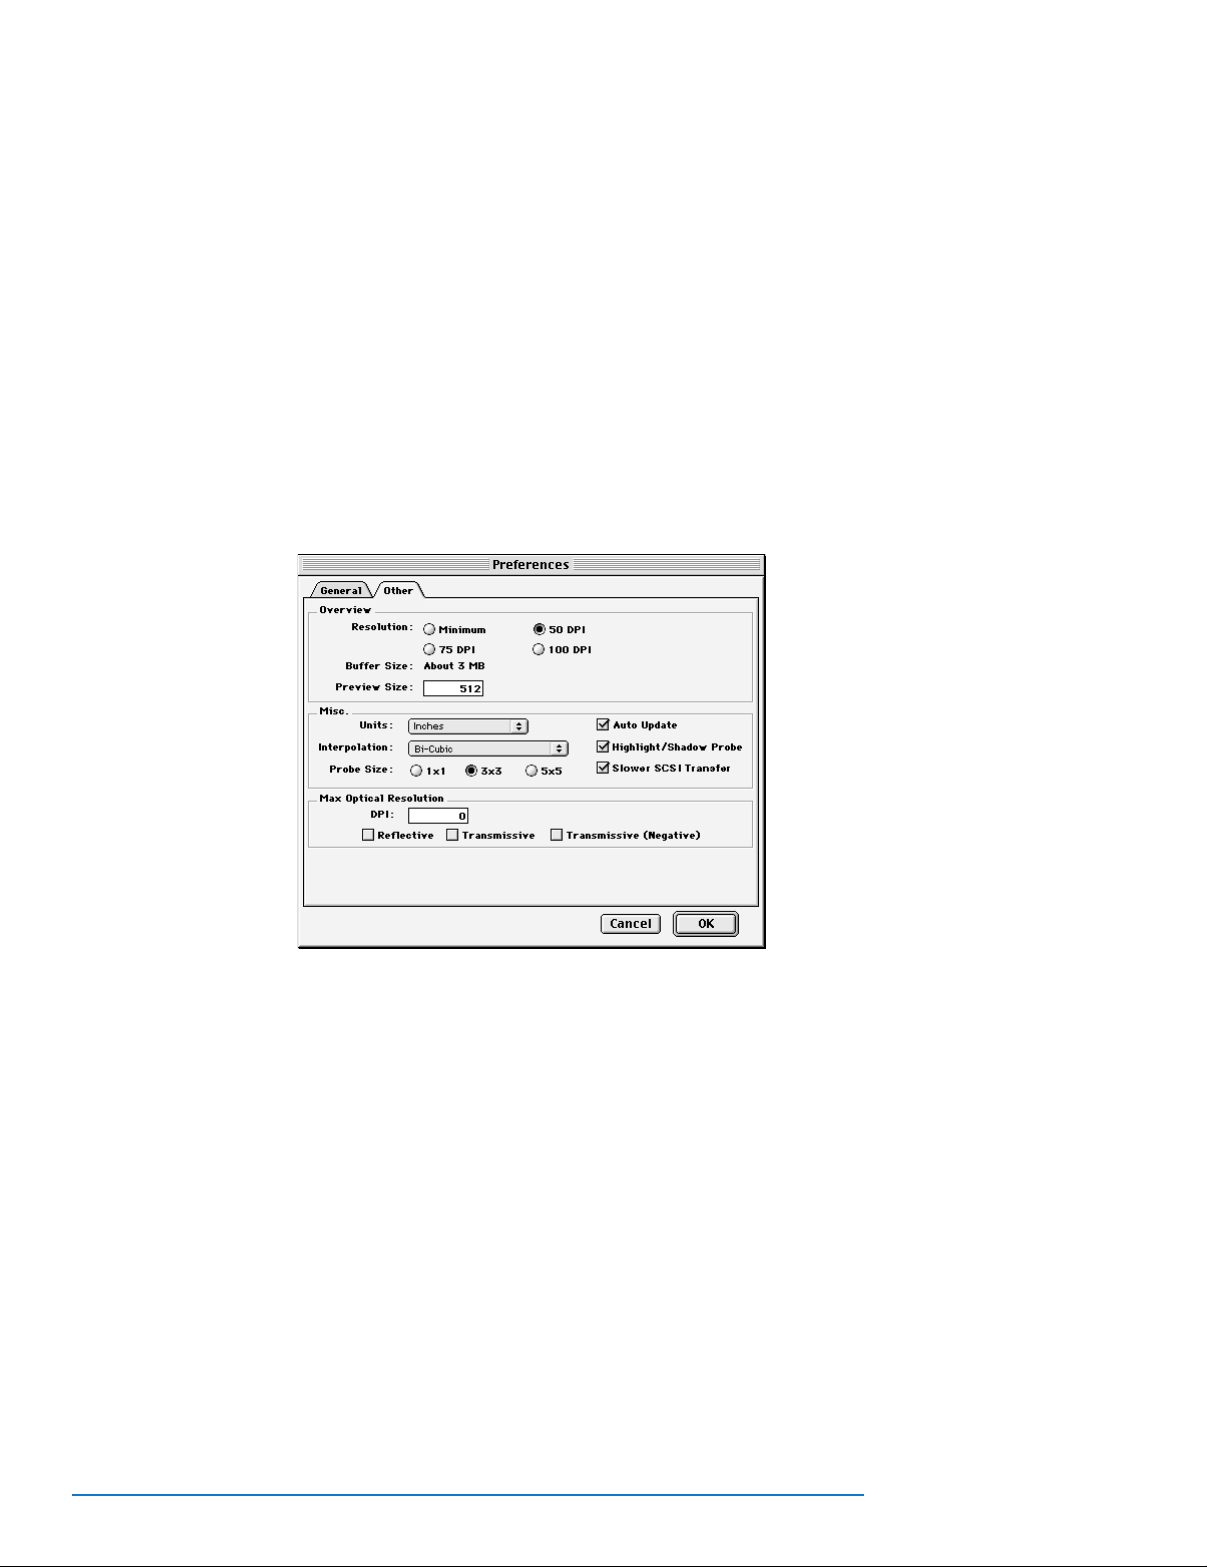
Figure 2–2b
Preferences window,
Other components
• Periodically Save Queue: allows you to designate whether PowerColor will
automatically save the current queue at the interval specified in the Saving
Interval Field.
The components of the Other tab in the Preferences Window are defined as follows:
• Overview: This section controls how images are viewed on screen during the
scanning and color correction process. The Resolution setting defines the
desired resolution of the overview scan. The default value is 50 dpi. Higher
resolutions provide greater detail in the image window, but also require considerably more RAM (as reflected in the non-editable Buffer Size field). If
you have over 64 MB of RAM available for PowerColor, setting the resolution to 75 or 100 increases the default resolution in the region windows,
which may save you from having to perform a preview scan for each region.
The Preview Size setting defines the dimensions of the image window. The
default size is 512 pixels.
• Units: sets the units of measure for the entire application. The default setting
is Inches.
• Probe Size: sets the size of the area sampled by the probe. 1x1 samples a sin-
gle pixel; 3x3 samples the eight pixels surrounding the cursor location; 5x5
samples the 24 pixels surrounding the cursor location.
2-4 PowerColor User Guide
Page 27

Interpolation: PowerColor provides the following interpolation modes:
– Bi-Cubic: weighted average of a region of pixels around the target pixel
(default mode). This type of interpolation provides high quality for continuous tone images when scaled to a resolution higher than that of the
scanner.
– Bi-linear: weighted average of adjacent pixels. This setting provides high
quality with better performance than Bi-Cubic, but may cause unwanted patterns in some images.
– Nearest neighbor: interpolation by pixel replication (should only be
used for line art).
– Maximum Optical Resolution: This feature allows PowerColor to set a
maximum optical scanning resolution for certain film types. Any resolution above this value will be interpolated. This is very helpful when
scanning noisy or grainy originals that need to be enlarged beyond the
quality of the original.
Note: The preferences you select, as well as all
window positions and contents, are saved by
PowerColor when the application is closed. The
next time you launch PowerColor, they will be
restored.
Note: Changes made in the preference window
do not require the PowerColor application to be
restarted to take effect.
Chapter 2: Getting Acquainted 2-5
Page 28
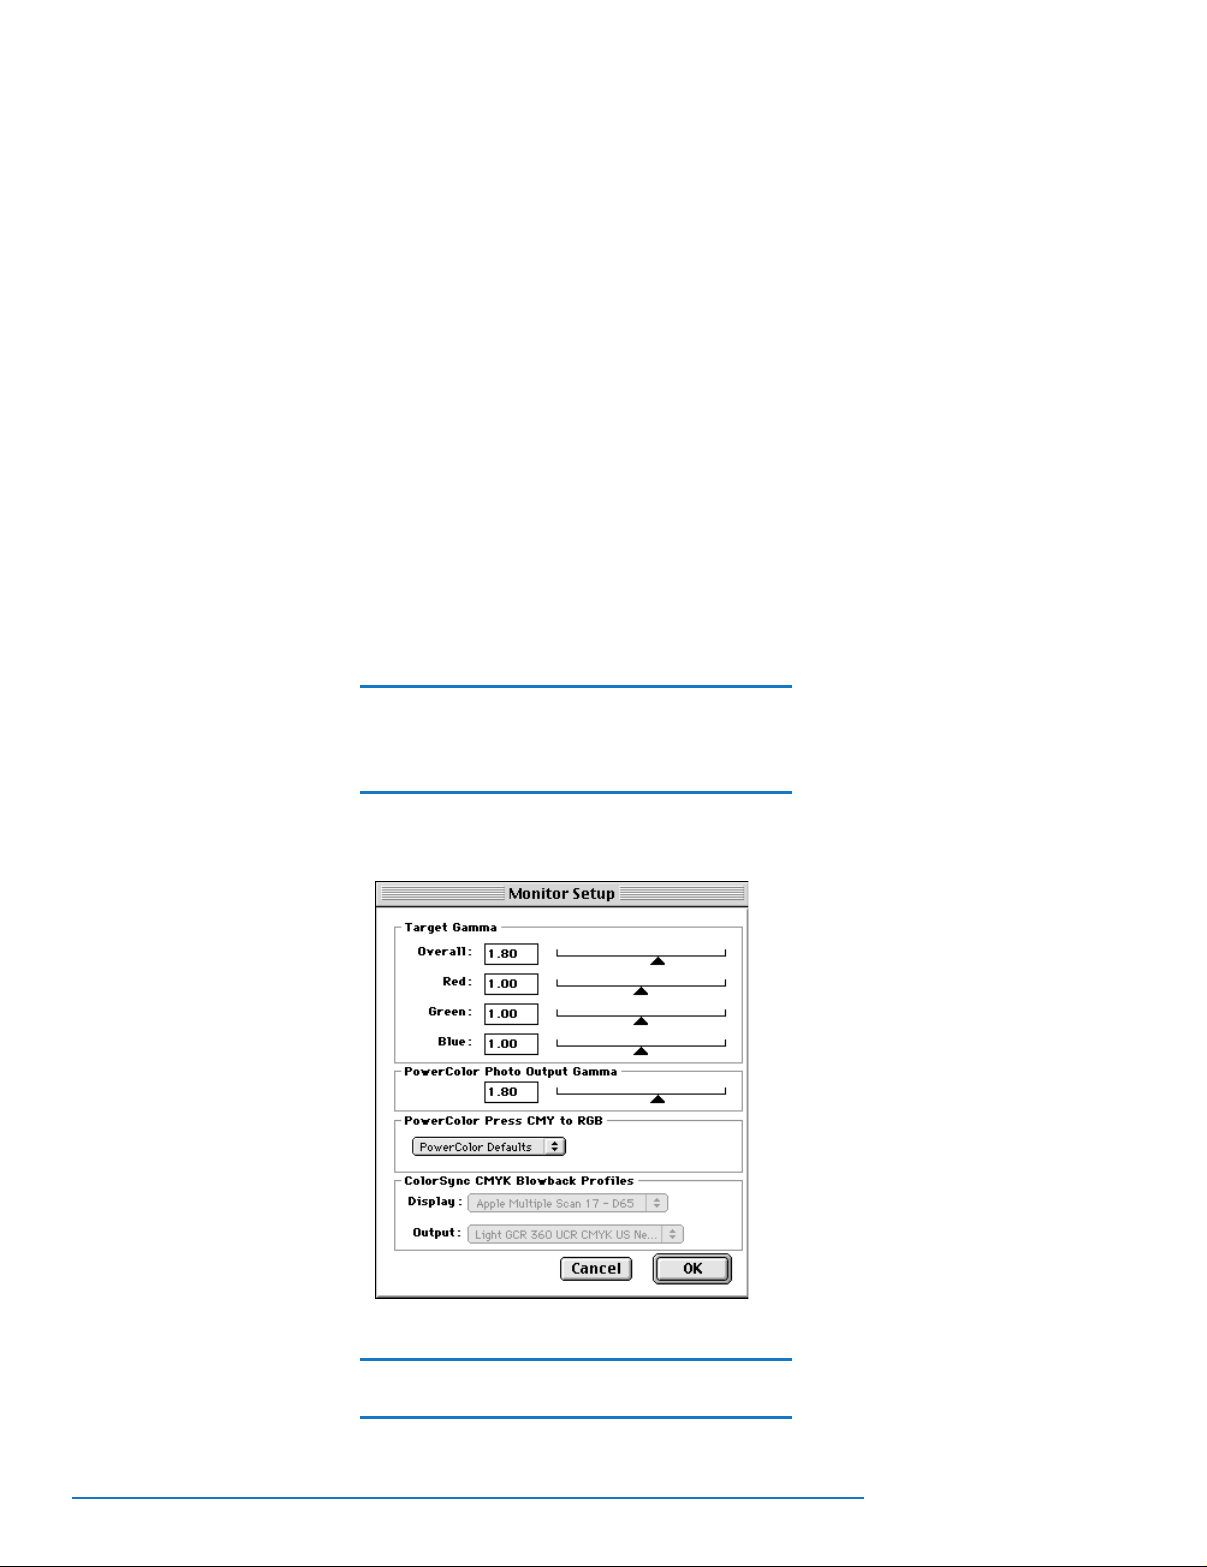
Changing Screen Gamma
PowerColor’s Monitor Setup option in the Edit menu (see Figure 2–3) allows you
to specify the gamma values of your monitor, as well as the CMY-to-RGB tables
used by PowerColor Press to display the “blowback” of your CMYK output.
By default, PowerColor assumes a monitor gamma value of 1.8. If you have
changed your monitor’s gamma, enter the new gamma value in the Monitor
Setup window. PowerColor then adjusts its previews to look the same regardless of
any monitor gamma
(in the range of 0.2 to 5.0)
Note: PowerColor does not adjust the gamma
value of your monitor. It merely adjusts its previews to look the same regardless of different
gamma settings.
You can choose between the PowerColor default blowback tables, or you can
Figure 2–3
Monitor Setup
window
select ColorSync and load your own monitor and output CMYK profile.
Note: PowerColor only uses ICC tables for the
monitor preview in Separator Mode.
2-6 PowerColor User Guide
Page 29

Making an Overview
Before working with images, the contents of the scanning surface must be
scanned into the Overview window. To do so, proceed as follows:
1. Mount the original(s) on your scanner.
2. Select the Scan Type in the toolbar as follows:
• Transmissive: color or black-and-white transparencies.
• Transmissive Negative: negative transparencies.
• Reflective: color or black-and-white photographs or prints.
3. Click on the Preview button ( ) in the toolbar or the Preview button
( ) below the blank first image in the Queue Manager.
Your scanner now produces a low-resolution overview scan of the entire
scanning surface.
Note: To stop an overview scan once the desired
portion of the scanning surface has been
scanned: on a Macintosh press + . (period), if
using Windows, hit the Escape (ESC) key.
Note: If you are scanning all the images in the
Queue Manager using the same line screen,
sampling, and scale values, set up the Overview
with the desired values. All images subsequently added to the queue will reflect those changes.
Chapter 2: Getting Acquainted 2-7
Page 30
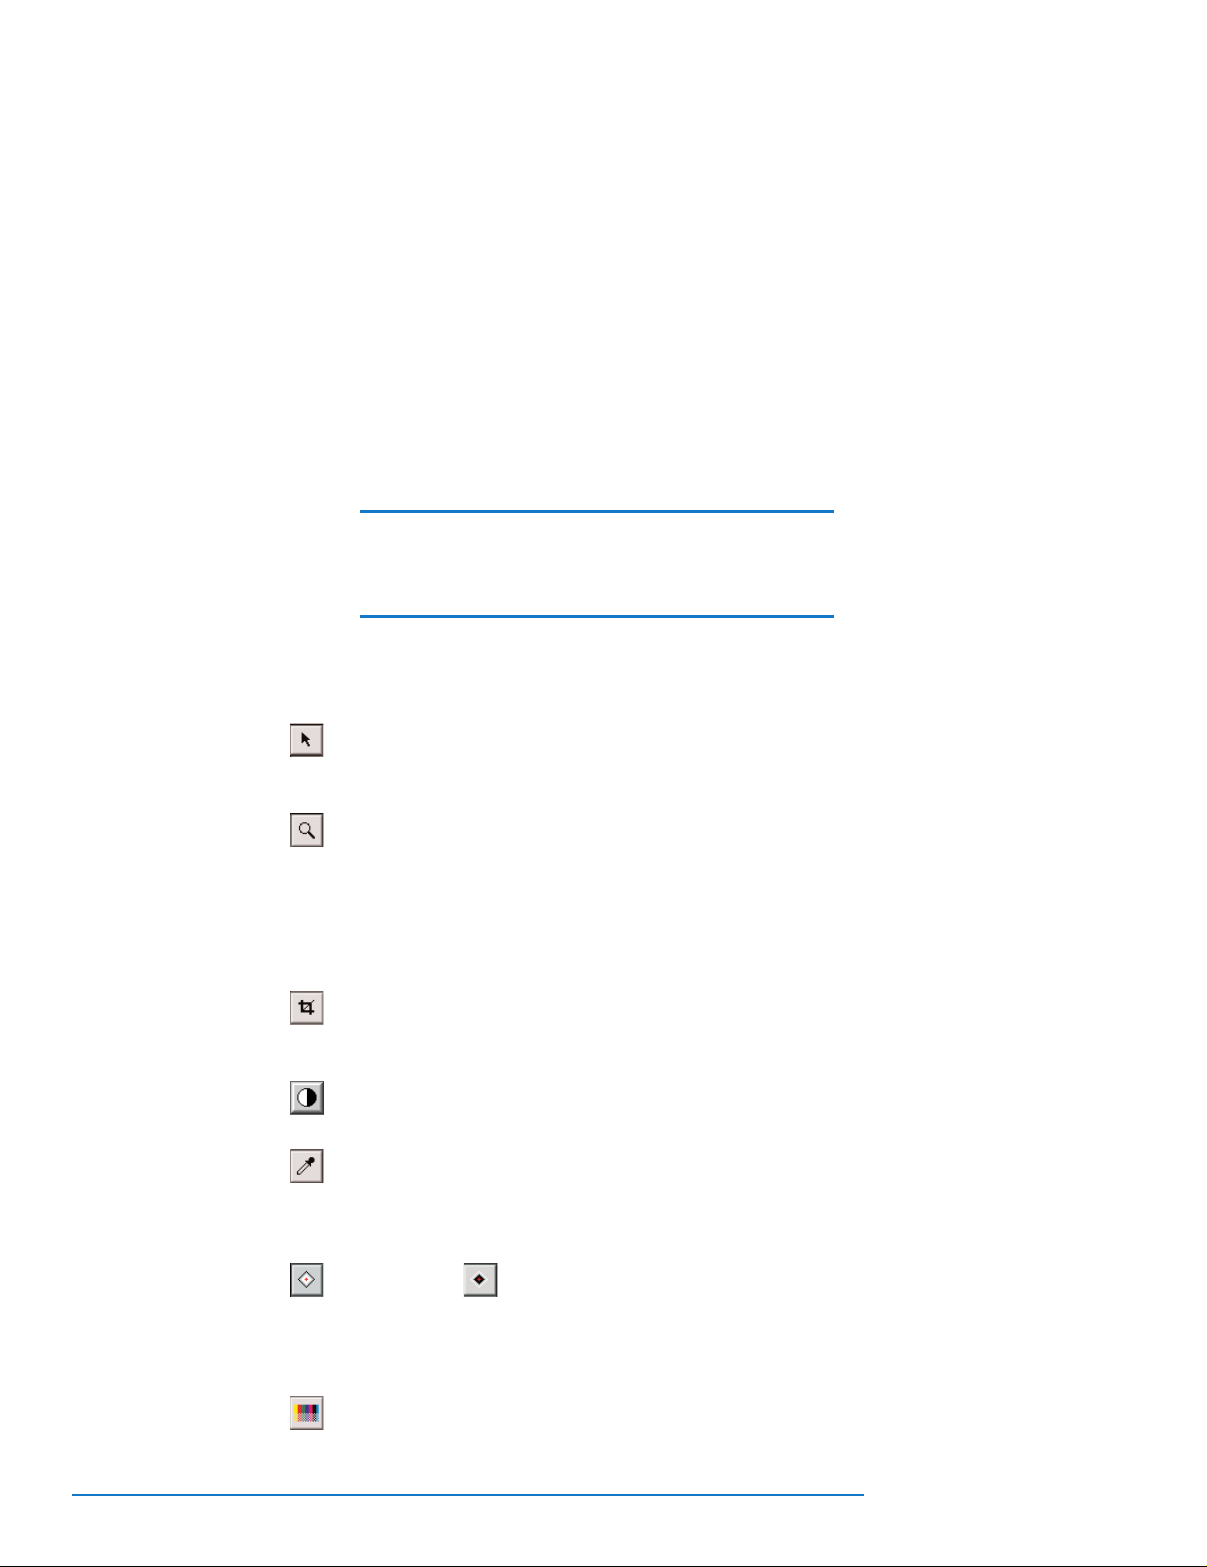
Image Selection Tools
Once you have produced an Overview, PowerColor’s image selection tools, located in the
Control Bar, allows you to define and work with regions for detailed color correction
work. This section describes how to use these tools.
Note: For Macintosh users, enabling the Macintosh
Balloon Help will cause the name and function of
each button to be displayed as the cursor passes
over it.
Image Selection Tools
Probe Region: The Probe (or Pointer) tool is used to select items and to move around the
image to sample pixels. The tool deselects the Crop and Zoom tools.
Zoom: Click on the image with the Zoom tool to enlarge the image for more precise examination of a region. If necessary, resize the image window to accommodate the new view. The magnification is shown at the bottom left-hand corner of the image window. To reduce the view again, hold
down the Option key (Macintosh) or Control key (Windows) while clicking on the image with the
Zoom tool. Note: The point where the Zoom tool is clicked becomes the new center of the image in
the window.
Crop Region: Use the Crop tool to select a portion of the image, for example to cut out the
clack edges of a film frame or tape used to hold images on the scanning surface.
Auto Range: Automatically adjusts the tonal range, setting the highlight and shadow points.
Pick Neutral Point: Uniquely selects multiple gray points in an image by holding down the
Option key (Macintosh) or Control key (Windows) and clicking on quarter, mid, and three quarter
tone values.
Highlight Value Shadow Value: Automatic values for each image highlight and
shadow range are made with both buttons selected (default setting). Deselecting either button will
result in a new auto range without the deselected value. Edit/Undo, from Main Menu reverts to last
values.
Refresh: With automatic updating off, click on the Refresh key to update the active region
with all changes since the last update
2-8 PowerColor User Guide
.
Page 31

Figure 2–4
Region Window
Regions
The purpose of the region window is to define areas from the overview that will
be scanned to image files, and to correct them in higher resolution than the
overview. Each region window has the following components:
• History : Each region can be cropped, rotated, and color corrected indepen-
dently of all other regions. Each region also carries its own history list of all
actions taken by the user on that region. You can scroll the history list by
selecting the “H” icon at the bottom of the region window (Macintosh version) or on the Toolbar (Windows version). This list can be used to undo
and redo to any point in the history.
• Duplicate: At any time during the correction process the active region can be
duplicated for side by side comparison. This duplicate view is static except
for its history list, which can be used to compare views at any correction
step.
Chapter 2: Getting Acquainted 2-9
Page 32

Creating Regions
There are two ways to create regions: from the cropped overview, or by opening a
TIFF file from disk.
1. Creating a region from a TIFF file
To create a region from a TIFF file on your hard drive, choose Open from the file
menu and choose the desired TIFF file. The file will open into a new region window.
2. Creating a region from the Overview
Once you have cropped the desired portion in the Overview, double click the
selected area to assign it to a region. You can also click on the Add Region button ( ) from the Queue Manager.
Images and Memory
The amount of memory (RAM) required for a region varies depending on the
Overview resolution (selected in the Preferences window) and the size of the
region. You can create as many regions as the amount of RAM assigned to the
PowerColor application allows. (The minimum and default application RAM is
32 MB, 64 MB of RAM is recommended.) If you exceed the amount of memory
allocated to the application, the following warning dialog appears:
Figure 2–4
Out of Memory
warning
If this dialog box appears, you can:
1. Quit the application and assign more RAM to PowerColor, (Macintosh only)
2. Final scan the regions you have already created, and/or
3. Delete unneeded regions. For more information on final scanning or deleting
regions, see Chapter 7.
2-10 PowerColor User Guide
Page 33

Note: Macintosh users: To check the current
memory setting for PowerColor on a Macintosh,
Select About this Macintosh in the Apple menu.
Region Names
PowerColor names regions by default according to the order
in which they are created. The default name assigned to
a region is based on the following scheme:
Region-X : scan####
where
X = the region number in the order of its placement in the
Queue Manager.
#### = an arbitrary sequential number.
Your regions may represent separate originals for different jobs, or different areas
from within the same piece of art. When you prepare your final scans, it is helpful to follow a naming convention for your regions that makes sense in your
production environment (for example, by job, client, date, etc.). To change the
name of a selected region, press +S or select Save from the File menu.
Note: For more information about naming
regions, see
Naming Final Scans
Chapter 2: Getting Acquainted 2-11
in Chapter 7.
Page 34

Working with Regions
Regions created using the Add Region button are placed into PowerColor’s Queue
Manager. The Queue Manager. is a highly flexible tool designed to organize your
work with regions. Use the Queue Manager. to:
• Activate a region
• Preview regions
• Rearrange the order of the regions
• Scan regions to disk
• Add a region
• Delete a region or all regions
• View the progress of a scan
• Switch between detail view and full preview
This section explains how to manipulate regions using the Queue Manager.
Scanning to disk is discussed in Chapter 7.
Activating Regions
To activate a region, double-click on its image in the Queue Manager. The
selected region is then framed in red, the region number is displayed in the
Region field, and the image data is shown in the appropriate fields in the toolbar.
A 1:1 view of the image is displayed in the image window. Color correction work
can now be performed on the image.
2-12 PowerColor User Guide
Note: Before making color corrections, make
sure the region you want to work on is active.
Page 35

Adjusting the Queue Manager Window
The Queue Manager window can be manipulated using standard Macintosh or
Windows tools:
• To close the window, click on the close box in the upper left-hand corner (to
reopen it, select Queue Manager from the Window menu. or press +M on
a Macintosh, or Control+M on a Windows PC).
• To expand the window to its full size, click on the window resize box.
• To resize the Queue Manager window to a custom size, click and drag the
resize button in the bottom right-hand corner. on a Mac, or click and drag
any corner on a Windows PC.
• To scroll through the images in the Queue Manager, use the standard scroll
bar at the bottom of the window.
• To move the Queue Manager window to another location on screen, click
and drag the title bar.
Chapter 2: Getting Acquainted 2-13
Page 36

Manipulating Regions in the Queue Manager
The regions in the Queue Manager can be rearranged or deleted any time, even
while scanning is in progress.
To rearrange the order of the regions in the Queue Manager, click and drag the
region to the desired location in the queue.
Note: The Overview can not be moved in this
manner.
To delete a region, use one of the following tools:
Cut: To delete a single region from the queue, activate the region by
double-clicking on it (a red frame appears around it) and click on the
black Cut button in the Queue Manager to delete the region.
Cut All: To delete all regions from the queue, click on the red Cut All
button in the Queue Manager
Saving the Queue
To save the contents of the current queue manager choose Save Queue from the
file menu. In the dialog box that appears assign a name for the queue, then
click OK to have it saved to disk. This option is useful for preserving your work in
the event of a crash, or for production environments in which drums need to be
set up for later scanning.
2-14 PowerColor User Guide
Page 37

Previewing Regions
Before manipulating and correcting regions, the image should generally be
previewed.
Note: Although previewing an image is not
absolutely necessary, it improves the accuracy of
the Probe values and provides a higher resolution
image for image correction work. Without a preview scan your Probe values may not be accurate
due to the dithering of the low resolution image.
Preview: To preview a single region, click on the Preview button ( )
under the desired image in the Queue Manager. During scanning the
region’s Preview button appears red, green, and blue. Once the preview
is complete, the button turns all red.
Preview All: PowerColor’s Preview All button allows you to batch
preview all the regions in the Queue Manager with a single click. This can
be done even if there are different types of originals in the scanning area
(reflective, positive transparencies, or negative transparencies).
Once you have defined and added multiple regions with the PowerColor
tools, click on the Preview All button. The scanner then scans each region
in succession.
To preview only certain regions in the Queue Manager, click on the
white Preview button under each desired image. The regions are then
scanned in order.
Chapter 2: Getting Acquainted 2-15
Page 38

Dynamic Operations in the Queue Manager
The Queue Manager is a multitasking tool. While a region
is being previewed or final scanned, other regions can be added, deleted, or
rearranged in the Queue Manager. Color correction work can also be performed
on a region in the queue, whether or not scanning is in progress.
The queue may also be interrupted during scanning using the Active/Pause icon
on the right-hand side under the Overview in the Queue Manager. Clicking on
this icon toggles the scanning process on ( ) or off ( ).
Transforming Images
To make your work with regions easier, PowerColor also includes the tools shown
below to transform images. The tools can also be selected from the Transform
menu.
Note: The image transformation tools can only
be used in a region, not in the Overview.
Rotate Left: rotates the image in a region 90° counterclockwise.
2-16 PowerColor User Guide
Rotate Right: rotates the image in a region 90° clockwise.
Flip Horizontally: flips the image horizontally, along the vertical axis.
Flip Vertically: flips the image vertically, along the horizontal axis.
Page 39

Viewing an Image in Detail
PowerColor’s Detail feature is used to scan a small area of a region at the final
scan output resolution. This feature is helpful for examining an image in precise
detail.
To use the Detail feature, proceed as follows:
1. Activate the region in which you want to perform
a detail scan by double-clicking on it in the Queue Manager.
2. Select Detail in the Region menu or click on the Pick Detail Point button
( ) in the Control bar. The cursor becomes a cross-hair.
3. Click on the center of the desired area of the image to
be viewed in detail.
The scanner now performs a detail scan of predefined dimensions around
the point you selected using the scanning parameters indicated in the fields
in the toolbar (size, scale, line screen, etc.).
Once the detail scan is complete, you can switch between the detail view (as indicated in the title bar of the image window) and normal preview by toggling the
Detail checkbox in the Queue Manager.
Note: The purpose of the detail scan is to view
a small area of interest at the final output resolution. Before performing a detail scan remember to setup the output parameters for the
image in the geometry window.
Chapter 2: Getting Acquainted 2-17
Page 40

Updating Images
Whenever you make changes in a prescanned image or scanning parameters, the
image can be updated in the Region window so you can visually gauge the effect
of the changes. Image updating is performed in two ways: automatically and
manually.
Updating Automatically
If you want the image window to be updated automatically, choose Auto Update
On from the Preferences menu. The image is then updated every time you make
a change. To turn off automatic updating, choose Auto Update Off.
Automatic updating is helpful in visually tracking changes incrementally.
However, it can add production time due to the time needed to refresh the screen
image after every adjustment.
Updating Manually
With automatic updating off, click on the Manual Update button ( ) in the
toolbar (or in any window where it appears) to update the active region with all
changes since the last update. You can also use the keyboard shortcut +K..
When the update is completed, the Command field at the top of the toolbar indicates Updating… Done.
The manual update feature is particularly useful if you are a more experienced
scanner operator and only need to check the image window from time to time.
2-18 PowerColor User Guide
Note: If you are using the manual update feature, the image window’s display is updated
only when you click on the Manual Update button.
Page 41
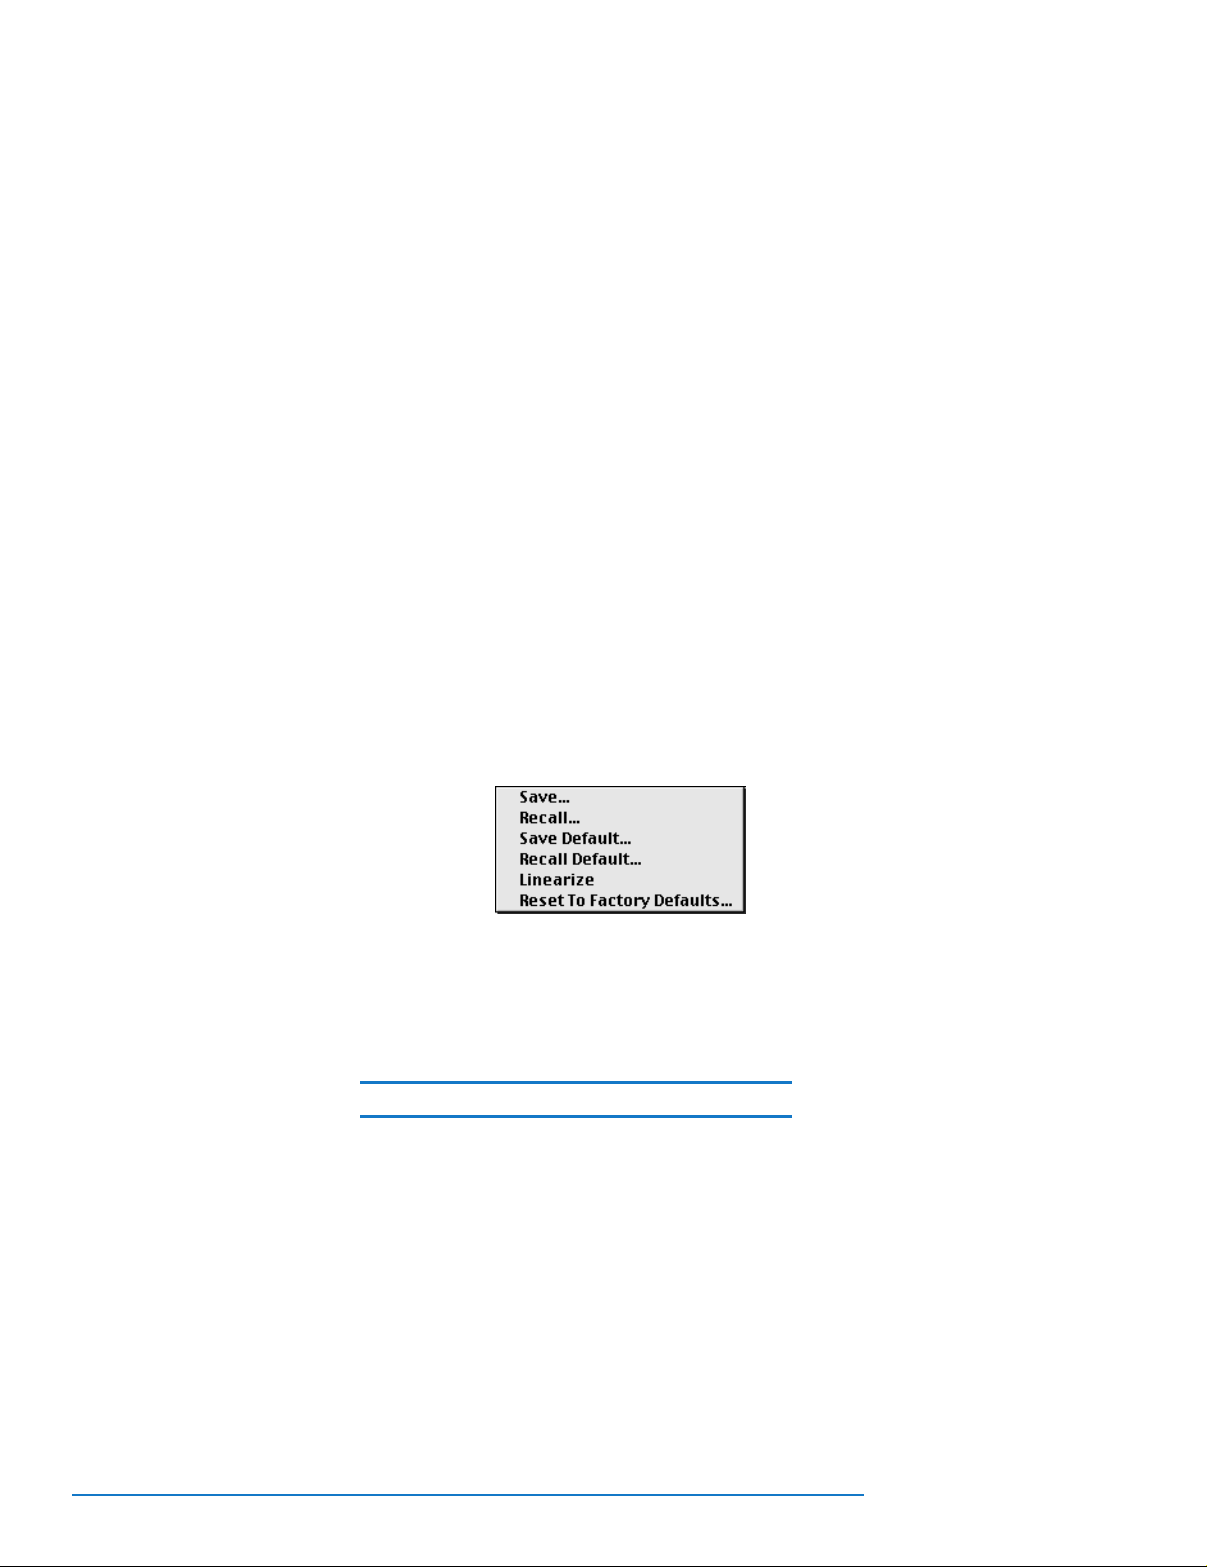
Figure 2–5
Settings menu.
Saving and Recalling Settings
During your color correction work, you may decide to save the changes you have
made for future applications. You may also wish to use other predefined settings,
or even start over. PowerColor gives you the option of saving and recalling default
or previously saved settings for one or all of the parameters you have changed, or
resetting the parameters to those in the original prescan.
To use this feature, select one of the options in the Settings menu,
Save: This option allows you to save custom correction settings. After
adjusting the settings you want to save, click on the Save button or
select Save in the Settings menu. In the dialog window that appears
(see Figure 2–6) check off the settings you want to save.
In the standard file dialog that appears next, name the settings file and
choose where it will be stored. The settings can now be recalled any
time using the Recall feature (see below).
Note: Only the settings you check off are saved.
Chapter 2: Getting Acquainted 2-19
Page 42

Figure 2–6
Settings window
Recall: This option recalls a previously saved settings file. PowerColor
comes with a number of preset files for your convenience, or you may
recall a settings file you created. After you select Recall, a standard file
dialog appears for you to select the settings file to be recalled.
Save Default: Use this option to store your own custom default settings.
Note: The Save Default option overwrites
PowerColor’s default settings. Once
PowerColor’s defaults have been overwritten,
they cannot be recalled. If you use certain settings regularly, save those settings in a separate
file and recall them as needed. See Save and
Recall above for more information about these
options.
2-20 PowerColor User Guide
When you select Save Default, a dialog window similar to the one
shown in Figure 2–6 appears where you can check off the settings to be
saved as defaults.
Note: Only the settings you check off are saved
as defaults.
Page 43

Recall Default: This option brings up a dialog window similar to the
one shown in Figure 2–6 where you can select the specific default settings to be recalled by clicking on the appropriate checkboxes. Click on
OK to recall the settings.
Linearize: This option will reset tone and gradation curves to linear
values. For other settings it will remove any correction made to the
tool. For example, gray balance would become equal percentages for
all inks.
Reset to Factory Defaults: This option will reload the original defaults
that may have been saved over at some time.
Note: In some cases, PowerColor grays out settings in the Recall Default and Reset dialog windows. The grayed out items are values which
have not been saved.
Chapter 2: Getting Acquainted 2-21
Page 44

Page 45

3
3
Correcting Images with
PowerColor Photo/RGB Mode
Page 46

Page 47

owerColor offers many powerful features that allow you to correct your pres-
P
canned images before the final scan is made. For those who prefer to work in
RGB color space, PowerColor provides fast and efficient tools to make image corrections.
This chapter explains how to use the RGB tools and covers the following topics:
• Using the RGB Probe
• Using the RGB Controls in Basic Mode
• Using the RGB Controls in Expert Mode
The Photo mode is selected in the Preferences window (see Setting Preferences in
Chapter 2 for more information).
For information on working in the CMYK color space with PowerColor, refer to
Chapters 4 and 5. For details on using PowerColor’s descreening and unsharp
masking features , see Chapter 6.
Chapter 3: Correcting Images in the RGB Color Space 3-1
Page 48

Using the RGB Probe
The most important tool in correcting images is the Probe. This window tracks
your corrections by displaying the RGB values. To view the RGB Probe, select
Probe in the Window drop down menu (Or press +P on a Macintosh,
Control+P if using Windows). As you pass your cursor over the Overview or a
region window, the Probe shows the values for the pixel(s) at the current cursor
position.
The RGB Probe window is a static display. Its appearance depends on the Scan
Mode you select in the Control Bar (see next section). However, the Probe always
shows the X/Y coordinates of the current cursor position (Probe Location) and
the original and output optical density values (Densities) for the selected pixel(s).
RGB Probe Window Configurations
When scanning in RGB mode, the RGB Probe displays the RGB reflectance values
(RGB Pixel Values) for the selected pixel(s) (see Figure 3–1).
Figure 3–1
RGB Probe in RGB
mode
3-2 PowerColor User Guide
Page 49

Figure 3–2
RGB Probe in Gray
mode
If the image is in a grayscale scan mode (one of the Gray options), the RGB
Probe shows the reflectance value (Pixel) and dot percentage (Dot) for the selected pixel both before and after correction (see Figure 3–2).
When scanning line art (the Scan Mode is set to one of the Line options), the
Line Art Pixel Value field in the RGB Probe shows whether the selected pixel is
black (0) or white (1) both before and after correction (see Figure 3–3).
Figure 3–3
RGB Probe in Line
mode
Note: When probing images in line art or grayscale mode, set the Probe Size in the Preferences window to 1x1 to avoid false readings.
Chapter 3: Correcting Images in the RGB Color Space 3-3
Page 50

Setting Highlight and Shadow
The most important aspect of setting up a scan is defining where to place the
highlight and shadow point. PowerColor has an automatic as well as a manual
means for accomplishing this task.
Note: There are two types of highlights:
“Specular” highlights are areas that contain no
color, while “diffused” highlights contain a minimum amount of color. All densities less than
the diffused highlight slope to white at a 45º
angle. When setting Highlight and Shadow
points, PowerColor uses the values within the
Diffused Highlight and Shadow area of the Tone
and Cast window.
Setting the Input Range automatically with Auto Range
In the Control bar you will find the Auto Range Icon. By selecting this tool, an
Auto Range will be performed on the active region. The Highlight and Shadow
point will be set to the RGB values shown in the Diffused Highlight and Shadow
fields at the bottom of the Tone and Cast Window. Also, these points will be
marked in your image by sticky densitometers.
How Auto Range determines Highlight and Shadow points
After the software has evaluated the image data it will make a series of decisions
as to where it will set the Highlight and Shadow point.
• Auto Range looks only at the densities of the image data that falls within the
current Region Crop. This is important to know because if you leave film
edge or an area beyond the image edge in your crop, the software will
include that data in its decision.
• The Highlight and Shadow points will not be set at the extreme minimum
and maximum, but at a percentage inside of the min and max. The reason
for this is to avoid setting the points on dust or scratches on the film.
• Due to the use of a catch light, data is never clipped, regardless of where the
highlight and shadow is set. (We will explain this later on with a discussion
of the Diffused Highlight.)
• PowerColor searches for densities that are closest to neutral (equal).
3-4 PowerColor User Guide
Page 51

Setting the Input Range Manually
In both Basic and Expert mode, there are two methods of manually setting the
Input Range:
1. Select the Histograms tab from the Photo RGB Window. You can use the fields
at the bottom of the Input Histogram to enter the Highlight and Shadow densities, or move the two arrows at the bottom of the Histogram graph. Changing the
RGB Histogram will affect all channels equally. To set each channel separately,
select the appropriate channel from the drop down window and adjust the
Highlight and Shadow points.
Note: In expert mode, any changes to the
Histograms will be shown in the position of the
RGB tone curves.
2. First, perform an Auto Range by clicking on the Auto Range icon within the
Control Bar. Next, select the Pointed cursor from the Control Bar, then click on
the diamond shaped Highlight (white) and Shadow (black) densitometers within
the region, and move them to the desired locations.
Changing the Diffused Highlight and Shadow Point : An Example
It is very important to understand the interaction between the diffused highlight
and shadow point in the image, the diffused highlight and shadow RGB fields in
the Tone and Cast menu, and the highlight and shadow cast correction setting in
the Tone and Cast menu. One will always affect the other.
• The sticky densitometers reflect the exact points of interest.
• The Highlight and Shadow RGB fields control the values those points will
inherit.
• The Cast settings influence how the RGB values react to one another when a
new value is typed into one of the fields or when you select a different cast
setting.
For this example, an IT8 target is used, although a similar target containing a
gray wedge would work as well.
Chapter 3: Correcting Images in the RGB Color Space 3-5
Page 52

The bottom of the target contains 22 steps of gray bordered by paper white and
black. Let’s refer to paper white as a specular highlight (any point that should
contain no color) and black as our shadow point.
By selecting the pointed cursor from the Control bar, you can pick up the highlight sticky densitometer and drag it to a new location. First, place the highlight
densitometer on the specular highlight. This will cause that area to become our
point of interest and reflect the values in the RGB Highlight fields from the Tone
and Cast Window.
We will now work with the Highlight fields in the Tone and Cast Window. First,
make sure the Highlight and Shadow Cast Correction is set to full. In the Red
field next to the Diffused Highlight label type in “255” and hit Enter. Notice that
both the Green and Blue values changed automatically. This is because the Cast
Correction setting is on Full--The color computer will always keep the RGB values adjusted based on the Cast setting. You have now made the paper white
patch a specular highlight.
For the Shadow point, take the Shadow sticky densitometer and place it on the
Black patch. In the Red field next to the Shadow label type 0. The black patch
will now become the absolute shadow point.
Of course, setting the input range would be a piece of cake if you only have to
scan IT8’s. Unfortunately, in the real world, not all images have perfect specular
highlights and absolute shadow points. But that’s OK, because PowerColor was
designed for the real world.
The next example is closer to the challenges of everyday scanning: Again, lets
use the bottom of the IT8, but this time we are going to throw out every patch
except #3 and #20. Now patch #3 may exist in an image as a linen table cloth,
pearl necklace, shirt, or countless other objects and materials. The point is that it
is identifiable in the image, and we either know, were told, or have to make an
assumption as to how it should reproduce on paper.
Lets start with knowing that patch #3 should be neutral and the red value should
be 240. Take the Highlight sticky densitometer and place it on patch #3. In the
Red field type in 240 and hit Enter. You have just set a Diffused Highlight and,
because the red value is less than 255, the Catch Light is automatically activated.
Now move the Shadow sticky densitometer to patch #20 and in the Red field next
to the Shadow label, type 10 and hit Enter.
3-6 PowerColor User Guide
Page 53

Note: Highlight and Shadow points don’t need
to be at the extreme ends of a histogram, even
though most of us are taught to think that way.
In fact, the highlight and shadow points don’t
even need to be neutral and in many images
you will need to leave a cast in these points.
Now, change the Highlight Cast correction setting to Half. The color computer
will automatically calculate and keep half of the original cast. Change the cast
setting to None. The Highlight point will now keep 100% of its original cast. Set
the cast setting to Manual and you can now control the Highlight point to any
values that you desire. This of course works identically for the Shadow Cast.
Using the Gray Eyedropper
The gray eyedropper is unique in that it can set multiple points. Gray points are
made up from the quarter tone, midtone, and three-quarter tone regions. On a
Mac, to select multiple points, hold down the Option key (Macintosh) or Control
key (Windows) while selecting each point. Before you select the last point, release
the Option or Control key and click on the point. The tool is then deselected automatically.
Chapter 3: Correcting Images in the RGB Color Space 3-7
Page 54

Tone and Cast
PowerColor gives users two options for working with Tone and Cast--Basic and
Expert modes.
• The Basic Mode uses sliders for correction instead of curves. These sliders
are easy to use, yet give good control over image editing features.
• The Expert mode gives access to curves for more advanced adjustment of the
tonal settings.
To change the current mode, select Preferences from the Edit Menu, then choose
the desired setting within the General section of the Preferences Window.
Adjust Tone and Cast - Basic Mode
Figure 3–5
Basic Mode Sliders
Adjusting Tone and Cast in Basic Mode
• Brightness: Controls the lightness and darkness of the image. Usually
referred to a the midtone point on a gradation curve.
3-8 PowerColor User Guide
Page 55

• Contrast: Controls how fast the transition is between light and dark pixels.
On a gradation curve this would be the correlation between the quarter
tones and three quarter tones.
• Saturation: The amount of chromanence present in all hues. Zero percent
saturation would yield a black and white image.
Chapter 3: Correcting Images in the RGB Color Space 3-9
Page 56
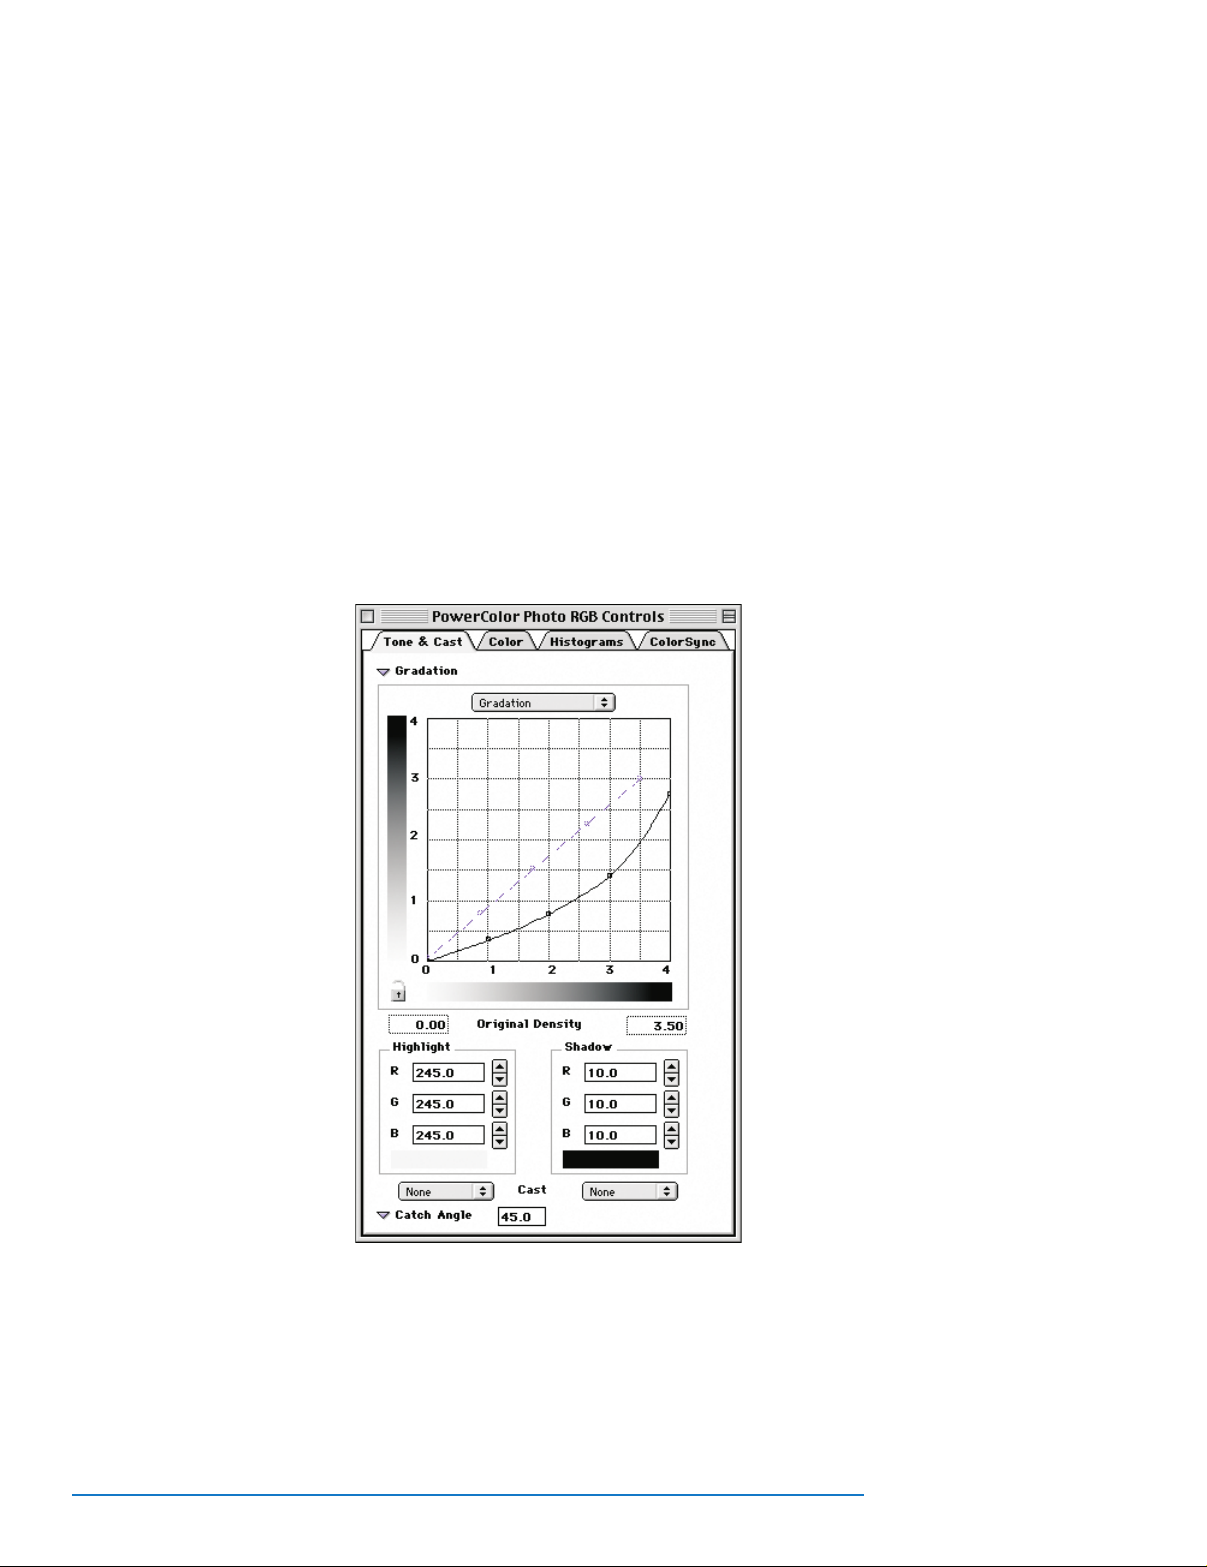
Figure 3–5
Tone & Cast option in the
RGB Control window
Adjusting Tone and Gradation - Expert Mode
The purpose of the tone curves is to define what is neutral by removing unwanted casts. The
purpose of the gradation curve is to specify tone compression and contrast. Therefore, color correction should be performed only in the Selective Color window, where neutrals and hues are
treated separately. To adjust neutral tones, use Tone & Cast; to correct hues, use Selective Color.
3-10 PowerColor User Guide
Page 57

The gradation curve (black) defines how tone compression is handled. The horizontal axis shows the input density while the vertical axis displays the output
density.
The points (called “anchor points”) are located, from left to right, at the following values: highlights, quarter tones, midtones, three-quarter tones, and shadows.
By selecting an anchor point and dragging it up or down, you can alter the gradation value for that point.
The lock icon at the bottom left corner of the grid is open by default. By clicking
on it, you can lock the anchor points on the curve. This allows you to move the
points individually without affecting the others. Locking anchor points is useful
for fine-tuning the gradation curve.
Note: Adjustments in the gradation curve
change the input-to-output tonal compression.
For example, moving the three-quarter tone
point down expands the shadow area of the
image by starting the three-quarter tone range
at a lower optical density.
Note: Every original, film or print, has a specific
density range which defines the points where
the image data starts and ends. This density
range is measured on an optical density scale of
0 (lowest) to 4 (highest).
The “output density range” is usually set to different values than the input range.
The default output density value is 2.7, the maximum density monitors are capable of displaying. Knowing the density range of your intended output device and
entering that value in the RGB Control window helps optimize the quality of the
final image.
Note: If you are unsure of which value to use,
keep the value 2.7. If your output device is a
film recorder, values of 3.0 or higher may be
advisable.
Chapter 3: Correcting Images in the RGB Color Space 3-11
Page 58
Using PowerColor Photo Controls
Adjusting Colors
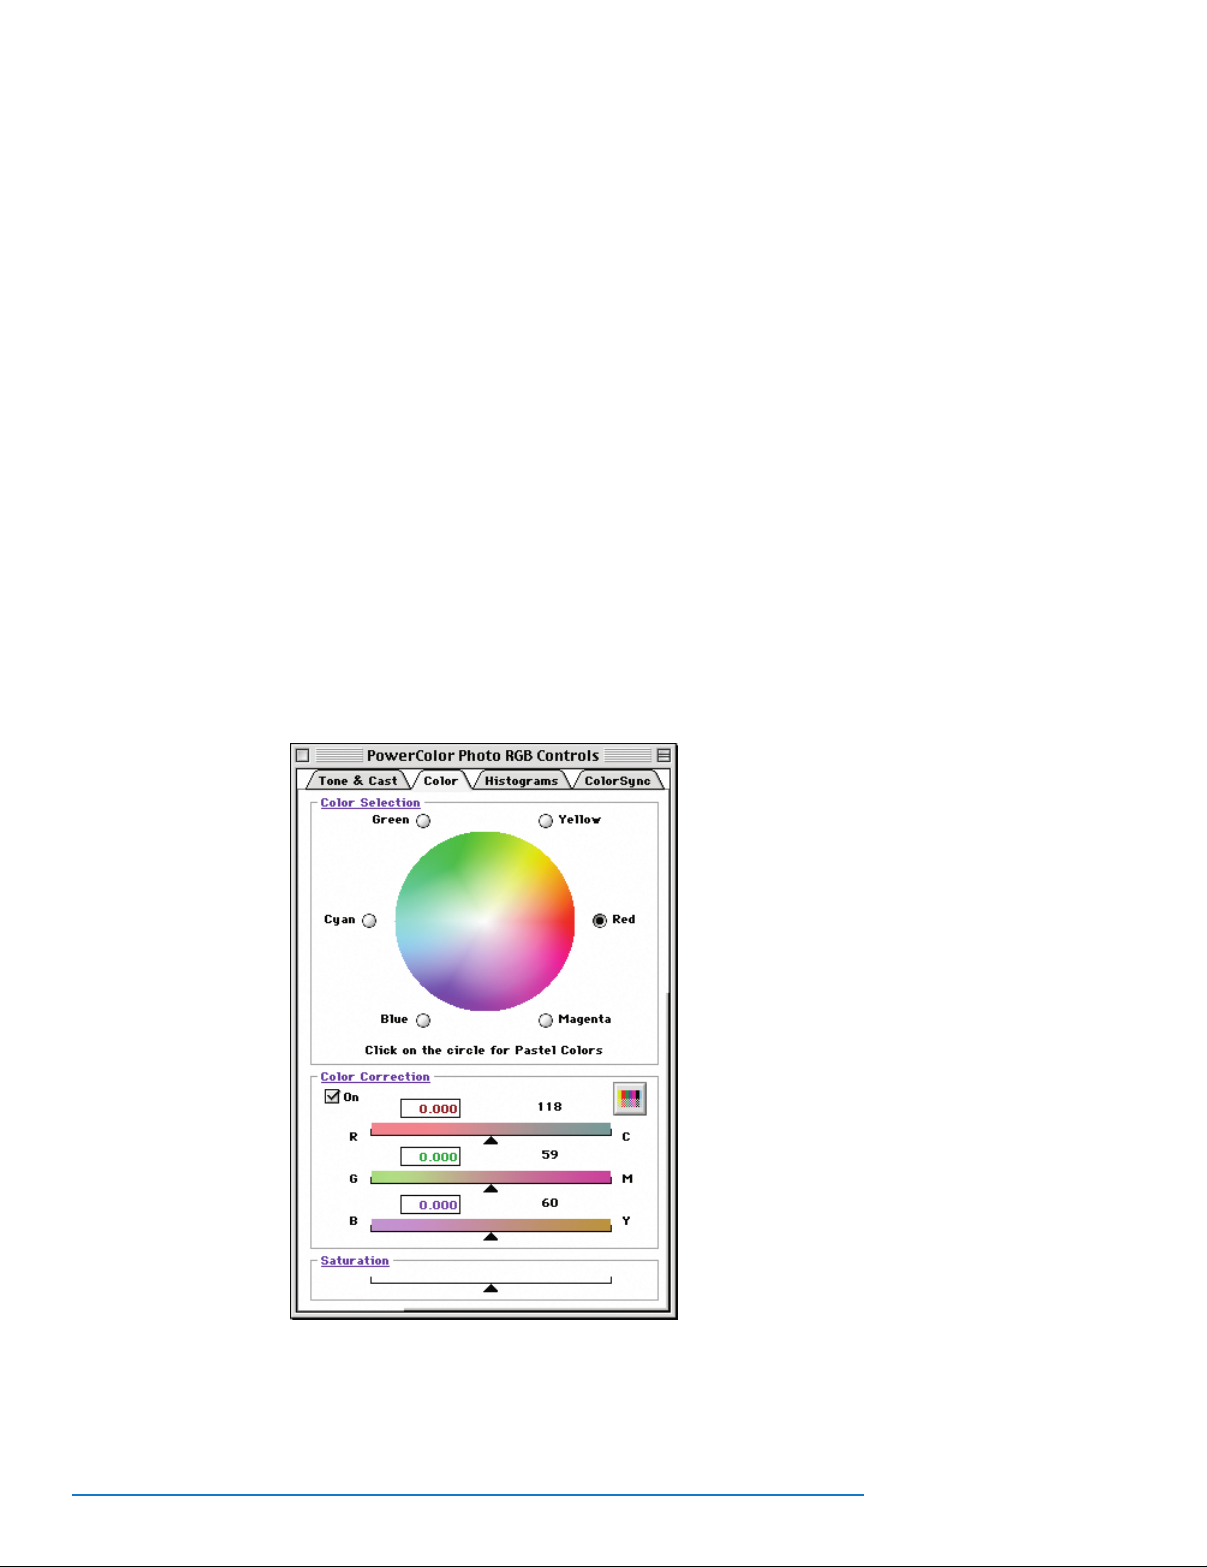
The Color option in the RGB Control window (see Figure 3–4) provides control
over high chroma (saturated) and low chroma (pastel) in all primary and secondary colors independently.
Use the Color Selection color wheel to select the individual color to be corrected.
You can also click on any area of the image and PowerColor automatically
detects the selected pixel’s high value and whether it is a pastel or saturated color.
To toggle between the high and low chroma colors, click on the color wheel. This
toggle feature allows you to make changes in the darker or lighter colors without
affecting the other.
Figure 3–4
Color option in the
RGB Control window
3-12 PowerColor User Guide
Page 59

Correcting Colors
The checkbox in the Color Correction section of the RGB Control window toggles
selective color on or off. The default mode is On.
Note: The Color Correction checkbox should
always be checked.
The sliders in the Color Correction section allow you to perform color correction
in the three separate color channels. To do so, proceed as follows:
1. Select the hue to adjust by clicking on the color wheel.
2. Click on the radio button of the desired color.
Note: Steps 1 and 2 above can be combined by
selecting a point in the image, which automatically selects the proper hue and color.
3. Adjust the sliders to add or remove color(s) in a channel. Remember that
small movements in either direction can have strong effects.
Note: The boxes in each slider show arbitrary
reference numbers for your convenience. The
numbers to the right of the boxes show the RGB
values after the change.
4. Click on the Manual Update button in the window to check the results of
each change (or turn on automatic updating by clicking on the Auto Update
On button located in the Preferences Window).
The Before and After sections of the Probe provide real-time feedback for your
changes.
Chapter 3: Correcting Images in the RGB Color Space 3-13
Page 60

Figure 3–6
Histograms option in
the RGB Control window
Manipulating the Histograms
Manipulating the image’s histograms is a quick and powerful method of of setting its tonal range. To do so, click on Histograms in the RGB Control window
(see Figure 3–6).
The window displays the input density histogram and the output reflectance histogram. The input histogram can be adjusted to show all three RGB channels
together or each channel individually. To adjust the limits, slide the white slider
(highlight) and/or black slider (shadow) to the desired position.
The Output Reflectance histogram is a static display that cannot be adjusted. It is
designed to show how your adjustments will affect the image when output.
Note: Minor adjustments to histograms have
strong results. Move the sliders in small increments to avoid distorting your range values
excessively. (Remember to update the image
regularly to view your changes.)
3-14 PowerColor User Guide
Page 61

The ColorSync Separator (Macintosh Only)
The ColorSync window appears when you select ColorSync in the RGB Control
window (see Figure 3–7). Please note that this feature is available only for the
Apple Macintosh version of PowerColor.
The ColorSync window allows you to choose ColorSync ICC profiles. These profiles
will be applied to separations done if Photo is the specified separator in the
Preferences window (See Chapter 2-3).
Using the ColorSync Separator
In order to use a ColorSync profile, it must be in the ColorSync Profiles folder
within the System Folder of the Macintosh.
You can choose to open profiles for calibrating your output to a specific printer, as
well as input profiles for reflective or transparency scanning. These profiles will
automatically be applied to images scanned into CMYK colorspace.You can also
specify a screen monitor profile to provide an accurate “blow back” of your
images.
Chapter 3: Correcting Images in the RGB Color Space 3-15
Page 62

To choose a profile, click on the appropriate button within the ColorSync Window.
In the file dialog box that appears, choose the desired profile.
Note: ColorSync must be active on your system in order to use ColorSync profiles
Note: ColorSync must be active on your system
in order to use ColorSync profiles.
Tagging profiles to scanned images
The Store ColorSync Profiles in Saved Images check box at the bottom of the
ColorSync Window allows the user to tag the current profiles to final scanned
images. This feature is only available with the TIFF format. When using this
feature, the output file is not processed with the profiles, which allows further
correction “downstream” with different profiles, and also allows others to view
the file as you did.
3-16 PowerColor User Guide
Page 63

4
4
Correcting Images with
PowerColor Press/CMYK:
Production Mode
Page 64

Page 65

owerColor’s selective separator offers two color control modes for image cor-
P
rection work in the CMYK color space: Production and Expert. The Expert
color control mode is discussed in Chapter 5.
This chapter explains how to use Production mode and covers the following
topics:
• Understanding the CMYK Probe
• Using Production Color Controls
• Making Selective Color Corrections
The Production mode is selected in the Preferences window (see Setting
Preferences in Chapter 2 for more information).
Chapter 4: Color Correction in the CMYK Color Space: Production Mode
Page 66

Page 67

Figure 4–1
CMYK Probe window
Understanding the CMYK Probe
The CMYK Probe window (see Figure 4–1) is opened by selecting Probe from the
Tool menu or pressing +P (Macintosh) or Control + P (Windows).
The Probe is a static display of numerical information used as a guide in making
color correction changes. It is a valuable tool and should always be used in conjunction with the screen display. This section explains how to understand and use
the Probe.
Probe Location
This section of the CMYK Probe window shows the cursor’s X/Y coordinates at the
current location.
Chapter 4: Color Correction in the CMYK Color Space: Production Mode 4-1
Page 68

Displaying Density Values
The Densities table can be toggled open or closed with the blue triangle. It displays the RGB densities as read from the scanner (Original), after color correction (Reproduction), and when output after tone compression (Output).
Displaying Color Plates
The Probe allows you to select the color separations or combination of separations you would like to view in the image window as follows:
• The Four Plates button ( ) shows all four process colors together in the
image window (press +0 on a Macintosh or Control + 0 in Windows).
• The Cyan button ( ) shows only the Cyan plate in the image window
(press +1 on a Macintosh or Control + 1 in Windows).
• The Magenta button ( ) shows only the Magenta plate in the image
window (press +2 on a Macintosh or Control + 2 in Windows).
• The Yellow button ( ) shows only the Yellow plate in the image window
(press +3 on a Macintosh or Control + 3 in Windows).
• The Black button ( ) shows only the Black plate in the image window
(press +4 on a Macintosh or Control + 4 in Windows).
CMYK Values Before and After Corrections
The section below the Color Plates shows the CMYK values of the current cursor
location before and after changes, both in color swatches and in terms of dot
percentages.
Note: As you sample the image, you can
“mark” a location for image correction by simply clicking with your mouse. The CMYK values
for that location are then entered in the CMYK
Selective Color window (see below for details)
and remain there until you click on another
location in the image window. After a location is
marked, the cursor can still be used to sample
other parts of the image.
4-2 PowerColor User Guide
Page 69

Selecting Fixed Reference Points
The Static Probes section at the bottom of the CMYK Probe can be toggled open
or closed by clicking on the blue triangle. It allows you to select up to three fixed
points in the image which you can use to monitor important tonal ranges as you
correct the image.
To select a point, click on the 1, 2, or 3 button and click on the desired location
in the image. The location is flagged with the number, and the colors and dot
percentage values for that point before and after any changes are displayed in the
Probe.
Note: New static points can be selected at any
time using the above procedure, but the points
cannot be moved or deleted.
Chapter 4: Color Correction in the CMYK Color Space: Production Mode 4-3
Page 70

Using Production Color Controls
PowerColor’s CMYK Production mode is designed to combine the most common
tools for color correction work in a single dialog window. This allows you to work
more efficiently, gain a better overview of all adjustments, and use window space
economically. For more detailed and precise color controls in the CMYK color
space, or to build custom tables, use the Expert mode (see Chapter 5).
Note: Changes made in Production mode are
reflected in the individual controls in Expert
mode and vice versa.
To use the Production mode, select Production as PowerColor Press Mode in the
Preferences window (see Setting Preferences in Chapter 2 for more details). Open
the Production Controls window by selecting Production Controls in the
Correction menu.
Production Mode Workflow
PowerColor’s Production mode was designed to allow for fast setup and correction
of scans through the use of predefined tables. Color correction tables are made up
of six components: Grey Balance, Dot Gain, Gradation, Tone, USM, and Selective
Colors. Selective colors are corrected in the CMYK Selective Color window (see
next section).
4-4 PowerColor User Guide
Page 71

Figure 4-2
CMYK Production
Controls
Using Production Controls
The Production Controls window is broken into three major sections.
• Tools to set highlight and shadow points
• Pop-up menus for dot limits, settings and cast
• Slider controls for brightness, contrast, and saturation
Although there is no set workflow that needs to be followed when correcting an
image, for this manual we will assume a more traditional work-flow as follows:
• Set highlight and shadow points
• Set cast correction settings
• Adjust brightness and contrast
• Adjust dot limits
• Adjust selective colors
• Adjust USM
For this section of the manual we only cover the topics associated with the
Production Controls window. Selective color will be covered later in chapter 4.
USM will be covered in chapter 6.
Chapter 4: Color Correction in the CMYK Color Space: Production Mode 4-5
Page 72

Setting Highlight and Shadow
The most important aspect of setting up a scan is defining where to place the
highlight and shadow point. PowerColor has an automatic as well as a manual
means for accomplishing this task.
Note: There are two types of highlights:
“Specular” highlights are areas that contain no
dot percentage of any ink, while “diffused”
highlights contain a minimum dot percentage.
All densities less than the diffused highlight
slope to a 0% dot at a 45º angle. When setting
Highlight and Shadow points, PowerColor uses
the values within the Diffused Highlight and
Shadow area of the Production Controls
Window.
Setting the Input Range automatically with Auto Range
In the Production Controls Window you will find the Auto Range Icon ( ).
By selecting this tool, an Auto Range will be performed on the active region. The
Highlight and Shadow point will be set to the values shown in the Diffused
Highlight and Shadow fields within the Productions Control Window. Also, these
points will be marked in your image by sticky densitometers.
How Auto Range determines Highlight and Shadow points
After the software has evaluated the image data it will make a series of decisions
as to where it will set the Highlight and Shadow point.
• Auto Range looks only at the densities of the image data that falls within the
current Region Crop. This is important to know because if you leave film
edge or an area beyond the image edge in your crop, the software will
include that data in its decision.
• The Highlight and Shadow points will not be set at the extreme minimum
and maximum, but at a percentage inside of the min and max. The reason
for this is to avoid setting the points on dust or scratches on the film.
• Due to the use of a catch light, data is never clipped, regardless of where the
highlight and shadow is set. (We will explain this later on with a discussion
of the Diffused Highlight.)
• PowerColor searches for densities that are closest to neutral (equal).
4-6 PowerColor User Guide
Page 73

Setting the Input Range Manually
To set the Input Range Manually when using the Production Controls, first, perform an Auto Range by clicking on the Auto Range icon within the Control bar.
Next, select the Pointed cursor from the Control bar, then click on the diamond
shaped Highlight (white) and Shadow (black) densitometers within the region,
and move them to the desired locations.
Changing the Diffused Highlight and Shadow Point : An Example
It is very important to understand the interaction between the diffused highlight
and shadow point in the image, the diffused highlight and shadow fields in the
Production Controls, and the highlight and shadow cast correction setting in the
Production Controls. One will always affect the other.
• The sticky densitometers reflect the exact points of interest.
• The Highlight and Shadow fields within the Production Controls control the
values those points will inherit.
• The Cast settings influence how the values react to one another when a new
value is typed into one of the fields or when you select a different cast setting.
For this example, an IT8 target is used, although a similar target containing
a gray wedge would work as well.
The bottom of the target contains 22 steps of gray bordered by paper white and
black. Let’s refer to paper white as a specular highlight (any point that should
contain no color) and black as our shadow point.
By selecting the pointed cursor from the Control bar, you can pick up the highlight sticky densitometer and drag it to a new location. First, place the highlight
densitometer on the specular highlight. This will cause that area to become our
point of interest and reflect the values in the Highlight field from the Production
Controls Window.
We will now work with the Highlight fields in the Production Controls. First,
choose the Settings button in the Production Controls Window, make sure the
Highlight and Shadow Cast Correction is set to full within the Settings Window
that appears. In the Cyan field next to the Diffused Highlight label type in “0”
and hit Enter. Notice that both the Magenta and Yellow values changed automat-
Chapter 4: Color Correction in the CMYK Color Space: Production Mode 4-7
Page 74

ically. This is because the Cast Correction setting is on Full--The color computer
will always keep the CMY values adjusted based on the Cast setting. The Color
Computer knows the relationship between Cyan, Magenta and Yellow based on
the user definable Gray Balance Table. You have now made the paper white
patch a specular highlight.
For the Shadow point, take the Shadow sticky densitometer and place it on the
Black patch. In the Cyan field next to the Shadow label type “100”. The black
patch will now become the absolute shadow point.
Of course, setting the input range would be a piece of cake if you only have to
scan IT8’s. Unfortunately, in the real world, not all images have perfect specular
highlights and absolute shadow points. But that’s OK, because PowerColor was
designed for the real world.
The next example is closer to the challenges of everyday scanning: Again, lets
use the bottom of the IT8, but this time we are going to throw out every patch
except #3 and #20. Now patch #3 may exist in an image as a linen table cloth,
pearl necklace, shirt, or countless other objects and materials. The point is that it
is identifiable in the image, and we either know, were told, or have to make an
assumption as to how it should reproduce on paper.
Lets start with knowing that patch #3 should be neutral and the cyan dot value
should be 10%. Take the Highlight sticky densitometer and place it on patch #3.
In the Cyan field type in “10” and hit Enter. You have just set a Diffused
Highlight and, because the cyan value is greater than 0, the Catch Light is automatically activated. Now move the Shadow sticky densitometer to patch #20 and
in the Cyan field next to the Shadow label, type “97” and hit Enter.
Note: Highlight and Shadow points don’t need
to be at the extreme ends of a histogram, even
though most of us are taught to think that way.
In fact, the highlight and shadow points don’t
even need to be neutral and in many images
you will need to leave a cast in these points.
Now, change the Highlight Cast correction setting to Half in the Settings Window.
The color computer will automatically calculate and keep half of the original
cast. Change the cast setting to None. The Highlight point will now keep 100%
of its original cast. Set the cast setting to Manual and you can now control the
Highlight point to any values that you desire. This of course works identically for
shadow cast.
4-8 PowerColor User Guide
Page 75

Figure 4–3
Dot Limits Window
Setting Dot Limits
The Dot Limits Window (see Figure 4–3) is used to control how inks will be output on a press.
The ink control fields are defined as follows:
• Total Ink: represents the maximum dot percentage the press can accommo-
date and equals the sum of the CMYK ink percentages. This number is generally between 260% and 340%.
• GCR/UCR: Undercolor Removal (UCR) and Gray Component Replacement
(GCR) replace CMY inks with Black in the neutral areas to reduce total ink
on the press. GCR/UCR is the percentage of ink replaced, while Start%
defines the Cyan dot percentage at which GCR/UCR begins.
• Max Black: This field sets the maximum dot percentage for Black. Start%
defines the Cyan dot percentage at which Black begins to be added.
Note: It is always advisable to consult with your
press operator when adjusting ink controls.
Chapter 4: Color Correction in the CMYK Color Space: Production Mode 4-9
Page 76
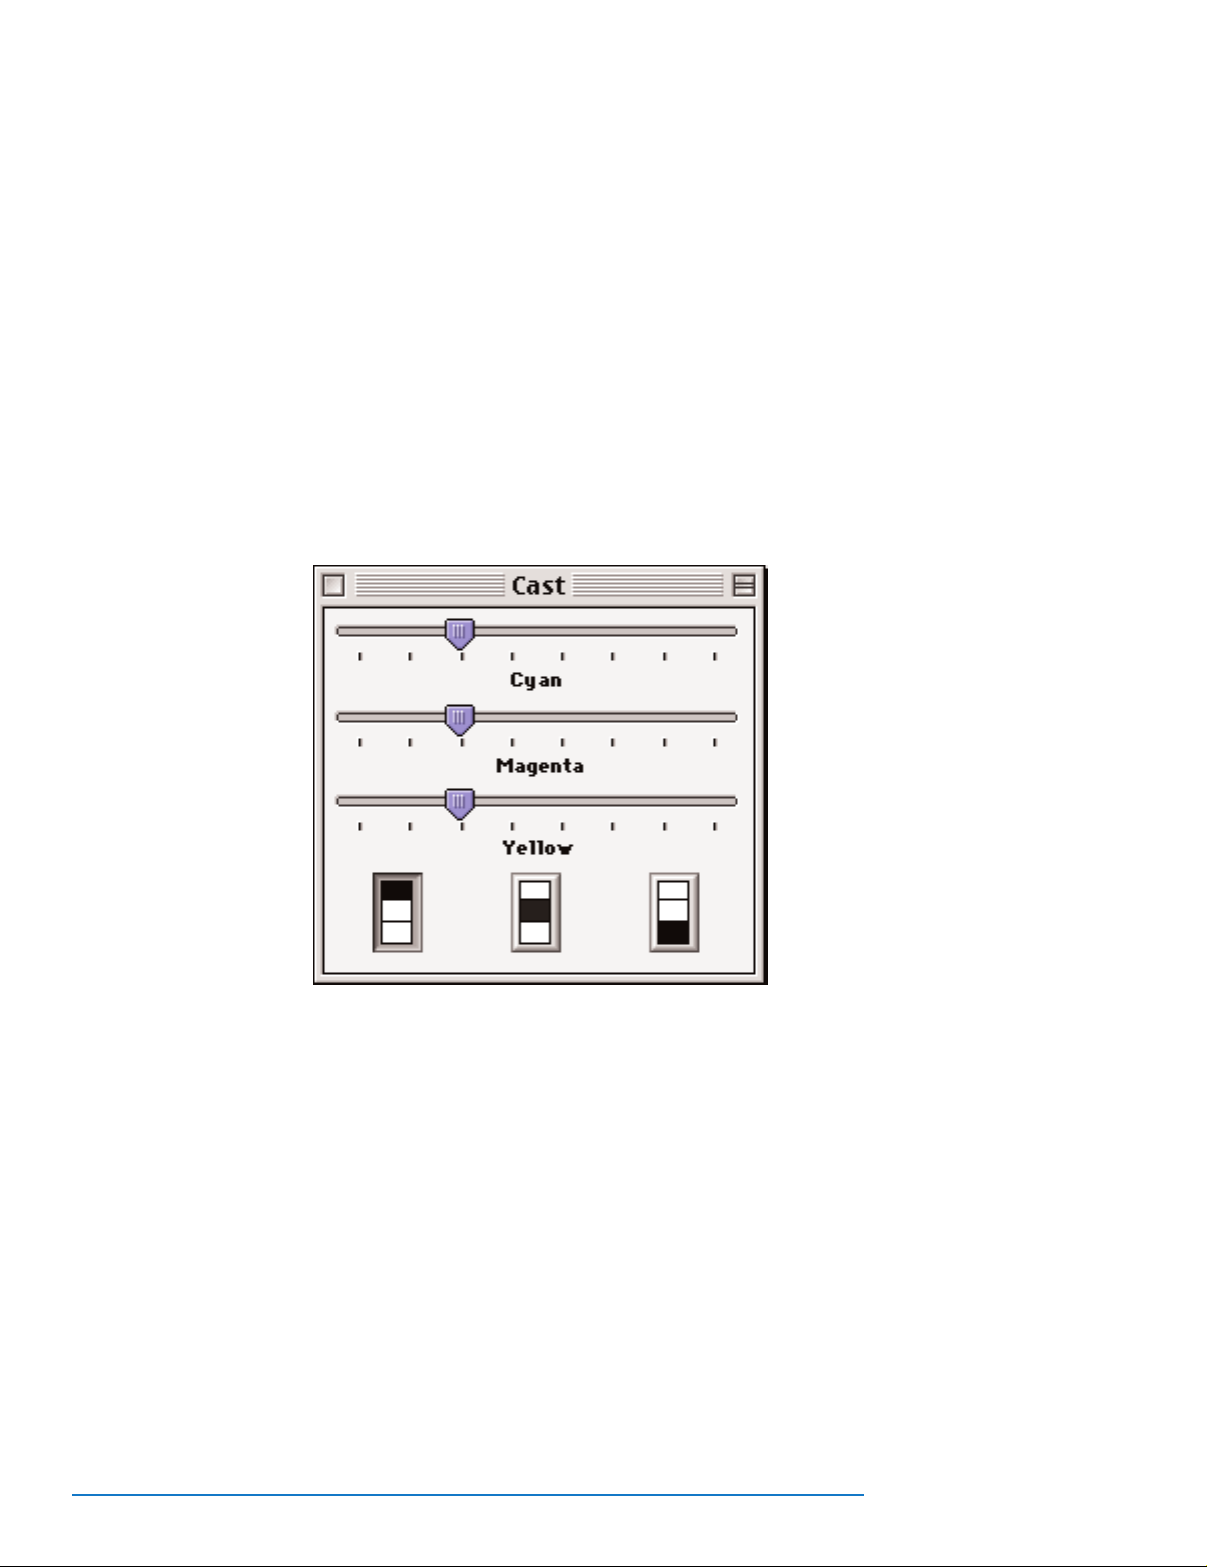
Figure 4–5
Cast window of the
Production Controls
window
Setting an Image’s Tone
Click on Tone at the top of the Production Controls window to bring up the Tone
section of the bottom of the window (see Figure 4–5). PowerColor’s tone controls
provide a flexible tool for correcting color casts.
Adjusting Colors in Tonal Regions
Use the top half of the Tone section to adjust the CMY colors in the three basic tonal
regions. To use these tools, click on the desired tonal region button left: quarter
tones, middle: midtones, right: three quarter tones) and adjust the CMY sliders to
achieve the result you are looking for.
Correcting Color Casts
Cast correction is the process by which unwanted color is removed from the neutral tones of an image. PowerColor provides automated and manual controls to
target points along the tonal range.
4-10 PowerColor User Guide
Page 77

Cast correction is important because PowerColor Press performs color correction
separately on the hues and on the neutral areas. Casts are removed by adjusting the
Cyan, Magenta and Yellow densities of a selected tonal region. By making the output densities equal or nearly equal, the result is a neutral value. This neutral density value is passed through PowerColor’s gray balance table where the appropriate
dot values are applied.
Note: Many images may not contain truly “neu-
tral” points. For these images, it is best to perform the following procedure on a grayscale
step wedge mounted next to the image instead
of the image itself.
To correct casts automatically on neutral grays, proceed as follows:
1. Click on the gray eyedropper in the Control bar.
2. Move the cursor inside the image or step wedge and click on the point you
wish to define. After you select the point, the eyedropper tool is automatically
deselected.
3. Check the new values using the Probe.
Setting multiple gray points
The gray eyedropper is unique in that it can set multiple points. Gray points are
made up from the quarter tone, midtone, and three-quarter tone regions. To select
multiple points, hold the Option key down (Macintosh), or the Control key down
(Windows), while selecting each point. Before you select the last point, release the
Option key and click on the point. The tool is then deselected automatically.
Chapter 4: Color Correction in the CMYK Color Space: Production Mode 4-11
Page 78

Figure 4–7
CMYK Selective Color
window
Making Selective Color Corrections
The CMYK Selective Color window (see Figure 4–7) provides control over high
chroma (saturated) and low chroma (pastel) in all primary and secondary colors
independently. To open the window, select Selective Color from the Correction
menu.
Selecting Colors to Be Corrected
Use the Color Selection color wheel to select the individual color to be corrected.
You can also click on any area of the image and PowerColor automatically
detects the selected pixel’s high value and whether it is a pastel or saturated color.
To toggle between the high and low chroma colors, click on the color wheel. This
toggle feature allows you to make changes in the darker or lighter colors without
affecting each other.
4-12 PowerColor User Guide
Page 79

Using the Sliders to Correct Individual Colors
The sliders in the Color Correction section allow you to perform detailed color
correction. Follow this procedure:
1. Select the color to adjust by clicking the appropriate radio button around
the Color Selection color wheel. Clicking on a point in the image automatically selects the proper hue.
2. Adjust the sliders in the desired color(s) to add or remove CMYK inks for that
color. Remember that small movements in either direction can have substantial effects.
Note: The boxes in each slider contain arbitrary
reference numbers for your convenience.
3. Click on the Manual Update button in the window to check the results of
each change (or turn on automatic updating by clicking the Auto Update
On button in the toolbar).
4. Check the Before and After swatches in the Probe to evaluate the effect of the
color change.
Chapter 4: Color Correction in the CMYK Color Space: Production Mode 4-13
Page 80

Page 81

5
5
Correcting Images with
PowerColor Press/CMYK:
Expert Mode
Page 82

Page 83

owerColor’s selective separator offers two color control modes for your image
P
correction work in the CMYK color space: Production and Expert. The
Production color control mode is discussed in Chapter 4. This chapter explains how
to use Expert mode and covers the following topics:
• Calibrating PowerColor selective separator
• Setting up the gray balance
• Controlling dot gain
• Using tone controls
• Setting highlight and shadow
• Using gradation controls
For information on how to use the CMYK Probe, see Understanding the CMYK
Probe in Chapter 4.
Calibrating PowerColor Press
CAUTION: PowerColor Press should be set up
and calibrated only using the procedures in this
section. Do not make any adjustments in the
CMYK Setup window.
Understanding Calibration
PowerColor incorporates a user-friendly method of calibrating the CMYK
Separator for specific output devices, such as inkjet printers, conventional proof
printers, and printing presses. The software includes a file called PowerColor 16,
which contains patches for saturated and pastel colors, as well as a three-color
and four-color Black patch (see Figure 5–1). The markers A, B, and C outside the
color patches identify the orientation of the target and the location of the patches.
Chapter 5: Color Correction in the CMYK Color Space: Expert Mode 5-1
Page 84

Figure 5–1
PowerColor 16 target
file
Note: PowerColor calibration is only used with
printed targets, not film-based targets (e.g.
Q60). This calibration method characterizes
output devices, not films.
By characterizing the output device, PowerColor can automatically remove
unwanted contaminants found in inks (a process sometimes referred to as “wanted” and “unwanted” calibration). It also allows PowerColor to set the proper
thresholds between the saturated and pastel colors.
The three-color Black patch sets the maximum three-color density. This value is
automatically entered into PowerColor’s setup table and determines the endpoint
of the Grad 3 gradation curve.
Note: The Grad 3 and 4 curves can be viewed
only in Expert mode.
Preparing the Target for Output
PowerColor 16 is a CMYK file in TIFF format. In order to characterize your output
device properly, the file must be processed exactly as a real job, so that all transforms and screens are identical to actual production work.
5-2 PowerColor User Guide
Page 85

To prepare the target file for output, follow these steps:
1. Output the PowerColor 16 file on film.
2. Produce a match print using your standard production process.
Note: Make sure the match print is free of
any artifacts, such as scratches, ink spots, or
fingerprints.
3. Mount the print on the bed of your scanner.
4. Produce an Overview scan and preview scan a region
containing the print. (For information on producing Overview scans and
working with regions, see Chapter 2).
Note: The Scan Type must be set to Reflective.
If scanning in screened output, remember to
turn descreening on.
5. In the Edit menu, select Selective Calibration. The Selective Calibration win-
dow appears:
Figure 5–2
Selective Calibration
window
Chapter 5: Color Correction in the CMYK Color Space: Expert Mode 5-3
Page 86

6. Make sure the selected Target is PowerColor 16. If not, select PowerColor 16
from the pulldown menu.
Note: Although it is possible to use customized
targets, it is strongly recommended that you
use the file supplied with PowerColor.
7. Click on Start. The Point A radial button becomes active.
8. Move the cursor over the A patch on the target image. The cursor changes to
look like this: .
9. Click once on the A patch. The Found box for A is now checked and the
Point B radial button becomes active.
10. Place the box over patch B and click once. The Found box for B is checked
and the Point C radial button becomes active.
11. Place the box over patch C and click once. The Found box for C is checked.
12. Click on the Calibrate button. The calibration takes less than one second.
The Selective Calibration window then returns to its original state (no points
found).
13. After the calibration is complete, you will be prompted to save the calibration as your default. If you select Yes, PowerColor will save the calibration
for all film types. If you select No, you can save the calibration manually
through the Settings menu. Remember to save Color & Setup and
Gradation for all film types.
Note: Before saving settings as defaults, use the
settings and verify that they produce the expected results. It is also advisable to save existing
defaults before defining new ones.
5-4 PowerColor User Guide
Page 87

Figure 5–3
Gray Balance
window
Setting Up the Gray Balance
PowerColor’s Gray Balance table should be adjusted for each press environment
you intend to use. PowerColor provides a number of easy-to-use tools for customizing tables for different ink or printing conditions. To bring up the Gray
Balance window (see Figure 5–3) select Gray Balance in the Correction menu.
The gray balance table shows the corresponding Magenta and Yellow values for
Cyan dot percentages in increments of 5%. Depending on specific press characteristics, you might, for example, want to make sure that at a 50% Cyan dot, the
Magenta channel is not too strong. This table could be used to reduce the
Magenta value to, for example, 39% by typing 39 in the Magenta field at Cyan
50%.
Note: Gray Balance affects only the reproduction of the neutral areas. It does not affect the
reproduction of hues.
Chapter 5: Color Correction in the CMYK Color Space: Expert Mode 5-5
Page 88

The default gray balance values for PowerColor are those for SWOP inks and may
vary with different ink manufacturers. Ink values correspond to a given density,
which is used by PowerColor to determine the ink values to be used. The Max
Density field at the top left of the gray balance table represents the maximum
three-color neutral density. This value should be obtained from your press operator or by performing a selective calibration using the PowerColor 16 target (see
previous section).
PowerColor’s Save and Recall features are also very useful in the Gray Balance
controls, allowing you to store and reuse different gray balance tables.
Editing the Gray Balance Table
The Gray Balance table can be edited by entering the desired values in the fields.
This can be done using the two different settings in the Points section as follows:
• Fewer: By selecting this mode, you can enter the desired values only in the
5%, 50%, and 100% fields for Magenta and Yellow. After entering the values,
click on Interpolate, and PowerColor calculates all the values in between
those fields.
• More: By selecting this mode, you can enter values in all of the fields in the
table.
5-6 PowerColor User Guide
Page 89

Figure 5–4
Dot Gain window
Controlling Dot Gain
PowerColor’s dot gain controls are accessed by selecting Dot Gain in the
Correction menu. The Dot Gain window that appears (see Figure 5–4) contains a
table of values with dot percentages for the Cyan, Magenta, Yellow, and Black
inks.
Setting Dot Gain
Presses vary widely in terms of the dot percentages at which they experience maximum dot gain. The four color plates also tend to gain differently from each other.
PowerColor’s Dot Gain window allows you to take a given press’s gain characteris-
tics into account in preparing your image for output.
Chapter 5: Color Correction in the CMYK Color Space: Expert Mode 5-7
Page 90

The Dot Gain table shows dot percentages in increments of 5% with editable fields
to set the gain at those percentages in each of the four color channels. Dot percentages are determined by the dot gain value a particular press experiences. This
value is best determined in consultation with your press operator. The Dot Gain
table fields function as follows:
• Density: defines the maximum density for each ink.
• Position: defines the dot percentage at which the press experiences maxi-
mum dot gain.
• Gain: sets the amount of dot gain at the dot percentage indicated under
Position.
Note: For greater ease of customization, you
can enter precise values in any of the fields.
After entering values in the Position and Gain fields, the Dot Gain table adjusts to
reflect these values, ramping down on both sides of the Position percentage. To
understand how to use PowerColor’s Dot Gain feature, see the example below:
An Industry Example
The press operator indicates that the press in your shop gains
20% at a peak of 40% for Cyan. In the Dot Gain window, proceed as follows:
1. Click on the Cyan Position field.
2. Enter 40.0.
3. Press Tab to move to the Cyan Gain field.
4. Enter 20.0 and press Return.
Repeat this procedure for the other plates, adjusting the numbers
based on the information from your press operator.
5-8 PowerColor User Guide
Page 91

PowerColor’s powerful features allow you to customize and save different tables
for different presses. This is particularly useful for trade shops that run a variety
of presses for different types of work. By recalling the desired tables with
PowerColor’s Recall feature, you can apply previously calculated dot gains to all
your new images without reentering data.
Chapter 5: Color Correction in the CMYK Color Space: Expert Mode 5-9
Page 92

Using Tone Controls
PowerColor’s tone controls in Expert mode are accessed by selecting Tone from
the Correction menu. The CMY Tone window (see Figure 5–9) provides a highly
flexible tool to correct color casts in your image and set the input density range.
When making tone corrections in your image always keep the CMYK Probe open
to monitor the changes in numerical values (for more information, see
Understanding the CMYK Probe in Chapter 4).
Correcting Color Casts
Cast correction is the process by which unwanted color is removed from the neutral tones of an image. PowerColor provides automated and manual controls to
target five points along the tonal range: highlights, quarter tones, midtones,
three-quarter tones, and shadows.
Cast correction is important because PowerColor Press keeps hues and neutrals
separate so that color correction can be performed on the hues without affecting
the neutral areas. Casts are removed by adjusting the Red, Green, and Blue
densities of a selected tonal region. By making the output densities equal or nearly equal, the result is a neutral value. This neutral density value is passed
through PowerColor’s gray balance table where the appropriate dot values are
applied.
Some images are intentionally photographed through color filters, which, while
adding artistic effects, also add a color cast to the image. The human eye is
extraordinarily sensitive to shifts in colors in the neutral areas, so cast removal
from the highlights and shadows is of paramount importance.
5-10 PowerColor User Guide
Note: Removing too much of a cast from a
heavily casted image may cause undesired
effects.
Page 93

Figure 5–9
CMYK Tone window
Tone Curves
The primary tools in the CMY Tone window are the tone curves and the highlight
and shadow value fields. They are a powerful way of correcting casts in very specific tonal regions of your image. The CMY drop down menu above the curves
activates the Cyan, Magenta,or Black curve in the graph, respectively.
The horizontal axis of the graph represents the input density. The vertical axis
represents the percentage of output density.
The points on the curve (called “anchor points”) are, from left to right, located
at the following values: highlights, quarter tones, midtones, three-quarter tones
and shadows. By selecting an anchor point and dragging it up or down, you can
alter the amount of the selected color in that tonal region.
The black lock icon at the bottom left-hand corner of the grid is open by default.
By clicking on it, the anchor points on the curve are locked into position so you
can move each of the points individually without affecting the position of the
others. Locking the curve also creates additional anchor points allowing you to
fine-tune the curve further.
Chapter 5: Color Correction in the CMYK Color Space: Expert Mode 5-11
Page 94

The Highlight and Shadow fields allow you to specify the Diffused Highlight and
Shadow settings for Cyan, Magenta and Yellow. When setting your Highlight and
Shadow points manually or with Auto Range, the values displayed in these fields
will be used. For more on setting Highlight and Shadow points see page 5-13.
The Catch Light Angle section allows you to define the angle between the diffused
highlight and the specular highlight. The default setting for Angle is 45°.
The Cast Removal drop-down menu at the bottom of the CMY Tone window
allows you to set automatic cast removal for the highlights and shadows as follows: Full, Half, Manual, or None. By selecting Manual cast removal, you can
define the density values or dot percentages for highlight and shadow on the
Cyan, Magenta, and Yellow plates in the appropriate editable field or by selecting
the curve you wish to edit and moving the highlight or shadow anchor point up
or down.
Note: Click on the Dot % or Density radio button
to display values in those units.
Using the Gray Eyedropper to Set Neutral Points
The Gray eyedropper, found in the Control Bar, is unique in that it can set multiple points. This is useful in correcting cast along multiple tones in your image.
Gray points are made up from the quarter tone, midtone, and three-quarter tone
regions. To select multiple points, hold the Option key (Macintosh) or Control
key (Windows) down while selecting each point. Before you select the last point,
release the Option or Control key and click on the point. The tool is then deselected automatically.
5-12 PowerColor User Guide
Page 95

Setting Highlight and Shadow
The most important aspect of setting up a scan is defining where to place the
highlight and shadow point. PowerColor has an automatic as well as a manual
means for accomplishing this task.
Note: There are two types of highlights: “Specular”
highlights are areas that contain no dot percentage
of any ink; “diffused” highlights contain a minimum
dot percentage. All densities less than the diffused
highlight slope to a 0% dot at a 45º angle. When setting Highlight and Shadow points, PowerColor uses
the values within the Diffused Highlight and Shadow
area of the Production Controls Window.
Setting the Input Range Automatically
In the Control bar you will find the Auto Range Icon ( ). By selecting this
tool, an Auto Range will be performed on the active region. The Highlight and
Shadow point will be set to the values shown in the Diffused Highlight and
Shadow fields within the Tonal Window. Also, these points will be marked in your
image by sticky densitometers.
How Auto Range determine Highlight and Shadow points
After the software has evaluated the image data it will make a series of decisions
as to where it will set the Highlight and Shadow point.
• Auto Range looks only at the densities of the image data that falls within the
current Region Crop. This is important to know because if you leave film
edge or an area beyond the image edge in your crop, the software will
include that data in its decision.
• The Highlight and Shadow points will not be set at the extreme minimum
and maximum, but at a percentage inside of the min and max. The reason
for this is to avoid setting the points on dust or scratches on the film.
• Due to the use of a catch light, data is never clipped, regardless of where the
highlight and shadow is set. (explained later on with Diffused Highlight.)
• PowerColor searches for densities that are closest to neutral (equal).
Chapter 5: Color Correction in the CMYK Color Space: Expert Mode 5-13
Page 96

Setting the Input Range Manually
To set the Input Range Manually, first, perform an Auto Range by clicking on the
Auto Range icon within the Control bar. Next, select the Pointed cursor from the
Control bar, then click on the diamond shaped Highlight (white) and Shadow
(black) densitometers within the region, and move them to the desired locations.
Changing the Diffused Highlight and Shadow Point : An
Example
It is very important to understand the interaction between the diffused highlight
and shadow point in the image, the diffused highlight and shadow fields in the
Production Controls, and the highlight and shadow cast correction setting in the
Production Controls. One will always affect the other.
• The sticky densitometers reflect the exact points of interest.
• The Highlight and Shadow fields within the Tone Window control the values
those points will inherit.
• The Cast settings influence how the values react to one another when a new
value is typed into one of the fields or when you select a different cast setting.
For this example, an IT8 target is used, although a similar target containing
a gray wedge would work as well.
The bottom of the target contains 22 steps of gray bordered by paper white and
black. Let’s refer to paper white as a specular highlight (any point that should
contain no color) and black as our shadow point.
By selecting the pointed cursor from the Control bar, you can pick up the highlight sticky densitometer and drag it to a new location. First, place the highlight
densitometer on the specular highlight. This will cause that area to become our
point of interest and reflect the values in the Highlight field from the Tone
Window.
We will now work with the Highlight fields in the Tone Window. First, click the
Cast button and make sure the Highlight and Shadow Cast Correction is set to
full. In the Cyan field next to the Diffused Highlight label type in “0” and hit
Enter. Notice that both the Magenta and Yellow values changed automatically.
This is because the Cast Correction setting is on Full--The color computer will
always keep the CMY values adjusted based on the Cast setting. The Color
Computer knows the relationship between Cyan, Magenta and Yellow based on
5-14 PowerColor User Guide
Page 97

the user definable Gray Balance Table. You have now made the paper white
patch a specular highlight.
For the Shadow point, take the Shadow sticky densitometer and place it on the
Black patch. In the Cyan field below the Shadow label type “100”. The black
patch will now become the absolute shadow point.
Of course, setting the input range would be a piece of cake if you only have to
scan IT8’s. Unfortunately, in the real world, not all images have perfect specular
highlights and absolute shadow points. But that’s OK, because PowerColor was
designed for the real world.
The next example is closer to the challenges of everyday scanning: Again, lets
use the bottom of the IT8, but this time we are going to throw out every patch
except #3 and #20. Now patch #3 may exist in an image as a linen table cloth,
pearl necklace, shirt, or countless other objects and materials. The point is that it
is identifiable in the image, and we either know, were told, or have to make an
assumption as to how it should reproduce on paper.
Lets start with knowing that patch #3 should be neutral and the cyan dot value
should be 10%. Take the Highlight sticky densitometer and place it on patch #3.
In the Cyan field type in “10” and hit Enter. You have just set a Diffused
Highlight and, because the cyan value is greater than 0, the Catch Light is automatically activated. Now move the Shadow sticky densitometer to patch #20 and
in the Cyan field next to the Shadow label, type “97” and hit Enter.
Note: Highlight and Shadow points don’t need
to be at the extreme ends of a histogram, even
though most of us are taught to think that way.
In fact, the highlight and shadow points don’t
even need to be neutral and in many images
you will need to leave a cast in these points.
Now, change the Highlight Cast correction setting to Half. The color computer
will automatically calculate and keep half of the original cast. Change the cast
setting to None. The Highlight point will now keep 100% of its original cast. Set
the cast setting to Manual and you can now control the Highlight point to any
values that you desire. This of course works identically for shadow cast.
Chapter 5: Color Correction in the CMYK Color Space: Expert Mode 5-15
Page 98

Figure 5–5
CMYK Gradation window
Using Gradation Controls
PowerColor’s gradation is controlled in the CMYK Gradation window (see Figure
5–5). To open this window select Gradation in the Correction menu.
When making gradation corrections in your image always keep the CMYK Probe
window open to monitor the changes in numerical values (for more information,
see Understanding the CMYK Probe in Chapter 4).
5-16 PowerColor User Guide
Page 99

Understanding Gradation
In a general sense, gradation governs how quickly colors ramp from highlight to
shadow. In the CMYK Tone window (see the Using Tone Controls later in this
chapter), highlight and shadow values are defined independently for Cyan,
Magenta and Yellow. In the CMYK Gradation window, however, highlight and
shadow are set for groups of colors globally.
The CMYK Gradation window consists of a curve grid and a table of editable fields
(see Working with the Gradation Table below). You may notice that only Cyan
appears to be represented in the table. Cyan is the most representative of the colors
which make up “Grad 3,” a term designating the CMY curve. However, gradation
changes affect all colors.
Above the table is a set of four radio buttons (see Figure 5–5) to select the gradation curve to work on. The buttons are defined as follows:
• Grad 3: activates the three-color (CMY) density curve, shown as the upper-
most blue curve in the graph. This curve determines the shape of the threecolor density gradation curve and sets both the three-color input and output
range (see Setting the Input Range later in this chapter).
Note: The endpoint of the Grad 3 curve represent the CMY reproduction density. This value is
set automatically during CMYK selective calibration (see the section earlier in this chapter). Do
not modify this value unless you intend to limit
the Cyan dot. This value should never be
increased beyond the maximum three-color density.
Chapter 5: Color Correction in the CMYK Color Space: Expert Mode 5-17
Page 100

Figure 5–6
Skeletal Black area.
➀
–Grad 4 curve.
➁
–Grad 3 curve.
➂
–Skeletal Black.
• Grad 4: represents the increased density that can be achieved by adding
Black to CMY (also referred to as the “skeletal Black”). The shape of the
curve reflects where Black begins and ends and the slope of its ramp in
between. The endpoint of the Grad 4 curve represents the total reproduction
density of all four inks (generally ±2.0 for coated stock). The area in
between Grad 4 and Grad 3 curves represents the skeletal Black:
By pulling the nodes of Grad 4 down to meet Grad 3,
the Black is eliminated in the density range where the curves meet:
Figure 5–7
Skeletal Black area.
➀
–Grad 4 curve.
➁
–Grad 3 curve.
➂
–Skeletal Black.
➃
–Black eliminated.
5-18 PowerColor User Guide
 Loading...