

Page 1

StabilityAnalysis T ool
User's Guide
For use withBoardMounted
DC-DCconverters
V1.3
TYCO ELECTRONICSPOWERSYST EMS3000SKYL INEDRIVEMESQU ITE,TX75149
Page 2

2
Copyright
***************************************************************************
* COPYRIGHT 2001, TYCO ELECTRONICS POWER SYSTEMS, INC. *
* ALL INTERNATIONAL RIGHTS RESERVED *
***************************************************************************
!!!!!!!!!!!!!!!!!!!!!!!!!!!!!!!!!!!!!!!!!!!!!!!!!!!!!!!!!!!!!!!!!!!!!!!!!!!
BY USING THE INFORMATION CONTAINED HEREIN, YOU ARE AGREEING TO BE
BOUND BY THE TERMS OF THIS AGREEMENT. IF YOU DO NOT AGREE TO THE
TERMS OF THIS LICENSE, YOU ARE NOT AUTHORIZED TO USE THE INFORMATION.
!!!!!!!!!!!!!!!!!!!!!!!!!!!!!!!!!!!!!!!!!!!!!!!!!!!!!!!!!!!!!!!!!!!!!!!!!!!
USER AGREEMENT
-------------The information contained herein, including the data files and other
documentation (collectively the "Information") has been licensed to you free of
charge for your use, but remains the property of Tyco Electronics Power
Systems, Inc. (“Tyco Electronics”). You acknowledge that Tyco Electronics owns
the Information and all copyrights and other intellectual property in the
Information. You receive only a limited right to use the Information. You
acknowledge that the Information is or contains proprietary information
developed by Tyco Electronics. You shall retain the Information in confidence
and shall not disclose, sell, license, transfer or otherwise dispose of the
Information without Tyco Electronics' permission. You acknowledge that the
Information maybe subject to additional restrictions of confidentiality as
addressed by additional agreements that may be in place between you and Tyco
Electronics. [Tyco Electronics reserves the right to code models to track
distribution.]
The Information is not covered by Tyco Electronics' limited warranty relating
to product for which the Information is provided. The Information is provided
"AS IS" and Tyco Electronics does not guarantee that it is error-free, nor does
Tyco Electronics make any representations, warranty or guarantee that the
Information is accurate, correct, reliable or up-to-date. Tyco Electronics
expressly disclaims all implied warranties regarding the Information provided,
including but not limited to any implied warranties of merchantability or
fitness for a particular purpose. Tyco Electronics does not warrant that the
Information will work correctly in your application. Some states do not allow
the limitation or exclusion of implied warranties, so the above limitation may
not apply to you. You may also have other rights that vary from state to
state.
Tyco Electronics will in no case be liable for your use, or the results of your
use, of the Information contained herein. IT IS YOUR RESPONSIBILITY TO VERIFY
THE RESULTS OF YOUR USE OF THIS INFORMATION IN YOUR OWN PARTICULAR ENGINEERING
AND PRODUCT ENVIRONMENT, AND YOU ASSUME THE ENTIRE RISK OF DOING SO OR FAILING
TO DO SO. In no event will Tyco Electronics or its contractors, directors,
officers, employees, affiliates or distributors be liable for any direct,
indirect, incidental or consequential damages (including but not limited to
damages for lost business, lost profits, business interruptions and loss of
information) arising from your use of, or your inability to use, the
Information, even if Tyco Electronics has been advised of the possibility of
such damages. In no event will Tyco Electronics' liability to you for any
cause whatsoever and regardless of the form of action, exceed $500. Some
states do not allow the limitation or exclusion of liability for incidental or
consequential damages, so the above limitation may not apply to you.
Page 3

3
No oral or written information or advice given by Tyco Electronics or its
distributors, agents or employees will operate to create any warranty or
guarantee or vary any provision or information herein, and you may not rely on
any such information or advice. Tyco Electronics reserves the right to change
any portion of this data, and to change the Information, at any time without
notice.
Page 4

4
1
Introduction
The Stability Analysis Tool (SAT) is a Microsoft Excel-based program that
provides a Bode plot of the voltage loop gain of a DC-DC converter for a variety of
external l oa ds. From this plot, informatio n such as crossover frequency and gain and
phase margins can be obtained .
In classical control theory, the stability of a feedback system is assessed by
evaluating its gain and phase margin which are read directly from the Bode plot of
the loop gain. The loop gain of a DC-DC converter dependsnotonlyon the converter
characteristics but also on the load characteristics and the o utput voltage sense
location. This dependence of loop gain on load and sense location makes it
impossible for the power converter manufacturer to determine stability margins in an
actual applicatio n, since the load (especially the number, type and location of output
bulk capacitors, parasitic inductances, etc.) and the output voltage sense location are
unknown. Due to this, in the past if the customer wanted to determine stability
margins, the loop gain would have to be measured using a breadboar d of the powersupply and the load networ k using a networkanaly z er.
The Stability Analysis Tool decouples the combined converter+load system into
two subsystems; one representing the converter and the other representing the load.
Tyco Electronics Power Systems provides converter data files on its web site. The
customer can download the converter data file and import it into the SAT. SAT
allows choosing one of five different configurations to best represent the combination
of load representation and voltage sense location. The tool then allows assessment
of the stability characteristics without the user having to build a prototype of the
power supply and the loadnetwor k andavoidsmaking measureme nts.
System Requirements
SAT v1.3 runs under the followingsy stems:
1) Windows 95, 98, 2000 or Windows NT version4opera tingsystems
2) Microsoft Excel 97 SR-2 or Excel 2000
3) Intel Pentium class or above processorandatleast64MBofRAM
Page 5
5
Installation and Usage
You should first read andaccep t theter mso f the SAT usag e.
Download the file SAT_v1.3.xls from the Tyco Electronics Power Systems
web site (given below ) to a directoryon your computer .
Download one or more module datafile(s )tothesam e director y.
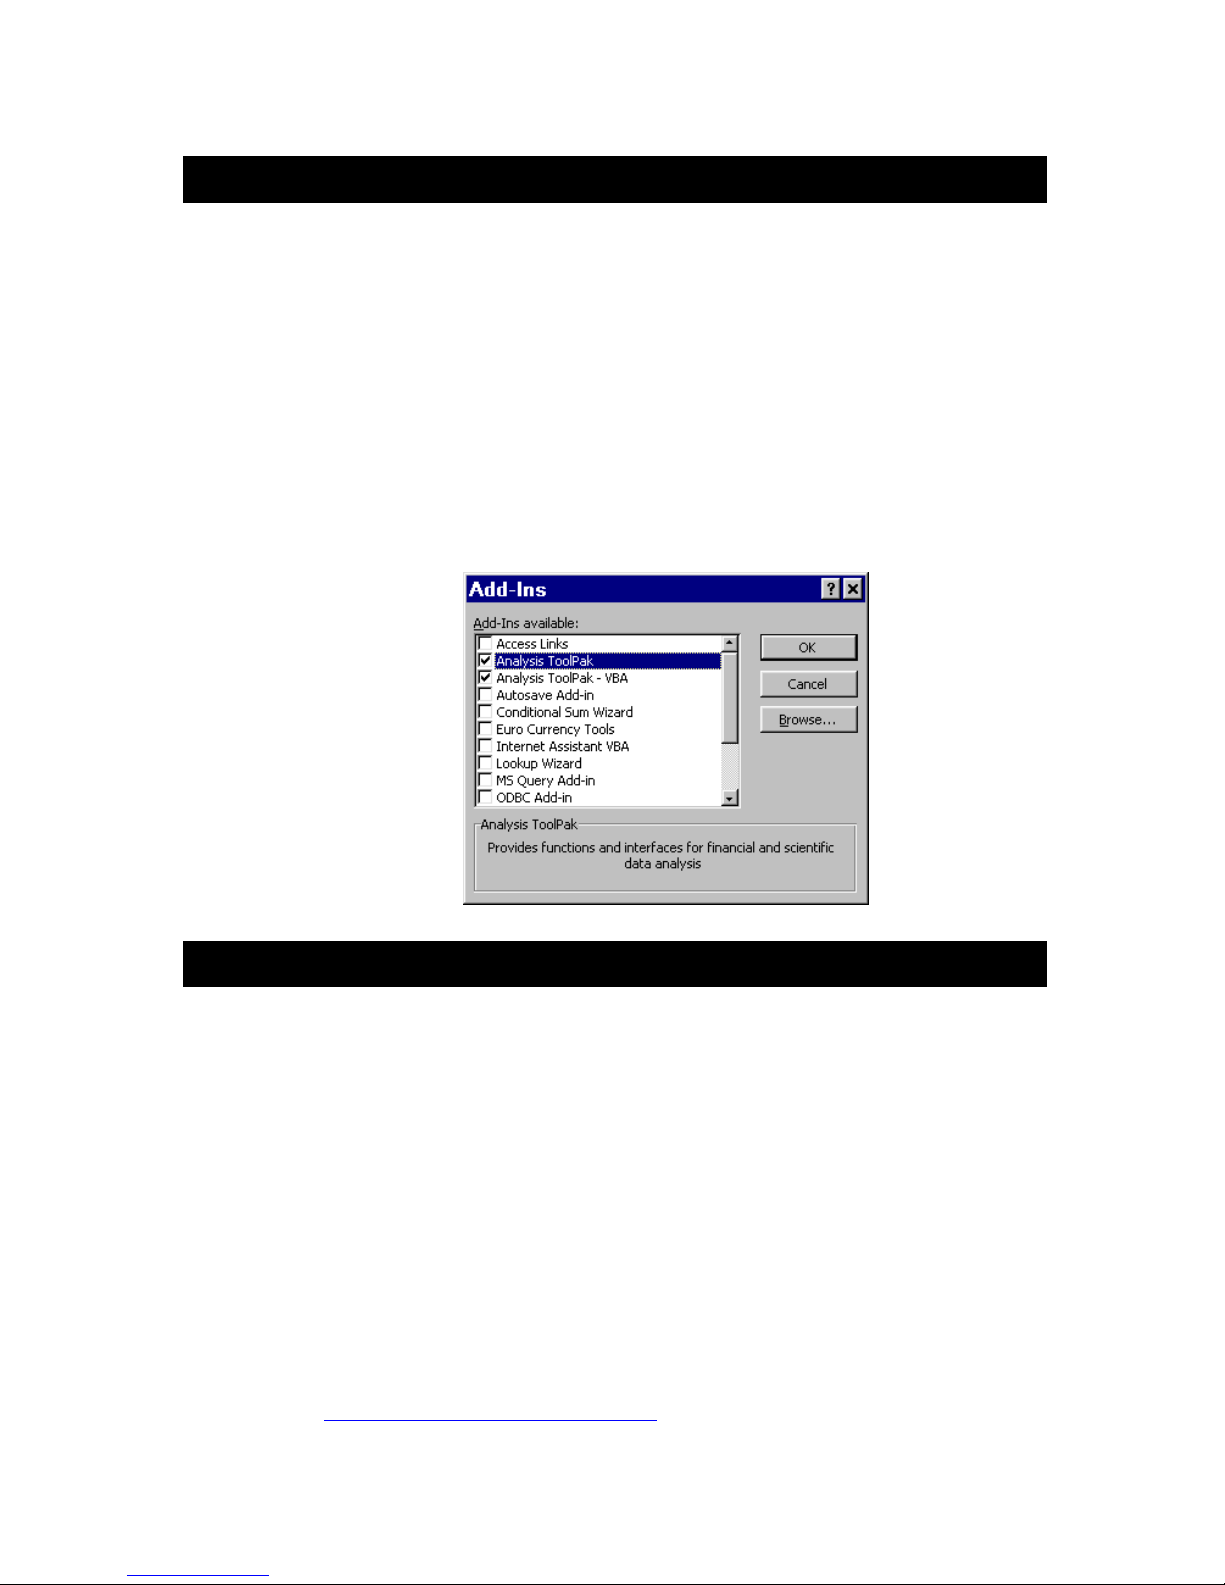
You can start up the tool by following the usual procedures to open an
Excel Worksheet and follow the directions on the screen. Make sure that
the Analysis Toolpak Add-ins are enabled in Excel. Go to Tools menu in
Excel and click on Add-Ins. Check (tick) on A naly sis Toolpack and
Analysis Toolpack – VBA.
Technical Support
For technical support,pleaseco nt actusat
USA Tyco Electronics Power Systems
3000 Skyline Drive
Mesquite, TX 75149
USA
Phone - 800-526-7819
Fax - 888-315-5182
Outside
U.S.A.: Refer to our Web site below for Serv ice and Suppor tinotherreg io nsof
the world
Web: http://power.tycoel ectr onics.co m/
Page 6

6
2
Using SAT
When you start SAT, you willsee the windowsh ownin Figur e1.
Fig. 1. SATIntr oducti on and Modul eSelecti onpag e
Page 7

7
There are two sheets, "
Module Selection
" and "
Configuration Menu
initially at the bottom left-hand section of the Excel spreadsheet. Each session
" shown
should start at the "
Click on the button This will bring the module data file
Module Selection
Load Module Data File
" sheet.
import window as shownbelowin Figure 2.
Note that all module data files have .pwr extensions. If you have not already
downloaded the module data files for the particular modules you wish to analyze,
they will need to be downloadedbe foreyoucanusethe tool .
Choose the module that you want to use in your application by selecting the
corresponding module data file. In this guide, we will use the JFW050A module
as an example.
After highlighting the JFW050A.pwr file, click on the "OK" button or hit "ENTER".
SAT will load the module data file and move to the
Configuration Menu
as
shown in Figure 3. You may want to save SAT_v1.3.xls file under a different
name so that the originalonethatyou downloaded remains unchanged.
Fig. 2. Module data file import window
Page 8

8
If you want to choose a different module data file, you can always go back to the
3
4
Module Selection
The
Configuration Menu
sheet to change it.
lists five choices for repres enti ng the load circui t
topology.
The first conf igur atio n is a simple one where the output voltage is sensed
directly at the output pins of the module. The capacitor is modeled as a series
combination of equivalent series resistance (ESR) and equivalent series
inductance (ESL). If all the capaci tor s are the same type (e .g . alumi nu m
electrolytic) and capacitance value (e.g. 6800 µF), then this is a reasonable
Configuration Menu
Please click on the appropriate box to choose the configuration for your application
SENSE
DC/DC
CONVERTER
CONFIGURATION
1
R
L
SENSE
DC/DC
CONVERTER
CONFIGURATION
2
R
L
SENSE
DC/DC
CONVERTER
SENSE
DC/DC
CONVERTER
SENSE
DC/DC
CONVERTER
CONFIGURATION
CONFIGURATION
CONFIGURATION
5
R
L
R
L
R
L
Fig. 3. Circuit configuration
Page 9

9
model of the capacitorbank.The load is modeled by the resistanceRL.
The second configuration is similar to the first one except that the voltage sense
location is moved from the output pins of the module to the load. In this case,
the voltage sensed and regulated is not the module output voltage but the
voltage across the load,a situati oncommo nlyreferred to as "remote sensing".
The remaining three configurations (3, 4 and 5) allow the inclusion of more
detailed models of the capacitor banks and parasitic elements between the
module and the load. In some applicati ons, the power module is mounted on a
separate printed circui t board and supplies a nu mber of loads on different
PCBs. In this case, it is common to have one capacitor bank on the power
board and anotheroneonthelo adboar d.
The first capacitor bank, which is a parallel combination of three capacitors, is
usually located as close as possible to the module output pins. It conveniently allows
for modeling different types of capacitors such as aluminum and tantalum
electrolytics and ceramics. When the size and type of capacitors used in a bank are
different, their individual frequency responses vary greatly from one another and
hence they cannot be modeled as a lump ed capacitor as shown in the first two
configurations. Note that if you only have one or two types of capacitors, you can still
use the model by setting the values corr espon dingto the other capacito rto zero.
The second capacitor bank is typically placed as close as possible across the
load terminals to improv e dynamic response during load transients by minimizi ng the
voltage overshoot and undershoot. The capability of modeling two capacitors with
their ESR and ESL are providedtomodeldi ffer entty pesandsiz es of capaci tors.
The three configurations also allow for modeling various sense points for the
feedback voltage. Feedback voltage can be sensed across the load (case 3), across
the capacitor bank (case2),oracrossth emodul eoutpu t.
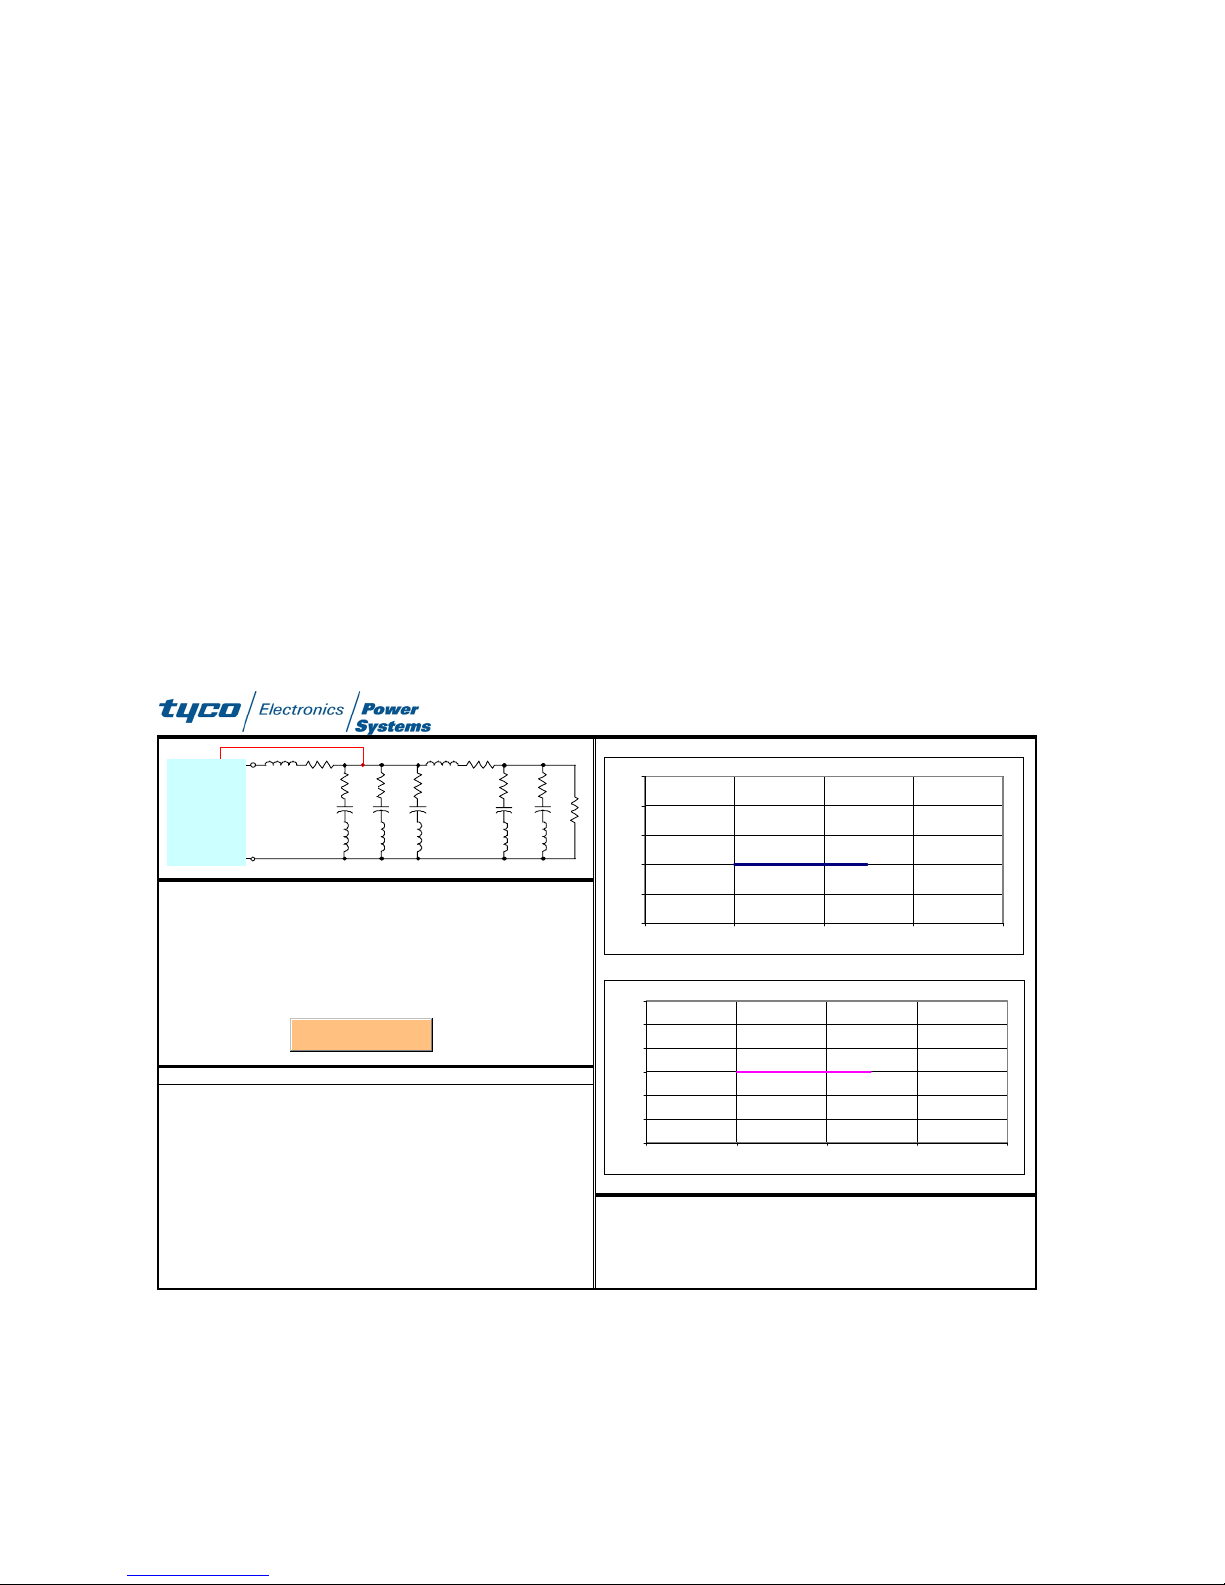
Click on the configuration picture suitable for your application. In this example, we
will choose Configuration 4. Clicking on the picture will bring that configuration's
page as shown in Figure4.
The top left section shows the configuration circuit with the feedback voltage
sense path depicted in red. Underneath the configuration circuit diagram, circuit
parameters are listed with default values that can be edited in blue. The
JFW050A module is a 5V, 10A output module and hence in this example, the
load resistance is set at 0.5 ohms, indicating a 10A load. You should set the load
resistance value corresponding to the actual load in your application. The
resistors R
and the inductances L
, through Ra3,andRb1through Rb3are the ESRs of the capacitors
a1
through Lb3are the ESLs.
a1
Enter all circuit para meter s of y our application. When you finish editing the
parameter values, click on the button.
Click to Calculate Stability
Page 10
0
SAT draws the Bode plot of the voltage loop gain on the right half of the page as
R
C
µ
H
d
G
shown in Figure 5. The phase margin, which is a measure of stability, and the gain
crossover frequency, which is a measure of fast transient response, are also
calculated and presented below the Bode plot.
You can enter your notes under the "Notepad Area for JFW050A Module" section
in the left lower corner of the page. You can also edit the circuit parameters and
simulate various what-if scenarios and record the results on the same page. Figure 6
below compares two scenarios where the value of C
is changed from 1000 µFto
b2
6800 µF.
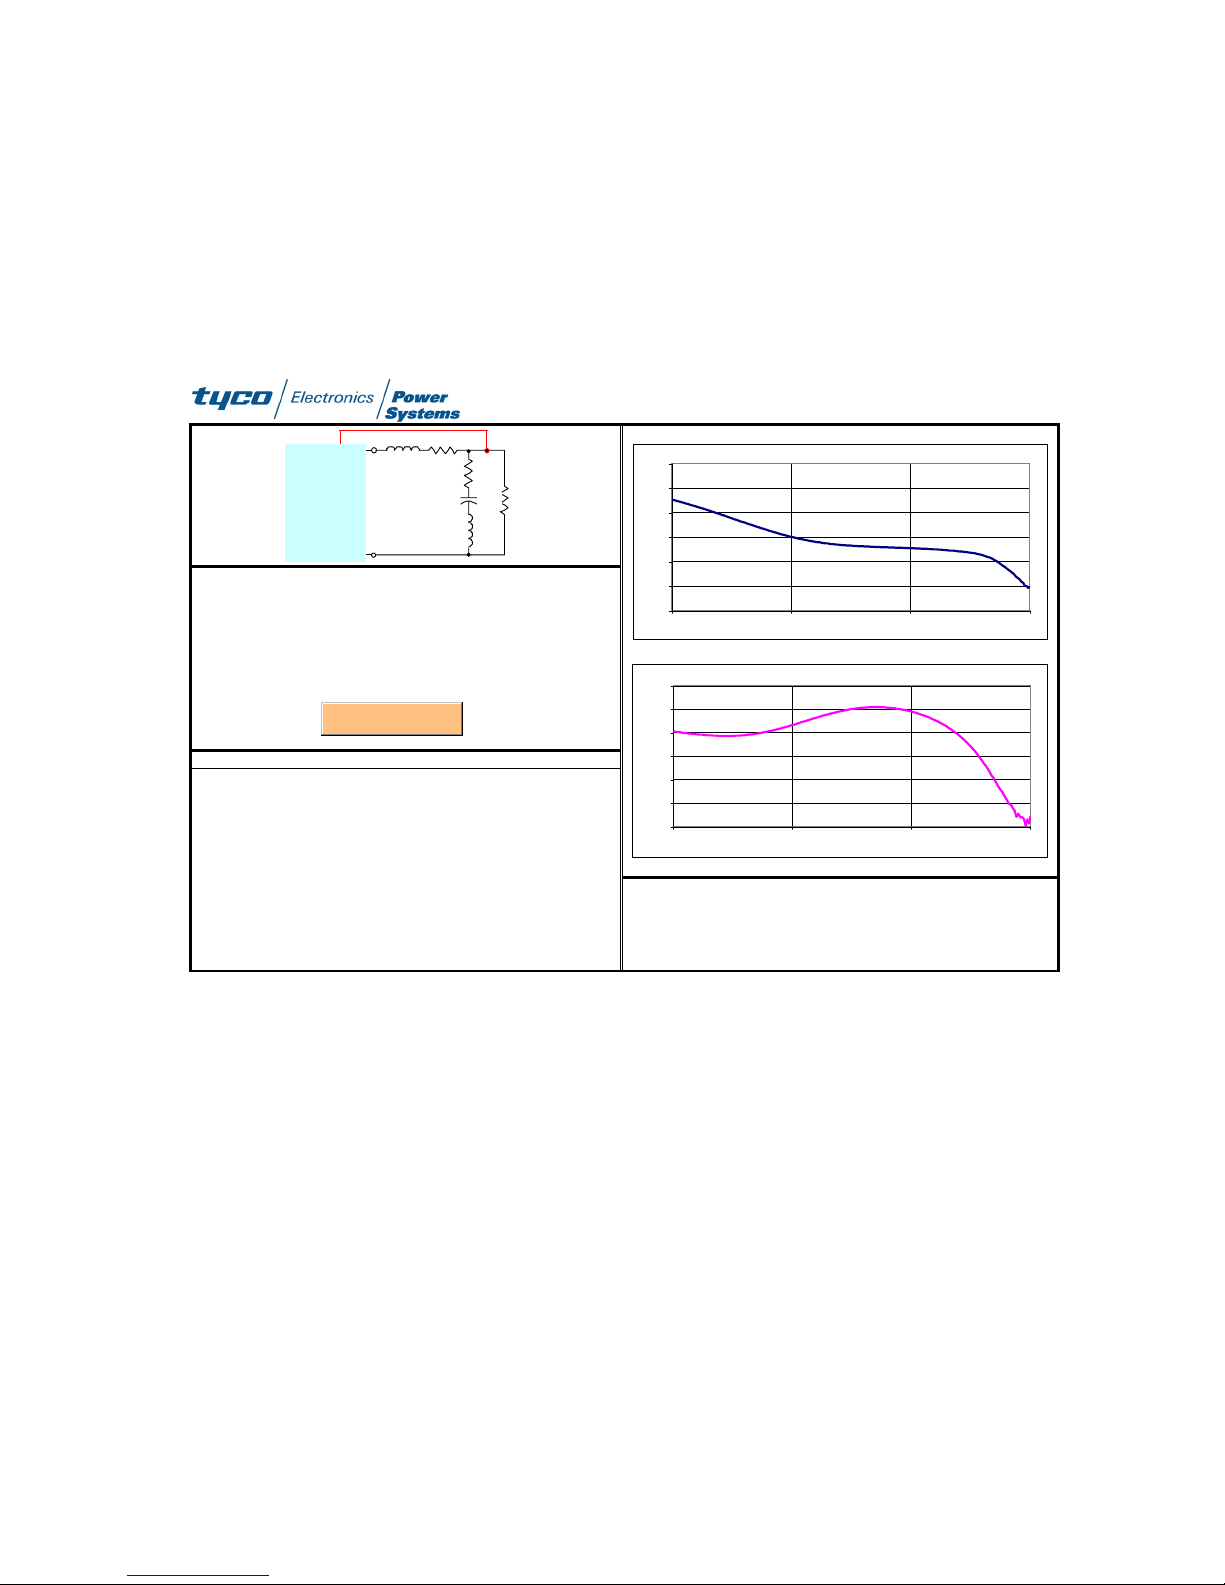
To investigate a different configuration, click on the
Configuration Menu
the bottom of the Excel worksheet which will take you back to the configuration-
selection page. If you click on the circuit diagram for Configuration 2, the page for
that configuration will appear in the window and the Configuration 4 page will
disappear (Figure 7). You can now repeat the analysis in a manner similar to the
previous case. There is no need to re-load the module data file for JFW050A to
perform an analysisfor another configurati on.
Stability Analysis Tool
DC/DC
CONVERTER
=
R
s1
Ls1=
Ra1=
La1=
Ca1=
LS1R
SENSE
S1
R
R
a1
a2
C
C
a1
a2
L
L
a2
a1
Please enter the circ uit parametersbelow
R
=
0.5 ohm
1
4
100
1
10
Ra2=
La2=
Ca2=
load
Ra3=
100
1
10
Click to Calculate Stability
La3=
Ca3=
10
1
1000
Notepad Area for JFW050A Module
LS2R
R
C
L
5 mohm
100 nH
=
10
10
=
1000
C
R
a3
a3
L
a3
Rs2=
Ls2=
b1
Lb1=
b1
S2
b1
b1
b1
Rb2=
Lb2=
Cb2=
R
b2
R
C
L
b2
L
b2
10 mohm
10 nH
F
1000
60
40
20
0
Gain (dB)
-20
-40
10 100 1000 10000 100000
180
120
60
0
Phase (deg)
-60
-120
-180
10 100 1000 10000 100000
Magnitude of the Loop Gain
Frequency (Hz)
Phase of the Loop Gain
Frequency (Hz)
tab at
Fig. 4. Page for entering and editing circuit parameters, shown for the case of
configuration 4.
ain crossover frequency:
Phase Margin:
z
egrees
1
Page 11

o
L
L
µ
6
5
Stability Analysis Tool
o
L
R
L
L
C
µ
N
G
DC/DC
CONVERTER
R
=
s1
Ls1=
Ra1=
La1=
Ca1=
LS1R
SENSE
S1
R
R
a1
a2
C
C
a1
a2
L
L
a2
a1
Please enter the circuit parametersbelow
R
=
0.5
1
4
100
1
10
Ra2=
La2=
Ca2=
load
Ra3=
100
1
10
Click to Ca lcula te S tability
La3=
Ca3=
10
1
1000
Notepad Areafor JFW050A Module
LS2R
R
a3
C
a3
L
a3
C
hm
Rs2=
5 mohm
=
100 nH
s2
Rb1=
10
Lb1=
10
Cb1=
1000
S2
R
b1
b1
L
b1
Rb2=
Cb2=
b2
R
b2
C
b2
L
b2
10 mohm
=
10 nH
1000
40
R
L
F
20
0
-20
Gain (dB)
-40
-60
100 1000 10000 100000
180
120
60
0
Phase (deg)
-60
-120
-180
100 1000 10000 100000
Gain crossover frequency:
Magnitude of the Loop Gain
Frequency (Hz)
Phase of the Loop Gain
Frequency (Hz)
Phase Margin:
96.6
Hz
2.06 degrees
Fig. 5. Voltage-loop-res pons eBodeplotw ithphasemarg inand gaincr ossov er
frequency calculat edan d displ ayed.
SENSE
DC/ DC
CONVERTER
LS1R
S1
R
R
a1
a2
C
C
a1
a2
L
L
a2
a1
LS2R
R
a3
C
a3
L
a3
Please enter the circuitparameters below
R
=0.5
= 1 Rs2= 5
R
s1
=
4
s1
Ra1= 100 Ra2= 100 Ra3= 10 Rb1= 10
= 1 La2= 1 La3= 1 Lb1= 10
a1
Ca1= 10 Ca2= 10 Ca3= 1000 Cb1= 1000
load
Click to Calculate Stability
hm
Ls2=
100
otepad Areafor JFW050A Module
Stability Analysis Tool
S2
R
R
b1
b2
C
b1
L
b1
R
C
L
b2
L
b2
mohm
nH
= 10
= 10
= 6800
mohm
nH
F
b2
b2
b2
40
20
0
-20
Gain (dB)
-40
-60
100 1000 10000 100000
180
120
60
0
Phase (deg)
-60
-120
-180
100 1000 10000 100000
ain crossover frequency:
Magnitude of the Loop Gain
Frequency (Hz)
Phase of the Loop Ga in
Frequency (Hz)
Phase Margin:
399.5
42.8
Hz
degrees
Fig. 6. Voltage loop respons eBodeplot when Cb2=6800 µF
11
Page 12
2
To analyze a different module, you should select the
o
µ
F
Module Selection
the bottom of the Excel Worksheet to go back to the first page and load the data
file for the new module. Note that the new data file will overwrite the old one
belonging to the JFW050A. If you want to keep your analysis results for the
JFW050A module, you should save SAT_v1.3.xls under a different name, e.g.
JFW050A.xls.
Stability Analysis Tool
LS1R
0.054
1
28
S1
C
hm
mohm
nH
mohm
nH
R
a1
R
a1
L
L
a1
40
20
0
-20
Gain (dB)
-40
-60
-80
100 1000 10000 100000
180
120
60
0
Phase (deg)
-60
-120
-180
100 1000 10000 100000
Magnitude of the Loop Gain
Frequency (Hz)
Phase of the Loop Gain
Frequency (Hz)
SENSE
DC/DC
CONVERTER
Please enter the circuit parameters below
R
=
load
R
=
s1
Ls1=
Ra1= 9
La1= 0
Ca1= 10000
Click to Ca lcula te Stability
Notepad Area for JFW050A Module
tab at
229.1
52.93
Hz
degrees
Gain crossover frequency:
Phase Margin:
Fig. 7. Stability analysis of the JFW050A for Configuration 2.
Paralleled Modules
Paralleled modules can also be analyzed using SAT. Typically, in systems
with paralleled modules, active current sharing is used to distribute the stresses
evenly between modules. As described in [1], such a system can be analyzed
separately for common-mode stability (which is solely dependent on the number of
modules, the characteristics of the modules and the load), and differential-mode
stability (which only depends on the current-sharing loop and is independent of the
number of modules paralleled or the load). Since differential-mode stability is
independent of the load, the manufacturer of the module is able to ensure that the
current-sharing loop is stable. However, common-mode stability depends both on
the number of modulesparall el edand theloa d,bot h of whichar e contr ol led by the
1
Page 13

3
customer application.
SAT can be used to assess the common-mode stability characteristics of a
paralleled converter system by analyzing an equivalent single-module system. The
single-module equivalent is obtained by scaling the load by the number of
paralleled modules. For example, in a tw o module parallel system, the load is
scaled by a factor of two by doubling the load resistance, ESR’s and ESLs, and
reducing the capacitances by half. The results from SAT are then valid for the
paralleled convert ersy ste m as well
This method assumes that the l ay out is symmetrical in the sense that all
parasitic impedances between the modules and the load are substantially equal
and the sense locations of all modules are the same. If there is any discrepancy,
then the single equivalent module approach will yield a different answer than the
actual paralleled system.
References
[1] V. Joseph Thottuvelil, George C. Verghese, “Analysis and Control Design of Paralleled DC/DC
Converters with Current Sharing”, IEEE Trans. On Power Electronics, July 1998, pp.635-644.
[2] Cahit Gezgin, Wayne C. Bowman, V. Joseph Thottuvelil, “A Stability Analysis Tool for DC-DC
Converters”, IEEE Applied PowerElectronics Conference 2002, vol.1, pp. 367-373.
1
Page 14

4
3
Limitations of SAT
Although SAT is a powerful tool, please keep in mind the following :
1. The loop gain Bode plot and phase margin predicted by SAT are valid when the
module is operating in continuous c onducti on mode (CCM). Therefore, make
sure that R
CCM operation. Modules with synchronous rectifier based output stages operate
in CCM throughout theentirel oadcur ren t range.
2. It is assumed that the module input voltage is at the nominal value, e.g. 48V for
xWxxx, 24V for xCxx modules, etc. The loop response and phase margin will be
different if the input voltage is not at the nominal value. However, for stability
assessment purposes, since there are usually requirements for margins of >45°
and 12dB, performing a stability analysis at nominal voltage of 48V is typically
sufficient.
is sufficiently low enough to guarantee a load current that leads to
L
3. For buck derived converter topologies, the sensitiv ity of voltage loop response on
load variations is small. Therefore, SAT captures the loop response over load
variations, from CCM limit to full load, with reasonable accuracy. Future releases
of SAT will address the effect of input voltage variations on the stability margins.
1
Page 15

5
4
Troubleshooting
If you encounter the follow ingmessagewhen running SAT,
there are two possibilities for the error message.
1. Some of the parameters you enter edfor yournetwork are nonnumeric.
2. You have not enabled the Analysis Toolpack and Analysis Toolpack – VBA in
your Excel environme ntasdesri bedi npage5 of thisdocu mentunder
“Installation and Usage” .If youcann ot seeAnal y sisToolpacka ndAnaly si s
Toolpack – VBA under theTools/ Ad dInstabinEx cel , then youhav e to
reinstall Excel with thoseoptio nscheck edduri n g installati on .
Make sure that you have the correct Excel setti ngsandnu mericdat afor thenetwor k
parameters.
1
 Loading...