

Page 1
LD6000
EN
OPERATING MANUAL
COMBINATION DETECTOR
TRT-BALD6000-WM-04-EN
Page 2

Table of Contents
1. Safety Instructions 3
2. Intended Use 3
3. Scope of Delivery 3
4. Control Elements and Connecting Ports 4
5. Powering Up and Operating the Device 4
5.1. Microphone Jack and Sensor Port . . . . . . . . . . . . . . . . . . . . . . . . .4
5.1.1. Connecting the Microphones for Acoustic Leak Detection .4
.1.2. Connecting the Hydrogen Sensor for Trace Gas Detection .5
5
5.2. Powering On and Off . . . . . . . . . . . . . . . . . . . . . . . . . . . . . . . . . . .5
6. Navigation and Menu Structure 5
6.1. Navigation . . . . . . . . . . . . . . . . . . . . . . . . . . . . . . . . . . . . . . . . . .5
6.2. Main Menu . . . . . . . . . . . . . . . . . . . . . . . . . . . . . . . . . . . . . . . . . .5
6.3 Help . . . . . . . . . . . . . . . . . . . . . . . . . . . . . . . . . . . . . . . . . . . . . . .5
6.4. Settings . . . . . . . . . . . . . . . . . . . . . . . . . . . . . . . . . . . . . . . . . . . .5
6.4.1. Time and Date . . . . . . . . . . . . . . . . . . . . . . . . . . . . . . . . . . .6
6.4.2. Languages . . . . . . . . . . . . . . . . . . . . . . . . . . . . . . . . . . . . .6
6.4.3. Power Off Time . . . . . . . . . . . . . . . . . . . . . . . . . . . . . . . . . .6
6.4.4. Backlight . . . . . . . . . . . . . . . . . . . . . . . . . . . . . . . . . . . . . .6
6.4.5. Frequency Range . . . . . . . . . . . . . . . . . . . . . . . . . . . . . . . .6
6.4.6. Hearing Protection . . . . . . . . . . . . . . . . . . . . . . . . . . . . . . .6
6.4.7. Touch Screen . . . . . . . . . . . . . . . . . . . . . . . . . . . . . . . . . . .6
6.4.8. Clear Memory . . . . . . . . . . . . . . . . . . . . . . . . . . . . . . . . . . .6
7. Acoustic leak and pipe detection 6
7.1. Parameter Settings in the Acoustic Modes . . . . . . . . . . . . . . . . . . .7
7.1.1. Manual sensor sensitivity adjustment . . . . . . . . . . . . . . . .7
7.1.2. Automatic sensor sensitivity adjustment . . . . . . . . . . . . .7
7.1.3. Selecting the Filter Presetting . . . . . . . . . . . . . . . . . . . . .7
7.1.4. Volume Setting . . . . . . . . . . . . . . . . . . . . . . . . . . . . . . . . .7
7.2. Smart Mode . . . . . . . . . . . . . . . . . . . . . . . . . . . . . . . . . . . . . . . . .8
7.2.1. Mode Description . . . . . . . . . . . . . . . . . . . . . . . . . . . . . . .8
7.2.2. Mode Selection . . . . . . . . . . . . . . . . . . . . . . . . . . . . . . . .8
7.2.3. Measuring Procedure . . . . . . . . . . . . . . . . . . . . . . . . . . . .8
7.3. F&V Mode (Frequency and Volume) . . . . . . . . . . . . . . . . . . . . . . . .9
7.3.1. Mode Description . . . . . . . . . . . . . . . . . . . . . . . . . . . . . . .9
7.3.2. Mode Selection . . . . . . . . . . . . . . . . . . . . . . . . . . . . . . . .9
7.3.3. Measuring Procedure . . . . . . . . . . . . . . . . . . . . . . . . . . . .9
7.4. V Mode (Level Mode) . . . . . . . . . . . . . . . . . . . . . . . . . . . . . . . . . .9
7.4.1. Mode Description . . . . . . . . . . . . . . . . . . . . . . . . . . . . . . .9
7.4.2. Mode Selection . . . . . . . . . . . . . . . . . . . . . . . . . . . . . . . .9
7.4.3. Measuring Procedure . . . . . . . . . . . . . . . . . . . . . . . . . . . .9
7.5. PULSE mode
(acoustic pipe detection using a pulse wave generator) . . . . . . . .10
7.5.1. Mode description . . . . . . . . . . . . . . . . . . . . . . . . . . . . . .10
7.5.2. Mode selection . . . . . . . . . . . . . . . . . . . . . . . . . . . . . . . .10
7.5.3. Measuring operation . . . . . . . . . . . . . . . . . . . . . . . . . . .10
7.5.4. Filter settings in PULSE mode . . . . . . . . . . . . . . . . . . . . .10
7.6. Clear Current Measurement Series . . . . . . . . . . . . . . . . . . . . . . .10
7.7. Adjusting the filter and switching on the acoustic function . . . . .11
7.7.1. Manual filter frequency adjustment . . . . . . . . . . . . . . . .11
7.7.2. Automatic filter frequency adjustment . . . . . . . . . . . . . .11
.7.3. Switching on the acoustic function
7
during filter adjustment . . . . . . . . . . . . . . . . . . . . . . . . .11
8. Acoustic Long-Term Measuring 11
8.1. Parameter Settings for Acoustic Long-Term Measuring . . . . . . . .12
8.2. Measuring Procedure . . . . . . . . . . . . . . . . . . . . . . . . . . . . . . . . .12
9. Trace Gas Detection 12
9.1. Putting the Device into Operation . . . . . . . . . . . . . . . . . . . . . . . .12
9.2. Display . . . . . . . . . . . . . . . . . . . . . . . . . . . . . . . . . . . . . . . . . . . .13
9.3. Normal Measuring with Acoustic Feedback . . . . . . . . . . . . . . . . .13
9.4. Defining Alarm Thresholds . . . . . . . . . . . . . . . . . . . . . . . . . . . . .14
9.5. Measuring with Zero Calibration . . . . . . . . . . . . . . . . . . . . . . . . .14
9.6. Clearing the Measurement Series / Clearing Zero Calibration . . .14
10. Saving and Loading Measuring Data 15
11. Transferring Measuring Data To A PC 15
12. Troubleshooting 16
Trace Gas Detection – List of possible errors or faults . . . . . . . . . . . . . .16
Acoustic leak detection – List of possible errors or faults . . . . . . . . . . .16
13. Changing the Battery, Cleaning and Maintenance 17
Changing the Battery . . . . . . . . . . . . . . . . . . . . . . . . . . . . . . . . . . . . . .17
Cleaning and Maintenance . . . . . . . . . . . . . . . . . . . . . . . . . . . . . . . . . .17
LD6000 Measuring Device . . . . . . . . . . . . . . . . . . . . . . . . . . . . .17
LD6000 H2 hydrogen sensor . . . . . . . . . . . . . . . . . . . . . . . . . . . .17
14. Technical Data 17
15. Information for Use in the Field 18
15.1. Acoustic Leak Detection . . . . . . . . . . . . . . . . . . . . . . . . . . . . . . .18
15.1.1. How Sound Is Created . . . . . . . . . . . . . . . . . . . . . . . . . .18
15.1.1.1. Ground-Borne Sound . . . . . . . . . . . . . . . . . . . .18
15.1.1.2. Structure-Borne Sound . . . . . . . . . . . . . . . . . . .18
15.1.1.3 Current Induced Sound . . . . . . . . . . . . . . . . . . .18
15.1.1.4 Interference Factors . . . . . . . . . . . . . . . . . . . . .19
15.1.2. Schematic Leak Detection . . . . . . . . . . . . . . . . . . . . . . .19
15.1.2.1 Narrowing Down the Leak Using
a Stick Microphone . . . . . . . . . . . . . . . . . . . . . .19
15.1.2.2 Pinpointing the Leak Using a Ground Microphone
. .
19
15.1.2.3 Pipe Detection with Pulse Wave Generator . . . .19
15.2. Leak Detection with Trace Gas . . . . . . . . . . . . . . . . . . . . . . . . . .19
15.2.1 Functioning Principle . . . . . . . . . . . . . . . . . . . . . . . . . . .19
15.2.2 How to Carry Out Leak Detection with a Forming Gas . . .19
15.2.3 Determining Correct Quantities Using
Experience Gained in the Field . . . . . . . . . . . . . . . . . . . .19
This publication replaces all previous publications. No part of this publication may be reproduced, processed using
electronic systems, replicated or distributed in any way without prior written authorisation by us. Subject to technical
modifications. All rights reserved. Names of goods are used without guarantee of free usage and used for the most
part according to the manufacturers‘ syntax. The names of goods used are registered and should be considered as such.
We reserve the right to modify the design in the interest of ongoing product improvement, such as shape and colour
modifications. The scope of delivery may vary from that in the product description. All due care has been taken in
compiling this document. We accept no liability for errors or omissions. © TROTEC
®
2
LD6000 Operating Manual
EN
Page 3

LD6000
This measuring device was designed and manufactured in line with the latest technological advancements and complies
with the requirements as laid down in existing European and national guidelines. Conformity has been certified.
The relevant declarations and documents are in the manufacturer’s possession.
As the user you must read and adhere to the following safety instructions in order to ensure that this
condition is maintained and that no danger results from the use of this device:
1. Safety Instructions
We do not accept any liability for any damages which might occur as a result
of improper use or the non-observance of these instructions. The guarantee
expires with immediate effect in such cases!
These instructions must be read in full before the device
is put into operation for the first time!
For reasons of safety and CE compliance you may on no account carry out any
changes or modifications on either the device itself or any other components
which may be used in connection with this measuring device!
The following instructions must be adhered to before the device is taken into use:
• Do NOT carry out measurements on live components.
• Please observe the measuring range of the measuring sensor.
• Please observe the operating and storage conditions.
• Do NOT immerse the sensor head of the hydrogen sensor in standing water
or any other liquids and do not dip into sludge or any sludge-like substances.
• Do NOT bring the sensor head of the hydrogen sensor into contact
with fine powder or powdery substances.
• The user is solely responsible for determining whether he or she considers
the measuring results to be valid and for any conclusions that are reached or
any measures that are taken as a result thereof. We can neither guarantee
the validity of any measuring results nor can we accept liability for any such
results. We are on no account able to accept liability for any damage which
may be caused as a consequence of the use of these measuring results.
2. Intended Use
The LD6000 is a combo detector designed to allow the user to carry out electroacoustic leak detection in pipe systems and to perform non-destructive pinpoint leak detection in systems which have been previously flooded with trace
gas using the indicative measurement of different hydrogen concentrations.
The device may be used for this purpose only and only within the
technical data parameters as specified.
Any other use is considered to be not intended for this purpose.
In accordance with the EU (European Union) Directives on Waste
Electrical and Electronic Equipment (WEEE), electronic equipment
must not be treated as domestic waste, but must be disposed of
professionally in accordance with Directive 2002/96EU of the
EUROPEAN COUNCIL AND PARLIAMENT of 27 January 2003
regarding old electrical and electronic equipment.
Please dispose of this appliance in a manner appropriate to the
relevant legal requirements at the end of its product life.
3. Scope of Delivery
The following components are included in the
standard scope of delivery:
• LD6000 measuring device
• LD K – sound blocking headphones
• LD6000 BM – universal microphone with magnet adapter
• LD6000 DA – tripod adapter
• LD6000 VL – stick extension with tip
• LD6000 TG – shoulder strap
• PC connecting cable, USB
• LD6000 transport case
The following components are available
as optional accessories:
• LD6000 BMW – wind protected ground microphone
(with dead-man’s button)
• LD6000 VK – connecting cable
• LD6000 BMW DA – tripod adapter for LD6000 BMW ground microphone
• LD6000 H2 – hydrogen hand sensor
• LD6000 H2 – hydrogen ground sensor with integrated pump
• LD6000 transport case V
EN
LD6000 Operating Manual
3
Page 4
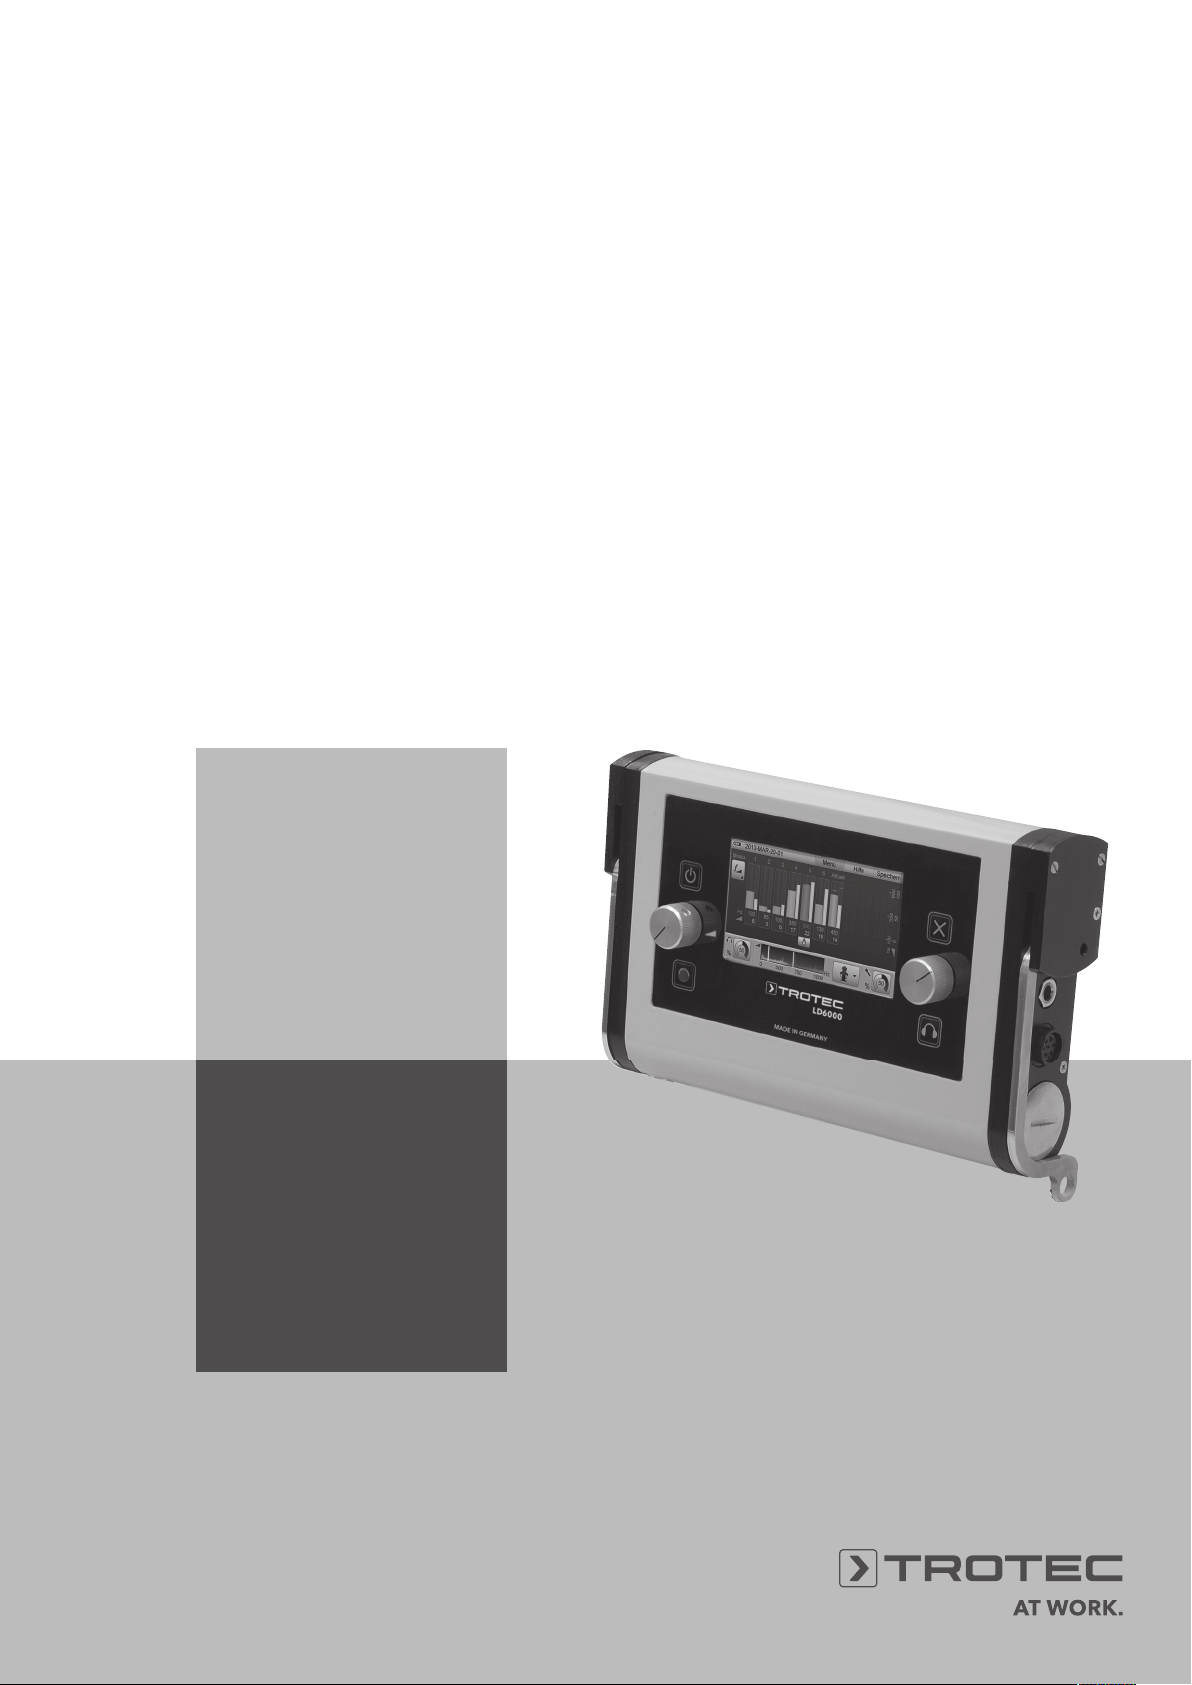
4. Control Elements and Connecting Ports
6
000
A
A
B
B
On/Off key
Left-hand volume dial
This dial has two functions: you can either press A or turn B
the dual function dial. Turn the dial to adjust the volume of your
headphones while measuring is being carried out. Press the dial
to clear the current measurement series.
Record button
Touch display
You can also use the high resolution colour touch screen to carry out
adjustments to the measuring device in place of the dial.
Cancel key
5. Powering Up and Operating
the Device
5.1. Microphone Jack and Sensor Port
First place the batteries into the battery compartment of the LD6000 and connect
all the components which you require to perform your specific measuring operation.
Headphones:
Connect the headphones to the headphone jack of the LD6000 if necessary
(see chapter 4, legend item
The headphones have been designed specifically for use with the LD6000
and for carrying out acoustic leak detection. The state-of-the-art electronics
incorporated in the high-quality hearing protector capsule ensure optimal results
while providing excellent soundproofing qualities.
). Use the supplied LD K headphones only.
Right-hand navigation dial
This dial has two functions: you can either press A
or turn
Turn the dial to access menu and setting functions and to specify selected settings.
Press the dial to confirm selections and settings. The navigation dial on the right
can also be used to execute a variety of settings which will be dealt with more
closely in the following chapters.
B the dual function dial.
Headphone key
Headphone jack
Connection for PC cable
Screw-on battery compartment lid
LD6000 H2 hydrogen sensor connecting port
Microphone jack
5.1.1. Connecting the Microphones for
Acoustic Leak Detection
Please be sure to use one of the following microphones only when carrying
out acoustic leak detection with the LD6000.
LD6000 BM universal microphone
The LD6000 BM is a universal microphone which can be either be used as a
probe microphone or a contact microphone. Connect the LD6000 VL extension
kit to the universal microphone and use as a probe microphone to pinpoint leaks
or screw on the optionally available magnet and use as a contact microphone
when carrying out leak detection where ferromagnetic pipes, for example, are
involved. The contact microphone can then be used in connection with the LD6000
DA tripod adapter as a ground microphone to locate any potential leaks.
Using the LD6000 BMW Ground Microphone
The LD6000 BMW is a wind-protected ground microphone which can be used when
carrying out leak detection on solid, stable surfaces. The LD6000 BMW can be
combined with the LD6000 DM tripod magnet for use on loose or unstable surfaces.
4
LD6000 Operating Manual
EN
Page 5

Depending on the type of acoustic measurement, the microphones
24-01-11 17:00
Help
H
2
24-01-11 17:00
HelpMenu
Date / Time
24-01-11
17:00
Level
3
Language Power off time Backlight
Freq. range Ear protection Touch screen
Clear Memory
can be connected to the LD6000 as follows:
The LD6000 BM as a Ground Microphone:
Connect the LD6000 DA tripod adapter to the base of the LD6000 BM
and connect the microphone to the microphone jack (see chapter 4,
legend item
he LD6000 BM as a Contact Microphone:
T
Connect the magnet base to the base of the LD6000 BM and connect
the microphone to the microphone jack (see chapter 4, legend item
of the LD6000.
The LD6000 BM as a Probe Microphone:
Connect the tip of the LD6000 VL to the base of the LD6000 BM either with or
ithout the extension piece and connect the microphone to the microphone jack
w
(see chapter 4, legend item
LD6000 BMW Ground Microphone:
onnect the LD6000 DM tripod magnet to the base of the LD6000 BMW if
C
necessary. Connect the LD6000 VK connecting cable to the microphone and
plug the microphone into the microphone jack (see chapter 4, legend item
of the LD6000.
) of the LD6000.
) of the LD6000.
)
5.1.2. Connecting the Hydrogen Sensor for
Trace Gas Detection
The LD6000 H2 hydrogen sensor can be connected to the LD6000 to carry out
non-destructive leak detection in systems that have previously been flooded
with trace gas. Connect the sensor to the hydrogen sensor port (see chapter 4,
legend item
You will find instructions on how to carry out measuring in chapter 9 and
further practical information guidelines regarding the use of trace gas
in leak detection in chapter 15.2.
) of the LD6000.
5.2. Powering On and Off
Press the On/Off key to power on (see chapter 4, legend item ). The start
screen appears and changes to the main menu as soon as the measuring device
is ready for use.
Press the On/Off key and hold for approx. 3 seconds to power off
(see chapter 4, legend item
).
.2. Main Menu
6
You are in the main menu when you power on the LD6000 for the first time.
You can navigate to the following sectors from there:
• Help menu
• Setting menu
• Measuring operation with acoustic leak and pipe detection
)
• Measuring operation acoustic long term measurements
• Measuring operation trace gas detection
• PC data transfer
Press menu in the upper screen bar or the cancel key to return to
the main menu from the selected sector.
(chapter 6.3)
(chapter 6.4)
(chapter 11)
(chapter 9)
(chapter 8)
6.3 Help
The LD6000 is equipped with an integrated help function which can be accessed
from either side. Navigate to the menu item Help in the upper menu bar as
described in chapter 6.1. to get to the Help main page. Scroll to the Help topic
which you would like to find out more about and confirm your selection by
pressing the dial on the right to get to the help text you need.
Press the door symbol within the help sector to navigate back out of the
help sector step by step. Return to the Help main page from a Help text
by pressing the door symbol. Press the door symbol to return to the
main menu from the Help main page.
Press the cancel key to leave the help sector immediately.
You will then return to the main menu.
(chapter 7)
6. Navigation and Menu Structure
6.1. Navigation
The LD6000 has a number of menu and selection boxes which you can select
by either using the touch screen or the navigation dial on the right. When using
the touch screen, simply briefly place your finger on the menu or selection box
you wish to select.
You can also turn the dial either clockwise or anticlockwise
continuously to go through all the menu or selection boxes
in order to get to the box you wish to select.
Active menu items or selection boxes are highlighted in yellow.
which was confirmed.
Press the cancel key to leave the menu or selection box
which is just being shown and return to the last command line
EN
Press the dial when you are finished to confirm your
selection. The menu or selection box which you have
selected will now be shown.
6.4. Settings
Navigate to the settings you wish to select and carry out your selection in order
to perform the following configurations:
LD6000 Operating Manual
You can reach the menu Settings via the Settings symbol
in the main menu.
5
Page 6
.4.1. Time and Date
24-01-11 17:00
SaveHelpMenu
12345678910
100500
3
Mode
Fittings
Ground
User
20 10
%%
05001000
Hz
6
Use the dial on the right to navigate to the selection field of your choice. The
selection field you have chosen will be marked with a red border. Press the
dial on the right to confirm your selection. The field you have selected is now
active and highlighted in yellow.
Press the dial again or press the cancel key to deactivate the field
you have selected.
When the selection field is active, you can enter a value by turning the dial on
the right and pressing the dial to confirm that the value you have entered is
correct. You can now navigate to the next selection field.
To enter the value via the touch screen, first press your finger against the selection field which you wish to activate and then enter the value using the number
pad. Press OK to confirm that the value you have entered is correct and press
DEL to clear the value.
Press the cancel key or the door symbol on the screen to leave the setting menu.
6.4.2. Languages
You can select from one of several display languages. Scroll down to the language
ou wish to select and press the dial on the right to conform your selection.
y
Press the Cancel key or the door symbol on the screen to leave the setting menu.
6.4.3. Power Off Time
You can conserve battery power by selecting a time between 1 and 60 minutes
after which the device then automatically powers off when not in use.
Repeat the procedure as described in Time and Date (see chapter 6.4.1.) to
enter the length of time you have selected.
.4.7. Touch Screen
6
You can use this setting window to deactivate the touch screen function or to
carry out a calibration or performance check.
Use the dial on the right to navigate to the selection field of your choice
and confirm your selection by pressing the dial.
If on/off has been selected, you can activate or deactivate the touch screen
function respectively by pressing the dial.
To leave the setting menu either press the dial or press the Cancel key
r the door symbol on the screen.
o
6.4.8. Clear Memory
You can clear two different memory values in this window setting.
Clear Memory clears all the values that have been saved into the device.
Clear Parameter Memory clears all the user-defined configurations for the high
pass filter, low pass filter and the maximum breadth of the frequency spectrum
in the window setting Frequency Range (see chapter 6.4.5.).
You can also use the touch screen to clear the memory or use the dial on the
right to navigate to the selection field you have chosen before pressing the
dial to confirm your choice. A tick symbol will appear to acknowledge that the
memory has been cleared.
To leave the setting menu either press the dial or press the cancel key or the
door symbol on the screen.
7. Acoustic leak and pipe detection
6.4.4. Backlight
The brightness of the display can be adjusted from 0 to 100 % to suit your
individual requirements. There is also a scale with three individual colour segments which show you just how much battery power the brightness setting
you have selected consumes.
The batteries will last longest when the scale is green and used up
fastest when the scale is red.
Turn the dial on the right to increase or dim the brightness and leave the menu
by either pressing the dial or by pressing the cancel key or the door symbol on
your screen.
6.4.5. Frequency Range
With the LD6000 a frequency range of 0-4,000 Hz can be analyzed. Each of the
measuring modes that can be used during acoustic leak detection has both a
selection of predefined filters as well as a selection of user-defined filters which
can be configured in the setting window Frequency Range.
The settings of the high pass filter (HP), the low pass filter (LP) and the maximum
breadth of the colour spectrum can all be changed.
Repeat the procedure as described in Time and Date (see chapter 6.4.1.) to enter
the configuration you have selected.
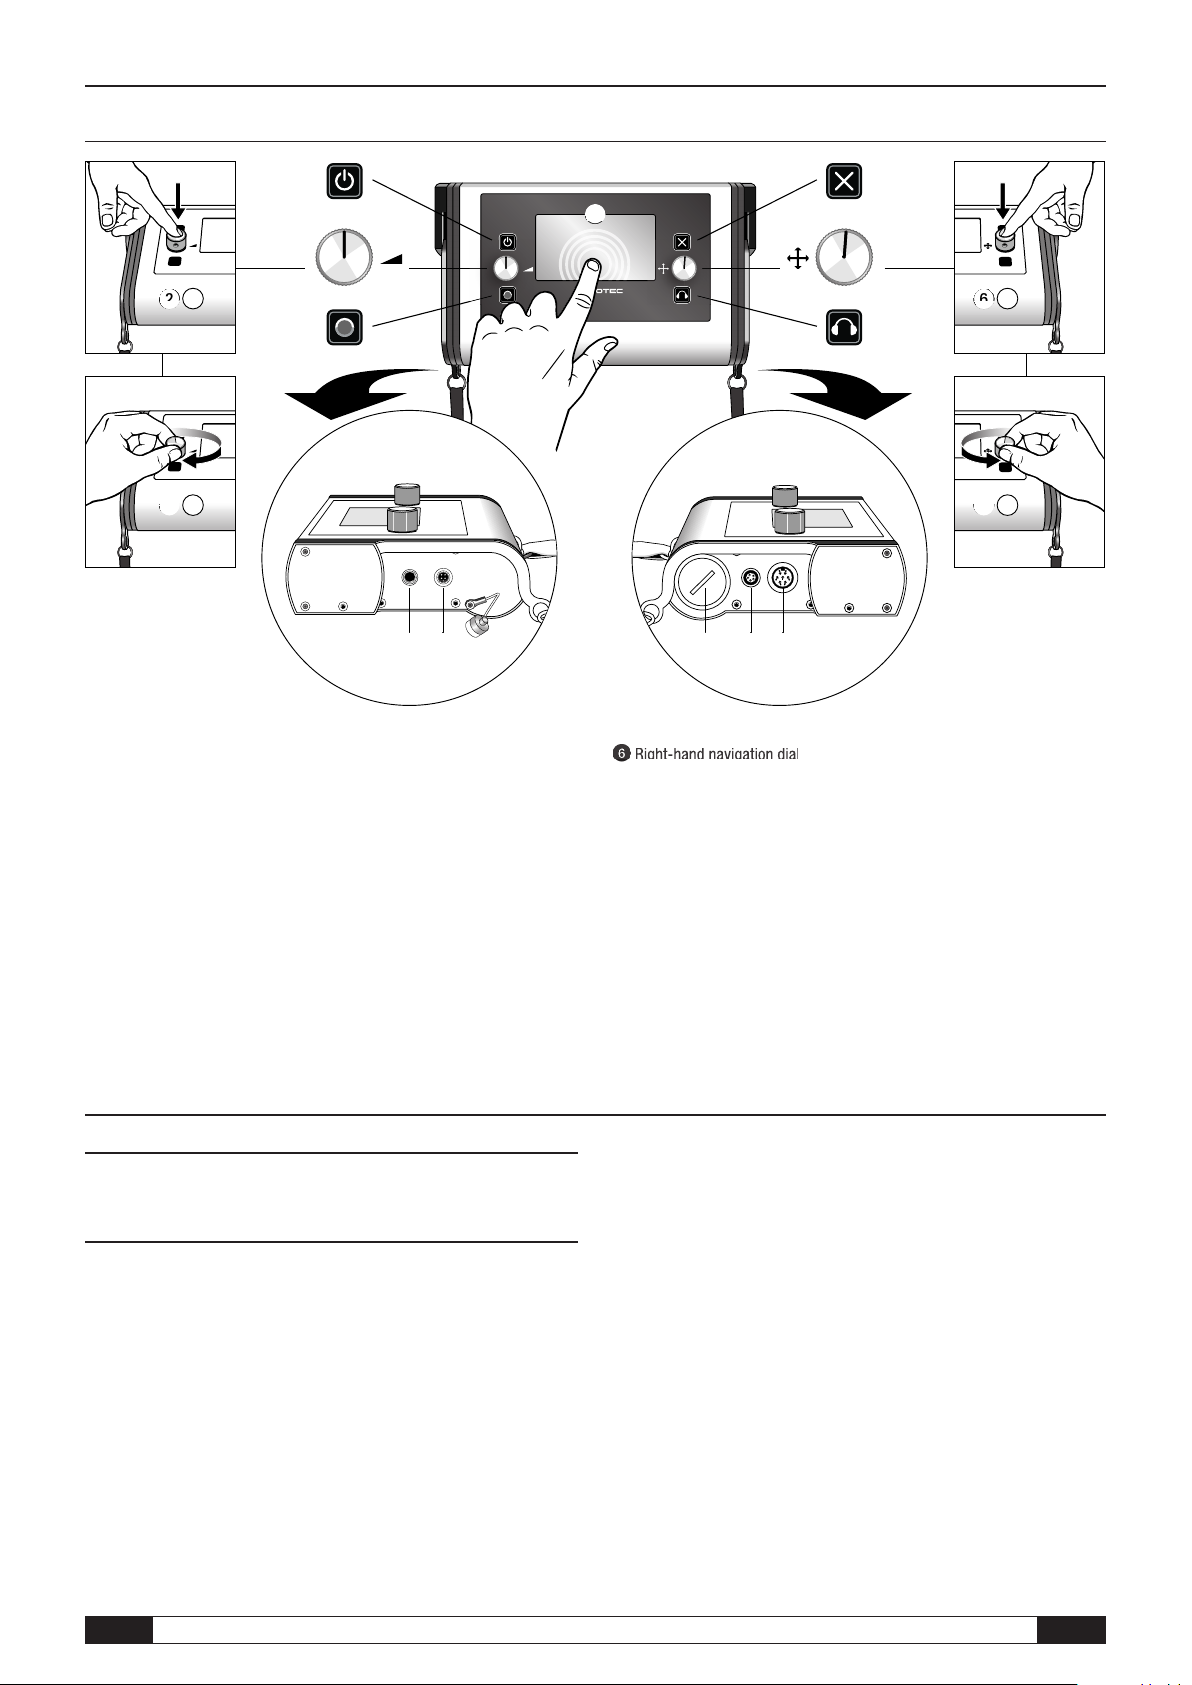
6.4.6. Hearing Protection
The LD6000 is equipped with an automatic sound absorber which ensures that
hearing protection guidelines according to BGV B3 (formerly VBG 121) (BGV Accident Prevention & Insurance Association) are complied with when used with
the headphones included in the scope of delivery.
The noise protection intensity of the headphones can be adapted individually to
suit the user. The intensity ranges from 0 (relatively low) to 3 (maximum). Each
of the three stages complies with the requirements as laid down in VBG 121.
The configuration corresponds to the procedure for setting the time
and date as described in chapter 6.4.1.
In order to be able to carry out acoustic leak detection with
the LD6000, first activate the symbol for your acoustic leak
detection measuring operation in the main menu and confirm
your selection.
How to get to the display.
Your measuring device is preset to Smart mode. In addition to the
☞
volume) and the V mode (level mode) or the pipe detection PULSE mode
(acoustic pipe detection using the pulse wave generator). The individual
measuring modes will be explained in detail in chapters 7.2 to 7.5.
Regardless of the measuring mode you have selected, the following parameters
can be set for all the measuring modes that can be used to carry out leak detection
in the same consistent manner:
Smart mode, you may choose to select the F&L (frequency and
Sensor sensitivity setting
Selection of predefined filter settings
Volume setting
6
LD6000 Operating Manual
EN
Page 7

.1. Parameter Settings in the Acoustic Modes
24-01-11 17:00
SaveHelpMenu
12345678910
100500
11 17:
0
0
Save
Help
Menu
234
5
678910
20 0
%
%0 10 20 30 40 50 60 70 80 90 100
%
06001200
H
z
24-01-11 17:00
SaveHelpMenu
12345678910
100500
2
40111 17
:
0
0
Help
Menu
1
234
5
678
9
20 10
%
%0 10 20 30 40 50 60 70 80 90 100
%
06001200
Hz
24-01-11 17:00
SaveHelpMenu
1
2345678910
100500
3
Mode
Fittings
Ground
User
20 10
%%
05001000
H
z
7
7.1.1. Manual sensor sensitivity adjustment
To set the sensitivity of the sensor which is connected to your leak detection
evice, navigate in the display window to the symbol for the sensor sensitivity
d
setting
The sensor sensitivity settings window opens.
T
on a scale from 0 to 100 %. Turn the dial on the right or touch the touch screen
and pull your finger to the sensitivity value which you would like to select.
The sensitivity value is ideal when the control bar
shown. Press the cancel key to leave the window without changing the sensitivity value.
Press the dial on the right to confirm the new setting or press the cancel key.
You can also confirm the setting change by pressing the symbol for the sensor
sensitivity
Important: The current measurement series will be cleared when any
changes are carried out to the sensitivity settings!
The sensitivity value you have selected will either be displayed as a number
or in the form of a tachometer in the symbol for the sensitivity setting
, activate the symbol and confirm your selection.
he microphone amplification factor that has been currently selected is displayed
on the left is half red, as
on the touch screen.
.
7.1.2. Automatic sensor sensitivity adjustment
In addition to the manual adjustment function, the LD6000 is also equipped with
an automatic adjustment function which enables you to set the sensor sensitivity
independently to the optimum setting.
To use this automatic function, navigate to the symbol for the sensor sensitivity
settings in the display
The sensor sensitivity setting window
Press the record button and keep pressed until
you hear a signal tone.
The acoustic signal tells you that the amplification has been automatically set
to the optimum setting.
To close the settings window, press the right-hand dial or the cancel key.
Alternatively you may close the window by pressing the sensor sensitivity
setting symbol
, activate the symbol and confirm your selection.
on the touchscreen.
opens.
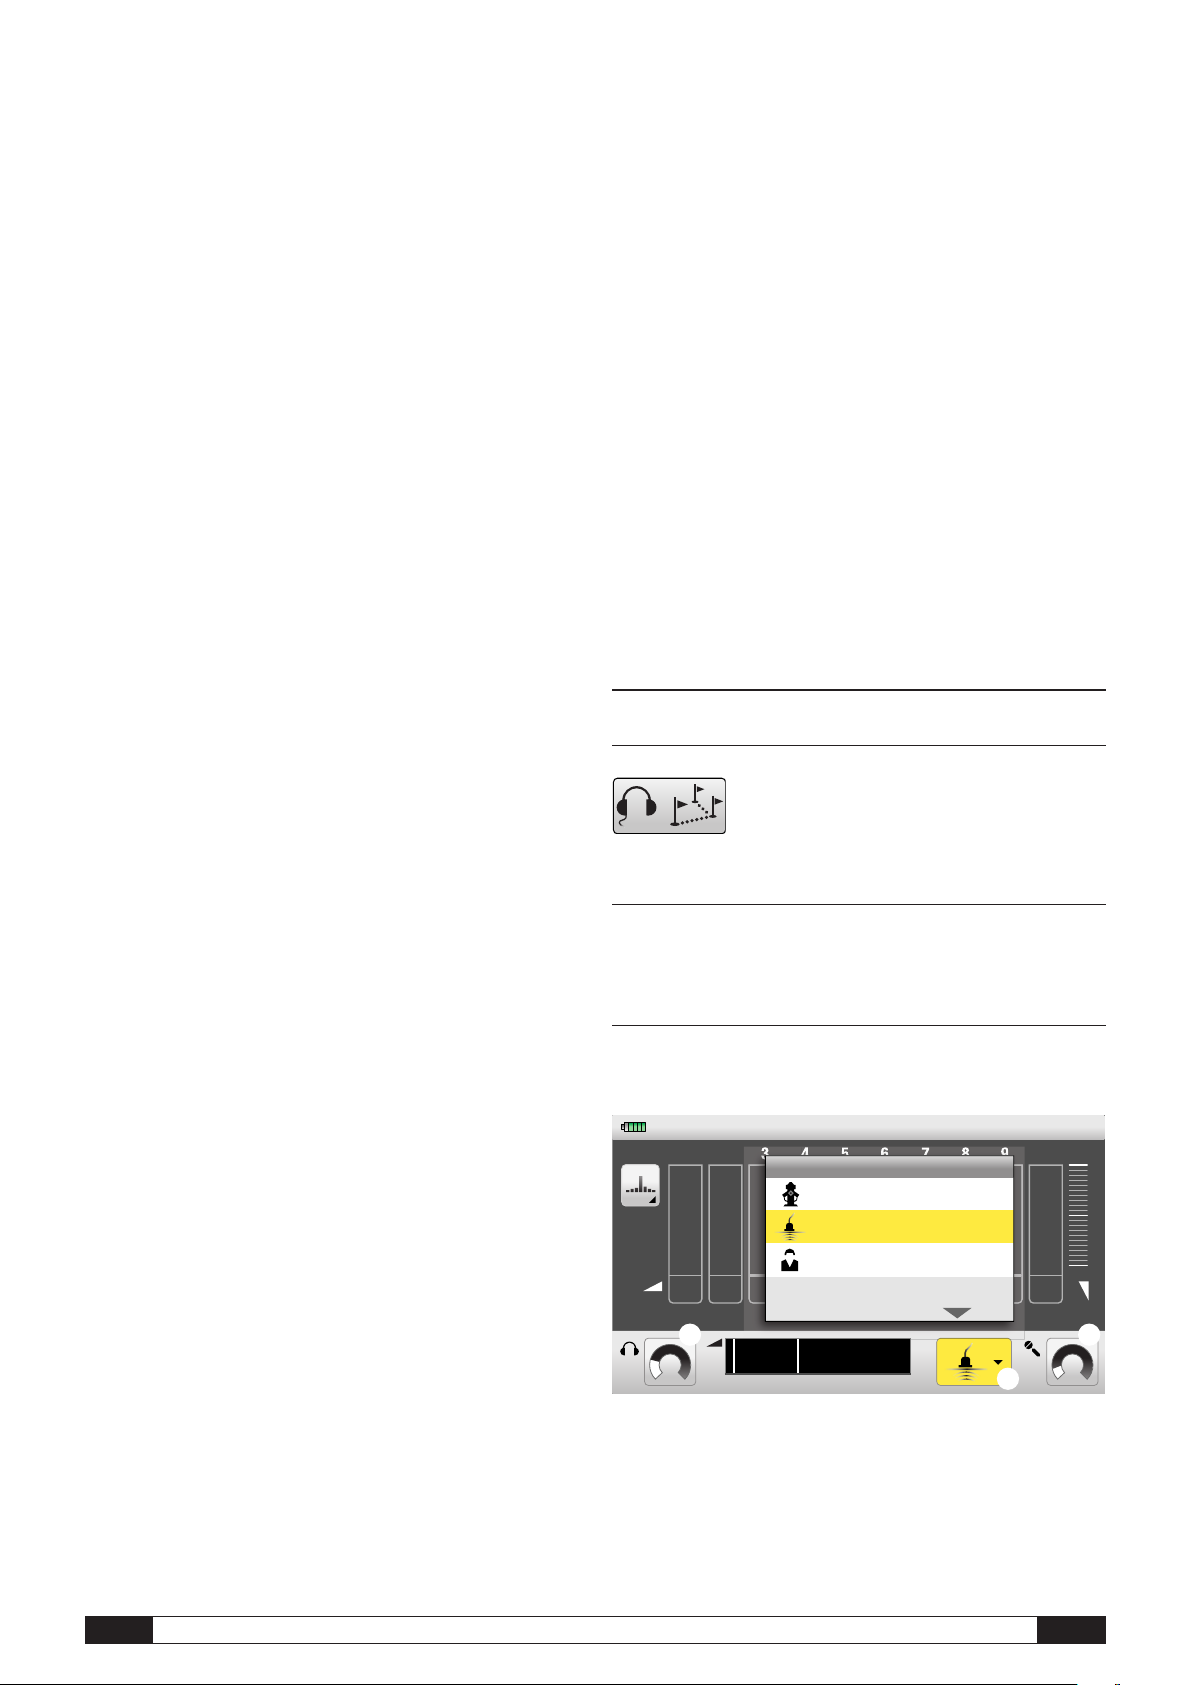
To select one of the predefined filter settings, navigate to the filter mode symbol
on the display, activate the symbol and confirm your selection.
The window for the filter presetting selection opens.
There are three presettings to choose from:
• Fittings
• Ground
• User
To carry out the setting, navigate in the window to the presetting
which you wish to select, activate the setting and confirm your selection by
pressing the dial on the right. The window then closes and the symbol for the
selected filter setting appears as the filter mode symbol
Press the cancel key to leave the window without changing the filter setting.
Important: The current measurement series will be cleared when any
changes are carried out to the filter settings!
In addition to the predefined filters, you can change the predefined filter settings
manually in all the measuring modes at any time between individual measurements while leak detection is being carried out. In order to do so, follow
the instructions as described in chapter 7.7.
There is a predefined frequency range from 0 to 2,000 Hz with a
200 Hz high pass filter and an 800 Hz low pass filter which are
ideal for checking the status of fittings and hydrants.
There is a predefined frequency range from 0 to 1,000 Hz with a
50 Hz high pass filter and a 400 Hz low pass filter which are ideal
for checking the status of pipe runs. This is the factory default setting and
therefore the setting when the device is put into operation for the first time.
This presetting uses the filter range which you, the user, defined according
to your own specific filter preferences (see chapter 6.4.5). When this
product leaves the factory the frequency range is from 0 to 1,200 Hz
with a 100 Hz high pass filter and an 800 Hz low pass filter.
,
or
.
7.1.4. Volume Setting
7.1.3. Selecting the Filter Presetting
You can select one of three filters when carrying out acoustic leak detection.
Each of the filters can be changed individually during measuring.
EN
You can adjust the volume of the headphones to suit your requirements. The
volume does not depend on the predefined hearing protection intensity (see
chapter 6.4.6.) which you may have selected.
LD6000 Operating Manual
7
Page 8

The volume you have selected will either be displayed as a number or in the
24-01-11 17:00 SaveHelpMenu
12345678910
100500
20 10
%%
06001200
Hz
Mode
Smart mode
F & V mode
V mode
PULSE mode
ƒ
24-01-11 17:00
S
aveHelpMenu
12345678910
100500
20919826
1
4
1414
20
9
999
888
999
27 29
%%
0
500 1200
H
z
, activate
.
form of a tachometer in the symbol for the volume of the headphones
Changing the Volume Before or After Measuring:
To change the volume of your headphones before or after measuring, navigate
in the window to the symbol for selecting the headphone volume
the symbol and confirm your selection.
The window for selecting the headphone volume opens.
he volume that has been selected for your headphones is displayed on a scale
T
from 0 to 100 %. Turn the dial on the right or touch the touch screen and pull
your finger to the volume which you would like to select.
Press the Cancel key to leave the window without changing the
volume setting.
Press the dial on the right to confirm the new setting or press the Cancel key.
You can also confirm the setting change by pressing the symbol for the headphone volume
A change in volume has no affect on the measuring curve and the current
measurement series is not cleared.
Changing the Volume During Measuring:
on the touch screen.
You can change the volume at any time during
measuring by either turning the dial clockwise if you
would like to turn up the volume or anti-clockwise
if you wish to turn down the volume.
7.2. Smart Mode
7.2.1. Mode Description
The Smart Mode displays a double bar comprising a noise level indicator
and the smart indicator for enhanced leak detection.
The smart indicator is based on a complex calculation and analysis system which
includes factors like frequency, sound levels and evaluations.
This algorithm has been tried and tested and is especially effective when
background noise levels are high and the sound emitted by the leak is very quiet.
7.2.2. Mode Selection
.2.3. Measuring Procedure
7
Press the record button to start measuring. Keep the button pressed for the
duration of the measuring operation. The device will stop measuring when the
record button is no longer pressed.
The display can show a measurement series which is made up of the last ten
individual measurements.
The first measurement is displayed on Position 1. Each further measurement –
beginning with Position 2 – will be placed on an ascending position. When
Position 10 has been reached, the oldest of the ten measurements, i.e. the
measurement on Position 1 will be cleared so that the last measurement that
was taken last is always on Position 10.
The double bar can be used to visualise the following information
in smart mode:
The right-hand, thin bar
from 0 to 100. The grey bar represents the minimum measured value, i.e. the
quietest sound that is relevant for the detection of the leak. This value is also
displayed as a number below the bar
In addition the sound value that is currently being measured is displayed as
such on the bar
The left-hand, broad bar
on a complex set of calculations and analysis methods (see chapter 7.2.1).
The higher the smart indicator value, the more reliable the information on the
leak. The smart indicator bar also displays the colour of the frequency which
was used for the calculation that is required to provide an indication on the
whereabouts of the leak. According to the rule of thumb, the closer the leak,
the higher the smart indicator bar value and the lighter the colour.
The smart indicator bar value is also displayed as a number next to
the actual bar
The symbol of a waterdrop
level in the measurement series and therefore the point at which a leak is
most likely.
.
shows the sound amplitude on a sound level scale
.
.
is the smart indicator. The smart indicator is based
is used to denote the highest minimum sound
Because the measuring values determined during leak detection
☞
a specific mode, measuring modes can be changed between individual
measurements and the measurements that were taken prior to the
The measuring mode symbol on the display shows which mode
has been set.
If the smart mode has not already been set, navigate to the measuring mode
symbol
The window for selecting the measuring mode will then open.
To set the smart mode, navigate to the list item smart mode and confirm your
selection by pressing the right-hand dial.
The window will close and the smart mode symbol will be shown
, activate the symbol and confirm your selection.
8
.
LD6000 Operating Manual
mode change can be either analysed or measuring can be continued.
The measurement series remains unaffected and is not cleared.
are not determined using a specific mode, but only shown in
EN
Page 9

.3. F &V Mode (Frequency and Volume)
24-01-11 17:00
S
aveHelpMenu
12345678910
100500
Hz
20 10
%%
06001200
Hz
1
234
5
6
7
Mode
Smart mode
F & V mode
V
mode
ƒ
ƒ
P
ULSE mode
24-01-11 17:00
SaveHelpMenu
12345678910
100500
Hz
20
160191702619020160
160160160
170170170
190190190
160160160
05001000
Hz
ƒ
27 29
%%
24-01-11 17:00 SaveHelpMenu
12345678910
100500
%
20 10
%%
06001200
Hz
1
234
5
6
7
Mode
Smart mode
F & V mode
V mode
ƒ
PULSE mode
24-01-11 17:00
SaveHelpMenu
12345678910
100500
%
20 19 26 20
05001000
Hz
27 29
%%
7
.3.1. Mode Description
7
The sound amplitude of the minimum measured value (bar height) and
the frequency range with the highest sound amplitude (bar colour) are
displayed as a bar in F& V mode.
.3.2. Mode Selection
7
The measuring mode symbol on the display shows which mode has been
set. If the F& V mode has not already been set, navigate to the measuring mode
symbol
selecting the measuring mode will then open.
To set the F &V mode, navigate to the list item F & V mode and confirm your
selection by pressing the right-hand dial. The window will close and the F & V
mode symbol will be shown
, activate the symbol and confirm your selection. The window for
.
The symbol of a waterdrop is used to denote the highest minimum sound
level in the measurement series and therefore the point at which a leak is most
likely.
Because the measuring values are not determined using a
☞
modes can be changed between individual measurements and the measurements that were taken prior to the mode change can be either analysed or measuring can be continued. The measurement series remains
unaffected and is not cleared.
specific mode, but only shown in a specific mode, measuring
7.4. V Mode (Level Mode)
7.4.1. Mode Description
In V mode, the measured minimum value only is
displayed as a single bar.
7.4.2. Mode Selection
7.3.3. Measuring Procedure
The measuring mode symbol on the display shows which mode is currently
being used. If the V mode has not been set, navigate to the measuring mode
symbol
The window for selecting the measuring mode will then open.
To set the V mode, navigate to the list item V mode and confirm your selection
by pressing the right-hand dial.
The window will close and the V mode symbol will be shown
, activate the symbol and confirm your selection.
7.4.3. Measuring Procedure
Press the record button to start measuring. Keep the button pressed for the
duration of the measuring operation. The device will stop measuring when the
record button is no longer pressed.
The display can show a measurement series which is made up of the last ten
individual measurements. The first measurement is displayed on Position 1.
Each further measurement – beginning with Position 2 – will be placed on
an ascending position. When Position 10 has been reached, the oldest of the
ten measurements, i.e. the measurement on Position 1 will be cleared so that
the last measurement that was taken last is always on Position 10.
The single bars are used to visualise the following information
in F&V mode:
As is the case in V mode, the height of the bar shows the sound amplitude on a
sound level scale from 0 to 100. In addition, the colour of the bar visualises the
frequency range with the highest noise amplitude. The brighter the colour, the
higher the frequency.
The sound level
under the bars.
In addition, the sound value that is currently being measured is displayed
in the form of a bar
EN
and frequency are also shown as a number
.
LD6000 Operating Manual
Press the record button to start measuring. Keep the button pressed for the
duration of the measuring operation. The device will stop measuring when the
record button is no longer pressed. The display can show a measurement series
which is made up of the last ten individual measurements.
The first measurement is displayed on Position 1. Each further measurement –
beginning with Position 2 – will be placed on an ascending position. When
Position 10 has been reached, the oldest of the ten measurements, i.e. the
measurement on Position 1 will be cleared so that the last measurement that
was taken last is always on Position 10.
.
9
Page 10

When in V mode, the height of the bar shows the noise amplitude of the
24-01-11 17:00 SaveHelpMenu
12345678910
100500
%
20 10
%%
06001200
Hz
1
234
5
6
7
Mode
Smart mode
F & V mode
V mode
ƒ
PULSE mode
24-01-11 17:00 SaveHelpMenu
1
2345678910
100500
%
3
5463050
20 10
%%
0
sec
4
0-1000
Hz
measured minimum value on a sound level scale from 0 to 100.
In addition, the value that is being currently measured is displayed
o
The symbol of a waterdrop
sound level in the measurement series and therefore the point at
which a leak is most likely.
☞
mode, measuring modes can be changed between individual measurements and the measurements that were taken prior to the mode change
can be either analysed or measuring can be continued. The measurement
series remains unaffected and is not cleared.
n the bar
.
is used to denote the highest minimum
Because the measuring values during leak detection are not
determined using a specific mode, but only shown in a specific
7.5. PULSE mode (acoustic pipe detection using a
pulse wave generator)
7.5.1. Mode description
The pulse wave generator produces a pressure wave which is repeated
periodically and can be picked up further down the pipe by the LD6000
and a connected ground microphone. This enables you to detect non-metallic
water pipes up to a depth of 2 metres without first having to interrupt any services
or turn off any water supplies.
7.5.2. Mode selection
In addition, the current measurement is displayed as a bar value .
The bar which shows the actual value is a practical aid for detecting pipes
because it clearly shows the impulse which the LD-PULS is generating. The
olume and frequency of the impulse are at their highest directly above the pipe.
v
The interval and intensity of the impulses are displayed visually in a four-second
window on the bottom time axis
.
7.5.4. Filter settings in PULSE mode
In contrast to the leak detection filter presettings (see chapter 7.1.3.), a filter
mode symbol
There is a predefined frequency range with a 0 Hz high pass filter and a 1,000
Hz low past filter. This is the factory setting which you would use for your first
measurement.
The frequency range can be adjusted at any time to suit your individual
requirements. To adjust the frequency range, navigate to the filter mode symbol
, activate the symbol and confirm your selection.
The acoustic filter adjustment window opens.
Follow the instructions for adjusting the filter frequencies as described in
chapter 7.7.1.
which is only available in this mode appears in PULSE mode.
The measuring mode symbol displayed in the display shows you which mode
has been currently selected. If the PULSE mode has not already been selected,
navigate to the measuring mode symbol
your selection.
The measuring mode selection window opens.
To set the PULSE mode, navigate to the list item PULSE mode and confirm your
selection by pressing the right-hand dial.
The window closes and the PULSE mode symbol is displayed as a measuring
mode symbol
.
7.5.3. Measuring operation
Press the record button to start a measurement and release the record button
to stop the measurement. The measurement will last for as long as you keep
the record button pressed.
The last ten individual measurements can be displayed as a measurement series
in the display. The first measurement is displayed on position 1 and each new
measurement is displayed in ascending form from position 2 upwards. When
the tenth measurement has been carried out, the first position, ie. the oldest
measurement will be deleted and the last measurement will be displayed on
position 10.
In PULSE mode, the height of the bar shows the sound amplitude of the measured
minimum value on a scale of 0 to 100.
, activate the symbol and confirm
We recommend that you do NOT use the automatic function
☞
adjust the filter frequencies manually. As a rule, the following applies: the
greater the distance between the LD6000 and the LD-PULS, the lower the
frequency you should select. A frequency window ranging from 0 - 350 Hz
has proved to be particularly effective when working in the field.
(chapter 7.7.2.) in PULSE mode. Instead we recommend that you
7.6. Clear Current Measurement Series
As many as 10 single measurements can be carried out with the LD6000 and
used as a measurement series which can then be seen on the display. This series
remains in the memory – even when the device is powered off – unless certain
parameters are changed.
This function is of a particular advantage in the field as this means that the last
measuring value can then be “carried over” to the next measuring point where
the measurement series can then be continued.
It must be pointed out that the measurement series will be cleared as soon as
the sensor sensitivity settings or the predefined filter settings are changed.
Follow the instructions in chapter 10 to find out more on how the measurement
series can be saved permanently.
To clear the individual measurements or the measurement
series shown on the display, press the dial on the left and
keep pressed for 3 seconds. All 10 positions on the display have now been cleared and are empty.
10
LD6000 Operating Manual
EN
Page 11

.7. Adjusting the filter and switching
24-01-11 17:00
SaveHelpMenu
100500
12345678910
20919826
1
1209
990192620
88
1111
99
05001000
Hz
01000
5
0400
27 29
%%
A
B
24-01-11 17:00
SaveHelpMenu
100500
12345678910
209198261120
9
990192620
88
1111
99
05001000
Hz
01000
50 400
27 29
%%
A
B
24-01-11 17:00
SaveHelpMenu
100500
12345678910
20919826
1
1
20
9
990192620
88
1111
99
05001000
H
z
01000
5
0400
27 29
%%
7
on the acoustic function
7.7.1. Manual filter frequency adjustment
You can change the preselected filter frequencies at any time between individual
measurements in each of the three acoustic leak detection measuring modes.
Navigate to the frequency range display
confirm your selection.
The window for the acoustic filter adaption will then open.
The high pass filter, the low pass filter, the frequency spectrum and the status
symbol for the acoustic activation are all presented on the display.
The frequency spectrum is also presented as a colour gradient.
Dark colours indicate low frequency sounds and bright colours
indicate high frequency sounds.
The preset high pass filter is active. This is indicated by the red high pass filter
value field
A and the red high pass filter bar B in the frequency band.
To change the frequency value of the high pass filter, turn the right-hand dial or
touch the touch screen and pull the high pass filter bar to the position where
you would like it to be.
, activate the display and
When working in the field, the setting for
the low pass filter is ideal when all the high
frequency sounds lie within the selected range
and the high pass filter is set so that the bottom
rong filter adaptation
W
left-hand sector of the selection box is on
he right-hand sloping flank of the biggest
t
part of the spectrum.
ress the cancel key to leave the window.
P
ight filter adaptation
R
7.7.2. Automatic filter frequency adjustment
In addition to the manual adjustment function, the LD6000 is also equipped with
an automatic adjustment function which enables you to set the frequency ranges
independently to the optimum setting.
To use this automatic function, navigate to the frequency range display
the display and confirm your selection.
The acoustic filter adjustment window
opens.
Press the record button and keep pressed until you hear a signal tone.
The acoustic signal tells you that the frequency values for the high pass filter
and the low pass filter have now been automatically set to the optimum setting.
To close the window, press the cancel key.
in
To change the frequency value of the low pass filter, press the right-hand dial
once. The low pass filter is now active. This is indicated by the red high pass
filter value field
A and the red high pass filter bar B in the frequency band.
To set the frequency value of the high pass filter, turn the right-hand dial or
touch the touch screen and pull the high pass filter bar to the position where
you would like it to be.
7.7.3. Switching on the acoustic function during
filter adjustment
The LD6000 is equipped with a function which allows you to activate the acoustics
while the filter is being adapted.
This function can be turned on or off by pressing the headphone key. The status
symbol for the acoustic activation function in the window
shows the current
function status.
When this function is active, the sound from the microphone is passed
on through to the headphones while the filter is being adapted.
This means that you can either enter numerical values to set the limits for the
frequency ranges you wish to select or you can set the limits using the acoustic
method.
8. Acoustic Long-Term Measuring
You can carry out long-term measuring with the LD6000 in
order to determine over a longer period whether a certain
sound can be attributed to either a leak or a sound that is
coming from the surrounding area (noises generated by a canal, pump etc.)
To select the acoustic long-term measuring mode, activate the symbol for
acoustic long-term measuring in the main menu and confirm your selection.
You will then arrive at the display.
EN
LD6000 Operating Manual
11
Page 12

.1. Parameter Settings for
24-01-11 17:00
SaveHelpMenu
100500
20 35
%%
0
500 1000
Hz
sec 0 50 100 150 200 250 300
24-01-11 17:00
S
aveHelpMenu
100500
20 35
%%
0
500 1000
Hz
sec 0 50 100 150 200 250 300
H
2
24-01-11 17:00
SaveHelpMenu
100 050 00
5 4 3 2 1
100 050 00
1
0
000
0
8
Acoustic Long-Term Measuring
.2. Measuring Procedure
8
You can set the following parameters and carry out the
following actions on the display:
:
:
:
• Set the sensor sensitivity
• Select the filter presetting
• Adapt the filter and activate the acoustics manually
• Set the volume
• Set time intervals for long-term measuring
• Start long-term measuring (chapter 8.2)
• Clear the display (chapter 8.2)
• Stop/continue long-term measuring (chapter 8.2)
Setting the sensor sensitivity
To set the sensor sensitivity, perform the same steps as described for current
measurements in chapter 7.1.1.
Selecting the filter presetting
To select the filter presetting, perform the same steps as described for current
measurements in chapter 7.1.2.
Adapting the filter and activating the acoustics manually :
To adapt the filter and activate the acoustics manually, perform the same
steps as described for current measurements in chapter 7.6.
Setting the volume
To select the volume for long-term measuring, perform the same steps as
described for current measurements in chapter 7.1.3.
In addition, the volume function for long-term measuring can be
deactivated at any time by pressing the headphone key.
The volume that has been set is not affected by the mute function. The mute
function mutes the headphones.
Press the record button or the record symbol on the display to start
long-term measuring. The measurement begins and ends with the
preselected times.
You can interrupt the recording at any time by pressing the pause symbol
the record symbol
pause symbol, the record symbol or the record button.
or the record button. Continue measuring by pressing the
To clear the long-term measurement series on the
display, press either the left-hand dial and keep pressed
for 3 seconds or by pressing the clear symbol
on the display.
9. Trace Gas Detection
The LD6000 is excellently-suited for detecting leaks together with the optionally
available LD6000 H2 hydrogen sensor and the formation gas type 95/5, which
comprises 95 % nitrogen and 5 % hydrogen.
To select the trace gas detection, activate the symbol
for the trace gas detection in the main menu and
confirm your selection.
You will then arrive at the display.
9.1. Putting the Device into Operation
,
Selecting the time intervals for long-term measuring
There are four predefined time intervals available for selection:
5, 15, 30 and 60 minutes.
To select a time interval, navigate to the time interval symbol
on the display and confirm your selection.
The window for setting the time interval will open.
Navigate to the time interval you wish to select by pressing the right-hand dial
or by touching the touch screen and confirm your selection by pressing the
right-hand dial or press the cancel key.
The time scale
that has been selected.
on the display will now display the time interval
:
As soon as you change to trace gas detection on the display when the hydrogen
sensor is connected, the device recognises the sensor and warms it up to
operating temperature.
This warm-up phase takes approximately 3 minutes and is displayed as a
blue progress bar
The sensor self-calibrates during the warm-up phase. This self-calibration is
designed to determine the base value for the different hydrogen concentrations
that are detected during measuring.
below the numerical display.
LD6000 Operating Manual
12
EN
Page 13

The sensor calibrates independently according to the existing hydrogen con-
24-01-11 17:00
SaveHelpMenu
100 050 00
5 4 3 2 1
20 35 11
100 050 00
1
300
0
300
H2
24-01-11 17:00
SaveHelpMenu
100 050 00
5 4 3 2 1
100 050 00
1
250
0
250
H2
centration in the surrounding air.
This is why it is especially important that you ensure that the sensor is not near
hydrogen source during the warm-up phase.
a
We therefore recommend that you either go outside into the open with the
LD6000 during the warm-up phase or remain in place where you know that
the hydrogen concentration is lower (< 1 ppm H
As soon as the sensor has reached its operating temperature the warm-up
bar disappears and the LD6000 is ready to use.
).
2
9.2. Display
You can read and adjust the following parameters and carry out the following
actions on the display for trace gas detection:
• Bar display
current value underneath it.
• Preset alarm value
• Digital display with the current measuring value
• Five position bars for the bar display and the numerical display
of the previous 5 measurements beginning with Position 1 for the last measurement up to Position 5 for the fifth of the last previous
5 measurements.
• Start / Stop symbol
• Perform zero calibration
• Switch the measuring tone on and off
• Define the alarm threshold
• Record symbol for the measurement operation
The functions and setting possibilities of these parameters will be explained in
detail in the following chapters.
and the number which displays the
to start and stop a measurement
9.3. Normal Measuring with Acoustic Feedback
Information on the displayed values:
☞
The LD6000 H2 hydrogen sensor is able to detect highly resolved hydrogen
concentrations from 10 to 20,000 ppm.
The LD6000 displays the detected hydrogen concentrations as digits but
without an accompanying value in a range from 0 to 1,000 digits.
Important: The correlation from display and H
but logarithmic. The displayed digital value does not automatically
correspond with the ppm value!
concentration is not linear,
2
Starting Measuring:
Press the start/stop symbol
to begin a measurement. The measurement and will be continued until one of
the keys is pressed to discontinue measuring.
A pulsating record symbol
The current measuring value is either displayed as a number on the digital dis-
play
or as both as a number and a bar on the right-hand red bar display .
The display value increases if you get closer to an area with a higher hydrogen
concentration. The value decreases again when you move away from this area
or enter adjoining areas with lower hydrogen concentrations.
There is a hydrogen concentration of 250 digits on the display as
shown in the example.
Activating the Acoustic Feedback:
As it may become difficult to keep an eye on the display the whole time while
trying to detect the direction which the biggest trace gas increase is coming
from, the LD6000 is also equipped with an acoustic feedback to help you during
leak detection.
The LD6000 is equipped with a signal display which is connected to a piezo
element and additionally able to transmit a signal tone to the connected LD K
headphones.
The acoustic feedback is initially set to “deactivated”.
To activate the acoustic feedback, navigate to the measuring tone symbol
with the right-hand dial and activate the symbol by either pressing the dial or
by directly touching the touch screen where the measuring tone symbol
When the acoustic feedback is activated, the sound is emitted via both the
connected headphones as well as the internal piezo element.
The sound is emitted in the same volume and the same frequency via the
piezo element. The tone sequence increases when the measuring values increase and decreases when the measuring values decrease.
The sound is emitted in the same volume as a continuous tone via the
headphones. The frequency depends on the measuring value. The frequency
increases when the measuring values increase (the tone becomes higher) and
decreases when the measuring values decrease (the tone becomes higher).
on the touch screen or press the record button
indicates that measuring is being carried out.
is.
EN
LD6000 Operating Manual
13
Page 14

.4. Defining Alarm Thresholds
24-01-11 17:00
SaveHelpMenu
100 050 00
5 4 3 2 1
20 35 11
100 050 00
1
0
0
2
40111 17
:
0
0
Help
Menu
543
212
035
11
Digits
02004006008001000
9
In order to allow you to identify certain hydrogen concentrations more easily,
the LD6000 is equipped with a permanent alarm function with alarm thresholds
that can be configured individually. The factory setting is 500 digits.
An acoustic alarm sounds when the alarm threshold is exceeded. The warning
tone sounds different than the standard feedback signal.
When the alarm tone sounds via the piezo element, the signal changes
constantly in a tone sequence with long tones in short intervals.
When the alarm tone sounds via the headphones, the continuous tone is
emitted without interruption with maximum frequency when the predefined alarm
hresholds have been exceeded.
t
To set the alarm threshold which you wish to select, navigate in the display
window to the symbol for the threshold setting
confirm your selection.
The window for setting the alarm threshold will then open.
The current alarm threshold is displayed on a step scale ranging from 0 to
1,000 digits.
You can select a new threshold value by either turning the dial on the right
or placing a finger on the touch screen and pulling it to the value which
you wish to select.
Press the cancel key to leave the window without changing the
threshold value.
Press the dial on the right to confirm your selection or press the cancel key.
, activate the symbol and
The digit display now shows two values: the relative measured value (relative
to the defined reference value, 000-display at the point of zero calibration) as
large digits in the middle of the digit display and the measured absolute measured value as reference value when zero calibration was carried out in the lower
right-hand area of the digital display.
The displayed value changes as follows when the hydrogen concentration
increases: the relative measured value shows the increasing values in relation
to the defined reference value. The absolute measured value shows the actual
existing hydrogen concentration.
The relative measured value is not only displayed on the digital display but
also on the red bar display as well as on the numerical display below.
If the hydrogen concentration sinks below the defined reference value, the
displayed relative measured value no longer changes (000), but the absolute
easured value still displays the existing hydrogen concentration.
m
Here an example to explain how this works:
There are different hydrogen concentrations in three fictive adjoining zones. The
concentration in Zone 1 is 200 digits, the concentration in Zone 2 is 300 digits
the concentration in Zone 3 is 100 digits.
First measuring is carried out in Zone 1.
The measured value on the display is 200 digits.
Now a zero calibration is carried out in Zone 1 and the existing
hydrogen concentration (200 digits) is defined as the reference
value. When a second measurement is carried out in Zone 1,
the digital display now shows a relative measured value of 000
and an absolute measured value of 200.
A new measurement is carried out in Zone 2. The digital
display now shows a relative measured value of 100
and an absolute measured value of 300.
Then measuring is carried out in Zone 3. After the measurement
has been carried out, the digital display only shows the absolute
measured value 100 and no measuring value (000).
9.5. Measuring with Zero Calibration
It may become necessary to use the zero calibration function to define a reference
value during measuring so that fluctuating hydrogen concentrations at different
measuring points can be defined more clearly.
As soon as a reference value has been defined a value that is relative to the
newly defined reference value appears on the display.
This can be of particular advantage when sections of pipe are measured in areas
with high hydrogen concentrations, because it allows you to narrow down the
position of the leak on a step-by-step basis.
To determine a reference value, navigate to the zero calibration symbol
with the right-hand dial and activate the symbol by pressing the dial. You
can also activate the zero calibration symbol by touching the symbol on touch
screen.
Important: The current measurement series is cleared when zero
calibration is performed!
When you perform a zero calibration you are defining the existing hydrogen
concentration, i.e. the current measuring value, as the new reference value.
This in turn changes the displayed measurement value when compared to the
normal measurement with zero calibration.
Important: The defined alarm thresholds are always set with regard to the
relative measured value! An alarm threshold of 150 digits, as shown in the
example above, would only trigger a signal after the first measurement in Zone
1 before zero calibration was carried out, even though the absolute measured
value that was measured in Zone 1 (after zero calibration) and also in Zone 2
was above the alarm threshold.
9.6. Clearing the Measurement Series /
Clearing Zero Calibration
You can use the clear function to clear both the measurement series and the
zero calibration in trace gas mode.
Either of the two cannot be cleared individually. You can either clear both of
them or neither of them.
Press the left hand dial to clear both the zero calibration
and the current measurement series. Both memory
parameters are now cleared. There are now no measuring
To save measurement series permanently into the memory,
follow the instructions as described in chapter 10.
values and no reference value.
14
LD6000 Operating Manual
EN
Page 15

10. Saving and Loading
24-01-11 17:00
H
elpMenu
S
elect memory
1
2
3
4
5
24-01-11 17:00
HelpMenu
Select memory
1 24-01-11 17:00
2
3
4
5
24-01-11 17:00
HelpMenu
Measuring Data
Any measurement reading and any measurement series can be saved to the
internal memory of the LD6000 permanently and either called up at a later point
or transferred to your PC.
The menu item “save” is only visible when you are in a measuring mode.
To save a measurement or a measurement series into the memory, navigate to
the menu item “save” with the right-hand dial and press the dial to confirm your
selection.
You can also use the touch screen to select the memory item “save”.
The display now changes to the memory page.
Saving Measuring Data
You can also confirm your selection directly by pressing the symbol
Load Measuring Data on the touch screen.
You can then call up the measuring data you have saved from any one of the
emory spaces. Turn the right-hand dial to navigate to the memory space you
m
wish to select and confirm your selection by pressing the display symbol Load
Measuring Data
The measuring value you have selected is now displayed.
.
11. Transferring Measuring Data
To A PC
The measuring values which you have saved to your internal memory can be
transferred to your PC for further assessment or documentation.
You will need the PC connecting cable included in the scope of delivery and a
software tool which you can download free of charge at www.trotec.com.
The software tool which you may choose to download is absolutely
☞
The software is provided without any form of support and any form of
guarantee. The intuitive user interface is exceptionally easy to work with
and understand. Further information regarding the software and its use can
be found in the application included.
free of charge and is not a part of the standard scope of delivery.
To save your measuring data, navigate to the display symbol Save Measuring
Value
You can also confirm your selection directly by pressing the symbol Save
Measuring Value on the touch screen.
The measuring values can then be saved to any memory space you wish. Turn
the right-hand dial to navigate to 1 of the 20 memory spaces and confirm your
selection by pressing the display symbol Save Measuring Value
The measuring value is now on the memory space which you
previously selected.
You can navigate to memory spaces outside the touch screen display
by touching the navigation symbols
You can either leave the memory page by pressing the cancel key
or the door symbol on the display.
Loading Measuring Data
and confirm your selection by pressing the right-hand dial.
.
.
To transfer your data to the PC, navigate to the main menu and select
the Data Transfer display symbol (see chapter 6.2).
The display now changes to the memory transfer page.
Please ensure that your PC is connected to the LD6000 and then navigate to
the display symbol Data Transfer . Confirm your selection and follow the
instructions as shown on your PC.
To call up any data that you have previously saved, navigate to the display symbol
Load Measuring Data
dial.
EN
and confirm your selection by pressing the right-hand
LD6000 Operating Manual
15
Page 16

12. Troubleshooting
Acoustic leak detection – List of possible errors or faults:
Error⁄Fault Description Possible Cause Recommended Action
No sound in the headphones
The screen remains blank.
1. The sound receiver or the
headphones are not connected
properly
2. Wrong filter settings
3. The cable that connects the
sound receiver and the unit
appears to be defective.
4. The cable that connects the
headphones to the unit appears
to be defective (in such a case
the sound level indicator on the
display still works properly!)
5. Memory settings
1. The batteries are empty
2. The unit is defective Please contact our Customer Support Centre.
Check the connections between the connected sound receiver and the
connected headphones and the LD6000.
Select a broader frequency range, e.g. 50 to 2,000 Hz and generate a clearly
audible sound by scratching a surface or turning on a radio, for example.
If the action you have carried out causes the numerical or bar display to change
and these sounds can be clearly heard in your headphones, then you can be
sure that the headphones and microphone are working properly.
Now carry out the measurement again and adapt the frequency range
to suit the measuring operation.
• Check the connections between the connected sound receiver
and the LD6000.
• Replace the cable with a spare cable if possible or use the cable from a
second LD6000 to check to see if the sound receiver is working properly.
• Check the connections between the connected headphones and the LD6000.
• Connect a spare pair of headphones which you may have or another pair
from a second LD6000 to the unit and check the function again.
If the actions that you have carried out have not been successful, then go to
“Clear memory” in the menu and clear the parameter memory.
If you can still not hear anything over the headphones, then please contact
our Customer Support Centre.
Replace the batteries inside your unit with new ones of the
same high quality and type.
1. The brightness setting has not
been set correctly.
Display brightness too dim
2. Battery power very low
The company logo remains on the display 1. The unit is defective Please contact our Customer Support Centre.
Go to the menu item “Settings” and increase the display brightness.
Replace the batteries inside your unit with new ones of the
same high quality and type.
Trace Gas Detection – List of possible errors or faults:
Error ⁄Fault Description Possible Cause Recommended Action
1. The sensor cable has not been
connected properly.
You cannot commence measuring,
the cross symbol above the function key
does not disappear,
the sensor does not warm up
No or hardly any display of existing
gas concentrations
Reaction time too long 1. Sensor is not working properly Please contact our Customer Support Centre.
2. Port ⁄ Jack or plug defective
3. Cable defective
4. Sensor defective Please contact our Customer Support Centre.
1. Sensor was connected to the
unit in a room with existing
gas concentrations
2. Sensor defective Please contact our Customer Support Centre.
• Check the connections between the connected H2 sensor and the LD6000.
• Replace the sensor with a spare sensor if possible or use the sensor from a
second LD6000 to check to see if the sensor is working properly.
• Check the connections between the connected H2 sensor and the LD6000.
• Replace the sensor with a spare sensor if possible or use the sensor from a
second LD6000 to check to see if the sensor is working properly.
• Check the connections between the connected H2 sensor and the LD6000.
• Replace the sensor with a spare sensor if possible or use the sensor from a
second LD6000 to check to see if the sensor is working properly.
Leave the room and go somewhere where existing hydrogen levels are normal,
e.g. out in the open. Power up the unit AGAIN and then return to the room
which you had previously left.
16
LD6000 Operating Manual
EN
Page 17

13. Changing the Battery, Cleaning and Maintenance
Changing the Battery
There is a battery symbol above the menu bar on the left-hand side of the display that shows you how much power you batteries have left. The more green
segments there are, the higher the battery capacity. If there is only one red
segment left, then the batteries need to be replaced very soon.
s soon as the battery voltage drops below the strength that is required to
A
power the unit, a warning symbol starts to blink in the middle of the display.
The batteries should be replaced immediately.
hange the batteries as follows:
C
Power off the unit. Unscrew and remove the battery compartment lid (see chapter
4, legend item
), take out the used batteries and replace them with new ones.
Please make sure that the poles of the batteries you are inserting are properly
aligned with the poles inside the battery compartment.
To power the LD6000, you may either choose to use high quality batteries type
LR14 C 1.5 V (recommended capacity ≥ 4,500 mAh) or rechargeable batteries.
When using rechargeable batteries, you must make sure that you only use
NIMH rechargeable batteries, type HR14 1.2 V.
Do not dispose of batteries in household waste. Do not throw into water or fire.
Please make sure that you dispose of your used batteries according to existing
government guidelines and regulations.
14. Technical Data
Cleaning and Maintenance
LD6000 Measuring Device
Use a slightly moist, lint-free cloth only to clean the main unit. Do NOT use any
detergents or cleaning fluids. Use clean, clear water only.
We recommend that you remove the batteries from the battery compartment
when you are not planning on using your measuring device for a longer period.
LD6000 H2 hydrogen sensor
The measuring tip of the hydrogen hand sensor is equipped with a brass-coloured
hexagonal protection cap (sinter filter) which is designed to protect the sensor
system.
Use compressed air to remove any dirt particles which might happen to settle
on the sinter filter.
Unscrew the sinter filter from the measuring tip and direct the jet of compressed
air from behind – from the direction of the inner thread of the filter – towards
the filter element to remove any dirt particles from the filter element. Replace
the sinter filter back on the sensor tip and screw back on.
The swan-neck hydrogen hand sensor can be cleaned with a slightly moist,
lint-free cloth if necessary.
Technical data LD6000
Article no. 3.110.008.010
Operating mode
Measuring and
device functions
Controls Either via touchscreen, keys or control dial
Amplification 120 dB low noise factor
Input impedance 1M Ω
Filter
Frequency spectrum 0 - 4,000 Hz
Display Colour LCD (automatic illumination), 480 x 272 pixels
Battery check Via micro-controller
Output impedance ≤ 10 Ω
Power supply 4 x batteries type LR14 C 1.5 V
Operating time
Connections
Protection class IP54
Housing Aluminium, powder-coated
Temperature conditions
Dimensions approx. L 210 x W 160 x H 60 mm
Weight approx.
Acoustic leak detection (F & V, Smart, long-term
measuring), pipe detection and trace gas leak detection
Measuring modes for minimum level, averaged level,
pulse wave measurements, simultaneous F & V analysis,
logging function, automatic functions for setting filter
frequencies and sensor sensitivity, memory preference
for manual filter settings, sound level overmodulation
protection, trace gas detection with concentrationdependent signal (optic and acoustic)
Up to 256 can be configured individually
(for stick sensor and ground microphone)
up to 14 h in non-stop operation,
up to 40 h in normal operation
Bayonet nut connector (microphone / sensor),
6.3 mm jack plug (headphones), USB
During operation: -5 °C to +55 °C;
Storage: -25 °C to +65 °C
1,050 g
Technical data LD6000 H2 hydrogen hand sensor
Article no. 3.110.008.011
Response sensitivity 1 ppm H
Measuring range 10 ppm H to 20,000 ppm H
Resolution 1 ppm H
Reaction time 0.5 s
Type
Temperature conditions
Technical data LD6000 H2 hydrogen ground sensor incl. pump
Article no. 3.110.008.020
Response sensitivity 1 ppm H
Measuring range 10 ppm H to 20,000 ppm H
Resolution 1 ppm H
Reaction time 0.5 s
Type
Pump module integrated, see technical data LD6000 H2 pump kit
Temperature conditions
Technical data LD6000 H2 pump kit
Article no. 3.110.008.030
Pump performance 1.5 litres ⁄ minute
Power supply 9 V block battery IEC 6LR61 ⁄ 6F22
Power input approx. 45 mA
Dimensions L 480 mm x W 40 mm x H 40 mm
Weight 500 g
The LD6000 H2 pump kit is a standard part of the LD6000 H2 hydrogen ground sensor (article no. 3.110.008.020). It can, however, also be ordered separately in
order to upgrade existing LD6000 H2 ground sensors without an integrated pump.
Hand sensor with flexible swan-neck (length 50 cm)
and 160 cm connecting cable for LD6000
During operation: -10 °C to +60 °C; Storage -20 °C to +60 °C
Ground sensor with active pump, two-part rod (length
approx. 1 m) and rubber collar as well as approx. 200
cm long connecting cable for LD6000. Weight 1.1 kg.
During operation: -10 °C to +60 °C; Storage -20 °C to +60 °C
EN
LD6000 Operating Manual
17
Page 18

0
25 H z 250 Hz 2,500 Hz
Concrete
Clay
Earth
Sand
16 0
140
120
100
80
60
40
20
15. Information for Use in the Field
15.1. Acoustic Leak Detection
15.1.1. How Sound Is Created
When there is a leak in a high pressure pipe system, water that leaks out generates
sound that is caused by the friction that occurs when the water escapes through
the hole at high speed. This also leads to oscillations in the pipe itself. The sound
s carried along the pipe and can be picked up at contact points (valves, hydrant,
i
fittings) which can actually be quite far from the actual leak itself and transformed
into audible sound by structure-borne sound microphones.
15.1.1.1. Ground-Borne Sound
When water that is escaping from a leak comes into contact with the ground,
then this causes the parts of the ground that it comes into contact with to oscillate. The sound spreads out from the leak in circles and can be picked up by
a ground microphone near the actual leak. The frequency of these signals lies
between 30 and 700 Hz.
Frequencies whose wave lengths are smaller than the depth that the pipes have
been laid in are strongly absorbed because of the low pass effect of the
surrounding soil. This means that only the low frequencies normally reach the
surface of the ground.
15.1.1.2. Structure-Borne Sound
Structure-borne sound oscillations occur when water escapes from a leak with
high pressure and at a correspondingly high speed which causes the pipe in
question to oscillate.
The sound that is generated at the point where water is escaping spreads out
to all sides of the pipe. Small diameter or thin steel pipes will oscillate strongly
and the sound that the leak is causing can be picked up at a considerable distance from the leak itself. Thick pipes or pipes made of synthetic material, on
the other hand, do not oscillate as strongly and the sound that the leak generates
does not spread out nearly as far.
The frequency and the material of the pipes play a major role as far as the distance
that the sound travels is concerned. As is the case with ground-borne sound, low
frequency sounds travel further distances and softer materials like PVC or PE
pipes absorb the energy that the leak causes more strongly than metallic pipes.
15.1.1.3 Current Induced Sound
Current-borne sound is generated at narrow points or bottlenecks, for example
at valves that are only half or partly open, at household connecting points where
pipes can have differing diameters or dimensions or when corrosion has formed
and pipes are crusted with rust on the inside. These factors can cause turbulent
currents which can generate frequencies of over 4,000 Hz.
15.1.1.4 Interference Factors
Sounds from surrounding sources that have been absorbed and filtered by the
ground have a similar frequency spectrum to the sound that a leak generates.
The interference this causes can be likened to stop and go traffic on the roads,
but with the difference that such a traffic situation is far more disruptive with
regard to traffic flow when it happens on a major road than somewhere in the
centre of a small town.
The higher the pressure in the pipe on which an inspection is to be carried out, the
higher the amount of energy that forms at the leak. This means that leaks become
less audible if the pressure in the pipe is lower than 3 bar. If the pressure is lower than
1.5 bar, then a leak cannot be heard even when in it is in the close vicinity.
15.1.2. Schematic Leak Detection
If the water has been escaping from the leak for a relatively long period of time,
a water blister sometimes forms and continues to contain the water that is leaking
from the pipe. The sound that is transmitted through the ground is therefore
barely audible and is almost impossible to pick up with a ground microphone.
The sound caused by the leak can be made audible again if compressed air can
be fed into the pipe system that is being examined. In such a case the compressed air is fed into the pipe system with a minimal amount of overpressure
via a hydrant or house connecting point. This combination of water and air
generates a sound at the leak that is clearly audible.
The diagram below shows the influence of the ground formation on the distance
that the ground-borne sound waves can travel with reference to the leak frequency
in metres. Low frequency sounds spread out further than high frequency sounds,
and compact ground conducts the sound to the surface better than ground which
is not as compact.
18
LD6000 Operating Manual
In order to keep costs down it often makes sense to adopt a systematic approach
to carrying out leak detection. This is especially true when water pipes are
concerned, for example. The first thing you need to know is the course of the
pipe. You will also need to differentiate clearly between the preliminary leak
detection stage and the stage which involves pinpointing the actual leak. If
this first stage were not to be performed, then the whole length of the pipe would
have to be inspected order to determine the exact spot where the leak is.
15.1.2.1 Narrowing Down the Leak Using a Stick Microphone
You can narrow down the position of a leak by inspecting the parts of the pipe
system that you are able to access with the probe tip of the stick microphone.
Particular attention must be paid the type of sound that is recorded: leaks generate
a dull, muffled sound and valves produce a brighter, sharper sound. Both sounds
are very helpful when it comes to narrowing down the position of a leak, but it is
important to remember that similar sounds – like that of water flowing through the
pipe – can be generated when water is taken from the pipe via a tap for example.
When narrowing down the leak, it is important to ensure that no value exceeds
the range on the display otherwise you will be unable to tell what the actual value
was. The fact that the measuring values can be saved into the internal memory
is an added benefit, as it can then be “carried over” to the place where measuring
is to be carried out next.
This method allows you to determine the section of pipe with the highest sound
intensity without changing the control settings. The next leak detection stage
can then be carried out on this particular section of pipe over ground.
EN
Page 19

15.1.2.2 Pinpointing the Leak Using a Ground Microphone
f you have managed to detect a defective section of pipe using the stick
I
microphone, you can use the ground microphone to pinpoint the leak. Always
make sure that the distance between any two points that you have selected for
the ground microphone is not too far apart as you could otherwise end up missing
the leak. As a rule, the distance apart should not be more than one metre.
5.1.2.3 Pipe Detection with Pulse Wave Generator
1
The LD6000 is equipped with a special PULSE mode (see chapter 7.5.) for acoustic
pipe detection in combination with a separately available pulse wave generator,
for example the LD-PULS.
The pulse generator generates up to 60 oscillations per minute. These oscillations
can be carried along the pipes up to a distance of 600 metres in especially
favourable con-ditions. They can then be picked up by the ground microphone.
The LD-PULS pulse generator has proved invaluable when working with both
non-metallic and metallic pipes which because of transformer stations or hightension underground power cables cannot be detected using conventional
detection methods.
15.2. Leak Detection with Trace Gas
15.2.1 Functioning Principle
The optionally available LD6000 H2 hydrogen hand sensor is excellently suited
for trace gas detection in combination with the LD6000. In such cases, the pipe
that is to undergo inspection is flooded with forming gas 95/5 (95 % nitrogen,
5 % hydrogen).
Because of its specific structure, hydrogen is able to permeate almost all materials
like earth, concrete, floor tiles etc. It can then be easily traced at the surface with
the LD6000 and the connected hydrogen sensor.
Forming gas 95/5 is neither toxic nor flammable. This means that it can be
considered harmless and even used in fire-protected industrial areas. You must,
however, always make sure that you you follow the rules and regulations that
apply to such areas.
15.2.2 How to Carry Out Leak Detection with a Forming Gas
After the pipe that is to undergo inspection has been emptied, the gas bottle is
connected and the pipe is then filled slowly from one end until the hydrogen
sensor at the other end of the pipe or at a control point along the pipe signals
that gas concentrations have been detected. Then the second end is sealed and
the pressure is gradually increased until the inspection pressure has been reached.
It might then take several minutes or even hours for the gas to reach the surface.
This depends on the leak and the type of ground and surface. It takes approximately 60 minutes for the gas to reach the surface when ground in green areas,
for example, is slightly moist and the pipes are circa 1.5 m under the ground. You
have to follow the path of the pipes repeatedly until the gas escapes through
the surface. Then look for the highest concentration within the area where the
gas has escaped and mark this point to show that this is where the leak is.
5.2.3 Determining Correct Quantities Using Experience
1
Gained in the Field
If a pressure test with water has already been carried out on the pipe, then the
pressure at which water no longer escapes through the leak can be used to
calculate the quantity of gas that is needed. If not the operating pressure can
be used.
On this basis and with the help of the volume table below, it is possible to calculate the maximum amount of forming gas that is required to locate the leak:
Formula: G = VL x L x D
G = Amount of gas with regard to inspection pressure (L)
VL = Volume in litres with regard to the length of pipe in metres (L)
L = Length of pipe (m)
D = Inspection pressure (bar)
Example:
A DN 125 pipe is 300 metres long and is to be filled with a pressure of 5 bar:
Volume per metre x length =
12.27 litres x 300 metres =
3,681 litres at 1 bar pressure.
At 5 bar pressure: 3681 litres x 5 bar = 18,405 litres
Because a standard 50 litre bottle contains 10,000 litres of gas at 200 bar, two
such bottles of forming gas were required in the above example.
You should also keep in mind when planning how much gas you will need that
in addition you will need a reserve for the gas that escapes at the leak.
Volumen table of various pipe diameters for calculating gas amounts
Pipe diameter in mm
40 1.26
50 1.96
60 2.83
80 5.02
100 7.85
125 12.27
150 17.66
200 31.4
250 49.06
300 70.65
VL (volume in litres with regard to the
length of pipe in metres)
EN
LD6000 Operating Manual
19
Page 20

Trotec GmbH
Grebbener Straße 7
D-52525 Heinsberg
+49 2452 962-400
+49 2452 962-200
info@trotec.com
www.trotec.com
 Loading...