

Page 1

U1 Plot
Manual
Page 2

Trademarks
, Acrobat, PostScript and PostScript3TM are registered trademarks of
Adobe
Adobe Systems Incorporated.
Apple, Macintosh, Mac and TrueType are registered trademarks of Apple Computer,
Incorporated.
AutoCAD
HPGL, HPGL/2 and HP-RTL are registered trademarks of Hewlett-Packard Company.
Ethernet
Microsoft
Microsoft Corporation in the United States and/or other countries.
Netscape Navigator
Corporation, Mountain View/USA.
PLOTBASE
Germany.
PLOTCLIENT
and DWG are registered trademarks of Autodesk, Inc.
is a registered trademark of Xerox Corporation.
, Outlook, Windows and Windows NT are registered trademarks of
is a registered trademark of Netscape Communications
is a registered trademark of RATIO Entwicklungen GmbH, Hamburg,
is a registered trademark of RATIO Entwicklungen GmbH, Hamburg,
Germany.
RATIO SSL is a registered trademark of RATIO Entwicklungen GmbH, Hamburg,
Germany.
Calcomp is a registered trademark of Calcomp Inc..
CALS is a registered trademark of U.S. Department of Defense, USA.
CGM is a registered trademark of Henderson Software Inc., Boulder, USA.
CIT is a registered trademark of Intergraph GmbH, Ismaning, Germany
PCX is a registered trademark of Zsoft, Microsoft Inc.
WMF is a registered trademark of Microsoft Corporation in the United States and/or
other countries.
Other product names used herein are for identification purposes only and might be
trademarks of their respective companies. We disclaim any and all rights in those
marks.
The proper names of the Windows operating systems are as follows:
Microsoft
Microsoft
Microsoft
Microsoft
Microsoft
Microsoft
Microsoft
Windows 95 operating system
Windows 98 operating system
Windows Millennium Edition
Windows 2000 Professional
Windows 2000 Server
Windows NT Server operating system Version 4.0
Windows NT Workstation operating system Version 4.0
Page 3

CONTENTS
Contents
Preface................................................................................6
U1 Plot ................................................................................7
Guide to the manual...................................................................8
Conventions used in the manual ...............................................10
Part I - Installation ...........................................................11
Installations and settings on the Server-PC.....................12
System requirements................................................................. 12
U1 Kernel Driver installation......................................................13
Operating system adjustments................................................... 16
Installing user accounts and groups ......................................17
Activating Windows components...........................................17
Settings for the Response function ......................................... 18
Installation of U1 Plot................................................................18
Extend licenses .........................................................................23
Installation of U1 WINPRINT......................................................25
Updating U1 Plot......................................................................26
Installation Problems................................................................. 27
Part II - U1 Plot.................................................................29
Start and quit program ....................................................30
Program window ..............................................................31
Program sequence ...........................................................32
Naming conventions.................................................................32
From the drawing to the job ......................................................34
Tools .................................................................................37
Job toolbar...............................................................................37
Entry toolbar.............................................................................37
Viewer toolbar.......................................................................... 38
Pause function .......................................................................... 39
U1 Plot signal lights ..................................................................40
Status bar................................................................................. 41
U1 Plot 3
Page 4

CONTENTS
Context menu........................................................................... 41
Configuration....................................................................43
Reader .....................................................................................43
Postscript and PDF (Options) .....................................................43
“General“ tab...................................................................... 43
“Fonts“ tab ..........................................................................44
Postscript halftoning tab .......................................................47
PDF halftoning tab............................................................... 50
CGM (Option) .......................................................................... 50
Properties.................................................................................51
Spool settings ......................................................................51
Job History ..........................................................................53
Exception handling ..............................................................53
Extended settings .................................................................54
Job History........................................................................60
Job types..................................................................................60
Manual (bypass tray)............................................................ 60
An overview of the job characteristics......................................... 60
Change job characteristics ........................................................63
Sort list.....................................................................................64
Carry out selection.................................................................... 65
Start selection ......................................................................65
Cancel selection ..................................................................66
Job information ........................................................................67
Status display ...................................................................68
Job editor..........................................................................69
“Job area “ and tab.................................................................. 69
Default settings area ................................................................. 71
“Default Specific“ tab ...........................................................71
“Default Additional“ tab .......................................................75
File Viewer ...............................................................................76
“Entry“ area .............................................................................76
Entry information .................................................................77
Add entries...............................................................................78
Adding using button............................................................. 79
Add using the right-hand mouse button ................................80
Add using Drag & Drop .......................................................80
Add entries several times...........................................................81
4 U1 Plot
Page 5

CONTENTS
Delete entries ...........................................................................81
Stamp editor ............................................................................82
Make stamp ........................................................................82
Stamp Configurations ..........................................................83
Edit or delete stamp .............................................................83
“Settings“ tab.......................................................................84
“Data“ tab...........................................................................86
Pen settings ..............................................................................89
View the changes.................................................................90
HPGL and HPGL/2 - pens ....................................................90
HPGL and HPGL/2 - Colors .................................................92
HPGL and HPGL/2 - Misc ....................................................93
HPGL and HPGL/2 – Plotter Defaults ....................................97
Calcomp - Pens ...................................................................98
Calcomp - Colors ..............................................................100
Calcomp - Misc .................................................................101
Print job ..........................................................................105
Set plot mode ......................................................................... 105
Automatic plot mode..........................................................105
Manual plot mode .............................................................106
Interrupt plotting.....................................................................106
Delete job ..............................................................................107
Reload plotter.........................................................................107
Error messages.......................................................................108
Part III - Appendix..........................................................114
Overview of the file formats...........................................115
Jobs in the subdirectories...............................................118
SSL based jobs ..................................................................118
CFG based jobs.................................................................119
HPGL and HPGL/2 commands and pens .......................120
Calcomp commands and pens........................................123
Index...............................................................................126
U1 Plot 5
Page 6

PREFACE
Preface
This manual contains detailed instructions on the operation and
maintenance of this machine. To get maximum versatility from
this machine all operators should carefully read and follow the
instructions in this manual. Please keep this manual in a handy
place near the machine.
Note: Parts of this manual are subject to change
without prior notice. In no event will the company be
liable for direct, indirect, special, incidental, or
consequential damages as a result of handling or
operation the machine.
6 U1 Plot
Page 7

U1 Plot
U1 Plot
This manual describes the program U1 Plot.
The client-server architecture of the U1 system allows each user
connected to define their own print jobs and sets of drawings
and to send them to U1 Plot for plotting. U1 Plot can process
whole sets from documents or drawings, with a high degree of
automation.
U1 Plot accepts print jobs from CAD systems, from archived
data stock, from scanning systems such as U1 Scan or from
other clients. The standard data formats supported are HPGL,
HPGL/2, HP-RTL, Calcomp 906/907, TIFF, BMP, PCX, T6X,
RLC, CIT, WMF and CALS. CGM, PDF and Postscript are
optional formats. You can use the DWG format only, if you
have installed an AutoCAD program on your PC.
The user can sort the print jobs in U1 Plot to their own criteria.
The output parameters can be freely altered depending on the
requirements. Individual requirements and repeat prints are
possible when plotting the sets of drawings.
Another manual is available:
U1 PLOTCLIENTS
This manual describes the installation and operation of U1
PLOTCLIENTS. It explains how you can use the Client to
produce print jobs and send them from the workstations to U1
Plot. It also contains information about solving applications
problems.
We wish you every success when working with U1 Plot.
U1 Plot 7
Page 8

U1 PLOT
Guide to the manual
This manual contains all the information that you will need for
the correct use of U1 Plot, from a functional description to
instructions for installation through to an overview of the
shortcut keys. In detail, these are the following chapters:
U1 Plot:
This chapter contains an outline description of the possible
applications and functions of U1 Plot.
Part I - Installation and Principles
Installation and operation:
Here you can read about what system requirements have to be
created for U1 Plot and how to prepare for the installation. In
addition, you are also explained how to set the necessary
default values in the operating system. The folder structure of
the installed program and the processing of jobs in U1 Plot are
explained in the appendix.
Part II - U1 Plot
Start and quit program:
How to start and quit program.
Program window:
This page includes a figure that shows all the work areas of the
program.
Program flow:
This section answers the question ”How does the drawing pass
into the job list of U1 Plot?“ It describes the path of a drawing
from being drawn to its preparation in the plot folder and
editing in U1 Plot through to the printout.
Tools:
This section gives an overview of the large number of buttons
available and which functions they can be used to carry out.
8 U1 Plot
Page 9

U1 Plot
These include the toolbars for Job, Entry and View as well as the
status bar. The so-called “signal lights“ is also explained.
Configuration:
Here you can read which default values are possible and what
you must look out for. You can also read how to activate the
Autoplot mode or start manual print jobs.
Job list:
The job list displays an overview of which jobs have been
printed and which are queued for plotting and what their status
is. This chapter describes what significance the individual fields
have and how you can prioritize the display of a selection of
certain jobs.
Status display:
This chapter describes the status window in which the current
status displays appear and how the current plotter can be
stopped and restarted.
Job editor:
In the job editor you can alter the original plot settings for a job
or an individual drawing or an individual entry. These include,
e.g. the output format, the medium source (paper type) etc. or
the number of copies to be printed.
Print job:
This chapter explains the two print modes “Automatic Print“
and “Manual Print“. Furthermore, it also explains how a plot
can be interrupted and jobs can be deleted after they have been
printed.
U1 Plot 9
Page 10

U1 PLOT
Conventions used in the manual
Two terms are used in the text to point out special circumstances
or advantages or even to warn you against certain steps:
Note: You are free to decide whether you wish to
follow the recommendation given in a note or not. Tips
are usually used to draw your attention to special
circumstances or even to point out useful commands or
ones that are easily forgotten and overseen.
Attention: It is advisable to take particular notice of
any possible problems marked with “Attention“ to e.g.
avoid problems with your data stocks, etc.
10 U1 Plot
Page 11

Part I - Installation
U1 Plot 11
Page 12

INSTALLATIONS AND SETTINGS ON THE SERVER-PC
Installations and settings on the ServerPC
This chapter explains,
• What system requirements must be fulfilled for the server,
• How to install the drivers and the program
• What adjustments you have to make to the operating
system settings.
Furthermore, a separate section lists all the new [sub-]
directories and file types that you will find on your hard disc
following installation.
Attention: Adjustment of the settings in the operating
system and installation of the program should only be
carried out by a user with administrator rights.
System requirements
Please read through the following recommendations carefully.
They can be very helpful in finding the optimum hardware for
your needs.
• Operating system:
Microsoft Windows 2000 Professional with ServicePack 1 or
ServicePack 2
• Processor:
Pentium III, at least 800 Mhz
Athlon, at least 800 Mhz
• Front Side Bus:
133 Mhz (Pentium III)
200 Mhz (Athlon)
• PCI Bus: The PCI bus system must meet up-to-date
standards (PCI 2.0 or higher – 3.3 V or 5 V autoadaptive,
maximum load 5 A). If your computer does not fulfill this
12 U1 Plot
Page 13

INSTALLATIONS AND SETTINGS ON THE SERVER-PC
standard, it is possible that the plotter controller will not be
identified.
• System memory:
Use a system memory with at least 256 MB RAM. With this
system memory, you can plot or scan the maximum drawing
size. However, a system memory of 512 MB RAM is
recommended if you wish to simultaneously plot and scan
drawings with maximum drawing size. Simultaneous
scanning and plotting of smaller formats also enables the
use of smaller system memory. Please ask your dealer or the
support technician for further information.
• Hard drive:
The hard drive should have at least 10 GB memory.
• Network interface/Configuration:
10/100 Base T Ethernet, the TCP/IP configuration is
necessary
• U1 Controller
• Monitor:
At least 1024 x 768 pixels resolution
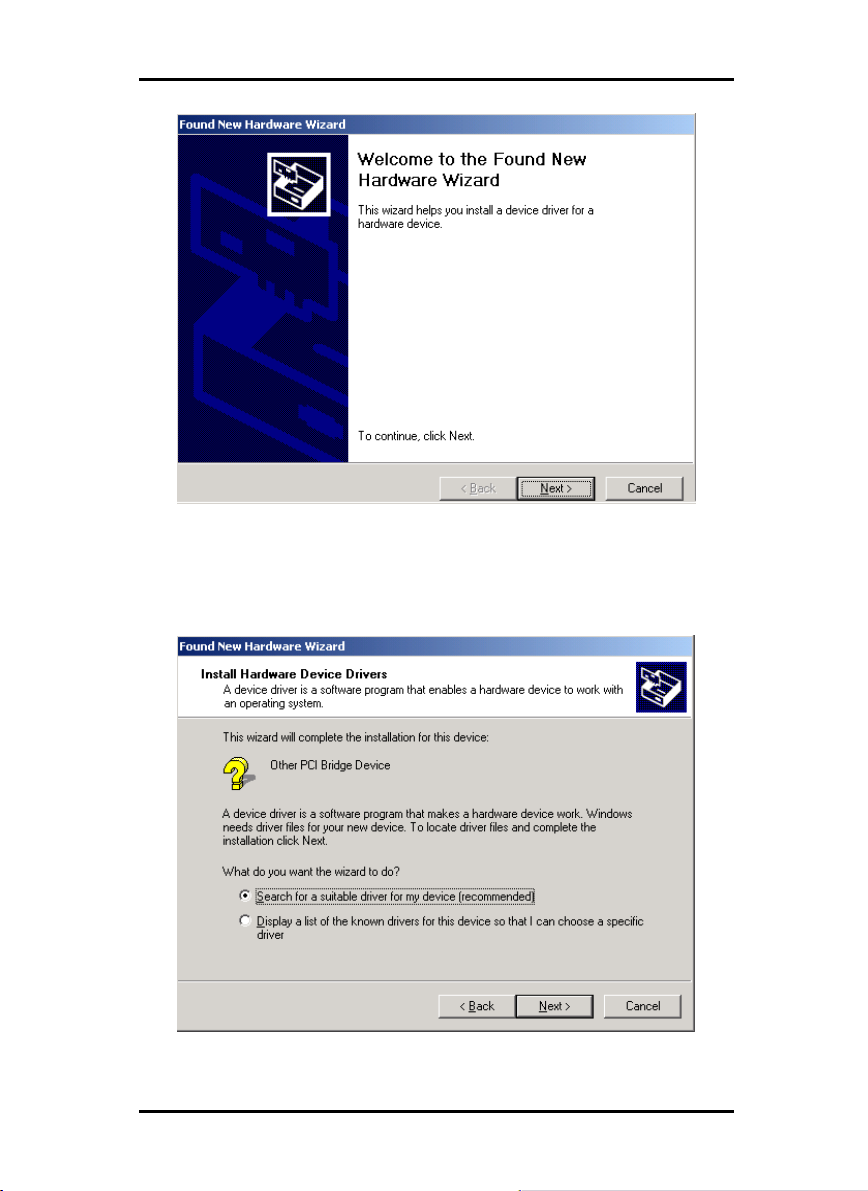
U1 Kernel Driver installation
Start your PC. After installing the Controller Board, the
operating system automatically reports that new hardware has
been found and that assistant has been started for installation
of the kernel-driver:
U1 Plot 13
Page 14
INSTALLATIONS AND SETTINGS ON THE SERVER-PC
Proceed as follows to install the driver:
1. Click on the “Next“ button to start the installation program.
2. In the next window the assistant asks where it can obtain the
Driver files required.
14 U1 Plot
Page 15
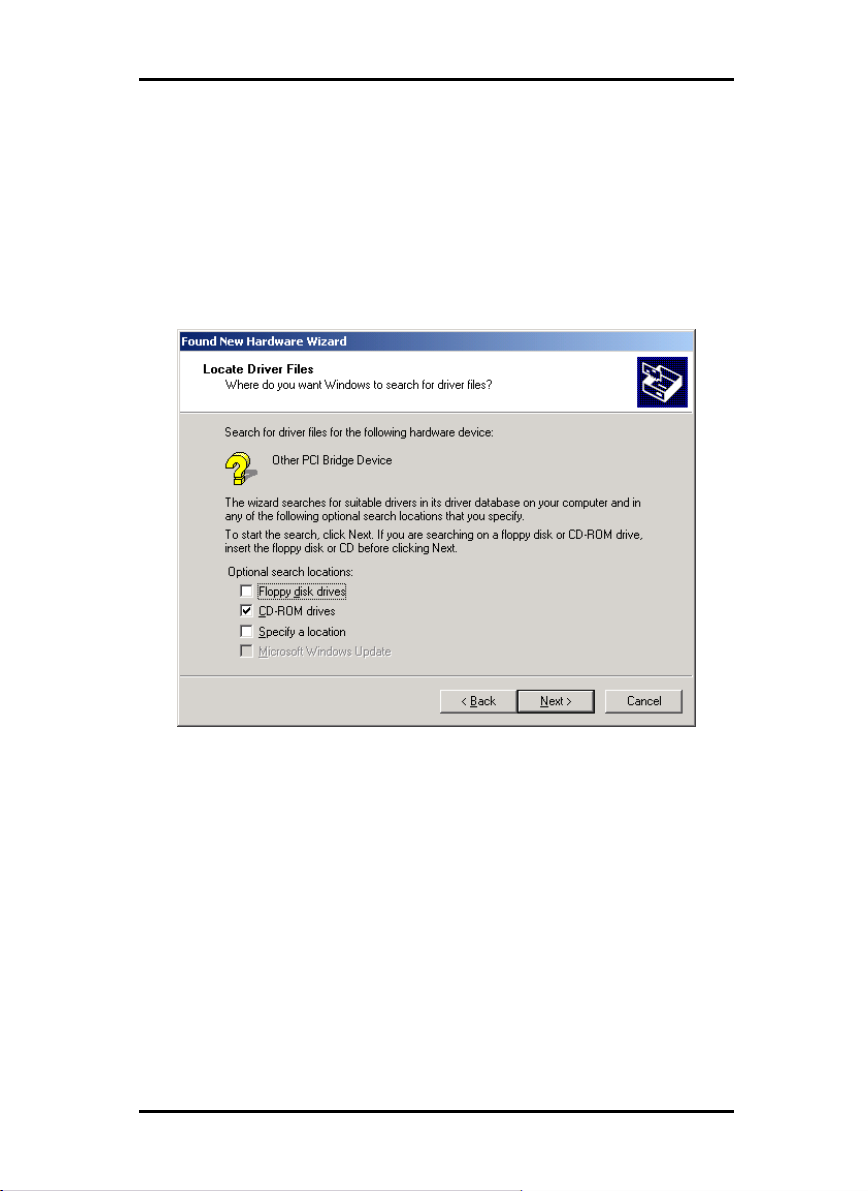
INSTALLATIONS AND SETTINGS ON THE SERVER-PC
Select the topmost option “Search for a suitable driver for
my device (recommended)“ and the click on “Next“, to
continue with the installation.
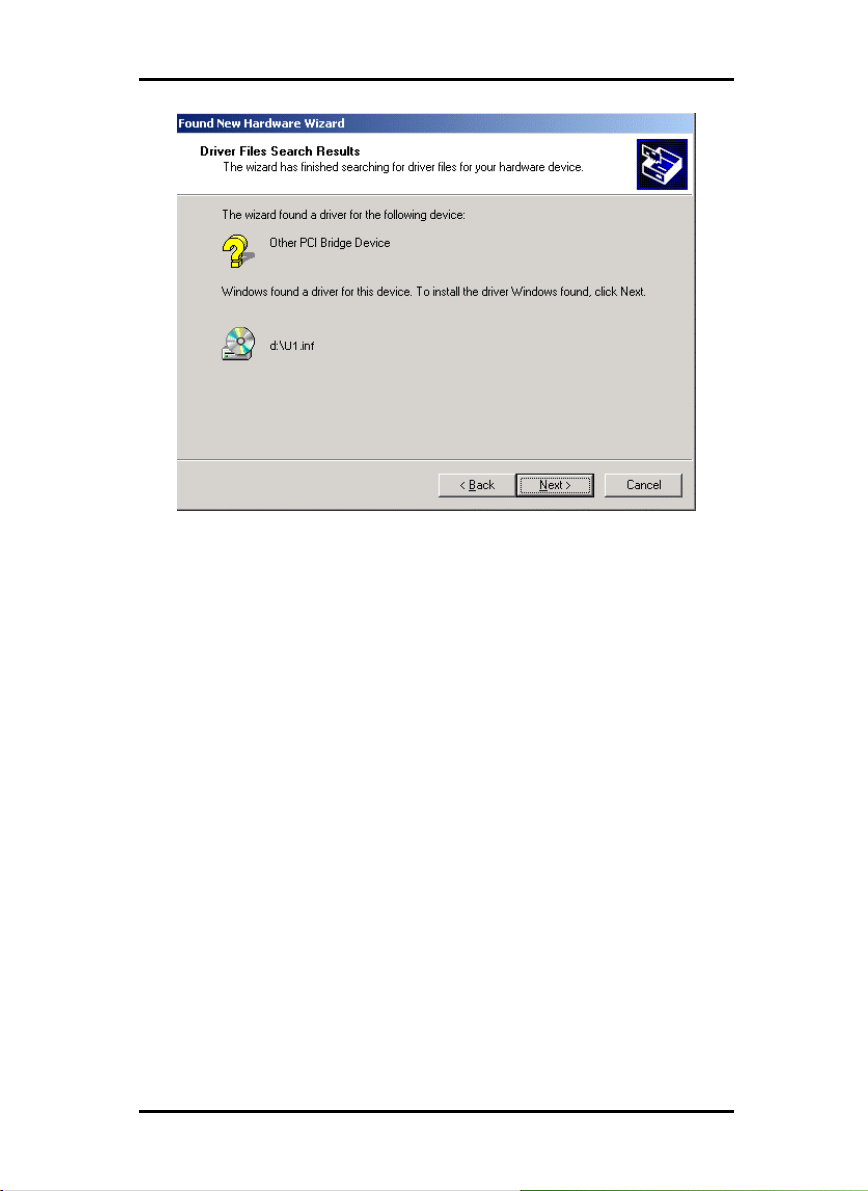
3. Insert the installation CD in your CD drive. If the installation
program of U1 Plot is starting automatically, close it with
„Cancel“.
4. The assistant now asks where it should look for the driver
files:
Select “CD-ROM drives“ and then click on “Next“.
5. In the next window you are now informed that the driver file
(U1.inf) has been found:
U1 Plot 15
Page 16
INSTALLATIONS AND SETTINGS ON THE SERVER-PC
Click on “Next“ to continue with the installation.
6. You are now informed that the driver files have been
installed. Click on “Finish“ to quit the installation program.
7. You can check the working of the kernel driver as follows:
Select on your desktop „My computer“ and open the context
menu by using the right mouse button. Select „Properties –
Hardware – Device Manager – LF Printer Interfaceboards –
U1.0 Board“. Open the context menu and select
„Properties“. Here you can find information about the status
of the Controller Board. If problems appear, please use the
Windows help.
Operating system adjustments
Several adjustments still have to be made to the operating
system for the cooperation between the server and clients as
well as the configuration of the scanner. These adjustments, as
well as the whole installation should only be carried out by an
administrator.
The procedures described in the following refer to the set up of
an individual computer. Should you wish to set up a network
computer, the configuration can differ slightly.
16 U1 Plot
Page 17

INSTALLATIONS AND SETTINGS ON THE SERVER-PC
After you have finished making the adjustments you must reboot
the computer.
Installing user accounts and groups
If you have to manage a big number of users we recommend to
install user accounts and groups. Especially if you use the FTP
protocol the installing of user accounts and groups is necessary.
Proceed as follows:
1. Open the “Control Panel“ via “Start – Settings – Control
Panel“. Open “Users and Passwords“ in the control panel.
Click on “Add”.
2. Enter the relevant information in the “User name“, “Full
name“, and “Description“ fields. Then click on “Next“.
3. You are then asked for the password. Enter a password and
confirm it by entering it again in the “Confirm password“
field below. Click on “Next“.
4. Select the “Standard user“ option in the next window. Click
on “Finish“.
Close any windows still open by clicking on “OK“.
You can find further explanations for that in Windows Help.
Activating Windows components
The adjustments listed in the following are necessary for correct
functioning of the U1 Plot program as well as for the connecting
the clients.
• SNMP: The settings for this protocol must be activated.
Proceed as follows:
1. Open the settings window with “Start – Settings –
Control Panel – Add/Remove Programs - Add/Remove
Windows Components“.
2. Activate the “Management and Monitoring Tools”
(SNMP) option by clicking on the check box.
3. Click on “Next“ and follow the instructions given in the
further windows.
After you have activated all the services required, adjust the
settings so that the “TCP/IP Print Server“ is automatically started
when the computer is started up.
U1 Plot 17
Page 18

INSTALLATIONS AND SETTINGS ON THE SERVER-PC
To do this, proceed as follows:
1. Click once on the “My computer“ desktop.
2. Open the context menu using the right hand mouse button
and select “Manage“. The “Computer Management“
window opens.
3. Double click “Services and Applications“ so that the
secondary directories are shown. Now double click on
“Services“.
4. Double click on “TCP/IP Print Server“. Set the “Automatic“
option in the window under “Startup Type“.
5. Close all windows.
Settings for the Response function
Users can be informed of successful completion of their jobs by
an in-house or external mail system. For using the E-Mail
option, Microsoft Outlook Express or Microsoft Outlook have to
be installed on the server. Another prerequisite is that you have
installed “Internet Mail“ using the Windows setup.
Further informations about installing your e-mail program you
can get in the Windows Help or your mail program manual.
Installation of U1 Plot
This section describes the installation of the program. We
recommend not to install the program on the drive where you
have already installed your operating system.
To install the program, please proceed as follows:
1. Start for Windows 2000 installation as a user with
administrator rights.
2. If Windows 2000 has already been started [with
administrator rights], close all programs that are running
and secure all the data.
3. Place the installation CD in your drive. The installation
program is now started automatically. If not, open the
Windows Explorer window and double click on the
“Setup.exe“ file in the “ManualSetup\Server\U1Plot" “ CDfolder.
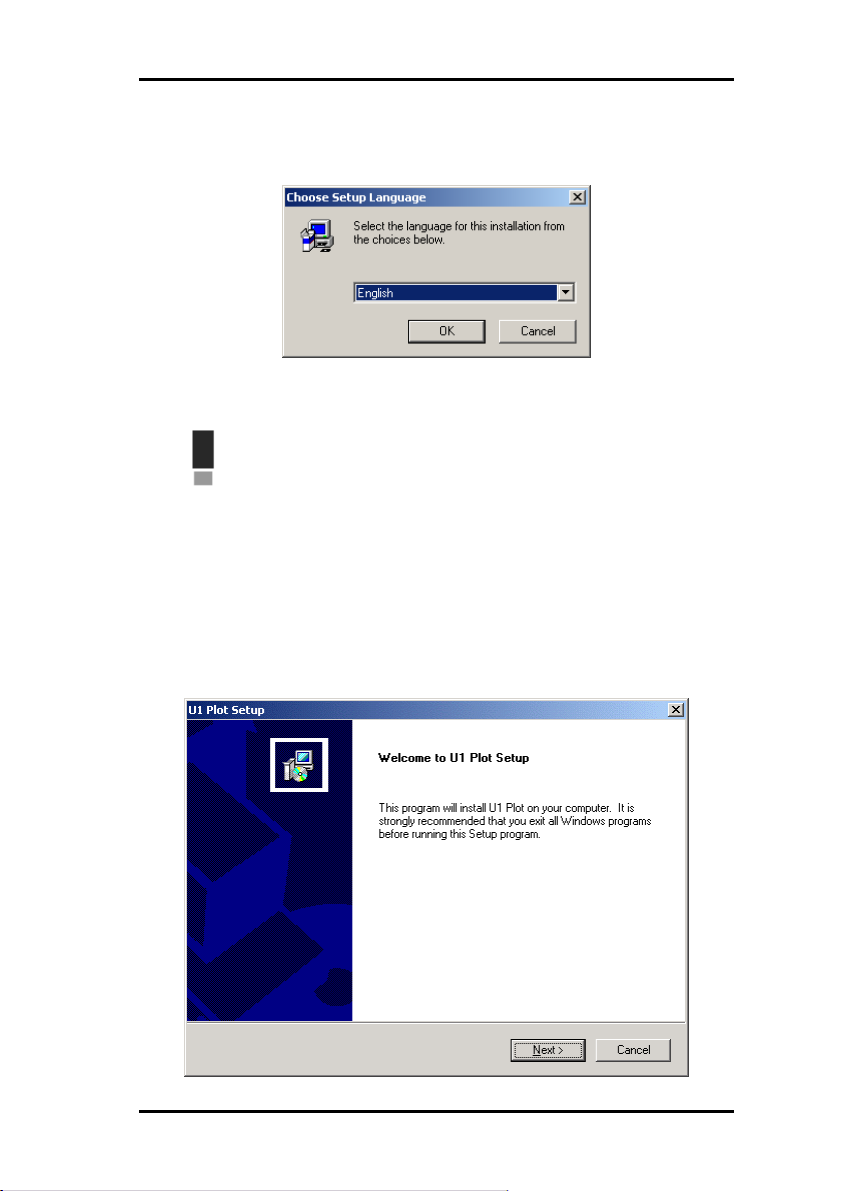
4. Firstly you can select a language for the installation from
18 U1 Plot
Page 19
INSTALLATIONS AND SETTINGS ON THE SERVER-PC
the list box of the next window. This language will also be
used later in the installed programs.
Confirm with “OK“.
Attention: It is imperative that the SNMP protocol has
been installed on your computer so that the data
exchange between the server and clients functions. An
error message appears, if you have not installed an
SNMP protocol. Read the chapter on “Operating
system adjustments“, on Page 17, to find out how to
set up the SNMP protocol. Start again with step 3.
5. A new window opens:
U1 Plot 19
Page 20
INSTALLATIONS AND SETTINGS ON THE SERVER-PC
Follow the instructions given in the window: Close any
Windows programs, which are still open. Then click on
„Next“.
6. Click on „Yes“ in the next window if you agree to the
license agreement terms. Click on „No“, if you do not
agree to them and wish to cancel the installation.
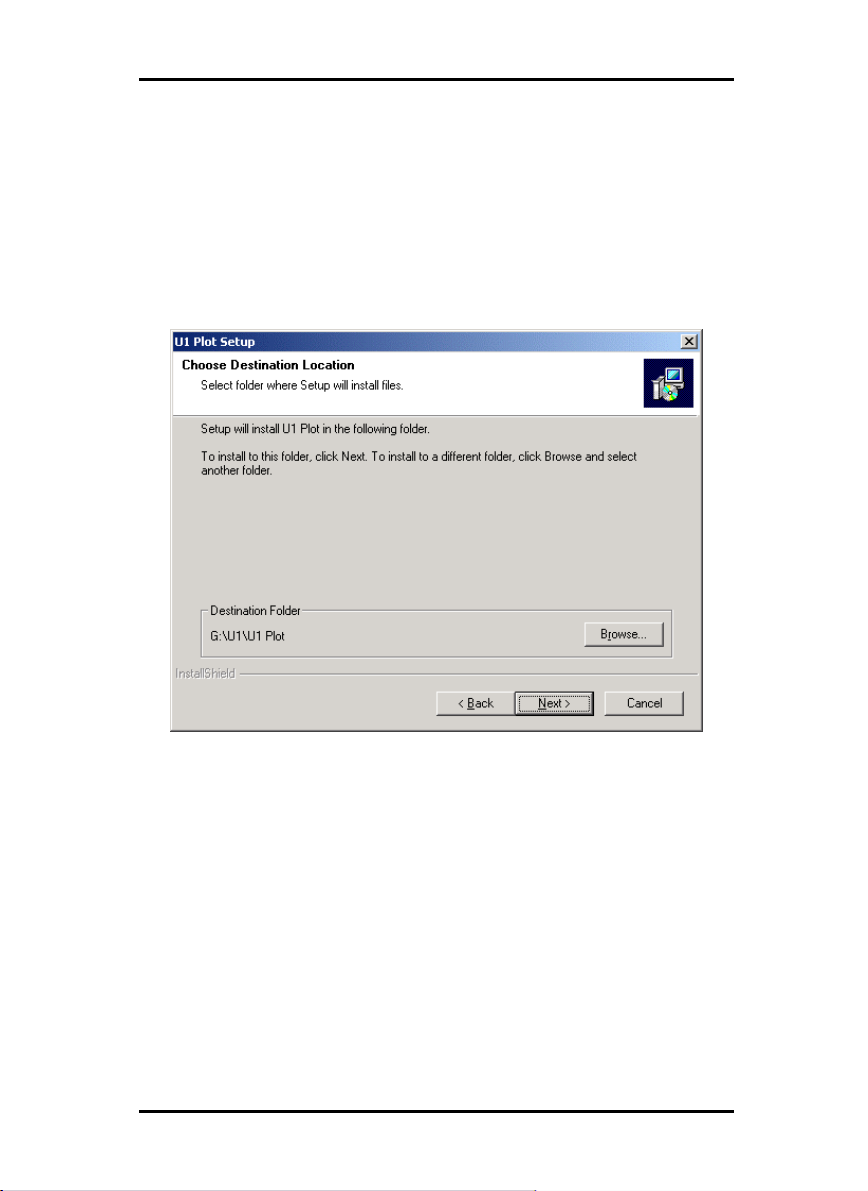
7. In the next window you are suggest a target path for the
program.
Confirm the suggestion with “Next“ or select another target
folder.
20 U1 Plot
Page 21
INSTALLATIONS AND SETTINGS ON THE SERVER-PC
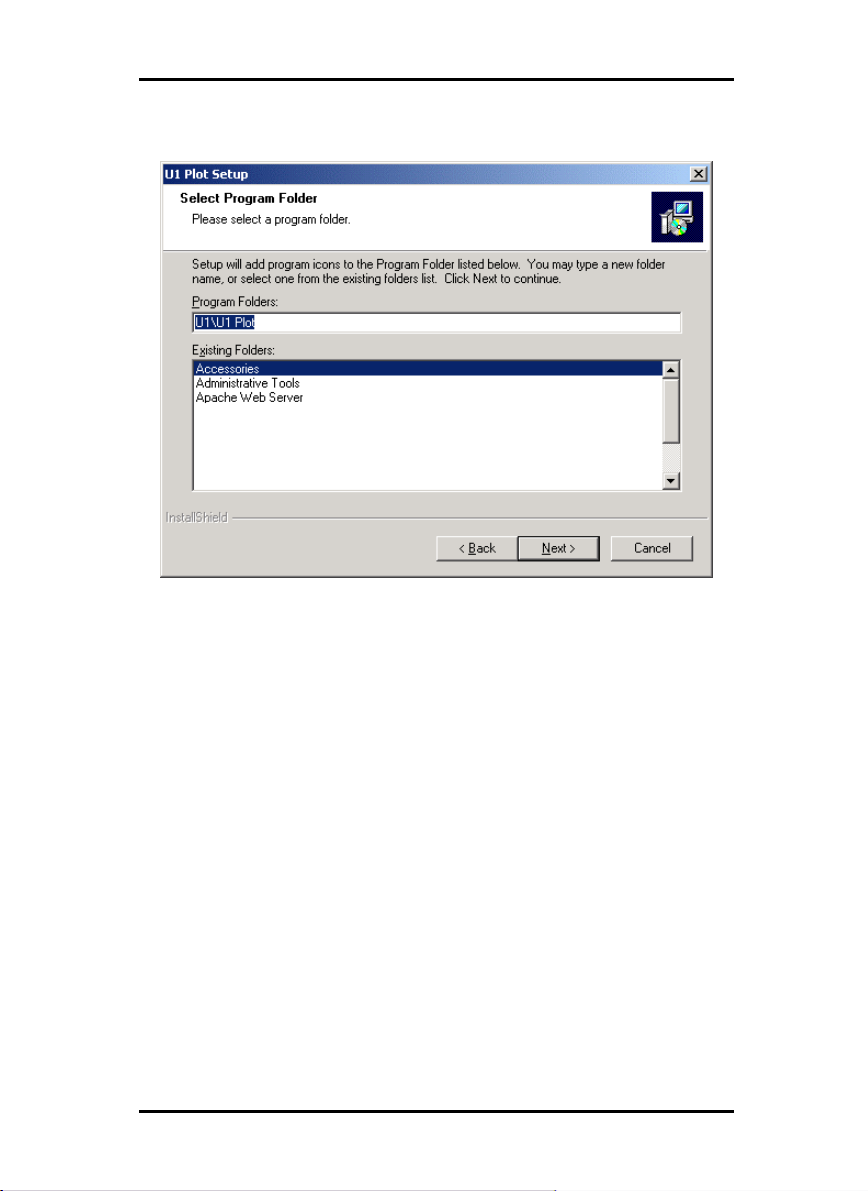
8. A program folder is now suggested.
Enter another folder name or confirm the suggested name
by clicking on “Next“.
9. The next dialog informs you, that the license files (RSP) will
be installed now. You are requested to insert the license
disk into the disc drive. Then click „OK“.
10. A new window is open.
U1 Plot 21
Page 22
INSTALLATIONS AND SETTINGS ON THE SERVER-PC
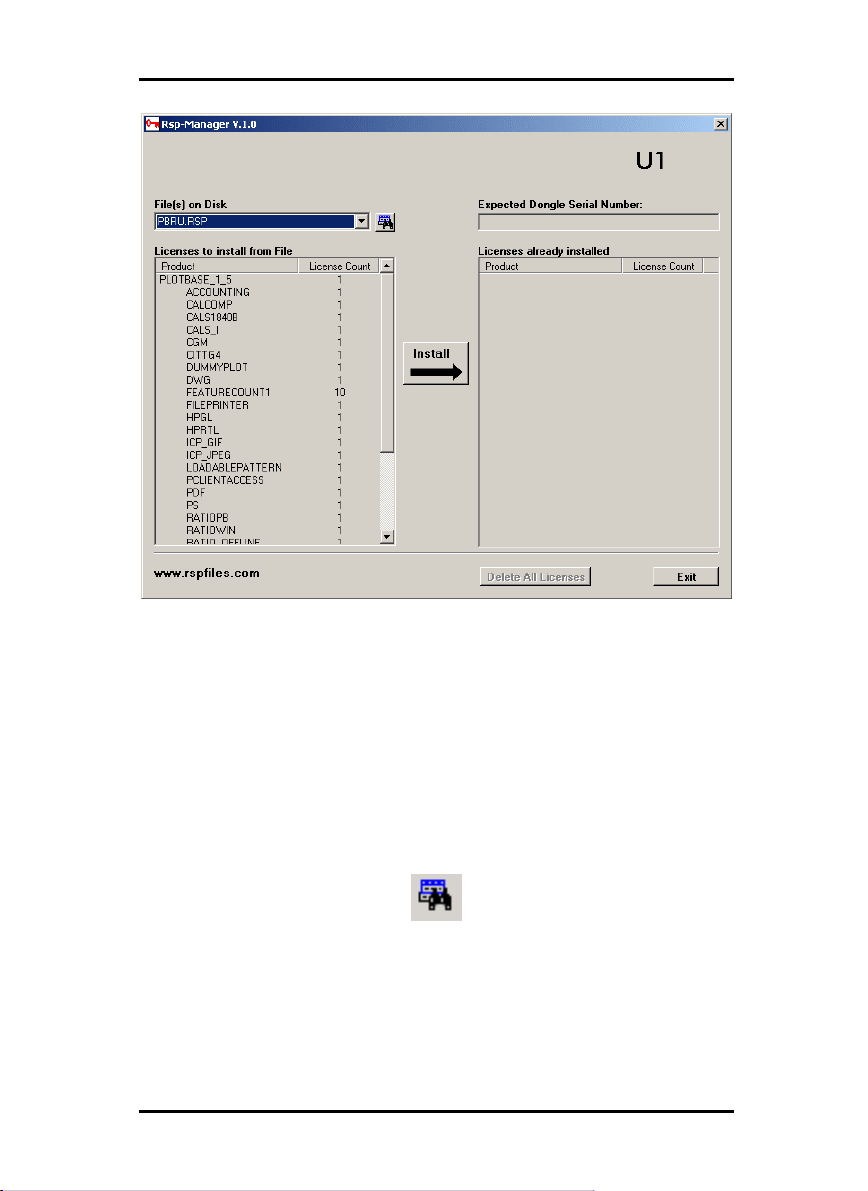
You have the choice to install the standard program
version or a demo program version. The demo program
version can be used to demonstrate the program options,
which you can additionally buy from your dealer. However
each scanned file and each print out is marked by stamps.
After you have tested the demo program version, you can
remove it by installing the license file of the standard
program version (License.rsp).
Install a license file as follows: In the top of the window you
can see a small searching symbol.
Click it to open a file selection dialog. Afterwards select a
license file (*.rsp), which is on your license disk, and
confirm the selection with „Open“. Click „Install“. The
license files will be copied in the correct folder. Close the
window.
22 U1 Plot
Page 23
INSTALLATIONS AND SETTINGS ON THE SERVER-PC
11. You can now complete the installation by clicking on
“Finish“ in the straight opened window.
Extend licenses
You can extend the functions of this program. To do this, you
must install a new license file, which you can obtain from your
dealer or the manufacturer. To install the file you require local
administrator rights for the U1 Plot computer. Install the file as
follows:
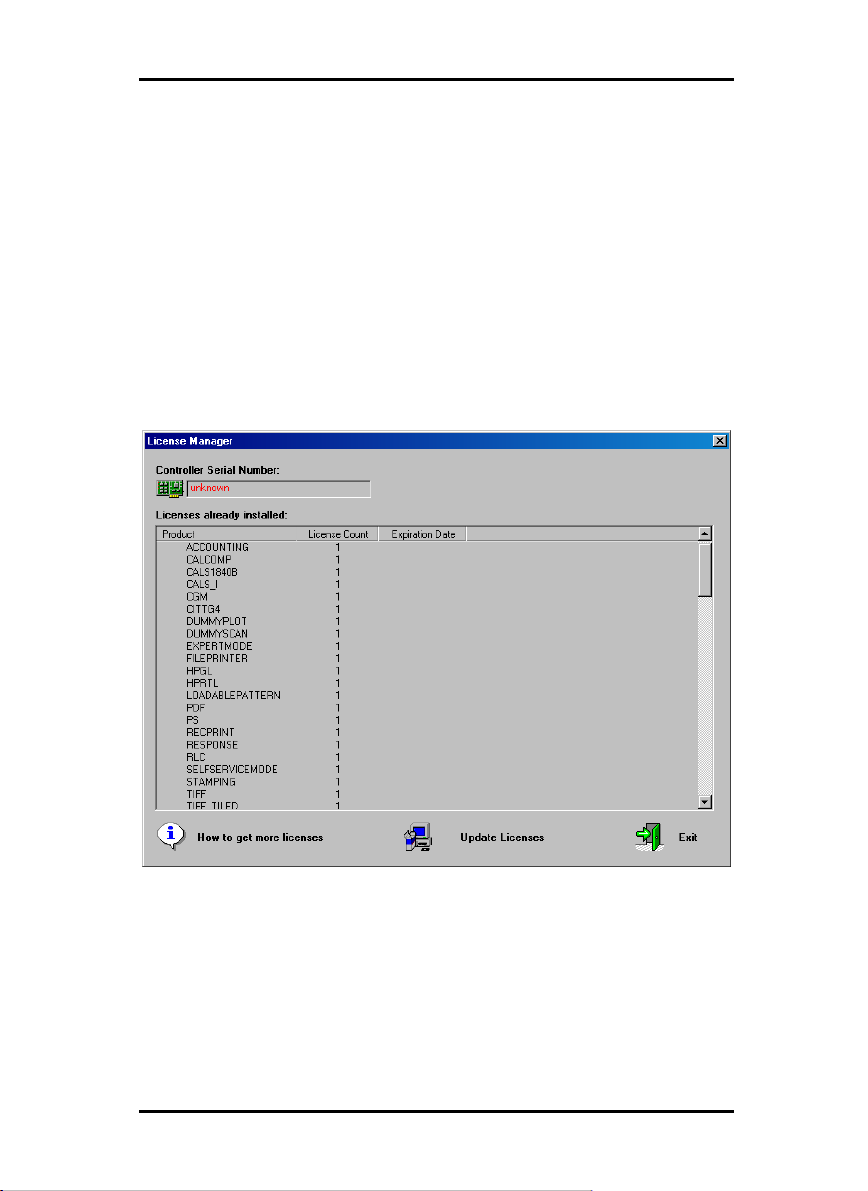
1. First open a dialog with the menu command “Help –
License Manager“.
The current licenses that are already installed are first listed
in the window.
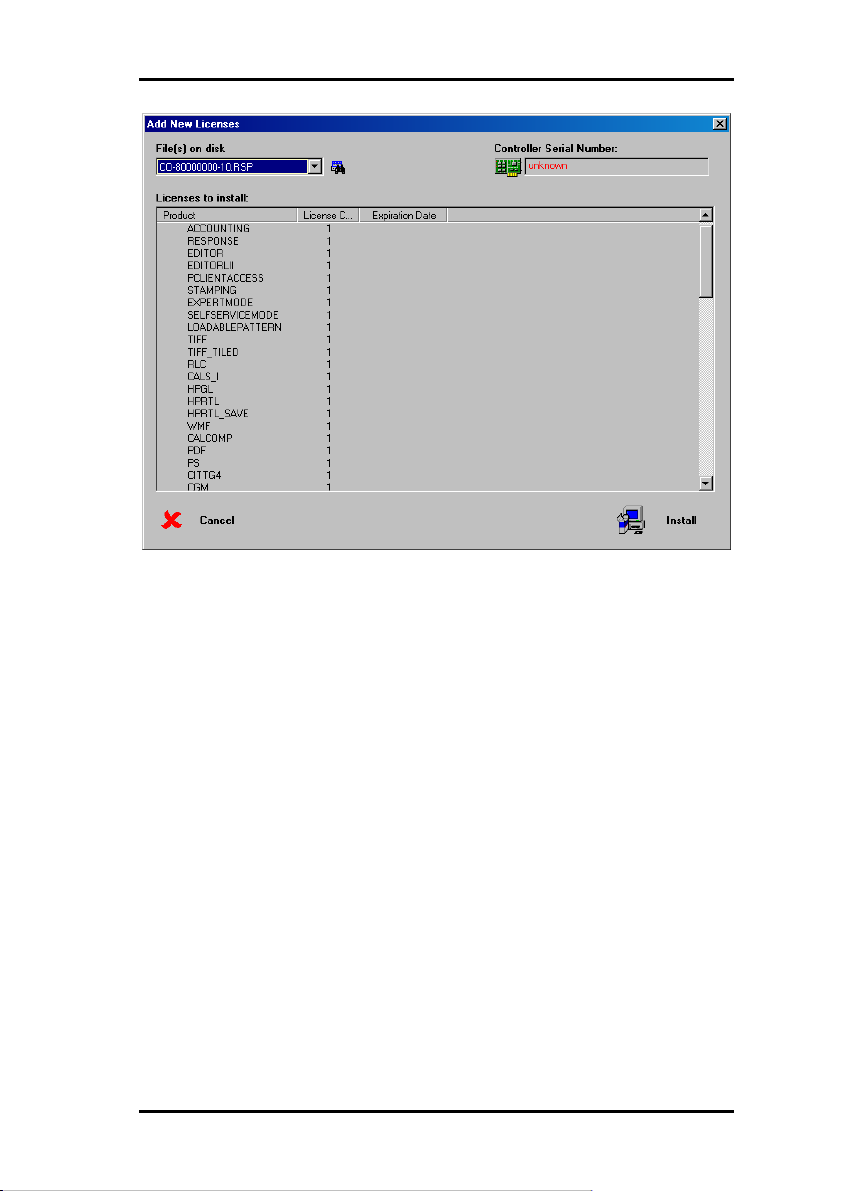
2. If you now wish to install the new license file, please click
on “Update licenses “. The following window opens:
U1 Plot 23
Page 24
INSTALLATIONS AND SETTINGS ON THE SERVER-PC
3. You can see a small search symbol in the top of the
window. Click on this symbol to open a file selection. Then
select the new license file (*.rsp), which you have saved on
you computer (or diskette) and confirm the selection with
“Open“.
4. You can now read through the window and check whether
all the required options are contained in the file. Then click
on “Install“ in the lower section of the window. You will
then be asked whether you really want to install the license
file and overwrite the old file. Confirm accordingly.
5. Restart U1 Plot so that you can use the new options.
24 U1 Plot
Page 25

INSTALLATIONS AND SETTINGS ON THE SERVER-PC
Installation of U1 WINPRINT
The Windows printer driver U1 WINPRINT allows print jobs to
be recorded from Windows applications, to then pass them on
directly to U1 Plot as a plot job.
Install the printer driver as follows:
1. Open the cd installation folder <CD
drive>:\U1\Clients\WINPRINT. You can also find this
folder on the installation CD. Start the file “Setup.exe“. The
installation program starts.
2. An information window opens at first. After you have read
the notes, click on „Next“.
3. In the next window you are asked to confirm the prescribed
port name by clicking on “OK“.
4. Confirm the printer name, that means the name of the
printer driver.
5. Confirm the shared name of the printer driver in the next
windows.
6. Detect which operating systems are installed on the client
PCs, which will use U1 WINPRINT for printing. If it is
Windows 95, 98 or ME, click on „Yes“ and confirm it with
„Next“.
7. If one of the appointed operating systems (Windows 95, 98
or ME) is used, more files are required, that probably may
not be installed on your PC. In that case put corresponding
installation CD of Windows into the drive or select a
network path, if the installation files are on a server PC.
8. The installation is finished successfully.
9. Now you have to confirm the spooler folder by opening
„Start – Settings – Printer“.
10. Select printer driver U1 WINPRINT.
11. Select „Properties“ in the context menu (right mouse
button). Select the tab „Port“.
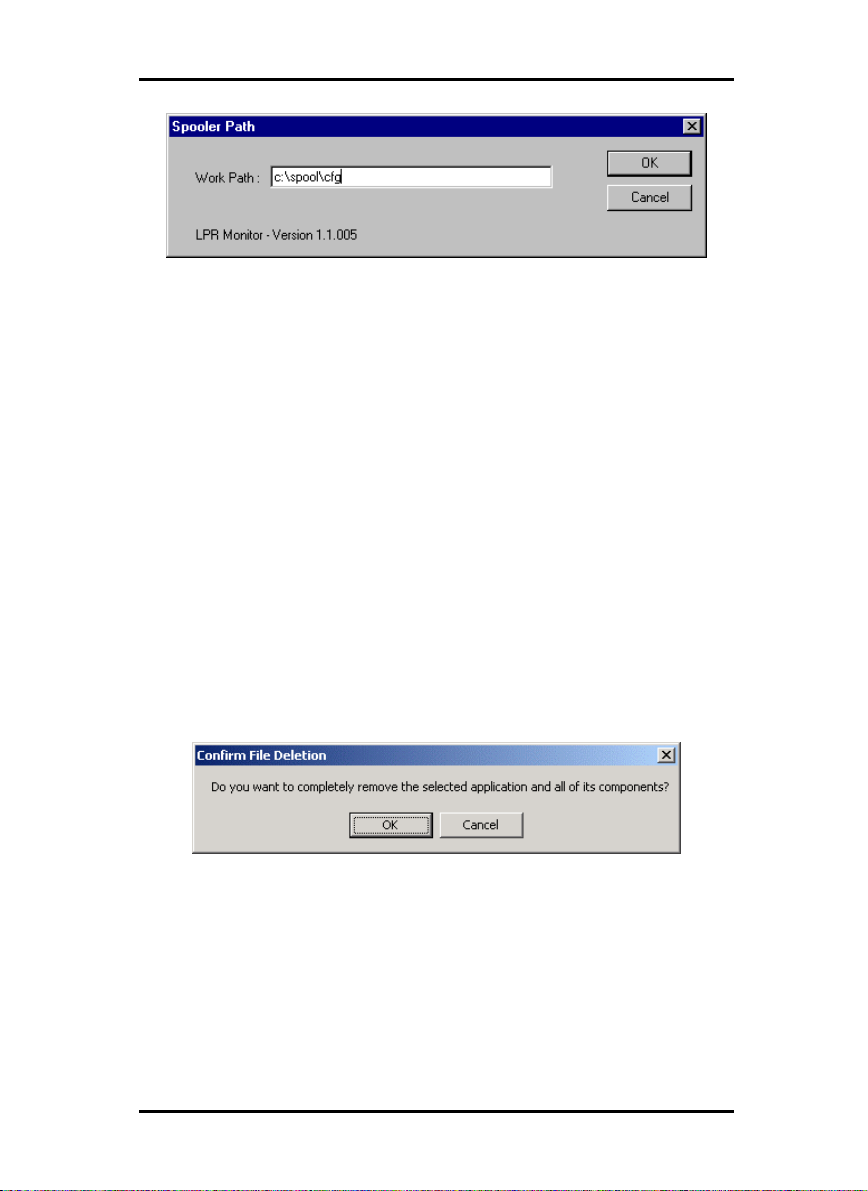
12. Open the following window with „Configure“ and confirm
the spooler folder:
U1 Plot 25
Page 26
INSTALLATIONS AND SETTINGS ON THE SERVER-PC
As a standard spooler folder is set on c:\spool\cfg. If you
installed the spool folder of U1 Plot on another drive, you
have to change the drive path.
Updating U1 Plot
To update the program, please proceed as follows:
1. Start for Windows 2000 installation as a user with
administrator rights.
2. If Windows 2000 has already been started [with
administrator rights], close all programs that are running
and secure all the data.
3. Place the new installation CD in your drive. The installation
program is now started automatically. If not, open the
Windows Explorer window and double click on the
“Setup.exe“ file in the “Install“ CD-folder.
4. After the setup program has detected an old program
version of U1 Plot, a new window will be opened:
You have to delete the old version first. If you want to do
this click “Ok”.
5. When the older version has been removed you can start the
setup.exe again. If you have updated U1 Plot, you also have
to update the U1 PLOTCLIENTS. Follow the instructions of
the manual U1 PLOTCLIENTS or the corresponding section
of the Installation Manual.
26 U1 Plot
Page 27

INSTALLATIONS AND SETTINGS ON THE SERVER-PC
Installation Problems
PC doesn’t start
The Controller-Board is defective. Use another board.
Kernel driver does not start
Error in COMPAQ BIOS I. Especially on COMPAQ computers
the controller does only work, if the PC is equipped with at least
128 MB of RAM memory.
Make sure that your COMPAQ PC has at least 128 MB of RAM
memory.
Plotting speed too slow
• Lack of RAM memory on PC. If the PC is „swapping“ all the
time (the harddisc is continuously operating), add more
memory to your PC. If you are not sure add at least 256
MB.
• CPU blocked by other application. Shutdown other
application.
• Usage of complex data formats. When using Postscript or
CGM data the processing time is quite high. For highest
performance use HPGL or TIFF data format.
U1 Plot 27
Page 28

INSTALLATIONS AND SETTINGS ON THE SERVER-PC
28 U1 Plot
Page 29

Part II - U1 Plot
U1 Plot 29
Page 30

START AND QUIT PROGRAM
Start and quit program
Although you have to install U1 Plot as a user with administrator
rights, only the rights of a standard user are required to use the
program.
Attention: U1 Plot cannot be used in multi-user
mode. I.e., the program can only be accessed under
one user name.
• Start program
At the end of the installation, the installation program sets up its
own program group with the icon. To start U1 Plot, open the
program from the “Start“ bar or double click on the program
symbol on the desktop.
• Quit program
You can either quit U1 Plot via the menu bar with “File - Exit“ or
using the standard Windows keyboard shortcut “ALT+F4“.
The following part of the manual describes the program’s
functions.
30 U1 Plot
Page 31

PROGRAM WINDOW
Program window
U1 Plot 31
Page 32

PROGRAM SEQUENCE
Program sequence
This chapter provides you with an overview of how a drawing is
placed in the U1 Plot job list and then printed. A graphic at the
end of the chapter illustrates the job flow graphically.
We recommend that you read this chapter at least once so that
you know how a drawing is processed from when it is produced
through to the U1 Plot job list. Together with the introduction
chapter on Page 6ff, this chapter is intended to help you to
understand the environment and the embedding of the program
within it.
Furthermore, the most important terms used in the program are
also explained.
Naming conventions
Job:
A job is a job order, which includes at least one entry or set of
entries, which concern the combination of individual to be
printed using the plotter. The job can be prepared by an U1
PLOTCLIENTS and can contain an unlimited number of entries.
User:
The user prepares the jobs using U1 PLOTCLIENTS. The user
can simultaneously be the client.
Entry:
An entry is a drawing with the corresponding description
required for U1 Plot. This description contains all the
information about the drawings such as the format, media type,
number of copies, etc. Entries are put together in U1
PLOTCLIENTS to produce jobs or can also represent an
individual job.
The entries or drawings can have the following file formats,
which are identified by U1 Plot by their file extensions:
• Calcomp ......................................................(*.906, *.907)
• CALS [to MIL-STD-1840B] .........................................(*.cal)
• CALS [to MIL-STD-28002A] .......................................(*.cal)
32 U1 Plot
Page 33

PROGRAM SEQUENCE
• Intergraph ........................................................(*.cit; *.tg4)
• HP-GL [/2, RTL] ................................................. (*.plt; *.rtl)
• PCX......................................................................... (*.pcx)
• RLC ...........................................................................(*.rlc)
• T6X ..........................................................................(*.t6x)
• TIFF .......................................................................... (*.tif)
[Group 3,4; uncompressed; packbits; striped & tiled]
• Windows / OS2 Bitmaps ........................................ (*.bmp)
• Windows Meta File..................................................(*.wmf)
The following are available as an optional:
• CGM......................................................................(*.cgm)
• PDF, Postscript ................................................. (*.pdf, *.ps)
The following are available with AutoCAD 2000 or 2000i
installed:
• DWG .....................................................................(*.dwg)
Note: A more precise definition of the file formats that
can be used is given in the appendix.
SSL file:
The SSL file is produced automatically by U1 PLOTCLIENT when
an order is prepared and contains all the information about the
job itself as well as all the descriptions of the individual entries.
The SSL file is required by U1 Plot to print off a job on the
plotter.
U1 PLOTCLIENTS:
U1 PLOTCLIENTS are programs with which the user can collate
drawings or entries to form jobs, to then print them via U1 Plot.
When preparing the order, the user enters all the information
for the individual entries, which are required for the print and
which are automatically written in an SSL file. This information
can include, e.g.: format, media type, number of copies and
border details.
U1 Plot 33
Page 34

PROGRAM SEQUENCE
Draftsman/woman:
The [technical] Draftsman/woman prepares the drawings for the
client, which can later be collated by the user to form jobs.
From the drawing to the job
The following describes the path of a drawing from when it is
prepared through to the U1 Plot job list. The work steps are
illustrated functionally and not related to persons, i.e. several
functions can be carried out by the same person.
In this example, the U1 PLOTCLIENT is interfaced with the U1
Plot, however you can easily use another possibility.
Note: More information on using U1 PLOTCLIENTS is
given in the manual of the same name.
With the help of this section, the following graphic and the first
chapter of the manual, you should be able to understand the
tasks and possible applications of U1 Plot and the environment.
1. PRODUCTION:
The [technical] Draftsmman/woman produces the drawing
using an EDM, CAD or similar system and saves it in one of
the following formats, which are identified by U1 Plot by way
of the file extension:
• Calcomp ......................................................(*.906, *.907)
• CALS [to MIL-STD-1840B] .........................................(*.cal)
• CALS [to MIL-STD-28002A] .......................................(*.cal)
• Intergraph ........................................................(*.cit; *.tg4)
• HP-GL [/2, RTL] ................................................. (*.plt; *.rtl)
• PCX......................................................................... (*.pcx)
• RLC ...........................................................................(*.rlc)
• T6X ..........................................................................(*.t6x)
• TIFF .......................................................................... (*.tif)
• Windows / OS2 Bitmaps ........................................ (*.bmp)
• Windows Meta File..................................................(*.wmf)
34 U1 Plot
Page 35

PROGRAM SEQUENCE
The following file formats can be read by U1 Plot, if a
corresponding license has been purchased:
• CGM......................................................................(*.cgm)
• PDF, Postscript ................................................. (*.pdf, *.ps)
The following are available with AutoCAD 2000 or 2000i
installed:
• DWG .....................................................................(*.dwg)
Note: A more precise definition of the file formats that
can be used is given in the appendix.
A second possibility is to produce the drawing using U1 Scan
and to save it in the suitable format.
2. TRANSFER:
The [technical] Draftsman/woman transfers the files with the
drawings to the user, who uses U1 PLOTCLIENT to put
together the print jobs. The files are then sent via the network
[LAN, Intranet or Internet] to the directories provided.
3. DRAG & DROP:
The user fetches all the drawings intended for plotting into
U1 PLOTCLIENT either using Drag & Drop or using the
“Insert or add entry “ functions.
4. SET CREATING and PLOT SETTING:
The user puts together the drawings in U1 PLOTCLIENT to
form jobs, assigns the priorities for the print, sets the
formats, media types, border settings and much more and
checks the drawing using the check view.
5. SENDING PLOT FILE:
As soon as the user has prepared the jobs, they
automatically send it via the network [LAN] using the
program command “File – Print SSL“ to the directories
provided, thus making it available for U1 Plot to print.
You can change or create a SSL file. Please ask your dealer
or support technician for further details about creating a SSL
file.
U1 Plot 35
Page 36

PROGRAM SEQUENCE
6. COLLECTION:
U1 Plot regularly reads the directories and checks whether
there are any new jobs. As soon as a job is available, it is
read in by U1 Plot and immediately appears in the job list.
7. U1 Plot:
The jobs in are now available in the job list for plotting.
However, before plotting you can still make changes to the
print properties. You can accompany the automatic
progression of the program using the status observations
and the error control and can intercept at any time, if
necessary for urgent jobs, to stop jobs or because of error
messages.
36 U1 Plot
Page 37

TOOLS
Tools
This section gives you a brief overview of the program’s tools,
which you can activate using the four tool bars as well as the
information, which is displayed in the status bar. All toolbars
can be freely positioned at the sides, at the top below the menu
bar and at the bottom below the status bar. You can blank out
and insert the toolbars using the “View“ menu.
The following chapter then explains the function and use of the
signal lights. Furthermore, a brief section also explains the
function of the right-hand mouse button, which you can use to
comfortably start and carry out functions, without having to use
the menu bar.
Job toolbar
The “Job“ toolbar is located directly beneath the “File“. The five
buttons have the following significance:
Send job to the plotter
Delete job
Save job
Open job information
In the job list, jump to job currently being printed
Entry toolbar
The toolbar for editing an entry is located on the left-hand edge
of the monitor after the program is started up for the first time
The buttons have the following significance:
U1 Plot 37
Page 38

TOOLS
Add entry at the end of the entry list
Insert entry in front of the marked position in the entry
list
Delete entry from the entry list
Viewer toolbar
The viewer bar is located on the right-hand side of the monitor
after the program is started for the first time, next to the preview
window, in which the individual drawing is shown:
Attention: These settings have no effect on the
printing result. You can just change the view of the
picture in the file viewer.
The buttons have the following significance, moving from right
to left:
Rotate drawing 90° to the left
Rotate drawing 90° to the right
Rotate drawing by 180°
Drawing in original position
Successively enlarge drawing
Successively reduce drawing
38 U1 Plot
Page 39

TOOLS
Switch over to zoom all of drawing
Switch over to 1:1 view of drawing
Multipage document: Show first page
Multipage document: Go back one page
Multipage document: Enter target page
Multipage document: Move forward one page
Multipage document: Show last page
Show drawing in black & white view
Show drawing in grey scale view
Show drawing in darker view
Show drawing in lighter view
Information about the overall settings of a drawing
currently loaded
Pause function
The pause function enables you to quickly interrupt a print, if
problems occur during plotting.
You can click this button, if it is blue. After activating
the print is interrupted.
U1 Plot 39
Page 40

TOOLS
You can click this button, if it is blue. After activating
the pause is cancelled and the print is continued.
U1 Plot signal lights
The U1 Plot signal lights shows the status of a print job as well
as the automatic function:
The three round areas describe the respective print status using
three different colors:
• Red field:
A print problem is indicated if the left-hand field is red. The
precise cause is described in the status window.
• Blue field:
If the middle field is blue, this indicates that the user has to
act. It can be a necessary operating of the bypass tray.
These print jobs are also blue-marked in the job list.
• Green field:
If the right-hand round area is green, a print is currently
underway. This display disappears as soon as the job order
has been accepted and processed by the plotter.
You can activate or deactivate the automatic print function by
clicking on the right-hand quadratic symbol. You can see a
cross on this button, if the function is deactivated. In this case
the print jobs arriving from other programs are not
automatically sent to the plotter and are not automatically
printed. But you can send a selected print job manually to the
plotter using the menu command „Job – Print“ or the command
„Print“ in the context sensitive menu.
40 U1 Plot
Page 41

TOOLS
Status bar
The status bar is located on the lower edge of the monitor and
provides you with the following four sets of information seen
from left to right:
• Account: SDF (Standard Delimited Format) and form file
for the account function is activated (On) or deactivated
(Off). Presetting is “Off”. This function is explained on page
54.
• Log file: Logbook file is activated (On) or deactivated (Off).
Presetting is “Off”. This function is explained on page 54
(see “Response”). It is irrelevant for normal users.
• Units: Current valid size unit: You can adjust the size unit in
the configuration program. Presetting is “mm”. This function
is explained on page 54.
• Response: The function is activated (On) or deactivated
(Off). Presetting is “Off”. This function is explained on page
54.
• Autoplot: Currently set plot mode: On/Off. You can
activate the Autoplot mode using the “Plotter“ menu, the U1
Plot signal lights or using “CTRL + A“. Presetting is “Off”. A
more detailed explanation you get on page 105.
• Reader: Activation of the reader (On/Off). Presetting is
“On”. A more detailed explanation you get on page 43.
• Current size of the drawing in the units set (in this example:
millimeters) and resolution in DPI.
• Toggle the keypad functions (here: NUM).
Context menu
U1 Plot provides an additional comfortable mouse function for
use during your work in the job list and in the entry list . In
general, you carry out all work using the left-hand mouse
button. In addition, you can also select so-called context menu
U1 Plot 41
Page 42

TOOLS
commands using the right-hand mouse button, without having
to mode to the menu or toolbar. You open the menu using the
right-hand mouse button and select the command using the
left-hand mouse button.
The commands that you can select using the context menu are
listed in the following. Cross-references to the chapters that
explain the commands in more detail are given after these.
The following commands are in the job list:
• Plot,
• Priority [set], Pages 63, 61
• Status [set], Page 63
• Job info, Page 67
• [Job] delete, Page 106
• Cancel Job, Page 107
The following commands are in the entry list:
• [Entry] Delete, Page 81
• [Entry] Insert, Page 80
• [Entry] Add, Page 80
You can open a context menu in the edit fields of the “Sorting“
in which you will find several standard commands: Undo, Cut,
Copy, Delete, Select all.
42 U1 Plot
Page 43

CONFIGURATION
Configuration
The following chapters describe how you can use the
“Configuration“ menu to alter the program settings.
Reader
The reader has the task of interpreting the print jobs arriving in
the spool folder and to edit them so that they can be processed
by the plotter. This function can also be used for error searching
and -relieving, which is made by your administrator.
In the configuration menu you can activate or deactivate the
reader by clicking on the menu command “Reader on/off“. This
function should be activated just by the way. No more print jobs
are processed if the reader is deactivated.
Postscript and PDF (Options)
As an option, U1 Plot can also read the Postscript format and
PDF format. You can open the settings for these formats using
the “Configuration - Postscript Default settings“ menu:
“General“ tab
On the “General“ tab you can alter the protocol and font path
settings:
U1 Plot 43
Page 44

CONFIGURATION
• Ghostscript-Logging:
If you activate these options, the Postscript or PDF actions of
the program are also logged. This gives the possibility of
obtaining further information in case of problems. The file
has the name RATIO_PS.LOG, is temporarily stored in the
TEMP folder of Windows and can be opened using a simple
text editor.
• Use automatic scaling:
Postscript files, that do not correspond with the DSC
standard, can’t displayed in the right size. If you activate this
option, the drawings can be adjusted to the required
configuration settings with respect to the drawing size. This
option should be activated all the time.
• Additional font paths:
The standard path only is initially given in the field. The font
path refers to a folder, in which the fonts are stored. If you
wish to refer to other font paths, ask your dealer or support
technician.
“Fonts“ tab
U1 Plot supports:
Type 0 = Composite Fonts
Type 1 = Basic Postscript fonts
44 U1 Plot
Page 45

CONFIGURATION
Type 3 = user-defined fonts
Type 4 = Type 1 fonts with a BuildChar or BuildGlyph
procedure
and TrueType Fonts under Windows.
The available fonts are listed on the “Fonts“ tab, insert new
Fonts or add aliases or delete fonts:
• Fonts list:
The fonts currently available are given in the font list.
• Add font:
To add a font, carry out the following steps:
1. Click once on the “Add Font“ button, to add a new font.
2. In the following dialog, click on the folder selection button,
and change over into the required folder with the additional
fonts.
3. Click once on the font, which you wish to add and quit the
dialog by clicking once on the “Open“ button.
4. Enter the name of the selected fonts in the following window
under the “Font Name“, and close the whole dialog by
clicking on OK.
U1 Plot includes the new font in the font list.
U1 Plot 45
Page 46

CONFIGURATION
Attention: If you want to add fonts from the WINNT
directory, you have to notice the following: The
WINNT-directory is write-protected and therefore you
can´t select and add a font directly. At first you have to
copy the font-files in an other directory (e.g. the
temporary directory) and afterwards you can select the
font-files from this directory using the dialogue which is
described above.
• Add font alias:
A font alias is the reference to the font currently being used. As
font names sometimes have different names due to different
manufacturers and operating systems, in U1 Plot you can
produce an alias for the various font names used by U1 Plot on
Windows 2000. In this way, U1 Plot can identify which font it
must use even if the Postscript file uses a different name.
To add a font alias, follow the following steps:
1. Mark the font in the font list, for which you want to add an
alias.
2. Click once on the “Add font alias“ button, to add the alias.
The following window is opened:
3. Enter the name of the alias under which the font for the
program should be able to be found. Enter the name of the
file that is in the Postscript file [*.ps].
4. Quit the addition of the new alias with OK.
U1 Plot enters the new alias in the font list.
46 U1 Plot
Page 47

CONFIGURATION
• Delete fonts:
To delete a font or an alias, you only need to mark it in the font
list and to click once on the “Delete Font“ button.
Postscript halftoning tab
Here you have several possibilities for manipulating the grey
values in the Postscript file. Only make these changes if you
have at least a basic knowledge of image editing. The tab
appears as follows:
When you opened this tab at the first time, it is disabled. To be
able to adjust the settings, you must first switch this module to
“Enable“. You can now select whether you wish to alter
“Default“ settings or “Manual“ in the “Settings“ area. The
Default setting is preselected and the corresponding area is
U1 Plot 47
Page 48

CONFIGURATION
activated. You can now select one of the following standard
settings from the “Selection“ list:
• Photo (fine dithering, lot of details)
• Text (only black/white)
• large technical picture
• Technical picture
• Image/ picture
You will also find the names of the settings, which you have
made and stored in the “Manual settings“ area in this list. These
individual settings can be removed again by clicking on the
“Delete Entry“ button.
To alter individual settings, you must first decide in the “Manual
Settings“ area to what extent you wish to manipulate the
settings. You can choose from the following:
• Background: Here you can determine the properties of
the grey scale pattern. You can select the frequency, angle
and spot function. These parameters are explained below.
• General: Here you can manipulate all properties except
for the filter matrix.
• Greyscales: Here you can adjust the filter matrix and
transfer scales. These parameters are explained in the
following.
The parameters for manipulating the grey scales have the
following effects:
• Frequency: Is used to determine how often the grey value
pattern is repeated. You can enter an integer number
between 1 and 999. A frequency above 500 is only
required in exceptional cases. Try and find out which
frequency is sufficient for your graphic.
• Filter matrix: This is used to determine how strong the
brightness gradations between the grey scales are. Level 7
means a small grey scale gradation, Level 1 a large
gradation.
48 U1 Plot
Page 49

CONFIGURATION
• Transfer function: The default setting is that no transfer
function is carried out. In addition, the settings “Invert“ and
2 to 64 grey scales are available in the pull-down menu.
The inversion causes a color inversion. I.e. in black & white
images the black areas are shown white and the white
areas are shown black. Alternatively, you can also select the
number of the grey scale. The more grey scale is used, the
more precise the grey scale gradations. The differences in
brightness are more precisely reproduced in the graphic.
• Spot function: Here you can select the basic pattern of the
grey scale patter from the pull-down menu, for example,
star, ellipse, etc.
• Angle: Here you can determine at what angle the
individual objects of the grey scale pattern are relative to
each other. Enter an angle between 0 and 90 degrees. We
recommend that an uneven angle is used, as otherwise
irritating patterns are produced in the graphic.
• Accurate Screens: If you switch on this option, a very
precise image is calculated and displayed. However, the
complicated calculation slows down the processing.
After you have altered all the settings, you can store them, so
that you can use them again. Click on the “Assign Entry“ button.
A window opens, where you can enter a name for these
settings.
The new name for the settings will be automatically inserted in
the “Selection” list.
U1 Plot 49
Page 50

CONFIGURATION
Later on you can search for your personal settings from the
“Selection“ list in the “Default Settings” using this name. This
means that you do not have to repeatedly alter this individual
settings.
PDF halftoning tab
You can use this tab to manipulate the grey scale values in the
PDF file. The functions are the same as those already described
in the previous chapter.
CGM (Option)
You can start the CGM settings using the “Configuration - CGM
defaults“ menu or via the keyboard shortcut “Ctrl + C“:
50 U1 Plot
Page 51

CONFIGURATION
The Help function for the individual CGM format settings can be
opened using the HELP button. This calls up detailed help for all
the buttons and possible settings as provided by Henderson
Software Inc.
Attention: In the “Dialogs“ tab, “Option Dialog“, the
option “Always“ must be activated. This setting
guarantees that the dialog is shown. Do not use the
„Never“ option, because the dialog will never be
shown again respectively it can only be activated again
with huge effort.
Properties
You can adjust further properties of the program using the
“Configuration - Properties“ menu. Each of the possible settings
is described in their own section in the following.
Note: After you have altered the settings, you can use
a test page to check whether the plotter has accepted
the settings. To do this, select the menu command “Job
– Test Page“. You can examine the page produced in
Preview window and then print it.
Spool settings
You can use this tab to alter the settings for the spool processes.
The tab looks like as follows:
U1 Plot 51
Page 52

CONFIGURATION
• Spool folder: The CFG and SSL subdirectories in which
the respective job files can be called up are located in the
spool folder. You only have to enter the path of the main
folder [drive]:\Spool. The CFG and SSL directories
contained in it are automatically read out. The path chosen
during installation is given in the field. You can also select
another folder, if the spool folder is located in another
position. To do this, click on the button next to the field and
select another folder from the file selection.
• Quota: You can also limit the amount of hard drive
memory used by the job files. In this way, you can prevent
too much of the hard drive being used for the job files in the
spool folder. You must first activate this function by clicking
on the check box. Presetting is “0”. Enter the maximum
hard drive capacity for the job files in the activated field. If
the “Quota” value is passed, the spool folder will be locked
for further print jobs and it won’t be released until having
free capacity on the hard disc.
52 U1 Plot
Page 53

CONFIGURATION
• Spool Timeout: To prevent long waiting times for reading
in incomplete job files, you can click on the check box so
that incomplete jobs read can be edited in the program.
You can also enter the waiting time for complete reading of
the job files in the field. Enter this time in seconds.
Job History
To ensure that too much hard drive capacity is not used and
thereby maintain an adequate performance of the system, older
processed jobs have to be deleted occasionally. You can use
this tab to set when older jobs should be deleted. To do this,
select one of the following criteria:
• Maximum number of plotted jobs in the job History:
Any old jobs exceeding this number are deleted. Use the
arrow key to change the number given or overwrite the
number.
• Maximum job usage of HDD capacity in %: Enter the
percentage size of the hard drive capacity to be used by the
jobs. As soon as this hard drive capacity is exceeded, the
older jobs are deleted.
• Delete plotted jobs which are older than (days):
Enter the number of days the jobs shall remain in the job
list. Jobs plotted before these days will be deleted.
Exception handling
On this tab you can enter what the program should do if a
plotter roll is empty or errors occur during the processing of the
jobs.
• On roll empty: It is regularly checked whether the rolls are
filled. You can select one of the following options which are
used in case of an empty roll:
Use identical media if available. Otherwise wait.: At
first the plotter checks if there is another roll of the same
medium and format. If it is not available, the plotter waits
until the empty roll is exchanged by a new one (plotter status
“Traffic lights” are red). Then the printing process will be
started automatically.
U1 Plot 53
Page 54

CONFIGURATION
The “No” option has the following consequences for the
print jobs: If you have select expressly a certain roll for your
print job (e. g. Roll 1) and this roll is empty, the plotter won´t
choose another roll. The job will be cancelled and an error
message will be displayed or printed (error page).
But if your job has the setting „auto“ (any roll) the print job
will be printed on another roll which has the same medium
and format.
Use any other media: The printing process will be
continued on another suitable roll. This option has the
following consequences for the print jobs:
If you have select expressly a certain roll for your print job (e.
g. Roll 1) and this roll is empty, the plotter won´t choose
another roll. The job will be cancelled and an error message
will be displayed or a error page will be printed. Whether the
printing process will be continued or not depends on the
settings you have made for the error cases (see below). In
case you have selected the “auto” option (any roll) for the
print job it will be printed on another suitable roll.
• On error: You can choose between three options:
1. The job is halted in case of an error and if the automatic
plot mode is active, this is deactivated.
2. The second option is for the faulty job to be skipped and
for the Autoplot mode to continue.
3. If you select the third option („...print next entries of
current job.”) the faulty entry will be left out and the
following entries will be printed. If there are three or
more than three faulty entries in this job the whole job will
be left out and the next job will be printed.
Extended settings
In this tab you can adjust the response, units and accounting
settings.
54 U1 Plot
Page 55

CONFIGURATION
• Response: During the installation of U1 Plot, the
“Response” folder is also set up, which is used to display the
current status of the jobs sent to the order users. There are
two ways of “Logging“. Either the current status information
is written to its own file or it is added to a database. The
database logs can be read in by other systems or
applications too using ODBC if required.
If you have activated the response function, a separate
folder is set up in the response folder for each user, the
path for which you will have entered here.
Users can be informed of successful completion of their jobs
by an in-house or external mail system. Further informations
you can get in chapter „Job editor“, page 69.
• Units: You can set which size unit is to be used for your U1
Plot work: You can choose between “millimeters“, “inches“
and “pixels“. The applicable units are then displayed in the
status bar of the main program.
U1 Plot 55
Page 56

CONFIGURATION
• Job Flag Sheet: The Job Flag Sheet contains information
about the print job and will be printed together with it as
last sheet. Therefore you have to activate the function in the
job editor. If you didn´t and a process error appears, a
error sheet will be printed instead of the Job Flag Sheet. In
this dialogue you can select a media for the Job Flag Sheet
and the Error Sheet. If this medium isn´t available, the Job
Flag Sheet and the Error page won´t be printed. It only
appears an error message informing you that pages
couldn´t be printed. The next print jobs are processed if you
haven´t choosen a different reaction for an error case.
That´s why you should take care that the selected media is
available in the plotter. The option „don´t care“ results in a
automatic media selection of the plotter.
In the list “Media Source” you can select the trays in which
the rolls with the different printing materials (paper, film,
etc.) are located. They can also have varying widths.
If you select the “Auto“ setting, the plotter chooses the
media source, which matches the format size of the Job
Flag Sheet. Should this input tray be empty, the plotter uses
the tray (roll) with the next larger format.
• Accounting: You must activate this setting if you wish to
produce bills for the print jobs. Click on the check box, so
that a tick appears. An “Account“ folder is now produced
automatically, in which an SDF file and a form file are
saved.
The paths and names of the SDF and form file are preset.
The SDF and TXT files do not have to be saved in the
account folder. You can also select other directories. Click
on the button next to the respective field. You can then
select a folder from the folder tree. The files are
automatically produced following activation of the
accounting function. They contain the following:
The form file [PB_ACCNT.TXT] can be read into any word
processing program. The following details are saved for each
individual job:
56 U1 Plot
Page 57

CONFIGURATION
+++++++++++++++++++++++++++++++++
+++++++++++++++++++++++++++++++++
Date: 16/08/2001 Time: 09:18:33
Job Number:
Job Name:
Priority:
Original Filename:
User Name:
Customer:
Account:
Distribution:
Media: recycled paper
Used Area:
Plotted Area:
Media: paper
Used Area:
Plotted Area:
Media: film
Used Area:
Plotted Area:
Media: vellum
Used Area:
Plotted Area:
Operation Count
Mirror:
Rotate:
Zoom:
Stamp:
Fold:
Notes:
U1 Plot 57
Page 58

CONFIGURATION
+++++++++++++++++++++++++++++++++
+++++++++++++++++++++++++++++++++
An SDF file can also be read into and edited in a spreadsheet,
for example Microsoft
Excel. The file contains the following
information:
JobNumber;JobName;EntryName;Customer;CostCenter;Distribution;
UserName;Account;JobPlotter;Priority;RecycledPaperSize;PaperSize;FilmSize;Tra
nsparentSize;UsedTray;RecycledPaperUsedArea;RecycledPaperPlottedArea;Paper
UsedArea;PaperPlottedArea;FilmUsedArea;FilmPlottedArea;TransparentUsedAre
a;TransparentPlottedArea;MirrorCount;RotateCount;ZoomCount;StampCount;Fo
ldCount;FoldProgram;CopyCount;Notes;Time;Date;OriginalFileName;
1001;House21;C:\SPOOL\ssl\House21.085955\\House2.tif;;;;joe;;;Normal;;IS
O A4;;;0;0;0;623;71120;0;0;0;0;0;0;0;0;;0;1;; 09:18:33;16/08/2001;
House2.tif
The fields at the start of the SDF files [PB_ACCNT.SDF] are listed
separated by semicolons. All jobs are then listed after this,
including the respective field entries, again separated by
semicolons. The jobs are read according to the fields. The
individual fields have the following meaning:
Field Explanation
Account Account to which the job order is charged
CopyCount Number of job copies printed
CostCenter Cost center
Customer Customer for whom the job order is
intended
Date Date of the print off
Distribution Information, who is to receive the job
EntryName Name of the entry in the character set
FilmPlottedArea Film area used in cm2 / inch2 during the
print including possible waste cm
FilmSize Film format used for the print
FilmUsedArea Printed film area in cm2 / inch2
FoldCount Number of folds in the printed set of
drawings
JobName Name of the print job
2
/ inch2
JobNumber Consecutive number of the print job
JobPlotter Plotter, used for plotting
MirrorCount Number of reflections in the printed set of
drawings
58 U1 Plot
Page 59

CONFIGURATION
Notes Free comments on the job order
OriginalFileName Original name of the entry file
PaperPlottedArea Area of paper consumed in cm2 / inch2
during plotting including possible waste
PaperSize Paper format used for plot
PaperUsedArea Printed area of paper in cm2 / inch2
Priority Priority of the print job
RecycledPaperPlott
edArea
Area of paper consumed in cm2 / inch2
during plotting including possible waste
RecycledPaperSize Paper format used for plot
RecycledPaperUsed
Printed area of paper in cm2 / inch2
Area
RotateCount Number of rotations in the printed set of
drawings
StampCount Number of stamp prints in the printed set of
drawings
Time Time printed
TransparentPlotted
Area
Vellum area used in cm2 / inch2 when
plotting including possible waste
TransparentSize Vellum format used for plot
TransparentUsed
Printed vellum area in cm2 / inch2
Area
UsedTray Used medium source
UserName Name of the job producer
ZoomCount Number of size changes in the printed set of
drawings
U1 Plot 59
Page 60

JOB HISTORY
Job History
All job planned for plotting or that have already been printed
are automatically included in the job list:
A job order that contains at least one drawing including the
corresponding SSL file that contains the detailed plot
information is called a job.
Job types
Apart from normal jobs, there are also one special type:
Manual (bypass tray)
If you select „bypass tray“ in the print setting „Media Source“ the
plotter processing this job will be stopped and the operator will
be able to put a special medium in the bypass tray. He can put
in, for example, a thick or a colored paper which is normally
not in one of the trays. It is useful to add the priority “wait” to
this job if the operator can´t put in the medium immediately.
Otherwise the whole printing process could be stopped for a
long time. If required the job can be later started by changing to
a higher priority.
An overview of the job characteristics
A job order has a total seven characteristics, which provide
information about the job. In the normal state they are sorted by
job numbers. In detail, the order characteristics provide the
following information:
• Job Number:
This column contains the consecutive job number, which is
automatically assigned by the program for each incoming job.
The program starts with the number 1,000 with the first
60 U1 Plot
Page 61

JOB HISTORY
program run following installation and numbers through to
10,000,000. It then starts to count from 1,000 again.
This job characteristic cannot be altered.
• Job Name:
This is the name of the print job. It is assigned in U1
PLOTCLIENT.
• Job Owner:
This means the user, who e.g. has prepared the job in a
CLIENT.
• Priority:
The priority is first entered by the user of the job in U1
PLOTCLIENT and shows which print jobs are to be printed in the
job list with priority. The following levels of priority are
available:
→ Normal: If you do not classify jobs with a “high “ priority,
jobs with “normal“ priority are processed quickly.
→ High: This is a high priority level, which the user can assign
in a client. It will be set for urgent jobs.
→ Low: A job with this priority does not wait until all other jobs
have been dealt with, but has three other priority levels
before it, which are processed first.
→ Wait: This is the lowest priority level. This priority shows that
the print job literally “can wait“. This job won´t be printed
automatically. It has to be started manually in the job list.
You can add this priority to a job, for example, if you want to
change the print settings afterwards.
→ Immediately: This is the highest priority level. This priority
can only be set in U1 Plot. The current print job will be
interrupted until the job with priority “immediately” is done.
The following chapter describes how you can alter the priority.
• Job status:
This job characteristic can be used to obtain information about
possible problems or plot errors during the job concerned. The
different status conditions are listed below. Behind each status
condition you can find an explanation and the color which is
shown in the Job list:
U1 Plot 61
Page 62

JOB HISTORY
OK The job has been printed. (black)
Pending The job is ready for printing. (blue)
Plotting The job is currently being printed.
(green)
Manual The medium for this print job must be
put in the bypass tray. The plotter will
be stopped before (light blue)
Problem There is a problem; the job
was not completed. (red)
Cancel The job order has been canceled. (red)
Further information on the status can be obtained by double
clicking on the line of the job concerned with the mouse cursor.
The program opens an info window, which contains detailed
information about the job status. This function is particularly
useful if the “Problem“ status is displayed. In the chapter „Error
messages“, page 108 you can get further information how to
solve problems.
• Date:
The date refers to when the job concerned arrives in the plot
folder, i.e. when U1 Plot receives knowledge of the job. If
several jobs have the same priority, the job with the oldest date
is printed first.
Note: A file format is used, which you have set in your
operating system.
As soon as you mark a row, the detailed information about the
marked job appears in the job editor below it: format, scaling,
media type, number of copies, etc.
• Plotted:
This is the date and time of the printout.
62 U1 Plot
Page 63

JOB HISTORY
Change job characteristics
Only the following job characteristics can be altered in the job
list:
• Priority
• Job status
The priority and status job characteristics are altered in a menu
reached by clicking with the right-hand mouse button:
1. Mark the job line with the mouse cursor and open a context
menu using the right-hand mouse button.
Note: You can also select several print jobs at once.
The procedure is the same as for Windows 2000
Explorer. You can thus mark several print jobs and set
all of them e.g. to the “Pending” status in one go.
2. Select the item you wish to change from the menu using the
left-hand mouse button:
• Priority: The user has possibly set one of the following
priorities: normal, high, low, wait. If they have not assigned
any priority, the job is assigned the priority “normal“. In this
program you can subsequently alter the priority.
Changing a priority is e.g. useful if you have to alter the job
settings. To do this, set the job priority to “wait“ and you can
then alter the settings in your own time, without having to
stop the whole plot process. Furthermore, you can also set
jobs with an initially lower priority to a higher priority or to
the priority “immediately”, to effect a faster printout.
• Status: Here you can assign the status “Pending“ or “OK“. If
an error occurs during a job (status display “Problem“), you
can first remove the error and then assign the “Pending“
status again, to inform the program that the job can now be
printed. The “OK“ status can be assigned of you wish to see
the job as completed and no longer want to print it off. You
can then change the status to “Pending“ to make a printout.
U1 Plot 63
Page 64

JOB HISTORY
Sort list
The jobs are normally sorted by job number. However, you can
also select another of the seven criteria given in the “Order by:“
row. To do this, you only have to click on the option field next to
a sort criteria.
If you have sorted the job list, U1 Plot draws attention to the fact
that the list is not shown according to the standard, i.e.
according to consecutive job numbers, by the activated “Order
by:“ wording to the left of the criteria. If you do have the list
displayed in standard mode, note the following Note:
Note: If the list is not displayed according to
consecutive numbers, it can take a while to set up the
list when new jobs arrive, because the jobs have to be
inserted in the job list according to the correct sort
criteria.
Activation of the individual sort criteria is shown as follows:
• Job number: The list is displayed in its standard state. The
smallest number is displayed first.
• Job name: The jobs are shown in their alphabetical order
starting with A.
• User: The jobs are shown in the alphabetical order of the
users’ names, starting with A.
• Priority: The jobs are displayed with those with the highest
priority first. I.e. the job with the priority “Immediately“ is in
position No. 1.
• Job status: When the jobs are sorted by status, they are
displayed in the sequence “Problem, OK, Pending, ...etc.“.
64 U1 Plot
Page 65

JOB HISTORY
I.e. the jobs, for which there were problems and for which
the printout has thus not yet been completed are shown first.
• Date: The job with the oldest date is in the first position. If
jobs have the same date, the job with the earliest time is
displayed first.
• Plotted: The plotted job with the oldest date is in the first
position. If jobs have the same date, the job with the earliest
time is displayed first.
Carry out selection
U1 Plot also allows you to only display specific jobs in the job
list. All seven selection fields of the job list can be used to make
a selection: “Job number“ through to “Plotted“.
Start selection
It is also possible to use several selection fields simultaneously
for the query to make a selection.
Only two steps are necessary to make a selection:
1. Enter a value in at least one of the seven selection fields.
2. Click on the “Select“ button.
The program immediately lists all jobs, which meet the selection
criteria. The activated “Order by:“ text is also displayed, which
shows that the listen entries are for jobs in which the selection
criteria has been limited, so that not all the available jobs are
listed.
If several jobs meet the selection criteria, they are listed
according to their consecutive number.
You can enter the following presets for making a selection:
• Job number: The following five operators can be used for
specifying the sort criteria: >, <, =, >= and <=.
You can thus enter any possible range of job numbers.
U1 Plot 65
Page 66

JOB HISTORY
The characters are entered one after the other without a
space, e.g.: >=1007.
• Job name: Here you can either search for a complete job
name or using the * (asterisk) operator. This operator can be
used in place of a letter or a sequence of letters: E.g. you
can search for all names, which begin with A by entering “A*
“or search for a job name with an “o” in the middle by
entering “*o*“. The names are listed in alphabetic order.
• User: When selecting according to users you proceed as for
[job] name. You can also use the operator “ * “, to replace a
letter or a sequence of letters. The names are listed in a
alphabetic order. If you have been used numbers, it is shown
in a rising order.
• Priority: To make a selection you enter the wording of the
priority label: Normal, High, Low, Wait, Immediately. Using
of operators is not possible.
• Job status: To make a selection, enter the word for the
status label. It is shown in the following order:
OK, Pending, Problem.
Jobs, which are ready for printing are shown in blue. Jobs
that have already been completed are black and jobs, in
which problems occurred are displayed in red. Print jobs,
which are currently being printed appear with a green bar.
• Date: The following five operators can be used to specify
the query: >, <, =, >= and <=.
The entry is made consecutive without spaces. Use the date
format of your operating system.
• Plotted: The instructions under “Date“ apply here too.
Cancel selection
To cancel a selection and to view the complete job list, click
once on the “Clear“ button. The program now lists all the
available jobs. The jobs are sorted according to their
consecutive number as a standard, where you have not
activated another sort criteria.
66 U1 Plot
Page 67

JOB HISTORY
Job information
A comfortable way obtaining job information quickly is to use
the job info window. You can open the info window in three
ways:
• Open the window with a double click of the mouse on the
job required.
• Mark the required job and select the menu item “Job - Job
Info“.
• Click on the required job with the right-hand mouse button
and select the item “Job Info“ from the menu.
U1 Plot 67
Page 68

STATUS DISPLAY
Status display
The status display is a pure information window, in which you
cannot make any entries and changes.
It contains information about the initialization of the plotter, the
plotting sequence itself and any error situations that have
occurred. The information for the current job is displayed with
the consecutive job number, so that you can quickly allocate the
status reports.
68 U1 Plot
Page 69

JOB EDITOR
Job editor
You can use job editor to alter the settings for jobs and the
entries contained within them. You can also delete jobs or
entries.
The individual settings possible range from the format size to
the selection of the print medium through to details of the
drawing header position.
To be able to edit the job settings in the job editor, you must first
mark the relevant job in the job list. Only then does the job
editor open and the applicable settings are displayed.
The altered settings for jobs or entries can be stored as follows:
• Simply select another job in the job list. The program
automatically asks whether you wish to save the previously
made settings.
• Select the command “Job – Save Job“.
“Job area “ and tab
All the entries that the user has made in U1 PLOTCLIENT
automatically appear in the “Job” tab. You can alter these
details:
U1 Plot 69
Page 70

JOB EDITOR
• Job name:
This is where the name of the plot job is displayed, which the
user has selected. You can enter maximum 40 characters.
Please do not use the following characters: ” “ /n /r
• User name:
This field displays the name of the employee who has put the
plot job together and sent it for printout. You can enter
maximum 40 characters.
• Customer:
This is the name of the customer for whom the plot job is being
carried out. You can enter maximum 40 characters.
• Account:
The account number of the customer is entered here. This can
be an account number that is allocated in-house or an in-house
invoice recipients. You can enter maximum 40 characters.
• Notes:
This field is free for you to make comments. You can enter
maximum 60 characters. Please do not use the following
characters: ” “ /n /r
• Distribution:
In this field you can enter who is to receive a copy of the job.
You can enter maximum 60 characters. Please do not use the
following characters: ” “ /n /r
• Collate:
Activate this field if the plot job is to be printed out sorted.
Sorted means that the entries of an order are printed out as
follows when several copies are required:
E.g. you have the entries A, B and C. Three copies of each are
to be produced. With activated sort (“On“) the print outs are in
the sequence A, B, C - A, B, C - A, B, C. If the printout is not
sorted, the complete number of entries are printed out: A, A, A B, B, B - C, C, C.
• Priority:
This shows what priority the job has been given by the user:
Normal, High, Low, Waiting. You can alter the priority here or
set it to the highest level.
70 U1 Plot
Page 71

JOB EDITOR
• Job Copies:
Here you can enter the number of job copies.
• Job flag sheet:
Activate the “ON“ field if you want a coversheet to be printed
summarizing all the information in, which you have entered in
this tab [“Job“]. You can also enter further information in the
comments field below it, however with a maximum length of 60
characters. Please do not use the following characters: “ “ /n
/r.
• Plotter:
This setting cannot be altered. The plotter is preset.
• E-mail:
Use of the e-mail function must be switched on in the default
values.
Here you can instruct the program to automatically send an email or a message to the user on successful completion of the
print job. To send an e-mail, enter the e-mail address of the
user.
• Delete:
If you activate this option, the job is deleted after printed out.
Default settings area
The following chapters explain which default settings you can
enter in the Job Editor. The default settings only apply for new
entries to be added. The previous settings apply for older
entries.
“Default Specific“ tab
On the “Default Specific“ tab you can enter the basic setting for
all new entries to be added for a job.
U1 Plot 71
Page 72

JOB EDITOR
Note: All basic settings only apply for newly added
entries except for the number of copies.
• Formats:
Use this section of the tab to select the drawing format, for the
drawing print. Apart from “Original“, “Window“ and “Percent“,
you will also find the drawing formats that are the usual
standards used: ISO A, ANSI A-E and ARC A-E.
Note: If you use the bypass tray to place paper or an
other medium, you can use all formats, also ISO B, C.
However you have to place the drawing in the
„portrait“ position.
In the “Original“ format setting the program obtains the format
size from the original drawing file. This is the preset.
If you use the “Window“ format setting, you can freely adjust the
format width and height values, whereby the format size is given
72 U1 Plot
Page 73

JOB EDITOR
by the window value. The freely adjustable settings apply both to
the orientation as well as the format size and the format border:
X-Scaling Format width
Y-Scaling Format height
If you want to scale the drawing set the format to “Percent“. In
this case, the “Scale“ input fields are activated and you can
enter any values between 1.0 and 999.0.
If you choose one of the standard ISO, ANSI or ARC formats,
you can accept the dimensions or change them as you require:
First set the required format. You can now alter the format width
(“X-scaling“) and the format height (“Y-scaling“) values as you
wish. If the entered values are not corresponding with the
standard formats, the menu entry will change to “window”.
The value x in the “Maintain ratio“ window represents the side
proportions “width = x · height “. If you activate the “Maintain
ratio“ option, you can only alter the values above it for the
width, i.e. the X-scaling. The Y-scaling, or height is then
adjusted automatically, i.e. the drawing is scaled proportionally.
This can be useful e.g. if you know that the printout of a
drawing is too large for the paper size available. In this case,
activate the “Maintain ratio“ option and reduce the value x
slightly, to obtain a proportionally correct printout. The
“Maintain ratio“ option is already activated as a standard
setting.
• Scaling:
The X-Scaling input fields only become active, if you have
selected “Percent“ as the format. You can print out the drawing
in a free format of 1.0 % to 999.0 % of the original. The input
field for Y-scaling is automatically filled with the value of the Xscaling, if you have activated the “Maintain ratio“ option. If you
then want to enter the Y-scaling value independently, you must
deactivate the “Maintain ratio“ option. In this case, you must
consider that the drawing will appear distorted.
• Media type and position
Use this menu to select which type of media the drawing is to be
printed on: Don’t care, Paper, Vellum, Film or Recycled Paper.
U1 Plot 73
Page 74

JOB EDITOR
The selection depends on what roll of medium you have fed in
the plotter. The “Position“ field is used to set the symbolic
position on the paper if the image is to be printed on a larger
paper format. E.g. if you have a ISO A4 drawing, which is
printed in original size on ISO A1, you can fix here where the
drawing is to be positioned on the larger sheet.
• Cut mode:
If you have not activate this option, the plotter trims the drawing
immediately after the last data has been printed. This results in
optimum paper or medium use, because it produces the
smallest amount of waste.
If you want the printout to always be trimmed to a standard
format, no matter how much space remains unprinted, activate
“Format“. The plotter then always trims to the next larger
format. This can be a disadvantage if e.g. a drawing is only
around 0.5 cm larger than a ISO A5 page is printed on a ISO
A4 page and thus almost 50 % of the sheet remains unused.
The advantage is that some folder machines require exact
formats and you can match them using the “Format“ setting.
• Copies:
You can enter any number of copies between 1 and 999 to be
printed by the job .
• Rotate:
Here you can say whether the drawing is to be rotated or not
during plotting. Rotations of 0°, 90°, 180° and 270° are
possible. When set to “Auto“, U1 Plot rotates automatically if
this results in less waste paper.
• Border:
If you want a white border around the drawing, activate the field
“On“ and enter the required spacing for all side borders. The
maximum border is 499, 99 mm (19,68 inch, 11811 Pixel). The
current dimensional units are given in the status bar at the
bottom of the monitor.
• Media Source:
Here you can select the trays in which the rolls with the different
Printing materials (paper, film, etc.) are located. They can also
have varying widths.
74 U1 Plot
Page 75

JOB EDITOR
If you select the “Auto“ setting, the plotter chooses the media
source, which matches the format size of the drawing. Should
this input tray be empty, the plotter uses the tray (roll) with the
next largest format. The option „bypass tray“ can be used for
putting in a special medium like thick or colored paper. The job
will be marked blue in the job list. When this job is processed
the blue signal light appears, the plotter stops and a dialogue
pops up that informs you to put the medium in the bypass tray.
In this dialogue the possibility is also given to delete the job
from the job list.
• Invert:
If you activate this option, the drawing is inverted, black and
white colors are swapped.
“Default Additional“ tab
The “Default Additional“ tab is used to enter mirroring,
stamping and pen details.
The stamp editor and the pen settings (Calcomp, HPGL) are
each explained in their own chapter. Please read the separate
“Stamp editor” section at the end of this Chapter from Page 82
ff. and the separate chapter on “Pen settings “ from Page 89 ff..
U1 Plot 75
Page 76

JOB EDITOR
• Mirror:
In this area you can set whether the drawing is to be mirrored
or not during plotting. The individual fields mean the following:
OFF: The drawing is not mirrored during plotting.
X: The drawing is mirrored horizontally.
Y: The drawing is mirrored vertically.
XY: The drawing is mirrored about both axes simultaneously;
equates to a 180° rotation.
You usually use these settings if the drawing has been scanned
and saved with a mirror inversion. This is especially important if
a vellum has been scanned with mirror inversion to increase the
contrast.
File Viewer
You can load a drawing in preview window, which is located on
the right-hand side next to the job editor, by selecting it in the
job editor using the mouse. To do this you must activate the
“File Viewer” option in the “View“ menu. You can still change
the view by using the tools in the “View” toolbar. These have
already been explained on Page 38.
“Entry“ area
You can read here, which adjustments can be made for an
individual entry.
If you want to alter the settings for the individual entries i.e. alter
the drawings, you can do this on the two “Specific“ and
“Additional“ tabs, which can be used to make the same
adjustments as described in the “Defaults“ tabs.
To begin altering the settings of an entry you must mark it in the
left-hand entry list. The “Specific“ and “Additional“ tabs are then
also opened and can be edited. If you want to change back to
the job settings or defaults, click once on the “Job“ or “Defaults“
button above the entry list.
76 U1 Plot
Page 77

JOB EDITOR
If you want to make entries in the “Specific“ tab, read the
information given for the “Default Specifics “ tab from Page 71.
If you want to alter the settings on the “Additional“ tab, read the
details for the “Default Additionals“ given on Page 75 ff.
You can open a tab for the pen settings on the “Additional“ tab.
To do this, click on the “Pen settings“ button. When an entry or
a drawing is marked, the program automatically identifies the
format and opens the Calcomp or HPGL settings itself. Please
read the separate Sections on the pen settings for Calcomp
pens from Page 97 and the HPGL pens from Page 90.
Entry information
Before you can begin with a possible change to the settings, you
can view a summary of all the currently loaded settings. Proceed
as follows:
1. Mark the job whose entries you want to look at in the job list
above the job.
2. Mark the required drawing in the entry list to the left of the
required drawing.
3. Click on the white “i” for information display in the “View”
toolbar:
For most file formats you can only see the “Misc“ tab. It contains
e.g. the information about the file format, the drawing size and
used pens. If you open a HPGL- or Calcomp drawing, you can
read on this tab information about general settings (“PenSource”, “Pen-Scale”, “Pattern style” etc.) which you can change
in the job editor.
The tabs “Drawing” and “Pens” appear only, if you open a
HPGL- or a Calcomp drawing file. On the tab “drawing” you
get the information about the file format, the drawing size, the
used colors etc.. The tab “Pens” informs you of the pen settings.
There can also be two symbols which inform you of the setting
status: The red exclamation marks point out that the pen is used
with several pen sizes and only the last set pen size can be
U1 Plot 77
Page 78

JOB EDITOR
shown. The green check shows, that a pen is used for the
current drawing.
Add entries
A job usually already contains all the setting entries to be
printed off. However, you may wish to enter another setting
value, because changes were made at the last minute or the
entry was simply forgotten. You can added this entry to the list
of entries, which you can see in the job editor on the left-hand
side page:
Newly inserted entries can have the following file formats, which
are identified by U1 Plot from the file extension:
• Calcomp ......................................................(*.906, *.907)
• CALS [to MIL-STD-1840B] .........................................(*.cal)
• CALS [to MIL-STD-28002A] .......................................(*.cal)
• Intergraph ........................................................(*.cit; *.tg4)
• HP-GL [/2, RTL] ................................................. (*.plt; *.rtl)
• PCX......................................................................... (*.pcx)
78 U1 Plot
Page 79

JOB EDITOR
• RLC ...........................................................................(*.rlc)
• T6X ..........................................................................(*.t6x)
• TIFF .......................................................................... (*.tif)
[Group 3,4; uncompressed; Packbits; striped & tiled]
• Windows / OS2 Bitmaps ........................................ (*.bmp)
• Windows Meta File..................................................(*.wmf)
The following are also available as an optional:
• CGM......................................................................(*.cgm)
• PDF, Postscript ................................................. (*.pdf, *.ps)
The following are available with AutoCAD 2000 or 2000i
installed:
• DWG .....................................................................(*.dwg)
Note: A more precise definition of the file formats that
can be used is given in the appendix.
Apart from the standard options using the “Job editor“ menu,
you have three other possible ways of adding a new entry. You
can either use the button, the context menu using the right-hand
mouse button or you can move the drawing into the entry list
using “Drag & Drop“:
Adding using button
To add an entry with the help of the button, proceed as follows:
1. Mark an entry in the entry list, before or after the place
where the new entry is to be inserted.
If you do mark an entry, new entries are always inserted at
the end of the list.
2. Click on the relevant button on the Entry toolbar. If the new
entry is to be inserted after the marked entry, click on:
U1 Plot 79
Page 80

JOB EDITOR
If the new entry is to be inserted in front of the marked entry,
click on:
The program opens a file selection window.
3. Select the required file, which has one of the above file
formats and confirm with “OK“. You can now mark several
files to insert lots of drawings in one go, as in Windows
Explorer.
Add using the right-hand mouse button
To add an entry using the right-hand mouse button, proceed as
follows:
1. Mark an entry in the entry list before or after which the new
entry is to be inserted.
If you do mark an entry, new entries are always inserted at
the end of the list.
2. Keep the mouse cursor on the entry list and click the righthand mouse button. The following commands are offered:
Delete, Insert, Add.
3. If the new entry is to be inserted in front of the marked entry,
select “Insert“. If the new entry is to be inserted after it,
choose “Add“.
The program opens a file selection window.
4. Select the required file, which has one of the above file
formats and confirm with “OK“. As in Windows Explorer, you
can now mark several files to insert lots of drawings in one
go.
Add using Drag & Drop
To add an entry using Drag & Drop, proceed as follows:
80 U1 Plot
Page 81

JOB EDITOR
1. Open Windows Explorer and arrange the two windows of U1
Plot and Explorer so that thy are positioned next to each
other or on top of each other.
2. Mark an entry from the U1 Plot to be inserted after the new
entry.
If you want to insert a new entry in front of an existing entry,
mark the entry in the entry list before the existing entry.
If you do not mark any entry, new entries will always be
inserted at the end of the list.
3. Change to the folder in Explorer that contains the file entry
that you want to add as the new entry.
4. Click on the required with the left-hand mouse button and
holding the mouse button pressed down, drag the file to the
U1 Plot entry list. You can also add several drawings in one
go as in Explorer, by marking several files.
In this case, by adding a new entry for the job, the basic settings
that you prepared for the job concerned on the “Default
Specific“ tab are correct, c.f. S. 69. If you want to alter these
basic settings, mark the new entry, after you have added it, and
make the settings on the tab “Specific“.
Add entries several times
Sometimes, a customer job order is such that an entry has to be
printed several times with different settings: e.g. if an entry is to
be plotted once with A0 format on paper and the second time
with A1 format on vellum. To do this, you can also add an entry
several times.
Delete entries
If you want to delete an entry from the list, use one of the three
following possible methods:
• Mark the entry in the entry list that you want to delete and
select the menu item “Job Editor – Delete Entry “.
• Mark the entry to be deleted and click on the following
button once:
U1 Plot 81
Page 82

JOB EDITOR
• Mark the entry to be deleted, click on the right-hand mouse
button and choose “Delete” using the left-hand mouse
button.
Stamp editor
The stamp settings can be altered on two levels. To configure a
stamp for an individual entry, select the “Additional“ tab under
“Entry“. Now click on the “Settings” button under “Stamp“. The
same button can be find in the “Defaults“ area on the “Default
Additionals “ tab. The settings in the “Defaults“ area are basic
settings, in which the following must always be noted:
Note: Changes to the basic settings always only apply
to new entries that are added. Entries already included
in a job retain their settings.
In stamp editor you have two tabs in which you can alter
settings. These are the “Settings“ and “Data“ tabs. You can
define as many stamps as you like per drawing.
Make stamp
This chapter describes how you can name and save new
stamps.
Proceed as follows to configure a new stamp:
1. The first stamp entry is preliminarily named “000“. Click on
the following symbol to edit the stamp name:
2. You can now delete the existing name entry and enter your
own name for the first stamp.
82 U1 Plot
Page 83

JOB EDITOR
3. You can now either enter your own settings for the stamps,
as described in the following chapters or use an existing
stamp configuration. To do the latter, click on the “Open“
button under “Configurations“. Now select a configuration
that you have saved previously (read the following chapter
“Stamp Configurations“) from the file selection. Now save
this configuration for the defaults or the entry by clicking on
the button with the same name; i.e. “Save“. This
configuration is now saved under the marked stamp name
in the “Select Stamp “ window.
4. You can produce as many stamps as you wish for a
drawing. If you now also want to configure an additional
new stamp, click on the following button:
5. Enter a name and set the desired configurations, as already
described under Step 3.
Stamp Configurations
The stamp settings are usually saved for specific entries. This
means that these settings only apply for one entry or a limited
number of entries. However, you can also save a stamp
configuration in its own “Stamp File“. It can then be used at any
time for producing a new stamp, which you would like to use for
other entries.
The stamp files have the file extension [*.stp] and it is advisable
that this extension is always retained.
Should you want to start the configuration, you must use the
“Open“ button. The “Open“, “Save [as]“ or overwrite old stamp
files steps are the same as those used in general file
management.
Edit or delete stamp
If you want to make changes to the stamp configurations
produced, first click on the correct stamp in the “Select stamp“
window and then change the settings. If you now change to
U1 Plot 83
Page 84

JOB EDITOR
another stamp or close the window by clicking on “OK“, all the
settings are saved.
To delete a stamp, first mark it and then delete it by clicking on
the following button:
“Settings“ tab
General details, e.g. on mirroring, rotation, stamp type and
stamp position are made in the “settings“ tab:
• Mirror:
The standard orientation of the text is always the reader
direction. You can mirror the text here in four ways:
- None: The text is not mirrored and is in the reader
direction.
- X-mirror: The text is mirrored horizontally.
- Y-mirror: The text is mirrored vertically.
- XY-mirror: The text is mirrored about both axes
simultaneously, which equates to a rotation of 180°.
84 U1 Plot
Page 85

JOB EDITOR
• Rotation:
- The standard orientation of the text is always the reader
direction. Here you can alter the text rotation of in 1° steps.
• Stamp mode:
The standard setting for the type of stamp is always “Opaque“.
There are three possible settings:
- Opaque: The stamp overwrites the area of the drawing
beneath it.
- Transparent: In the “Transparent“ setting the inserted stamp
lies “beneath“ the existing drawing, which means that parts
of the stamp can be overwritten.
- Inverting: It is only the “Inverting“ setting that allows both
the drawing as well as the stamp to be identified in the plot,
because the overlapping areas are shown inverted.
• Stamp placement:
This is where you fix the actual position of the stamp on the
drawing. The frame equates to the drawing, so that you can
choose from the entries for the nine positions from “top“,
“centered“ to “bottom“.
In addition, you can shift this fixed position in the field to the
right of it by a valid size unit. You´ve got to be aware that you
don´t place the stamp outside the drawing because in that case
it won´t be printed or it will be printed only partially. You set the
currently valid size units for U1 Plot in the configuration
program and it is displayed at the bottom of the screen in the
status bar.
• Scale position:
With the “Scale position“ you determine whether the stamp
always retains its position relative to the edge of the drawing
when the size is changed or whether the distance to the edge of
the drawing should be scaled too.
U1 Plot 85
Page 86

JOB EDITOR
• Enable Frame:
Activate the “Enable frame“ field if you want a stamp frame to
be printed. Three default settings can be set for the stamp
frame. Here too, the settings refer to the currently valid size unit,
which you can see in the status bar:
- Upper setting - stamp border: With the upper of the three
settings you set the distance of the stamp to the edge of the
drawing.
- Middle setting – Stamp content: The middle setting gives the
distance of the stamp content to the stamp frame.
- Lower setting. The lower setting is used to fix the thickness of
the stamp frame.
“Data“ tab
On the “Data“ tab the user specifies the stamp text and logo.
You can also alter the text and text attributes on this tab or even
change the logo:
86 U1 Plot
Page 87

JOB EDITOR
• Stamp type:
Before you can begin to enter the settings or change the other
fields, you must first select the stamp type, whereby the two
symbols are clear: With the “A“ you activate the “Text“ field,
with the colored symbol you let the program know that there is
a logo and activate the “Logo orientation“ field.
• Text:
In this text field you can enter the text to be “Printed“ with your
stamp. In the text field you can edit in the same way as in
common word processing programs.
• Font:
The font „Lucida Sans Unicode“ is used as default font. The
“Font“ button opens the usual Windows dialogue for the font
attributes. Only the font color setting does not have any effect,
because the color is fixed in U1 Plot with black.
• Preview:
Use the “Preview” button if you want to view the stamp again
before the final print. In this window you can move the
directional arrows to move from side to side and enlarge or
reduce the view using “+“ and “–“. The left-hand mouse button
can be used to enlarge a selected area.
However, the preview only applies to the stamp itself and the
arrangement of its logo and its text. The preview does not show
you the stamp’s position on your drawing, which you set on the
“settings“ tab!
• Macros:
You can use a macro to enter a text field, which is not filled out
until printed. In the preview you can only see the field function.
All the file details always refer to the drawing or the entry on
which the stamp(s) are printed. The following macros are
available:
- Date: With this macro, U1 Plot inserts the date of the plot. In
the preview you can just see the current date because the
plot date isn´t known.
- File title: This macro gives the file name of the drawing how
it is saved in the SSL directory of the server PC (e.g.
house003.tif).
U1 Plot 87
Page 88

JOB EDITOR
- Count: This macro is suitable if you have lots of drawings or
entries with the same stamp text and you want to
differentiate between them by numbering them. If you want
to have a consecutive number printed on the plot, you must
enter the first number under “Enumeration“.
- Time: This macro inserts the time the drawing was stamped.
- Server name: This macro inserts the server PC name, where
U1 Plot is installed.
- Account: This macro inserts the text of the job editor field
„Account“ in the stamp.
- Creation appl: This macro gives the name of the application
which is used for creating a job (e.g. U1 PLOTCLIENT WIN).
- Customer: This macro inserts the text of the job editor field
„Customer“ in the stamp.
- Distribution: This macro inserts the text of the job editor field
„Distribution“ in the stamp.
- Job name: This macro inserts the text of the job editor field
„Job name“ in the stamp.
- Notes: This macro inserts the text of the job editor field
„Notes“ in the stamp.
- User name: This macro inserts the text of the job editor field
„User name“ in the stamp.
• Text color:
As black is the only color available in this version of U1 Plot,
you cannot alter any settings here.
• Start count at:
If you have selected the field function “Count“ as a macro, you
must enter the first number here. By using this function you can
enumerate each sheet of your print output.
88 U1 Plot
Page 89

JOB EDITOR
• Logo:
Select a graphic using the “Browse“ button, which is to appear
in the stamp as a logo. For example, the firm logo. The file
formats that can be used are: BMP, Calcomp, CALS, CGM
(optional), CIT, EPI (optional), EPS (optional), HPGL, HPGL/2,
HPGL-RTL (s/w), PCX, PDF (optional), PS (optional), RLC, TG4,
T6X, TIFF G4 and WMF. You can select from four possible
positions for the logo relative to the text: above, below, right or
left of the text. Select a position by clicking on it.
Pen settings
You can change the pen settings on two levels. On the one
hand in the “Default“ area on the “Defaults Additional“ tab and
on the other in the “Entry“ area on the “Additional“ tab. The
settings in the “Defaults“ area are basic settings, for which the
following must always be noted:
Note: Changes to the basic settings always only refer
to new entries that have been added. Existing entries
already in the job retain their settings.
You can only change pen settings if the entry has either a
HPGL/2 or Calcomp file format. There are three tabs each for
both file formats, on which you can change the settings. These
are the “Pens“, “Colors“ and “Misc“ tabs.
In the “Defaults“ settings you must use the separate “Calcomp
settings...“ and “HPGL settings...“ buttons, because a job can
contain several drawings with different formats.
If you alter the settings for an entry, U1 Plot immediately
identifies the format and automatically opens the respective
HPGL or CalComp tabs via the “pen settings...“ button.
U1 Plot 89
Page 90

JOB EDITOR
View the changes
U1 Plot has an additional function, which allows you to look at
the changes to the pen widths and some of the pen colors
before printing in the File Viewer, if changes have been made to
a certain entry. To do this, proceed as follows:
1. Activate the view using the “View - File Viewer“ menu item.
2. Mark an entry in the entry list.
3. In the job editor change to the “Additional“ tab and open the
“Pen Settings...“.
4. Make your changes.
5. Now change to the “Misc“ tab and activate the pen source
as “Custom“.
6. Quit the pen settings.
7. Double click on the entry that has just been changed.
The changes are visible in the file view. You may have to
enlarge the view if e.g. the pen widths have only slightly
changed.
Note: It is possible that if you change colors you will
not see any large changes in the File Viewer, if you
only change from 50% grey to 60% grey for grey
shades say. Clear changes are e.g. visible if you set the
color of all pens to “white“, but then you don’t have to
print the drawing either!
HPGL and HPGL/2 - pens
The pen attributes are set in the “pens“ tab:
90 U1 Plot
Page 91

JOB EDITOR
• Pen size:
Enter the pen widths directly in the first column under “size”
using the keyboard. The maximum values that you can enter
depend on the size unit, which you set in the configuration
program. The current valid size unit is given in the status bar at
the lower edge of the screen.
If you want to “switch off“ a pen, you can enter the pen widths
as “0“or set the pen color as “white“.
• Pen color:
Select the pen color in the second column under “color“. Click
on the arrow to the right of the color setting and drag the
mouse to the desired color. If you want to “switch off“ a pen,
you can enter the pen color as “white“ or the pen widths as “0“.
The individual pen colors here only represent a grey scale value:
e.g. “yellow“ can be represented by 0 % grey, “red“ with 50 %
grey and blue with 80 % grey, etc. Several pens may also have
the same color and thus the same grey scale. This has the
advantage that you can simultaneously change the grey scale
value for several pens, if you have assigned a different grey
scale to a color in the “Colors“ tab. You can set which grey
scale a color represents on the “Colors“ tab.
U1 Plot 91
Page 92

JOB EDITOR
• Grey scale:
The grey scale can only be adjusted if you have chosen “grey“
as the color. The changes are also made directly using the
keyboard.
If the plotter is definitely to use the pen attributes from the
entry’s SSL file, you must activate the “file“ field on the “Misc”
tab as the pen and/or color source.
• Fill:
With “Fill“ the program offers you a comfortable way of
simultaneously setting the pen attributes for the pens 1 to 255.
Pen O must always be set manually. First set the pen widths, the
pen color and the grey scale and then click on “Fill“ once:
HPGL and HPGL/2 - Colors
To assign the required grey scale to each of the individual
colors, open the “Colors“ tab:
92 U1 Plot
Page 93

JOB EDITOR
In this window you can change the grey scale, which has been
assigned to each color. If you do not want to change each
color, you can set all pens to “grey” on the “Pen“ tab and there
you can set the individual grey values for each pen.
You can change the percentage value directly using the
keyboard. Click on “OK“ to quit the window and your settings
are saved. If you do not want to save your changes, quit the
window with “Cancel“.
HPGL and HPGL/2 - Misc
• Pen Source:
If you activate the “File“ field you instruct the plotter to use the
pen width details when plotting, which are entered in the entry’s
SSL file and that it should not use the settings in the “Pen“ tab. If
no pen widths have been defined, the program uses your
settings.
If you activate “Custom“, your settings are always used.
U1 Plot 93
Page 94

JOB EDITOR
• Color Source:
Is you activate the “File“ field, you instruct the plotter to use the
pen color information when plotting, which are entered in the
entry’s SSL file and that the settings on the “Pen“ tab are not to
be used. If no pen colors are defined, the program uses your
settings.
If you activate “Custom“, your settings are always used.
• Pen Scale:
Activate the check box, if the pen widths are to be scaled with
the drawing. To avoid possible loss of information during the
printout, you must ensure that you have entered at least one
minimum pen width in “Pen Settings“ if the drawing is to be
reduced in size and at least one maximum pen width if the
drawing is to be enlarged.
• Clipping:
The trim command removes the white edges on the border of
the drawing. Most plotter languages differ from each other in
many ways to a greater or lesser extent – including with respect
to the section, which, put simply, refers to the paper size.
This fact means that unwished for printing results are obtained,
if a drawing is only printed in sections or in the most
unfavorable case a white sheet of paper comes out of the
plotter.
The “Trim” function“ is considered in the context of the widely
used reference plotter “HP DesignJet 650 C / C 2859b“: If you
activate the check box, the drawing is printed in exactly the
same way as it was printed on the “HP DesignJet“ plotter.
However, unwished for printing results can result, if the plotter
language of your plotter differs greatly from that of the “HP
DesignJet“.
If you deactivate the function, U1 Plot looks for the drawing
dimensions itself and thus guarantees that the whole drawing is
plotted.
• Ignore pen widths:
You can only activate this option if you have not activated the
“Trim“ option.
Activate the option, e.g. in case of a drawing that is exactly ISO
A4 size to guarantee that it is printed on an A4 sheet and not on
94 U1 Plot
Page 95

JOB EDITOR
a printout with the next format because the pen widths are too
large and the A4 format is slightly exceeded, causing
unnecessary wastage.
In all cases where a drawing has exactly the same size as a
standard formats, you can ensure that this drawing is printed off
on this format and thus avoid unnecessary waste paper.
• Pen Limits:
− Min:
Using the keyboard, enter the minimum pen widths. The entry
here affects all HPGL pens.
As there are plotters in which even at the finest resolution the
individual pixels are not reliably reproduced, a minimum pen
size is indispensable in these cases.
Should one of your settings not cover the plotter circumstances
and no longer guarantee the printout of a drawing object, U1
Plot automatically adjusts the pen widths.
− Max:
Using the keyboard, enter the maximum pen widths. The entry
affects all HPGL pens.
Analog to the problem with the minimum pen widths, you can
set the maximum thickness that the pen draws, e.g. to prevent
the drawn objects from overlapping when printed. Setting the
maximum pen widths on the other hand is less seldom
necessary.
Should one of your settings not cover the plotter circumstances
and no longer guarantee the printout of a drawing object, U1
Plot automatically adjusts the pen widths.
• Steps:
Some time ago, most plotters had stepper motors, which ran at
a varying number of steps per centimeter. In the meantime, the
standard is 400 steps per centimeter. The U1 Plot therefore
enters 400 as a default value, which does not normally have to
be altered. Nevertheless, it is sometimes advisable to ask the
customer what step number per centimeter they are used to
working with to guarantee plot consistency. Furthermore, it can
be necessary to make a change to reduce the DPI, to release
more system memory for large drawings:
U1 Plot 95
Page 96

JOB EDITOR
Attention: If you enter a larger value, you will obtain
a s ma l le r drawing: The entry 1 equates to 0.25 %.
Example: if you enter 401, the drawing is reduced to
99.75 %.
• HPGL Font path:
This entry informs you in which folder the fonts are to be used
when printing HPGL files. The path is preselected.
• Dither mode / RTL: Here you can select grey value
patterns for bitmap graphics. You can choose between the grey
value patterns “symmetric pattern“ or “diffusion pattern“. Test
them and see which pattern best suits your graphic. To do this,
you have to reload the drawing in the File Viewer after each
change.
• Patternstyle:
There are four fill patterns that you can use to influence a vector
graphic.
“Round“ means that a certain colored area is filled with a
certain number of filled circles, which are given a certain
arrangement on the area, to achieve the intended color
saturation.
In “Random“ on the other hand a percentage of color
saturation is determined for the same colored area, which is
then converted into the necessary number of pixel, which are
randomly arranged over the area to achieve the intended color
saturation.
Which is why that when circle patterns are overlapped, the
covered areas can not be as clearly identified as if two random
patterns are overlapped. The recommended default setting is
therefore “random“, because you can achieve the best results.
As the “round“ setting has been installed as a standard to date,
this option has been retained of you do not see the need to print
the same drawings differently in future.
In addition, you can also select the grey value patterns
“symmetric pattern“ and “loadable pattern“. As the name
suggests, the „symmetric pattern“ produces a symmetrical grey
96 U1 Plot
Page 97

JOB EDITOR
value pattern. If you select the “loadable pattern” as the grey
value pattern, a pattern is loaded. Try and see which pattern
produces the best printing results.
HPGL and HPGL/2 – Plotter Defaults
These defaults settings will only be used if you activate the
option “file” in the area “Pen Source” and “Color Source” in the
tab “Misc”. If you need special settings for your current print job,
please activate “custom” in the areas and do your settings in the
tabs “Pen” and “Color”.
• Default:
If you activate the “Default“ option you instruct the plotter to use
the default pen settings when plotting. They correspond with the
settings of a HP-Plotter.
• Black/White:
The files will be printed in black and white. Gray won´t be used.
You can change the pen sizes.
• User Defined:
U1 Plot 97
Page 98

JOB EDITOR
You can change the pen sizes and the gray values aside from
black and white. These settings will be saved as default settings.
Calcomp - Pens
The pen attributes are set on the “pens“ tab:
• Size:
The pen widths are entered directly using the keyboard in the
first column under “Size“. The maximum values that can be
entered depend on the size unit, which you set in the
configuration program. The current valid size unit is shown in
the status bar at the bottom of the monitor.
If you want to “remove” a pen, you can set the pen widths as
“0“ or as the pen color “white“.
The standard values for the pen widths of the 16 Calcomp pens
are given in the appendix (Chapter “CalComp commands and
pens“).
• Color:
Select the pen color from the second column under “color“.
Open the pull down menu and select the required color. If you
want to “remove“ a pen, you can set the pen color as “white“ or
98 U1 Plot
Page 99

JOB EDITOR
the pen widths as “0“. You can set the grey shade that a color
represents on the “Colors“ tab.
• Grey:
The grey scale can only be adjusted if you have selected “grey“
as the color. Here too the changes are made directly using the
keyboard.
• Fill:
The “Fill“ option allows you to set the pen attributes for all 16
pens simultaneously. To do this, first set the pen widths, the pen
color and the grey scale and then click on “Fill“ once:
U1 Plot 99
Page 100

JOB EDITOR
Calcomp - Colors
To assign the required grey scale to each individual color, open
the “Colors“ tab:
The change to the percentage figure is made directly using the
keyboard. Quit the window with “OK“ and your changes will be
saved. If you do not wish to save your changes, quit the window
with “Cancel“.
In this window you can change the grey scale, which has been
assigned to each color. If you do not want to change each
color, you can tab set all pens to “grey” on the “Pen“ tab and
then set the individual grey values for each pen.
100 U1 Plot
 Loading...