

Page 1

Thurlby DSA524
digital storage adaptor
OPERATING MANUAL AN D TUTORIAL
V2.0
Page 2

1
INTRODUCTION
This manual is divided into four sections as follows:
Section 1 is the main reference section which contains a detailed
description of the operation of each function.
Section 2 is a tutorial for new users (or for existing users needing
examples of how functions operate).
The Appendices provide additional detail on some of the more
complex functions and on some of the theoretical aspects of digital
storage.
The Specifications give detailed technical specifications for the
instrument, plus service and warranty details.
N.B. The DSA524 can use either an oscilloscope or a personal
computer (IBM compatible) as the display device. This manual only
covers use with an oscilloscope. To use a PC as the display device
the "DS-PC Link" software package must be purchased, an additional
manual is supplied with this software.
FIRMWARE LEVEL
From time to time small revisions may be made to the
firmware of the DSA524 (the firmware is the ROM based
program code for the unit).
The firmware level is displayed briefly whenever the unit is
first switched on (and when SET 'SCOPE is used) as DSA524
X.XX, where X.XX is the firmware level.
This issue of the operating manual applies to units with a
firmware level of 2.71 and above.
IT IS VERY STRONGLY RECOMMENDED THAT NEW
USERS START BY FOLLOWING THE TUTORIAL.
INDEX
Title Section Page
REFERENCE SECTION
Connecting an Oscilloscope..................................... R1 ...............2
Setting up the Display .......................................... R2 ...............2
Front Panel Controls ............................................. R3 ...............2
Escape and Reset ................................................ R4 ...............2
Controlling Digitising ............................................R5 ...............2
Timebase Setting ................................................. R6 ...............2
CH1 and CH2 ....................................................... R7 ...............3
Digitising Memories .............................................. R8 ...............3
Trigger ................................................................ R9 ...............3
Trace A and Trace B ............................................. R10 ..............4
Memory Search (Comp, Scan, Mag) ........................ R11 .............5
Indexed Waveform Memories ................................. R12 ..............5
Display Update Rate .............................................. R13 .............5
Roll Mode Operation ............................................. R14 .............6
Repeat Mode Operation ......................................... R15 .............6
Cursor Measurement ............................................. R16 .............6
Program Mode ...................................................... R17 .............6
Sine Interpolation ................................................R18 .............7
Average ...............................................................R19 .............7
AxB (Trace Multiply) ............................................. R20 .............7
Line or Dots Display .............................................R21 .............7
Plot ..................................................................... R22 .............7
Print ...................................................................R23 .............8
Remote Control and Data Transfer ......................... R24 .............8
RS-423 Interface ................................................... R25 ............8
GP-IB (IEEE-488) Interface ................................... R26 ............8
Directly Acting Functions ...................................... R27 ............8
USERS TUTORIAL
Index to Tutorial .......................................................................9
APPENDICES
The Oscilloscope Display ........................................ Appendix A 16
Aliasing ............................................................... Appendix B 16
Bandwidth and Interpolation .................................. Appendix C 16
Analog Plotter Function ......................................... Appendix D 17
Connecting the Serial Interface .............................. Appendix E 18
Software Commands ............................................. Appendix F 18
SPECIFICATIONS
DSA524 Technical Specifications ............................ S1 ................20
Electrical Isolation ................................................. S2 ...............22
General Safety Considerations ............................... S3 ...............22
Fuse Replacement ................................................ S4 ...............22
Maintenance and Repair .......................................S5 ...............22
Updating the Firmware ......................................... S6 ...............22
Guarantee ........................................................... S7 ...............22
ADDENDA AND ERRATA .........................................................22
Page 3
2
REFERENCE SECTION
R1. CONNECTING AN OSCILLOSCOPE
Any conventional oscilloscope with an 8x10 division graticule can
be used with the DSA524. Only one input channel is needed and
a bandwidth of 5MHz is sufficient. The oscilloscope can be
connected using a single BNC to BNC cable. Alternatively two
cables can be used (see Appendix A).
Connect the rear panel socket marked "composite" to the vertical
input of the oscilloscope. If a two cable connection is preferred,
connect the rear panel socket marked "trigger" to the external
trigger input of the oscilloscope.
Set up the oscilloscope controls as follows:-
Vertical Input: DC coupling
100mV per division
Timebase: 50usec per division
No Sweep Hold-off
Trigger: Source — as input channel (single
cable connection)
— or external (two cable
connection)
Mode — normal (not bright-line auto)
Coupling — AC
Slope — negative
Level — negative
R2. SETTING UP THE OSCILLOSCOPE DISPLAY
Switch on the DSA524 (the power switch is at the rear) and wait
while the unit performs a brief selftest and initialisation. The
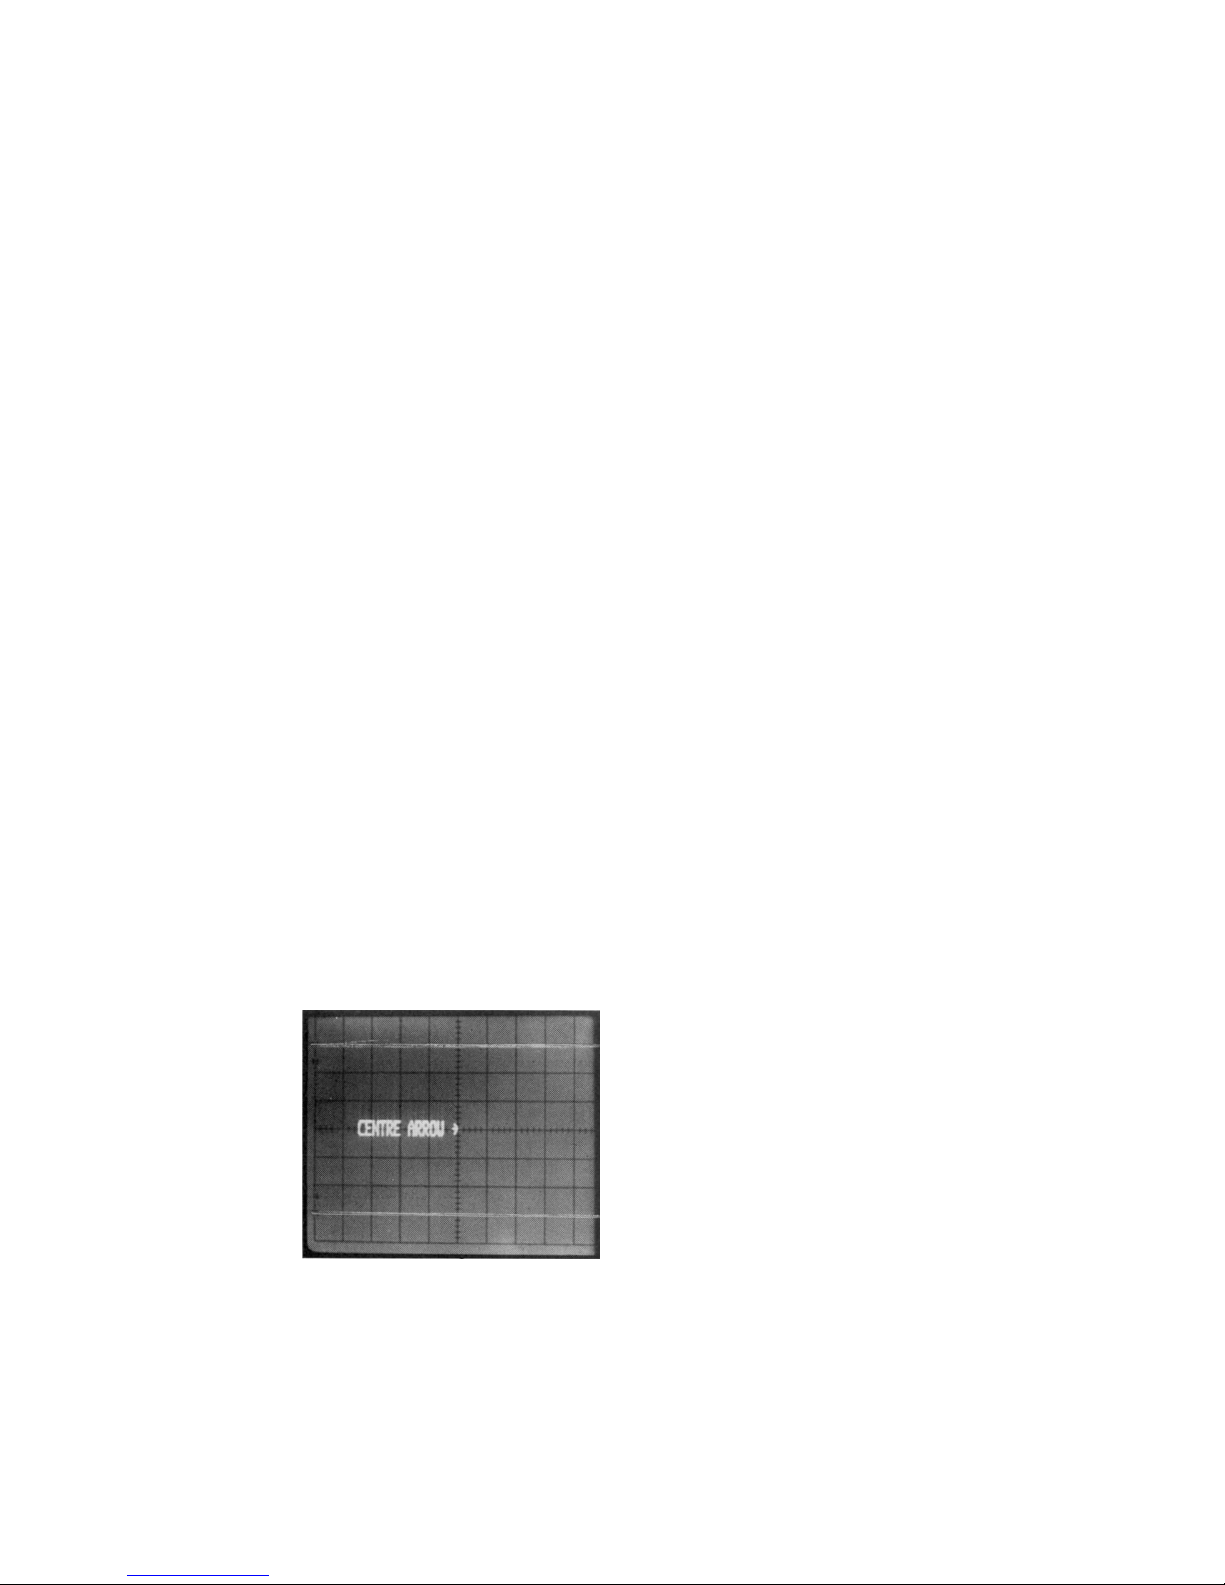
oscilloscope should then show a message as follows:"CENTRE ARROW TIP" alternating with "THEN PRESS ESCAPE"
Adjust the oscilloscope's horizontal and vertical position controls
until the tip of the arrow is exactly in the centre of the screen.
Two horizontal lines should be visible, one at three divisions
above the graticule centre and one at three divisions below.
Pressing the ESCAPE key on the DSA524 (top right-hand corner)
will remove this set-up display and start normal operation.
Once the display oscilloscope has been set up, no further use
need be made of its controls except for occasional re-centering of
the trace to correct for any warm-up drift. To re-centre the trace
press the two keys marked "SET 'SCOPE" (on the lower right of
the DSA) and adjust the oscilloscope's position controls to centre
the arrow tip. If problems occur when setting up the display read
Appendix A.
The oscilloscope setup
display.
R3. FRONT PANEL CONTROLS
All of the controls, including the rotary ones, are monitored by a
microprocessor which then performs the control. All of the
switches are of a momentary non-latching "key" type whose
status is indicated either by lamps under the panel or, where
appropriate, by text on the display. Each rotary control is enabled
or disabled by the key to its right. The control is enabled when
the lamp above the key is off, and is disabled when the lamp is
on.
The keys within the numeric keypad section (right-hand side of
unit) have up to three functions. The normal function is printed
in black above each key. After the SHIFT control is pressed the
function becomes as printed in green above the key. When a
function ending in (NN) is pressed (e.g. SAVE(NN)) the key will
enter the number printed alongside it.
Note that when SHIFT or a function ending in (NN) is pressed,
the lamp marked ENTER will flash to indicate that one or more
further key presses is required. Any function that causes the
ENTER lamp to flash can be cancelled by pressing that function
key again.
Note that some of the functions (including SET 'SCOPE)
automatically set the RUN/HOLD function to HOLD. If digitising
ceases unexpectedly check to see if you have unintentionally
set RUN/HOLD to HOLD.
All of the front panel settings are retained when the power is
turned off (except for RUN/HOLD which is always set to HOLD
at power-on).
R4. ESCAPE AND RESET
The ESCAPE key is used to terminate some of the functions of
the DSA such as "SET PLOT" and "SET AVG". At other times it
has no effect except after SHIFT has been pressed.
Pressing SHIFT followed by ESCAPE gives the RESET function.
RESET places the DSA into a known state. It cancels all of the
more complex functions and sets the DSA into a state which
makes it easy to display the input signals.
The main effect of RESET is to set up the unit as follows:-
RUN /HOLD RUN.
CH1 and CH2 Coupling: AC, Volts/div: 1V, Offset: ZERO,
On/off: ON.
TRIGGER Run/hold: RUN, Source: CH1, Mode: AUTO,
Level: ZERO, Slope: POS, Coupling: AC.
TRACES A Trace A source: CH1, Trace B source: CH2,
and B Gain variable: CAL, Position: HOME.
TIMEBASE Time/div: 20usec.
ALL OTHER
FUNCTIONS OFF.
After pressing RESET the DSA will be set such that the CH1
signal is displayed on trace A and the CH2 signal on trace B.
The display will be updated about three times per second. The
input sensitivity will be set at 1V per division. The timebase will
be set to 20usec/div. The input sensitivity and timebase speed
will need to be adjusted to suit the signal.
R5. CONTROLLING DIGITISING (DATA ACQUISITION)
The digitising of the input signals is controlled by the two keys
at the top of the TRIG section marked RUN/HOLD and SINGLE.
When RUN/HOLD is set to RUN, the DSA is automatically rearmed following each acquisition. Thus digitising is repeated
continuously provided that triggering is active (see Section R9
Trigger — Mode).
When RUN/HOLD is set to HOLD, digitising is stopped and the
contents of the digitising memories is frozen. When set to
HOLD, the DSA can be armed for a single acquisition using the
SINGLE key.
Digitising can be performed on both input signals
simultaneously, or on either signal individually. Each input
channel (CH1 and CH2) is enabled or disabled using the key
marked ON/OFF at the top of each channel section. When one
of the input channels is turned off, the digitising memory
associated with that channel is frozen and digitising takes place
on the other channel alone.
R6. SETTING THE TIMEBASE
The timebase of the DSA524 is somewhat different from that of
a conventional real-time oscilloscope. The time per division
keys, instead of setting a sweep speed, actually control the
Page 4

3
sampling rate of the digitiser. The shorter the time per division
the higher the digitising rate. After it has been stored, the
digitised data is displayed as 1024 samples across the screen
(100 samples per graticule division with 12 samples before and
12 samples after the graticule). Thus the time per division is
equal to 100 divided by the sampling rate.
The timebase should be set in much the same way as with a realtime oscilloscope but, unlike a real-time oscilloscope, the effect of
setting the timebase speed to too slow a rate can cause aliasing
effects on the display (see Appendix B). For this reason if the
signal frequency is unknown a fast timebase speed should be
selected initially.
Alternatively, if the signal is repetitive, the AUTOSET facility can
be used. It is fully described at the end of this section.
As well as setting the digitising rate, the time per division keys
also set the digitising mode. There are three modes:
NORMAL MODE: 100msec to 5usec per division (1KS/s to 20MS /s
sample rates) suitable for single or repetitive events. The screen
is updated after each digitising is completed.
ROLL MODE: 200msec to 200 minutes per division (500S/s to
8.3mS/s sample rate). Suitable for single or repetitive events. The
screen is updated continuously. As digitising takes place, new
data is written onto the right-hand side of the screen and old
data disappears from the left-hand side. Thus the waveform
appears to "roll" across the screen similarly to a strip chart
recorder. (See Section R14. Roll Mode Operation.)
REPEAT MODE: 2usec to 50nsec per division (50MS/s to 2GS /s
equivalent sample rate). Suitable for repetitive events only. The
screen is updated more slowly than in normal mode. The signal
must be repetitive and must be generating a trigger signal. Auto
free-run (trigger mode = AUTO) is not available in repeat mode,
neither is LINE trigger. (See Section R15. Repeat Mode
Operation.)
The time per division keys will autorepeat if held. When a change
in timebase speed causes a mode change a "beep" will be heard.
ROLL and REPEAT (RPT) modes are indicated by front panel
lamps.
When CH1 and CH2 are ON simultaneously the DSA524 uses a
single high speed digitiser to digitise both signals. For timebase
speeds of 20usecs per division and slower, both signals are
digitised together using a very high speed chopping technique.
For timebase speeds of 10usecs per division and faster the
signals are digitised separately on alternate trigger events. The
CHOP and ALT lamps show which mode is being used.
AUTOSET: The autoset function can be used to automatically set
the timebase speed so as to avoid aliasing effects. The input
signal must be repetitive and be generating a trigger signal
whose repetition rate is between 50Hz and 5MHz.
To initiate autoset press the two keys in the timebase section
marked AUTOSET simultaneously. If the trigger rate is between
50Hz and 1MHz the timebase will be reset to a position that gives
between 4 and 10 trigger events across the screen. The AUTO
lamp will illuminate for 3 seconds and the display will show the
message "AUTOSET SUCCESSFUL" for 3 seconds.
If the trigger rate was below 50Hz the timebase setting will
remain unchanged, the AUTO lamp will not illuminate and the
display will show the message "TRIGGER RATE TOO LOW" for 3
seconds.
If the trigger rate was above 1MHz the timebase will reset to
1usecs/div, the AUTO lamp will illuminate for 3 seconds, the
display will show the message "TRIGGER RATE ABOVE 1MHz"
and the DSA will "beep" to indicate that the timebase speed may
need to be set faster.
R7. CH1 AND CH2
The two input channels are identical. The input sensitivity is
variable between 10V and 2mV per division. The maximum
bandwidth is 35MHz down to 20mV/div, 20MHz at 10mV/div,
10MHz at 5mV/div and 5MHz at 2mV/div. The volts per division
keys autorepeat if held. The input coupling can be AC ( 3db =
5Hz) or DC.
When both keys are pressed simultaneously the unit enters an
AUTORANGING mode whereby the sensitivity is automatically
set to maintain a peak to peak signal amplitude between 2 and
4 divisions. The AUTO lamp is then illuminated. To leave autoranging mode press either key. Autoranging does not operate in
"roll" or "repeat" timebase modes.
The digitiser has an input dynamic range equivalent to ± 4.25
screen divisions. To maintain the input signal within this range
an OFFSET control is provided which has a range of ±8
divisions. OFFSET can be set to zero by pressing the
ZERO/(VAR) key. Press it again to return to variable offset.
If the signal goes outside the dynamic range of the digitiser
while digitising is taking place the AUTO/OVLD lamp flashes to
show that a signal overload is occurring. Signal values which
exceed the dynamic range will be digitised as either + 4.25 divs
or - 4.25 divs. Note that the lamp will continue to flash when
the waveform is "held" even if the signal overload is removed.
The input amplifiers have an automatic system for removing
offset errors. If the GND and AC/DC keys are pressed simultaneously an "autocalibration" takes place which re-checks and
removes offset errors from every volts/div position. AUTOCAL
should be used when the unit has warmed up, i.e. after about
20 minutes.
Each channel has an ON/OFF key. The operation of these keys
is explained in the next section (Digitising Memories).
R8. DIGITISING MEMORIES
Each channel has its own digitising memory of 4K words. When
both channels are turned ON (using the channel ON/OFF keys),
both memories are updated whenever digitising is performed.
When one channel is turned OFF, the contents of its digitising
memory is frozen and only the memory for the other channel is
updated.
The contents of the digitising memories is unaffected by the
settings of the trace controls. The digitising memories are nonvolatile i.e. their contents are not destroyed when the power is
turned off.
Note that if either of the digitising memories is storing a waveform which gave rise to an overload condition, the OVLD lamp
will continue to flash until the memory is overwritten with a
waveform which is within the dynamic range of the digitiser.
R9. TRIGGER
The trigger circuitry of the DSA is broadly similar to that of a
real-time oscilloscope. The trigger signal defines the exact
moment at which digitising takes place. Control of the trigger
circuit defines which part of a waveform will be stored.
Many functions are similar to those of a conventional oscilloscope:
SOURCE: Can be from CH1, CH2 or EXT (external
trigger BNC socket).
MODE: AUTO — similar to "Bright Line Auto", the
digitiser free runs if there is no trigger or if the
trigger repetition rate is below 20Hz. If the rate is
above 20Hz digitising takes place in synchronism.
NORM (Normal) — digitising is always in synchronism with the trigger signal. If there is no
trigger signal digitising stops.
LINE — digitising is in synchronism with AC line
rate (50 or 60Hz).
N.B. The trigger modes operate differently when
the timebase is set to "roll" mode (see Section
R14. Roll Mode Operation).
Neither Auto nor Line are available when the
timebase is set to "repeat" mode (see Section
R15. Repeat Mode Operation).
Page 5
4
LEVEL: Variable over ±4 divisions. Press ZERO/(VAR)
key to set zero level triggering, press again to
return to variable.
SLOPE: Can be POS (positive edge triggered) or NEG
(negative edge triggered).
COUPL: Can be AC, DC or HFREJ (high frequency
reject). With TV and video signals, use AC for Line
sync and HFREJ for Frame sync.
N.B. The lamp marked TRIG, to the right of the SINGLE key,
indicates the presence of a trigger signal.
Other functions are specific to the digital storage function:
RUN/HOLD: RUN — enables continuous digitising with
synchronism defined by the trigger mode control.
The previous contents of both digitising memories
are overwritten unless one has already been frozen
using the channel ON/OFF key.
HOLD — disables digitising. The contents of both
digitising memories are frozen.
SINGLE: Only operates when RUN/HOLD is set to
HOLD. Enables a single update of the digitising
memory with synchronism defined by the trigger
mode control.
EVENTS Sets a number of trigger events (0 to 15) which
DELAY: must occur before a trigger is sent to the digitiser.
This allows delayed triggering on complex single-event
waveforms, and can be used to avoid mis-triggering of complex
repetitive waveforms (similarly to Sweep Hold-off on a real-time
oscilloscope). Pressing either key shows the existing value on the
display for three seconds. Repeated pressing increments or
decrements the number, the keys auto-repeat if held. To rapidly
turn events delay off (i.e. to 00) press both keys simultaneously.
Note that when using AUTO trigger mode, events
delay will increase the minimum frequency at
which it can be used from 20Hz to (1 + 20Hz,
where n is the number of events.
TIME DELAY: Sets the time delay between the trigger event and
the start of the digitising process. The delay is
measured in screen divisions and can be positive
(POST TRIGGER DELAY) or negative (PRE
TRIGGER DELAY).
POST — this acts similarly to sweep delay on a
real-time oscilloscope. By adding time delay and
then selecting a faster timebase speed, a section of
a waveform occurring long after the trigger event
can be examined. For "normal" mode timebase
speeds (100msec/div to 5usec/div) the number of
divisions of post-trigger delay is automatically
increased or decreased to maintain a constant time
delay when the timebase speed is changed (within
a limit of 9,999 divisions maximum).
PRE — there is no equivalent to pre-trigger on a
real-time oscilloscope. Pre-trigger allows the part of
the waveform which occurred before the trigger to
be stored and observed. The maximum pre-trigger
delay is —40 divisions.
Pressing either key shows the existing value of
delay on the screen for three seconds. Repeated
pressing increments or decrements the number,
the keys autorepeat if held. To rapidly turn time
delay off (i.e. to 0000) press both keys
simultaneously.
N.B. Neither pre nor post trigger delay is available
in "repeat" mode. In "roll" mode only post trigger
delay is available. See Section R14. Roll Mode
Operation for an explanation.
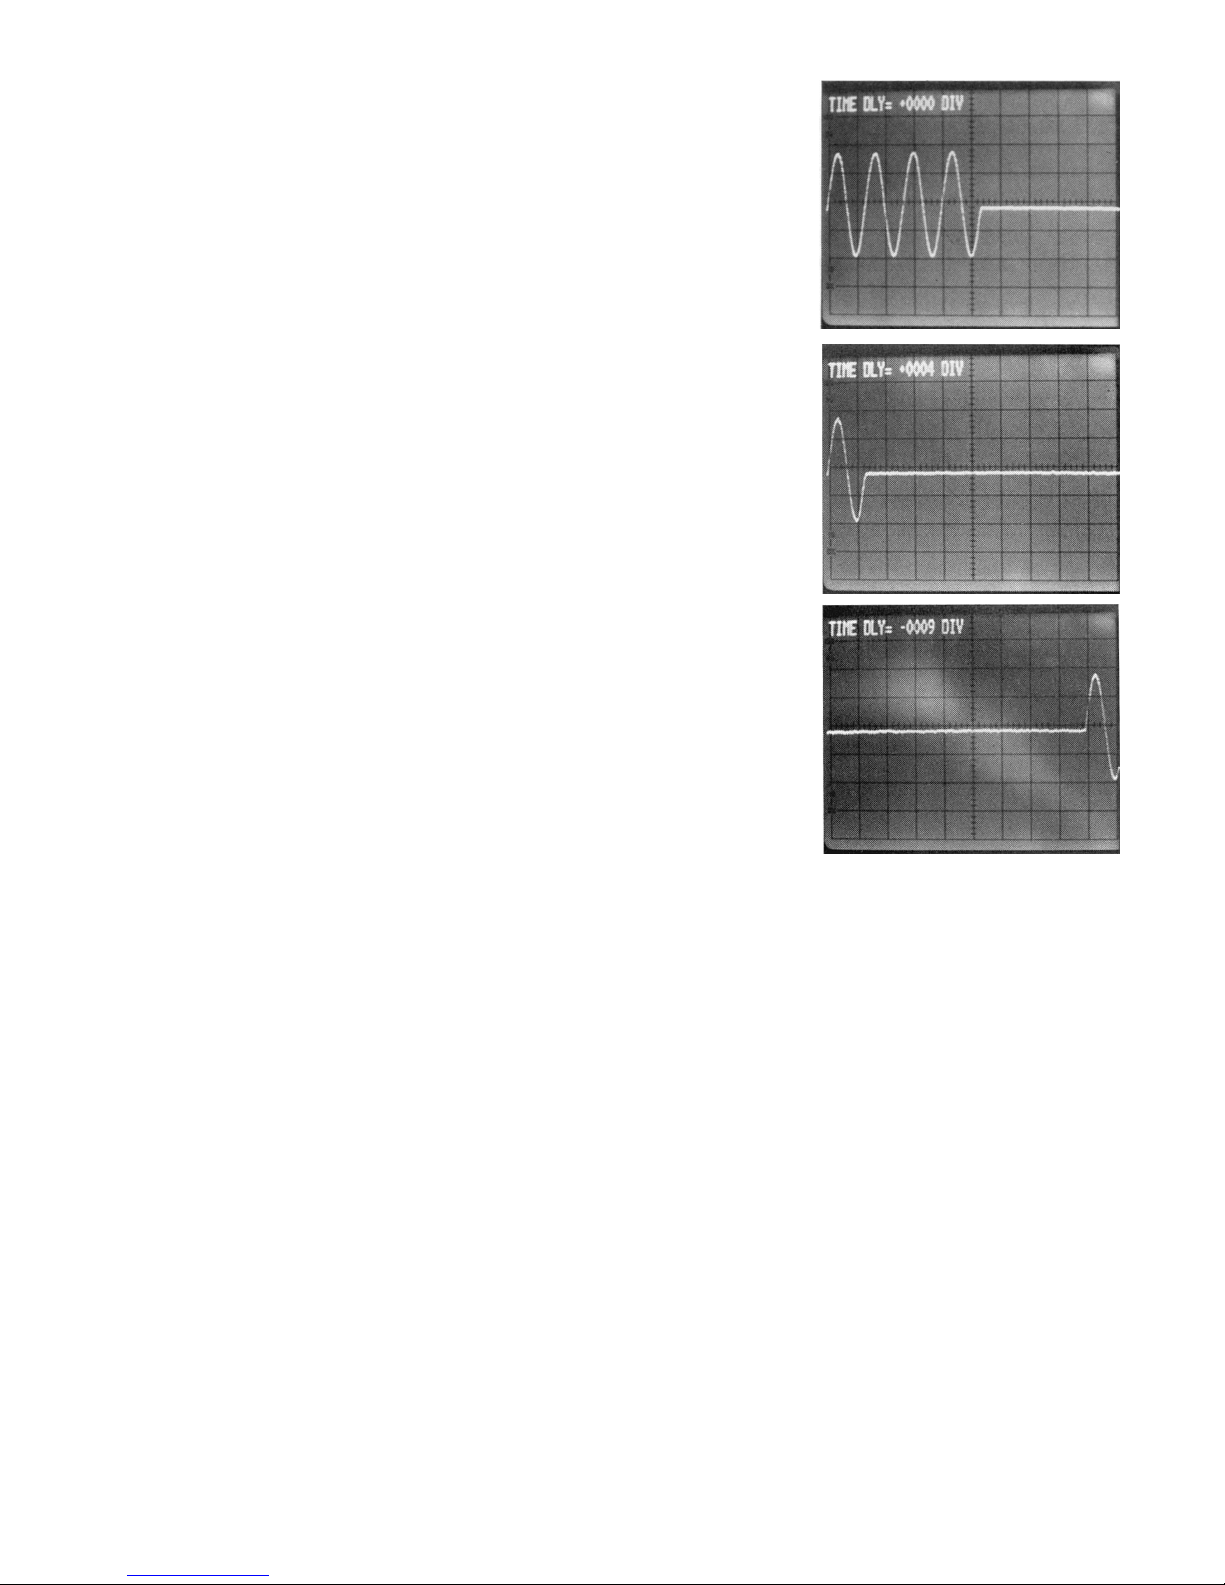
A waveform burst (4
cycles) captured with
no trigger time delay.
The same waveform
burst captured with 4
divisions of post
trigger delay.
The same waveform
burst captured with 9
divisions of pre
trigger delay.
R10. TRACE A AND TRACE B
The DSA524 can display two traces simultaneously, the traces
are called A and B. Each trace has its own 1K word memory
which can be loaded with data either from the corresponding
digitising memory (CH1 for trace A or CH2 for trace B) or from
an indexed waveform memory.
The trace controls operate on the waveform after it has been
digitised but before it has been 'displayed. Therefore they can
be used to modify waveforms recalled from a waveform store
as well as waveforms taken from the digitising memories of the
input channels.
POSITION: Enables the vertical position of the trace on the
display to be adjusted. Pressing the HOME/(VAR)
key toggles between fixed position (HOME) and
variable position.
GAIN Enable intermediate sensitivity levels to be set.
VARIABLE: Pressing the CAL/( UNCAL) key toggles
between calibrated gain (X1) and variable gain
(X1 to X0.2).
CH1 Pressing this key causes the trace to display the
(or
CH2): contents of the digitising memory for the
corresponding input channel.
RCL(NN): (Recall indexed waveform memory). Pressing
this key followed by a two digit number on the keypad
causes the trace to display the contents of the
corresponding waveform memory. It also sets RUN
/HOLD to HOLD.
OFF: Pressing the CH1 (or CH2) and RCL(NN) keys
simultaneously turns the trace off (the CH key should be
pressed first, otherwise RUN/HOLD will be set to HOLD).
Page 6
5
INV(Invert): Applies to Trace B only. Causes the waveform
to be displayed inverted.
ADD B: Applies to Trace A only. Displays the sum of
what is presently on Trace B and what was
previously on Trace A.
SAVE(NN): Pressing this key followed by a two digit number
causes the waveform presently displayed on that
trace to be stored in the corresponding waveform
memory. It also sets RUN/HOLD to HOLD.
R11. MEMORY SEARCH (COMP/SCAN/MAG)
Although the size of each trace memory is 1K words (equivalent
to 10.24 divisions across the screen) the size of each digitising
memory is 4K words (equivalent to 40.96 divisions). Normally
each trace memory is filled with the first 1K words from the corresponding digitising memory. (Note that in "roll" mode it is the
last 996 words — see Section R14. Roll Mode Operation.)
To enable all of the digitising memory to be viewed, a SEARCH
key is provided next to the timebase section. Pressing SEARCH
cycles through three states as detailed below. The actual mode is
indicated both by a corresponding front panel lamp and by a
diagram on the display which remains there for three seconds
after the mode has been changed.
COMP: Compresses all 4K words of the digitising
memory into the 1K words of the trace memory by
transferring every fourth word.
SCAN: Enables any 1K section of the digitising
memory to be transferred to the trace memory via
a moveable window. The window is moved using
the two keys marked SCAN/MAG. The position of
the window is shown graphically on the display for
three seconds whenever either key is pressed.
Repeated pressing of either key moves the window
left or right in one division (100 word) steps. The
keys autorepeat if held.
MAG: Digitally magnifies any 100 word section of the
trace memory by ten so that it fills the display. The
section is selected via a moveable window which is
moved using the two keys marked SCAN/MAG. The
position of the window is shown graphically on the
display for three seconds whenever either key is
pressed. Repeated pressing of the key moves the
window left or right in half division (50 word)
steps. The keys autorepeat if held.
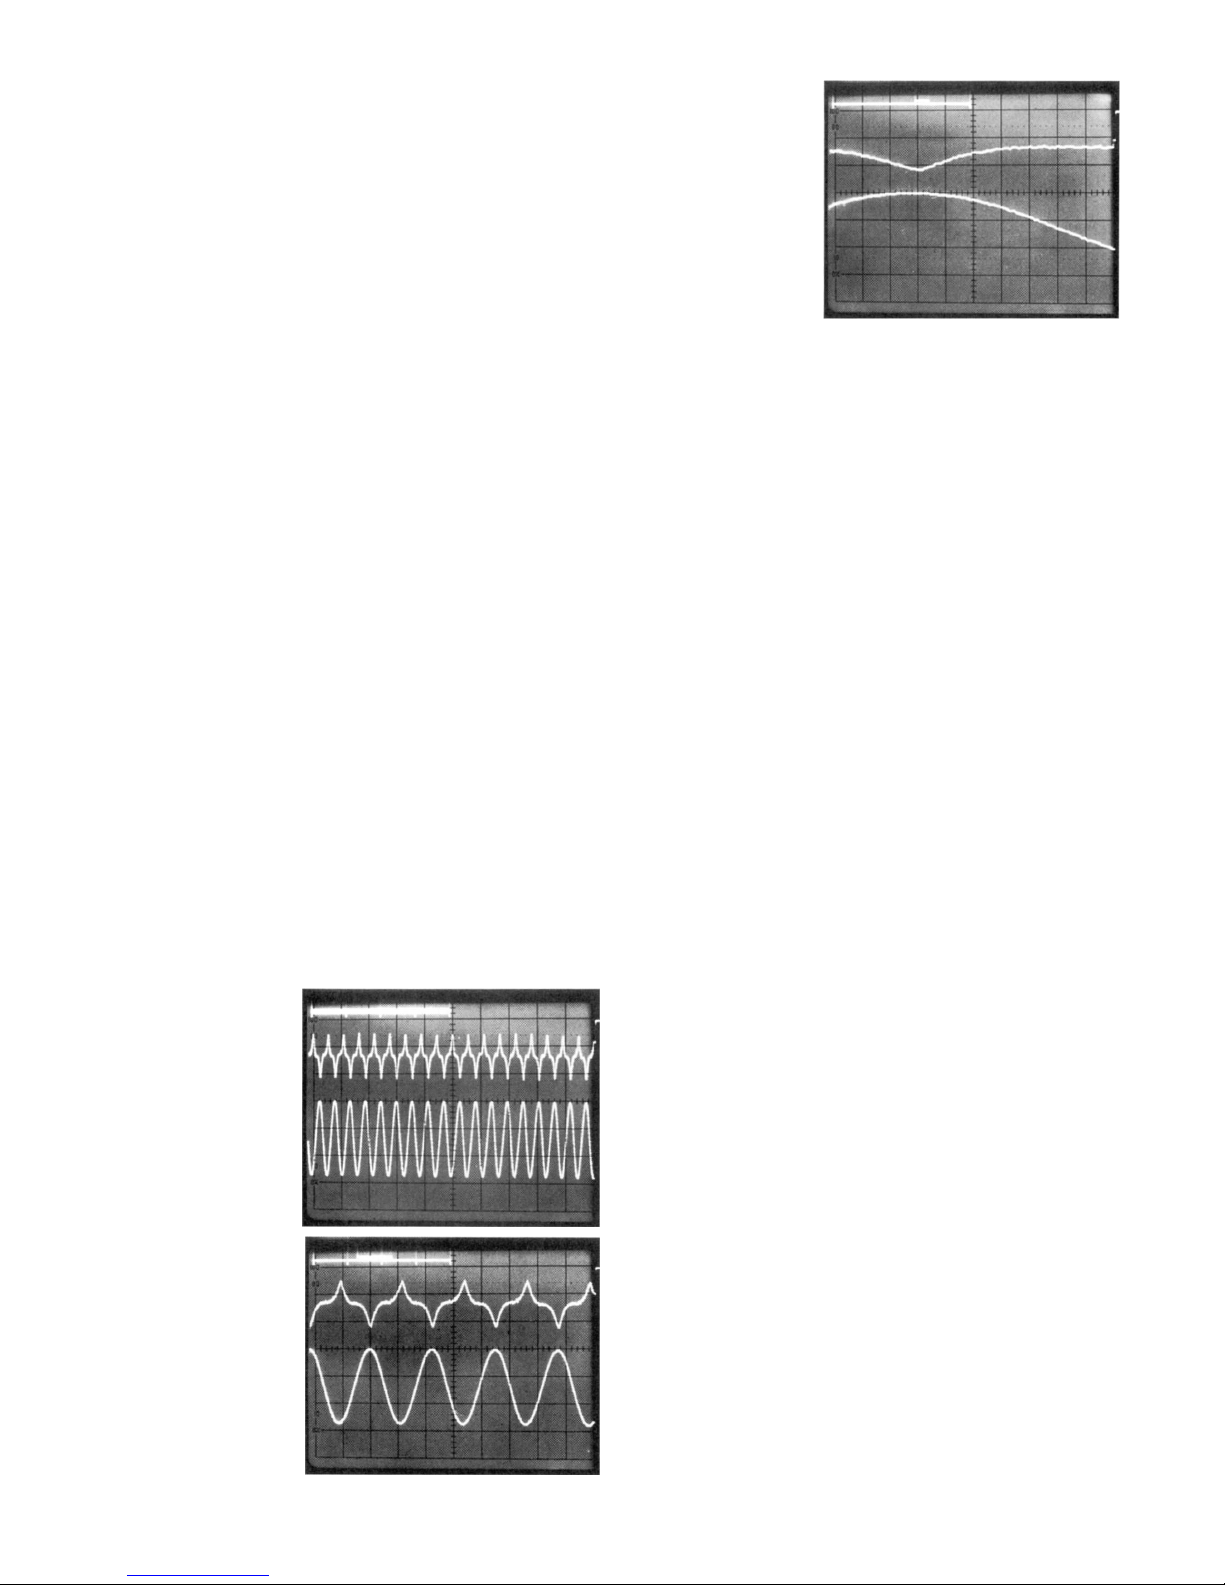
A captured waveform
displayed using Compress mode.
The same waveform
displayed using Scan
mode.
The same waveform
displayed using
Magnify mode.
To leave SEARCH mode and set the display mode back to
normal, press the two SCAN/MAG keys simultaneously.
If one of the traces is displaying a waveform recalled from an
indexed waveform memory when SEARCH is selected, the recalled waveform will remain unaffected.
R12. INDEXED WAVEFORM MEMORIES
The DSA524 has sixteen 1K word memories for temporary or
permanent storage of waveforms. Each memory is identified by
a two digit number from 01 through to 16. The memory is supported by trickle charged Ni-Cad batteries which will remain
charged for several months should the unit be left unpowered.
To store a waveform in an indexed memory, obtain the required
waveform on the display and press the SAVE(NN) key for the
appropriate trace. This will cause the ENTER lamp above the
numeric keypad to flash. Enter the two digits corresponding to
the required memory position, the display will show "MEMORY
NN = TRACE A (or B) for 3 secs.
Note that the waveform is stored exactly as it appears on the
display except for its vertical position which is stored as it would
be if the trace position control was at HOME.
To recall a waveform from an indexed memory, press the
RCLINN) key for the trace on which the waveform is to be displayed. This will cause the ENTER lamp above the numeric keypad to flash. Enter the two digits corresponding to the required
memory, the display will show "TRACE A (or B) = MEMORY NN"
for 3 secs.
When a waveform recalled from an indexed memory is being
displayed, the MEM lamp on the corresponding trace will be illuminated. The memory number from which it was recalled can
be checked by pressing the RCLINN) key twice.
Any trace recalled from a waveform store is temporarily suppressed when in "roll" mode RUN or SINGLE.
R13. DISPLAY UPDATE RATE
In "normal" mode (timebase speeds between 100msec and
5usec per division) the display update rate can be varied. This
is done with the key marked RATE (within the timebase
section).
The default update rate (NORM) re-starts the digitising process
about 300msecs after the completion of the previous one. This
gives a display update rate of about 3 per second for higher
timebase rates, slowing down as the timebase speed gets into
the tens of milliseconds (at 100msec per division digitising takes
4 seconds).
Pressing the RATE key once enters SLOW update mode. This
increases the delay from 300msec to 3secs giving more time for
each digitising of the waveform to be observed carefully. Pressing the key again returns to normal update rate.
Holding the RATE key depressed for two seconds enters FAST
update mode. This reduces the delay from 300msec to 20msec
giving a virtually instant update which mimics a real-time
oscilloscope. Pressing the key again returns to normal update
rate.
Entering FAST update mode reduces the acquisition memory
size to 1K words per channel and disables all of the trace
control functions except for trace position. Search mode
(COMP/ SCAN/MAG) and Average (AVG) are also disabled.
Page 7
6
When RUN/HOLD is set to HOLD, the remaining 3K words per
channel of the digitising memory are set to zeroes and the
disabled functions are restored. Pre-trigger time delay is limited
to 10 divisions in FAST mode.
In "roll" and "repeat" modes the RATE key is disabled.
R14. ROLL MODE OPERATION
In "roll" mode new data is written onto the right-hand side of the
display as digitising takes place. Thus the waveform appears to
roll across the screen. The operation of the DSA524 in "roll"
mode (timebase speeds of 200msecs and below) is different from
its operation in other modes in several respects:
a) Triggering and Display Update Rate
Because the waveform data is written continuously onto the display, it is not necessary to continually stop and restart the digitising process. Consequently when RUN /HOLD is set to RUN,
digitising takes place continuously and triggering is disabled. The
RATE key is disabled.
When RUN/HOLD is set to HOLD, triggering is enabled for
operation via the SINGLE key. Pressing SINGLE commences the
"roll" and the trigger event stops it, thus the waveform data
captured is entirely pre-trigger data. Consequently if a trigger
occurs immediately, no data will be captured unless some posttrigger time delay has been set. When the trigger mode is set to
AUTO, triggering occurs immediately. When the trigger mode is
set to NORM, triggering occurs synchronously with the trigger
signal.
Because in "roll" mode the trigger stops the digitising process
instead of starting it, all the data in the digitising memory is pretrigger data unless some post-trigger time delay has been set.
Pre-trigger time delay is therefore not needed and is disabled.
b) Display Window and Search mode
Because the waveform data is written continuously to the screen
as digitising takes place, the display shows the last part of the 4K
digitising memory instead of the first part. Because the left hand
edge of the display window is set in steps of 100 words, only 996
words are displayed and the remaining 28 words are set to zero.
SEARCH can only be selected in HOLD, and the scan window is
initially set fully to the right instead of fully to the left.
c) Trace Controls
When in roll mode, operation of any of the trace controls (e.g.
gain variable) will effect only the waveform data on the display
which was captured after the control was changed. However,
when the digitising process is stopped, the new trace control
values will be applied to the whole of the contents of the
digitising memory including waveform data captured before the
change was made.
R15. REPEAT MODE OPERATION
In normal mode the DSA524 can digitise a waveform at up to
20MS /s digitising rate, equivalent to 5usecs per division. If the
waveform is repetitive (as opposed to being a single event) it can
digitise the waveform repetitively, gradually building up the data
in the digitising memory. This mode of operation, known as
"repeat" mode, is used for timebase speeds of 2usecs and above
and provides equivalent digitising rates of up to 2GS /s (50nsecs
per div.). The operation of the DSA524 in repeat mode is
different from its operation in normal mode in several respects:
a) Triggering
Repeat mode requires a synchronously triggered waveform,
AUTO and LINE trigger modes are therefore disabled. Time delay
is not available (neither pre nor post trigger). The trigger event is
not captured, the first section of the waveform captured starts
350 nanoseconds after the trigger event.
b) Display Update Rate
Repeat mode involves complex manipulation of data which can
take several seconds per digitisation. The display update rate
varies between about one per second for a single channel at
2usecs/div to one every 10 seconds for both channels at
50nsecs/div. The Rate key is disabled in repeat mode.
R16. CURSOR MEASUREMENT
Moveable cursors allow accurate measurements of voltage and
time to be made on either Trace A or Trace B via an on-screen
digital readout.
To select cursor measurement, press the key marked ON/OFF
within the numeric keypad. Cursors will appear on Trace A, and
Trace B will be suppressed. Pressing the key marked A/ B
selects Trace B instead of Trace A. To turn cursor measurement
off press the ON/OFF key again.
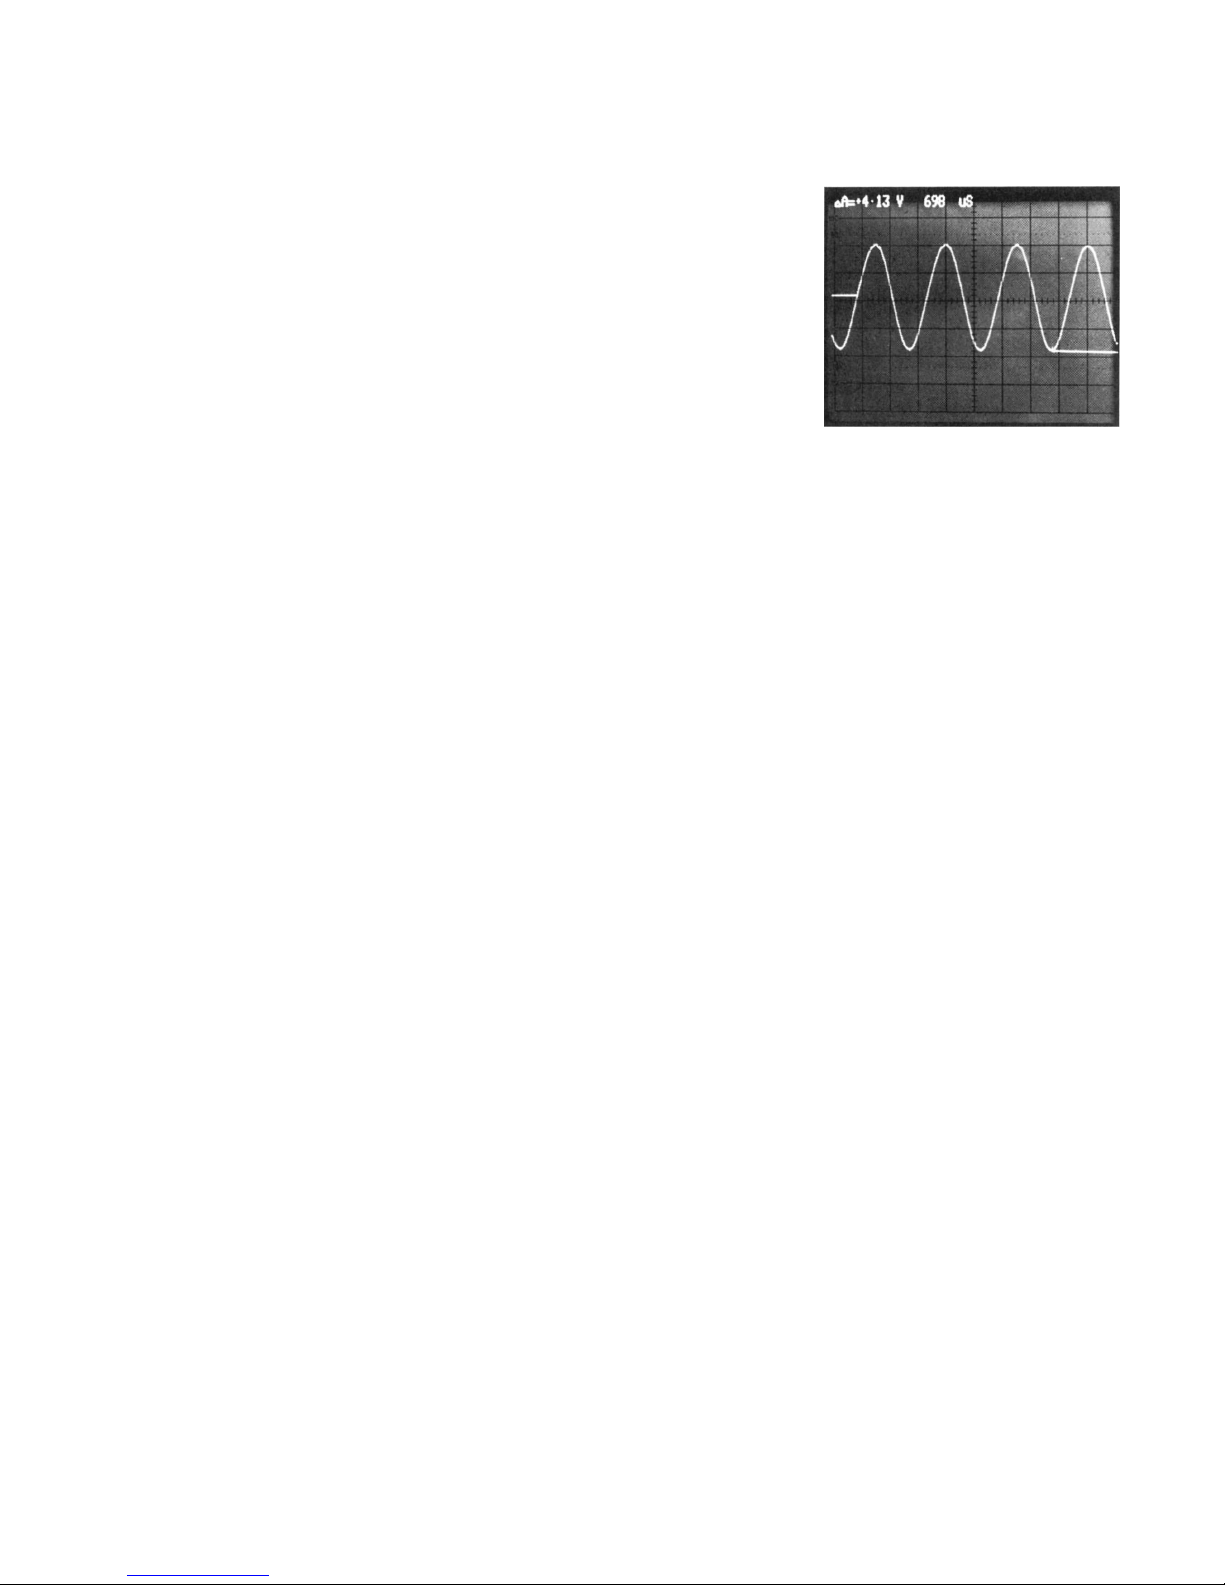
Cursor measurement.
The cursors are flashing horizontal lines which each terminate
at a point on the waveform. The reference cursor is on the left
hand side of the screen, the delta cursor is on the right hand
side. The measurement is made between the two lines. The
readout shows the voltage and time difference between the end
of the reference cursor line and the start of the delta cursor
line. The cursors are moved using the arrow keys marked REF
CURS and ∆ CURS respectively.
R17. PROGRAM MODE
The DSA524 can operate as a fully programmable instrument. It
can "learn" individual or sequential front panel settings, store
them in non-volatile memory, and "replay" them on demand.
Up to 50 settings can be stored.
Each front panel setting includes the state of every key and
rotary control and the source of each trace waveform. Thus if a
setting is "learned" which includes a trace recalled from a waveform store, that same store will be recalled again when the setting is "re-played". Thus reference waveforms can be recalled
automatically within PROGRAM mode.
To "learn" one or more settings press the LEARN key, this turns
on learn mode. The display will show the message "NEXT
POSITION = NN" for 3 seconds where NN is a number between
01 and 50 corresponding to the position set when the unit was
last used.
To store a front panel setting in this position, ensure that the
front panel is set as required and press the SET/NEXT key. The
display will show the message "STORED IN NN" followed by
"NEXT POSITION = NN + 1". To store another front panel setting, reset the front panel as required and press the SET/NEXT
key again. To store the setting in any other memory position,
press the SET(NN) key followed by a two digit number between
01 and 50.
The next memory position can be checked at any time by
pressing the LEARN key again.
To "replay" one or more settings press the REPLAY key, this
turns on replay mode. The display will show "NEXT POSITION =
NN" as for learn mode. To replay the front panel setting corresponding to this position press the SET/NEXT key. The display
will show "REPLAYED FROM NN" followed by "NEXT POSITION
= NN + 1". Press the SET/NEXT key again to replay this next
position. To replay any other position press the SETINN) key
followed by a two digit number between 01 and 50.
The next memory position can be checked at any time by
pressing the REPLAY key again.
Whenever the front panel is set using the replay mode all the
rotary controls become inoperative. To make any rotary control
operative again press the key directly to its right. (Press once if
the lamp above the key is on, or twice if it is off.)
To exit either learn or replay modes press the LEARN and
REPLAY keys simultaneously.
Page 8

7
R18. SINE INTERPOLATION
When the display mode is set to MAG (magnify) the number of
true samples shown across the screen is reduced to 102. Although 1,024 samples are displayed, 9 samples out of each block
of 10 are mathematically calculated using linear interpolation.
Linear interpolation provides a good reconstruction of the original
waveform provided that either the number of samples per cycle
of the waveform is reasonably high (i.e. ten or more) or, if the
number of samples is low, that the original waveform is made up
mainly of linear elements (e.g. pulse, sawtooth, triangle
waveforms).
When the waveform is basically sinusoidal and the number of
samples per cycle is low, linear interpolation will not provide a
satisfactory reconstruction and sine interpolation should be used
instead. Sine interpolation uses a mathematical curve fitting algorithm and can provide a near perfect reconstruction of a sine
wave from only four samples per cycle. See Appendix C for a
detailed discussion of interpolation.
Pressing the SINE INTERPOLATE key toggles the function on or
off as indicated by the lamp above the key. Interpolation is only
active when the SEARCH mode is set to MAG. Sine interpolation
slows down the display update rate considerably.
R19. AVERAGE
The RUN AVERAGE function allows a number of digitisations of
the waveform to be summation averaged before being displayed.
This improves the signal to noise ratio of a noisy signal and can
often enable a signal to be observed that would otherwise have
been masked by large amounts of HF or LF noise. The average
function reduces the size of the digitising memories to 1K words
per channel.
The number of waveform digitisations which are averaged can be
Set to any number between 2 and 256. To change the number of
readings averaged press SHIFT (key 8) followed by SET AVG (key
4). The current averaging value is shown on the display and can
be incremented or decremented using the REF CURS keys (keys 2
and 3). When the required number is displayed, press ESCAPE.
Pressing the RUN AVERAGE key enables averaging, pressing the
key again disables it again, the status is indicated by the lamp
above the key. Acquisitions continue to be controlled by the
RUN/HOLD and SINGLE keys.
When the display update rate is set to NORM the display is
updated only whenever the total number of averages has been
completed. When the update rate is set to SLOW the display is
updated continuously as averaging takes place. The display
shows the number of averages currently accumulated.
Note that averaging slows down the display update rate. This is
particularly so at fast timebase speeds in "repeat" mode and slow
timebase speeds in normal mode.
R20. A= AXB (TRACE MULTIPLY)
This function provides a display of the Trace A waveform multiplied by the Trace B waveform. It is particularly useful for obtaining power waveforms.
Press SHIFT (key 8) followed by AxB (key 2). The two waveforms
will be multiplied together and displayed on Trace A (Trace B
continues to be displayed). To return to a normal display press
ESCAPE.
The multiplied waveform is scaled using units of one screen
division with the centre of the screen being zero. The traces are
multiplied exactly as they appear on the oscilloscope display including offsets introduced by the trace position controls. Thus at
a point where the position of Trace A is +2 divs and of Trace B is
—1.5 divs, the value of the multiplied waveform will be — 3 divs.
It should be noted that if either trace has values greater than ± 1
divs then overflows could occur on the multiplied waveform. The
displayed waveform is limited to ± 4.25 divisions and consequently —3 divs multiplied by —2.5 divs will be displayed as +
4.25 divs instead of + 7.5 divs.
The AxB function cannot operate while digitising is taking place.
Pressing the AxB key will set RUN/HOLD to HOLD. The function
multiplies the traces exactly as they appear at the moment that
the AxB key is pressed. When the function is enabled all of the
trace controls are inoperative with the exception of the Trace A
position control which can be used to adjust the position of the
multiplied waveform.
R21. LINE OR DOTS DISPLAY
In line display mode the 1,024 individual points of the display
are joined with angled lines to simulate one continuous line.
This gives a display which is easier to view and less subject to
visual aliasing than one made up of dots (see Appendix B).
Sometimes, however, it is desirable to see the exact points on
the waveform where samples have been taken, along with their
levels. Pressing SHIFT (key 8) followed by DOTS (key 7) causes
the points to be joined by right-angled lines which form a staircase. Since the horizontal lines are brighter than the vertical
ones, this gives an impression of dots and makes it easier to
see each sample point and its associated level.
Also the line display may reduce the amplitude of waveforms
where successive samples can have very large vertical
separations. Such a waveform will also appear brighter if a dots
display is used.
To return to a line display press LINE (key 7). The unit defaults
to a line display after RESET.
R22. PLOT
The waveforms shown on the oscilloscope display can be sent
either to a digital X-Y plotter (HP-GL compatible) using the RS423 interface; or to an analog X-Y plotter or Y-T chart recorder
using the analog plotter interface.
The plot function can be directed either to the RS-423 interface
for use with a digital plotter, or to the analog plotter interface.
The DSA is factory initialised for use with a digital plotter. To
change to use with an analog plotter key in "function 26" (press
FUNCTION NN, followed by 2 followed by 6). To return to use
with a digital plotter key in "function 27".
a) Digital Plotter
The digital plotter must be compatible with HP-GL plotting commands and must be fitted with a serial interface for connection
to the RS-423 interface socket of the DSA. For details of making
connections and of setting the baud rate see Section R25
’RS-423 Interface’. Alternatively, if the DSA has the IEEE-488
interface option fitted, a plotter with an IEEE-488 interface may
be used.
To commence plotting press PLOT (key 6), the time and voltage
per division and a graticule will be plotted followed by Trace A
followed by Trace B. If the plotter is a multi-pen plotter the text
and the graticule will be plotted using pen 1, Trace A will be
plotted using pen 2, and Trace B will be plotted using pen 3.
The entire plot fits onto an A4 sized sheet. To abandon plotting
at any stage press ESCAPE.
b) Analog Plotter
The analog plotter interface is mounted on the rear panel and
comprises five 4mm sockets marked X, YA, GND, YB, and PL
(pen lift).
The waveforms for Trace A and Trace B are sent simultaneously
to their separate output sockets along with an X axis signal for
use with X-Y plotters. The 10.24 divisions of the display are
plotted using a level of 100mV/div (for both Y and X) at a rate
selectable as 1, 2, 5 or 10 seconds per division. The pen-lift
signal is normally "low to lift" but can be inverted.
To set the plot rate, press SHIFT (key 8) followed by SET PLOT
(key 5)., The oscilloscope display will show the present plot
rate. Press one of the REF CURS keys (key 2 or 3) to select a
new value, then press ESCAPE.
Page 9

8
To commence plotting press PLOT (key 6). The oscilloscope display will show a series of prompts for setting the plotter. If RUN /
HOLD is at RUN it will be set to HOLD. To abandon plotting
before it is completed press ESCAPE.
A more complete description of the analog plotter PLOT function
is given in Appendix D.
R23. PRINT
The waveforms shown on the oscilloscope display can be converted to hard-copy using a dot-matrix printer. The printer must
be compatible with EPSON graphics commands (including quad
density bit mapping) and must be fitted with a serial interface for
connection to the RS-423 interface socket of the DSA. For details
of making connections and of setting the baud rate see Section
R25. Baud rates below 2400 are not recommended as the
printing time becomes excessive.
The waveforms are printed with an 8x10 graticule using the same
1:1 aspect ratio as the oscilloscope display. They are preceded by
several lines of text which detail the present settings of the DSA.
Line feeds are arranged so that two prints will fit onto one sheet
of 11 inch paper.
To commence printing, press SHIFT (key 8) followed by PRINT
(key 6). RUN /HOLD will be set to HOLD and printing will commence. To abandon printing before it is completed press ESCAPE.
R24. REMOTE CONTROL AND DIGITAL DATA TRANSFER
The DSA can be fully controlled via its RS-423 serial interface or
its IEEE-488 interface (if fitted). Anything that can be controlled
from the front panel can also be controlled via these digital interfaces. Waveform data can be sent to and from the DSA using the
interfaces, and a variety of other functions are also available.
The software commands for use on either of these interfaces are
listed in Appendix F. ‘Software Commands’.
R25. RS-423 INTERFACE
The DSA524 is fitted with an RS-423 serial interface which is fully
compatible with equipment fitted with an RS-232C interface. It
can be used for remote control of the DSA, for bidirectional data
transfers and for connection to a printer or a digital plotter.
The RS-423 interface is connected via the 9 pin female D
connector mounted on the rear panel. The connections are as
follows:
Pin No. Name Function
2 RXD Input line for sending data to the DSA
3 TXD Output line for sending data from the DSA
5 GND Signal ground line
7 RTS Output line for handshaking (Request to
Send)
8 CTS Input line for handshaking (Clear to Send)
The interface operates with 8 data bits, 1 start bit, 1 or more
stop bits, no parity. If hardware handshaking is not being used,
pin 8 (CTS) must be pulled permanently high, this can be done
by linking it to pin 7 (RTS) and forcing RTS permanently high by
using function 83 (see Section R27). X-on/X-off handshaking can
be used as an alternative to hardware handshaking.
The baud rate is adjustable in binary steps between 300 baud
and 38,400 baud. Once set, the baud rate is stored in nonvolatile memory and will remain set. As shipped from the factory
it is set to 9,600 baud.
To change the baud rate press SHIFT (key 8) followed by SET
BAUD (key 3). The display will show "baud rate = 9600" (for
example). Use the reference cursor keys (keys 2 and 3) to
increase or decrease the rate, then press ESCAPE. If the DSA is
not connected to an oscilloscope the baud rate may be set
directly using the FUNCTION NN key (see Section R27).
Note that as well as the options of 300 through to 38,400 there is
a further option of IEEE. This option is exclusively for use when
the optional IEEE-488 interface board is installed and enabled.
Note that the RS-423 interface cannot be used when the IEEE488 interface is enabled.
Further details of making connections to the RS-423 interface
are given in Appendix E.
A description of the software commands for remote control and
data transfer via the interface is given in Appendix F.
R26. GP-IB (IEEE-488) INTERFACE
An optional module is available which interfaces the DSA524 to
the General Purpose Interface Bus (GP-IB) using the IEEE-488
standard. This option makes all of the functions which are available via the RS-423 interface also available via the GP-IB interface. The interface can be used either with a controller or without a controller in "talker only" mode for connection to a printer
or digital plotter.
A full description of the fitting and operation of the GP-IB interface module is provided in the separate manual supplied with it.
A description of the software commands for remote control and
data transfer via the interface is given in Appendix F. ‘Software
Commands’.
R27. DIRECTLY ACTING FUNCTIONS
Some of the parameters of the DSA which are normally set
interactively using the text readout on the oscilloscope display
can also be set directly using the FUNCTION NN key. These
include setting the baud rate for the RS-423 interface and
setting the analog plotter rate.
A full list of these functions is given below:
Set Analog Plotter Rate 1sec /div 21
2sec/div 22
5sec/div 23
10sec/div 24
Select Analog Plotter Routine auto version 25
Select Analog Plotter Routine prompted version 26
Select Digital Plotter Routine 27
Set Baud Rate 300 30
600 31
1200 32
2400 33
4800 34
9600 35
19200 36
38400 37
IEEE-488 mode 38
Turn bandwidth limiting off 80
Turn bandwidth limiting on (factory default) 81
(a bandwidth limit of about 6MHz is applied
except in repeat mode)
Enable hardware handshaking via RTS (factory default) 82
Disable hardware handshaking via RTS 83
(disabling RTS handshaking forces RTS permanently high)
Note that the RESET function cancels the effect of Function 80.
The following functions are intended for use by Service Engineers only (in conjunction with the appropriate service manuals):
Start analog plotter calibration routine 20
Check display lamps 70
Check keyboard switches 71
Check rotary controls 72
Check DAC output waveform 73
Check RS-423 operation 74
Check Autocal values 75
Return bytes from RS-423 input buffer 76
Clear all set-up parameters 78
Function 78 can be used if the DSA appears to have suffered a
program corruption from which it cannot be made to recover
either by switching the DSA off or by using the RESET function.
Note that the contents of all the memories including the
indexed waveform stores and the PROGRAM memory will be
cleared. Function 78 restores the DSA to the same state as
when it left the factory.
Page 10

9
USERS TUTORIAL
The sophisticated facilities of the DSA524 have resulted in a fairly complex instrument. This "hands-on" tutorial takes the user through
most of the functions of the unit step by step, and provides an easy method of gaining familiarity with its operation.
New users should follow the tutorial exactly and resist the temptation to experiment with functions before they have been covered.
Existing users may find the tutorial useful for covering functions with which they are not yet familiar. Each section is complete in itself
and commences with the DSA being "reset" using SHIFT followed by RESET, and with the signal generator being set to SINE, 20kHz,
5V pk-pk.
INDEX TO THE TUTORIAL
Page
Equipment Required 10
Setting up the Equipment 10
First Steps 10
What to Expect 10
The Display Oscilloscope 10
Front Panel Controls 10
Getting out of Trouble 10
Part One The Basic Functions.
Controlling Digitising 10
Controlling the Input Channels 11
Controlling the Traces 11
Setting the Timebase 12
Normal Mode 11
Roll Mode 12
Repeat Mode 12
Triggering 12
Part Two More Advanced Functions.
More about Triggering 12
More about Roll Mode 13
Memory Search 13
Display Update Rate 13
Indexed Waveform Memories 14
Cursor Measurement 14
Averaging 14
Dot Joining and Interpolation 14
Trace Multiply 15
Program Mode 15
Hardcopy Output 15
Remote Interfacing 15
A Final Word 15
Page 11

10
Equipment Required
1. A conventional real-time oscilloscope for the display, the
minimum specification: 5MHz bandwidth, single channel,
8x10 division graticule.
2. A wide frequency-range signal source, preferably a
function generator. (The tutorial assumes that a function
generator is being used.)
3. Three BNC to BNC connecting cables.
Setting-up the Equipment
1. Connect the rear panel BNC socket of the DSA marked
"composite" to the CH1 input of the oscilloscope.
2. Set the oscilloscope as follows:
Mode: Single channel (CH1)
CH1 input coupling: DC
Sensitivity: 100mV/div
Timebase: 50usecs/div
Trigger source: CH1 (not vertical mode)
Trigger coupling: AC
Trigger slope: Negative
Trigger Level: Negative (slightly)
Sweep delay, sweep
hold-off etc: Zero or minimum
3. Connect the main output of the function generator to the
CH1 input of the DSA. Connect the Sync or TTL output to
CH2.
First Steps
1 Switch on the DSA (the power switch is at the rear). The
oscilloscope should then show the message "CENTRE
ARROW TIP" (alternating with "THEN PRESS ESCAPE").
Adjust the trigger level if necessary.
2. Adjust the vertical and horizontal shift controls of the os-
cilloscope until the arrow tip is in the centre of the
graticule.
3. Set the function generator to SINE, 20kHz, 5V pk-pk.
4. Press the ESCAPE key. Then press SHIFT followed by
RESET. This ensures that all of the more complex functions are cancelled, and that the DSA is put into a known
state as follows:
Both channels ON, 1V /div, AC coupled, 20usec/div AUTO
trigger from CH 1.
The display should now be showing a sine waveform and
a pulse waveform, each of around 5 divisions pk-pk amplitude and around 2.5 divisions period.
What to Expect
The unit is now operating as a digital storage oscilloscope. Both
input signals are being repetitively digitised by an analog to
digital converter (ADC), and stored in a memory the contents of
which is being converted back into analog signals by a digital to
analog converter (DAC) and then displayed on the screen via a
display multiplexer. This process takes a little time, introducing a
slight delay between a change occurring at the input and that
change appearing on the display.
The display multiplexer mixes together the two traces, the trigger
signal and, when needed, text. At the far left of the screen the
valid section of the trace is preceded by a very narrow negative
pulse followed by a horizontal line at the trace zero level (this can
be removed by using a two cable connection — see Appendix A).
Following the valid section, at the far right of the screen, the
trace is shifted up to the top of the display area.
When the display is correctly centred, the valid section of the
traces starts 0.12 divisions to the left of the graticule and ends
0.12 divisions to the right of it. If the timebase of the display
oscilloscope is not perfectly calibrated, the valid section may be
slightly longer or shorter than this.
Each trace is made up of 1024 samples across 10.24 horizontal
divisions of the screen (100 samples per division). Each sample
can be at any of 256 levels within 8.53 vertical divisions (30
levels per division).
Because the display is made up of discrete steps, waveforms do
not look quite the same as they do with an analog oscilloscope.
The minimum level change between samples is one thirtieth of
a division, and even where the input signal level is constant the
digitised level may vary slightly. This variation is caused by
noise on the signal, noise in the input amplifiers, or digitising
noise in the ADC (typically ± )bit) and results in the digitised
waveform looking slightly "ragged" when compared with an
analog oscilloscope. Noise on the waveform of an analog
oscilloscope is averaged out by the eye.
The Display Oscilloscope
Once the display oscilloscope has been set up, no further use
need be made of its controls except for occasional re-centering
of the trace to correct for any warm-up drift. To re-centre the
trace press the two keys marked "SET 'SCOPE" (on the lower
right of the DSA) and adjust the oscilloscope's position controls
to centre the arrow tip.
Front Panel Controls
The front panel of the DSA524 is completely "cold", that is to
say that there are no direct links between the front panel and
the circuitry. All of the controls, including the rotary ones, are
monitored by a microprocessor which then performs the control. All of the switches are of a momentary non-latching type
whose status is indicated either by lamps under the panel or,
where appropriate, by text on the display. This system enables
complete digital programming of the front panel when required.
The keys within the numeric keypad section (right-hand side of
unit) have up to three functions. Their normal function is
printed in black above each key. After the SHIFT key is pressed
the function becomes as printed in green above the key. When
a function ending in (NN) is pressed (e.g. SAVE(NN)) the key
will enter the number printed alongside it.
Note that when SHIFT or a function ending in (NN) is pressed,
the lamp marked ENTER will flash to indicate that one or more
further key presses is required. Any function that causes the
ENTER lamp to flash can be cancelled by pressing that function
key again.
Note that some of the functions (including SET 'SCOPE) automatically set the RUN/HOLD function to HOLD. If digitising
ceases unexpectedly check the condition of RUN /HOLD.
All of the front panel settings are retained when the power is
turned off (except for RUN /HOLD which is always set to HOLD
at power-on).
Getting out of Trouble
If at any stage you lose track of the operation of the DSA, it can
be reset to a known state by pressing SHIFT followed by RESET
(as in First Steps). Each section of the tutorial starts with the
DSA in the "reset" state and the generator set to SINE, 20kHz,
5V pk-pk. Thus it is easy to restart the tutorial at the beginning
of any section.
PART ONE — BASIC FUNCTIONS
The functions covered in this first part of the tutorial are the
ones necessary to operate the DSA524 as a basic digital storage
adaptor.
Controlling Digitising
(Start with the DSA reset and the generator set to SINE, 20kHz,
5V pk-pk.)
The digitising of the input signals is controlled by the two keys
at the top of the TRIG section marked RUN /HOLD and SINGLE.
1. When RUN/HOLD is set to RUN, digitising is repeated
continuously. Try changing the amplitude or frequency
of the generator and note how the display is updated
about three times each second.
Page 12

11
2. When RUN /HOLD is set to HOLD, digitising is stopped.
Press RUN /HOLD to set it to HOLD, then change the output of the generator, and note how the display remains
unchanged.
3. When RUN /HOLD is set to HOLD, pressing the SINGLE
key causes digitising to occur once. Press SINGLE and
note how the display is updated to the new amplitude/frequency of the generator.
Controlling the Input Channels
(Start with the DSA reset and the generator set to SINE, 20kHz,
5V pk-pk.)
The two input channels CH1 and CH2 are identical. They control
the levels of the input signals before they are digitised.
1. The input coupling switches (AC/DC and GND) perform
the same function as on a normal oscilloscope. Try
changing them. Note that when CH1 is grounded the
position of the CH2 waveform on the display becomes
random, this is because the trigger signal has been
removed. Set both channels back to AC.
2. The input sensitivity is variable between 10V/div and 2mV
/div. The key with a downwards arrow sets a lower
volts/div setting and the key with the upwards arrow a
higher one, the keys autorepeat if held depressed. Try
changing the CH1 sensitivity upwards and downwards.
Note that when the input exceeds approximately ± 4.25
divisions on the screen it becomes "clipped", this is
because the range of the digitiser is limited to ± 4.25
divisions. When the input signal is outside the range of the
digitiser, the AUTO/OVLD lamp flashes, this is to warn the
user that the signal is not being correctly digitised (no
damage is being done).
3. Autoranging input sensitivity can be selected on either
channel. Press both arrow keys simultaneously, the AUTO
lamp will come on. Try changing the amplitude of the generator output and note how the sensitivity is automatically
changed to maintain a screen amplitude of between about
1.5 and 3.5 divisions. To cancel autoranging press either
arrow key once.
4. If the DC level of the input signal is not zero, it may be
necessary to apply a DC offset to the signal before it is
digitised. This can be done with the rotary controls
marked OFFSET which can add up to ±8 divisions of
offset. Press the key marked ZERO(VAR) to enable
variable offset (it is enabled when the lamp is off). Try
rotating the offset control and note how the DC level of
the signal is changed. Press the key again to return to
zero offset.
5. The digitising for each channel can be controlled
individually by the keys marked "ON/OFF". These allow
one channel to be "held" while digitising continues on the
other channel. Try turning CH1 off and changing the frequency of the generator, note that the CH2 display continues to be updated but that the CH1 display is frozen.
Note that if both channels are turned off, RUN/HOLD will
be automatically set to HOLD.
Controlling the Traces
(Start with the DSA reset and the generator set to SINE, 20kHz,
5V pk-pk.)
The DSA524 can display two traces simultaneously, the traces are
called Trace A and Trace B. Whereas the input channel controls
(CH1 and CH2) operate on the input to the digitiser, the trace
controls operate on the output signals which are sent to the
display oscilloscope. Normally Trace A is used to display CH1, and
Trace B is used to display CH2, but the traces may alternatively
be used to display waveforms stored in the indexed memories.
1. The POSITION controls define the position of the traces
on the screen and provide ± 4.25 divisions of adjustment.
Press the key marked HOME(VAR) to enable variable position (it is enabled when the lamp is off). Try varying the
position of the traces, note that whereas OFFSET only
affects the waveform when digitising is taking place, POSITION affects it at all times whether RUN/HOLD is at
RUN or HOLD. Press the key again to "home" the trace
position.
2. The GAIN VARIABLE controls can reduce the amplitude
of each trace by any factor between one (fully clockwise)
and five (fully anti-clockwise). Press the CAL(UNCAL) key
to enable variable gain (it is enabled when the lamp is
off). Try varying the gain and note that, because it is
within the trace control section, it operates on the
waveform after it has been digitised and continues to
operate even when the waveform is "held". Press the
key again to return to calibrated gain.
3. Each trace is turned off by simultaneously pressing the
keys marked CH1 (or CH2) and RCL(NN). Try turning a
trace off (note that the CH key should be pressed first to
avoid setting RUN/HOLD to HOLD). To turn the trace
back on press the CH1 (or CH2) key. Do not try using
the RCL(NN) or SAVE(NN) keys at this stage.
4. Trace B has a key marked INV (Invert). Press this key
and note that the trace becomes inverted. Press it again
to turn inversion off.
5. Trace A has a key marked ADD B. Press this key and
note that Trace A then displays the sum of the Trace A
waveform and the Trace B waveform. Note that this can
also be used for subtraction when Trace B is set to
invert. Note also that because add and invert are trace
controls they can still be used when either or both
channels are "held".
Setting the Timebase
(Start with the DSA reset and the generator set to SINE, 20kHz,
5V pk-pk.)
The timebase is adjustable between 50ns/div and 200mins/div.
The timebase speed is set using the two TIME/DIV keys which
autorepeat if held depressed. Setting the timebase speed also
sets the DSA into one of three modes of operation:
1. Normal Mode
1a. Turn off CH2 and Trace B. Try changing the generator
frequency up and down and changing the timebase
speed to maintain a roughly constant period on the
screen (within the range 5us/div to 100ms/div). This is
the "normal" mode of operation whereby the display is
updated each time 40.96 divisions of the waveform have
been digitised. Note that at low timebase speeds the
display update rate becomes slower, this is because of
the increased digitising time (at 100ms/div digitising
takes 4.096 seconds).
1b. Now set a generator frequency of 100Hz and a timebase
speed of 5ms/div. Increase the generator frequency to
1kHz, note that the waveform is starting to become difficult to view. Increase to 2kHz, note that the waveform
can no longer be interpreted as a sine waveform and
appears to have random patterns superimposed onto it.
This is visual aliasing (caused by the vertical separation
between sample points being much greater than the
horizontal separation). Turn on the sweep magnifier of
the display oscilloscope to observe that the waveform is
roughly sinusoidal but is made up of only 10 samples per
cycle.
1c. Now increase the generator frequency to 20kHz and vary
it slightly, note that the waveform changes erratically as
the generator frequency is changed, and that waveforms
with an apparent frequency down to a few Hz can be
obtained. This is true aliasing, caused by the sampling
frequency being less than twice the signal frequency
(the sampling rate equals 100 divided by the time/div,
so at 5ms/div the sampling rate is 20kS /s).
Page 13

12
Aliasing effects are common to all digital storage instruments. Note that to avoid true aliasing the sampling rate
must be greater than twice the signal frequency (time/div
= 50/f) and to avoid visual aliasing the rate must be
greater than ten times the signal frequency (time/div =
10/f).
1d. The DSA524 incorporates a feature which automatically
sets the timebase to avoid aliasing effects and to provide
a sensible waveform period on the screen. Turn off the
sweep magnifier on the display oscilloscope. Press simultaneously the two keys marked AUTOSET within the
timebase section, note that the timebase is automatically
set to 20us/div.
1e. Try changing the generator frequency and using
AUTOSET, note how it sets the timebase to maintain
between 4 and 10 cycles of the waveform across the
screen. (AUTOSET can only operate when a trigger signal
of 50Hz or above is being generated.)
2. Roll Mode
For timebase speeds of 200ms/div and slower, the DSA
enters roll mode (indicated by an audible "beep" and
illumination of the ROLL lamp). In roll mode the waveform
data is written onto the screen continuously as it is being
digitised. This avoids the long delays that would occur if
the screen was only updated after digitising was
completed.
Set the timebase to 200ms/div and the generator to 2Hz,
note how the waveform appears to "roll" across the
screen. Try setting slower timebase speeds and lower
generator frequencies (DC coupling will be necessary for
lower frequencies). Set the timebase as slow as it will go,
note that below 500s/div the SEC and mSEC lamps illuminate together to indicate minutes (speeds as low as 200
minutes/div can be set enabling waveform capture over
many hours).
3. Repeat Mode
The maximum sampling rate of the DSA524 is 20MS /s
(which is obtained at 5us/div). This is the maximum rate
that can be used to capture single event signals. However,
if the signal is repetitive, repeat mode can be used. This
builds the waveform up by repeatedly digitising it, and can
provide equivalent sampling rates up to 2GS /s. For timebase speeds of 2us/div and faster the DSA enters repeat
mode (indicated by a "beep" and illumination of the RPT
lamp).
3a. Set the generator to 200kHz and set the timebase set to
2us/div (or press AUTOSET), note that the waveform is
being digitised at an equivalent rate of 50MS /s. Vary the
generator frequency slightly and note that the display
update rate is slower in repeat mode, and that the first
screen update after the signal is changed is invalid (this is
because the waveform is built up from multiple
digitisations).
3b. Ground the CH1 input and note that updating of the
screen ceases and a message "NO TRIGGER" appears on
the screen (this is because repeat mode requires a repetitive trigger signal to be able to operate). Un-ground the
input and increase the generator frequency. Increase the
timebase speed and note that waveforms up to 35MHz
can be captured (this is limited by the input amplifier
bandwidth of the DSA) using timebase speeds of up to
50ns/div (2GS /s equivalent sampling rate). Note also that
the update rate is slowest at the fastest timebase speeds
when in repeat mode.
4. Turn on CH2 and Trace B. Note that the repeat mode
update rate is slower when both channels are turned on.
Set the timebase speed down to 20us/div noting that
when both channels are on, the ALT lamp illuminates for
speeds of 10us/div and faster, and that the CHOP lamp
illuminates for speeds of 20us/div and slower. CHOP
indicates that both input channels are digitised together
(on opposite cycles of the sampling clock) while ALT
indicates that the input channels are digitised alternately
(CH2 followed by CH1). Thus if digitising is un-triggered,
or if the input signals do not have a constant relationship
to the trigger signal, phase relationships between the
signals will not be maintained above 20us/div.
Triggering
(Start with the DSA reset and the generator set to SINE, 20kHz,
5V pk-pk.)
The trigger controls for the DSA524 are broadly similar to those
on a conventional oscilloscope. The exceptions are EVENTS DLY
and TIME DLY.
1. SOURCE The source of the trigger signal can be CH1,
CH2, or EXT (external via the BNC socket below the
trigger controls). Note that only AC coupling is available
via the external input.
2. MODE The mode switch has three positions, AUTO,
NORM, and LINE. AUTO mode is similar to Bright-Line
Auto on a conventional oscilloscope. Digitising is performed in synchronism with the trigger signal but, if the
trigger signal ceases or the trigger repetition rate falls
below 20Hz, digitising continues but without synchronism. In NORM (normal) mode, digitising stops if the
trigger signal ceases. In LINE mode, digitising is
performed in synchronism with AC line (50 or 60 Hz).
Try removing the trigger signal by setting SOURCE to
external, note that digitising continues (without
synchronism) in AUTO mode, but ceases in NORM mode.
2.
LEVEL, SLOPE and COUPL (coupling) The function of
these controls should be self explanatory. To enable
variable trigger level, press the key marked ZERO(VAR
I (variable level is enabled when the lamp is off). Try
using all of the trigger controls, then return them to
their original settings.
PART TWO — MORE ADVANCED FUNCTIONS
The functions covered in the first part of the tutorial enable the
user to operate the DSA524 as a basic digital storage
oscilloscope. This second part covers the more advanced
features which would not be found on a basic DSO.
More about Triggering
(Start with the DSA reset and the generator set to SINE, 20kHz,
5V pk-pk.)
1. TIME DLY (time delay) With TIME DLY off, digitising
starts immediately following a trigger. Thus the left-hand
edge of the trace shows the waveform immediately after
the trigger point. TIME DLY shifts the point at which
digitising starts to allow the trace to show the waveform
either before the trigger (pre trigger delay) or after the
trigger (post trigger delay).
Set the generator to 5kHz; the trace should now show
about one cycle of the waveform starting at the trigger
point. Press the TIME DLY (minus) key, note that the
message "TIME DLY = +0000 DIV" is displayed. Press
the key again to decrement the number to —0001 (note
that the keys only increment or decrement when the
message is being displayed, on the first press they
merely cause the current delay value to be shown).
The trace should now start one division before the
trigger point. Try incrementing and decrementing the
delay using the + and — keys, note that the trace can
be positioned anywhere relative to the trigger point (in
steps of one division) and that the PRE and POST lamps
illuminate for negative and positive delays respectively.
The maximum pre trigger delay is —40 divs and the
maximum post trigger delay is + 9999 divs. Note that
the + and — keys autorepeat if held depressed, and that
the delay can be set back to zero at any time by
Page 14

13
pressing both keys simultaneously.
Post trigger time delay can be used to expand a small sec-
tion of a waveform (as in a sweep-delay oscilloscope). Set
a delay of +0002 so that the peak of the sinewave is
within the first division of the screen. Now increase the
timebase to 5usec/div, note that the delay is increased to
+0008 divs so as to maintain a constant time delay thus
keeping the sinewave peak within the trace area.
Note that time delay is not available in RPT mode, and
that only post trigger time delay is available in ROLL
mode. Time delay is automatically set to zero whenever
the timebase is set into RPT or ROLL.
2. EVENTS DLY (events delay) This function enables the
triggering of the digitising to be delayed by up to 15
trigger events. See the reference section of the manual for
a full explanation.
More about Roll Mode
(Start with the DSA reset and the generator set to SINE, 20kHz,
5V pk-pk.)
Because in roll mode the waveform data is written continuously
onto the display, it is not necessary to continually stop and
restart the digitising process. Consequently when RUN/HOLD is
set to RUN, digitising takes place continuously and triggering is
disabled.
The purpose of triggering is to enable a specific part of a waveform to be captured. In normal modes the digitising period is
always 40 divisions, so defining the trigger point automatically
defines the part of the waveform that will be captured. In roll
mode the digitising period is not limited to 40 divisions but continues indefinitely.
There are two possible ways in which a triggered roll mode can
be provided. The trigger could start the roll which could then
continue for 40 divisions, but this would have the disadvantage
that pre-trigger data could not be captured. Alternatively, the roll
could run continuously until stopped by the trigger, this is the
system employed in the DSA524 when SINGLE is used.
1. Set the generator frequency to 2Hz and the DSA timebase
to 200ms/div. Select DC input coupling.
2. Set RUN /HOLD to HOLD, ensure that the trigger mode is
AUTO and that TIME DLY is off. Now press SINGLE, note
that although the roll starts, it stops again immediately.
This is because in AUTO mode triggering occurs automatically after a very short delay.
3. Now set TIME DLY to +0005 divisions. Press SINGLE and
note that the roll stops after 5 divisions of data has been
captured.
4. Set TIME DLY back to zero and set the trigger mode to
NORM. Press SINGLE and note that a small section of the
waveform prior to the trigger level point has been captured. Thus the waveform occurring between SINGLE
being pressed and the trigger occurring has been
captured.
Note that in roll mode SINGLE, all the data in the digitising
memory is pre-trigger data unless some post-trigger time delay
has been set. Pre-trigger time delay is therefore not needed and
is disabled.
Similarly, when in roll mode the display always shows the last
section of the digitising memory rather than the first. Therefore
when SEARCH mode is selected, the SCAN window is initially set
fully right instead of fully left.
Memory Search
(Start with the DSA reset and the generator set to SINE, 20kHz,
5V pk-pk.)
Although the screen shows only 1024 words (10.24
divisions) for each trace, the digitising memory captures
4096 words (40.96 divisions) per channel. The SEARCH
key enables the whole of the digitising memory to be
accessed. It also provides digital magnification by ten
(using linear interpolation).
1. Press SEARCH once, the COMP (compress) lamp will illuminate and a filled bar will appear at the top of the
screen for 3 seconds (the filled bar represents the 4K of
the memory). Note that the waveform is compressed by
a factor of four, thus allowing the whole of the digitising
memory to be displayed (this is achieved by displaying
every fourth word).
2. Press SEARCH again, the SCAN lamp will illuminate and
a bar will appear at the top of the screen with the first
quarter filled (this bar represents the 4K of the memory
and the filled section represents the 1K which is being
displayed). Note that the waveform returns to normal
and that the bar disappears after 3 seconds.
Press the key marked SCAN /MAG which has a right-
hand arrow, note that the bar reappears. Press the key
again, note that the waveform appears to r 'love to the
left by one division and that the filled section of the bar
moves to the right. The filled section can be regarded as
the "scan window" which shows which 1K section of the
4K memory is being displayed.
Try moving the scan window backwards and forwards
using the two arrow keys. Note that the keys only move
the window whilst the bar is being displayed, otherwise
the first press merely brings up the bar in order to show
the present position.
3. Press SEARCH again, the MAG light will illuminate and a
bar will appear with the first one tenth filled (the bar
represents the present position of the scan window and
the filled section represents the 102 words which are
being magnified to fill the screen, this can be regarded
as the magnify window). Note that the waveform
becomes magnified by x10 and that the bar disappears
after 3 seconds.
Try moving the magnify window backwards and
forwards using the two arrow keys. Note that this works
in just the same way as with the scan window.
4. Press SEARCH several times and note how it cycles
through the COMP, SCAN and MAG functions. Press the
two SCAN /MAG keys simultaneously in order to turn
search off.
Display Update Rate
(Start with the DSA reset and the generator set to SINE, 20kHz,
5V pk-pk.)
The rate at which digitising is repeated and the display is
updated can be varied using the key marked RATE. When the
rate is set to normal (SLOW and FAST lamps both off) there is a
delay of about 0.3 seconds before digitising is restarted when in
RUN mode. This delay can be increased to about 3 seconds or
reduced to about 0.03 seconds.
The RATE key only operates with timebase speeds between
100ms/div and 5us/div, it has no effect in ROLL or RPT modes.
1. Press the RATE key (the SLOW lamp will illuminate) and
vary the generator output. Note that the screen is
updated only about once every 3 seconds instead of
about 3 times per second. This gives enough time for
each digitising to be observed and for the display to be
"held" before the waveform is lost and replaced with a
new one. Press RATE again to return to normal update
rate.
2. Press the RATE key and hold it depressed for 2 seconds
(the FAST lamp will be illuminated) and vary the
generator output. Note that the screen is updated very
quickly providing a near instant response to waveform
changes similar to a conventional oscilloscope. Press
RATE again to return to normal update rate.
Page 15

14
Selecting FAST update cancels any waveform processing
functions that have been selected including GAIN
VARIABLE, ADD B, INV, RUN AVERAGE and SEARCH.
Indexed Waveform Memories
(Start with the DSA reset and the generator set to SINE, 20kHz,
5V pk-pk.)
The DSA524 has 16 non-volatile indexed waveform memories.
These memories are each 1K words in size and are used to save
and recall waveforms from Trace A or Trace B.
1. Press the SAVE(NN) key on Trace A, note that the ENTER
lamp flashes within the numeric keypad section. Press key
0 followed by key 1, this stores the waveform currently
displayed on Trace A into memory 01. Note that the
screen shows "MEMORY 01 = TRACE A" and that RUN
/HOLD is set automatically to HOLD.
2. Now press RCL(NN) on Trace B, followed by key 0,
followed by key 1, this recalls the waveform onto Trace B.
Note that the screen shows "TRACE B = MEMORY 01" and
that the MEM lamp (in the Trace B area) illuminates in
place of the CH2 lamp.
3. Set RUN /HOLD back to RUN, and change the generator
frequency. Note that Trace B is now displaying a reference
waveform which can be used for on-screen comparison
with the CH1 signal. Operate the Trace B invert and gain
variable functions, note that these operate on a recalled
waveform just as they do on a waveform sourced from an
input channel.
4. Press the Trace B RCL(NN) key twice and note that
"TRACE B = MEMORY 01" is displayed again, allowing the
user to check which memory is being displayed at any
time. Press the CH2 key on Trace B to return to a display
of CH2.
The 16 memories are numbered 01 through to 16. They can only
be used to store the contents of a trace memory (i.e. a waveform
displayed on the screen). Recalled waveforms are not affected by
the SEARCH function.
Cursor Measurement
(Start with the DSA reset and the generator set to SINE, 20kHz,
5V pk-pk.)
The DSA524 incorporates cursor measurement with on-screen
digital readout of voltage and time difference. Cursor measurement can only be performed in HOLD, and on only one channel
at a time. The cursor line starts at the left hand edge of the
screen and intersects with the waveform at the reference cursor
point. It is then shifted upwards away from the trace, continues
sideways and then comes down to intersect with the waveform
again at the delta cursor point before continuing to the right
hand edge of the screen. The measurement is made between the
two cursor points.
1. Press CURS ON/OFF (key 4), Trace B will turn off and a
flashing cursor line will be displayed. Note that RUN/
HOLD is set to HOLD and that the screen shows the
message "Delta A = XX.XV XXX.XuS" representing the
voltage difference and time difference between the two
points.
2. Try moving each of the cursors using the arrow keys
marked REF CURS and A CURS. Note that the cursor
points "track" the waveform automatically and that the
cursor movement speeds up when the keys are held depressed.
3. Press CURS A/ B (key 5), Trace A will be replaced with
Trace B. Note that the cursor points adjust automatically
to the new waveform. Press CURS ON/OFF again to turn
cursor measurement off.
Averaging
(Start with the DSA reset and the generator set to SINE, 20kHz,
5V pk-pk.)
The DSA524 can average any number of readings from 2 up to
255, enabling large improvements to be made to the signal to
noise ratio of noisy signals. The average number is initially set
to 16.
1. Turn off Trace B and note the waveform amplitude on
Trace A. Then remove the trigger signal by setting the
source to EXT. The waveform should now be
unsynchronized, this simulates random noise because
the phase of the signal is now random.
2. Press the RUN AVERAGE key (within the timebase section), the indicator lamp will illuminate to show that
averaging has been selected. The screen will show the
message "AVERAGE COUNT = X" where X increments
continuously between 001 and 016. Note that the trace
is updated each time the message reaches 016 and that
the signal amplitude has been reduced, typically by a
factor of four (truly random noise is attenuated by the
square root of the number averaged). Set the DSA to
HOLD and press SINGLE, note that averaging is
performed once only.
3. Now press SHIFT (key 8) followed by SET AVG (key 4),
the message "AVERAGES = 016" will be displayed
showing the current setting. Now try using the REF
CURS arrow keys to increment or decrement the
number. Set it to 064 and press ESCAPE to terminate
set-average mode. Re-start averaging, note that the
signal amplitude is now reduced typically by a factor of
eight instead of four. Use SET AVG again to set the
averages back to 16.
The above mode of operation is known as a totalising
average because the screen is only updated when the
total number of digitisings have been averaged. An
alternative mode is a running average whereby the
screen is updated each time digitising takes place.
4. Return the trigger source to CH1. Press RATE, the SLOW
lamp will illuminate. When SLOW and RUN AVERAGE are
both illuminated the mode is set to running average.
Press SINGLE, note that the screen is updated with the
new average value on every count. Note that averaging
can be stopped at any time by pressing RUN/HOLD.
Averaging is not available in ROLL mode and only a
totalising average is available in RPT mode. In RPT
mode the average number is only displayed each time
averaging is completed.
Dot Joining and Interpolation
(Start with the DSA reset and the generator set to SINE, 20kHz,
5V pk-pk.)
The DSA524 is initialised to use analog dot joining. This links
the 1024 individual sample points on the screen with angled
lines to simulate one continuous line. This gives a display which
is easy to view, and reduces the number of samples per cycle
required to avoid visual aliasing.
However, when the vertical separation between adjacent
sample points is large, dot joining can reduce the peak
amplitude of the waveform. To avoid this a "dots" display can
be selected instead of a "line" display. A dots display also has
the advantage that the exact position and level of each sample
point can be viewed.
1. Set the generator to SINE, 20kHz (with the DSA at
20us/div) and turn on sweep magnify on the display
oscilloscope. Press SHIFT followed by DOTS (key 7),
note that the individual sample points are now visible.
2. Turn off the sweep magnifier and note that the display
shows some visual aliasing. Return to a "line" display by
pressing LINE (key 7), note that the visual aliasing is
reduced.
Page 16

15
The sweep magnifier of the display oscilloscope provides an
analog expansion of the trace. The magnify function on the DSA
(via the SEARCH key) provides a digital expansion. 102 words of
the digitising memory are used to fill the 1024 words of the trace
by using linear interpolation to generate nine extra words
between each pair.
When a waveform has been captured at a very low number of
samples per cycle, MAG can be used to observe it. If the
waveform is sinusoidal in nature, linear interpolation will not reproduce the waveform shape very well if the number of samples
per cycle is less than ten. The DSA524 provides the alternative of
sine interpolation which provides a good reconstruction of a
sinewave from only four samples per cycle by using a mathematical curve fitting algorithm.
3. Reduce the timebase speed to 100us/div, this reduces the
number of samples per cycle to five. Press SEARCH three
times to select MAG mode, note that the displayed waveform shape is poor. Press the SINE INTERP key, the lamp
will illuminate, note that the displayed waveform shape is
greatly improved.
Trace Multiply
(Start with the DSA reset and the generator set to SINE, 20kHz,
5V pk-pk.)
The trace multiply function (A = AxB) allows the product of two
waveforms to be displayed. Thus, for example, if Trace A was
displaying a voltage waveform and Trace B was displaying a
corresponding current waveform, trace multiply could be used to
display the power waveform on Trace A.
1. Note the waveforms obtained on each trace then press
SHIFT followed by A = AxB (key 2), RUN/HOLD will be set
to HOLD, note that the multiplied waveform appears on
Trace A.
2. Note that trace multiply cannot be used while digitising is
taking place (pressing RUN or SINGLE will cancel the
function). Note also that ADD B and GAIN VARIABLE on
Trace A are disabled after trace multiply has been
selected. Press ESCAPE to return Trace A to its normal
display.
The multiplied waveform is scaled using units of one screen
division with the centre of the screen being zero. The traces are
multiplied exactly as they appeared on the oscilloscope display
including offsets introduced by the trace position controls. Thus
at a point where the position of Trace A is +2 divs and of Trace B
is -1.5 divs, the value of the multiplied waveform will be -3 divs.
It should be noted that if either trace has values greater than ±1
divs then overflows could occur on the multiplied waveform. The
displayed waveform is limited to ±4.25 divisions and
consequently -3 divs multiplied by -2.5 divs will be displayed as
+4.25 divs instead of +7.5 divs.
4. Use the Trace A and Trace B variable controls to alter
the amplitude and position of the waveforms prior to
multiplication. Note the results. Press ESCAPE to exit.
Program Mode
(Start with the DSA reset and the generator set to SINE, 20kHz,
5V pk-pk.)
The DSA524 can operate as a fully programmable instrument. It
can "learn" individual or sequential front panel settings, store
them in non-volatile memory, and "replay" them on demand. Up
to 50 settings can be stored.
Each front panel setting includes the state of every key and
rotary control and the source of each trace waveform. Thus if a
setting is "learned" which includes a trace recalled from a waveform store, that same store will be recalled again when the
setting is "re-played". Thus reference waveforms can be recalled
automatically within PROGRAM mode.
1 Select "learn" mode by pressing LEARN (the LEARN lamp
will illuminate). Note that the screen shows the message
"NEXT POSITION = 01".
2. Press SET(NN), followed by key 3, followed by key 0 (for
'example). The screen will show the message "STORED
IN MEM = 30" followed by "NEXT POSITION = 31",
showing that the current front panel settings have been
stored in memory position 30.
3. Now reset the front panel including time/div, volts/div,
input coupling, rotary controls etc. Press SET/NEXT, the
screen will show "STORED IN MEM = 31" followed by
"NEXT POSITION = 32". Now recall waveform memory
01 onto Trace B and then press SET/NEXT again.
Further sets of front panel settings have now been
stored in positions 31 and 32.
4. Exit "learn" mode by pressing the LEARN and REPLAY
keys simultaneously, and select "replay" mode by
pressing REPLAY (the R PLY lamp will illuminate). The
screen will show "NEXT POSITION = 33", showing that
the most recently used position was 32.
5. Press SET(NN) 30, the front panel will reset and the
screen will show "REPLAYED MEM = 30" followed by
"NEXT POSITION = 31". Press SET/NEXT, the front
panel will be reset again. Press SET/NEXT again, the
front panel will be reset and the waveform in memory 01
will appear on Trace B.
6. Press SET(NN) 30 to reset the front panel to its original
settings and exit "replay" mode by pressing the LEARN
and REPLAY keys simultaneously.
Hardcopy Output
The DSA524 can provide hardcopy output via dot matrix printer
(Epson codes compatible, with a serial interface), a digital X-Y
plotter (HP-GL codes compatible, with a serial interface), an
analog X-Y plotter, or an analog Y-T chart recorder.
Because different users will wish to use different types of
printers or plotters, this subject cannot be usefully covered in
this tutorial. Please refer to the reference section of the manual
for a description of the PRINT and PLOT functions.
Remote Interfacing
The RS-423 serial interface (RS-232 compatible) and the
optional IEEE-488 interface of the DSA524 enable it to be
connected to a wide variety of other equipment. The interfaces
can be used for full remote control of the DSA (anything that
can be controlled from the keyboard can also be controlled via
the interfaces), and for bi-directional transfer of waveform data.
Refer to the reference section and appendices for full details.
A Final Word
This tutorial has covered most of the functions of the DSA524 in
terms of its use with a display oscilloscope. The DSA524 is a
highly sophisticated and versatile instrument which has many
further uses which have not been touched upon in the tutorial,
in particular its use as an interfaceable and programmable
instrument. Some of its other facilities are covered in the
reference section of the manual, the appendices, or in individual
application notes.
Page 17

16
APPENDICES
APPENDIX A. THE OSCILLOSCOPE DISPLAY
Single or dual cable connection
The DSA524 produces a multiplexed output which enables two
traces plus text to be displayed using only one channel of the
display oscilloscope. The multiplexed output also incorporates a
trigger signal. Consequently the DSA can be connected to the
oscilloscope via just one cable with triggering being sourced from
the input channel.
The disadvantage of single cable connection is that the trigger
signal is visible at the left hand edge of the screen as a very
narrow vertical pulse followed by a short bright line. Connecting a
second cable from the "Trig out" socket to the external trigger
input of the oscilloscope and setting the scope to external trigger
removes the visible trigger signal from the screen.
Triggering
Because the DSA524 produces a multiplexed output waveform,
trigger adjustment is very important particularly when text is
being displayed. If a satisfactory initial set-up display cannot be
obtained check the following points:
The 'scope must be set to single channel operation. The input
coupling must be DC and the sensitivity must be set to
100mV/div. The sweep hold-off and trigger delay (if present)
must be set to minimum. The sweep speed must be set to
50us/div. The trigger source must be from the input channel (not
vertical mode). The trigger slope and level must both be
negative.
Adjust the trigger level. If a satisfactory display can still not be
obtained try setting the sweep speed to 20us/div and then slowing it down to 50us/div using the sweep variable control.
When using a single cable connection, some oscilloscopes (those
having a poor dynamic range on their trigger circuit) may give
unstable triggering when full screen height waveforms are being
displayed. Should this occur, first try careful adjustment of the
trigger level control but if the trouble persists change to a two
cable connection.
Vertical Size
The amplitude of the vertical output is factory adjusted to an
accuracy of + 1 %. The two horizontal lines of the set-up display
are intended to be exactly 6 divisions apart. The output level can
be adjusted to compensate for inaccuracies of the oscilloscope
using the rear panel preset adjustment marked "Set Height". If
the linearity of the oscilloscope is poor, however, it may not be
possible to set the two lines at exactly ±3 divisions from the
arrow tip. If so ignore the vertical position of the arrow tip and
set the two lines to be at ±3 divisions from the graticule centre
line.
The horizontal timing of the DSA524 is crystal controlled to an
accuracy of 0.01% (except for "repeat" mode operation) and
cannot be adjusted.
APPENDIX B. ALIASING
One problem that occurs with digital storage oscilloscopes that
does not occur with real-time oscilloscopes is aliasing.
Sampling theory dictates that any periodic waveform must be
sampled at more than twice the highest frequency component to
avoid aliasing. Aliasing causes the apparent waveform frequency
to be much lower than the real frequency. Thus if the timebase is
set too low an invalid display will result (see Fig a).
To avoid aliasing the timebase must be set as follows:
Minimum time/div = 50 divided by the maximum cyclic signal
frequency.
The difficulties occur when the signal frequency is unknown. In
this case it is safest to set a fast timebase speed initially and
work down.
A second form of aliasing that can occur is visual aliasing. This
occurs when the display is made up of bright dots and the
number of samples per waveform period is low (though greater
than two). The eye can be deceived into incorrectly linking the
dots to form a slower period waveform (see Fig b). The dot join
feature of the DSA524 greatly reduces the chances of visual
aliasing occurring.
Fig a. True aliasing waveform sampled at
less than twice the
signal frequency (in
this case
approximately at the
signal frequency).
Fig b Visual aliasing vertical separation
between samples
large in comparison
to horizontal separation, leading to incorrect interpretation by
the eye.
If the input signal is repetitive and the trigger repetition rate is
between 50Hz and 5MHz the AUTOSET function of the DSA524
can be used. Autoset resets the timebase to a speed suited to
the trigger rate and well above the point at which aliasing
effects can occur.
APPENDIX C. SINGLE-SHOT BANDWIDTH AND INTERPOLATION
Probably the most important use of a digital storage instrument
is for the capture of single-shot waveforms (i.e. waveforms
which occur only once). The user will need to understand the
bandwidth restrictions which apply to this mode of operation.
Nyquist sampling theory dictates that a waveform can be perfectly re-constructed if sampled at more than twice the frequency of the highest frequency component. Thus a 9.9 MHz
sinewave could be reconstructed if sampled at 20MHz. Unfortunately this assumes that sampling can take place for an infinite
period of time. Clearly this is not possible with a single-shot
waveform.
In theory a single-shot waveform can only be perfectly reconstructed using an infinite sampling frequency. This is because
the waveform has discontinuities at the start and end which
give rise to infinite frequency elements. Given a known
maximum sampling frequency we need to know how good a
representation of the original waveform can be achieved.
Because there can be no certainty of the existence of any cyclic
elements in a single-shot waveform, sampling theory must be
abandoned. Instead, a subjective principle must be used to
decide what constitutes an acceptable representation of a
waveform. This will depend on the information that the user
needs to obtain from the waveform.
Consider the waveform of Fig c which consists of a rapid
change of level, followed by an exponential decay of sinusoidal
oscillations. If the user requires only to know the settled
amplitudes before and after the change of level the sampling
frequency requirements are modest since a representation
which merely indicates the disturbance and the settled values
will suffice.
Page 18

17
However, if the user requires to know the rate of change of the
rising edge, the sampling frequency requirements are considerable since a number of samples must be taken during the time of
the rise.
Fig c.
Most commonly, the user merely requires a representation of the
general shape of the waveform. In the case of the waveform of
Fig c it is clear that a reasonable representation can be obtained
using ten samples per cycle of the sinusoidal frequency. This
leads to a useful rule of thumb which is that the sampling
frequency should be at least ten times that of the fastest cyclic
element in the waveform. Alternatively we could say that the
single-shot bandwidth equals one tenth of the maximum
sampling frequency.
Because a cyclic element which is represented by ten samples
occupies only 0.1 divisions on the display, it will be necessary to
use "magnify" mode to view it properly. When the DSA524
display mode is set to MAG it not only increases the spacing
between the original samples by ten, but also calculates and displays intermediate samples using mathematical interpolation.
The standard interpolation provided by the DSA524 is linear.
Linear interpolation joins the true samples with straight lines,
which improves the visual appearance of the waveforms when
the number of samples per cycle is low. Linear interpolation provides a good reconstruction of waveforms which are made up
mainly of linear elements.
The DSA524 also provides sine interpolation as an alternative.
This is based on a mathematical curve fitting algorithm known as
the "cubic spline", and provides an excellent reconstruction of
waveforms which appear to be made up of simple sinusoids. Sine
interpolation will provide a near perfect reconstruction of a
sinewave sampled at only four samples per cycle.
This leads to a second useful rule of thumb which is that, when
using sine interpolation, the single-shot bandwidth equals one
quarter of the maximum sampling frequency.
Sine interpolation will not provide a good reconstruction of the
parts of a waveform which are not smooth curves. It should
therefore not be used with pulse, triangle, sawtooth waveforms
etc.
APPENDIX D. ANALOG PLOTTER "PLOT" FUNCTION
The waveforms shown on the oscilloscope display can be sent
either to an analog X-Y plotter or to a Y-T chart recorder using
the analog plotter interface.
The DSA is factory initialised for use with a digital plotter. To
change over to use with an analog plotter key in "function 26"
(press FUNCTION NN, followed by 2 followed by 6). To return to
use with a digital plotter key in "function 27".
The analog plotter interface is mounted on the rear panel and
has five 4mm sockets marked X, YA, GND, YB, and PL (pen lift).
The X signal is only required when using an X-Y plotter. When
using a chart recorder the pen lift signal can be used to control
the chart movement.
The waveforms for Trace A and Trace B are sent simultaneously
to their separate output sockets along with an X axis signal for
use with X-Y plotters. The 10.24 divisions of the display are plotted using a level of 100mV/div (for both Y and X) at a rate selec-
table as 1,2,5 or 10 seconds per division. The pen-lift signal is
normally "low to lift" but can be inverted.
To set the plot rate, press SHIFT (key 8) followed by SET PLOT
(key 5). The oscilloscope display will show the present plot rate.
Press one of the REF CURS keys (key 2 or 3) to select a new
value, then press ESCAPE. If the DSA is not connected to an
oscilloscope the plot rate may be set directly using the FUNCTION NN key (see Section R27.).
Two versions of the PLOT function are provided. The default
version provides prompts for manual or semi-automatic
operation of the recorder or plotter. Its operation is as follows:
Before the PLOT function is commenced, the Y and X output
signals will both be at zero, representing the bottom left-hand
corner of the oscilloscope display. The pen lift signal will be set
to "up".
Press PLOT (key 6), the oscilloscope display will show "ZERO
PEN/HIT ANY KEY". If RUN/HOLD was set to RUN it will become
set to HOLD. The interface will output YA and YB values
equivalent to + 4.25 divisions, and an X value equivalent to
+0.12 divisions. This represents the left-hand centre of the oscilloscope graticule. Adjust the zero controls of the plotter/recorder accordingly. The pen lift signal will remain set to "up".
Press any key (e.g. PLOT), the display will show "PEN DOWN/
HIT ANY KEY". The pen lift signal will be set to "down". If
automatic pen lift control is not being used, lower the pen.
Press any key, the display will show "PLOTTING". Plotting will
commence starting at X position 0.00 and continue to position
10.24. When plotting has finished the display will show "PEN
UP/HIT ANY KEY". The pen lift signal will be set to "up". If
automatic pen lift control is not being used, raise the pen.
Press any key, the Y and X output signals will both be set to
zero and the pen lift signal will remain "up". To abandon the
PLOT function at any stage before it is completed press
ESCAPE.
The alternative version of the PLOT function is intended for fully
automatic control of the recorder/plotter. To change to this version, key in "function 25". To return to the normal prompted
version, key in "function 26". The operation of the alternative
version is as follows:
Press PLOT (key 6), the pen lift signal will be set to "down", and
plotting will commence starting at X position 0.00 and finishing
at 10.24. If RUN/HOLD was set to RUN it will become set to
HOLD. When plotting is completed, the pen lift signal will be set
to "up", and the Y and X output signals will both be set to zero.
To abandon plotting at any time press ESCAPE.
The Pen Lift signal has a level of either 0 volts or 5 volts from a
source impedance of 1K ohm. The default polarity of this signal
is "low to lift". This can be changed to "high to lift" by dismantling the case and changing the jumper on the analog plotter
interface PCB from position 1 to position 2 (see diagram below).
The signal can be used to switch most logic based control
inputs including TTL. However it should not be connected to
input circuits which sink currents to below 0 volts or which
source currents of more than 1mA to a voltage above 5 volts.
Doing so could cause incorrect operation of the whole plotter
interface.
Page 19

18
APPENDIX E. CONNECTING TO THE SERIAL INTERFACE
The interface uses a female 9-pin D connector and has five active
connections: pin 2 (RXD) is the data input line, pin (TXD) is the
data output line, pin 5 is signal ground, pin 8 (CTS) is the
hardware handshake input, pin 7 (RTS) is the hardware
handshake output. RTS can be disabled and forced permanently
high by using FUNCTION 83 on the DSA, it can be re-enabled by
using FUNCTION 82.
Unfortunately, although there are connection standards for
modems and for terminals, there is no single connection standard
applying to other equipment fitted with an RS-232C interface. It
will therefore be necessary to refer to the technical handbook of
the equipment concerned before a suitable connection cable can
be made up. The most commonly used connector system is a 25
pin "D" connector in a "terminal" configuration, and a suitable
cable wiring scheme for this is shown below.
Where bi-directional transfer of data is required, the TXD of the
DSA should be connected to the RXD of the other equipment and
the RXD of the DSA should be connected to the TXD of the other
equipment. Where unidirectional data transfer is required (i.e.
when connecting to a printer or plotter), the RXD of the DSA can
be left unconnected (unless X-ON/X-OFF handshaking is used).
Unless the baud rate is set very low, some form of handshaking
connection will probably be necessary. If hardware handshaking
is not being used, pin 8 (CTS) on the DSA cannot be left unconnected and must be taken permanently high. This can be done by
connecting pin 8 to pin 7 (RTS) and using FUNCTION 83 to force
RTS permanently high. RTS can be re-enabled for normal
handshaking operation using FUNCTION 82.
Handshaking is necessary when the receiving equipment cannot
accept the data as fast as the sending device is sending it. Handshaking allows the receiving device to tell the sending device
when to send data and when not to send data, thus controlling
the effective rate at which data is transmitted.
Handshaking is not always needed. The receiving equipment may
be able to keep up with the incoming data without needed to
interrupt it, either because the baud rate is set low enough that it
can act on the data as fast as it is being sent, or because it has a
large enough data-input buffer to accept all of the transmitted
data in one stream. However, even when a large data buffer is
available, handshaking can sometimes still be needed at high
baud rates because the RS-232 hardware of the equipment
cannot transfer data bytes into the buffer fast enough.
The DSA has a 40 byte data input buffer. When transmitting data
to the DSA baud rates up to 9600 can be used without
handshaking, above this handshaking will be needed for strings in
excess of 40 characters.
When making connection to a printer or plotter, the need for
handshaking will depend upon the characteristics of that device.
Because the amount of data transmitted is large (approx. 30K
bytes for a "print") the baud rate needs to be kept high to minimise transmission time. Since the device is unlikely to have a
buffer large enough to accept the data in one stream, handshaking will almost certainly be needed.
There are two basic types of handshaking, hardware handshaking and X-ON/X-OFF handshaking. Both types are provided on
the DSA.
Hardware handshaking uses the RTS and CTS lines of the DSA.
When the RTS line is set to a 0 (a positive voltage level) the
DSA is ready to receive data, when it is set to a 1 (a negative
voltage level) the DSA is not ready to receive data. When CTS is
pulled to a 0 (positive) the DSA is enabled to send data, when it
is pulled to a 1 (negative) the DSA is disabled from sending
data.
X-ON/X-OFF handshaking uses the TXD line of the receiving
device to send messages to the transmitting device telling it to
stop or to start sending data. The X-OFF message (ASCII 13)
stops transmission, the X-ON command (ASCII 11) starts transmission.
The protocol of the DSA is fixed (8 data bits, 1 start bit, 1 stop
bit, no parity) and therefore any incompatibility must be
removed by adjusting the protocol of the other equipment.
Most computers have fully adjustable protocol but some
printers and plotters do not.
It is not essential to have exactly the same protocols on both
interconnected interfaces. The other interface must use 8 data
bits and 1 start bit, but parity can be even, odd or none, and
stop bits can be 1, 2 or more.
The wide range of baud rates available from the DSA should
ensure compatibility with virtually all equipment. Where the
other equipment also provides a choice of baud rates there are
a number of points to bear in mind when choosing which rate
to use.
Some types of equipment cannot handle incoming data at high
baud rates even when handshaking is correctly established.
Such problems are minimised at lower baud rates but waveform
data will take a long time to transfer. High baud rates will give
shorter transmission times but may produce problems with
missing bytes.
APPENDIX F. SOFTWARE COMMANDS
The RS-423 and IEEE-488 interfaces provide identical facilities
for control and data transfer. The commands listed below are
common to both interfaces. The DSA is controlled by sending it
ASCII strings. Each string must be terminated with a carriage
return (shown in examples as CR). All commands are case sensitive.
When the DSA receives a valid command string it responds by
sending back the string "OK CR". If the command string is not
valid the DSA responds by sending back the string "ERROR N
CR" where N is the number of the first apparently invalid byte
of the command string.
1. Controlling the DSA front panel set up.
For controlling the front panel, each ASCII string must consist
of a primary command followed by a comma followed by one or
more secondary commands (separated by commas) followed by
a carriage return.
There are seven primary commands for control of the front
panel. Each one defines a control area to which the secondary
command (or commands) will apply. The primary commands
are as follows:-
CH1 This defines the control area as channel 1
CH2 This defines the control area as channel 2
TRG This defines the control area as trigger
TMB This defines the control area as timebase
TRA This defines the control area as trace A
TRB This defines the control area as trace B
KEY This is a Global control command
Page 20

19
For CH1 or CH2 the secondary commands are as follows:
2mV, 5mV, 10mV, 20mV, 50mV, 100mV, 200mV, 500mV, 1V,
2V, 5V, or 10V (This sets the input sensitivity.)
AC, DC or GND (This sets the input coupling.)
ZERO or VAR,N (where N is a number between -100 and
+100) (This sets the offset level equal either to zero or to N%
of its maximum value.)
OFF or ON (This turns the channel off or on.)
Example: CH 1,20mV, DC,VAR,50 CR
For TRG the secondary commands are as follows:
CH1, CH2 or EXT (This sets the trigger source.)
AUTO, NORM or LINE (This sets the trigger mode.)
POS or NEG (This sets the trigger slope.)
ZERO or VAR,N (where N is a number between -100 and
+100) (This sets the trigger level either to zero or to ±N% of
its maximum value.)
AC, DC or HFREJ (This sets the trigger coupling.)
EDLY,N (where N is a number between 0 and 15) (This sets
the trigger events delay.)
TDLY,N (where N is a number between -40 and 9999) (This
sets the trigger time delay.)
Example: TRG,CH2,AC,TDLY, -10 CR
For TMB the secondary commands are as follows:
50nS, 100nS, 200nS, or 500nS (This sets the timebase speed
in nanoseconds per division).
or 1uS, 2uS, 5uS, 10uS, 20uS, 50uS, 100uS, 200uS, or 500uS
(this sets the timebase speed in microseconds per division).
or 1mS, 2mS, 5mS, 10mS, 20mS, 50mS, 100mS, 200mS, or
500mS (this sets the timebase speed in milliseconds per
division).
or 1S, 2S, 5S, 10S, 20S, 50S, 100S, 200S or 500S (This sets
the timebase speed in seconds per division).
or 10M, 20M, 50M, 100M or 200M (This sets the timebase
speed in minutes per division).
COMP (This sets the SEARCH function into Compress mode).
SCAN,N (where N is a decimal number between 0 and 3100)
(This sets the SEARCH function into Scan mode with the trace
starting at word N).
MAG,N (where N is a decimal number between 0 and 900)
(This sets the SEARCH function into Magnify mode with the
trace starting at word N).
SROFF (This turns any of the SEARCH modes off).
NORM, SLOW or FAST (This sets the display update rate).
ION or IOFF (This sets sine interpolation on or off).
AON or AOFF (This sets averaging on or off). Example:
TMB,10uS,AON,SLOW CR
For TRA or TRB the secondary commands are as follows:
HOME or VAR,N (where N is a number between -100 and
+100) (This sets the trace position either to "home" or to
N% of its maximum shift.)
CAL or UNCAL,N (where N is a number between 0 and 100)
CH1 or CH2 (This links the trace to CH1 (for TRA) or CH2
(for TRB).)
RCL,N (where N is a number between 1 and 16) (This
recalls a waveform to the display from the corresponding
indexed memory.)
SAVE,N (where N is a number between 1 and 16) (This
memory.)
SAVE,N 'where N is a number between 1 and 161 (This
stores the waveform presently displayed on the trace into
the corresponding indexed memory.)
ADD or NOADD (TRCA only) (This turns the "add B to A"
function on or off.)
INV or NOINV (TRCB only) (This turns the trace invert function on or off.)
Example: TRA,HOME,UNCAL,40 CR KEY
KEY
The KEY command enables the front panel of the DSA to be
controlled in exactly the same manner as if the front panel keys
were being pressed. This command provides for control of any
key operated function including those not covered by the previous six primary commands (e.g. PLOT).
The primary command, KEY, must be followed by one or more
(maximum five) secondary commands each of which represents
a front panel key. Each secondary command is a two or three
digit decimal code as shown on the diagram below.
Example: KEY,34,34,97 CR
This would have the effect of incrementing the CH1 volts/div by
two steps and decrementing the timebase time/div by one step.
Page 21

20
Note that if the DSA is being used with an oscilloscope display,
the set-up display will remain on the screen until a key is pressed
or a KEY command is sent. Where immediate use of the display is
required the command for ESCAPE (KEY,112) should be sent.
2. Reading back the front panel status
The front panel status can be read by sending the primary
command for one of the control areas followed by a question
mark (followed by a carriage return).
The valid commands are therefore:
CH1? CH2? TRG? TMB? TRA? TRB?
EXAMPLE: the command CH1? CR will cause the DSA to
send a string of the form CH1,ON,2V,AC,ZERO,0000, OK CR.
3. Controlling and checking the DSA acquisition modes
There are three primary commands for controlling acquisitions.
Each is an ASCII string terminated with a carriage return. There
are no secondary commands.
RUN This sets Run/Hold to Run, enabling continuously
repeating acquisitions.
HOLD This sets Run/Hold to Hold, freezing the digitising
memories.
SINGL (only when Run/Hold is at Hold) This enables a
single acquisition.
EXAMPLE: RUN CR
There is also a command for checking the current acquisition
status of the DSA.
BUSY? This causes the DSA to send back a status letter. The
letter is H if the DSA is in Hold, or B if the DSA is either in Run
or is still completing a Single.
4. Reading waveform data from the DSA
The data from any of the digitising memories, trace memories or
indexed memories can be sent over the interfaces. The data can
be sent in either binary, hex or decimal. In binary mode each
word of the memory is sent as a single byte. In hex and decimal
modes the characters are sent in ASCII, two characters per word
in hex mode and three characters per word in decimal mode.
The DSA is factory initialised to send in decimal. To change the
mode, send the primary command MODE followed by a comma
followed by one of the secondary commands BIN, HEX or DEC
(followed by a carriage return). Once changed, the new mode is
retained in non-volatile memory.
EXAMPLE: MODE,BIN CR
To read the data, send the primary command MEM? followed by
a comma followed by one of the secondary commands listed
below (followed by a carriage return).
The secondary commands are as follows:
AQU1 or AQU2 This causes 4096 words to be read from the
digitising memory of CH 1 or CH2.
TRA or TRB This causes 1024 words to be read from the trace
memory of Trace A or Trace B.
TRAB This causes 512 words to be read from each of the
trace memories in an interleaved manner (only every
alternate word in each memory is read). A total of 1024
words is sent. N (where N is a number between 1 and 16)
This causes 1024 words to be read from the corresponding
indexed memory.
EXAMPLE: MEM?,7 CR
After the final word has been sent, the DSA will send the string:
SPACE OK CR.
5. Loading data into the waveform memories
Data can be loaded into any of the digitising memories, trace
memories or indexed memories. The data can be sent in binary,
hex or decimal formats. The format is changed using the MODE
command (see previous section for an explanation of this
command).
To load the data, send the primary command MEM followed by
a comma followed by one of the secondary commands listed
below (followed by a carriage return).
The secondary commands are as follows:
ACQ1 or AQU2 This loads the digitising memory of CH1 or
CH2. 4096 words must be sent.
TRA or TRB This loads the trace memory of Trace A or
Trace B. 1024 words must be sent.
N (where N is a number from 1 to 16) This loads one of the
indexed memories. 1024 words must be sent.
EXAMPLE: MEM,TRA CR
After this command has been sent the DSA will send back the
string: READY CR indicating that it is ready to accept the data.
When the correct number of bytes have been received it will
send back the string: OK CR.
6. Further primary commands
IDENT? This causes the DSA to send back an identity
string which includes the firmware level, e.g.
DSA524 V2.67
BEEP This causes the audio transducer on the DSA
to give a short "beep".
TEXT,STRING where STRING is a string of up to 20 ASCII
characters from the set listed below; This
causes the string to be displayed on the
screen for 3 seconds.
FPOFF This causes the DSA front panel to be
disabled. The front panel lamp marked REM
(remote) will be illuminated.
FPON This causes the DSA front panel to be enabled
again.
Note that FPOFF also disabled the primary command KEY, thus
if KEY commands are required when the front panel is disabled
it will be necessary to send FPON followed by the appropriate
KEY commands followed by FPOFF.
List of allowable ASCII characters for the TEXT command:
All upper case letters A to Z, numbers 0 to 9, plus the following
lower case letters and symbols: m, n, u, +, -, *, /, =. In
addition, sending the ASCII character ! will produce a delta
symbol, [will produce a left facing arrow and] will produce a
right facing arrow. Space will produce a space.
7. Saving and restoring the total contents of the DSA
memories
The total contents of the non-volatile memories of the DSA (i.e.
digitising memories, screen memories, indexed waveform
stores, front panel set-up memory, and Program mode
memory) can be saved to a remote location (e.g. a disk store)
and restored from a remote location using the commands
DUMP? and LOAD.
To save data from the DSA, send the command string DUMP?
CR the DSA will send 30,000 bytes of data followed by the
string SPACE OK CR. The data will be sent in the format set by
the MODE command (see Section 4).
To restore data to the DSA, send the command string LOAD CR
the DSA will send back the string READY CR indicating it is
ready to accept data. When 30,000 bytes have been received it
will send back the string OK CR.
Important note! No modifications must be made to the data
saved using the DUMP? command. Also the MODE setting (see
Section 4) must be the same when the data is restored as it
was when it was saved. To guard against this, any save and
restore program should incorporate a MODE command before
both the DUMP? and the LOAD commands. If the DSA memory
were to be restored with invalid data a total system corruption
would occur. In this event it would be necessary to switch the
DSA off and then on, and then to use "FUNCTION 78" to totally
clear the memories (see Section R27.).
Page 22

21
S1. DSA524 TECHNICAL SPECIFICATIONS
VERTICAL INPUT AMPLIFIERS
Number of
channels 2.
Bandwidth DC to 35MHz (10V/div to 20mV/div).
DC to 20MHz (10mV/div).
DC to 10MHz (5mV/div).
DC to 5MHz (2mV/div).
Accuracy ± 3%.
Input Protection 400V DC or ACpk.
DIGITAL RECORDING SYSTEM
Vertical Resolution 8 bits (0.4%).
Recording
Memory Size 4096 words per channel.
Max. Sampling
Rate 20MS/s (single channel).
(single event 20MS/s (dual alternate).
signal) 5MS/s (dual chop).
Max. Storage
Bandwidth 5MHz (4 samples/cycle) using sine inter(single event interpolation.
signal)
Max. Equiv.
Sample Rate 2GS /s.
(repetitive signal)
Max. Storage
Bandwidth 35MHz.
(repetitive signal)
TIMEBASE MODES
Normal 100ms/div to 5us/div.
Repeat 2us/div to 50ns/div.
(repetitive signal)
Roll 200mins/div to 200msecs/div.
ACQUISITION MODES
Run Acquisitions are repeated automatically.
Hold Acquisition memory contents are frozen.
Single Acquisition memories are updated once
and then frozen.
TRIGGER MODES
Triggered Acquisitions are only taken in synchronism
with a trigger signal.
Auto As triggered but acquisitions free run when
there is no trigger signal.
Line Acquisitions are taken in synchronism with
AC line frequency.
Pre-trigger delay The acquisition is stopped such that data
prior to the trigger event is captured.
Post-trigger delay The acquisition is stopped such that data
after the trigger event is captured.
TRIGGER CONTROL SYSTEM
Source CH1, CH2 or External.
Level Variable ± 4.25 divisions or fixed (zero).
Sensitivity Internal< 0.8 divisions, External < 300mV
(DC to 5MHz).
Internal < 3 divisions, External <1V
(5MHz to 20MHz).
Slope Selectable as positive or negative.
Coupling Selectable as AC, DC or HF reject.
Time Delay 0 to 40 divs pre-trigger, 0 to 10,000 divs
post-trigger (10 seconds max.).
Events Delay Selectable 1 to 16 trigger events before
acquisition.
OSCILLOSCOPE DISPLAY SYSTEM
Trace A Displays 1024 words from either CH1 or
any indexed waveform storage memory.
Trace B Displays 1024 words from either CH2 or
any indexed waveform storage memory.
Line Type Selectable as individual levels (dots) or
joined to form a smooth line.
Update Rate Selectable between 50 per second and
(Run Mode) one every 3 seconds (continuous in roll
mode).
OSCILLOSCOPE DISPLAY VERTICAL CONTROL
Position Continuously variable for each trace
± 4.25 divisions.
Gain Variable Continuously variable for each trace
between X1 and X0.2.
Invert Displays trace B inverted.
Add Adds trace B (normal or inverted) to
trace A.
Multiply Multiplies trace A by trace B.
Average Displays the average of between 2 and
256 acquisitions.
OSCILLOSCOPE DISPLAY HORIZONTAL CONTROL
Compress Compresses the whole 4096 words of the
acquisition memory into the 1024 words of
the trace memory.
Scan Selects which block of 1024 words from
4096 is displayed.
Magnify (x10) Expands any 102 word section of the
memory ten times to fill the screen using
digital liner interpolation.
Sine Interpolation Re-constructs sinusoidal waveforms in
magnify mode.
WAVEFORM STORAGE (NON-VOLATILE)
Digitising
Memories 2 of 4096 words each.
Indexed Memories 16 of 1024 words each.
Storage Period Potentially infinite, supported by trickle
charged batteries, hold-up period
1month when un-powered.
PROGRAM STORAGE (NON-VOLATILE)
System All controls are fully programmable and
front-panel settings can be stored and re-
called individually or in sequence. Maxi-
mum number of stored settings 50.
RS-423 INTERFACE (RS-232 COMPATIBLE)
Baud Rate Selectable between 300 baud and 38,400
baud in 8 steps.
Write Functions All front panel controls are fully
programmable and can be set via the
interface. The trace memories and indexed
waveform memories can all have data
written to them.
Read Functions The front panel status can be read via the
interface. Data can be read from the trace
memories and the Indexed waveform
memories.
Page 23

22
HARDCOPY OUTPUT FACILITIES
Printer Interface Links to dot-matrix printer
(Epson quad density graphics compatible)
via RS-423 interface.
Prints stored waveforms plus annotation.
Digital Plotter Links to digital X-Y plotter
Interface (HP-GL compatible) via RS-423 interface.
Plots stored waveforms plus annotation.
Analogue Plotter Provides simultaneous output of A and B
Interface traces for analogue chart recorder plus X
output for X-Y plotter. Output 100mV/div.
Speed 1,2,5 or 10 seconds per division. Pen
lift/chart feed output 0 to 5V.
POWER 110, 120, 220 or 240V ± 10% at 50/60Hz.
REQUIREMENTS 30VA max.
OPTIONS
GP-IB (IEEE-488) Provides all of the functions of the
Interface RS-423 interface via the General Purpose
Interface Bus.
DS-PC Link Software and firmware package which links
the instrument to an IBM-PC compatible
personal computer for waveform display
and control.
S2. ELECTRICAL ISOLATION
The ground connections of the DSA are all connected to the
ground conductor of the AC line supply. All exposed metal parts
are also connected to this point. Consequently only equipment
which is either floating or is already connected to AC line
ground should be connected to the ground of the DSA.
S3. GENERAL SAFETY CONSIDERATIONS
This instrument has been designed to the highest safety
standards, but safety depends on the user and the following
basic precautions should be observed. The instrument is Class 1
by IEC classification.
i) Before connecting to an AC line supply, check that the unit is
set to the correct voltage as indicated by the label at the rear.
ii) Ensure that an appropriate AC line plug is connected to the
standard IEC cable supplied, and that a secure ground
connection is made. Connections are brown = live, blue =
neutral, green/yellow = ground.
iii) Remove power from the instrument before making any
attempts to dismantle it.
S4. FUSE REPLACEMENT
The AC power fuse is mounted on the back panel within the AC
line input socket housing. To replace the fuse pull the clip-in
tray outwards. The active fuse is at the back of the tray, the
front space is for a spare fuse.
The fuse must be replaced with a 500mA anti-surge 20mm
cartridge fuse. A ceramic bodied HRC type should be used
whenever possible.
S5. MAINTENANCE AND REPAIR
The manufacturers or their agents abroad will provide repair for
any unit developing a fault. In the UK, defective instruments
should be returned, carriage paid, to the manufacturer's service
department. Careful and substantial packing is essential, no responsibility can be accepted for damage caused in transit to the
manufacturer, if possible use the original packing material.
If the guarantee has expired or if the fault is the result of
misuse, the repair will be carried out and charged unless other
instructions are received.
Customers outside of the UK should contact the dealer or agent
from whom the unit was purchased to ascertain service
arrangements for that country.
S6. UPDATING THE FIRMWARE
From time to time small revisions may be made to the firmware
of the DSA524 (the firmware is the ROM based program code
for the unit). The firmware level is displayed briefly whenever
the unit is first switched on (and when SET 'SCOPE is used) as
DSA524 X.XX, where X.XX is the firmware level.
If the user should require an update to the latest firmware level
at any time, new firmware can be obtained via the agent or distributor from whom the unit was purchased (or directly from
Thurlby Electronics Ltd.) and can be fitted by the user. A small
charge will be made for the new firmware.
S7. GUARANTEE
The instrument is guaranteed as free from defects in workmanship or materials. The terms of the guarantee will vary dependent upon the country in which it is sold. Information concerning the guarantee can be obtained from the dealer or agent
from whom it was purchased. In the UK the guarantee period is
12 months.
Page 24

Thurlby Electronics Ltd
New Road/Burrel Road, St. Ives
Huntingdon, Cambs. England
Telephone: (0480) 63570, Fax (0480) 64832, Telex: 32475
 Loading...