

Page 1

STORMBEE
Software User Manual
Think 3D BVBA
30/09/2018
Page 2

STORMBEE Software User Manual – Think 3D BVBA
Version N°1.1, last modified 30/09/2018
ii
PAGE INTENTIONALLY LEFT BLANK
Page 3

STORMBEE Software User Manual – Think 3D BVBA
Version N°1.1, last modified 30/09/2018
iii
Version control
Author
Date
Version
Comments/Adaptations
Jon Verbeke
26/04/2018
1.0
Initial version
Jon Verbeke
30/09/2018
1.1
Updated to S20 production model
Page 4

STORMBEE Software User Manual – Think 3D BVBA
Version N°1.1, last modified 30/09/2018
iv
PAGE INTENTIONALLY LEFT BLANK
Page 5

STORMBEE Software User Manual – Think 3D BVBA
Version N°1.1, last modified 30/09/2018
v
Table of Contents
Version control ........................................................................................................................................ iii
List of figures .......................................................................................................................................... vii
List of tables ............................................................................................................................................ xi
Symbols and abbreviations ................................................................................................................... xiii
1 Introduction ..................................................................................................................................... 1
1.1 System requirements .............................................................................................................. 1
1.2 General workflow postprocessing ........................................................................................... 1
2 Extracting data from FARO scanner and GNSS module .................................................................. 3
2.1 Extracting data from FARO scanner ........................................................................................ 3
2.1.1 Extraction......................................................................................................................... 3
2.1.2 Format ............................................................................................................................. 4
2.2 Extracting data from GNSS module ......................................................................................... 5
3 Applanix POSPac UAV .................................................................................................................... 11
3.1 Installation POSPac UAV ........................................................................................................ 11
3.2 Importing GPS trajectories .................................................................................................... 12
3.3 Processing raw GNSS data to refined GNSS data .................................................................. 17
3.3.1 Single base processing ................................................................................................... 18
3.3.2 SmartBase processing.................................................................................................... 25
3.3.3 Own base station processing ......................................................................................... 35
3.3.4 Quality control ............................................................................................................... 36
3.3.5 Data export .................................................................................................................... 42
3.4 Troubleshooting .................................................................................................................... 44
3.4.1 Import error ................................................................................................................... 44
3.4.2 Checking message logs for errors after import ............................................................. 45
3.4.3 Too few satellites (below five) ...................................................................................... 47
4 BEEFLEX ......................................................................................................................................... 49
4.1 Installation ............................................................................................................................. 49
4.2 Data processing ..................................................................................................................... 51
5 Visualisation (refined) point cloud ................................................................................................ 57
5.1 CloudCompare information ................................................................................................... 57
5.1.1 Install Cloud Compare software .................................................................................... 57
5.1.2 Visualize cloud point data ............................................................................................. 57
Page 6

STORMBEE Software User Manual – Think 3D BVBA
Version N°1.1, last modified 30/09/2018
vi
5.2 Visualisation postprocessed point cloud ............................................................................... 57
5.2.1 Import data files ............................................................................................................ 57
5.2.2 Verify accuracy results ................................................................................................... 59
5.3 Examples post-processed data .............................................................................................. 68
6 STORMBEE and FARO scanner calibration procedure................................................................... 71
Page 7

STORMBEE Software User Manual – Think 3D BVBA
Version N°1.1, last modified 30/09/2018
vii
List of figures
Figure 1.1 STORMBEE post-processing software workflow .................................................................... 2
Figure 2.1 Remove SD-card from FARO scanner ..................................................................................... 3
Figure 2.2 Insert SD-card into computer ................................................................................................. 4
Figure 2.3 FARO scanner data *.fls folder structure ............................................................................... 4
Figure 2.4 Data extraction: connect battery ........................................................................................... 5
Figure 2.5 Data extraction: turn on GNSS avionics and connect ethernet cable .................................... 6
Figure 2.6 Ethernet settings 1 ................................................................................................................. 6
Figure 2.7 Ethernet settings 2 ................................................................................................................. 7
Figure 2.8 Ethernet settings 3 ................................................................................................................. 7
Figure 2.9 FileZilla open site manager ..................................................................................................... 8
Figure 2.10 FileZilla site manager settings .............................................................................................. 8
Figure 2.11 FileZilla connect to STORMBEE ............................................................................................. 9
Figure 2.12 FileZilla select files and drag to left screen .......................................................................... 9
Figure 2.13 FileZilla file transfer progress ............................................................................................. 10
Figure 2.14 FileZilla file transfer succesful ............................................................................................ 10
Figure 3.1 Applanix base stations worldwide ........................................................................................ 11
Figure 3.2 Applanix license activation step 1 ........................................................................................ 12
Figure 3.3 Applanix license activation step 2 ........................................................................................ 13
Figure 3.4 Applanix new default project ............................................................................................... 13
Figure 3.5 Importing GNSS data files from PosPac ribbon .................................................................... 14
Figure 3.6 Applanix GNSS data import progress window 1 ................................................................... 14
Figure 3.7 Applanix GNSS data import progress window 2 ................................................................... 15
Figure 3.8 Applanix GNSS antenna used ............................................................................................... 15
Figure 3.9 Applanix trajectory with zoomed view of orange event triangles ....................................... 16
Figure 3.10 Applanix import failure error message .............................................................................. 16
Figure 3.11 Applanix IMU data continuity check error message .......................................................... 16
Figure 3.12 Applanix processing initialisation settings ......................................................................... 17
Figure 3.13 Applanix GNSS-Inertial processor button ........................................................................... 17
Figure 3.14 Applanix GNSS-Inertial processor Single Base .................................................................... 18
Figure 3.15 Applanix data base import options .................................................................................... 18
Figure 3.16 Applanix data base import high-rate data sites ................................................................. 19
Figure 3.17 Applanix data base import single base ............................................................................... 20
Figure 3.18 Applanix data base stations import list .............................................................................. 21
Figure 3.19 Applanix single base station w.r.t. mission trajectory view ............................................... 21
Figure 3.20 Applanix set single base station ......................................................................................... 22
Figure 3.21 Applanix single base station data quality analysis ............................................................. 23
Figure 3.22 Applanix GNSS-inertial processor processing ..................................................................... 23
Figure 3.23 Applanix GNSS-Inertial processing completed ................................................................... 24
Figure 3.24 Applanix GNSS-Inertial processor SmartBase..................................................................... 26
Figure 3.25 Applanix data base import options .................................................................................... 26
Figure 3.26 Applanix data base import high-rate data sites ................................................................. 27
Figure 3.27 Applanix data base import SmartBase ............................................................................... 27
Page 8

STORMBEE Software User Manual – Think 3D BVBA
Version N°1.1, last modified 30/09/2018
viii
Figure 3.28 Applanix data base stations import list .............................................................................. 28
Figure 3.29 Applanix set SmartBase control station ............................................................................. 29
Figure 3.30 Applanix GNSS-inertial processor processing SmartBase .................................................. 30
Figure 3.31 Applanix SmartBase website .............................................................................................. 30
Figure 3.32 Applanix SmartBase Login and register for free ................................................................. 31
Figure 3.33 Applanix SmartBase Login .................................................................................................. 31
Figure 3.34 Applanix SmartBase search mission location ..................................................................... 32
Figure 3.35 Applanix SmartBase mission location ................................................................................ 32
Figure 3.36 Applanix SmartBase mission location marker .................................................................... 33
Figure 3.37 Applanix SmartBase preview SmartBase button ................................................................ 33
Figure 3.38 Applanix SmartBase VRS info ............................................................................................. 34
Figure 3.39 Applanix SmartBase VRS request window ......................................................................... 34
Figure 3.40 Applanix SmartBase VRS data (full) .................................................................................... 35
Figure 3.41 Applanix SmartBase VRS data to import in POSPac ........................................................... 35
Figure 3.42 Applanix quality control generate diagnostic report ......................................................... 36
Figure 3.43 Applanix quality control display plots overview................................................................. 37
Figure 3.44 Applanix quality control display plot RMSE ........................................................................ 38
Figure 3.45 Applanix quality control display plot number of satellites ................................................. 39
Figure 3.46 Applanix quality lever arm settings .................................................................................... 40
Figure 3.47 Applanix quality control display plot PDOP ........................................................................ 40
Figure 3.48 Applanix quality control display plot cycle slips ................................................................. 41
Figure 3.49 Applanix export LIDAR event data (for BEEFLEX processing) ............................................. 42
Figure 3.50 Applanix export trajectory data (for BEEFLEX processing) step 1 ...................................... 43
Figure 3.51 Applanix export trajectory data (for BEEFLEX processing) step 2 ...................................... 43
Figure 3.52 Applanix import failure error message .............................................................................. 44
Figure 3.53 Applanix import error split file program ............................................................................ 44
Figure 3.54 Applanix import error split files .......................................................................................... 45
Figure 3.55 Applanix opening message logs dropdown menu.............................................................. 45
Figure 3.56 Applanix message log POS data import .............................................................................. 45
Figure 3.57 Applanix message log IMU data continuity checking (step 1) ............................................ 46
Figure 3.58 Applanix message log IMU data continuity checking (step 2) ............................................ 46
Figure 3.59 Applanix satellite elevation mask angle ............................................................................. 47
Figure 4.1 BEEFLEX program folder structure ....................................................................................... 49
Figure 4.2 BEEFLEX license activation and management ...................................................................... 50
Figure 4.3 BEEFLEX start screen ............................................................................................................ 50
Figure 4.4 Folder containing all files required by BEEFLEX ................................................................... 51
Figure 4.5 BEEFLEX select folder flight and scan data ........................................................................... 51
Figure 4.6 BEEFLEX import raw scan data and convert to *.e57-format .............................................. 52
Figure 4.7 BEEFLEX flight and scan data general overview ................................................................... 52
Figure 4.8 BEEFLEX flight and scan data general overview (satellite view) .......................................... 53
Figure 4.9 BEEFLEX data import possible error messages..................................................................... 53
Figure 4.10 BEEFLEX select relevant section of flight ............................................................................ 54
Figure 4.11 BEEFLEX select multiple sections of flight .......................................................................... 54
Figure 4.12 BEEFLEX data processing run information window ............................................................ 55
Figure 4.13 BEEFLEX data processing progress E57-format .................................................................. 56
Page 9

STORMBEE Software User Manual – Think 3D BVBA
Version N°1.1, last modified 30/09/2018
ix
Figure 4.14 BEEFLEX data processing progress LAS-format .................................................................. 56
Figure 4.15 BEEFLEX refined point cloud data folder structure ............................................................ 56
Figure 5.1 CloudCompare import files through desktop icon ............................................................... 58
Figure 5.2 CloudCompare import point cloud properties window ....................................................... 58
Figure 5.3 CloudCompare import point cloud progress ........................................................................ 59
Figure 5.4 CloudCompare visualisation refined point clouds................................................................ 59
Figure 5.5 CloudCompare selection flight (segment) ............................................................................ 60
Figure 5.6 CloudCompare flight (segment) colour selection window ................................................... 60
Figure 5.7 CloudCompare flight (segments) with unique colours ......................................................... 61
Figure 5.8 CloudCompare selecting all point clouds in Navigation menu ............................................. 61
Figure 5.9 CloudCompare all point clouds selected in navigation menu .............................................. 62
Figure 5.10 CloudCompare point cloud cross-section .......................................................................... 62
Figure 5.11 CloudCompare cross-section properties window .............................................................. 63
Figure 5.12 CloudCompare point cloud with cross-section properties window and interactors ......... 63
Figure 5.13 CloudCompare point cloud cross-section narrow slice ...................................................... 64
Figure 5.14 CloudCompare point cloud slice zoomed in (10 meter) ..................................................... 64
Figure 5.15 CloudCompare cross-section zoomed in (1 meter) ............................................................ 65
Figure 5.16 CloudCompare cross-section in-plane quality control ....................................................... 65
Figure 5.17 CloudCompare point cloud cross-section narrow slice (example 2) .................................. 66
Figure 5.18 CloudCompare point cloud slice zoomed in (example 2) ................................................... 67
Figure 5.19 CloudCompare cross-section in-plane quality control (example 2) ................................... 67
Figure 5.20 Final post-processed point cloud ....................................................................................... 68
Figure 5.21 3D model based on final post-processed point cloud data ................................................ 68
Figure 5.22 2D drawing based on final post-processed point cloud data ............................................. 69
Figure 6.1 STORMBEE hastag (#) calibration flight path example ......................................................... 71
Figure 6.2 Folder containing all files required by BEEFLEX ................................................................... 72
Figure 6.3 FARO scanner calibration "config.ini" file ............................................................................ 72
Figure 6.4 FARO scanner calibration parameters (heading, pitch and roll) .......................................... 73
Page 10

STORMBEE Software User Manual – Think 3D BVBA
Version N°1.1, last modified 30/09/2018
x
PAGE INTENTIONALLY LEFT BLANK
Page 11

STORMBEE Software User Manual – Think 3D BVBA
Version N°1.1, last modified 30/09/2018
xi
List of tables
N/A
Page 12

STORMBEE Software User Manual – Think 3D BVBA
Version N°1.1, last modified 30/09/2018
xii
PAGE INTENTIONALLY LEFT BLANK
Page 13

STORMBEE Software User Manual – Think 3D BVBA
Version N°1.1, last modified 30/09/2018
xiii
Symbols and abbreviations
GNSS Global Navigation Satellite System
GPS Global Positioning System
IMU Inertial Measurement Unit
RAM Random-Access Memory
Page 14

STORMBEE Software User Manual – Think 3D BVBA
Version N°1.1, last modified 30/09/2018
xiv
PAGE INTENTIONALLY LEFT BLANK
Page 15

STORMBEE Software User Manual – Think 3D BVBA
Version N°1.1, last modified 30/09/2018
1
1 Introduction
1.1 System requirements
We recommend a performant laptop/desktop to perform all processing with as visualising the point
clouds and processing all data is very demanding on the processor and graphical card and requires a
lot of RAM.
Recommended specs (based on most demanding software package FARO Scene):
• Processor: Quad-core X64, Intel Core i7/Xeon, 8 physical cores
• Graphics Card: Dedicated graphics card, OpenGL 4.1 or higher, at least 4 GB Memory,
o For Stereo Rendering: NVIDIA Quadro;
o For VR Rendering: NVIDIA 1080GTX or similar, Oculus Rift or HTC Vive with Touch
Controllers, SteamVR must be installed
• Main memory: 64 GB RAM
• Hard Disk Drive: 512 GB Solid State Drive + Regular HDD
• Operating System: 64-bit Windows™ 7 SP1 or higher
• Screen resolution: 1920×1080
1.2 General workflow postprocessing
The general workflow for postprocessing the laser scanner data is shown in Figure 1.1 .
Page 16

STORMBEE Software User Manual – Think 3D BVBA
Version N°1.1, last modified 30/09/2018
2
Figure 1.1 STORMBEE post-processing software workflow
Page 17

STORMBEE Software User Manual – Think 3D BVBA
Version N°1.1, last modified 30/09/2018
3
2 Extracting data from FARO scanner and GNSS module
2.1 Extracting data from FARO scanner
2.1.1 Extraction
1. Ensure that the FARO scanner is powered off.
2. Remove the SD card of the FARO scanner. Please refer to the manual of your specific FARO
scanner on how to do this.
Figure 2.1 Remove SD-card from FARO scanner
Page 18

STORMBEE Software User Manual – Think 3D BVBA
Version N°1.1, last modified 30/09/2018
4
3. Plug the SD-card into an SD-card reader connected with your laptop. Copy the data to your
laptop in a folder of your choice.
Figure 2.2 Insert SD-card into computer
2.1.2 Format
The FARO scanner data is stored within a folder named “***.fls”. It should contain several files and
subfolders. Each “*.fls” folder represents a single STORMBEE flight (Figure 2.3).
Figure 2.3 FARO scanner data *.fls folder structure
Page 19

STORMBEE Software User Manual – Think 3D BVBA
Version N°1.1, last modified 30/09/2018
5
2.2 Extracting data from GNSS module
Data retrieval uses FileZilla Client Basic (or equivalent) software. Please download and install program
from https://filezilla-project.org/.
1. Connect battery (1 is sufficient)
Figure 2.4 Data extraction: connect battery
2. On the STORMBEE, power on the GNSS avionics (and FARO Focus scanner) by pressing the
large button with the power symbol on it.
Page 20

STORMBEE Software User Manual – Think 3D BVBA
Version N°1.1, last modified 30/09/2018
6
3. Wait until the large LED is blinking and then connect the ethernet cable from the GNSS avionics
box to your PC.
Figure 2.5 Data extraction: turn on GNSS avionics and connect ethernet cable
4. You should verify that the adapter settings of your ethernet port are set to the correct fixed IP
address. Otherwise FileZilla cannot connect to it. Open your Windows settings page and leftclick on "network and internet settings". Go to page "Ethernet". Click on "Change adapter
options". You should now see the adapters (usually "Bluetooth", "Ethernet" and "Wi-Fi").
Right-click on "Properties. Select "Internet Protocol version 4 (TCP/IPv4" and click below on
"Properties". You should now see the IP and DNS properties window. Here is where you need
to set the manual IP address to be able to connect with STORMBEE. Usually this will be set to
"apply automatic IP and DNS addresses". If it is filled in with other values or you use an
ethernet cable for internet then you should remember to revert the following changes
afterwards. Otherwise your (wired) internet connection might not work anymore. The settings
don't affect your Wi-Fi connections. Set IP-address to "192.168.53.101" and subnet mask to
"255.255.255.0". Leave the rest empty. Press OK until all windows are closed.
Figure 2.6 Ethernet settings 1
Page 21

STORMBEE Software User Manual – Think 3D BVBA
Version N°1.1, last modified 30/09/2018
7
Figure 2.7 Ethernet settings 2
Figure 2.8 Ethernet settings 3
Page 22

STORMBEE Software User Manual – Think 3D BVBA
Version N°1.1, last modified 30/09/2018
8
5. Open FileZilla
6. File -> Site Manager
Figure 2.9 FileZilla open site manager
7. If you have already performed this step once, you can skip this step.
For first use, you need to add the STORMBEE as a new “site”. If you have set this before, skip
to step 7. Press “New Site”, change its name to STORMBEE by simply clicking on the text and
fill in the following settings:
- Host: 192.168.53.100
- Protocol: FTP- File Transfer Protocol
- Encryption: Only use plain FTP (insecure)
- Logon Type: Normal
- User: guest
- Password: Applanix
Figure 2.10 FileZilla site manager settings
Page 23

STORMBEE Software User Manual – Think 3D BVBA
Version N°1.1, last modified 30/09/2018
9
8. Connect to STORMBEE using the dropdown menu of the upper left icon and choose
“STORMBEE”. FileZilla will connect to STORMBEE and show the file structure in the right-hand
window.
Figure 2.11 FileZilla connect to STORMBEE
9. Find the data file with the newest date of creation (Last modified) corresponding to your flight.
Select all relevant files. In the left-hand window go to your preferred folder in which the GNSS
data files may be stored. Simply click-and-drag from the right-hand window (STORMBEE
onboard data folder) to the left-hand window (your PC folder)
Figure 2.12 FileZilla select files and drag to left screen
Page 24

STORMBEE Software User Manual – Think 3D BVBA
Version N°1.1, last modified 30/09/2018
10
Figure 2.13 FileZilla file transfer progress
10. If all went well, the text window at the top will display: “File transfer successful”.
Figure 2.14 FileZilla file transfer succesful
11. Close FileZilla, disconnect the ethernet cable and power off the GNSS avionics (and FARO Focus
scanner) by pressing the large button with the power symbol on it. Afterwards, disconnect
the flight battery/batteries.
12. Don't forget to revert the changes to the IP-address window if you use wired internet (through
ethernet cable). See step 4.
Page 25

STORMBEE Software User Manual – Think 3D BVBA
Version N°1.1, last modified 30/09/2018
11
3 Applanix POSPac UAV
3.1 Installation POSPac UAV
POSPac UAV is differential GNSS-aided inertial post-processing software for georeferencing
STORMBEE’s flight trajectory. It corrects STORMBEE’s flight trajectory, measured on-board by APX20
equipped with IMU and GPS antenna. It uses GPS satellite ephemeris (trajectory) and GPS base station
data to achieve robust, centimetre level position and orientation information worldwide.
You can find a map showing all base stations worldwide that are used by POSPac UAV here:
https://applanixsmartbase.com/. You need to (freely) register with Trimble to see the map of all base
stations worldwide (Figure 3.1). In case no base stations are near your mission location, POSPac UAV
allows you to use Applanix SmartBase option (requires additional Trimble subscription, not free) or use
data from your own GPS station.
Figure 3.1 Applanix base stations worldwide
You can download POSPac UAV here:
https://www.applanix.com/contact.htm#support
If you are not registered for download yet, please register here:
https://www.applanix.com/register.htm
Go to “Airborne Support” → “Download and Updates” → “PosPac UAV”. Please download the latest
version. Current version at time of writing these instructions: PosPac UAV 8.3. A zip-file will start
downloading. Simply unpack it and install with default settings. You may need to temporarily disable
you virus scanner during installation.
Page 26

STORMBEE Software User Manual – Think 3D BVBA
Version N°1.1, last modified 30/09/2018
12
3.2 Importing GPS trajectories
The following files are required in order to process a trajectory in Applanix POSPac.
➢ Raw STORMBEE Applanix GNSS data files (Stormbee1_APX20.***),
➢ Satellite ephemeris files (supplied by POSPac UAV databases),
➢ Base station data files (supplied by POSPac UAV databases or your own GPS station).
1. Open POSPac UAV.
2. If this is your very first time running POSPac UAV, please activate your license to unlock all features.
Go to the Applanix ribbon and open the “Help” menu (Figure 3.2). Press “Software License Utility”.
A new window will open. Press “Activate License” after which you can fill in the product key you
have received. Press “Activate. If all went well, then you should get confirmation that your license
has been successfully activated (Figure 3.3).
Figure 3.2 Applanix license activation step 1
Page 27

STORMBEE Software User Manual – Think 3D BVBA
Version N°1.1, last modified 30/09/2018
13
Figure 3.3 Applanix license activation step 2
3. In POSPac ribbon at the top, select “Project” → “New Default Project” (Figure 3.4).
Figure 3.4 Applanix new default project
4. Choose “File” → “Save project As”. Specify the name and desired directory into which all of the
project files will be saved.
Page 28

STORMBEE Software User Manual – Think 3D BVBA
Version N°1.1, last modified 30/09/2018
14
5. Import the raw STORMBEE GNSS data files into your project (Stormbee1_APX20.***). To import
these files either “drag and drop” the files from Windows Explorer into the working window or use
the import tool from the POSPac ribbon shown in Figure 3.5. First, select the Import icon. Then
select the “…”-box to open the file explorer and finally select “Import”.
Figure 3.5 Importing GNSS data files from PosPac ribbon
6. The files will begin to import into the project. A progress bar will appear. Once the files have
successfully imported POSPac will then automatically attempt to access and download the
necessary satellite ephemeris files (Figure 3.6 and Figure 3.7). Do not press any button while this
is going on. This process step can take several minutes up to half hour or more depending on how
much files there are.
Figure 3.6 Applanix GNSS data import progress window 1
Page 29

STORMBEE Software User Manual – Think 3D BVBA
Version N°1.1, last modified 30/09/2018
15
Figure 3.7 Applanix GNSS data import progress window 2
7. Once imported, POSPac will ask you to set the antenna for the system in use (Figure 3.8). Please
set “Type” to “AV14”.
Figure 3.8 Applanix GNSS antenna used
The raw trajectory will now appear in the working window. Ensure that the event icons (orange
triangles) are present on the trajectory (Figure 3.9). These event timestamps prove that the scanner
was recording during the flight. If errors have occurred during importing, then a message window will
automatically pop up (Figure 3.10 and Figure 3.11). If so, please consult section 3.4 “Troubleshooting”
for solving these errors.
Page 30

STORMBEE Software User Manual – Think 3D BVBA
Version N°1.1, last modified 30/09/2018
16
Figure 3.9 Applanix trajectory with zoomed view of orange event triangles
Figure 3.10 Applanix import failure error message
Figure 3.11 Applanix IMU data continuity check error message
Page 31

STORMBEE Software User Manual – Think 3D BVBA
Version N°1.1, last modified 30/09/2018
17
3.3 Processing raw GNSS data to refined GNSS data
Some GNSS systems are comprised of two GPS antennas mounted on each side of a long arm which
allows them to measure the arm’s heading by comparing both antenna’s GPS position. STORMBEE S20
uses the APX20 which has an IMU combined with a single GPS to be more compact. To measure its
initial heading, STORMBEE first has to fly a few seconds (and several meters forward) to allow the GPS
position measurements of that time period to be used to estimate an initial heading (Figure 3.12). The
default should be set to “Initialize from GNSS track heading”.
Figure 3.12 Applanix processing initialisation settings
Once the flight trajectory data has been imported, you can import base station data. Depending on the
mission location and the project planning, you may want to use either:
1. Data from single base station extracted from POSPac database (“Single Base”, section 3.3.1).
2. Data from multiple base stations extracted from POSPac database (“SmartBase”, section
3.3.2).
3. Data from your own base station (section 3.3.3)
To access the various processing methods, open the “GNSS-Inertial Processor” dialog (Figure 3.13).
Figure 3.13 Applanix GNSS-Inertial processor button
Page 32

STORMBEE Software User Manual – Think 3D BVBA
Version N°1.1, last modified 30/09/2018
18
3.3.1 Single base processing
This is the default processing method when the distance between mission location and reference base
station is below 50km. If the distance in-between is higher than 50km, using SmartBase (requires
subscription) or own local base station might be a better choice depending on your accuracy needs.
1. Select “IN-Fusion Single Base” from the dropdown menu and then click “Run” (Figure 3.14).
Figure 3.14 Applanix GNSS-Inertial processor Single Base
2. A new window will open (Figure 3.15). Select “Search the Internet for base stations”.
Figure 3.15 Applanix data base import options
Page 33

STORMBEE Software User Manual – Think 3D BVBA
Version N°1.1, last modified 30/09/2018
19
3. A new window will open. Please activate high-rate data base stations through search options
(Figure 3.16). It is best to search within 50km of your mission location to achieve the highest
accuracy. Keep the distance between mission location and reference base station as small as
possible.
Figure 3.16 Applanix data base import high-rate data sites
4. Select “Single Base” from the dropdown menu at the bottom of the window (Figure 3.17).
Note: Make sure your country/region and language settings for notations of numbers are set correctly.
Decimals should be dot (.) and grouping per thousand should be comma (,). Otherwise you will get an
error when the base station data import window opens and you will not see a list of base stations. If
this is the case, adjust the settings in Windows and restart POSPac UAV.
Page 34

STORMBEE Software User Manual – Think 3D BVBA
Version N°1.1, last modified 30/09/2018
20
Figure 3.17 Applanix data base import single base
5. The window will now list all possible base stations (Figure 3.18). The “Smart Select” command will
choose the closest one to your mission site and download its data. Optionally, you could select
another desired base station and press “Download and Import” if you want. Applanix will then
download the data and import it. Once complete, press “Close”.
Note: It is sometimes possible that when trying to download and import a base station it gives a
status error “File not found”. This might be due to maintenance of that station at the time of the
mission or that the base station data was not published that period. The only solution is to choose
the next closest base station and try again. The “Smart Select” command will keep trying to find
suitable base stations until it has a validated base station. Typically, the quality of the solution will
degrade with an increase in distance between rover and base. For this reason POSPac will always
order the base stations with respect to their proximity to your mission location. POSPac sets an
automatic limit of 200km from the rover to potential base stations, but it is best to keep it below
50km.
Page 35

STORMBEE Software User Manual – Think 3D BVBA
Version N°1.1, last modified 30/09/2018
21
Figure 3.18 Applanix data base stations import list
6. Once “Close” has been selected, the main window will have zoomed out and show your base
station’s location with respect to your mission trajectory (Figure 3.19). Simply zoom into your
mission area to see your trajectory in more detail.
Figure 3.19 Applanix single base station w.r.t. mission trajectory view
Page 36

STORMBEE Software User Manual – Think 3D BVBA
Version N°1.1, last modified 30/09/2018
22
7. You now need to explicitly set that base station as the base station for your mission. You need to
activate the “Project Explorer” window on the left-hand side if it is not active already through the
ribbon and the “View” menu (Figure 3.20). Go to your mission (default “Mission 1”) and unfold it.
Then Unfold “Base Stations” and right-click on your relevant base station. This will open a small
menu where you should select “Set Base Station”.
Figure 3.20 Applanix set single base station
8. Applanix will automatically perform a quality control analysis of the data of your flight trajectory
and base station data and show you a report (Figure 3.21). There are three types of solutions
reported:
➢ Fixed Solution: very good quality location estimation
o Should be above 90%
o Usually while hovering or flying straight lines with no GPS interference
➢ Float solution: moderate quality location estimation
o Should be as small as possible
o Usually during aggressive manoeuvres such as turns or when GPS has interference
(close to obstacles)
➢ No solution: no localisation was possible
o Should be as small as possible
o Usually happens during initial minutes while booting up as initial GPS lock has not
happened yet
Page 37

STORMBEE Software User Manual – Think 3D BVBA
Version N°1.1, last modified 30/09/2018
23
Note: if the fixed solution percentage is below 70%, you should further investigate why this is. Please
refer to section 3.3.4 “Quality control” for further instructions.
Figure 3.21 Applanix single base station data quality analysis
9. You can now start the final data refinement post-processing by the GNSS-inertial processor (Figure
3.22). Go to the Applanix ribbon and open the “Project” menu. Press on the “GNSS-Inertial
Processor” button and its window will open. Press “Run”. The software may issue a warning when
the distance from the base station to the trajectory or survey area exceeds 20km. Choose to
continue by pressing “Yes”. As noted before, the results remain of good quality if the distance
between base station and mission area is below 50km. Otherwise use SmartBase processing or
your own base station. When the processing is finished, you will see a rough estimation of the
trajectory’s positional accuracy (Figure 3.23). As long as it is at or below 0.1m, it should be fine.
Figure 3.22 Applanix GNSS-inertial processor processing
Page 38

STORMBEE Software User Manual – Think 3D BVBA
Version N°1.1, last modified 30/09/2018
24
Figure 3.23 Applanix GNSS-Inertial processing completed
10. Please go to sections 3.3.4 and 3.3.5 for quality control and data export.
Page 39

STORMBEE Software User Manual – Think 3D BVBA
Version N°1.1, last modified 30/09/2018
25
3.3.2 SmartBase processing
“For land-based applications a significant productivity improvement in Real-Time Kinematic (RTK)
positioning has been achieved using the concept of a “Virtual Reference Station” or VRS. Here
observables from a dedicated network of GNSS reference stations are processed to compute the
atmospheric and other errors within the network. These are then interpolated to generate a complete
set of GNSS observations as if a reference station was located at the rover. There are a number of
significant benefits to this approach” [Applanix SmartBase white paper]:
➢ The distance to the nearest reference station can be extended well beyond 30 km
➢ The time to fix integer ambiguities is significantly reduced
➢ The overall reliability of fixing integer ambiguities in increased
➢ The cost of doing a survey is reduced by eliminating the need to set up dedicated base stations.
➢ No special processing is required in the RTK engine, as it is the case for a centralized multi-base
approach
Basically, it allows you to select four or more base stations in your vicinity and it then interpolates the
correction data to your mission area. This is more precise than using a single base station as reference,
but is less precise than using your own base station at your mission area during your mission (section
3.3.3). The processing procedure and steps are very similar to the single base station processing. For
more detailed instructions, please consult the Applanix POSPac UAV manual and support website.
Note: You can use the POSPac UAV build-in SmartBase feature, but this requires an additional
Trimble subscription. Or you can download (for free) the SmartBase VRS manually from their website
48h after your mission. The first method is described in section 3.3.2.1 "Automated SmartBase
processing", while the manual method is described in section 3.3.2.2 Manual SmartBase processing.
Page 40

STORMBEE Software User Manual – Think 3D BVBA
Version N°1.1, last modified 30/09/2018
26
3.3.2.1 Automated SmartBase processing
1. Select “IN-Fusion SmartBase” from the dropdown menu and then click “Run” (Figure 3.24).
Figure 3.24 Applanix GNSS-Inertial processor SmartBase
2. A new window will open (Figure 3.25). Select “Search the Internet for base stations”.
Figure 3.25 Applanix data base import options
Page 41

STORMBEE Software User Manual – Think 3D BVBA
Version N°1.1, last modified 30/09/2018
27
3. A new window will open. Please activate high-rate data base stations through search options
(Figure 3.26). It is best to search within 50km of your mission location to achieve the highest
accuracy. Keep the distance between mission location and reference base station as small as
possible.
Figure 3.26 Applanix data base import high-rate data sites
4. Select “SmartBase” from the dropdown menu at the bottom of the window (Figure 3.27).
Figure 3.27 Applanix data base import SmartBase
Page 42

STORMBEE Software User Manual – Think 3D BVBA
Version N°1.1, last modified 30/09/2018
28
Note: Make sure your country/region and language settings for notations of numbers are set
correctly. Decimals should be dot (.) and grouping per thousand should be comma (,). Otherwise
you will get an error when the base station data import window opens and you will not see a list
of base stations. If this is the case, adjust the settings in Windows and restart POSPac MMS.
5. The window will now list all possible base stations (Figure 3.28). The “Smart Select” command will
choose the four closest bases stations to your mission site and download their data. Afterwards,
select them and press “Download and Import”. Applanix will download the data and import it.
Once complete, press “Close”.
Note: It is sometimes possible that when trying to download and import a base station it gives a
status error “File not found”. This might be due to maintenance of that station at the time of the
mission or that the base station data was not published that period. The only solution is to choose
the next closest base station and try again. The “Smart Select” command will keep trying to find
suitable base stations until it has four validated base stations. Typically, the quality of the solution
will degrade with an increase in distance between rover and base. For this reason POSPac will
always order the base stations with respect to their proximity to your mission location. POSPac
sets an automatic limit of 200km from the rover to potential base stations, but it is best to keep it
below 50km.
Figure 3.28 Applanix data base stations import list
6. Once “Close” has been selected, the main window will have zoomed out and show the SmartBase
base stations’ locations with respect to your mission trajectory.
Page 43

STORMBEE Software User Manual – Think 3D BVBA
Version N°1.1, last modified 30/09/2018
29
7. You now need to explicitly set one of the base station which you believe is most accurate as the
control station for your mission. You need to activate the “Project Explorer” window on the lefthand side if it is not active already through the ribbon and the “View” menu (Figure 3.29). Go to
your mission (default “Mission 1”) and unfold it. Then Unfold “Base Stations” and right-click on
your relevant base station. This will open a small menu where you should select “Set Control
Station”.
Figure 3.29 Applanix set SmartBase control station
8. You can start the final data refinement processing by the GNSS-inertial processor (Figure 3.30). Go
to the Applanix ribbon and open the “Project” menu. Press on the “GNSS-Inertial Processor”
button and its window will open. Press “Run”. The software may issue a warning when the distance
from the base station to the trajectory or survey area exceeds 20km. Choose to continue by
pressing “Yes”. As noted before, the results remain of good quality if the distance between base
station and mission area is below 50km. Otherwise use your own base station. When the
processing is finished, you will see a rough estimation of the trajectory’s positional accuracy. As
long as it is below 0.1m, it should be fine. For more detailed instructions, please consult the
Applanix POSPac UAV manual and support website.
Page 44

STORMBEE Software User Manual – Think 3D BVBA
Version N°1.1, last modified 30/09/2018
30
9. Please go to sections 3.3.4 and 3.3.5 for quality control and data export.
Figure 3.30 Applanix GNSS-inertial processor processing SmartBase
3.3.2.2 Manual SmartBase processing
This is the free option, but you have to register yourself. Please note that the GNSS correction data of
a VRS close by your mission location is not available until 48h after you finished your mission.
1. Go to the Applanix SmartBase website (https://applanixsmartbase.com/) and click on "Learn
More" (Figure 3.31).
Figure 3.31 Applanix SmartBase website
Page 45

STORMBEE Software User Manual – Think 3D BVBA
Version N°1.1, last modified 30/09/2018
31
2. If you have not registered a Trimble account, click on "Try it Free" and create your own account.
Once you have an account, you can click on "Log In" (Figure 3.32).
Figure 3.32 Applanix SmartBase Login and register for free
3. Log in into you Trimble account (Figure 3.33).
Figure 3.33 Applanix SmartBase Login
Page 46

STORMBEE Software User Manual – Think 3D BVBA
Version N°1.1, last modified 30/09/2018
32
4. Search you mission location in the upper right box (Figure 3.34 and Figure 3.35).
Figure 3.34 Applanix SmartBase search mission location
Figure 3.35 Applanix SmartBase mission location
Page 47

STORMBEE Software User Manual – Think 3D BVBA
Version N°1.1, last modified 30/09/2018
33
5. Zoom in on your mission area and draw a marker in the middle of it. This will open a small window
where you can press "Preview SmartBase" (Figure 3.36 and Figure 3.37).
Figure 3.36 Applanix SmartBase mission location marker
Figure 3.37 Applanix SmartBase preview SmartBase button
Page 48

STORMBEE Software User Manual – Think 3D BVBA
Version N°1.1, last modified 30/09/2018
34
6. The SmartBase website will create a Virtual Reference Station (VRS) at the location of the marker
using multiple (physical) base stations. It will provide you with an indication of the quality of the
VRS data ranging from fail (very bad) to Excellent (very good). Press the "Request SmartBase
button" to request the VRS data (Figure 3.38).
Figure 3.38 Applanix SmartBase VRS info
7. Fill in your mission specifications in the request window (Figure 3.39). Afterwards press the
"Request SmartBase" button. You should then receive within half an hour an email from Applanix
containing your VRS data file (in a zip file).
Figure 3.39 Applanix SmartBase VRS request window
Page 49

STORMBEE Software User Manual – Think 3D BVBA
Version N°1.1, last modified 30/09/2018
35
8. Unpack the *.zip file containing your VRS data (Figure 3.40).
Figure 3.40 Applanix SmartBase VRS data (full)
9. Select and drag the relevant files from your Windows Explorer window into your POSPac trajectory
view screen (Figure 3.41). It shall load the data and show both your flight trajectory and the VRS
location. The latter should be very close to your mission location as you have selected it as close
as possible on the SmartBase website. From now on the processing of the refined trajectory is
identical to the single base processing (section 3.3.1 Single base processing). Please follow the
instructions from step 7 onwards.
Figure 3.41 Applanix SmartBase VRS data to import in POSPac
3.3.3 Own base station processing
If a GPS base station has been placed specifically for the survey or the desired base station has been
sourced from a database not listed in the POSPac software, you will need to import the base station
data (in RINEX-format) into POSPac by either selecting the file and using the “drag and drop” method,
or using the Import tool as described in section 3.2 ,step 5.
Once the base station data is imported an icon will appear on the screen at the location of the base
station, similar to that of a base station form the Applanix database similar to Figure 3.19. Please follow
step 7 to 10 of the single base station processing method described in section 3.3.1 “Single base
processing”.
If a number of base stations have been placed and the SmartBase method is desired for processing,
import all of the base station files and continue with the SmartBase method as described in section
3.3.2.1 "Automated SmartBase processing”. The software will select the ideal primary station, so
there is no need for the user to select it in this case.
Page 50

STORMBEE Software User Manual – Think 3D BVBA
Version N°1.1, last modified 30/09/2018
36
3.3.4 Quality control
3.3.4.1 Quality control diagnostic report
To verify the quality of the recorded flight and base station data, you can generate a report (PDF) which
shows all quality control parameters and figures in a single document or you can use “Display Plots” to
show individual quality control figures.
To generate a PDF report, open the “Reports” ribbon and click on “QC Report” (Figure 3.42). A new
window will open in which you can choose the directory where you want the report stored and the
type of report. Leave this on “Diagnostic” and press “Generate”. Go to the specified directory in
windows explorer and open the report (default name is “report_Mission 1.pdf”). You can verify the
number of satellites, flight height profile, position error and so on.
Figure 3.42 Applanix quality control generate diagnostic report
Page 51

STORMBEE Software User Manual – Think 3D BVBA
Version N°1.1, last modified 30/09/2018
37
To investigate the quality control figures individually through the POSPac UAV interface go to the
“Reports” ribbon and click on “Display Plots” (Figure 3.43). There are a number of possible graphs to
view. This manual focuses on the most important ones that will ensure overall accuracy. These are
described in sections 4.3.4.2 to 4.3.4.6.. When viewing the graphs, select the graph you want from the
left hand panel and it will display on the right. You may also select a number of graphs simultaneously
and then using the right mouse button choosing “Display Selected”.
Figure 3.43 Applanix quality control display plots overview
Page 52

STORMBEE Software User Manual – Think 3D BVBA
Version N°1.1, last modified 30/09/2018
38
3.3.4.2 Position error (RMSE)
Quality check: mandatory
The overall accuracy for the trajectory is shown by the position error (Root-Mean-Square Error, RMSE)
graph (Figure 3.44). In this instance, three graphs are shown together as seen on the left hand side. It
is common that the result for the North and East error will be very similar and more accurate than the
Down error. North and East represents the horizontal accuracy and the Down represents the vertical
accuracy. Lower values are always better. If the base station or base station network is in close
proximity to the survey, we expect resulting position errors below 5cm. Be cautious of very high values
as they usually hint at an error.
Expand “Smoothed Performance Metrics, Reference Frame” and inspect “North Position Error RMS
(m)”, “East Position Error RMS (m)” and “Down Position Error RMS (m)” (Figure 3.44).
Figure 3.44 Applanix quality control display plot RMSE
3.3.4.3 Number of GNSS satellites
Quality check: mandatory
A minimum number of GNSS satellites is required in order to achieve an accurate trajectory. POSPac
makes use of a number of satellite constellations for its processing methodologies and most Applanix
equipment allows for the recording of GPS and GLONASS observables. Therefore, both the GPS and
GLONASS graphs must be examined (Figure 3.45). A combined minimum of 5 satellites will yield a good
solution.
Keep in mind that the base stations being used for the survey must also have the ability to record both
the GPS and GLONASS observables. If not, only the observables that are common to both the airborne
and land-based systems will be used for trajectory processing.
Page 53

STORMBEE Software User Manual – Think 3D BVBA
Version N°1.1, last modified 30/09/2018
39
Expand “Solution Status” and inspect “Number of GPS Satellites” and “Number of GLONASS Satellites”
(Figure 3.45).
Figure 3.45 Applanix quality control display plot number of satellites
3.3.4.4 Lever Arm settings
The position and attitude of the IMU (inertial measurement unit) with respect to the GPS is very
important. An error in these values will cause the final calculated trajectory to be offset by the lever
arm error amount. This value was measured by Think3D – STORMBEE and is automatically saved into
the Applanix raw trajectory log file. An example of these lever arm errors is shown in Figure 3.46.
3.3.4.5 Position Dilution of Precision (PDOP)
Quality check: optional
PDOP describes error caused by the relative position of the GPS satellites. The more signals a GPS
receiver can “see” (spread apart across the sky versus flying close together), the more precise it can
be. An average value of below 3 is suggested to be adequate (Figure 3.47). Spikes may occur, but if
they are kept to a minimum they should not be of concern. In general, lower values are preferred. The
user can not greatly affect this value by altering processing methods, but knowledge of less accurate
regions can alert the user to the need to be more careful in future processing steps.
Expand “Solution Status” and inspect “PDOP” (Figure 3.47).
Page 54

STORMBEE Software User Manual – Think 3D BVBA
Version N°1.1, last modified 30/09/2018
40
Figure 3.46 Applanix quality lever arm settings
Figure 3.47 Applanix quality control display plot PDOP
Page 55

STORMBEE Software User Manual – Think 3D BVBA
Version N°1.1, last modified 30/09/2018
41
3.3.4.6 Cycle Slips
Quality check: optional
Constant lock onto the satellites is required. Buildings and other obstacles, as well as high roll values
or quick directional changes can cause the system to lose lock. Checking the L1 and L2 signal lock graphs
gives a good illustration of how consistent the calculated trajectory will be. It is common for GLONASS
satellites to show a higher number of cycle slips and so special attention should be shown to the GPS
satellites. The Cycle Slips graph combines all satellites observed. GPS satellites are shown by numbers
1 - 32 and GLONASS satellites are shown by numbers 33 and above.
Expand “Primary GPS/GLONASS Satellite Data” and inspect “L2 Satellite Lock/Elevation”. Each small
black “cross” is a cycle slip (Figure 3.48).
Figure 3.48 Applanix quality control display plot cycle slips
Page 56

STORMBEE Software User Manual – Think 3D BVBA
Version N°1.1, last modified 30/09/2018
42
3.3.5 Data export
In order to produce a refined final point cloud using the BEEFLEX software, two files are required from
the POSPac process. Firstly, the LiDAR event data and secondly, the post-processed trajectory data.
Once processing is complete and the results are found to be acceptable, the following files must be
saved.
3.3.5.1 LiDAR Event Data
The LiDAR event data is automatically exported from POSPac when the GPS observation files are added
into the software. To locate this file, using windows explorer, open the folder in which the POSPac
session was saved. This will be the location chosen to save the project in the steps above. You will note
that a number of additional folders have been created by POSPac. Locate the folder labelled “Extract”.
Within this folder is a file named “event1_Mission 1.dat”. Copy this file to a safe location for later use.
Figure 3.49 Applanix export LIDAR event data (for BEEFLEX processing)
Page 57

STORMBEE Software User Manual – Think 3D BVBA
Version N°1.1, last modified 30/09/2018
43
3.3.5.2 Trajectory data
Unlike the LiDAR event data, the post-processed trajectory data is not automatically exported in the
required format. To export the trajectory data go to the “Tools” ribbon and click on “Export”. A new
window will open where you can specify the directory in which to save the trajectory data. Leave as
default. Choose the ASCII “Export File Format” and press “Export”.
Figure 3.50 Applanix export trajectory data (for BEEFLEX processing) step 1
Go to windows explorer and go to the Applanix mission project folder and locate the folder labelled
“Export”. Within the folder is a file named “export_Mission 1.txt”. Copy this file to a safe location for
later use.
Figure 3.51 Applanix export trajectory data (for BEEFLEX processing) step 2
Page 58

STORMBEE Software User Manual – Think 3D BVBA
Version N°1.1, last modified 30/09/2018
44
3.4 Troubleshooting
If you encounter a problem and can’t find a solution within this manual, please contact Think3D-
STORMBEE or your authorised reseller.
You can also find the user manuals of Applanix POSPac UAV in its installation directory on your laptop:
C:\Program Files\Applanix\POSPac UAV 8.3\Manuals
The most relevant manual is the “POSPac MMS GNSS-Inertial Tools.PDF” manual.
3.4.1 Import error
If an error is received when importing the raw POS data there may be an issue with one of the POS
files. This would usually occur with either the first or the last files. This also occurs if the file you import
is empty (Figure 3.52). If the trajectory appears to be importing correctly and then stops, likely the first
file is fine but the last has an error. However, if the trajectory does not begin importing at all, likely the
first file has an issue.
Figure 3.52 Applanix import failure error message
A possible workaround, when the file is not empty, is to split the erroneous files into two parts. Only a
small portion of the file needs to be removed (100 - 200kB). If editing the first raw POS file, split a small
portion away from the beginning of the file. If editing the last raw POS file, split a small portion away
from the end of the file.
The suggested tool for this process is a freeware application called HJSplit. It may be downloaded from
the following location: http://www.hjsplit.org/windows/. How to split the file can be found on the
website, but an example is shown in Figure 3.53 and Figure 3.54.
Figure 3.53 Applanix import error split file program
Page 59

STORMBEE Software User Manual – Think 3D BVBA
Version N°1.1, last modified 30/09/2018
45
Figure 3.54 Applanix import error split files
3.4.2 Checking message logs for errors after import
You can check the message logs of the imported flight data trajectory for the presence of any errors
(Figure 3.55). Verify both “POS Data Import” and “IMU Data Continuity Checking” have no errors
present.
Figure 3.55 Applanix opening message logs dropdown menu
Scroll to the bottom of the “POS Data Import” message log (Figure 3.56). Check for “Termination
Status: Normal” and “Extraction completed”. Scroll through the other information and confirm no
obvious errors are reported.
Figure 3.56 Applanix message log POS data import
Page 60

STORMBEE Software User Manual – Think 3D BVBA
Version N°1.1, last modified 30/09/2018
46
Check “Termination Status” of the “IMU Data Continuity Checking” message is “Normal”. Note that
Figure 3.57 and Figure 3.58 show a time tag anomaly. If a time tag anomaly is present, confirm whether
the time noted is within the flight period. Check the time tag is within the survey portion of the flight.
If so some data may be lost and processing may prove difficult or impossible. Go back to the dropdown
menu and select “IMU Data Scanning”.
For this example, the time tag (Figure 3.57, @291178.568 seconds) occurs before the “Start Time” of
the IMU scan (Figure 3.58, @291178.573 seconds) so it has no influence on the scan data quality as
the error occurred when the IMU was booting up while STORMBEE was still on the ground. If the error
does occur within the start to end period, please look at the time interval and look at the timeline of
the height profile in BEEFLEX to estimate where in your flight the problem occurred and do not select
these portions of the flight for final processing (Section 4.2 ”Data processing”).
Figure 3.57 Applanix message log IMU data continuity checking (step 1)
Figure 3.58 Applanix message log IMU data continuity checking (step 2)
Page 61

STORMBEE Software User Manual – Think 3D BVBA
Version N°1.1, last modified 30/09/2018
47
3.4.3 Too few satellites (below five)
Whilst viewing the processing graphs, you may notice the number of satellites is not adequate. You
are limited to the satellites observed at the time of flight, but the software automatically excludes all
satellites below a 10 degree elevation above the horizon. This setting can be changed in an attempt to
force the software to use satellites that were observed just above the horizon.
Go to the “Project” ribbon and click on “Project Settings” (Figure 3.59). A new window will open in
which you should select “Satellite Selection”. Set the “Elevation Mask Angle” lower than 10 degrees
elevation and press “OK”.
Figure 3.59 Applanix satellite elevation mask angle
Page 62

STORMBEE Software User Manual – Think 3D BVBA
Version N°1.1, last modified 30/09/2018
48
PAGE INTENTIONALLY LEFT BLANK
Page 63

STORMBEE Software User Manual – Think 3D BVBA
Version N°1.1, last modified 30/09/2018
49
4 BEEFLEX
STORMBEE's proprietary BEEFLEX software allows the user to create cm-accurate point clouds from
the in-flight data. Industry-standard export formats (LAS and E57) are compatible with most postprocessing software for point cloud optimization, analysis and feature extraction.
BEEFLEX creates geo-referenced point clouds from Lidar and GNSS data. Multiple strips can be selected
and exported in LAS- and E57-formats. Further post-processing is possible with other existing mobile
mapping software, such as TerraSolid’s Terramatch software package.
The user can choose to export the entire project as a single file or flexibly extract selected flight strips
through an intuitive user interface based on a Google Maps background. BEEFLEX is designed with
user-friendliness in mind, allowing anyone to start using the software with less than 1 hour of training.
4.1 Installation
You can download BEEFLEX here: www.stormbee.eu
The download consists of a ZIP-file named “BEEFLEX-v*.zip”. Please extract it and click on the
“BEEFLEX.exe” file to start the installation (Figure 4.1). Depending on your anti-virus program, you may
have to temporarily disable it or add an exception for the BEEFLEX program. Otherwise your anti-virus
program may block BEEFLEX from opening properly.
Figure 4.1 BEEFLEX program folder structure
The first time you open BEEFLEX, a “License Management” window will open. The “Current status” will
display “Product not activated” and you will have to enter an activation key (Figure 4.2). When you
Page 64

STORMBEE Software User Manual – Think 3D BVBA
Version N°1.1, last modified 30/09/2018
50
buy BEEFLEX, you will have to register your email address, after which you will receive an email from
STORMBEE containing a 25-character activation key which you can then enter. Depending on your type
of purchase, the key will be valid for a limited or unlimited period. The number of days until the license
becomes expired is shown on the bottom of the BEEFLEX program window. To enter a new license key,
go through the main menu: BEEFLEX → License Management. Enter the new license key and press
“ACTIVATE”.
Figure 4.2 BEEFLEX license activation and management
Once BEEFLEX is up and running (Figure 4.3), you can start processing the laser scan and GNSS data.
Figure 4.3 BEEFLEX start screen
Page 65

STORMBEE Software User Manual – Think 3D BVBA
Version N°1.1, last modified 30/09/2018
51
4.2 Data processing
1. Make a separate folder for each flight and ensure all relevant files of that flight are stored in this
folder!
- “config.ini”: contains the STORMBEE FARO scanner and GNSS module calibration data
- “export*.txt”: contains the GNSS refined IMU data files
- “scan*.fls”: contains the raw FARO laser scanner point cloud data
- “event*.dat”: contains the timestamps to synchronise GNSS and scanner data
Figure 4.4 Folder containing all files required by BEEFLEX
2. Select the folder in which all relevant files are stored (Figure 4.5). Do not enter the folder, only
select the folder itself.
Figure 4.5 BEEFLEX select folder flight and scan data
3. BEEFLEX now loads all data. If this is the first time you process this data set then it will first convert
the raw scan data from the FARO *.fls-format to the *.e57-format required by BEEFLEX to generate
the final point cloud. Press "import" (Figure 4.6). This conversion can take up to 15 minutes. The
converted e57-format point cloud is stored in the same folder as the other data files and when you
process the data again, BEEFLEX will automatically detect the *.e57-file so you don't have to do
the conversion again.
Page 66

STORMBEE Software User Manual – Think 3D BVBA
Version N°1.1, last modified 30/09/2018
52
Figure 4.6 BEEFLEX import raw scan data and convert to *.e57-format
4. Once the conversion is done, BEEFLEX shows the various scans in the left-hand menu (Figure 4.7).
BEEFLEX shows the flight trajectory on a Google Maps like background. You can also select the
satellite view which shows the terrain (Figure 4.8). In addition, BEEFLEX shows the height (profile)
of the drone during the flight at the top of the screen. This allows you to easily see which part of
the scan data was obtained during flight. If BEEFLEX is unable to locate any of the required files, a
message will appear in the left hand panel (Figure 4.9)
Figure 4.7 BEEFLEX flight and scan data general overview
Page 67

STORMBEE Software User Manual – Think 3D BVBA
Version N°1.1, last modified 30/09/2018
53
Figure 4.8 BEEFLEX flight and scan data general overview (satellite view)
Figure 4.9 BEEFLEX data import possible error messages
There should be one scan window (in the left-hand menu) per flight performed. Select the flight you
want to visualise, and you can (optionally) change the name of the destination folder where the final
processed point cloud data, generated by BEEFLEX, will be stored. You do this by clicking on the pencil
icon to the right of the name.
5. Select the section(s) of the flight (and corresponding scan) data which you want to use.
When hovering with your mouse above the flight data height profile, a small green dot will
simultaneously show the synchronised location on the flight data trajectory and on the height profile
(Figure 4.10). This allows you to easily see which part of the scan data you are looking at.
Select the section(s) of the flight (and its corresponding scan data) you want to use for you final point
cloud. We advise to use the straight-line segments of your flight as this usually has the highest accuracy
(flat and level, little to no turns and no aggressive manoeuvres). Hover your mouse on the start location
of the section you want, left-click on it and drag the mouse to the right until you reach the endpoint of
Page 68

STORMBEE Software User Manual – Think 3D BVBA
Version N°1.1, last modified 30/09/2018
54
the section you desire to select. The selected section on the height trajectory will be shaded in green,
while the corresponding section of the flight trajectory will be coloured green/blue (Figure 4.10). You
can select multiple portions of the flight by simply repeating this clicking and dragging procedure
(Figure 4.11).
The selected sections are listed in listed in the left-hand menu and their name can be edited by the
pressing on the pencil icon. They can also be individually removed by clicking on the garbage can icon.
Figure 4.10 BEEFLEX select relevant section of flight
Figure 4.11 BEEFLEX select multiple sections of flight
Page 69

STORMBEE Software User Manual – Think 3D BVBA
Version N°1.1, last modified 30/09/2018
55
6. Extract the relevant data for the final refined point cloud.
BEEFLEX gives you the option to not only export the point cloud in E57-format, but also LAS-format.
You can (un-)check the box with this option in the left-hand menu. Default, the point cloud will be
exported both in E57- and LAS-format.
After all relevant sections of the flight are selected, press “START” to start processing. A new window
will appear titled “Run Information” (Figure 4.12). Simply press “PROCEED”. BEEFLEX will first export
the relevant point cloud data in E57-format (Figure 4.13) after which, if the LAS-box was checked, the
LAS-format files will be generated and exported (Figure 4.14). For both formats, each selected section
of the flight will have a separate data file and name as specified in the left-hand menu before
processing. BEEFLEX will make a new folder, to store its refined point cloud data files in, within the
folder where the input files are located (Figure 4.15). You can now view the final results using
visualisation software such as CloudCompare (free), Autodesk Recap (paid) or any other software
package which is compatible with E57- or LAS-format point cloud files.
Figure 4.12 BEEFLEX data processing run information window
Page 70

STORMBEE Software User Manual – Think 3D BVBA
Version N°1.1, last modified 30/09/2018
56
Figure 4.13 BEEFLEX data processing progress E57-format
Figure 4.14 BEEFLEX data processing progress LAS-format
Figure 4.15 BEEFLEX refined point cloud data folder structure
Page 71

STORMBEE Software User Manual – Think 3D BVBA
Version N°1.1, last modified 30/09/2018
57
5 Visualisation (refined) point cloud
Visualizing the raw E57-format point cloud generated by FARO SCENE and the refined point cloud (E57or LAS-format) generated by BEEFLEX can be done with several software packages such as
CloudCompare or Autodesk Recap. This manual only gives instructions on how to use CloudCompare
as this is a free software package.
5.1 CloudCompare information
CloudCompare is a free Open-Source 3D point cloud (and triangular mesh) editing and processing
software. You can use CloudCompare to visualize the raw point cloud from the FARO Laser scanner
after it has been transformed into the E57-format required by BEEFLEX and to visualize the refined
point cloud (E57- or LAS-format) generated by BEEFLEX.
5.1.1 Install Cloud Compare software
Download software: http://www.danielgm.net/cc/
Install with default settings and include FARO I/O to be able to use *.fls files!
It is best to first install CloudCompare before installing Scene Full Version 30-day trial software
package. Installing CloudCompare after you installed the Scene Full Version 30-day trial software
package may delete the trail period (license key) which would require you to re-install the Scene Full
Version 30-day trial software package.
5.1.2 Visualize cloud point data
Tutorial: https://www.youtube.com/watch?v=MQiD4HjhpAU
Wiki: http://www.cloudcompare.org/doc/wiki/
5.2 Visualisation postprocessed point cloud
5.2.1 Import data files
You can easily import point clouds with CloudCompare by simply dragging the files over the desktop
program icon (Figure 5.1). This will automatically open CloudCompare and open a new window to
specify the import properties (Figure 5.2). Simply press “Yes to all” and CloudCompare will import
(Figure 5.3) and visualize the point cloud files (Figure 5.4).
In the left-hand menu (“DB Tree”) you can (de-)activate the individual sections/files of the refined point
cloud. The mouse allows you to manipulate the visualisation:
- Left mouse click-and-drag: rotation
- Right mouse click-and-drag: position
- Scrolling: zoom in and out
Page 72

STORMBEE Software User Manual – Think 3D BVBA
Version N°1.1, last modified 30/09/2018
58
Figure 5.1 CloudCompare import files through desktop icon
Figure 5.2 CloudCompare import point cloud properties window
Page 73

STORMBEE Software User Manual – Think 3D BVBA
Version N°1.1, last modified 30/09/2018
59
Figure 5.3 CloudCompare import point cloud progress
Figure 5.4 CloudCompare visualisation refined point clouds
5.2.2 Verify accuracy results
To determine the final refined point cloud quality, it is necessary to verify that data points of different
segments (of each and all flights) representing the same object/surface/edge are very close together
and overlap as much as possible. The best method of doing so is by assigning different colours to each
flight (segment) and afterwards analysing manually how well they overlap. For better visualisation, the
example scan data used in this section is comprised of several flights in which a whole factory was
scanned and not just of one small segment of a flight as was used for the instructions earlier on in this
manual.
1. Assign a colour to each (flight) segment. Left-click on the first segment in the “DB-tree”. You will
see that the properties window is filled with info of that segment and a yellow box is drawn around
that segment of the point cloud data (Figure 5.5).
Page 74

STORMBEE Software User Manual – Think 3D BVBA
Version N°1.1, last modified 30/09/2018
60
Figure 5.5 CloudCompare selection flight (segment)
2. Now assign a unique colour to that segment by going to “Edit” → “Colors” → “Set Unique”. A
window will open that will allow you to select a colour (Figure 5.6). Repeat this for each flight
(segment). Tip: Pick colours with lots of contrast with respect to each other (red, green, blue,
orange, yellow, pink,…). The resulting point cloud is shown in Figure 5.7.
Figure 5.6 CloudCompare flight (segment) colour selection window
Page 75

STORMBEE Software User Manual – Think 3D BVBA
Version N°1.1, last modified 30/09/2018
61
Figure 5.7 CloudCompare flight (segments) with unique colours
3. Select all point clouds of each flight (segment). Do not select the top folders but the individual
point clouds with the small cloud symbol next to it (Figure 5.8). Keep pressing the “Ctrl-button”
while left-clicking on each point cloud to select more than one point cloud at the same time. When
all are selected you will see multiple yellow boxes drawn around their respective point cloud
segments (Figure 5.9).
Figure 5.8 CloudCompare selecting all point clouds in Navigation menu
Page 76
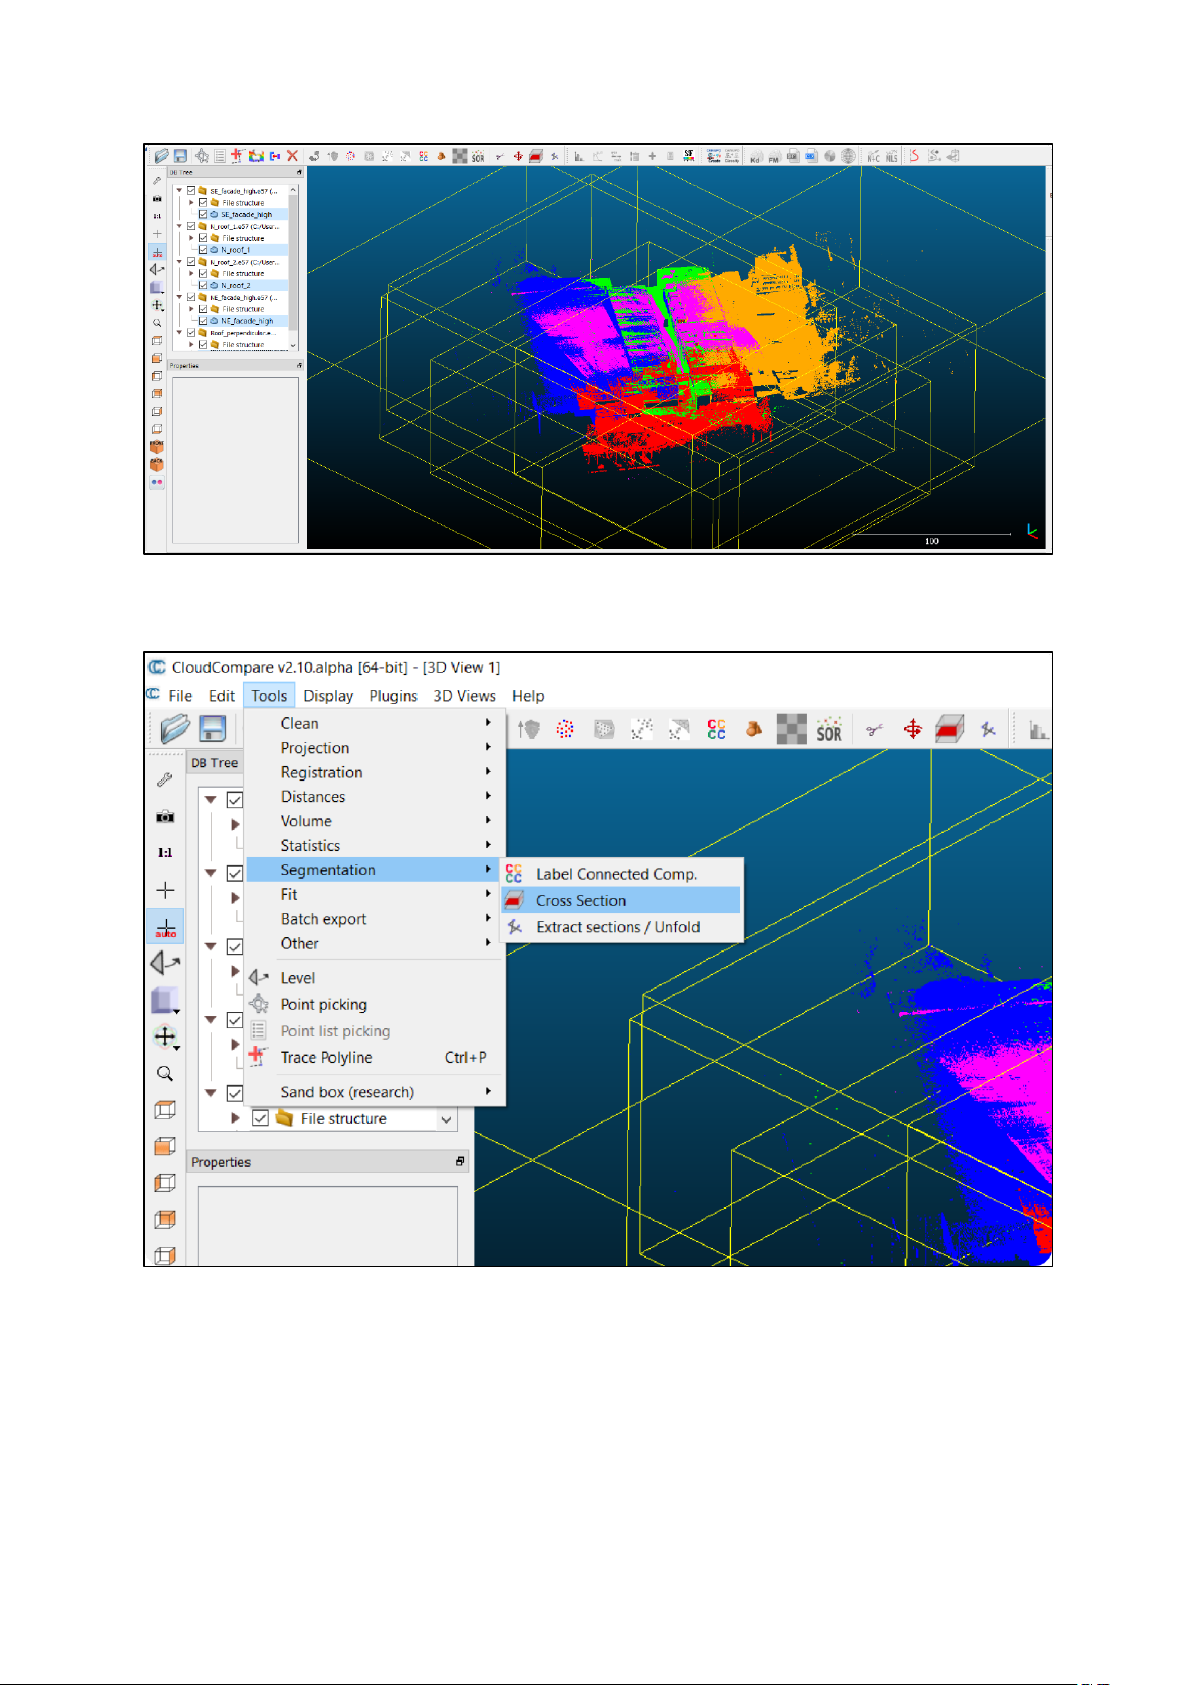
STORMBEE Software User Manual – Think 3D BVBA
Version N°1.1, last modified 30/09/2018
62
Figure 5.9 CloudCompare all point clouds selected in navigation menu
4. Go to “Tools” → “Segmentation” and left-click “Cross Section” (Figure 5.10).
Figure 5.10 CloudCompare point cloud cross-section
Page 77

STORMBEE Software User Manual – Think 3D BVBA
Version N°1.1, last modified 30/09/2018
63
5. A new small window will open where you can modify the cross-section properties (Figure 5.11),
but also arrows (“interactors”) will appear that can be dragged (press and hold mouse left button
on arrow) or rotated (press and hold mouse left button on circle/donut around arrow) (Figure
5.12).
Figure 5.11 CloudCompare cross-section properties window
Figure 5.12 CloudCompare point cloud with cross-section properties window and interactors
Page 78

STORMBEE Software User Manual – Think 3D BVBA
Version N°1.1, last modified 30/09/2018
64
6. Now use the interactors (arrows) to cut the point cloud to a narrow slice (Figure 5.13), preferably
with less than 1 meter wide. The width can be verified in the cross-section properties window.
Figure 5.13 CloudCompare point cloud cross-section narrow slice
7. Zoom in on a piece of the point cloud slice where multiple coloured points, representing different
flight (segments), are present (Figure 5.14). Zoom in until you can distinguish individual data points
(Figure 5.15). At the right-bottom side of the screen you can see a reference distance represented
by a horizontal white line and a number underneath showing the length of that line in meters.
Figure 5.14 CloudCompare point cloud slice zoomed in (10 meter)
Page 79

STORMBEE Software User Manual – Think 3D BVBA
Version N°1.1, last modified 30/09/2018
65
Figure 5.15 CloudCompare cross-section zoomed in (1 meter)
8. Rotate that zoomed-in piece of the point cloud until you see it from its (in-plane) side for which
the data points should be in one plane (Figure 5.16) and zoom in further (legend 0.25m). Look at
how close the different coloured layers of data points match each other. You can estimate
(roughly) the quality of the synchronisation of the scans by looking at the distance they span and
compare it visually with the reference distance in the right-bottom corner. For this cross-section,
you can see that the synchronisation of the different data sets has around 10cm accuracy. This
does NOT mean that the point cloud data within one scan has 10cm accuracy! Only the
synchronisation quality is assessed here. Within a single scan, you can check the (out-of-plane)
distribution of points on a flat surface of a scanned object (wall, floor, roof, road…). They should
be as close together normal to the plane a possible, or in other words, the plane/surface should
be as thin as possible. A good quality scan is where the plane thickness is only a few centimetres
thick (see thickness surface purple point cloud in Figure 5.16).
Figure 5.16 CloudCompare cross-section in-plane quality control
Page 80

STORMBEE Software User Manual – Think 3D BVBA
Version N°1.1, last modified 30/09/2018
66
9. Repeat steps 6 to 8 for other cross-sections with other flight (segments). You can press the reset
button in the cross-section properties window if this helps to make a new cross-section slice. The
goal is to compare each flight (segment) to another at least once. You don’t need to compare one-
on-one. If the cross-section you choose contains three or more(different coloured) segments, you
save time, so if possible choose these kinds of cross-sections. Other examples of the same point
cloud data set are shown in Figure 5.17, Figure 5.18 and Figure 5.19 where the synchronisation of
the two flight (segment) is now only a few centimetres off. The synchronisation quality and also
point cloud data quality can vary locally within a data set depending on the flight parameters,
weather conditions, scanner settings and scanning flight path and distance between the
STORMBEE and the object which is scanned.
Figure 5.17 CloudCompare point cloud cross-section narrow slice (example 2)
Page 81

STORMBEE Software User Manual – Think 3D BVBA
Version N°1.1, last modified 30/09/2018
67
Figure 5.18 CloudCompare point cloud slice zoomed in (example 2)
Figure 5.19 CloudCompare cross-section in-plane quality control (example 2)
Page 82

STORMBEE Software User Manual – Think 3D BVBA
Version N°1.1, last modified 30/09/2018
68
5.3 Examples post-processed data
The final point cloud (Figure 5.20) can then be used to generate 2D and 3D drawings and models of
the inspected object with 3rd party software (Figure 5.21 and Figure 5.22).
Figure 5.20 Final post-processed point cloud
Figure 5.21 3D model based on final post-processed point cloud data
Page 83

STORMBEE Software User Manual – Think 3D BVBA
Version N°1.1, last modified 30/09/2018
69
Figure 5.22 2D drawing based on final post-processed point cloud data
Page 84

STORMBEE Software User Manual – Think 3D BVBA
Version N°1.1, last modified 30/09/2018
70
PAGE INTENTIONALLY LEFT BLANK
Page 85

STORMBEE Software User Manual – Think 3D BVBA
Version N°1.1, last modified 30/09/2018
71
6 STORMBEE and FARO scanner calibration procedure
The STORMBEE with the FARO Focus scanner mounted on it should be calibrated at regular intervals
or after maintenance or repair to ensure the relative location and attitude of the GNSS module
components with respect to the FARO Focus scanner are still accurate. Otherwise the margin of error
after post-processing will be larger than normal.
Currently, this calibration can only be done by Think3D. However, to do this calibration, Think3D only
requires the user to send (over internet) the point cloud data files of one of the last flights in which a
Hashtag (#) manoeuvre is performed (Figure 6.1). Afterwards, you will receive the new correction
factors which you should implement in the config.ini file used by BEEFLEX as described further on in
this section.
Figure 6.1 STORMBEE hastag (#) calibration flight path example
STORMBEE operators should send through a (calibration suitable) set of scan and GNSS data to Think3D
every 6 months or 20 hours of flight time (roughly every 150 flights), whichever comes first.
The Hashtag (#) manoeuvre consists of flying (preferably automatically) horizontally along the lines of
the shape of a hashtag in the vicinity of some form of infrastructure while the scanner is active. There
needs to be some form of infrastructure (road, building) nearby as the calibration will be done with
respect to this infrastructure. As this manoeuvre takes little flight time (roughly 2 minutes), one can
simply perform it at the end of an inspection flight when sufficient battery is left. There is no need to
perform a separate flight.
Please note that each STORMBEE is built with the high quality standards. However, the relative
location and attitude of the GNSS module components with respect to the FARO scanner will always
be slightly different and as such have slightly different calibration values! If you own multiple
Page 86

STORMBEE Software User Manual – Think 3D BVBA
Version N°1.1, last modified 30/09/2018
72
STORMBEEs, you will have to send suitable inspection point cloud data made by each STORMBEE
separately and track which point cloud data (calibration values) correspond with each STORMBEE to
ensure you use the new calibration values with the correct laser scan data set.
Follow the next steps to modify the calibration values.
1. Go to the folder where the files are stored that are required to do the final processing in BEEFLEX
(Figure 6.2).
Figure 6.2 Folder containing all files required by BEEFLEX
2. Open the “config.ini” file using Notepad program by right-clicking on it, then hover the mouse over
“Open with” and left-click on “Notepad”. When opened it should look similar to Figure 6.3.
Figure 6.3 FARO scanner calibration "config.ini" file
Page 87

STORMBEE Software User Manual – Think 3D BVBA
Version N°1.1, last modified 30/09/2018
73
3. Scroll down until you see “heading”, “pitch” and “roll” underneath “[ScannerRotations] ()”.
Figure 6.4 FARO scanner calibration parameters (heading, pitch and roll)
4. Replace the “heading, “pitch” and “roll” values with the new values provided by Think3D for your
specific STORMBEE.
5. Save the changes.
6. From now on, use this newly adapted “config.ini” file for all BEEFLEX data postprocessing of new (
or recent) laser scan data made by that specific STORMBEE.
Page 88

STORMBEE Software User Manual – Think 3D BVBA
Version N°1.1, last modified 30/09/2018
74
PAGE INTENTIONALLY LEFT BLANK
 Loading...