

Thies CLIMA 9.2750.xx.90 Series, 9.2750.00.900, 9.2750.01.900, 9.2750.00.901, 9.2750.01.901 Operating Instructions Manual
...
D
Operating Instructions
021503/10/07
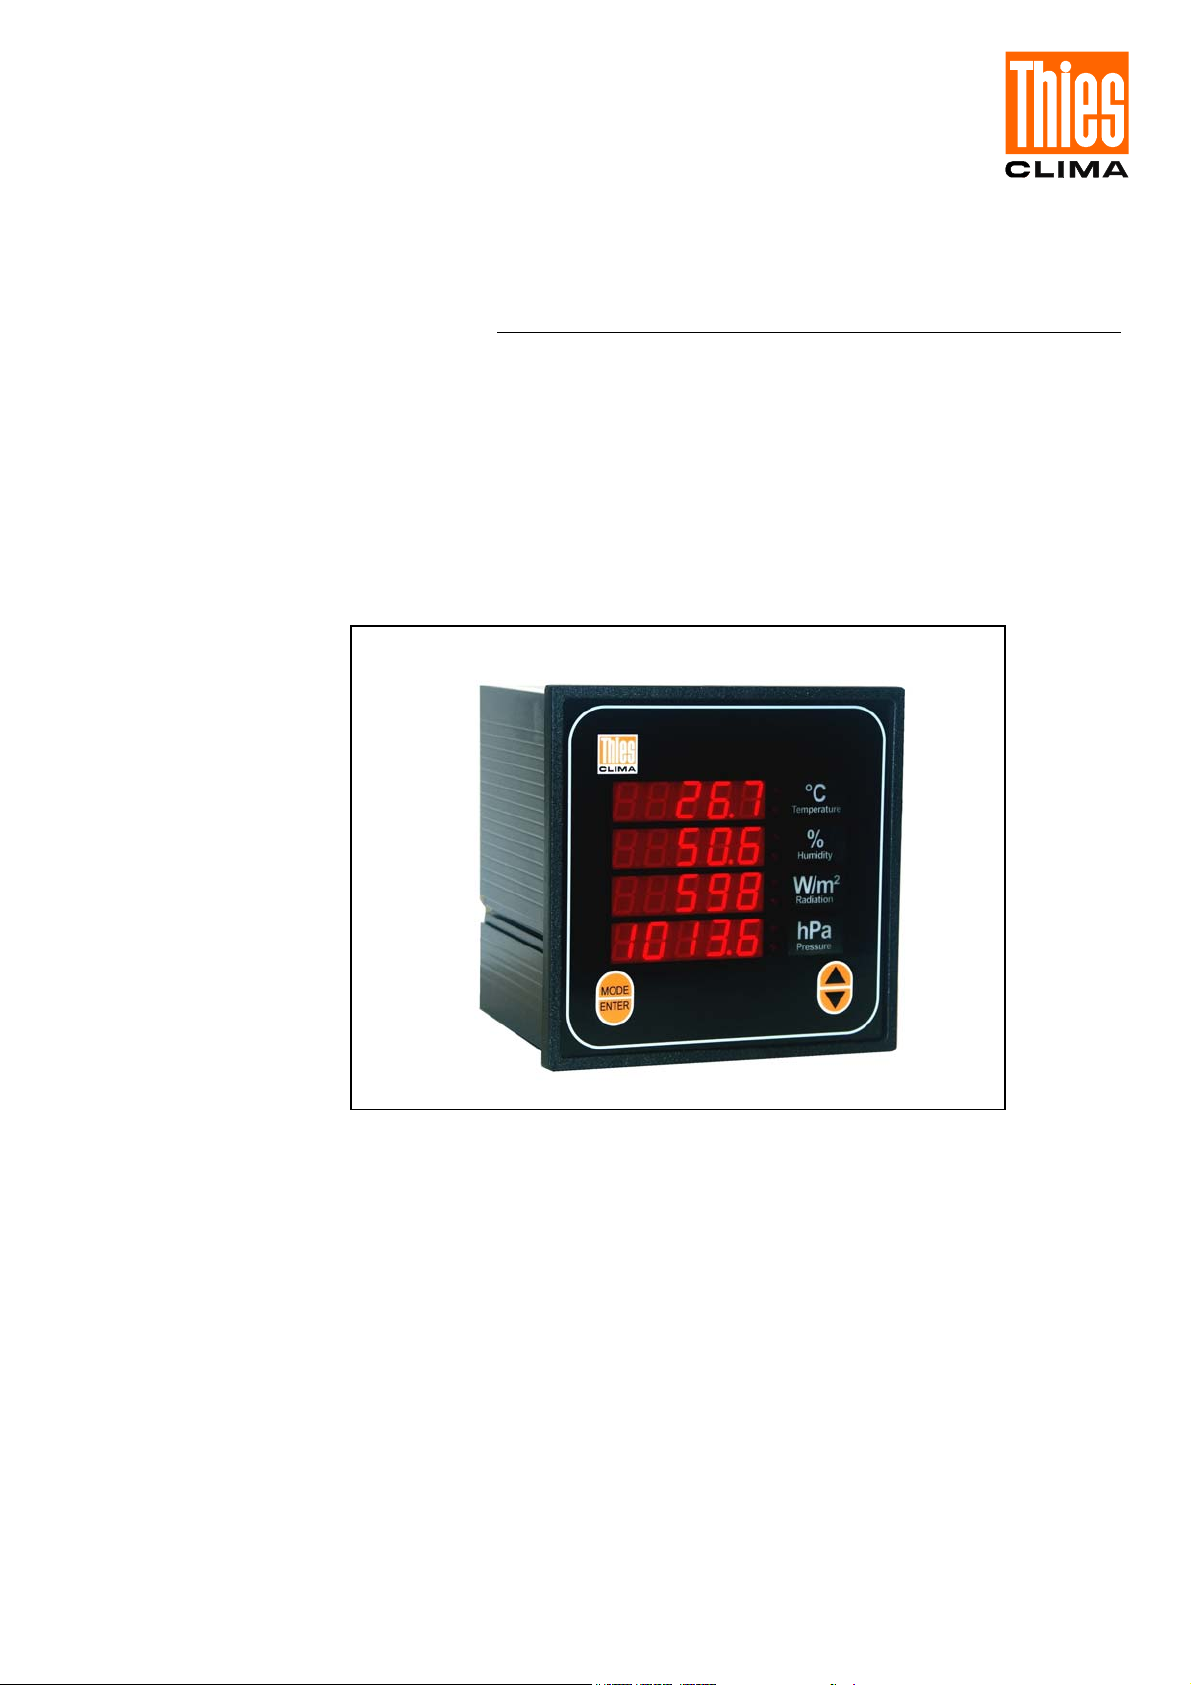
Weather Display LE
9.2750.xx.90x
ADOLF THIES GmbH & Co. KG
Hauptstraße 76 37083 Göttingen Germany
Box 3536 + 3541 37025 Göttingen
Phone ++551 79001-0 Fax ++551 79001-65
www.thiesclima.com info@thiesclima.com
THE WORLD OF WEATHER DATA - THE WORLD OF WEATHER DATA - THE WORLD OF WEATHER DATA

Contents
1 Device Versions ......................................................................................................................... 3
2 Application ................................................................................................................................. 3
3 View ........................................................................................................................................... 5
4 Mode of Operation ..................................................................................................................... 5
4.1 Calculation of sliding mean and extreme values: ................................................................ 5
4.2 Calculation of Sums ............................................................................................................ 6
4.3 Elevation Input to the Air Pressure (Function only with instrument 9.2750.1x.901) ............ 6
4.4 Acquisition of measured values........................................................................................... 7
5 Recommendation for Selection of Site....................................................................................... 8
6 Installation.................................................................................................................................. 8
6.1 Mechanical installation: ....................................................................................................... 8
6.2 Electrical installation / connections:..................................................................................... 9
6.2.1 Connection of serial interface RS422 ......................................................................... 10
6.2.2 Connection of analog inputs (9.2750.xx.901) ............................................................. 12
6.2.3 Connection Power Supply for external Sensors (9.2750.xx.901) ............................... 12
6.2.4 Connection of analog outputs (9.2750.xx.901) ........................................................... 12
6.2.5 Connection of power supply ....................................................................................... 13
6.2.6 Connection of remote control...................................................................................... 13
7 Data Output Protocol ............................................................................................................... 14
8 Operation ................................................................................................................................. 15
9 Functional Test ........................................................................................................................ 23
10 Error Messages .................................................................................................................... 24
11 Maintenance ......................................................................................................................... 25
12 Technical Data...................................................................................................................... 26
13 Dimension Drawing............................................................................................................... 28
14 EC-Declaration of Conformity............................................................................................... 29
Figures
Fig. 1: Rear 9.2750.xx.900 ............................................................................................................... 9
Fig. 2: Rear 9.2750.0x.901............................................................................................................... 9
Fig. 3: Example of connection ........................................................................................................ 11
Fig. 4: Front view with operating buttons........................................................................................ 15
Tables
Table 1: Device versions .................................................................................................................. 3
Table 2: Error messages ................................................................................................................ 24
2 - 30 021503/10/07

1 Device Versions
Designation Order No. Equipment
Weather Display
LED
Weather Display
LED
Weather Display
LED
Weather Display
LED
Weather Display
LED
Weather Display
LED
9.2750.00.900 Input/output 1 x RS422
9.2750.01.900 Input/output 1 x RS422
9.2750.00.901 Input/output 1 x RS422
Input 1 x Pt100 or 0...10 V / 0(4)...20mA
3 x 0..10 V or 0(4)..20 mA
Output 2 x 0..10 V or 0(4)..20 mA
9.2750.01.901 Input/output 1 x RS422
Input 1 x Pt100 or 0...10 V / 0(4)...20mA
3 x 0..10 V or 0(4)..20 mA
Output 2 x 0..10 V or 0(4)..20 mA
9.2750.10.901 Input/output 1 x RS422
Input 1 x Pt100 or 0...10 V / 0(4)...20mA
3 x 0..10 V or 0(4)..20 mA
Output 2 x 0..10 V or 0(4)..20 mA
Integrated pressure sensor
9.2750.11.901 Input/output 1 x RS422
Input 1 x Pt100 or 0...10 V / 0(4)...20mA
3 x 0...10 V or 0(4)...20mA
Output 2 x 0..10 V or 0(4)..20mA
Integrated pressure sensor
Operating
voltage
230 V AC; 24 V AC;
12…35 V DC
115 V AC; 24 V AC;
12…35 V DC
230 V AC; 24 V AC;
15…35 V DC
115 V AC; 24 V AC;
15…35 V DC
230 V AC; 24 V AC;
15…35 V DC
115 V AC; 24 V AC;
15…35 V DC
Table 1: Device versions
2 Application
The Weather Display LED is a modern data-processing measuring and display device for the
display of to four measured values. Depending on the version it is also used for serial and analog
output of the measured data to further processing systems.
The device operates in conjunction with a weather station (e.g. data logger), which supplies a serial
data protocol. Optionally the Weather Display LED also acquires analog data (see Device versions)
from direct-connection sensors with analog outputs.
Configuration is carried out either at the factory according to the data protocol of Thies products
(weather station, data logger etc.) or on the basis of a data protocol as per customer specification.
The Weather Display LED is characterised by its high reliability and flexibility as well as optimum
display of the weather parameters.
Red light-emitting diodes (LEDs), which are easily to read under a wide range of lighting conditions
and distances, are used for display. The brightness is adjustable. Two brightness levels can be
stored using an extended dimming function. This allows individual settings for daytime and nighttime brightness to be called up quickly.
3 - 30 021503/10/07

The device version 9.2750.xx.901 also has an analog interface. This provides for the connection of
measured value transmitters with an analog output.
The device version 9.2750.1x.901 is additionally equipped with an integrated pressure sensor for
the acquisition of barometric air pressure data.
Equipment with device 9.2750.0x.900:
• 1 x real-time clock
• 1 x RS422 interface
Additional equipment with 9.2750.xx.901:
• 4 analog inputs (current / voltage / Pt100)
• 2 analog outputs (current or voltage)
Additional equipment with 9.2750.1x.901:
• 4 analog inputs
• 2 analog outputs (current or voltage)
• Built-in pressure sensor (air pressure)
Functions with device 9.2750.0x.900:
• Measured values received via:
- serial interface RS 422
- real-time clock
• Measured values output via:
- serial interface RS 422
• Calculation of:
- Instantaneous values
- sliding extreme values
- sliding mean values
- sums
• Customer-specific formatting of weather parameters
• Customer-specific formatting of display sequence
• Operation and settings via five buttons on front
• Flexible power supply with 230VAC or 24VAC / 12 - 35V DC (optionally 115VAC).
Additional functions with 9.2750.0x.901:
• Measurement of analog weather parameters and conversion to different units of
measurement for display and data output.
Additional functions with 9.2750.1x.901:
• Measurement of analog weather parameters and conversion to different units of
measurement for display and data output.
• Setting, measurement and conversion of pressure sensor parameters for display and
output.
4 - 30 021503/10/07
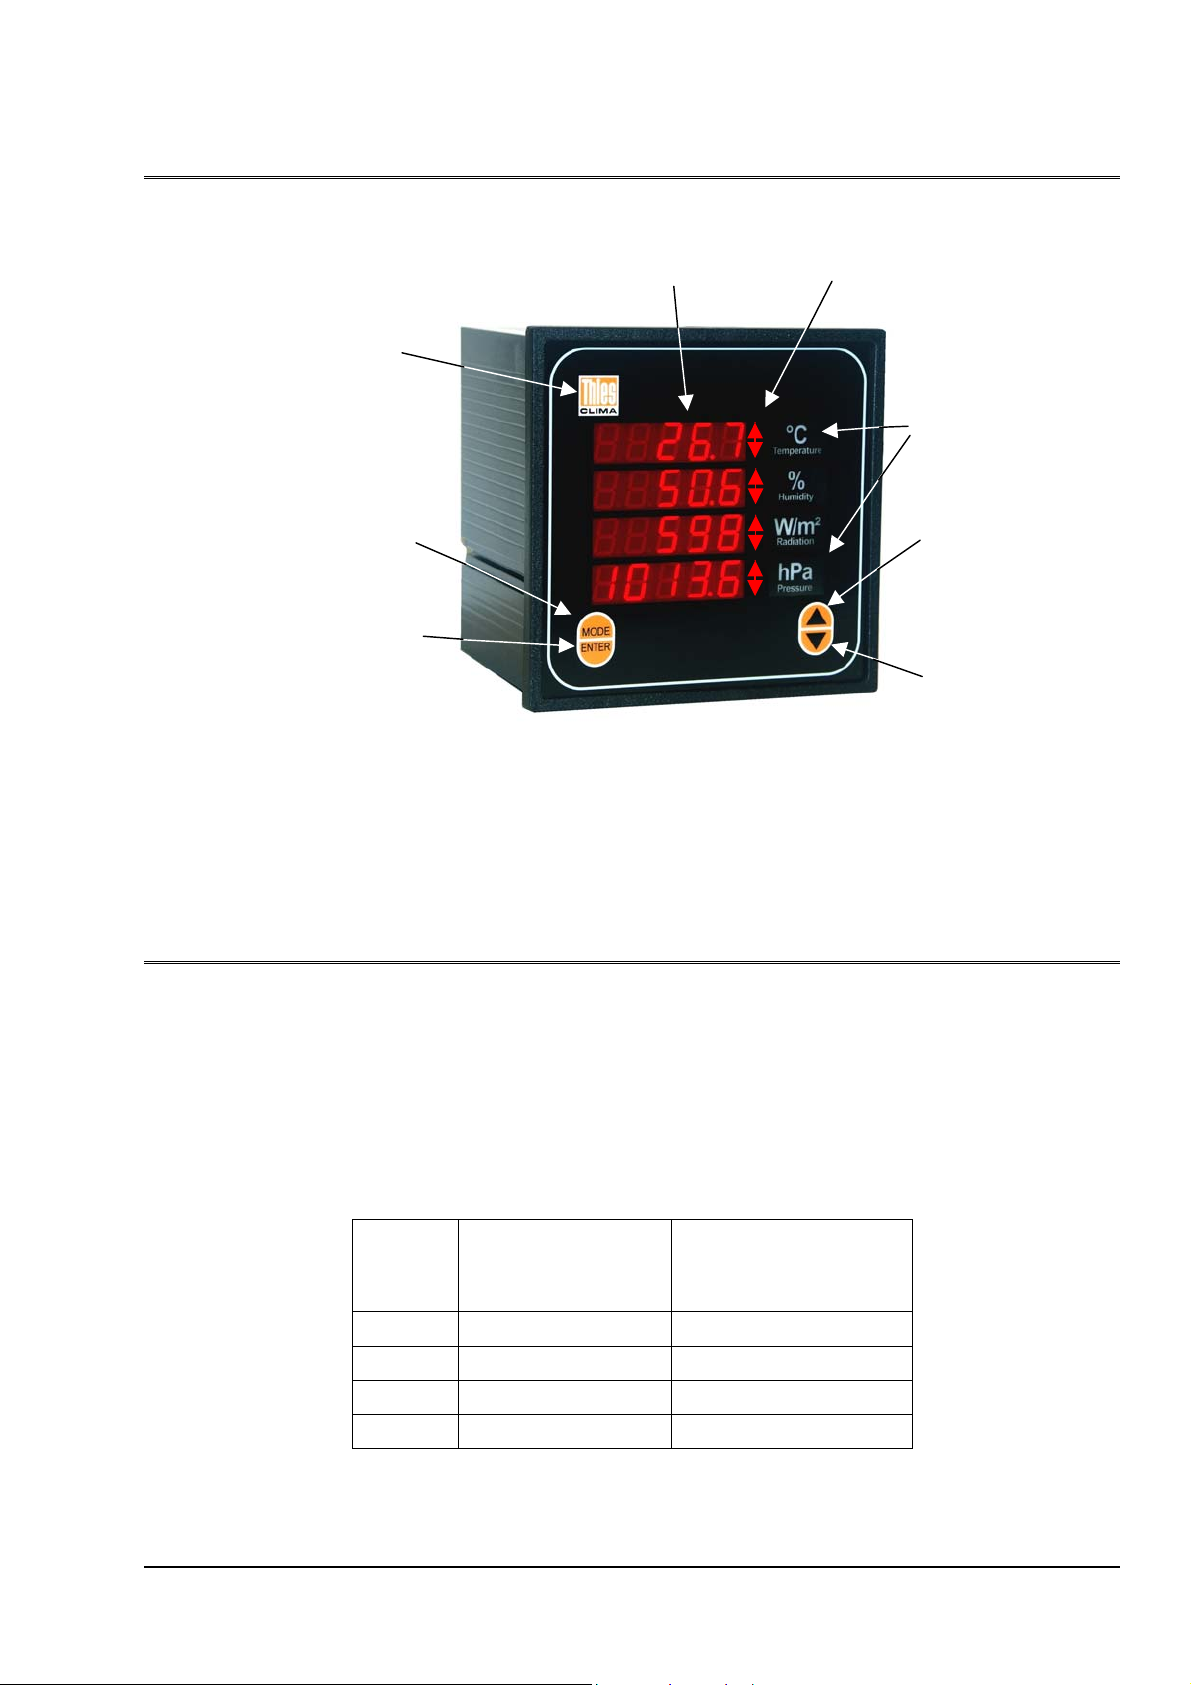
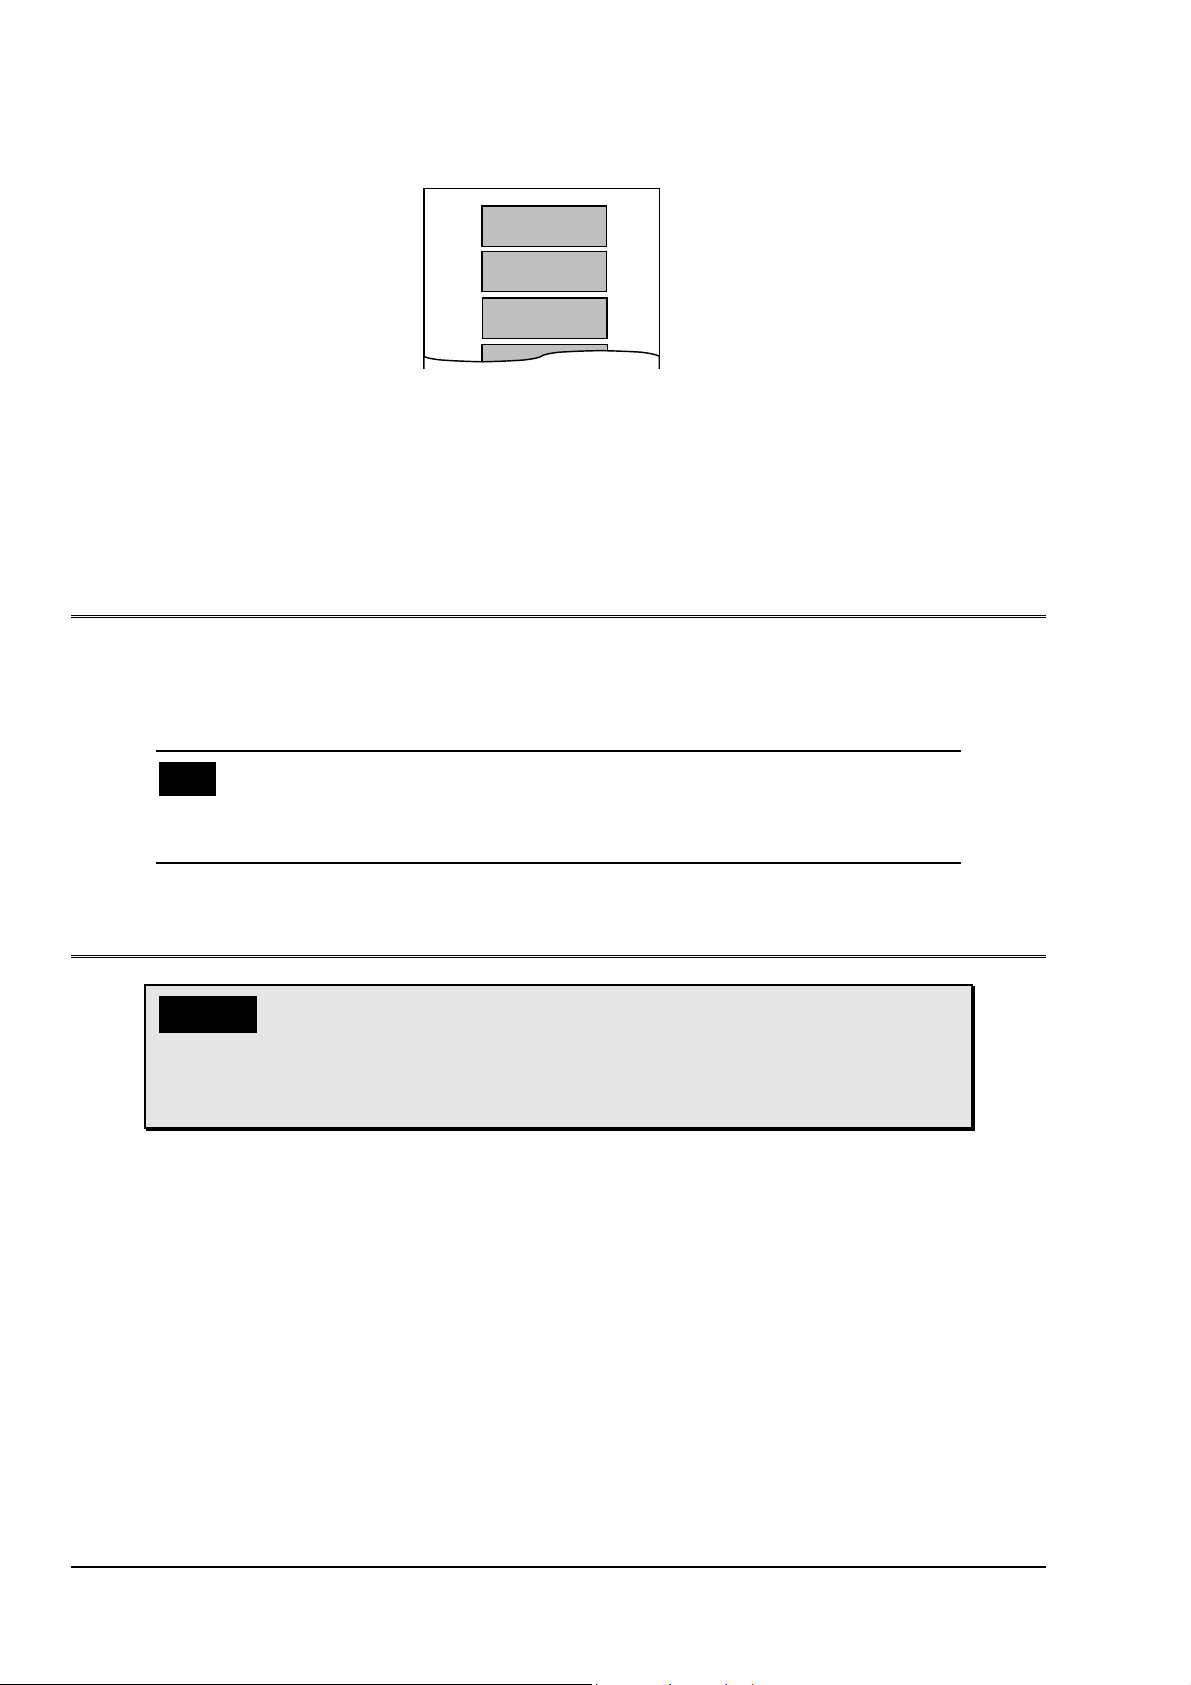
3 View
Button
"INFO & RESET"
4 x 5-digit
LED displays
Min/Max LEDs
Button "MODE"
Button
4 Mode of Operation
"Dimension"
Button "UP"
Button "DOWN"
4.1 Calculation of sliding mean and extreme values:
To process the sliding measured values two ring buffers with a depth of 60 single values are
available for each measured value. With processing of the measured values every second this
results in a 1-minute sliding extreme and mean value. With the selection of times > 1min, the
measured values are processed to produce an integral extreme and mean value prior to sliding
processing.
5 - 30 021503/10/07
Sliding
time
1 min 1 60
10 min 10 60
1 h 60 60
24h 1440 60
Integral mean from
n values (pre-
averaging)
Sliding mean value
from n
integral values
The ring buffers are initialised whenever the Weather Display is started up. The first valid measured
value is written to the ring buffers so that a measured value appears in the display at once. A
regular extreme or mean value is then available after the time selected.
The times selected are not synchronised to the clock time. They indicate the period of time in the
past.
Available time settings:
Parameter
Extreme value
Mean value
Time
1min 10min 30min 1h 2h 6h 12h 24h
no 1min 10min 30min 1h 2h 6h 12h 24h
4.2 Calculation of Sums
The menu sum „Su“ facilitates the configuring of a display line into a sum channel.
The input value, related to the display line, must be a sum value, too.
The addend for the sum to be indicated is calculated from the difference between the current input
value and the „old“ input value. The measuring range of the input values is acquired automatically
in increments, so that the sum overflow of the input value is identified and respectively processed.
Sum ranges:
Parameter
Value
The accepted increment within a second-by-second-query is between 0.1 and 1.1. Values of
outside the range are not accepted, and lead, after 2 sec, to a new vasic value for the following
totals formation
Sum
10,0 20,0 25,0 50,0 1000,0
The totals formation, once started (Power On), and the indicated sum value, are reset exclusively
by the internal clock (RTC) at 00:00, or by a RESET.
4.3 Elevation Input to the Air Pressure (Function only with instrument
9.2750.1x.901)
The wind display indicates the absolute pressure (P) or the air pressure (QNH), reduced to the sea
level. The absolute pressure is the standard factory setting, in case no other written arrangement
has been made.
For the setting of the display of the air pressure (QNH), reduced to sea level, the baro station height
(above sea level) must be entered.
The range of the baro station height input is 0.. 3000 m. The input is done by the front side keys,
and is indicated in the display line „Pressure“.
For description of the station height input please refer to operating examples point 6 (chapter 8).
6 - 30 021503/10/07
4.4 Acquisition of measured values
The acquisition of measured values is carried out via the serial interface (RS422) or optionally the
analog inputs.
The parameters required are filtered out of the data protocol received or the analog values and
assigned to the relevant LED displays.
Configuration of the Weather Display LED is carried out at the factory. Any ASCII data protocols
can be interpreted.
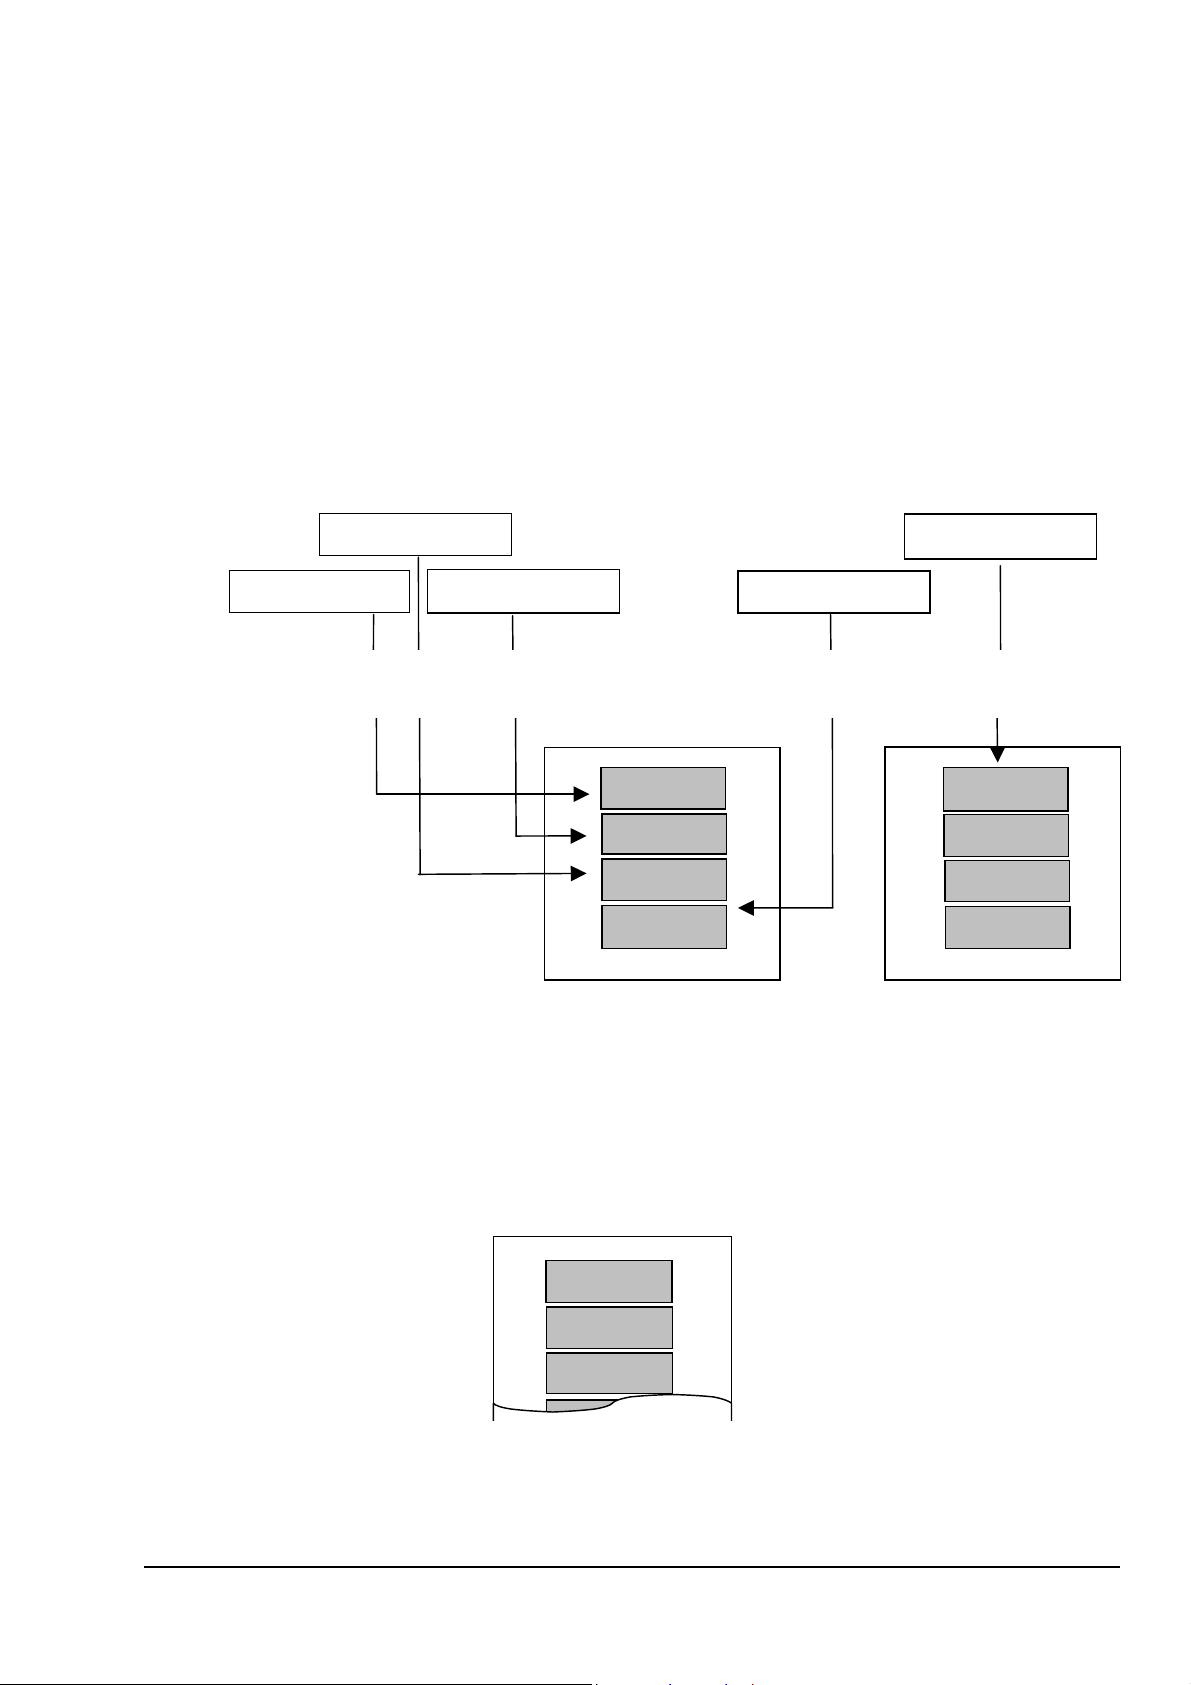
Example: Input telegram with filtering and display
Rel. humidity
Clock time
Temperature 2m
Temperature 5
Range of vision
1 2 3 4 5 6 7 8 9 10 11 12 13 14 15
07.2713 90 4.2 8.4 61.9 1.5 14.7 986.8 0.0 0 491 1 69.3 ---.- ----- ---- 20.04.05 7:16:17
8 . 4
T I n E
6 1 . 9
-----
0 7
1 6
1 7
After the Weather Display has started up, the internal real-time clock is synchronised with the first
clock time received.
Erroneous parameters are indicated by an error message in the level.
Erroneous parameters are replaced by minus signs "-----".
8 . 4
E r r o r
-----
-----
7 - 30 021503/10/07
If no telegram is received, the following message will appear after 10 sec
"E09" =Time out
5 Recommendation for Selection of Site
The device is designed for indoor installation. When used outdoors, an additional external housing
including the appropriate type of protection is required.
Note
When selecting the installation site please take note of the operating temperature
range.
6 Installation
Caution
The device should only be installed and connected by qualified
technicians. The general engineering regulations and
provisions and standards applicable must be observed.
6.1 Mechanical installation:
The display is designed for control panel installation. The necessary opening in the control panel
must measure 138 x 138 mm. The scope of supply includes two fixing brackets. After the device
has been inserted in the control panel, the fixing brackets are slid into the housing at the rear and
screwed into place.
8 - 30 021503/10/07
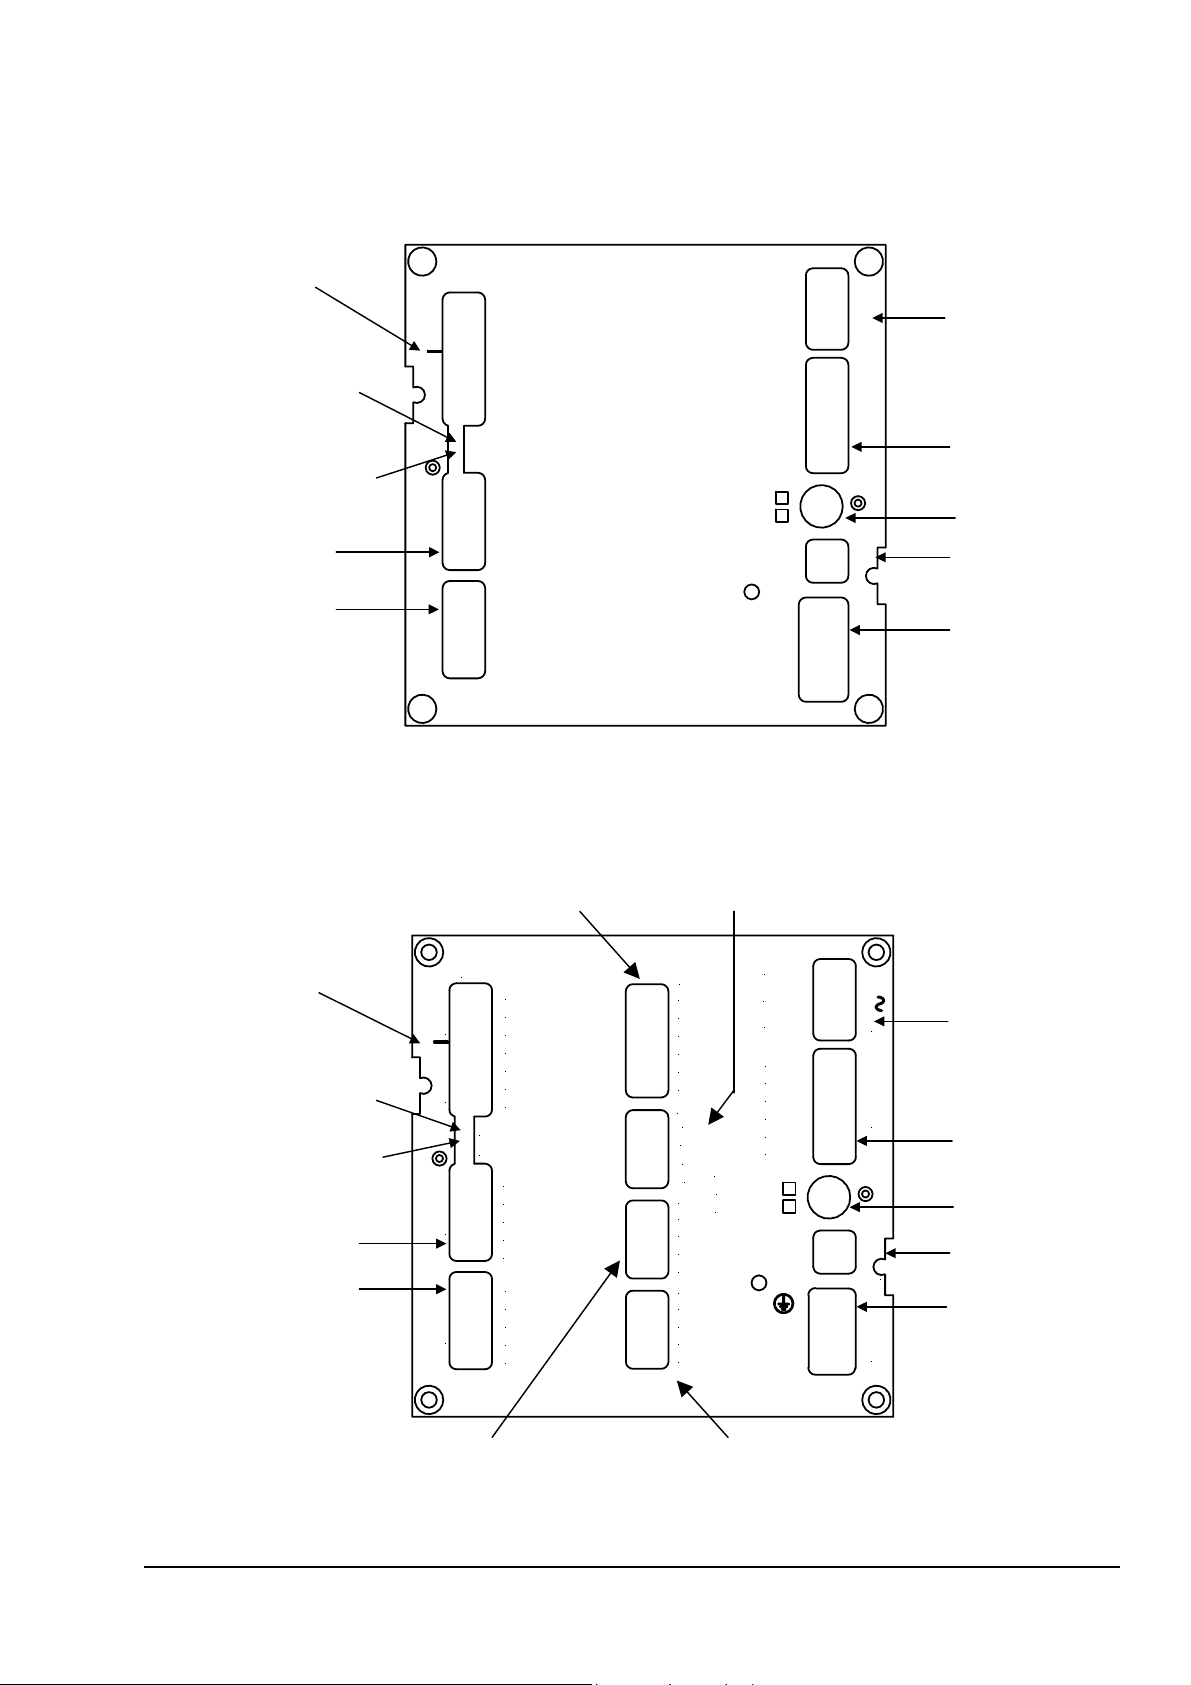
6.2 Electrical installation / connections:
All connections are at the rear (see Fig. 1 and 2).
No function
X7 Termination In (RS422)
X8 Termination Out
COM1
COM1’
Windsensor
Direction Velocity
COM1
COM1'
Vcc
GND
Pulse
Vcc
GND
Data
Clock
TX TX +
GND
RX RX +
TX TX +
GND
RX RX +
PE
N
L
GND
Down
Up
Enter
Mode
Res.
Power Supply
230V 1A
115V 2A
AC-Power
Remote
AC-Power
Remote control
Fuse
low voltage
low-voltage
Power
No function
Settings
No function
X7 Termination In
X8 Termination Out
COM1
COM1’
Windsensor
VelocityDirection
COM1
COM1'
Fig. 1: Rear 9.2750.xx.900
Analog input
Vcc
GND
Pulse
Vcc
GND
Data
Clock
X 7
X 8
TX TX +
GND
RX RX +
TX TX +
GND
RX RX +
Temp. (PT100)
Input
CH1+
CH1-
CH2+
CH2-
CH3+
CH3-
Te mp .
+ I
+ U
- U
- I
Vout
Vcc+
Vcc-
Vcc+
Vcc-
Output
Ch1+
Ch1-
Ch2+
Ch2-
PE
N
L
GND
Down
Up
Enter
Mode
Res.
Power Supply
230V 0,25AT
115V 0,5 A T
AC-Power
Remote
AC-Power
Remote control
Fuse
low voltage
low-voltage
Power
No function
Settings
Supply of external Sensors
Fig. 2: Rear 9.2750.0x.901
9 - 30 021503/10/07
Analog output
 Loading...