

Thermo Scientific picoSpin picoSpin-45 White Paper

White Paper
picoSpin-45 Monitoring of a Transesterification Reaction
Dean Antic, Applications Chemist
picoSpin, LLC
February 2011
The acid catalyzed transesterification reaction of methanol (MeOH) with ethyl
acetate (EtOAc) to produce methyl acetate (MeOAc) and ethanol (EtOH) was monitored
using the picoSpin-45 NMR spectrometer (Figure 1).
Figure 1. Acid catalyzed transesterification reaction of methanol with ethyl acetate.
A solution of MeOH and EtOAc (6:1 mol/mol) was prepared in a 10 mL HDPE
bottle by mixing 5 mL of dry MeOH (Sigma-Aldrich: 99.8%; 24.7 M) with 2 mL of
EtOAc (Acros: 99.6%; 10.24 M). To start the reaction 7 drops (0.3 mL) of concentrated
H2SO4 (18.4 M) was added to the reaction mixture. (The acid concentration after dilution
is approximately 0.75 M). The solution was shaken briefly, transferred to a 13 mm (dia.)
x 100 mm (L) test tube and placed in a hot water bath preheated to 56 °C - the bath
temperature fluctuated between 52-58 °C during the experiment. The reaction vessel was
capped with a loose fitting glass stopper to minimize evaporation of reactants and
products.
A 40 L aliquot of the reaction mixture was taken at a sampling interval of 5
minutes, from t = 0 to t = 180 min, and injected into the inlet port of the capillary
probe. The magnet temperature was 46 °C and approximates the capillary temperature
within the spectrometer’s RF coil. After an elapsed time of 180 minutes, the reaction
mixture was transferred to a HDPE bottle, sealed, and allowed to react for an additional
40 hours, at which time a final spectrum was acquired. A spectrum of the unreacted
MeOH:EtOAc solution, prior to the addition of acid, was also acquired for comparison.
The 40 L sample volume provided sufficient material to purge the capillary of the
previous analyte and fill it with the current sample.
Each spectrum is an average of 12 scans acquired using a 90° pulse, 750 ms
acquisition time, and 10 s recovery delay. Averaged spectra were processed in MNova
first by applying automatic baseline correction, manual phase correction (PH0
picoSpin • 6650 Gunpark Drive • Boulder CO 80301 • 877.390.0465
White Paper
and PH1 corrections were both applied as needed), zero filling with 64K points, and
finally the spectra were filtered using Sine Bell (26°), exponential (0.10 Hz), and
Gaussian (1 Hz) apodization. Spectra are internally referenced against the CH3 proton
signal in MeOH which was set to a chemical shift (δ) of 3.48 ppm. Spectra are presented
as unnormalized except where noted. Peak areas were obtained with the line fitting
function in MNova using the same spectral width and region for the CH3 signal in MeOH
(3.255 to 3.619 ppm) and the α-CH3 signal in EtOAc and MeOAc (1.927 to 2.257 ppm).
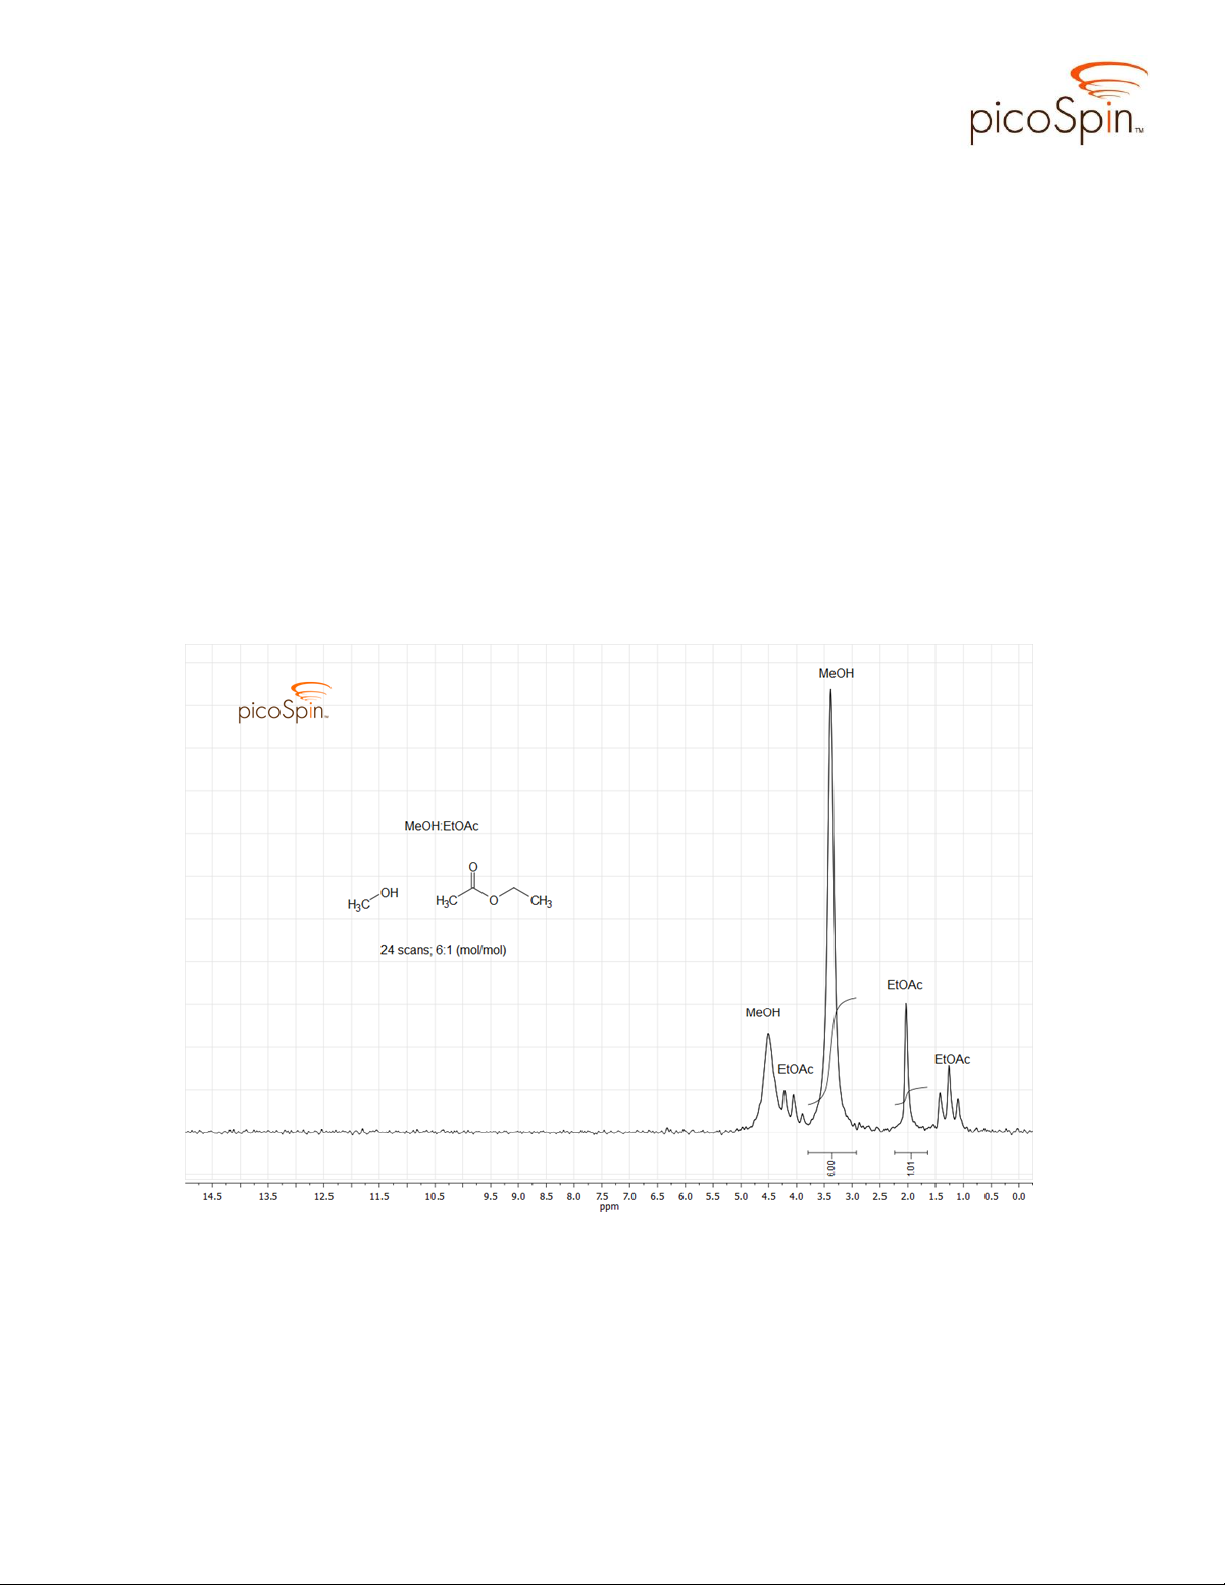
Figures 2 and 3 show the proton spectrum of unreacted MeOH:EtOAc solution
from separate batches (prior to adding the mineral acid catalyst). Methanol produces two
singlet peaks, a methyl peak at 3.48 ppm and a hydroxyl peak at 4.7 ppm. Ethyl acetate
produces three signals, a triplet (1.36 ppm) arising from the terminal methyl being split
by two vicinal protons on the adjacent methylene, a singlet at 2.13 ppm from the αcarbon protons, and a quartet centered near 4.22 ppm (this signal is partially masked by
the hydroxyl signal of MeOH where only 3 peaks of this quartet are
discernible). Integration of the methyl CH3 signal from MeOH and that of the α-CH3
from EtOAc approximates the 6:1 mole ratio of the original solution.
Figure 2. picoSpin-45 spectrum of the initial, uncatalyzed reaction mixture; 6:1
(mol/mol) MeOH and EtOAc.
The spectrum in Figure 3, taken from a separate MeOH-EtOAc solution, differs
from the one in Figure 2 in that it shows additional structure in both the methyl and
hydroxyl proton signals of MeOH. The doublet signal at 3.48 ppm has a J value of 3.9 Hz
and suggests the CH3 protons are split by the adjacent hydroxyl proton. Ordinarily proton
exchange is too rapid for spin coupling to be observed in MeOH, however, hydrogen
picoSpin • 6650 Gunpark Drive • Boulder CO 80301 • 877.390.0465
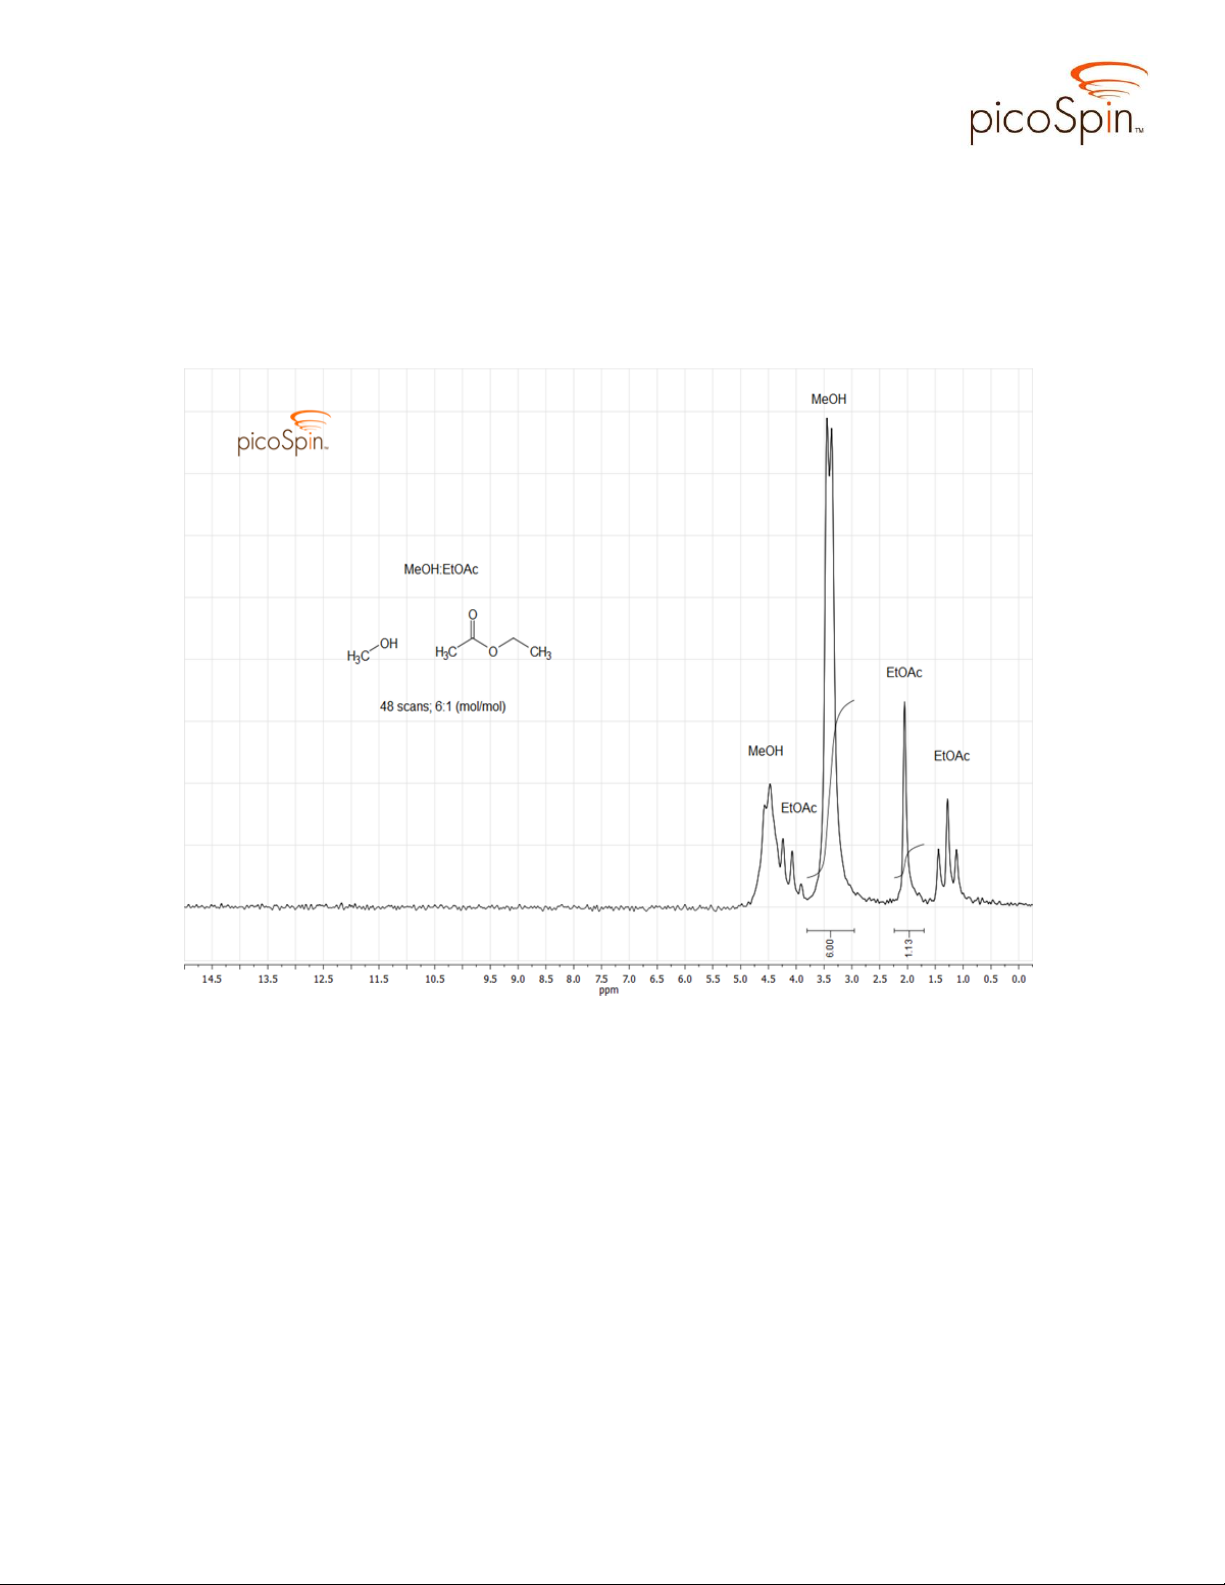
White Paper
bonding with EtOAc slows proton exchange, increasing the lifetime of isolated hydroxyl
protons sufficiently to allow for spin-spin coupling to occur, which produces the
observed fine structure. This behavior is known to occur in methanol solutions containing
sufficient concentration of acetone to encourage hydrogen bonding. Addition of even a
small amount of acid causes the observed doublets in MeOH to collapse to singlet peaks,
as seen in the in the reaction spectra series in Figure 4.
Figure 3. picoSpin-45 spectrum of the initial, uncatalyzed reaction mixture; 6:1
(mol/mol) MeOH and EtOAc exhibiting hydrogen bonding effect on spin coupling in
methanol.
In Figure 4 spectra acquired during the reaction taken at 5 minute intervals, from t
= 0 to t = 180 min, are stacked for comparison. Several regions of the composite
spectrum are expanded to provide clarity and to emphasize changes occurring in the αCH3, alkoxy ethyl and methyl CH3, methylene CH2, and hydroxyl OH signals.
The peak centered at δ2.13 is attributable to resonances of the α-CH3 group
protons in both the reactant EtOAc and product MeOAc. Since chemical transformation
occurs on the ester side of EtOAc and the reaction does not create any new keto-methyl
groups the chemical shift of these α-carbon protons, which are very closely spaced in
both reactant and product, is not expected to change during the course of reaction.
Initially, the triplet structure at δ1.35 is due to splitting of the terminal alkoxy
ethyl CH3 group in EtOAc being split by two vicinal protons on the adjacent methylene
picoSpin • 6650 Gunpark Drive • Boulder CO 80301 • 877.390.0465
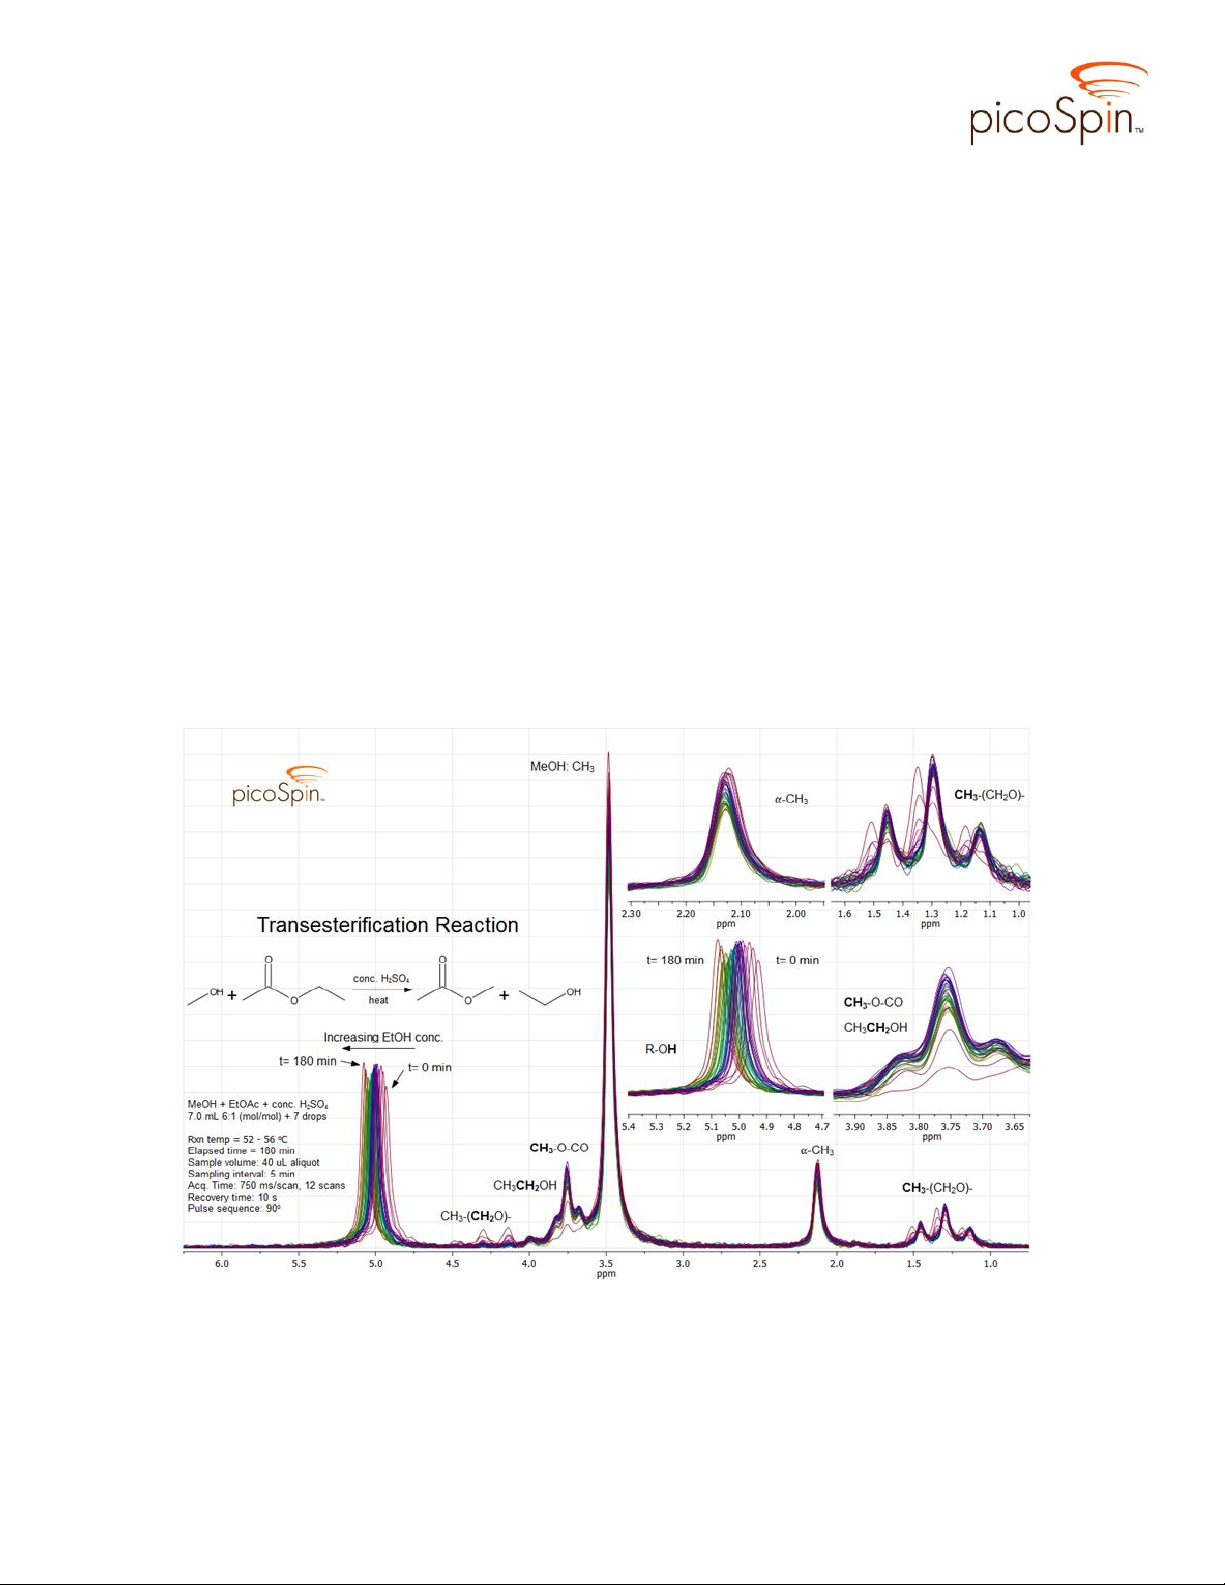
White Paper
group. As the reaction progresses the triplet shifts upfield to δ1.29 and is attributable to
splitting of the alcoholic CH3 group in EtOH.
At first glance the signal centered on δ3.76 appears to be a triplet but is actually
two overlapping signals; one is a quartet signal due to splitting of the methylene group by
three vicinal protons of the terminal methyl group of the product EtOH, and the second
signal comes from the alkoxy methyl group of the product methyl acetate. Only three of
the four peaks of the EtOH methylene quartet are resolved, with the peak farthest upfield
buried under the leading edge of the large CH3 signal from MeOH (δ3.48). The alkoxy
methyl proton resonance overlaps nearly perfectly with the third downfield peak of the
methylene quartet giving the appearance of the triplet structure. There are no triplet
resonances expected to appear in this region of the spectrum.
The progression of the reaction is best seen in the downfield ‘walk’ of the OH
signal which indicates a change in the mole fraction of MeOH and EtOH as the reaction
proceeds. Initially the reaction contains only MeOH, with a MeOH:EtOH mole fraction
of 6:1. As EtOH product is generated, the time-averaged OH signal arising from a rapid
exchange of hydroxyl protons shifts to higher frequency as the MeOH:EtOH mole ratio
changes. The OH signal reaches its maximum chemical shift in this reaction at t = 180
min. A comparison of a spectrum taken of the reaction mixture at t = 40 hrs (Figure 5) to
that obtained at t = 180 min suggests the reaction has already finished by this time.
Figure 4. picoSpin-45 spectra of the reaction mixture sampled at 5 min intervals.
picoSpin • 6650 Gunpark Drive • Boulder CO 80301 • 877.390.0465
 Loading...