

Page 1

Thermo Fisher Scientific Niton
Analyzers
XL2 Analyzer
Version 8.0.1
User’s Guide (Abridged)
Refer to NITON XL2 Resource Guide for complete information
Revision A March 2012
Page 2

Page 3

© 2010 Thermo Fisher Scientific Inc. All rights reserved.
Page 4

Thermo Fisher Scientific Inc. provides this document to its customers with a product purchase to use in the
product operation. This document is copyright protected and any reproduction of the whole or any part of this
document is strictly prohibited, except with the written authorization of Thermo Fisher Scientific Inc.
The contents of this document are subject to change without notice. All technical information in this
document is for reference purposes only. System configurations and specifications in this document supersede
all previous information received by the purchaser.
Thermo Fisher Scientific Inc. makes no representations that this document is complete, accurate or errorfree and assumes no responsibility and will not be liable for any errors, omissions, damage or loss that might
result from any use of this document, even if the information in the document is followed properly.
This document is not part of any sales contract between Thermo Fisher Scientific Inc. and a purchaser. This
document shall in no way govern or modify any Terms and Conditions of Sale, which Terms and Conditions of
Sale shall govern all conflicting information between the two documents.
Release history:
For Research Use Only. Not for use in diagnostic procedures.
Page 5

Contents
Chapter 0 Contact Us. . . . . . . . . . . . . . . . . . . . . . . . . . . . . . . . . . . . . . . . . . . . . . . . . . . . . . . . . . . . .1
Chapter 1 Manual Overview . . . . . . . . . . . . . . . . . . . . . . . . . . . . . . . . . . . . . . . . . . . . . . . . . . . . . .1
Warnings, Cautions, and Notes. . . . . . . . . . . . . . . . . . . . . . . . . . . . . . . . . . . . . . 1
Figures. . . . . . . . . . . . . . . . . . . . . . . . . . . . . . . . . . . . . . . . . . . . . . . . . . . . . . . . . 1
Physical Buttons . . . . . . . . . . . . . . . . . . . . . . . . . . . . . . . . . . . . . . . . . . . . . . . . . 2
Other Hardware . . . . . . . . . . . . . . . . . . . . . . . . . . . . . . . . . . . . . . . . . . . . . . . . . 2
Chapter 2 Using Your Analyzer . . . . . . . . . . . . . . . . . . . . . . . . . . . . . . . . . . . . . . . . . . . . . . . . . . . .3
Safely and Effectively Using Your Analyzer . . . . . . . . . . . . . . . . . . . . . . . . . . . . . 3
Proper and Improper Operation . . . . . . . . . . . . . . . . . . . . . . . . . . . . . . . . . . . . 19
Chapter 3 How to Analyze . . . . . . . . . . . . . . . . . . . . . . . . . . . . . . . . . . . . . . . . . . . . . . . . . . . . . . .23
General Analysis . . . . . . . . . . . . . . . . . . . . . . . . . . . . . . . . . . . . . . . . . . . . . . . . 24
Chapter 4 Basic Operation . . . . . . . . . . . . . . . . . . . . . . . . . . . . . . . . . . . . . . . . . . . . . . . . . . . . . . .29
Taking a Sample Analysis . . . . . . . . . . . . . . . . . . . . . . . . . . . . . . . . . . . . . . . . . 29
Analysis Modes . . . . . . . . . . . . . . . . . . . . . . . . . . . . . . . . . . . . . . . . . . . . . . . . . 37
Chapter 5 Common Operations . . . . . . . . . . . . . . . . . . . . . . . . . . . . . . . . . . . . . . . . . . . . . . . . . . . 47
Metal Sample Prep . . . . . . . . . . . . . . . . . . . . . . . . . . . . . . . . . . . . . . . . . . . . . . 47
Soil Sample Prep . . . . . . . . . . . . . . . . . . . . . . . . . . . . . . . . . . . . . . . . . . . . . . . . 60
Preparing Mining Samples . . . . . . . . . . . . . . . . . . . . . . . . . . . . . . . . . . . . . . . . 64
Setting Up Beep Times . . . . . . . . . . . . . . . . . . . . . . . . . . . . . . . . . . . . . . . . . . . 65
Sorting the Custom Element Display . . . . . . . . . . . . . . . . . . . . . . . . . . . . . . . . 66
Max Measure Time . . . . . . . . . . . . . . . . . . . . . . . . . . . . . . . . . . . . . . . . . . . . . . 67
Minumum Test Time . . . . . . . . . . . . . . . . . . . . . . . . . . . . . . . . . . . . . . . . . . . . 67
Virtual Keyboard . . . . . . . . . . . . . . . . . . . . . . . . . . . . . . . . . . . . . . . . . . . . . . . . 68
Setting Display Units . . . . . . . . . . . . . . . . . . . . . . . . . . . . . . . . . . . . . . . . . . . . 71
Adjusting the Element Range . . . . . . . . . . . . . . . . . . . . . . . . . . . . . . . . . . . . . . 73
Setting the Date and Time . . . . . . . . . . . . . . . . . . . . . . . . . . . . . . . . . . . . . . . . 74
Calibrating the Touch Screen . . . . . . . . . . . . . . . . . . . . . . . . . . . . . . . . . . . . . . 81
Chapter 6 Data Management . . . . . . . . . . . . . . . . . . . . . . . . . . . . . . . . . . . . . . . . . . . . . . . . . . . . .83
Viewing Data . . . . . . . . . . . . . . . . . . . . . . . . . . . . . . . . . . . . . . . . . . . . . . . . . . 83
Viewing Fingerprints . . . . . . . . . . . . . . . . . . . . . . . . . . . . . . . . . . . . . . . . . . . . . 90
Erasing Data . . . . . . . . . . . . . . . . . . . . . . . . . . . . . . . . . . . . . . . . . . . . . . . . . . . 91
Managing Libraries . . . . . . . . . . . . . . . . . . . . . . . . . . . . . . . . . . . . . . . . . . . . . . 96
Chapter 7 Connectivity . . . . . . . . . . . . . . . . . . . . . . . . . . . . . . . . . . . . . . . . . . . . . . . . . . . . . . . . .103
Using Your Analyzer With Your PC . . . . . . . . . . . . . . . . . . . . . . . . . . . . . . . . 109
Connecting From Your Analyzer to Your PC . . . . . . . . . . . . . . . . . . . . . . . . . 111
Using a USB Cable to Connect Your Analyzer . . . . . . . . . . . . . . . . . . . . . . . . 114
Downloading Data . . . . . . . . . . . . . . . . . . . . . . . . . . . . . . . . . . . . . . . . . . . . . 116
Thermo Scientific manual-name 1
Page 6

Contents
Chapter 7 Controlling Your Analyzer From Your PC . . . . . . . . . . . . . . . . . . . . . . . . . . . . . . . . 125
Chapter 8 Learning More, Service, and Support . . . . . . . . . . . . . . . . . . . . . . . . . . . . . . . . . . .129
Replacing the Measurement Window . . . . . . . . . . . . . . . . . . . . . . . . . . . . . . . 129
Tips and Troubleshooting . . . . . . . . . . . . . . . . . . . . . . . . . . . . . . . . . . . . . . . . 132
Storing and Transporting Your Niton XL2 Analyzer . . . . . . . . . . . . . . . . . . . . 139
Chapter 8 Advanced Settings . . . . . . . . . . . . . . . . . . . . . . . . . . . . . . . . . . . . . . . . . . . . . . . . . . .143
Tools Menu Options . . . . . . . . . . . . . . . . . . . . . . . . . . . . . . . . . . . . . . . . . . . . 149
NDF Files: User Data Structuring . . . . . . . . . . . . . . . . . . . . . . . . . . . . . . . . . . 169
Safety Settings . . . . . . . . . . . . . . . . . . . . . . . . . . . . . . . . . . . . . . . . . . . . . . . . . 181
Camera . . . . . . . . . . . . . . . . . . . . . . . . . . . . . . . . . . . . . . . . . . . . . . . . . . . . . . 188
Chapter 8 Service . . . . . . . . . . . . . . . . . . . . . . . . . . . . . . . . . . . . . . . . . . . . . . . . . . . . . . . . . . . . . 191
Warranty . . . . . . . . . . . . . . . . . . . . . . . . . . . . . . . . . . . . . . . . . . . . . . . . . . . . . 191
2 manual-name Thermo Scientific
Page 7
Contact Us
Americas Europe Asia
niton.eur@thermofisher.com
niton@thermofisher.com
itonEurope.support@thermofisher.com
N
niton.asia@thermofisher.com
NitonAsia.Support@thermofisher.com
1
Page 8

0
Contact Us
2 Niton XL2 Analyzer User’s Guide Thermo Scientific
Page 9

Manual Overview
Warnings, Cautions, and Notes
Warnings
Warnings are extremely important recommendations, violating which may result in either
injury to yourself or others, or damage to your analyzer and/or data. Warnings will always be
identified as Warnings in the text, and will always be visually presented as follows:
WARNING This is a Warning.
Example Warning:
WARNING Tampering with the 5,500 ppm (Lead high) lead-in-soil standard may cause
exposure to lead dust. Keep all standards out of reach of children.
1
Manual Overview
Warnings, Cautions, and Notes
Cautions
Example Caution:
Notes
Example Note:
Cautions are important recommendations. Cautions will always be identified as Cautions in
the text, and will always be visually presented as follows:
CAUTION This is a Caution.
CAUTION Never tamper with Test Standards. They should not be used unless they are
completely intact
Notes are informational asides which may help you with your analyses. Notes will always be
identified as Notes in the text, and will always be visually presented as follows:
Note This is a Note.
Note For defensible Quality Control, keep a record of the time and precision of every
calibration
Figures
Figures are illustrations used to show what something looks like. Figures will always be
labelled and identified as Figures directly below the Figure itself, and will always be visually
presented as follows:
Thermo Scientific Niton XL2 Analyzer User’s Guide 1
Page 10
1
Manual Overview
Physical Buttons
Figure 1. This is a Figure
Physical Buttons
Physical Buttons are actual buttons on the analyzer which must be pushed to activate their
function. Physical Buttons will always be identified as Buttons in the text, and will always be
visually presented as follows:
This is a Physical Button.
Example Physical Buttons:
On/Off/Escape Button, Clear/Enter Button, Interlock Button, and Trigger Button.
Other Hardware
Other Hardware refers to any physical part of the analyzer which performs a necessary
function. Other Hardware will always be visually presented as follows:
This is an example of Other Hardware.
Example Other Hardware:
Battery, Touch Screen Display, Measurement Window, and USB Cable
2 Niton XL2 Analyzer User’s Guide Thermo Scientific
Page 11

Using Your Analyzer
This section discusses the basics of using your analyzer, no matter the
specific type of analysis you wish to perform. First we go over analyzer
safety, particularly radiation safety. Using an X-ray based analyzer safely
is very important, and not difficult, provided you read, understand, and
follow these guidelines. Secondly, we outline the startup procedure we
recommend for daily use to ensure that your analyzer is performing
properly and at its most efficient level.
Safely and Effectively Using Your Analyzer
CAUTION Niton analyzers are not intrinsically safe analyzers. All
pertinent Hot Work procedures should be followed in areas of concern.
WARNING Always treat radiation with respect. Do not hold your
analyzer near the measurement window during testing. Never point your
analyzer at yourself or anyone else when the shutter is open.
Radiation and General Safety
This section covers topics related to radiation safety and general safety
when using a Thermo Scientific Niton XL2 analyzer. At a minimum all
operators of the analyzer should be familiar with the instructions
provided in this chapter in order to handle the analyzer in a safe manner.
In addition to reading the information presented on the following pages,
Thermo Fisher Scientific recommends that instrument users participate
in a radiation safety and operational training class.
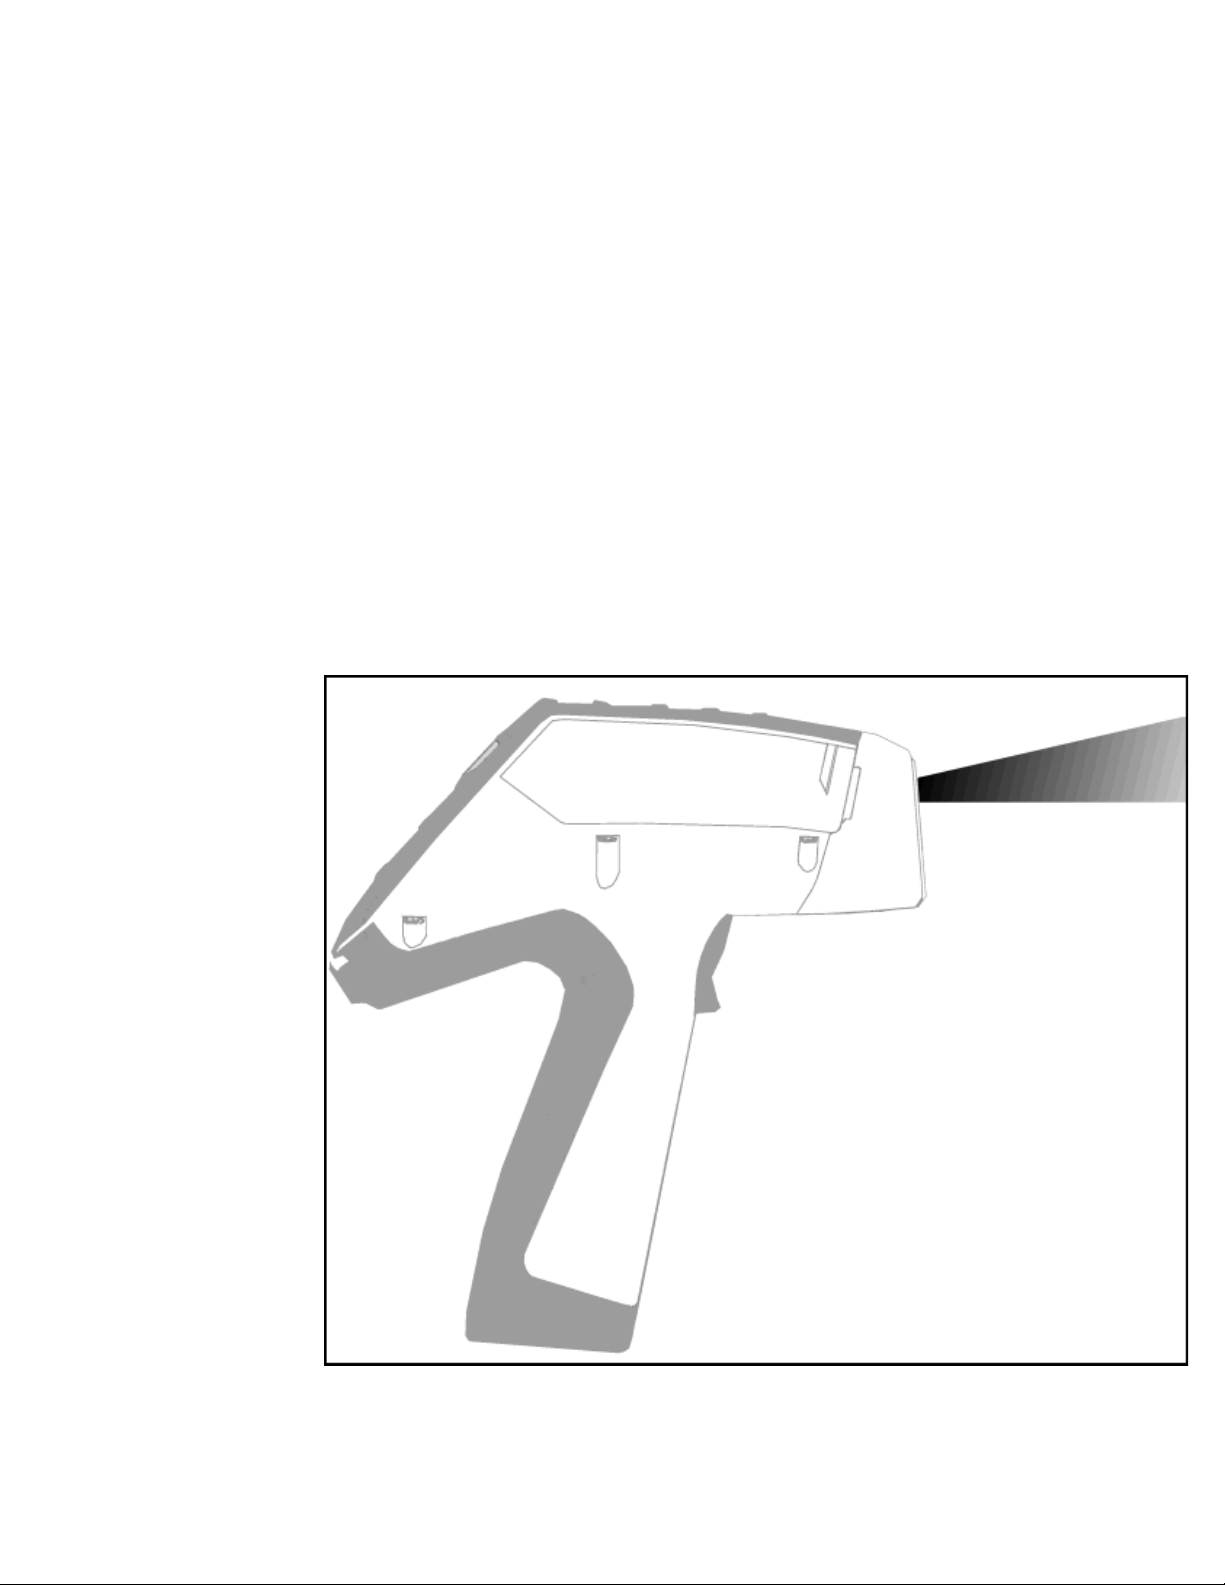
Radiation Protection Basics
The Niton Model XL2 analyzer contains an x-ray tube which emits
radiation only when the user turns the x-ray tube on. When the x-ray
tube is on and the shutter is open, as during a measurement, the analyzer
emits a directed radiation beam - see Figures 1-1 and 1-2. Reasonable
effort should be made to maintain exposures to radiation as far below
dose limits as is practical. This is known as the ALARA (As Low as
Reasonably Achievable) principle. For any given source of radiation,
three factors will help minimize your radiation exposure: Time,
Distance, and Shielding.
3
Page 12

2
Using Your Analyzer
Safely and Effectively Using Your Analyzer
Time
The longer you are exposed to a source of radiation the longer the radiation is able to interact
in your body and the greater the dose you receive. Dose increases in direct proportion to
length of exposure.
Distance
The closer you are to a source of radiation, the more radiation strikes you. Based
on geometry alone, dose increases and decreases with an inverse-squared relation
to your distance from the source of radiation (additional dose rate reduction comes
from air attenuation). For example, the radiation dose one foot from a source is
nine times greater than the dose three feet from the source. Remember to keep your
hands and all body parts away from the front end of the analyzer when the shutter
is open to minimize your exposure.
Shielding
Exposure to Radiation
Shielding is any material that is placed between you and the radiation source. The more
material between you and the source, or the denser the material, the less you will be exposed
to that radiation. Supplied or optional test stands are an additional source of shielding for
analysis. A backscatter shield accessory is also available and may be appropriate in some
applications.
Human dose to radiation is typically measured in rem, or in one-thousandths of a rem, called
millirem (mrem), 1 rem = 1000 mrem. Another unit of dose is the Sievert (Sv), 1 Sv = 100
rem. The allowable limit for occupational exposure in the U.S (and many other countries) is
5,000 mrem/year (50 mSv/year) for deep (penetrating) dose and 50,000 mrem/year (500
mSv/year) for shallow (i.e., skin) dose or dose to extremities. Deep, shallow, and extremity
exposure from a properly used Niton XL2 analyzer should be less than 200 mrem per year,
(2.0 mSv per year) even if the analyzer is used as much as 2,000 hours per year, with the
shutter open continuously. The only anticipated exceptions to the 200 mrem maximum
annual dose are: 1) routine and frequent analysis of plastic samples without use of a test stand,
backscatter shield, or similar additional protective measures, or 2) improper use where a part
of the body is in the primary beam path.
Note NEVER OPERATE THE DEVICE WITH A PART OF YOUR BODY IN THE
PRIMARY BEAM PATH OR WITH THE PRIMARY BEAM PATH DIRECTED AT
ANYONE ELSE.
Also, consider the use of protective accessories such as a shielded test stand or backscatter
shield (or equivalent) when performing routine and/or frequent analysis of any of the
following:
4 Niton XL2 Analyzer User’s Guide Thermo Scientific
Page 13

2
Using Your Analyzer
Safely and Effectively Using Your Analyzer
• light materials (such as plastic, wood, or similarly low density/low atomic mass
samples)
• thin samples (such as foils, circuit boards, and wires)
• samples that are smaller than the analysis window.
Shown in Table 1 are the typical background radiation doses received
by the average member
of the public. The radiation dose limits for radiation workers in the US are also shown in
Table 2.
Thermo Scientific Niton XL2 Analyzer User’s Guide 5
Page 14

2
Using Your Analyzer
Safely and Effectively Using Your Analyzer
Table 1. Typical Radiation Doses Received (Source: NCRP 1987)
Category Dose in mrem Dose in mSv
Average total dose in US (annual) 360 3.6
Average worker exposure (annual) 210 2.1
Average exposure for an underground
400 4.0
miner
Exposure for airline crew (1,000 hours at
500 5.0
35,000 ft)
Additional from living in Denver at 5300’
25 .25
(annual)
Additional from 4 pCi/l radon in home 1,000 10.0
Typical Chest X-Ray 6 0.06
Typical Head or Neck X-Ray 20 0.2
Typical pelvis/hip x-ray 65 0.65
Typical lumbar spine x-ray 30 0.3
Typical Upper G.I. x-ray 245 2.45
Typical Barium enema x-ray 405 4.05
Typical CAT scan 110 1.10
Table 2. Annual Occupational Dose Limits for Radiation Workers (Source:
Code of Federal Regulations Title 10, Part 20)
Category Dose in mrem Dose in mSv
Whole Body 5000 50
Pregnant Worker (during gestation
500 5
period)
Eye Dose Equivalent 15,000 150
Shallow dose equivalent to the skin or
50,000 500
any extremity or organ
Maximum allowable dose for the general
100 1.0
public (annual)
For a Minor 500 5.0
6 Niton XL2 Analyzer User’s Guide Thermo Scientific
Page 15

Monitoring your radiation exposure
Individuals can be monitored for the radiation dose they receive by use of radiation dosimetry
devices (dosimeters). Monitoring dose using a dosimeter can be a way of identifying improper
use and at the same time demonstrating proper use. In some locations, dosimetry is required
by regulations and in others it is optional. It is normally required when the user could
reasonably be expected to receive in excess of 10% of the annual dose limit. Thermo Fisher
Scientific recommends that you determine and obey the local regulatory requirements
concerning radiation monitoring of occupational workers.
Two common types of dosimeters are whole-body badges and ring badges. Whole body
badges are often attached to the user’s torso (e.g., clipped to the collar, shirt pocket, or waist as
appropriate). A ring badge is worn on the finger as a measure of maximum extremity dose.
When worn, the specific location of the dosimeter should be that part of the body that is
expected to receive the highest dose. This location will depend on how the analyzer is used
and so it may not be the same for all users. Dosimetry services are offered by many companies.
Two companies offering dosimetry services in the USA and much of the world are:
2
Using Your Analyzer
Safely and Effectively Using Your Analyzer
Company Global Dosimetry Solutions Landauer, Inc.
Address 2652 McGaw Avenue 2 Science Road
City and State Irvine, CA 92614 Glenwood, IL 60425-9979
Website www.dosimetry.com www.landauerinc.com
Phone Number (800) 251-3331 (800) 323-8830
Note Wearing a dosimeter badge does not protect you against radiation exposure. A
dosimeter badge only measures your exposure (at the dosimeter location).
Pregnancy and Radiation Exposure
International guidance documents (e.g., ICRP Publication 60 and NCRP Publication 116*)
recommend that the radiation dose to the embryo/fetus of a pregnant woman should not
exceed a total of 500 mrem (10% of normal radiation worker limit) during the gestation
period. While this dose limit exceeds the dose limit to a trained operator, pregnant workers
may want to take special precautions to reduce their exposure to radiation. For more
information see the U.S. NRC Regulatory Guide 8.13 "Instruction Concerning Prenatal
Radiation Exposure" which can be found on the resource CD.
* The International Commission on Radiological Protection, ICRP, is an independent
Registered Charity, established to advance for the public benefit the science of radiological
protection, in particular by providing recommendations and guidance on all aspects of
protection against ionizing radiation.
Thermo Scientific Niton XL2 Analyzer User’s Guide 7
Page 16
2
Using Your Analyzer
Safely and Effectively Using Your Analyzer
* The National Council on Radiation Protection and Measurements (NCRP) was chartered
by the U.S. Congress in 1964 as the National Council on Radiation Protection and
Measurements.
How to Use the Niton XL2 Analyzer Safely
The Niton XL2 analyzer is designed to be safe to operate provided that it is used in
accordance with manufacturer's instructions. Under conditions of normal use, monitored
operators seldom receive a measurable dose and have not been known to receive in excess of
10% of the annual occupational dose limits (a criteria that would require monitoring under
regulation in the U.S.). In addition to proper use of the analyzer, it is recommended that you
follow these precautions to ensure your safety and the safety of those around you.
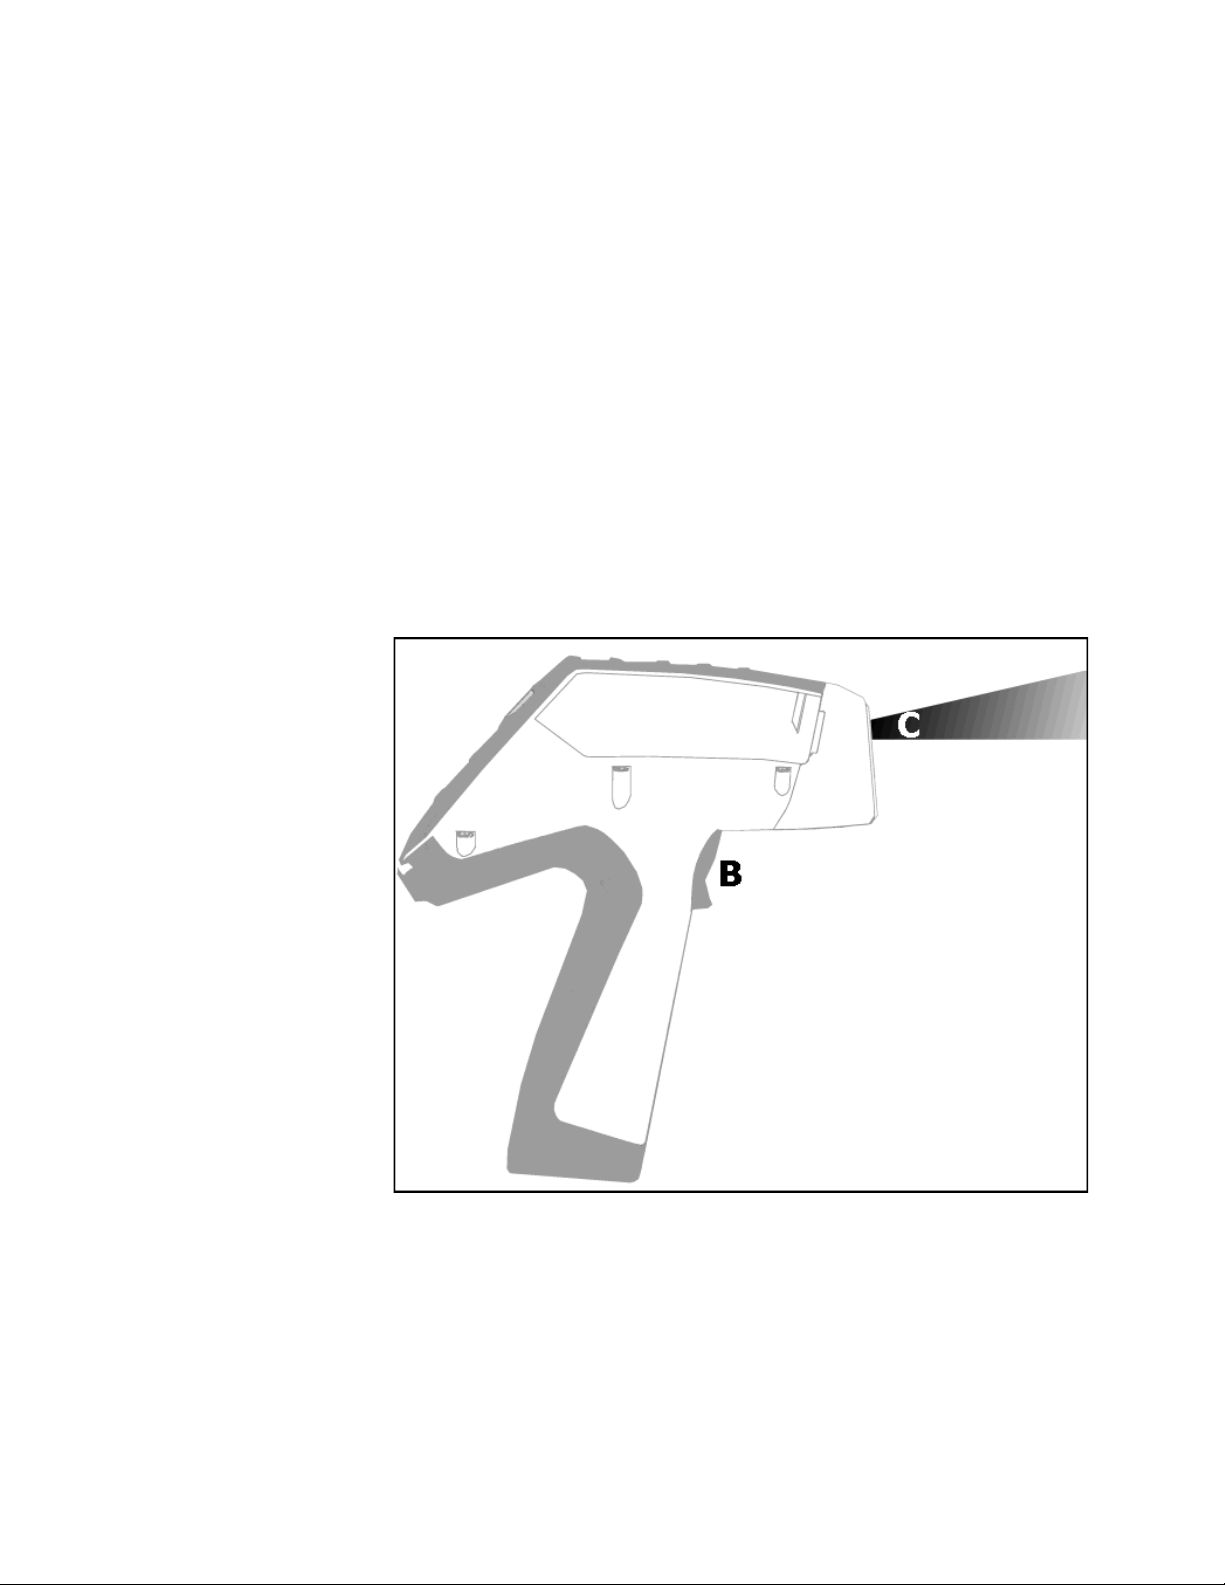
Know where the beam is
The primary beam is a directed beam out of the front of the analyzer that can have high dose
rates. The secondary beam, or scattered beam, has much lower dose rates.
Figure 1. Primary Beam
8 Niton XL2 Analyzer User’s Guide Thermo Scientific
Page 17

2
Using Your Analyzer
Safely and Effectively Using Your Analyzer
Figure 2. Secondary (Scattered) Beam
The Shutter-Open Indicator Lights
When the lights are flashing, the primary beam is on, and radiation is being emitted from the
front of the analyzer.
Figure 3. The X-ray Beam Indicator Lights
Thermo Scientific Niton XL2 Analyzer User’s Guide 9
Page 18

2
Using Your Analyzer
Safely and Effectively Using Your Analyzer
Handle and Use with Respect
Avoid holding the front of the analyzer when the x-ray tube is energized and the shutter is
open. Never point the instrument at yourself or anyone else when the shutter is open and the
x-ray tube is energized. Never look into the path of the primary beam.
Follow a Radiation Protection Program
Your organization should establish, document, and follow a Radiation Protection Program.
An example of such a program can be found on the resource CD (provided with the
instrument).
Take Proper Care of your Niton XL2
Keeping your analyzer maintained in good condition will help minimize the risk of accidental
exposure. Mechanical malfunction of the shutter can be avoided by maintaining the
measurement window, as described in the User Guide. This prevents foreign objects from
entering your analyzer
Avoid Over-Exposures
Direct contact with the window could result in overexposures in the times indicated inTable 3
below.
Table 3. Potential Exposure Limit Times
Location of Dose Limit Time to Reach Limit
Deep Dose /
Whole Body
Shallow Dose /
Extremities
Member of Public
(i.e. untrained
operator)
Extremity is defined by the NRC as the hand, elbow, arm below the elbow, foot, knee, or leg
below the knee. Whole Body is defined by the NRC as the head, trunk (including male
gonads), arms above the elbow, or legs above the knee.
Safe Handling of Samples
5 rem (50 mSv) 2.1 minutes
50 rem (500 mSv) 0.95 minutes
0.1 to 5 rem (1 to 50 mSv) 2.5 to 9.5 seconds
As mentioned many times in this chapter, never place any part of your body in the path of the
x-ray beam. There is always a safe way to handle samples whether they are small, irregularly
shaped, or of low density. Never look into the path of the primary beam.
10 Niton XL2 Analyzer User’s Guide Thermo Scientific
Page 19

Small Samples
A small sample would be any sample that is smaller than the measurement window. Small
samples present a unique risk because they don’t block the entire beam path. The difficulty
with placing small samples down on a work surface to analyze them is that you may get
readings from the work surface that interfere with analytical results. A test stand is an effective
way of analyzing small samples accurately and safely. Never hold samples during analysis or
look into the path of the primary beam.
Irregularly Shaped Samples
Irregularly shaped samples may not allow the proximity button to be depressed, or they may
not entirely cover the primary beam and cause additional scattering. A back scatter shield is a
safe way of reducing your radiation exposure while effectively analyzing an irregularly shaped
sample.
Light Materials (such as plastics).
2
Using Your Analyzer
Safely and Effectively Using Your Analyzer
X-rays are attenuated more by denser and higher atomic mass materials, and less through
lighter materials such as plastic. This causes higher dose rates in the scattered radiation. If you
are frequently handling low density samples, you should consider the use of test stands,
backscatter shields, or the equivalent.
Thermo Scientific Niton XL2 Analyzer User’s Guide 11
Page 20

2
Using Your Analyzer
Safely and Effectively Using Your Analyzer
Niton XL2 Radiation Profile
Radiation Meter Information
Model: Bicron MicroRem
SN: 2057
Cal Due: 10/10/2009
Background Radiation Level
<0.01 mr/hr
Table 4 - Scatter Measurements off various substrates - Dose Rates in mRem/hr
Table 4. Niton XL2 Radiation Profile - Scatter Measurements - mRem/hr
kV uA Range Substrate Max @ 5cm Max @ 30 cm Max @ Trigger
15 80 Low Aluminum <0.01 <0.01 <0.01
15 80 Low Stainless <0.01 <0.01 <0.01
15 80 Low Plastic <0.01 <0.01 <0.01
15 80 Low Soil <0.01 <0.01 <0.01
20 80 Low Aluminum <0.01 <0.01 <0.01
20 80 Low Stainless <0.01 <0.01 <0.01
20 80 Low Plastic 3 <0.01 <0.01
20 80 Low Soil <0.01 <0.01 <0.01
45 44 Main Aluminum 1.2 0.017 0.01
45 44 Main Stainless 1.6 <0.01 <0.01
45 44 Main Plastic 19 1.2 0.15
45 44 Main Soil 2.0 0.050 0.025
12 Niton XL2 Analyzer User’s Guide Thermo Scientific
Page 21

Safely and Effectively Using Your Analyzer
Table 5 - Scatter Measurements off various substrates - Dose Rates in µSv/hr
Table 5. Niton XL2 Radiation Profile - Scatter Measurements - µSv/hr
kV uA Range Substrate Max @ 5cm Max @ 30 cm Max @ Trigger
15 80 Low Aluminum <0.1 <0.1 <0.1
15 80 Low Stainless <0.1 <0.1 <0.1
15 80 Low Plastic <0.1 <0.1 <0.1
15 80 Low Soil <0.1 <0.1 <0.1
20 80 Low Aluminum <0.1 <0.1 <0.1
20 80 Low Stainless <0.1 <0.1 <0.1
2
Using Your Analyzer
20 80 Low Plastic 30 <0.1 <0.1
20 80 Low Soil <0.1 <0.1 <0.1
45 44 Main Aluminum 12 0.17 0.1
45 44 Main Stainless 16 <0.1 <0.1
45 44 Main Plastic 190 12 1.5
45 44 Main Soil 20 0.50 0.25
Notes:
Scatter measurements were taken at a radius of 5 or 30 cm around the nose of the analyzer
with the highest scatter dose rate being recorded.
Thermo Scientific Niton XL2 Analyzer User’s Guide 13
Page 22

2
Using Your Analyzer
Safely and Effectively Using Your Analyzer
Table 6 - In Beam Measurements - Dose Rates in Rem/hr
Table 6. Niton XL2 Radiation Profile - In Beam Measurements - Rem/hr
kV uA Range Contact Deep Contact Shallow 5cm Deep 30cm Deep
15 80 Low 7.9 230 2.1 0.088
20 80 Low 41 690 19 0.90
45 44 Main 45 150 7.4 0.70
Table 7 - In Beam Measurements - Dose Rates in mSv/hr
Table 7. Niton XL2 Radiation Profile - In Beam Measurements - mSv/hr
kV uA Range Contact Deep Contact Shallow 5cm Deep 30cm Deep
15 80 Low 79 2300 21 0.88
20 80 Low 410 6900 190 9.0
45 44 Main 450 1500 74 7.0
Notes:
In beam dose rates were measured using optically stimulated luminescent (OSL) dosimeters.
Reported results are based on measurement results that have been reduced to 2 significant
digits by rounding up. For example, a measurement result of 1441 would be reported as
1500.
14 Niton XL2 Analyzer User’s Guide Thermo Scientific
Page 23

Safely and Effectively Using Your Analyzer
Niton XL2 GOLDD Radiation Profile
Table 8 - Niton XL2 GOLDD Radiation profile- Scatter measurements - mRem/hr
Table 8. Niton XL2 GOLDD Radiation Profile - Scatter Measurements - mRem/hr
kV uA Range Substrate Max @ 5cm Max @ 30 cm Max @ Trigger
8 100 Light Plastic <0.01 <0.01 <0.01
8 100 Light Stainless <0.01 <0.01 <0.01
8 100 Light Soil <0.01 <0.01 <0.01
45 44.4 Main Aluminum 0.5 <0.01 <0.01
45 44.4 Main Stainless 0.01 <0.01 <0.01
2
Using Your Analyzer
45 44.4 Main Plastic 5.0 0.4 0.8
45 44.4 Main Soil 0.9 <0.01 <0.01
Table 9 - Niton XL2 GOLDD Radiation Profile - Scatter Measurements - µSv/hr
Table 9. Niton XL2 GOLDD Radiation Profile - Scatter Measurements - µSv/hr
kV uA Range Substrate Max @ 5cm Max @ 30 cm Max @ Trigger
8 100 Light Plastic <0.1 <0.1 <0.1
8 100 Light Stainless <0.1 <0.1 <0.1
8 100 Light Soil <0.1 <0.1 <0.1
45 44.4 Main Aluminum 5.0 <0.1 <0.1
45 44.4 Main Stainless 0.1 <0.1 <0.1
45 44.4 Main Plastic 50 4.0 8.0
45 44.4 Main Soil 9.0 <0.1 <0.1
Notes:
Scatter measurements were taken at a radius of 5 or 30 cm around the nose of the analyzer
with the highest scatter dose rate being recorded.
Thermo Scientific Niton XL2 Analyzer User’s Guide 15
Page 24

2
Using Your Analyzer
Safely and Effectively Using Your Analyzer
Table 10 - Niton XL2 GOLDD Radiation Profile - In Beam Measurements - Rem/hr
Table 10. Niton XL2 GOLDD Radiation Profile - In Beam Measurements - Rem/hr
kV uA Range Contact Deep Contact Shallow 5cm Deep 30 cm Deep
8 100 Light 0.01 980 0.002 <0.001
45 44.4 Main 39 130 8.1 0.51
Table 11 - Niton XL2 GOLDD Radiation Profile - In Beam Measurements - mSv/hr
Table 11. Niton XL2 GOLDD Radiation Profile - In Beam Measurements - mSv/hr
kV uA Range Contact Deep Contact Shallow 5cm Deep 30 cm Deep
8 100 Light 0.1 9800 0.02 <0.01
45 44.4 Main 390 1300 81 5.1
Notes:
In beam dose rates were measured using optically stimulated luminescent (OSL) dosimeters.
Reported results are based on measurement results that have been reduced to 2 significant
digits by rounding up. For example, a measurement result of 1441 would be reported as
1500.
16 Niton XL2 Analyzer User’s Guide Thermo Scientific
Page 25
2
Using Your Analyzer
Safely and Effectively Using Your Analyzer
Figure 4. Primary and Secondary Dose Locations (Not to Scale)
Thermo Scientific Niton XL2 Analyzer User’s Guide 17
Page 26

2
Using Your Analyzer
Safely and Effectively Using Your Analyzer
Primary Radiation
Primary radiation is radiation that is produced by the analyzer and emitted out through the
kapton measurement window. Individuals should never place any part of their body in the
primary beam path when the x-ray tube is on. There should always be a sample in contact
with the measurement window when the x-ray tube is on. The sample will absorb most of the
primary-beam radiation unless it is smaller than the instrument's measurement window or of
low atomic mass, low density, and/or very thin. Caution should be taken when analyzing
samples that are small, thin, and/or low in atomic mass or density as they may allow much
more of the primary beam to escape. In-beam primary radiation dose rates for the Niton XL2
are listed in Table 6 andTable 7 - or Table 10 and Table 11 for the Niton XL2 GOLDD -and
heir location identified relative to the analyzer in Figure 4as Dose Point C.
t
Secondary Radiation
Under conditions of normal and proper use, individuals can be exposed to secondary (or
"scattered") radiation. Secondary radiation is low-level radiation that emanates from the
sample being analyzed as a result of primary beam radiation scattering in the sample or
primary beam radiation inducing fluorescent x-rays in the sample. Dose points A, A’ and B in
Figure 4are examples of where you can encounter secondary radiation. The magnitude of this
secondary radiation is sample dependent. Higher atomic mass and density samples such as
steel will emit the lowest levels as they absorb most primary and secondary radiations. Lower
atomic mass and density samples such as aluminum, wood, and especially plastic, will produce
higher levels of secondary radiation. Secondary radiation dose rates for the Niton XL2 are
listed in Table 4and Table 5- or Table 8 and Table 9 for the Niton XL2 GOLDD - for a few
ommon sample types over a wide range of densities.
c
The operator is reminded that one should never hold samples during analysis, doing so will
result in higher than necessary exposure to secondary radiation and could expose the operator
directly to the much higher primary-beam dose rates.
Deep and Shallow Dose
You will find in Table 6, Table 7, Table 10, and Table 11that shallow dose rates are listed for
some dose points. All dose rates listed in these four Tables are deep dose unless they are
specifically identified as shallow dose. Deep dose is dose from penetrating radiation that is
delivered to both skin and underlying tissues and organs and is the type most commonly
referred to when describing external radiation hazards. Occupational deep dose is limited to a
maximum of 5 rem (50 mSv) per year in the United States and most countries internationally.
Deep dose is measured at 1.0 cm below the skin surface.
18 Niton XL2 Analyzer User’s Guide Thermo Scientific
Page 27

Shallow dose is often referred to as "skin dose" because it is a result of low penetrating
radiation that only interacts with the skin. Shallow dose is limited to a maximum of 50 rem
(500 mSv) per year in the United States and most countries internationally. Shallow dose is
listed for primary in-beam dose points only because the low penetrating radiation that causes
shallow dose is nearly all absorbed by a sample and does not produce any significant secondary
radiation. Shallow dose is measured at a point 0.007 cm below the surface.
Proper and Improper Operation
Storage and Transportation
Storage
Regulations in nearly all locations will require that you store your analyzer locked in a secured
area to prevent access, use, and/or removal by unauthorized individuals. Storage requirements
will vary by location, particularly with regard to storage at temporary job sites or away from
your primary storage location such as hotels and motels and in vehicles. You should contact
your local Radiation Control Authority to identify the specific storage requirements in your
jurisdiction.
2
Using Your Analyzer
Proper and Improper Operation
Transportation
There are no X-ray tube specific US Department of Transportation (DOT) or International
Air Transport Association (IATA) radiation regulations regarding shipping the Niton XL2
analyzer. It is recommended that you ship the analyzer in its carrying case and an over-pack to
protect the sensitive measuring equipment inside the analyzer. Do NOT ship the analyzer
with the battery pack connected to the analyzer.
Lost or Stolen Instrument
Note THIS PAGE CONTAINS EMERGENCY CONTACT INFORMATION THAT
SHOULD BE AVAILABLE TO THE OPERATOR AT ALL TIMES.
If the Niton XL2 analyzer is lost or stolen, notify your Radiation Safety Officer (RSO) or the
equivalent responsible individual at your company or institution immediately. Your
company's RSO, as well as other important emergency contacts, are listed below. Your
company RSO may need to notify the x-ray tube regulatory authority and the local police. It
is also recommended that a notification is made to Thermo Fisher Scientific.
Damaged Instrument
Minor Damage
If the instrument is intact but there is indication of an unsafe condition such as a cracked case,
a shutter mechanism failure, or the lights remain flashing after a measurement is terminated,
follow these steps:
Thermo Scientific Niton XL2 Analyzer User’s Guide 19
Page 28

2
Using Your Analyzer
Proper and Improper Operation
1. Stop using the instrument
2. Remove the battery. The x-ray tube can not produce radiation when the battery is
disconnected. The instrument is now safe to handle.
3. Place the instrument securely in the holster.
4. Place the instrument in the carrying case that came with the instrument.
5. Notify your Radiation Safety Officer (RSO) or the equivalent responsible individual at
your company or institution immediately.
6. You or your RSO should call Thermo Fisher Scientific at one of their contact numbers
listed below for additional instructions and guidance.
Major Damage
If the instrument is severely damaged:
1. Perform the same steps as described above for minor damage. There will be no radiation
hazard as long as the battery is removed from the instrument.
2. Place all components in a plastic bag and contact Thermo Fisher Scientific.
20 Niton XL2 Analyzer User’s Guide Thermo Scientific
Page 29

Emergency Response Information
Please Complete the Following Emergency Response Information and Keep with the Analyzer
at All Times
NITON ANALYZER EMERGENCY CONTACT INFORMATION
The Company RSO is:______________________________________
RSO Telephone Number:____________________________________
Regulatory Agency Emergency Number:________________________
Local Fire Department:______________________________________
Local or State Police Department:_____________________________
Thermo Fisher Scientific's Niton Analyzer Contact Numbers
Main Number (USA): (800) 875-1578
2
Using Your Analyzer
Proper and Improper Operation
Europe
Asia
Additional Radiation Emergency #'s: (978) 790-8269 or (617) 901-3125
Outside the USA - Local Niton Service Center:___________________
Niton Analyzers Europe
Munich, Germany
Phone: +49 89 3681 380
Fax: +49 89 3681 3830
Email: niton.eur@thermofisher.com
Niton Analyzers Asia
Hong Kong
Phone: +852 2869-6669
Fax: +852 2869-6665
Email: niton.asia@thermofisher.com
Thermo Scientific Niton XL2 Analyzer User’s Guide 21
Page 30

2
Using Your Analyzer
Proper and Improper Operation
Registration and Licensing
As a user of a Niton XL2 analyzer, you may be required to register or obtain a license with
your local radiation control authority. In the US, if you intend to do work with your analyzer
in states other than your own, you may be required to register there as well. See the Safety and
Compliance Web Hub for much more information.
Regarding Safety Devices for the Open Beam Configuration:
In the US, you may be required to file for an exemption, "variance letter", with your state if
there is a requirement for a safety device that would prevent entry of an extremity into the
primary beam. If you need assistance with the exemption letter, you may contact the radiation
safety group.
Registration and Licensing FAQ
See the “Registration and Licensing FAQ” on page 433
22 Niton XL2 Analyzer User’s Guide Thermo Scientific
Page 31

How to Analyze
To analyze samples, from the main menu select sample type, and then click on the appropriate
Mode icon. Once in the Selection Screen you have a number of sub-modes to select from.
depending on how your instrument is calibrated. See the Example Path below.
3
How to Analyze
Thermo Scientific Niton XL2 Analyzer User’s Guide 23
Page 32

3
How to Analyze
General Analysis
Figure 5. The Metals Analysis Menu Path (Example)
Element Ranges and Lists
From the Element Range Screen, select the Element List Button to display the Element List
for the Range you want to use. This list shows the elements that the Range is best designed to
detect. See Adjusting the Element Range for details.
igure 6. The Element Range Screen
F
General Analysis
Note Each user should read the Thermo Scientific Niton XL2 User’s Guide carefully before
initiating measurements with the system. Users are strongly urged to attend the Thermo
Scientific Niton XRF Analyzer Radiation Safety and Operations Training courses offered
regularly, or the web-based trainings. For more information, visit www.thermo.com/niton.
PREPARATORY TASKS
Attach a charged battery to the analyzer and turn it on. Follow the screen instructions and
“Log On” as the operator using either the default password or a custom one as designated by
the user in an NDU file.
Wait five (5) minutes before using the analyzer, allowing the instrument electronics to
stabilize.
24 Niton XL2 Analyzer User’s Guide Thermo Scientific
Page 33

3
How to Analyze
General Analysis
Verify that the date is set properly for data tracking purposes.
From the Main Menu, select the System icon, then the Specs icon. The date will be displayed
for verification. If the date is incorrect, correct it prior to proceeding. This can be done by
“Closing” out of the Specs screen and selecting the Date & Time icon. Detailed information
on this procedure is available in Setting the Date and Time.
(Optional) Connect the analyzer to a computer via the included serial cable, USB cable, or
Bluetooth™ wireless module. (Consult “Using Your Analyzer With Your PC” on page 109for
etails, if necessary.)
d
During analysis and detector calibrations, it is important to ensure that the analyzer is not
exposed to strong electromagnetic fields, including those produced by computer monitors,
hard drives, cellular telephones, walkie talkies, etc. Keep a minimum two (2) feet (0.7 meters)
distance between the analyzer and electronic devices.
From the Main Menu, select System Check icon then the Yes button. (Figure 1.)
System Check calibrates the detector and verifies it is operating to specifications. After starting
the process, no further user interaction is required during this operation. When the
instrument is finished performing the check, the unit will show either “System OK” or one of
the failure errors.
If the unit shows a failure error, then perform a second System Check by clicking Recheck. If
the unit still does not show a “System OK,” please contact Thermo Scientific Niton Analyzers
toll-free in the USA at (800) 875-1578, +1 978 670-7460, niton@thermofisher.com, or
contact your local Niton Analyzers representative for assistance.
Thermo Scientific Niton XL2 Analyzer User’s Guide 25
Page 34

3
How to Analyze
General Analysis
Figure 7. System Check Menu Path
Thermo Scientific Niton XL2 analyzers are equipped with excitation filters that optimize the
analyzers’ sensitivity for various elements. The “Main Range” filter provides optimum
sensitivity for the elements manganese (Mn) through bismuth (Bi). The “Low Range” filter is
used to optimize the sensitivity for the elements from titanium (Ti) through chromium (Cr).
Note that the main range filter can be used to analyze Ti, V and Cr, but the sensitivity is not
as good as when using the low filter. The "Light Range" filter is available only with He-purged
and GOLDD technology analyzers, and is typically used in light element analysis. The
amount of time that the analyzer spends in each filter position is user definable, but the
default settings should be used unless there is reason to change them. Please note that the
analyzer will continue alternating excitation filters until the user selectable maximum analysis
time is reached or the operator terminates the measurement.
Figure 8. Setting Element Ranges
Verify instrument measurement accuracy using the supplied reference material (RM) supplied
with the analyzer.
Test the factory-supplied reference standard (or other approved check sample) based on a 30s
measurement using main range filter only. If the sample is correctly identified and all major
elements read within calculated acceptance limits (within the low and high values of factory
readings found on the QC sheet, proceed to General Testing Protocol section
If the analyzer reports values outside the acceptance tolerance ranges specified in the tables,
repeat the detector calibration then repeat the reference sample analysis.
If the analyzer again fails to meet the acceptance tolerance ranges specified in the tables, please
contact Thermo Scientific Niton Analyzers or your local representative for assistance.
26 Niton XL2 Analyzer User’s Guide Thermo Scientific
Page 35

GENERAL TESTING PROTOCOL
Good surface preparation is essential for obtaining accurate test results. All non- representative
material (e.g., paint, coating, scale) must be removed prior to testing. An approximately
2-inch-square section of surface should be cleaned down to the material to be analyzed. See
the Resource Guide for information on Sample Preparation.
The analyzer will often display a correct alloy identification and/or accurate chemistry result
before the specified time interval. If the accuracy meets the user’s requirements, it is not
necessary to measure for the full time.
Longer measurements might be necessary if low concentrations of elements must be
determined.
INSTRUMENT QC
Measure the supplied reference calibration check sample AT LEAST once a shift. If correct,
continue work. If incorrect, redo System Check and re-take the past 2 hours of results.
3
How to Analyze
General Analysis
UNDERSIZED OR NON-CONTACT SAMPLES
(Samples that do not make contact with or that do not fully cover the measurement aperture)
For samples that do not fully cover the measurement aperture, increase the testing time by
increasing the time in inverse proportion to the decrease in percentage of aperture covered.
For example: a rod only covers ½ of the aperture, so increase the measurement time by two
(e.g., from 10 to 20 seconds per filter for alloy chemistry).
The best procedure to measure undersized samples is to use the Thermo Scientific Niton
portable test stand (optional), which is shielded to prevent radiation exposure to the operator.
An undersized sample may alternately be measured while lying on another material. Results
may be affected by the signal coming from the underlying material itself. Use only pure
aluminum, pure plastic, or clean wood and employ the Disable Al feature. Use the Tools
Menu, then select Disable Al, and check the underlying surface itself to be sure no metals are
present. Be sure to use the Tools Menu and select Enable Al before testing aluminum alloys.
Thermo Scientific Niton XL2 Analyzer User’s Guide 27
Page 36

3
How to Analyze
General Analysis
28 Niton XL2 Analyzer User’s Guide Thermo Scientific
Page 37

Basic Operation
Taking a Sample Analysis
4
Basic Operation
Taking a Sample Analysis
1. Clean the sample to be analyzed so it is free of all surface contamination.
Thermo Scientific Niton XL2 Analyzer User’s Guide 29
Page 38

4
Basic Operation
Taking a Sample Analysis
2. Place the analyzer so the sample is covered by the analysis window.
30 Niton XL2 Analyzer User’s Guide Thermo Scientific
Page 39

4
Basic Operation
Taking a Sample Analysis
3. Select the Sample Type Icon.
4. Select the proper Mode (in this case Mining Cu/Zn) from the Mode Menu.
Thermo Scientific Niton XL2 Analyzer User’s Guide 31
Page 40

4
Basic Operation
Taking a Sample Analysis
Note See “Analysis Modes” on page 37. for more information on the Modes available.
5. Select the Analyze Icon.
32 Niton XL2 Analyzer User’s Guide Thermo Scientific
Page 41

4
Basic Operation
Taking a Sample Analysis
5a. Select Data Entryif you wish todo any data entry.
Thermo Scientific Niton XL2 Analyzer User’s Guide 33
Page 42

4
Basic Operation
Taking a Sample Analysis
5b and 5c. Enter the data on the sample using the Virtual Keyboard.
34 Niton XL2 Analyzer User’s Guide Thermo Scientific
Page 43

4
Basic Operation
Taking a Sample Analysis
6. Initiate a Reading by pressing the trigger.
7. When the sample has been sufficiently analyzed, release the trigger.
Thermo Scientific Niton XL2 Analyzer User’s Guide 35
Page 44

4
Basic Operation
Taking a Sample Analysis
8. View the composition returned.
36 Niton XL2 Analyzer User’s Guide Thermo Scientific
Page 45

4
Basic Operation
Analysis Modes
9. Remove the sample.
Analysis Modes
Your analyzer has several Analysis Modes. Which Analysis Mode you should use depends on
the nature of the sample you are attempting to analyze.
General Metals Mode
Use this mode to analyze samples entirely composed of metal alloys. This mode will attempt
to return an Alloy Grade Identification by matching the analyzed composition of the sample
with the nominal composition of alloys in the analyzer's Alloy Grade Library. It will also
return an elemental composition of the alloy as analyzed. Alloy Composition is output by
default in terms of percent of composition by weight.
See “Using General Metals Mode” on page 39.
Thermo Scientific Niton XL2 Analyzer User’s Guide 37
Page 46

4
Basic Operation
Analysis Modes
Electronic Metals Mode
Use this mode to analyze electronic component samples - circuit boards, chips, etc. This mode
will attempt to return an Alloy Grade Identification by matching the analyzed composition of
the sample with the nominal composition of electronic alloys in the analyzer's Alloy Grade
Library. It will also return an elemental composition of the electronic alloy as analyzed.
Electronic Metal Composition is outputby default in terms of percent of composition by
weight.
See “Using Electronic Metals Mode” on page 40.
Precious Metals Mode
Use this mode to analyze samples composed primarily of precious metals. This mode will
attempt to return an Alloy Grade Identification by matching the analyzed composition of the
sample with the nominal composition of alloys in the analyzer's Precious Alloy Grade Library.
It will also return an elemental composition of the precious metal sample as analyzed. Precious
Alloy Composition is outputby default in terms of parts per million.
See “Using Precious Metals Mode” on page 40.
Plastics Mode
Use this mode to analyze samples composed primarily of plastic. This mode will return an
elemental composition of the plastic sample as analyzed. Plastic Composition is outputby
default in terms of parts per million.
See “Using Plastics Mode” on page 42.
Soils Mode
Use this mode to analyze samples composed primarily of soil and rock. This mode will return
an elemental composition of the soil sample as analyzed. Soil Composition is outputby
default in terms of parts per million.
See “Using Soils Mode” on page 42.
Mining Cu/Zn Mode
Use this mode to analyze samples composed of potential metal ore - rock containing high
proportions of metal - and containing Cu and/or Zn. This mode will return an elemental
composition of the ore sample as analyzed. Ore Composition is outputby default in terms of
percent of composition by weight.
See “Using Mining Cu/Zn Mode” on page 43.
38 Niton XL2 Analyzer User’s Guide Thermo Scientific
Page 47

Mining Ta/Hf Mode
Use this mode to analyze samples composedof potential metal ore- rock containing high
proportions of metal - and containing Ta and/or Hf. This mode will return an elemental
composition of the ore sample as analyzed. Ore Composition is outputby default in terms of
percent of composition by weight.
See “Using Mining Ta/Hf Mode” on page 44.
TestAll Mode
Use this mode to analyze samples composed of unknown and/or mixed composition, such as
toys and consumer products. This mode will attempt to return a general Material
Identification by comparing the analysis with other general types of materials. It will select the
proper sub-mode for analysis and return an elemental composition of the sample as analyzed.
Material Elemental Composition is outputby default in terms of parts per million.
See “Using TestAll Mode” on page 44.
4
Basic Operation
Analysis Modes
TestAll Geo Mode
Use this mode to analyze powder, mineral, and ore samples without first determining whether
the samples would best be analyzed with Mining or Soil Mode. This mode uses both the
Compton Normalization calibration (Soil) and the Fundamental Parameters calibration
(Mining) to determine whether the soil calibration is acceptable or whether the total metal
content is too high for Compton mode. It will then return an elemental composition of the
sample as analyzed. If the sample can be analyzed via soil mode, then the analyzer will display
results from both Soil and Mining Modes in one unified list. If both calibrations contain the
same element, then the mode that has the lower detection limit will be displayed. Material
Elemental Composition is outputby default in terms of both parts per million (mg/kg) and
percent of composition by weight, with 0.10% being the cutoff point.
Note Due to the nature of this mode, your analyzer will only use factory calibrations. User
modified Cal Factors will not be available.
See “Using TestAll Geo Mode” on page 44.
Using General Metals Mode
1. Clean the sample to be analyzed so it is free of all surface contamination, grinding the
surface if appropriate.
2. Place the analyzer so that the sample covers the analysis window.
3. Select the Mode icon.
Thermo Scientific Niton XL2 Analyzer User’s Guide 39
Page 48

4
Basic Operation
Analysis Modes
a. Select General Metals from the Mode Menu.
4. Select the Analyze icon.
a. Select the Data Button if you wish to do any data entry.
b. Enter the data on the sample using the Virtual Keyboard.
5. Initiate the analysis.
6. When the sample has been sufficiently analyzed, stop the analysis.
7. View the composition returned.
8. Remove the sample.
Using Electronic Metals Mode
1. Clean the sample to be analyzed so it is free of all surface contamination.
2. Place the analyzer so that the sample covers the analysis window.
3. Select the Mode icon.
a. Select Electronic Metals from the Mode Menu.
4. Select the Analyze icon.
a. Select the Data Button if you wish to do any data entry.
b. Enter the data on the sample using the Virtual Keyboard.
5. Initiate the analysis.
6. When the sample has been sufficiently analyzed, stop the analysis.
7. View the composition returned.
8. Remove the sample.
Using Precious Metals Mode
1. Clean the sample to be analyzed so it is free of all surface contamination.
2. Place the analyzer so that the sample covers the analysis window.
3. Select the Mode icon.
a. Select Precious Metals from the Mode Menu.
4. Select the Analyze icon.
40 Niton XL2 Analyzer User’s Guide Thermo Scientific
Page 49

a. Select the Data Button if you wish to do any data entry.
b. Enter the data on the sample using the Virtual Keyboard.
5. Initiate the analysis.
6. When the sample has been sufficiently analyzed, stop the analysis.
7. View the composition returned.
8. Remove the sample.
4
Basic Operation
Analysis Modes
Thermo Scientific Niton XL2 Analyzer User’s Guide 41
Page 50

4
Basic Operation
Analysis Modes
Using Plastics Mode
1. Clean the sample to be analyzed so it is free of all surface contamination.
2. Place the analyzer so that the sample covers the analysis window.
3. Select the Mode icon.
a. Select Plastics from the Mode Menu.
4. Select the Analyze icon.
a. Select the Data Button if you wish to do any data entry.
b. Enter the data on the sample using the Virtual Keyboard.
5. Initiate the analysis.
6. When the sample has been sufficiently analyzed, stop the analysis.
Using Soils Mode
7. View the composition returned.
8. Remove the sample.
1. Pack the sample into a Sample Cup.
a. Clean the sample to be analyzed so it is free of all surface contamination.
2. Place the analyzer so that the sample covers the analysis window.
3. Select the Mode icon.
a. Select Soils from the Mode Menu.
4. Select the Analyze icon.
a. Select the Data Button if you wish to do any data entry.
b. Enter the data on the sample using the Virtual Keyboard.
5. Initiate the analysis.
6. When the sample has been sufficiently analyzed, stop the analysis.
7. View the composition returned.
8. Remove the sample.
42 Niton XL2 Analyzer User’s Guide Thermo Scientific
Page 51

Using Mining Cu/Zn Mode
1. Clean the sample to be analyzed so it is free of all surface contamination.
2. Place the analyzer so that the sample covers the analysis window.
3. Select the Mode icon.
a. Select Mining Cu/Zn from the Mode Menu.
4. Select the Analyze icon.
a. Select the Data Button if you wish to do any data entry.
b. Enter the data on the sample using the Virtual Keyboard.
5. Initiate the analysis.
6. When the sample has been sufficiently analyzed, stop the analysis.
4
Basic Operation
Analysis Modes
7. View the composition returned.
8. Remove the sample.
Thermo Scientific Niton XL2 Analyzer User’s Guide 43
Page 52

4
Basic Operation
Analysis Modes
Using Mining Ta/Hf Mode
1. Clean the sample to be analyzed so it is free of all surface contamination.
2. Place the analyzer so that the sample covers the analysis window.
3. Select the Mode icon.
a. Select Mining Ta/Hf from the Mode Menu.
4. Select the Analyze icon.
a. Select the Data Button if you wish to do any data entry.
b. Enter the data on the sample using the Virtual Keyboard.
5. Initiate the analysis.
6. When the sample has been sufficiently analyzed, stop the analysis.
7. View the composition returned.
8. Remove the sample.
Using TestAll Mode
1. Clean the sample to be analyzed so it is free of all surface contamination.
2. Place the analyzer so that the sample covers the analysis window.
3. Select the Mode icon.
a. Select TestAll from the Mode Menu.
4. Select the Analyze icon.
a. Select the Data Button if you wish to do any data entry.
b. Enter the data on the sample using the Virtual Keyboard.
5. Initiate the analysis.
6. When the sample has been sufficiently analyzed, stop the analysis.
7. View the composition returned.
8. Remove the sample.
Using TestAll Geo Mode
1. Clean the sample to be analyzed so it is free of all surface contamination.
44 Niton XL2 Analyzer User’s Guide Thermo Scientific
Page 53

2. Place the analyzer so that the sample covers the analysis window.
3. Select the Mode icon.
a. Select TestAll Geo from the Mode Menu.
4. Select the Analyze icon.
a. Select the Data Button if you wish to do any data entry.
b. Enter the data on the sample using the Virtual Keyboard.
5. Initiate the analysis.
6. When the sample has been sufficiently analyzed, stop the analysis.
7. View the composition returned.
8. Remove the sample.
4
Basic Operation
Analysis Modes
Thermo Scientific Niton XL2 Analyzer User’s Guide 45
Page 54

4
Basic Operation
Analysis Modes
46 Niton XL2 Analyzer User’s Guide Thermo Scientific
Page 55

Common Operations
Metal Sample Prep
Up until recently, sample preparation was not a big worry for XRF metals analysis, as the
LOD of the analyzer was seldom low enough for any but the most heavy contamination to be
intrusive; but recent developments such as He-purged analysis have brought analysis to a level
where even light surface contamination can skew an analysis.
You should always prepare your samples before analysis, especially when using He-purged
analysis, as these analyzers will see even trace amounts of contaminants. Oils from fingerprints
and other body contact, lint, oxidation materials, and abrasive materials used in cleaning can
all skew readings if not removed. Sample preparation is simple and not time consuming, and
usually well worth the effort.
The following is a list of problems that need correction before testing:
5
Common Operations
Metal Sample Prep
• Oxidation or Rust may produce an increase or decrease in one or more element test
values unless we remove the rust or oxidation and expose the raw metal.
• Paint may contain several elements which need to be tested at lower levels within
metal alloys (Ti & Zn in white paint, Fe in red paint, Cr in green paint).
• Oil, grease or lubricates may contain high levels of the following elements: lithium,
aluminum, barium, strontium, molybdenum or calcium.
Plated surfaces may have high levels of the following elements: zinc, chromium, nickel, or
copper.
CAUTION Anything on the metal surface will become part of your test results!
Sample Analysis Preparation
You need to clear the surface of your samples of any paint, plating, or any oxidation such as
rust or verdigris before analysis. In order to accomplish this, you need the following:
• Isopropyl alcohol - not rubbing alcohol, which contains oils.
• Lint-free paper.
• Diamond paper - P/N 179-1202- cut into 1 inch/2.5 cm squares. Never re-use this
paper, as it may transfer contaminants to the surface of the sample from previous
cleanings. Depending on the state of the sample, several squares may be needed per
sample.
Thermo Scientific Niton XL2 Analyzer User’s Guide 47
Page 56

5
Common Operations
Metal Sample Prep
• A Sample Grinder for removing deeper surface contamination. Choice of grinding
wheel media also may be important, depending on what you are testing for. Never
re-use grinding media, as contaminants can be transferred from sample to sample on
the media itself.
For light contamination on hard metal reference standards, remove the oxidation by
scrubbing the dry sample lightly with the diamond paper square, using the fingers to maintain
pressure. If the diamond paper begins to load up with material, discard it and use a fresh
square. When the oxidation is removed, wipe the sample with lint-free paper soaked with
isopropyl alcohol to remove any oils or dust. Let the sample dry before attempting analysis.
For soft metal reference standards, wipe the sample with lint-free paper soaked with isopropyl
alcohol, then remove the oxidation by scrubbing the wet sample lightly with the diamond
paper square, using the fingers to maintain pressure. If the diamond paper begins to load up
with material, discard it and use a fresh square. When the oxidation is removed, wipe the
sample again with lint-free paper soaked with isopropyl alcohol to remove any oils or dust. Let
the sample dry before attempting analysis.
Oils, lint and dust can be removed by wiping the sample with lint-free paper soaked with
isopropyl alcohol. Let the sample dry before attempting analysis.
Surface Oxidation
With the exception of a limited number of metal types, most metal alloys form an oxide
covering on the surface when exposed to oxygen or air. This oxide covering is visible in carbon
and low alloy steel as a red colored substance called rust. Other metal alloys form oxidation
which is not always visible, but that does not mean that it is not present. If the test results for
low concentration elements are higher or lower than expected, remove the oxide coating by
grinding and retest. Follow proper safety procedures when changing discs or grinding
materials.
During a recent case study the effects of sample preparation became apparent. A customer
asked for low detection limits of nickel, chromium and copper in carbon steel pipe. The
reported chemistry of the purchased material is listed on the first line in the chart below. The
test results of a hand held Niton XL2t 900S GOLDD instrument appears in the second line
of the chart. The results from a test on the unground surface appear in the bottom line of the
chart. Note the values for nickel and copper in this carbon steel alloy in the chart below. The
oxidation on the surface of this pipe was not visibly egregious. We need to always be wary of
the presence of even low levels of oxidation and their possible effects on analytic accuracy.
Table 1. Comparative test results with and without grinding
Sample % Mn % Ni % Cr % Mo % Cu
Reported Chemistry 0.650 0.090 0.070 0.030 0.040
48 Niton XL2 Analyzer User’s Guide Thermo Scientific
Page 57

Table 1. Comparative test results with and without grinding
Test Results with Ground Surface 0.67 0.089 0.070 0.033 0.039
5
Common Operations
Metal Sample Prep
Test Results with Unground Surface
Painted Surfaces
Paint is a mixture of several items that are combined into a liquid which is applied to the
surface of materials such as metal. Once applied this liquid dries with time and adheres to the
surface of metal. Paint is used to protect or decorate the metal item. Paint can also be used to
identify or mark the metal during the manufacturing process.
Components of paint are divided into classifications of pigments, binders, solvents, additives
and fillers. The inorganic elements in pigments will contribute to increases in displayed values
for those elements if paint on the metal surface is not removed prior to testing. Be especially
careful of the presence of heavy elements, which can also act to shield x-rays from lighter
elements in the metal sample.
The following is a list of some of the most common components of paint:
White Paint
• Antimony (Sb)
• Lead (Pb)
0.61 0.178 0.081 0.033 0.514
Red Paint
• Titanium (Ti)
• Zinc (Zn)
• Cobalt (Co)
• Iron (Fe)
• Lead (Pb)
• Green Paint
• Chromium (Cr)
An experiment was conducted to determine the effect and severity of surface problems on
XRF results. Results from analyses of a 1541 alloy steel sample are shown below, before and
after surface grinding. The sample had painted markings, of light to medium thickness, on
the surface, as well as light rust. Note the change in titanium, zinc and cobalt levels after
surface grinding.
Thermo Scientific Niton XL2 Analyzer User’s Guide 49
Page 58

5
Common Operations
Metal Sample Prep
Table 2. Prepped and unprepped painted metal analysis
Sample Mn Ni Cr Mo Ti Zn Co
Ground Surface 1.49 0.04 0.03 0.004 0.011 0.0001 0.03
Unground Surface 1.34 0.01 0.04 0.011 2.507 1.751 0.21
Oil, Grease & Cutting Oils
Oil and grease contain a number of elements combined into a viscous substance and applied
to moving parts in order to reduce friction. Grease coatings can remain on component
surfaces after it has been removed from service. Grease can also be applied to a metal's surface
by accidental contact with other materials coated in heavy grease. Metals can also be coated in
oil as a result of cutting and machining processes in manufacturing.
Grease and oil may contain the following elements:
• Aluminum (Al)
• Zinc (Zn)
• Molybdenum (Mo)
• Sodium (Na)
• Calcium (Ca)
An experiment was performed to show how grease on metal surfaces affects XRF results. A
carbon steel sample was cleaned and ground as a control surface for the experiment. XRF tests
were performed on the control surface, and again after light and heavier layers of automotive
wheel bearing grease were applied to the surface of the steel sample. Results are shown below.
Note the elevated levels of molybdenum, cobalt and zinc from the grease.
Table 3. Clean and greased sample metal analysis
Sample Mn Ni Cr Mo Cu Co Zn
Clean Surface 1.18 0.001 0.041 0.004 0.001 0.001 0.019
Light Grease 1.07 0.001 0.001 0.067 0.033 0.322 0.416
Heavy Grease 0.96 0.001 0.001 0.500 0.062 1.760 3.430
If a sample's surface contains lubricants or cutting oil, use a solvent and a clean towel or rag to
remove them before analysis. You may then need to grind the surface to insure good results.
Clean first, grind second, test last.
50 Niton XL2 Analyzer User’s Guide Thermo Scientific
Page 59

Remember to follow safe techniques for handling and disposing of solvents and cleaning rags
Anodized, Plated and Galvanized Surfaces
Anodizing is the process of polarizing the metal surface into a passive state which protects it
against corrosion. This process is most often applied to aluminum alloys.
Galvanized steel is one of the most common of the coated surfaces. In this process, steel is
passed through a molten bath of a zinc alloy. Zinc reacts with the steel metal to form a
bonding layer on the steel surface. The zinc layer does not separate from the steel and forms a
protective layer that protects the steel from oxidation.
Galvanized layers are relatively thick compared to other plating elements and methods. When
grinding to remove the zinc coating, you will find increased zinc values even when you can see
the steel surface. Grind a little further and zinc values will disappear. Zinc clings to the surface
of the sanding disc, so you will need to frequently change discs.
Electroplating is another common practice of applying a coating which not only protects the
surface from oxidation, but also improves the base material's wear resistance, lubricity and
improves the overall aesthetics of the product. The electroplated coating is generally thinner
and more evenly applied than galvanizing. Electroplating has a wide range of elements and in
some situations there may be two or more different coatings on the same part.
5
Common Operations
Metal Sample Prep
The following is a partial list of elements that are used to plate the surface of base metals:
Ni, Cr, Cadmium (Cd), Tin (Sn), Zn, Al
Cordless Right Angle Drill
This style of drill is recommended for most surface preparation in the field because it gives the
operator the greatest amount of control, and thus safety, when grinding samples. When
moving a sanding disc on a conventional drill over a sample, forces tend to produce
movement the operator may find difficult to control. Control and stability are important in
grinding from effectiveness and safety perspectives.
A cordless right angle drill similar to the one pictured below is recommended for light to
medium surface removal. For materials with heavy oxidation such as carbon and low alloy
steel, an angle grinder, explained in the next section, is recommended. A kit with the drill,
batteries and charging units, can be purchased from ThermoFisher, or companies such as
DeWalt, Hitachi, Makita, Milwaukee or Ryobi.
Thermo Scientific Niton XL2 Analyzer User’s Guide 51
Page 60

5
Common Operations
Metal Sample Prep
Figure 1. Example of Right Angle Drill
A disc holder is needed with the drill to hold the sanding disc. (In the US, we recommend a
3.0 inch disc holder. It has a 0.25 inch shank to insert into the chuck of the drill.) If sanding
discs are ordered from a local supplier, attention should be paid to the method of attaching
the sanding disc to the disc holder. There are three types of connections: metal snap-on,
plastic twist and plastic snap-on.
52 Niton XL2 Analyzer User’s Guide Thermo Scientific
Page 61

5
Common Operations
Metal Sample Prep
Figure 2. Sanding Disc
Before attaching the grinder and sanding disc as pictured below, first remove the battery to
disable the grinder. Then insert the shaft of the disc holder into the drill and securely tighten
the chuck. Next, attach the appropriate sanding disc. The method of attachment will vary
depending upon the type of fastener on the sanding disc (snap-on or twist connectors).
Reinstall the battery and prepare for use.
Thermo Scientific Niton XL2 Analyzer User’s Guide 53
Page 62

5
Common Operations
Metal Sample Prep
Figure 3. Attaching the Sanding Disc 1
Figure 4. Attaching the Sanding Disc 2
54 Niton XL2 Analyzer User’s Guide Thermo Scientific
Page 63

Cordless Angle Grinder
A cordless angle grinder similar to the one pictured below will successfully remove medium to
heavy oxidation or paint. This grinder (which uses a 4.5 inch sanding disc with a rubber
backup pad) can be purchased from ThermoFisher or industrial tool manufactures like
DeWalt, Makita or Milwaukee.
5
Common Operations
Metal Sample Prep
Figure 5. Cordless Angle Grinder Kit
A grinder kit typically contains the grinder, a battery, and charging unit. If the kit contains a
grinding stone wheel, remove and dispose of it. Grinding stones are not to be used for XRF
sample preparation. A rubber backup pad and a retaining nut are needed to use with sanding
discs. (See picture below).
Thermo Scientific Niton XL2 Analyzer User’s Guide 55
Page 64

5
Common Operations
Metal Sample Prep
Figure 6. Rubber Backing Pad and Nut
In the US, sanding discs are 4.5 inch diameter and can be purchased in various grit sizes of 36
to 120. The surface abrasive can be one of the following materials: aluminum oxide, silicon
carbide or zirconia alumina. The selection of sanding discs is covered in the next section.
56 Niton XL2 Analyzer User’s Guide Thermo Scientific
Page 65

5
Common Operations
Metal Sample Prep
Sanding Discs
Figure 7. Assembling the Grinder
Remove the battery before assembling the grinder, backup pad and sanding disc. Start by
installing the backup pad onto the drive shaft of the grinder, or, with some backup pads. You
will need to screw it onto the threaded shaft.
Next place the sanding disc over the drive shaft onto the backup pad. Hold the locking button
on the reverse side of the grinder while tightening the retaining nut into the hole of the
sanding disc.
Once the backup pad, sanding disc and locking nut are secured, reinstall the battery. The
grinder is now ready for use.
It has been well tested and determined that samples can be easily contaminated by the abrasive
material contained in and on a sanding disc. An example would be the increase in aluminum
content of carbon steel after grinding the sample with a new aluminum oxide sanding disc.
Aluminum from the aluminum oxide disc imbeds itself in the surface of the steel sample and
an XRF would show an unusually high aluminum concentration.
Thermo Scientific Niton XL2 Analyzer User’s Guide 57
Page 66

5
Common Operations
Metal Sample Prep
Silicon Carbide
Zirconia Alumina
Aluminum oxide is the most common abrasive surface used today. For most applications it
will be safe to use aluminum oxide discs. But if test results for aluminum in any metal alloy are
significantly higher than expected, switch to another type of abrasive disc. Also, when
grinding aluminum, aluminum oxide discs tend to trap aluminum from the metal surface into
the disc surface. Once this happens, the disc looses its efficiency and cross contaminates the
next sample.
Silicon carbide discs are a good alternative for aluminum oxide and the cost of a disc is only
slightly higher than aluminum oxide. This adhesive type is best for grinding aluminum,
copper and other soft metals.
Zirconia alumina discs are more expensive than aluminum oxide or silicon carbide but they
last much longer and so may be the best investment. Few metal alloys have low additive levels
of zirconium, so it is one of the safest abrasive types for general use.
One exception is the Aluminum alloy Al 7050 which is a near twin to alloy Al 7075 except for
the ~0.1% Zr in 7050. Therefore, if 7075 is ground with Zr grinding paper it may be
erroneously identified as Al 7050 due to the Zr transferred from the grinding disk to the
surface of the Al 7075. s
Diamond Sanding Paper
Do not use diamond sanding paper for surface preparation in the field. Even after extensive
and aggressive sanding with diamond paper, a metal surface will not be prepared properly.
Diamond sanding paper is only recommended for removal of very light oxide coatings on flat
surfaces such as analytical reference standards.
Safety Rules
• Nickel, cobalt, and steel alloys should be ground using 36, 40, 50 or 60 grit discs.
The selection of a grit size of 100 or la
• inum, copper alloys, and other softer metals should be ground using 60 or 80 grit
discs.
• Grinding stones are not recommended because they will absorb surface material and
transfer them onto the next surface ground.
When using a grinder, follow these safety rules:
• When changing sanding discs, always remove the grinder battery to prevent
accidental activation of the grinder.
• Allow the grinder to stop spinning before placing it on a flat surface.
58 Niton XL2 Analyzer User’s Guide Thermo Scientific
Page 67

5
Common Operations
Metal Sample Prep
• Replace any damaged or torn sanding discs immediately.
• Always wear impact eye protection to prevent eye damage from flying debris.
• Place small samples or standards in a clamping device when grinding to prevent
accidental contact between the spinning disc and your hand.
• Use proper techniques and safety precautions when grinding beryllium, beryllium
copper, lead, or titanium alloys.
• Always follow the safety instructions outlined by the grinder's manufacture as
mentioned in the instruction manual..
Thermo Scientific Niton XL2 Analyzer User’s Guide 59
Page 68

5
Common Operations
Soil Sample Prep
Soil Sample Prep
Examine the site for differences in surface characteristics before sampling. Valid results depend
on a sufficient and appropriate selection of sites to sample. Incorrect sample collection may
give rise to misleading or meaningless results, regardless of the analysis method. Delineate
sections with different characteristics and treat them as different areas. It may be desirable to
subdivide larger areas even if they have the same characteristics to ensure a thorough
examination. Make certain to label each bag thoroughly. Common information included on
each bag includes the person and/or the company who collected the sample, the location and
area where the sample was taken, and the date the sample was collected.
Prepared sample analysis is the most accurate method for determining the concentration of
elements in a bulk medium using the instrument. Sample preparation will minimize the
effects of moisture, large particle size, variations in particle size and sample non-homogeneity.
Note More sample preparation (drying, milling and sifting) will yield greater accuracy. The
drier, finer, and more homogeneous the particles, the better the measurements.
Preparing Bulk Soil Samples
We recommends establishing a specific sample protocol. Following this protocol for preparing
and testing samples is vital for achieving a level of accuracy comparable with laboratory
results. The equipment you need to prepare samples is included in your kit. Among these are
a mortar and pestle, several different sized metal sieves, and cups to hold the samples
.
CAUTION All test equipment must be kept clean to prevent contaminationof samples.
Cleaning Your Equipment:
The mortar, pestle, and grinding mill may be cleaned with dry paper towels. You can also
clean the mortar, pestle, and the mill’s container with water, but be sure each is absolutely dry
before using them on another sample. The mortar and pestle may be cleaned by grinding
clean, dry sand in the mortar. Use the short bristle brushes (included in your Soil Testing Kit)
to clean the sieves. If you have an electric soil grinder in your kit, when the soil grinder blades
wear out, unbolt the worn blades and replace them. Call the Thermo Sales Department at
1-800-875-1578 for replacement blades.
Note Using the soil grinder may artificially increase the amount of Fe in soil samples.
60 Niton XL2 Analyzer User’s Guide Thermo Scientific
Page 69

Sample Preparation
Prior to analysis, the material should be dry and well homogenized. Ideally, the entire sample
should be dried to constant weight, sifted to remove gravel and debris, and ground or milled
to a fine powder. Dry the sample if it is moist and cohesive. The sample can be dried in any of
several ways. Choose one of the following:
Coning and Quartering
5
Common Operations
Soil Sample Prep
• Oven dry the sample for approximately 2 hours at 150° C, until the sample reaches a
constant weight. Note: Oven drying is inappropriate when volatile compounds may
be present in the sample. For example, lead present as tetraethyl lead would be driven
off by the heat of drying. Some forms of mercury and arsenic are volatile. Air drying
will preserve more of these volatile substances.
• Air dry the sample overnight at room temperature in a shallow pan.
• Stir gently and warm the sample in a pan over a hot plate or burner.
You may need to divide your sample at various times during preparation. Coning and
quartering is a method for dividing the sample into homogenous quarters.
• Pour the dry material slowly and carefully onto a flat sheet or pan, forming a
symmetrical cone. Divide the cone into equal piles using a flat thin-bladed tool, such
as a knife or ruler. Divide these in half again.
• Now you have four samples, each one-quarter the size of the original and each more
homogenous than the original.
• Grind the sample to break up dirt clods and/or paint chips.
WARNING Grinding and sifting dried samples produces dust. Even clean soil contains silica,
which may be hazardous when airborne. Prepare all samples in a ventilated area; wear a mask,
gloves, and an apron; and spread a drop cloth.
Sift using the #10 (2mm) mesh and separate out the larger pieces (stones, organic matter,
metallic objects, etc. Examine the larger particles by eye but do not include in the sample.
Grind the sample again so its particles will be finer and more homogenous. Use mortar and
pestle, or an electrically powered grinding mill. Sift at least 10 grams of the sample through
#60 (250 ?m) and #120 (125 ?m) mesh. Re-grind the un-passed material until the entire
fraction is able to pass. Mix the resulting sample.
Placing the Sample in an XRF Sample Cup
Note The sample container should be a sample cup of a type that can be filled from the rear;
that is, the side opposite the window (e.g. Thermo NITON Part Number 187-466). Thermo
recommends using a 1/4 mil Polypropylene film (e.g. Thermo NITON Part Number
187-461). A supply of cups and films are included.
Thermo Scientific Niton XL2 Analyzer User’s Guide 61
Page 70

5
Common Operations
Soil Sample Prep
PLACE FILM
SECURE FILM
The container used to hold the sample will affect the accuracy of the measurement. Use a
container with as thin-walled a window as is convenient and use the same kind of container
and window for each sample. Consistency and careful attention to detail are keys to accurate
measurement.
Place a circle of polypropylene film on top of an XRF sample cup. This film goes on the end
of the cup with the indented ring. Thermo recommends preparing the cup ahead of time, if
possible.
FILL CUP
TAMP SAMPLE
Secure the film with the collar. The flange inside the collar faces down and snaps into the
indented ring of the cup. Inspect the installed film window for continuity and smooth, taut
appearance.
Set the cup on a flat surface film-window-side down. Fill it with at least five grams of the
prepared sample, making sure that no voids or uneven layers.
Lightly tamp the sample into the cup. The end of the pestle makes a convenient tamper.
62 Niton XL2 Analyzer User’s Guide Thermo Scientific
Page 71

PLACE FILTER
STUFF CUP
5
Common Operations
Soil Sample Prep
Place a filter-paper disk on the sample after tamping it.
Fill the rest of the cup with polyester fiber stuffing to prevent sample movement. Use
aquarium filter or pillow filling as stuffing. A small supply of stuffing comes with your bulk
sample kit.
CAP CUP
LABEL CUP
Place a cap on your cup.
Place a label on teh cup. Using a pen with indelible ink, write identifying information on the
cup. Keep a record of the sample designation, the site and location, the date of the sample,
and any other relevant comments.
Cup is ready for testing.
Thermo Scientific Niton XL2 Analyzer User’s Guide 63
Page 72

5
Common Operations
Preparing Mining Samples
Preparing Liquids and Sludge
Liquids
Fill an XRF sample cup with the liquid to be tested (do not pad the sample with cotton). The
cup must be full so it is best if some liquid is allowed to overflow when the cap is put on.
Sludge
Sludge can be placed directly into an XRF cup for screening. This is considered in-situ testing
because no attempt has been made to prepare the sample. For more accuracy, the sludge can
be dried, sieved, and ground. Prepare in an XRF sample cup and test the same way you would
with a soil sample. For risk analysis, it is advisable to use a 60-mesh sieve to isolate and test
only fine particles.
Preparing Mining Samples
Examine the site for differences in surface characteristics before sampling. Valid results depend
on a sufficient and appropriate selection of sites to sample. Incorrect sample collection may
give rise to misleading or meaningless results, regardless of the analysis method. Delineate
sections with different characteristics and treat them as different areas. It may be desirable to
subdivide larger areas even if they have the same characteristics to ensure a thorough
examination. Make certain to label each bag thoroughly. Common information included on
each bag includes the person and/or the company who collected the sample, the location and
area where the sample was taken, and the date the sample was collected.
Prepared sample analysis is the most accurate method for determining the concentration of
elements in a bulk medium using the instrument. Sample preparation will minimize the
effects of moisture, large particle size, variations in particle size and sample non-homogeneity.
Note More sample preparation (drying, milling and sifting) will yield greater accuracy. The
drier, finer, and more homogeneous the particles, the better the measurements.
Specimen Preparation - Fused Glass Disk
The samples need to be predried for 2-6 hours in 105°C depending on the moisture content.
1. Grind the dried samples to ~200mesh (74 ?m).
2. Calcination (Ashing) the sample
a. About 4-6 g of dry pulverized sample is calcinated in an alumina or platinum crucible in a
muffle furnace at 1000°C for 1 hour.
b. The sample is cooled in a dedicator and loss on ignition (LOD) is calculated from weight
difference before and after Calcination.
64 Niton XL2 Analyzer User’s Guide Thermo Scientific
Page 73

3. Weight 1.0g of calcinated sample into fusion crucible add 5.0 g of lithium tetraborate and
0.3 lithium fluoride, and 10-20 mg lithium bromide as a nonstick agent.
4. Fuse in a fluxer for at least 4 min in the flame.
5. The resulting disk is released from the mold, cooled, then presented to the spectrometer.
Specimen Preparation - Pressed Powder Briquette Preparation
1. Thoroughly remix the sample in its jar by rotating in a figure-eight motion with two hands
2. Weight 7.0g of sample into weighting boat by taking several separate gram-size portions
then fine grind sample using a swing mill.
3. Add 2 small drops of propylene glycol on the top of the powder sample in the mill as a
grinding aid, grind 4min at 1000rpm to obtain 10 ?m particle size.
4. Add 0.5g binder to the sample and continue grinding for 30sec more.
5
Common Operations
Setting Up Beep Times
5. Brush the finely grounded samples into 31 mm aluminum sample cap and press at
50,000psi for 1 min.
CAUTION All test equipment must be kept clean to prevent contamination of samples.
Setting Up Beep Times
Selecting the Measurement Parameters icon allows you to set up Beep Times, enabling
changes to the beep settings for various modes. This option allows you to change the beep
settings for different modes independently. Select Mode you want to change, then the
Measurement Parameters icon to set up your preferred beep times.
First Beep
This option allows you to change the seconds of delay before the First Beep. Select the screen
button labeled with the number of seconds of delay for the First Beep. The Beep One Time
editor will open. Clear the current number of seconds with the "C" button, then select the E
button to enter the information.
Second Beep
This option allows you to change the seconds of delay before the Second Beep. Select the
screen button labeled with the number of seconds of delay for the Second Beep. The Beep
Two Time editor will open. Clear the current number of seconds with the "C" button, then
select the E button to enter the information.
Thermo Scientific Niton XL2 Analyzer User’s Guide 65
Page 74

5
Common Operations
Sorting the Custom Element Display
Third Beep
This option allows you to change the seconds of delay before the Third Beep. Select the screen
button labeled with the number of seconds of delay for the Third Beep. The Beep Three Time
editor will open. Clear the current number of seconds with the "C" button, then select the E
button to enter the information.
Beep on Grade Match
Selecting this option will enable a special beep when the reading chemistry matches an alloy
grade, and put a check mark in the box. Selecting the box again will remove the check mark
and turn the beep off
Sorting the Custom Element Display
Select the Custom Element Display icon to configure sorting criteria used for analysis display.
Select the mode you wish to change, then selecting the Custom Element Display icon opens
up the Custom Element Display Screen.
Display Options
On the left of the display are elements, each with its currently selected display option beside it
to the right. The element list is ranked by importance, with the most important element on
top, and each one lower down of less importance than the one above it.
By selecting an element and using the arrow buttons to the right of the list, you can change its
ranking. Use the Up Button to move an element one rank closer to the top with each click.
Use the Dn Arrow Button to move an element one rank closer to the bottom with each click.
The Display Options Drop Down Menu allows you to change the display status of any
element to one of three states:
• Normal - The standard state. Element displays only when the elemental value is
greater than the limit of detection.
• Always - Always display the results for this element. Use this state for elements critical
to all of your analyses.
• Never - Never display the results for this element. Use this state for elements which
are unimportant to your work. This makes your instrument display less complex.
Select the element you want to change, then select the menu option corresponding to your
choice of display status. The currently selected element is displayed in white on black.
Select the Save Button to save your current status as the new default. Select the Reset button
to reset the settings to the previously saved state. Select the Close button to exit the screen
without saving.
66 Niton XL2 Analyzer User’s Guide Thermo Scientific
Page 75

Report Settings
RoHS Option
Detection Option
5
Common Operations
Max Measure Time
Under Electronics Metals, Plastics, and Test All Modes, A field called Report Settings is
available. Selecting the triangle next to the Report Settings Field will open a pop up menu
allowing you to choose between the three Report Settings Modes. Select the mode you wish to
edit.
Changing the settings for one analysis mode will not affect the settings for other modes, and
the configurations can be saved independently.
When the RoHS Option is selected, clicking on the Pass and Fail values works as it does in
any other Mode.
When the Detection Option is selected, Selecting the Pass/Fail field for that element acts as an
On/Off Toggle, which will switch Pass/Fail mode between On and Off for the selected
element. Selecting it again will reverse the toggle.
Consumer Products Option
When the Consumer Products Option is selected, clicking on the Pass and Fail values works
as it does in any other Mode. In addition, the total of Cl+Br is also calculated and used for
Pass/Fail Testing.
Max Measure Time
Under the Method Setup -> Measurement Parameters option is a field called Max Measure
Time. Here you can set up the maximum time your analyzer will continue to analyze the
sample. Select the Max Measure Time field, and a Virtual Numeric Keypad will pop up,
allowing you to input a new Maximum Measurement Time in seconds. The default Max
Measure Time is set to 300 seconds.
Minumum Test Time
Under the Method Setup -> Consumer Goods option is a field called Minimum Test Time.
Here you can set up the minimum time your analyzer will continue to analyze the sample
when using the Detection Option only. Select the Minimum Test Time field, and a Virtual
Numeric Keypad will pop up, allowing you to input a new Minimum Test Time in seconds.
The default Minimum Test Time is set to 60 seconds.
Thermo Scientific Niton XL2 Analyzer User’s Guide 67
Page 76

5
Common Operations
Virtual Keyboard
Virtual Keyboard
Whenever you see the Keyboard Icon, you can select it to bring up a Virtual Keyboard on
your touch screen. Generally, selecting the keys on the Virtual Keyboard will type the
corresponding character into the field. The exceptions are the meta-keys Del, Clear, Left,
Right, Shift, Backspace, Cancel, and Enter.
68 Niton XL2 Analyzer User’s Guide Thermo Scientific
Page 77

Figure 8. Virtual Keyboard
5
Common Operations
Virtual Keyboard
Del
Clear
Left
Right
Shift
Figure 9. Shifted Virtual Keyboard
Del is the Delete Key. Selecting this key will delete the character to the left of the cursor.
Clear is the Clear Key. Selecting this key will clear all characters from the field.
Left is the Left Cursor Key. Selecting this key will move the cursor one space to the left.
Right is the Right Cursor Key. Selecting this key will move the cursor one space to the right.
Shift is the Shift Key. Selecting this key will bring up the alternate, shifted keyboard. See
Figure 1-1B. Selecting the Shift Key on the shifted keyboard will bring up the normal
keyboard. See Figure 1-1A.
Thermo Scientific Niton XL2 Analyzer User’s Guide 69
Page 78

5
Common Operations
Virtual Keyboard
Backspace
Cancel
Enter
Backspace is the Backspace Key. Selecting this key will delete the character to the right of the
cursor.
Cancel is the Cancel Key. Selecting this key will return you to the normal screen without
inputting your changes into the field.
Enter is the Enter Key. Selecting this key will return you to the normal screen, replacing the
former contents of the field with the changes you have made.
70 Niton XL2 Analyzer User’s Guide Thermo Scientific
Page 79

Setting Display Units
Select the Display Units radio buttons on the Set Display Units page to choose between ppm
(parts per million) and percentage (hundredths of whole) displays when taking readings, and
to change the Sigma value you want for the reading.
In the Display Units area, you can select between Percent composition and Parts per Million
as the units displayed in a measurement, and you can change this setting independently for
any mode. You can also change the Sigma for each of these modes independently. When you
have changed the display units to the appropriate values, select the Close button to save these
settings for use.
Changing Precision (Sigma Value)
Sigma is the symbol used for Standard Deviation, a measure of how much a set of numbers
deviates from the mean. For example, each of the three data sets {0, 0, 14, and 14}, {0, 6, 8,
and 14} and {6, 6, 8, 8} has a mean of 7. Their standard deviations are 7, 5, and 1,
respectively. The third set has a much smaller standard deviation than the other two because
its values are all close to 7. In a loose sense, the standard deviation tells us how far from the
mean the data points tend to be. The number of standard deviations between the process
mean and the nearest specification limit is given in sigmas. As process standard deviation goes
up, or the mean of the process moves away from the center of the tolerance, the sigma number
goes down, because fewer standard deviations will then fit between the mean and the nearest
specification limit.
5
Common Operations
Setting Display Units
Confidence Intervals
Confidence intervals assume that the data are from an approximately normally distributed
population - generally, sums of many independent, identically distributed random variables
tend towards the normal distribution as a limit. Using this assumption, about 68 % of the
values must be within 1 standard deviation of the mean, about 95 % of the values must be
within two standard deviations, about 99.7 % must lie within 3 standard deviations, and
about 99.99% of the values must lie within 4 standard deviations.
The greater the sigma value of the test, the more confident you can be that the sample is as it
appears, but the more difficult and time consuming the testing must be to verify this. That's
why it's important to use the most appropriate sigma value for the test. By adjusting the sigma
value for each type of test, you can optimize the process for your needs.
Thermo Scientific Niton XL2 Analyzer User’s Guide 71
Page 80

5
Common Operations
Setting Display Units
Adjusting the Sigma Values
The sigma values are listed in the column headed with the Greek letter "sigma". The default
value is 2 sigma. You can change this value by selecting the down arrow next to the value,
which opens up a drop-down menu from which you can select the desired sigma value by
clicking on it.
Figure 10. Selecting the Sigma Value
When you have changed the sigma values to the appropriate number, select the Close button
to save these settings for use.
72 Niton XL2 Analyzer User’s Guide Thermo Scientific
Page 81

Adjusting the Element Range
5
Common Operations
Adjusting the Element Range
Figure 11. Adjusting the Element Range
Multi-Range tests are used to either preferentially excite specific elements for increased
sensitivity, or to cover a wider element range than one Range alone can provide. Most modes,
when enabled, will use several Ranges in sequence to produce a combined analysis result. In
typical Metals analysis applications, Main Range is used for the analysis of most elements,
Low Range is utilized for the subsequent high sensitivity analysis of V, Ti, and Cr, High Range
is is used to optimize the sensitivity for the elements from Palladium (Pd) through Barium
(Ba), and Light Range is typically used in light element analysis. Multi-Range switching can
be set to activate off time alone, or, when time switching is disabled, off settings in the
General Metals grade library. In most modes, Low and Light Range add the capability to
analyze light elements which cannot be efficiently excited by Mid Range.
Select the mode you wish to configure from the Mode Menu. You can set different
configurations for different modes.
The Element Range Screen enables you to directly enable or disable any Range, or control the
time that a Range alters the irradiation of the sample before auto-switching to another Range.
Select the checkbox next to the Range you want to use to determine exactly which of the
Ranges contained in your Analyzer is used for sample testing. Selecting an empty checkbox
will enable that range and place a check into the box as an indicator. Selecting a checked box
will disable the Range and clear the box.
Thermo Scientific Niton XL2 Analyzer User’s Guide 73
Page 82

5
Common Operations
Setting the Date and Time
In typical metals analysis applications, Main Range is used for the analysis of most elements.
You cannot deselect the Main Range in metals analysis.
Low Range is utilized for the subsequent high sensitivity analysis of V, Ti, and Cr.
Select the Element List Button - labeled with a question mark - to display the Element List for
that Range. This list shows the elements that the Range is best designed to detect.
Select the Range Time field for the intended range to change the switch time for that range.
The Range Time Editor will appear. This enables you to set the number of seconds each
enabled range is allotted before auto-switching will occur when needed during sample testing.
Your analyzer will auto-switch from one range to another when the testing time for that range
is greater than or equal to the time you have chosen, and the identified alloy is flagged as
needing the switch in the Niton Alloy Library.
Select the C button to clear the current time, then from the virtual numeric key pad, select
each digit you want to input, then select the E button to enter.
Setting the Date and Time
Figure 12. Setting the Date and Time
From the System Menu, select the Date & Time icon from the System Screen to set the date
and time as needed for different time zones, daylight savings time, or any other reason. The
date and time are factory preset prior to shipping. The clock is a 24 hour clock, so add 12 to
PM hours - i.e. 1:13 PM would be 13:13.
74 Niton XL2 Analyzer User’s Guide Thermo Scientific
Page 83

5
Common Operations
Setting the Date and Time
Figure 13. The Date & Time Screen
When the Date & Time button is selected, the Date & Time Screen comes up on your
analyzer’s LCD Screen. You may change the Month, Year, Date, Hour, and Minute on your
analyzer.
Thermo Scientific Niton XL2 Analyzer User’s Guide 75
Page 84

5
Common Operations
Setting the Date and Time
Changing the Month
To change the month, select the downward pointing triangle button next to the month
displayed. A drop down menu will appear, listing the months of the year in order of
appearance.
Figure 14. Month Drop Down Menu
Select the month you want from the drop down menu, using the vertical slider button to
display hidden months. The display will change to show the month you selected.
76 Niton XL2 Analyzer User’s Guide Thermo Scientific
Page 85

Changing the Year
5
Common Operations
Setting the Date and Time
To change the year, select the downward pointing triangle button next to the year displayed. A
drop down menu will appear, listing the years in order of appearance.
Figure 15. Changing the Year
Select the year you want from the drop down menu, using the vertical slider button to display
hidden years. The display will change to show the year you selected.
Thermo Scientific Niton XL2 Analyzer User’s Guide 77
Page 86

5
Common Operations
Setting the Date and Time
Changing the Date
To change the date, select the date you want from the Date Selection Screen. The date you
selected will be highlighted in red, while the old date will be shown in red numbers.
Figure 16. Selecting the Date
78 Niton XL2 Analyzer User’s Guide Thermo Scientific
Page 87

Changing the Hour and Minute
To change the hour, select the hour numbers. The hour numbers will be highlighted in gray.
Then select the Upwards Pointing Chevron Button to increment (increase) the hour, or the
Downward Pointing Chevron Button to decrement (decrease) the hour.
5
Common Operations
Setting the Date and Time
Figure 17. Changing the Hour
To change the minute, select the minute numbers. The minute numbers will be highlighted in
gray. Then select the Upwards Pointing Chevron Button to increment (increase) the minute,
or the Downward Pointing Chevron Button to decrement (decrease) the minute.
Thermo Scientific Niton XL2 Analyzer User’s Guide 79
Page 88

5
Common Operations
Setting the Date and Time
Figure 18. Changing the Minute
Saving Your Changes
To save your changes, select the "Save" screen Button. The display will return to the previous
screen and the Date and Time will be saved.
Exiting Without Saving
To exit the screen without saving changes, select the "Cancel" Screen Button. The display will
return to the previous screen and the Date and Time will not be saved.
80 Niton XL2 Analyzer User’s Guide Thermo Scientific
Page 89

Calibrating the Touch Screen
5
Common Operations
Calibrating the Touch Screen
Figure 19. Initiating Touch Screen Calibration
Select the Calibrate Touch Screen button from the System Screen to re-calibrate the analyzer's
touch screen display. This procedure establishes the display boundaries for the touch screen
interface.
1. Select the Touch Screen icon.
2. The display will show a message asking you to confirm whether or not you want to
calibrate your Touch Screen. Select the Yes button.
3. The display will show the message: "Calibrate Touch Screen". There will be a small cross in
the upper left-hand corner of the display.
4. Tap on this cross with the stylus, and the cross will disappear and reappear in the upper
right-hand corner of the screen.
5. Tap on the cross again, and it will reappear in the lower right-hand corner of the screen.
6. Tap on the cross again and it will reappear in the lower left-hand corner of the screen.
7. Tap on the cross once more, and you will be presented with a Confirmation Screen.
8. Select the Yes Button to confirm that the parameters are good. Select the No Button to start
the process again.
Thermo Scientific Niton XL2 Analyzer User’s Guide 81
Page 90

5
Common Operations
Calibrating the Touch Screen
9. Once you have confirmed the parameters, the System Menu will be displayed. The screen is
now calibrated.
Figure 20. Touch Screen Calibration Crosses
The Touch Screen can be calibrated - and the system operated - with a USB mouse plugged
into the USB ports in the rear of teh analyzer.
82 Niton XL2 Analyzer User’s Guide Thermo Scientific
Page 91

Data Management
Viewing Data
6
Data Management
Viewing Data
Figure 21. The View Data Menu Path
Use the Data Screen to view previously taken test result readings. When the View Data icon is
selected, the Results screen of your most recent test is shown on the Touch Screen.
Thermo Scientific Niton XL2 Analyzer User’s Guide 83
Page 92

6
Data Management
Viewing Data
Figure 22. The View Data Screen
Using the buttons on the control panel, you may view different readings or additional data for
individual readings. Your analyzer will display the standard screen analysis. Pressing the Down
Button on the 4-way touch pad will display a complete scrolling elemental chemistry listing.
Each press of the Down Button scrolls the screen down to the next element. You can also use
the scroll bar along the right side to scroll or page through the elements.
Scrolling Down Through the Complete Listing of Elements
Figure 23. Complete Listing of Elements
Pressing the Left Button on the 4-way touch pad of your analyzer will display the previous
reading, or if the first reading is currently displayed, the last reading. Pressing the Right
Button on the 4-way touch pad will display the next reading, or if the last reading is currently
displayed, the first reading in memory. Your analyzer can store up to 10,000 readings. You can
also look at the complete x-ray spectra for each reading stored in the analyzer's memory.
Sorting Elements
You can sort element rows by various criteria in order to view your data in the manner you
prefer. The Sort Buttons, which double as column headings, can be used to re-sort the data in
different ways. The Data Screen always begins as a Standard Sort, as you have defined it.
Selecting the appropriate Sort Button once toggles the sort order to High-to-Low. Selecting
the Sort Button again toggles the sort order to Low-to-High. To return to the Standard Sort,
select the Sort Button a third time.
84 Niton XL2 Analyzer User’s Guide Thermo Scientific
Page 93

Figure 24. Standard, High-to-Low, and Low-to-High Composition Sorts
6
Data Management
Viewing Data
Element Sorts
Composition Sorts
Error Sorts
Element sorts are performed alphabetically based on the element symbol.
Composition sorts are performed numerically based on the percentage of composition, i.e.
from lowest to highest concentration, or by toggling again, from highest to lowest.
Error sorts are performed based on the size of the error in the reading, i.e. from largest to
smallest error, or by toggling again, from smallest to largest.
Thermo Scientific Niton XL2 Analyzer User’s Guide 85
Page 94

6
Data Management
Viewing Data
Figure 25. Element, Composition, and Error Sorts
Spectrum Graph
For any reading result, simply use the NAV Menu to gain access to the reading’s spectrum
graph. Selecting Spectra will show a graphed spectrum of this reading, called SpectraView.
SpectraView can be a useful tool for rapid, qualitative analysis of a sample. See Viewing the
Spectrum for details.
86 Niton XL2 Analyzer User’s Guide Thermo Scientific
Page 95

Figure 26. The SpectraView Screen
Viewing the Spectrum
SpectraView
SpectraView enables you to to visually inspect the fluorescent x-ray peaks obtained from any
sample and qualitatively identify them using the on-board software. In SpectraView Mode,
the spectrum is displayed using a linear energy scale along the x-axis, with the count rate
autoscaled logarithmically on the y-axis so that the highest peak on the screen reaches the top
of the scale.
How to Use SpectraView
You can access the SpectraView screen after taking a measurement in any mode, or while
viewing a previous measurement, by selecting Spectra from the NAV Menu. Once you are in
SpectraView, you can use the up and down positions of the 4-way touch pad to scroll through
the spectrum, or you can tap on the spectrum display with the stylus to place the cursor at the
point you tapped. The vertical cursor line indicates the current position along the spectrum.
6
Data Management
Viewing Data
Viewing the Information in SpectraView Mode
Figure 27. The SpectraView Screen
By default, the following information is shown along with the spectrum:
• The Reading number (Bottom Left) in the form "Read:x", where x is the Reading
number.
• The position of the cursor on the energy scale (Bottom Left, under the Reading
number), in the form "E: x.xx KeV", where KeV is kilo electron volts.
• The count rate (Bottom Left, under the energy position), in the form “R:x.xx”.
Thermo Scientific Niton XL2 Analyzer User’s Guide 87
Page 96

6
Data Management
Viewing Data
Note SpectraView cannot be used to determine exact element percentages in a sample.
Fitting the Spectrum
By using the touch screen, you can select parts of the displayed spectrum and zoom in. Touch
and hold the stylus to the screen immediately before the area of the spectrum you wish to
enhance, then - still holding the stylus to the screen - sweep it across the area of the spectrum
you wish to see closer, lifting the stylus from the screen when you pass the end of the area of
interest. The screen will display vertical lines to either side of the area of interest, delineating
the boundaries of the area.
• Ka, Kb, La, Lb, and/or Lg peaks of the three elements closest to where your cursor is
positioned on the energy scale (Bottom Right). This information is written with the
element symbol first, followed by either Ka (K shell alpha peak), Kb (K shell beta
peak), La (L shell alpha peak), La (L shell beta peak), or Lg (L shell gamma peak). An
example would be "Al Ka 1.48." To determine if a given element is present, look at
the count rate at that cursor position.
Figure 28. Delineating the Area of Interest
Select the FIT button in the upper right hand corner of the Spectrum to fit the area of interest
to the display area.
88 Niton XL2 Analyzer User’s Guide Thermo Scientific
Page 97

Multiple Ranges
Figure 29. Area of Interest Fit to the Display
The view of the spectrum will change to show only the area of interest.
6
Data Management
Viewing Data
SpectraView can display any individual spectra, including those obtained from multiple
Ranges (filters) if you are using more than one Range. Use the NAV Menu to select which
spectrum to view.
The Spectra1 choice will display the spectrum produced by the first Range.
The Spectra2 choice will display the spectrum produced by the second Range.
SpectraView Navigation
Use the left button on the 4-way touch pad to expand the spectrum, centered on the position
of the cursor.
Use the right button on the 4-way touch pad to contract the spectrum, centered on the
position of the cursor.
Thermo Scientific Niton XL2 Analyzer User’s Guide 89
Page 98

6
Data Management
Viewing Fingerprints
Viewing Fingerprints
Figure 30. The View Fingerprints Menu Path
Select the View Fingerprints icon to view data saved as reference sample Fingerprints in Teach
Fingerprint Mode. When the View Fingerprints icon is selected, the Results Screen of your
most recent Teach Fingerprint is shown on the Touch Screen display.
90 Niton XL2 Analyzer User’s Guide Thermo Scientific
Page 99

Erasing Data
Figure 31. The View Fingerprints Screen
The Erase All Data Screen
6
Data Management
Erasing Data
Thermo Scientific Niton XL2 Analyzer User’s Guide 91
Page 100

6
Data Management
Erasing Data
Figure 32. The Erase All Data Menu Path
Select the Erase All Data icon to erase all data, including signatures and readings, from your
analyzer. Selecting the Erase All Data icon will bring up a confirmation screen asking you “Are
you sure?” with options to select “YES” or “NO”. Selecting the Yes Button will erase all data
from your analyzer. Selecting the No Button will return you to the Erase Menu.
Figure 33. The Erase All Data Confirmation Screen
CAUTION Never turn off the analyzer while data is being erased!
WARNING Do not attempt to take measurements while downloading readings! This will
generate an error requiring a system reset, and may corrupt your stored readings, requiring all
stored readings to be erased.
92 Niton XL2 Analyzer User’s Guide Thermo Scientific
 Loading...