

Page 1
Sarasota 2000
Ultrasonic Multipath Flowmeter
User Guide
P/N HB-S2000
Revision A
Part of Thermo Fisher Scientific
Page 2

Page 3

Sarasota 2000
Ultrasonic Multipath Flowmeter
User Guide
P/N HB-S2000
Revision A
Page 4

Page 5

©2007 Thermo Fisher Scientific Inc. All rights reserved.
All trademarks are the property of Thermo Fisher Scientific Inc. and its subsidiaries.
Thermo Fisher Scientific (Thermo Fisher) makes every effort to ensure the accuracy and completeness of
this manual. However, we cannot be responsible for errors, omissions, or any loss of data as the result of
errors or omissions. Thermo Fisher reserves the right to make changes to the manual or improvements to
the product at any time without notice.
The material in this manual is proprietary and cannot be reproduced in any form without expressed
written consent from Thermo Fisher.
Thermo Fisher Scientific
1410 Gillingham Lane
Sugar Land, TX 77478
USA
Phone: 713-272-0404
Fax: 713-272-2272
Web: www.thermofisher.com
Thermo Fisher Scientific
14 Gormley Industrial Avenue
Gormley, Ontario L0H 1G0
Canada
Phone: 905-888-8808
Fax: 905-888-8828
Page 6

This page intentionally left blank.
Page 7

Sarasota 2000 Ultrasonic Multipath Flowmeter
SECTION 1
INTRODUCTION
1.2.1 The Standard
1.3 Implementation of principles in Sara sota 2000
1.1 Applications
1.2 Principle of operation
1.2.2 Velocity x area method
1.2.3 Water level
1.2.4 Water velocity
1.2.5 Flow determination
1.2.5.1 Mid section method
1.2.5.2 Mean section method
1.2.6 Path configurations
1.2.7 Transducer frequency
1.2.8 Minimum depth of water
1.2.9 Performance estimates
INDEX
SECTION 2
SYSTEM COMPONENTS
2.1 Flowmeter system overview
2.2 Family tree
2.3 Flowmeter contents and options
2.3.1 Flowmeter layout
2.3.2 Core items
2.3.2.1 Power supply
2.3.2.2 Central processor
2.3.2.3 Keyboard and display
2.3.2.4 Serial connections
2.3.3 Optional items
2.3.3.1 Transducer I/F card
2.3.3.2 Input/output card
2.3.3.2.1 I/O card layout
2.3.3.2.2 Analogue I/O
2.3.3.2.3 16 bit BCD & encoder
2.3.3.3 Relay (VFC) card
2.4 Ultrasonic transducers
2.4.1 1 MHz transducers
2.4.2 500 kHz transducers
2.4.3 Lower frequency transducers
2.4.4 Maximum cable lengths
2.5 Controls and displays
2.5.1 Panel layout
2.5.2 Screen organisation
2.5.3 Status indicator
2.6 Software & firmware
2.6.1 Operating firmware
2.6.2 “GAFA” PC software
2.7 Documentation
INDEX Page 1
Thermo Fisher Scientific
Page 8

Sarasota 2000 Ultrasonic Multipath Flowmeter
SECTION 3
PERIPHERAL EQUIPMENT
SECTION 4
INSTALLATION
4.1 Safety
SECTION 5
COMMISSIONING
5.1 Site dimensions
SECTION 6
CALIBRATION/
VERIFICATION
3.1 Additional items
3.2 Transducer mounting hardware
4.2 General
4.3 Unpacking and laying out
4.4 Installing transducer assemblies
4.5 Connecting transducers to flowmeter
4.6 Transducer alignment
4.7 Output connections
4.8 Power connection
5.2 Powering up
5.3 Programming
5.4 Setting up
5.5 Outputs
6 Calibration/verification
INDEX
SECTION 7
MAINTENANCE
7.1 Channel maintenance
7.1.1 Weed
7.1.2 Profile
7.1.3 Debris
7.2 Flowmeter maintenance
7.3 Routine checks
7.3.1 Remote
7.3.2 On site
INDEX Page 2
Thermo Fisher Scientific
Page 9

Sarasota 2000 Ultrasonic Multipath Flowmeter
APPENDIX 1
LCD SCREENS
A1.1 Screen organisation chart
APPENDIX 2
GAFA PC SOFTWARE
A2 GAFA PC software
A1.2 Screen types
A1.3 Screen selection and data entry
A1.4 Power off mode
A1.5 Screens
INDEX
APPENDIX 3
SPECIFICATION
A3.1 Enclosure
A3.2 Power supply
A3.2.1 AC supply
A3.2.2 12 volt DC supply
A3.3.3 24 volt DC supply
A3.3 Electronics
A3.4 Transducers
A3.4.1 1 MHz
A3.4.2 500 kHz
A3.4.3 Other frequencies
A3.4.4 Transducer ca ble
A3.5 GAFA software
APPENDIX 4
REFERENC ES
A4 References
APPENDIX 5
SITE DATA BOOK
A5.1 Model and serial number
A5.2 Site and customer
A5.3 General description
A5.4 Software issue
A5.5 Card layout in rack
A5.6 Programmed data
A5.7 Schedule of drawings
A5.8 Test certificates
INDEX Page 3
Thermo Fisher Scientific
Page 10

Sarasota 2000 Ultrasonic Multipath Flowmeter
This page is blank
INDEX
INDEX Page 4
Thermo Fisher Scientific
Page 11

Sarasota 2000 Ultrasonic Multipath
Flowmeter
INTRODUCTION
1 INTRODUCTION
1.1 Applications
The Thermo Scientific Sarasota 2000 is a velocity x area open channel flowmeter which uses
the ultrasonic “time of flight”, also known as the “transit time” method.
Unlike traditional methods of open channel flow measurement which use weirs or flumes, the
transit time method creates no obstruction and assumes no relation between level and flow. It
will correctly determine flow throughout its designed range by measuring water velocity and
cross section area (see Section 1.2).
The method is tolerant of backwater effects caused by tides, downstream confluence or
blockages. Unlike a weir or flume it does not drown out at high flow conditions.
The method employs the transmission of ultrasonic “beams” which can be affected by factors
which impede or deflect them. For this reason the method should not be used in situations of:
• Aerated water
• Weed growth between the transducers (unless it is regularly cut)
• High levels of suspended solids (greater than 2000 mg/l) *
• Gradients
• Gradients
* In relatively small channels (up to 5 metres) the method is more tolerant of suspended solids
and therefore is often used in sewage applications.
Though described as an open channel method, the flowmeter may be used in closed
conduits, including those which run full. In the latter case, the cross section area is defined by
the conduit geometry without the need to measure water level.
Suitable applications include water flow measurement of:
• Rivers
• Canals
• Aqueducts
• Irrigation conduits
• Sewage discharges
• Sewage works
• Industrial discharges
• Power generation
Note that although the flowmeter is most often used for open channels or part filled conduits,
it is often used for conduits which always run full. Under these circumstances it is not
necessary to have a depth input but steps need to be taken to ensure that the flowmeter
always takes the conduit as full. This is done via the encoder depth input. The conduit shape
must still be entered.
of salinity (the actual value of salinity is, however, unimportant)
of temperature (the actual temperature is, however, unimportant)
Section 1 INTRODUCTION Page 1-1
Thermo Fisher Scientific
Page 12

Sarasota 2000 Ultrasonic Multipath
Flowmeter
1.2 Principle of operation
1.2.1 The Standard
The Sarasota USMP is a velocity x area open channel flowmeter which uses the ultrasonic
“time of flight” method. This is also known as the “transit time” method. It complies with the
International Standard ISO 6416. The UK version BS 3680 part 3E is identical. The transit
time method belongs to the general category of velocity x area methods. A full description of
the method and its applications is to be found in the Standard. A brief summary is given
below.
1.2.2 Velocity x area method
Velocity x area methods require a means of determining the water velocity and the cross
section area. The product of the two produces the flow rate in a manner which is not
dependent on factors influencing the level, for example downstream constrictions, tidally
influenced wat er level et c.
Assuming the shape of the channel cross section is stable, determination of the area
becomes a matter of measuring water level. This may be done by a variety of methods.
1.2.3 Water level
Water level is required in order to determine the cross section area in an open channel.
Though a single level measurement may be used, it is common to use more than one and to
average them. This has the advantage of a more representative level, particularly if the
measurements are made at different positions, for example on either side of the channel.
Another advantage is that flow may still be computed even if a level sensor fails.
Level may be determined by using one or more ultrasonic transducers in the water facing
upwards. The time taken for a pulse of sound to return to the transducer after being reflected
from the surface is converted into level using the velocity of sound in water as measured on
the water velocity paths (see Section 1.2.4). There is a minimum depth of water required
above the transducer for it to carry out a measurement. This is given in Appendix 3:
Specification.
Water level may also be provided by external auxiliary depth gauges, for example pressure
transmitters, downward facing ultrasonic devices and float systems with shaft encoders.
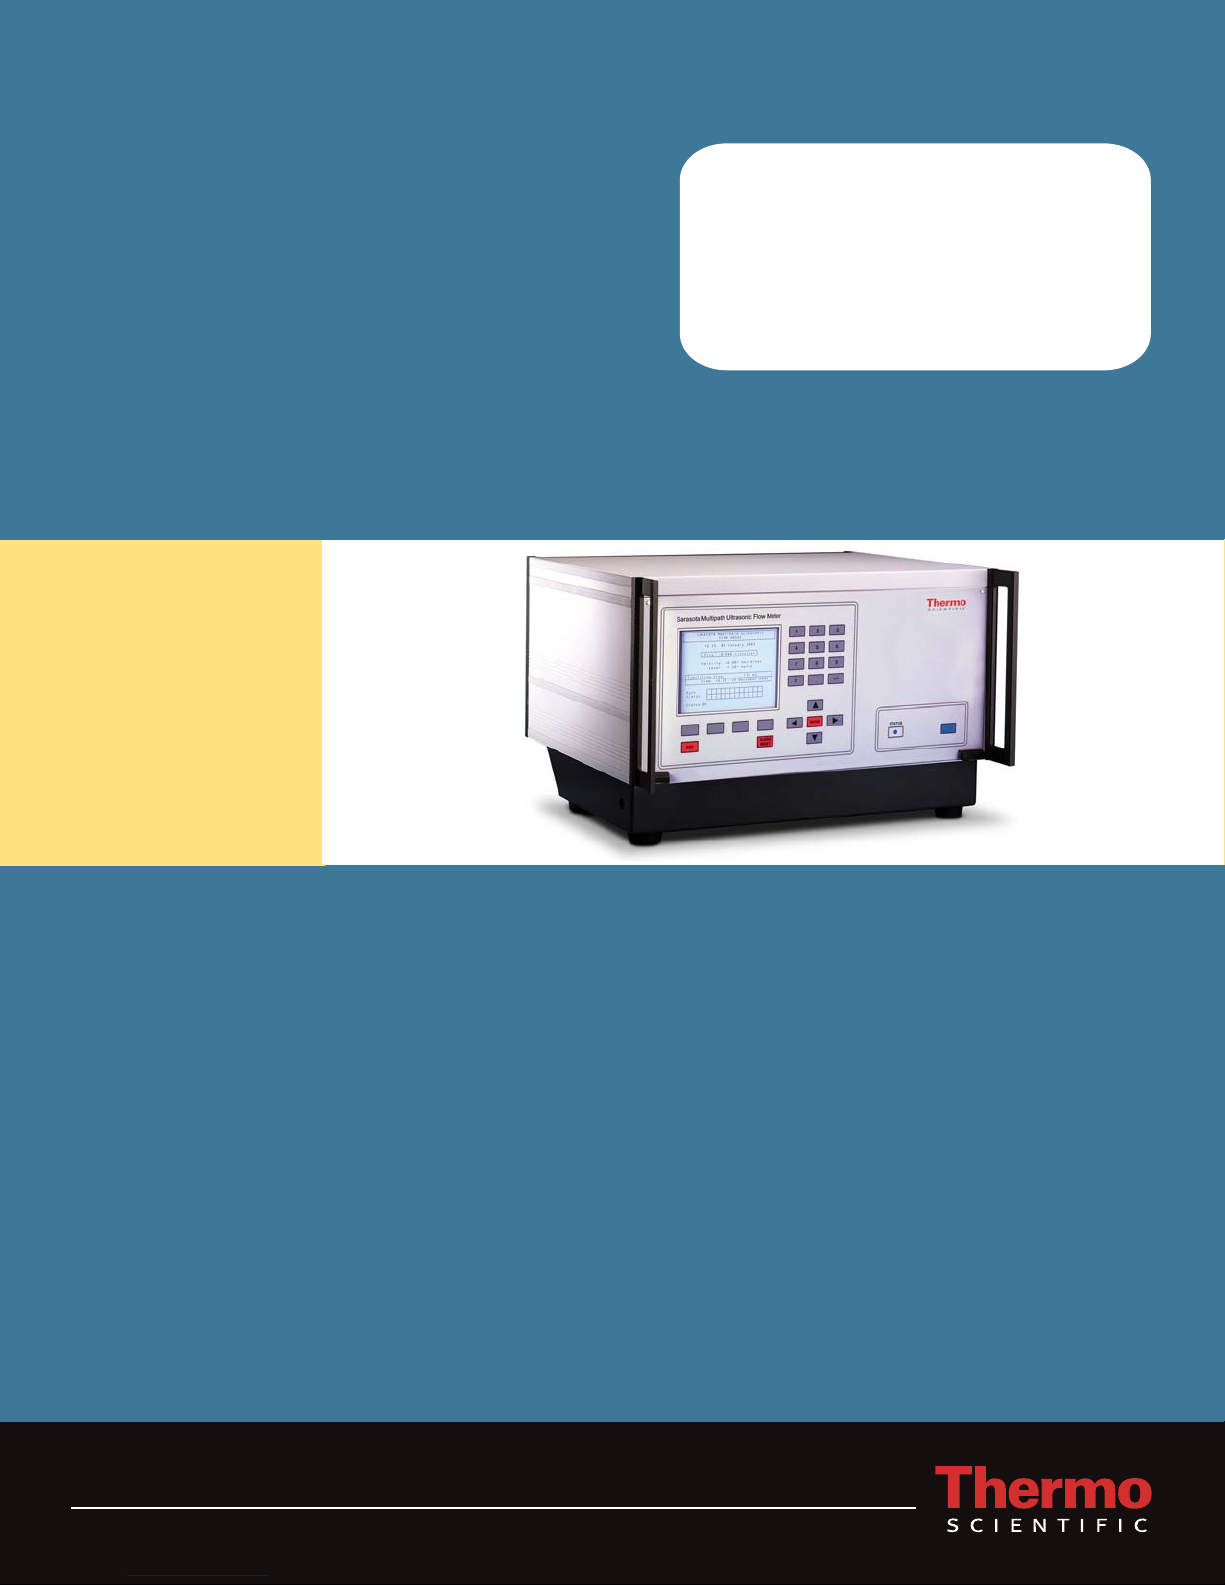
1.2.4 Water velocity
In the transit time method, water velocity is determined at a number of heights within the body
of water by measurement of time taken for pulses of ultrasound to travel across the channel
at an angle to the flow direction.
Transducers are mounted in the water at or near the sides of the channel with each pair
usually at the same height and aligned so as each one can transmit a “beam” of ultrasound
towards its partner. The ultrasonic “path” between the transducer pairs must be at an angle
(usually about 45
Each transducer acts as a transmitter and receiver and is connected to a processing unit,
which measures the transit time and the time difference.
o
) to the flow direction.
INTRODUCTION
Section 1 INTRODUCTION Page 1-2
Thermo Fisher Scientific
Page 13
Sarasota 2000 Ultrasonic Multipath
θ
Flowmeter
The mean water velocity at the height of each path is determined from these timing
measurements, based on pre-determined geometrical measurements (length of the path and
the angle to the flow direction).
V
It may be shown that the water velocity at the height of the path AB is:
v = L x (T
– TBA) / (TAB x TBA x 2 cosθ)
AB
Where
T
T
= Transit time from transducer A to B
AB
= Transit time from transducer B to A
BA
L = Path length (distance between transducer A and transducer B)
θ = the angle between the “path” and the direction of flow.
1.2.5 Flow determination
The flow is determined by combining the water velocity measurements at the height of each
path with the cross section area defined by the water level and the shape of the channel. The
channel shape need not be the same as the projected width between the transducers. For
example if the transducers are mounted on piles inset from the channel sides. For the
purposes of flow determination the cross section area is divided into horizontal slices
determined by the channel bed, the heights of the paths themselves and the water surface
level.
The channel flow is the sum of the flows in each slice determined by the path velocity or
velocities and the area of the slice. The bottom slice is defined by the bed (which is assumed
not to move) and the top slice by the water level (which is measured). The slice widths may
be determined by the projected width between the transducers or by a separate table defining
the cross section shape.
There are 2 methods, mid section and mean section.
Transducer A
Direction of the Flow
Ultrasonic Path
Transducer B
INTRODUCTION
Section 1 INTRODUCTION Page 1-3
Thermo Fisher Scientific
Page 14
Sarasota 2000 Ultrasonic Multipath
Flowmeter
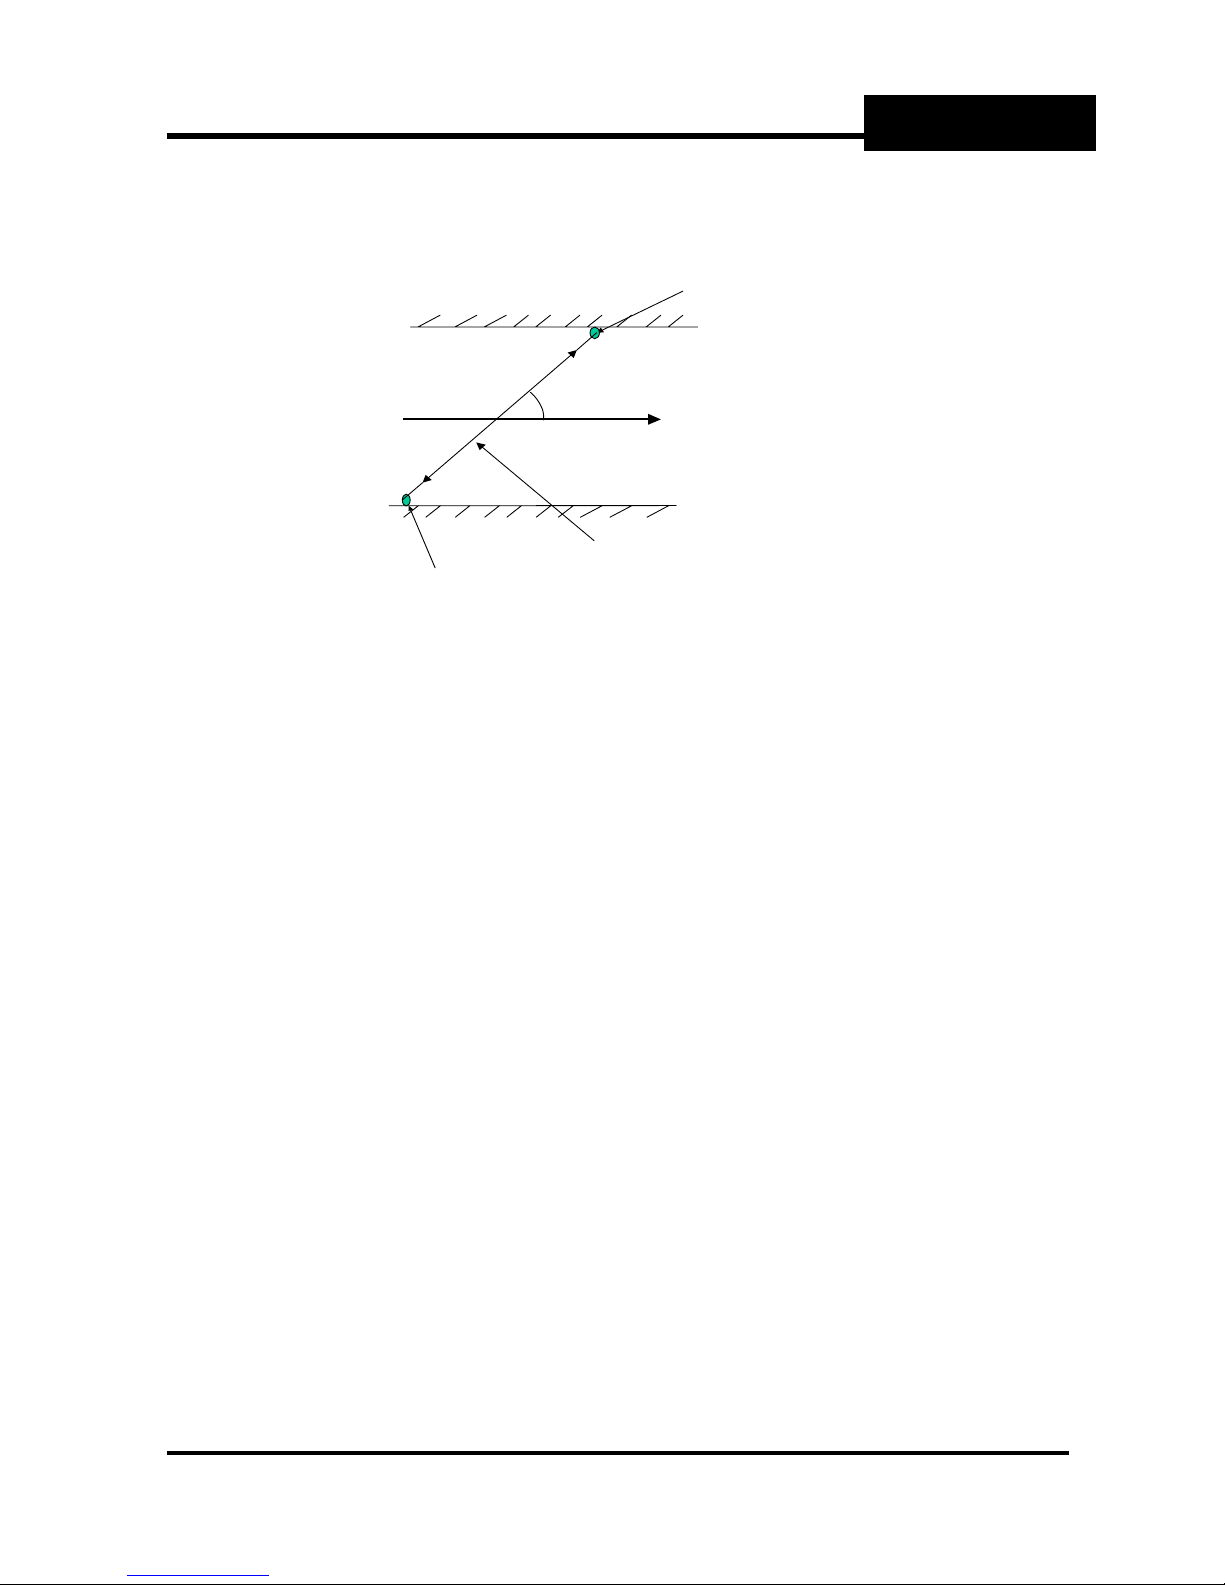
1.2.5.1 Mid section method
In the mid section method, the slice boundaries are defined by lines mid way between the
paths. The slice velocity is taken as that determined by the path within the slice and the slice
area as the product of the slice height and the (average) width. The upper boundary of the top
slice is the water surface. At the bottom, an additional slice is defined between the bed and a
line half way between the bed and the bottom path. This bottom slice has a weighting factor,
K, normally between 0.4 and 0.8 to allow for the slow moving water near the bed. To reduce
the uncertainty of this factor, the bottom path should be positioned as close to the bed as
practical.
INTRODUCTION
Height H
Top panel
½(H
+ H3)
4
S
Water S u rf ac e
QS = V4 {HS − ½(H4 + H3)}W
QS = ½V3 (H4 – H2)W
3
4
½(H3 + H2)
+ H1)
½(H
2
+ H0)
½(H
1
Height H
0
Bottom panel
QS = ½V2 (H3 – H1)W
QS = ½V1 (H2 – H0)W
QS = ½kV1 (H1 – H0)W
2
1
Width W
Bed
Width W
Illustration of the mid section method for 4 paths
Width W
Width W
Width W
1
Bed
4
3
2
Path 4 H e ight H
Path 3 Height H
Path 2 Height H
Path 1 Height H
Bed Height H
4
3
2
1
0
Section 1 INTRODUCTION Page 1-4
Thermo Fisher Scientific
Page 15
Sarasota 2000 Ultrasonic Multipath
4
Flowmeter
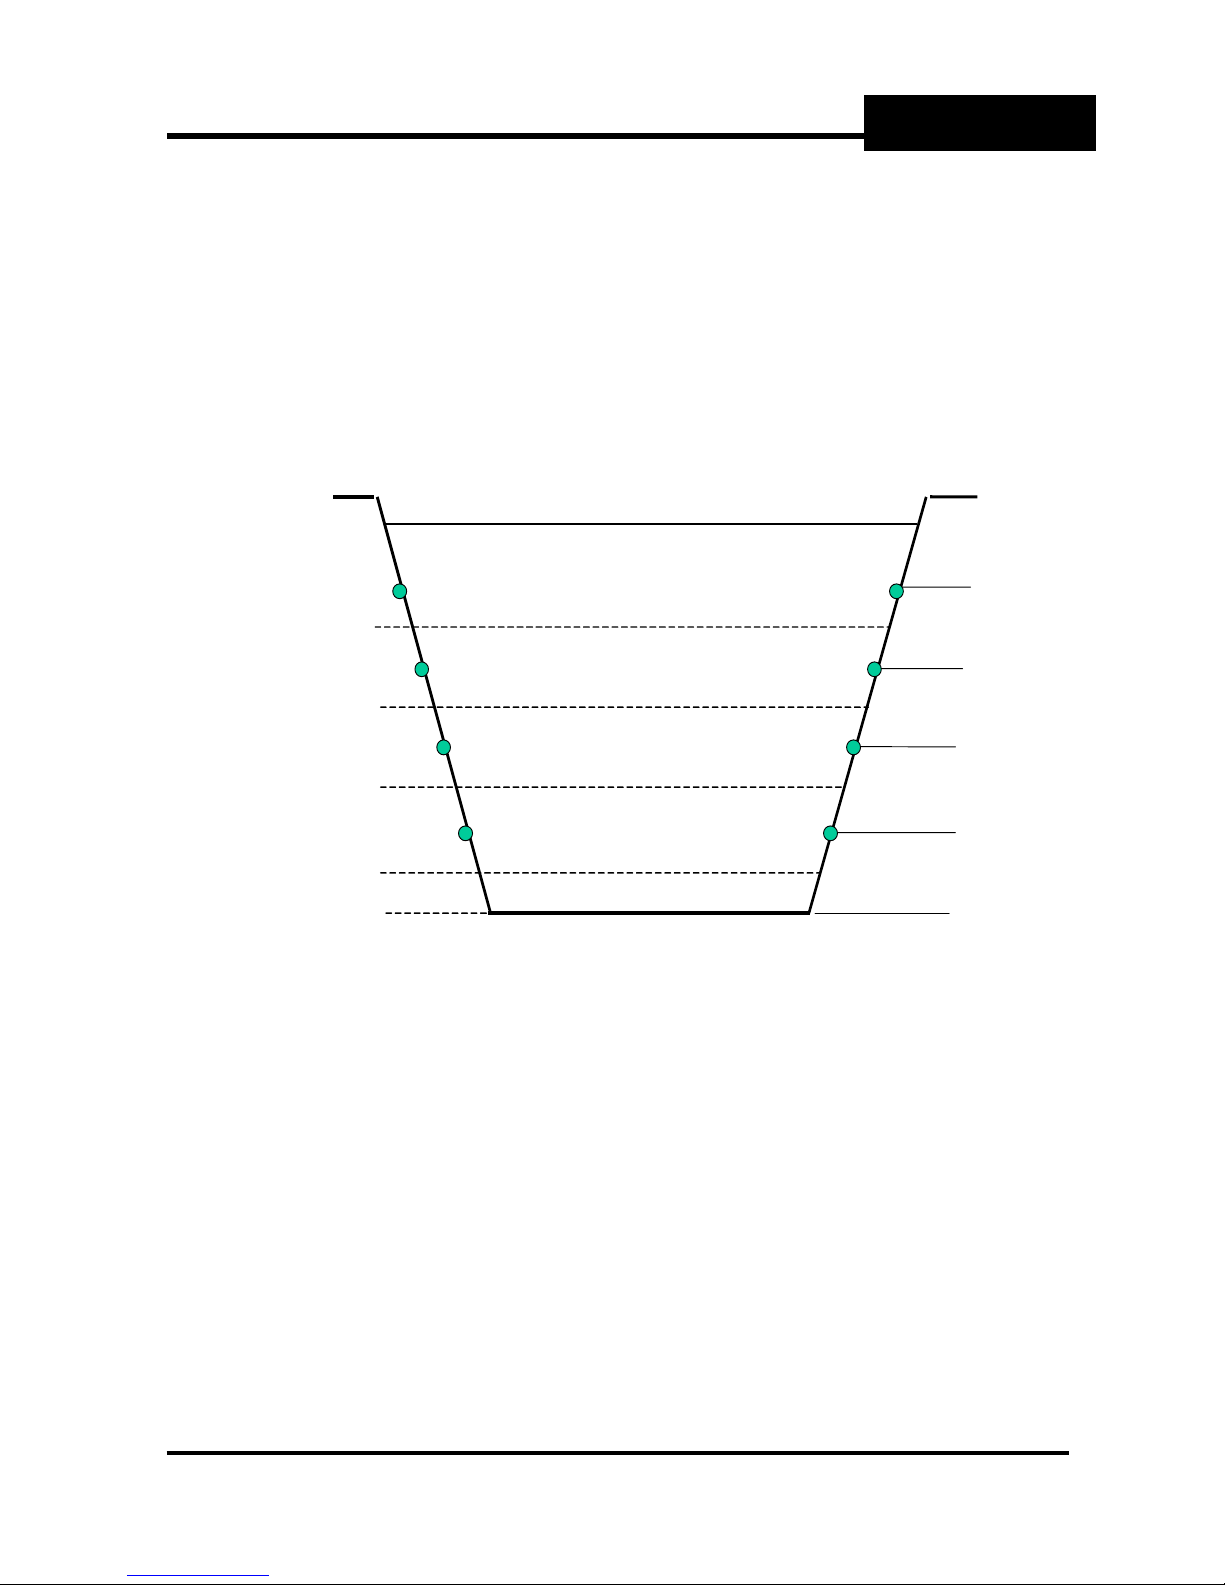
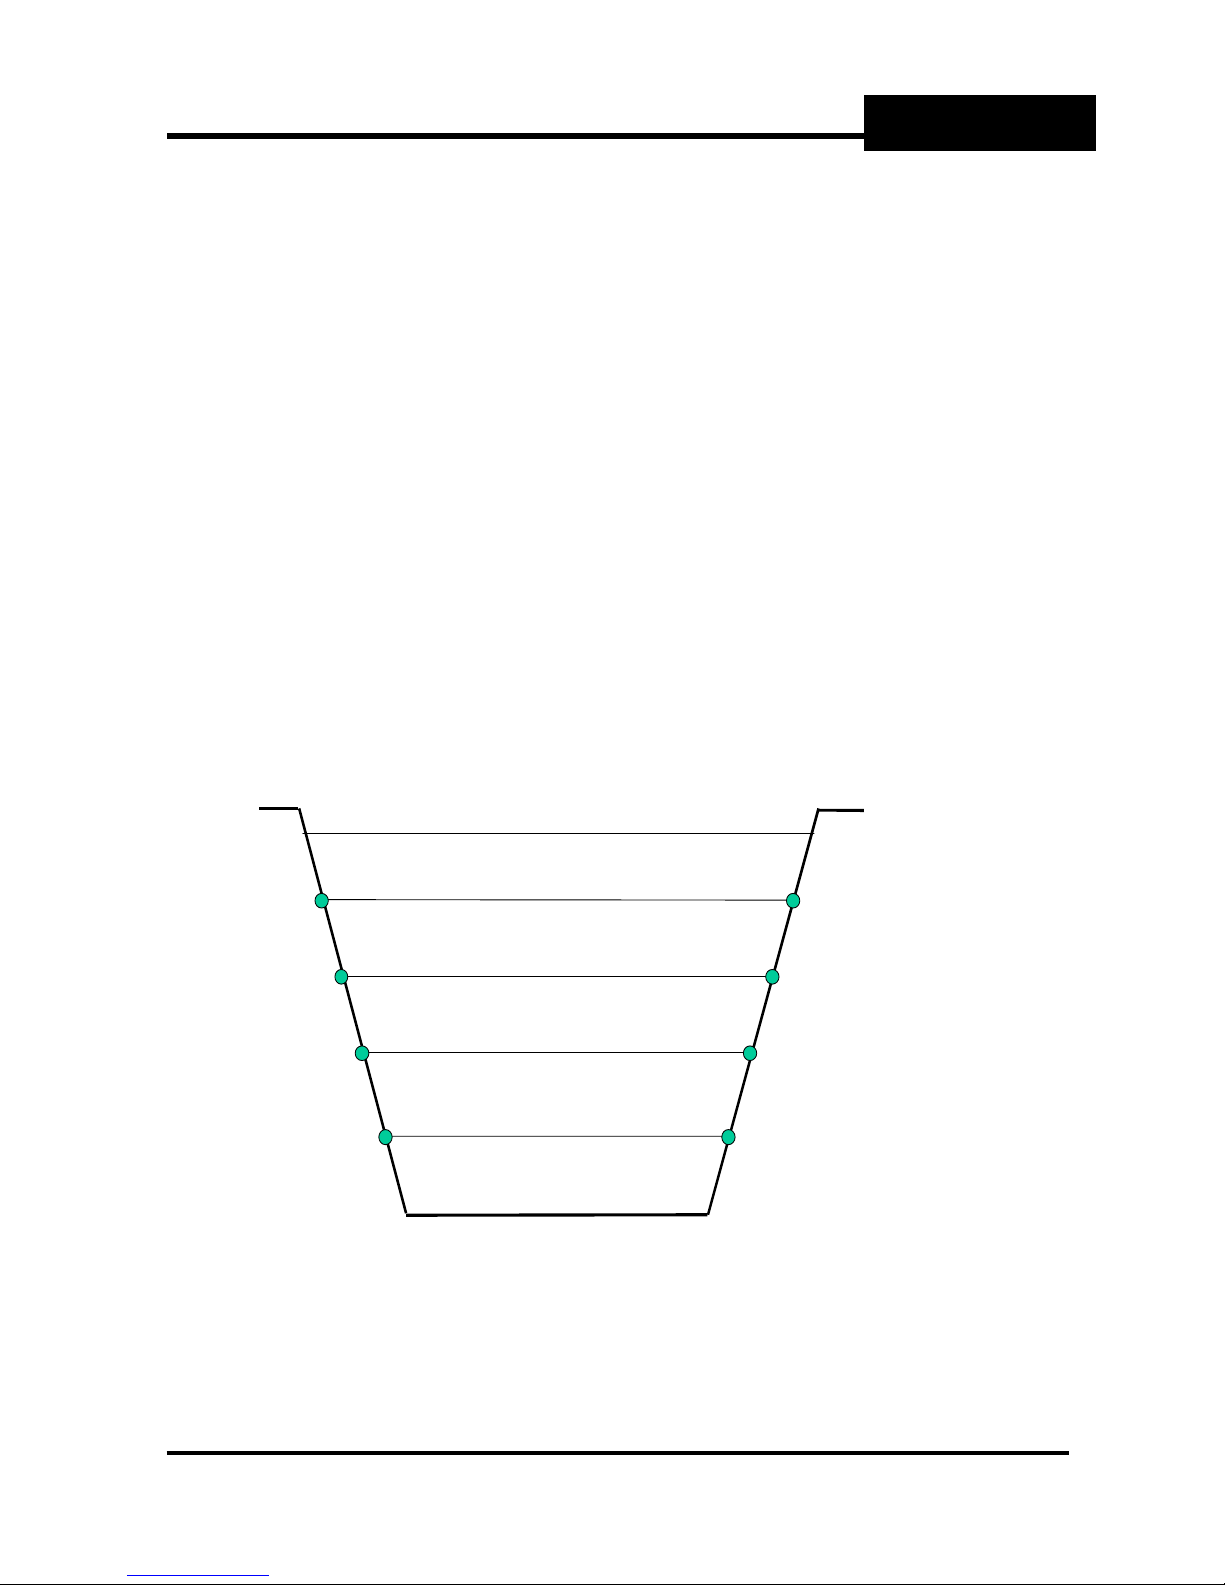
1.2.5.2 Mean section method
In the mean section method, the slice boundaries are defined by the path heights themselves.
The slice velocity is taken as the mean of the upper and lower paths which define the slice
boundaries. The upper boundary of the top slice is the water surface.
The velocit y of the water surface, Vs, is given by:-
Vs = V
Where Ks is a multiplying factor normally between 0 and 1 to allow for the projection
of velocity to the water surface
Vs is limited to a value of V
The lower boundary of the bottom slice is the bed. This bottom slice has a weighting factor,
, normally between 0.4 and 0.8 to allow for the slow moving water near the bed.
K
B
The mean section method is superior in cases where the paths are not near the slice centres,
but the mid section method handles the top slice better. The more paths that are deployed,
the less the differences matter.
The mean section method is illustrated in the following diagram:
+ (V4-V3) x Ks(Hs-H4)/(H4-H3)
4
+ (V4-V3) in the event of (Hs-H4) being greater than (H4-H3)
4
INTRODUCTION
Water Surface
Qs = ½(VS + V4) x (HS – H4) x ½(WS+ W4)
Q
= ½ (V4+ V3) x (H4 – H3) x ½(W4 + W3)
s
= ½ (V3 + V2) x (H3 – H2) x ½(W3 + W2)
Q
s
= ½ (V2 + V1) x (H2 – H1) x ½(W2 + W1)
Q
s
Q
= ½V1(1 + kB) x (H1 – H0) x ½(W1 + W
s
W
W
W
W
Wbed
Width W
4
3
2
1
)
Bed
S
Illustration of the mean section method for 4 paths
Surface Heigh t H
Path 4. Height H
Path 3. H eight H
Path 2. He i ght H
Path 1 Height H
Bed, Height H
S
3
2
1
0
Section 1 INTRODUCTION Page 1-5
Thermo Fisher Scientific
Page 16

Sarasota 2000 Ultrasonic Multipath
Flowmeter
1.2.6 Path configurations
The simplest arrangement is to have a number of paths “in line” above each other. This
would be suitable for a channel of regular cross section shape, which is straight for a long
distance compared with its width (5 to 10 times).
Other configurations are often used in other circumstances. For example:
• Crossed paths where there is uncertainty about the flow direction
• Sloping paths where the de pth is greater on one side compared with the other
• Transducers inset from the banks
• Multiple sets of paths for compound channel shapes
• V configuration used to divide the width because of size or uneven profile
• Multiple channels
• Reflected paths where transducers are on one side only and reflectors “bounce” the
sound pulses back from the far side. This method saves cable but increases path lengths
and is very sensitive to misalignment.
The Sarasota 2000 flowmeter is capable of being configured for these and many other
situations. Please consult Thermo Fisher Scientific for examples and advice.
1.2.7 Transducer frequency
Transducers are manufactured with characteristic frequencies. These will be in the range 1
MHz to 100 kHz. For propagation reasons, the greater the path lengths the lower the
frequency and the larger the transducer. As a guide, path lengths below 10 metres would use
1MHz transducers, 10 to 80 metres 500 kHz, 80 to 150 metres 250 kHz. These figures are for
guidance and the selection may be influenced by other factors relating to the application. For
example, lower frequency transducers may be used to improve penetration in conditions of
high suspended solids provided there is sufficient depth and velocity.
Please consult Thermo Fisher Scientific for advice.
1.2.8 Minimum depth of water
In order to avoid reflections from the bed or surface causing distortion of the ultrasonic
signals, a minimum height of water is necessary above each path. This depends on the
transducer frequency and the path length.
H
= 27 √ ( L / ƒ )
min
INTRODUCTION
Where:
is the minimum height of water above the path, in metres
H
min
L is the path length, in metres
ƒ is the transducer frequency, in hertz
A similar restriction applies to the channel bed, particularly if it is smooth and reflects rather
than absorbs an acoustic signal. The minimum depth of water is therefore usually 2 x H
Section 1 INTRODUCTION Page 1-6
min
Thermo Fisher Scientific
Page 17

Sarasota 2000 Ultrasonic Multipath
Flowmeter
1.2.9 Performance estimates
ISO 6416 describes how to estimate the uncertainty of measurement in any particular
installation. Please consult Thermo Fisher Scientific for advice on this.
1.3 Implementation of the principles of operation in the Sarasota 2000
The principles described in Section 1.2 are used by the Sarasota 2000 subject to certain rules
as listed below. See also Appendix 1:LCD Screens and Appendix 2:GAFA Screens that
describe in detail how the flowmeter is programmed via the LCD screen or PC. Note that the
Sarasota 2000 is a multi-channel device and so paths and levels may be allocated to up to 4
different channels. Overall “station” information (“S” screens) should be entered before
individual channel data (“C” screens). The comments below are how the flowmeter treats
each channel. There are some exceptions, for example, measurement units and flow method
which are common to the station.
Flow
• There is a choice of mean or mid section method of flow calculation.
• The channel cross section shape is entered as a height/width table independent from the
path lengths and angles. (For rectangular or trapezoidal channels it is only necessary to
enter 2 points to define the channels.) The separate table allows the path velocities to be
applied to more accurate slice areas since the defined shape is used rather than a fixed
width for each slice as specified in the Standard.
• Where no path velocity is available, for example at low water height, flow may be inferred
from water level. This is done via a flow estimation table, which may be derived
empiricall y o r by calculation.
Velocity
• The upstream velocity transducers are connected to the upper row of connectors,
downstream to the lower row.
• Path numbering is from the bottom.
• Paths are automatically brought into operation according to the water level and the
programmed minimum water cover.
• Paths entered as being at the same height are taken as crossed, otherwise they are
separate.
• Separate paths may be “normal” with transducers on each side or “reflected” with
transducers on one side only. The latter method saves cable but is not recommended
because of the increased path lengths and sensitivity to alignment.
• The velocities calculated by a pair of paths comprising a crossed path are averaged and
the average velocity used for the slice. The velocity calculated by a separate path is used
alone for the slice.
• When a velocity path fails, the slice boundaries automatically adjust to use only the
working paths.
• A failed path will show on the status indicated on screen C11: Instantaneous Flow &
Level. The path status is a percentage of the “instantaneous” transducer firings which
result in successful reception. If this figure drops below 12% the path is considered to
have failed during the corresponding instantane ous cycle time and is discarded for that
cycle. This could be the result of a fault, misalignment or obstruction.
• Only valid velocity paths which are in the water and covered by sufficient water to be
operating are used for the status indication.
• Each path may have a multiplying factor (“X Factor”) assigned to it. This will normally be 1
but may be different in exceptional circumstances for calibration purposes. An example of
when this might be is when the transducers are not exactly at the channel edges .
• Transducers in each velocity path may be set to operate simultaneously (the norm) or
sequentially. Simultaneous operation allows more measurements in a given time but
INTRODUCTION
Section 1 INTRODUCTION Page 1-7
Thermo Fisher Scientific
Page 18

Sarasota 2000 Ultrasonic Multipath
Flowmeter
there is a small possibility of confusing a signal reflected back to the firing transducer with
one received from the opposite transducer.
Water level
• Levels are combined in the following algorithm:
Only non-faulty measurements are used.
Highest and/or lowest are discarded until 3 remain.
The one furthest from the others is dis carded leaving 2.
The remaining 2 measure ments are averaged for arbitrated level if within an
acceptable band defined on screen C20: Channel Configuration.
If not, level determination fails and flow cannot be calculated.
If only 1 level measurement is installed or only 1 is not discarded, it is used as the
arbitrated level.
If not OK, level fails and flow cannot be calculated.
• Levels defined as valid but rejected by the algorithm will be indicated on the level status,
screen C10: Instantaneous Flow & Level.
• Where the flowmeter is installed in a closed conduit which always runs full, the channel
shape is entered in the usual way but there is no need for a level measurement. The
flowmeter is programmed as though it had an encoder level input (section 2.3.3.2.3) with
a reference level at the top of the conduit and a cal. factor of zero.
Transducer and bed levels
All heights may be set to a fixed datum (local or national) or relative to mean bed level. The
former requires a height for the bed and avoids re-entering all path and level transducer
heights in the event of a change to the bed.
General
• “Instantaneous” means the average over the cycle time scale. This defaults to 10
seconds but may be set to 1 minute for large numbers of paths or long path lengths via
screen S22: Station Configuration.
• The average period is the time over which measurements are averaged for the purpose
of output or logged data. If the cycle time is set to 1 minute, the average period cannot be
shorter.
• At the data logging intervals, the averaged values of the selected data are stored.
• Analogue inputs will normally be linear. However, screen C212: Analogue Input allows
non linear characteristics to be entered.
• When operating on an external 12 volt source, for example from a solar panel, power
saving is possible by using intermittent operation. Power consumption in normal and
intermittent modes is quoted in the Appendix 3:Specification
• The LCD display will turn off 15 minutes after the last keyboard operation. This is to
reduce power and prolong LCD life. Pressing any key will turn it on again.
INTRODUCTION
Section 1 INTRODUCTION Page 1-8
Thermo Fisher Scientific
Page 19

Sarasota 2000 Ultrasonic Multipath
Flowmeter
SYSTEM COMPONENTS
2 SYSTEM COMPONENTS
2.1 Flowmeter system overview
• The Thermo Scientific Sarasota 2000 is an ultrasonic multi-path flowmeter, which
complies with ISO6416.
• It employs state of the art technology to achieve excellent performance in conditions
which have previously be en outside the scope of this type of instrument.
• Smart transducer technology incorporating drive and receiver circuits optimises signal to
noise ratio and minimises losses. The smart circuits are located inside the transducer
housings except for the 1 MHz transducers. In that case they are in sealed in-line
housings known as Tboxes.
• Automatic adjustment of receiver gain and transducer drive voltage (HT).
• Low power consumption and intermittent modes make mains free operation feasible.
• Multi-path operation, (up to 32 via multi-drop facility made possible by smart transducer
addressing.)
• Multiple depth inputs,
- up to 16 ultrasonic depth transducers
- up to 4 auxiliary depth gauges (via 4-20 mA inputs.)
- up to 2 auxiliary depth gauges via BCD inputs
- up to 2 depth inputs via pulses direct from direct from shaft encoder.
• Multiple flow channels – up to 4 separate channels measured by a sin gle instrument. The
velocity pa ths and depths are allocated to the channels durin g set up.
• Up to 4 analogue 4-20 mA outputs and two 16 bit binary coded decimal (BCD) I/Os
• O v er a l l s y st e m al ar m re l ay
• Four relays (volt free contact) option. Programmable, for example for alarms, status,
totaliser pulses.
• Three serial ports. RS232 for PC, RS232 for modem and RS485 for site multi-drop
instrument communications
• IR communication link alternative for PC
• Internal data logger, 1 Mbyte capacity, programmable.
• Water temper ature measurem e nt at each smart transducer (except 1 MHz transduc e r s )
Section 2, SYSTEM COMPONENTS, Page 2-1
Thermo Fisher Scientific
Page 20
Sarasota 2000 Ultrasonic Multipath
Flowmeter
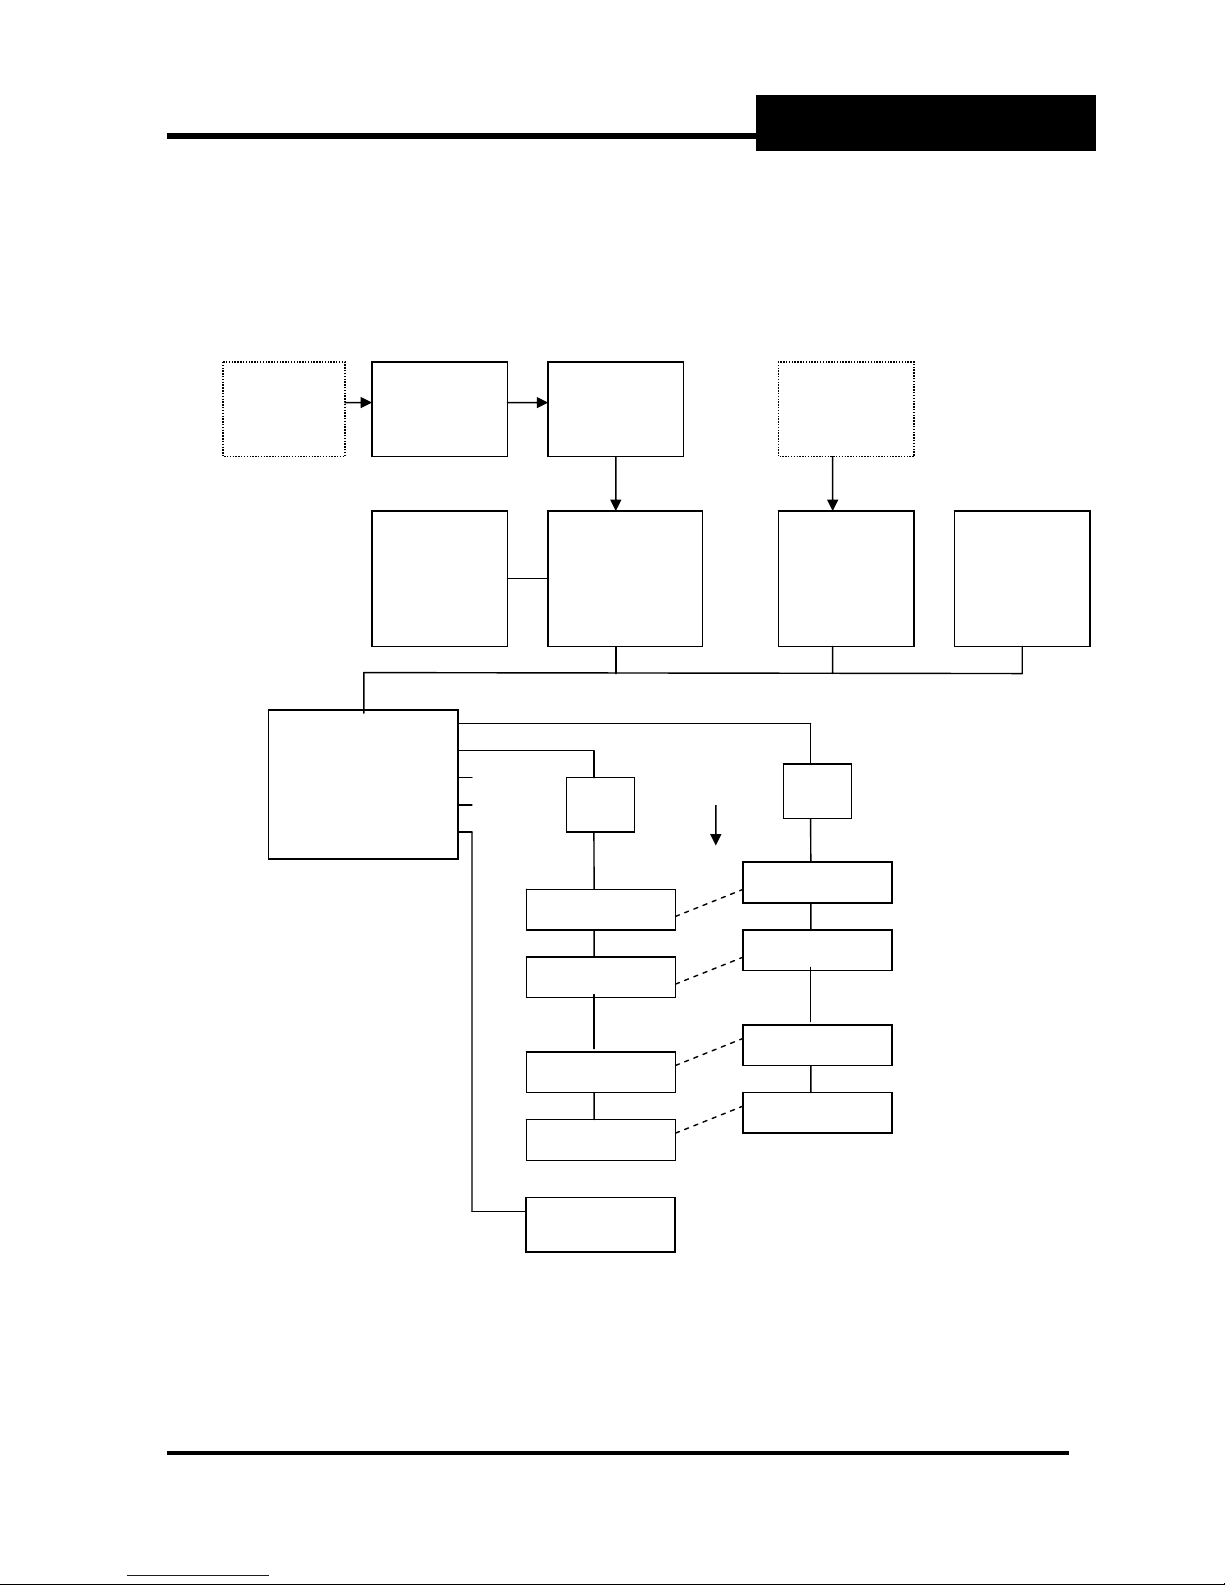
2.2 Family tree
The schematic diagram below is an illustration of a four path system.
SYSTEM COMPONENTS
External
power
source
Transducer A u/s
interface A d/s
(option B u/s
of 1 to 4) B d/s
Level W
Power
supply
Display and
keyboard
Battery
Central
Processor Unit
inc. 3 x serial
I/O & system
relay
Star
J box
Trans. 1 d/s
Trans. 2 d/s
Flow
Auxiliary
depths
Input/output
4-20 mA,
BCD
(option of
none,1,or 2)
Star
J box
Trans. 1 u/s
Trans. 2 u/s
Relays
(4 x VFC)
(optional)
Section 2, SYSTEM COMPONENTS, Page 2-2
Trans. 3 u/s
Trans. 3 d/s
Trans. 4 u/s
Trans. 4 d/s
Level
Transducer
Thermo Fisher Scientific
Page 21
Sarasota 2000 Ultrasonic Multipath
Flowmeter
2.3 Flowmeter contents and options
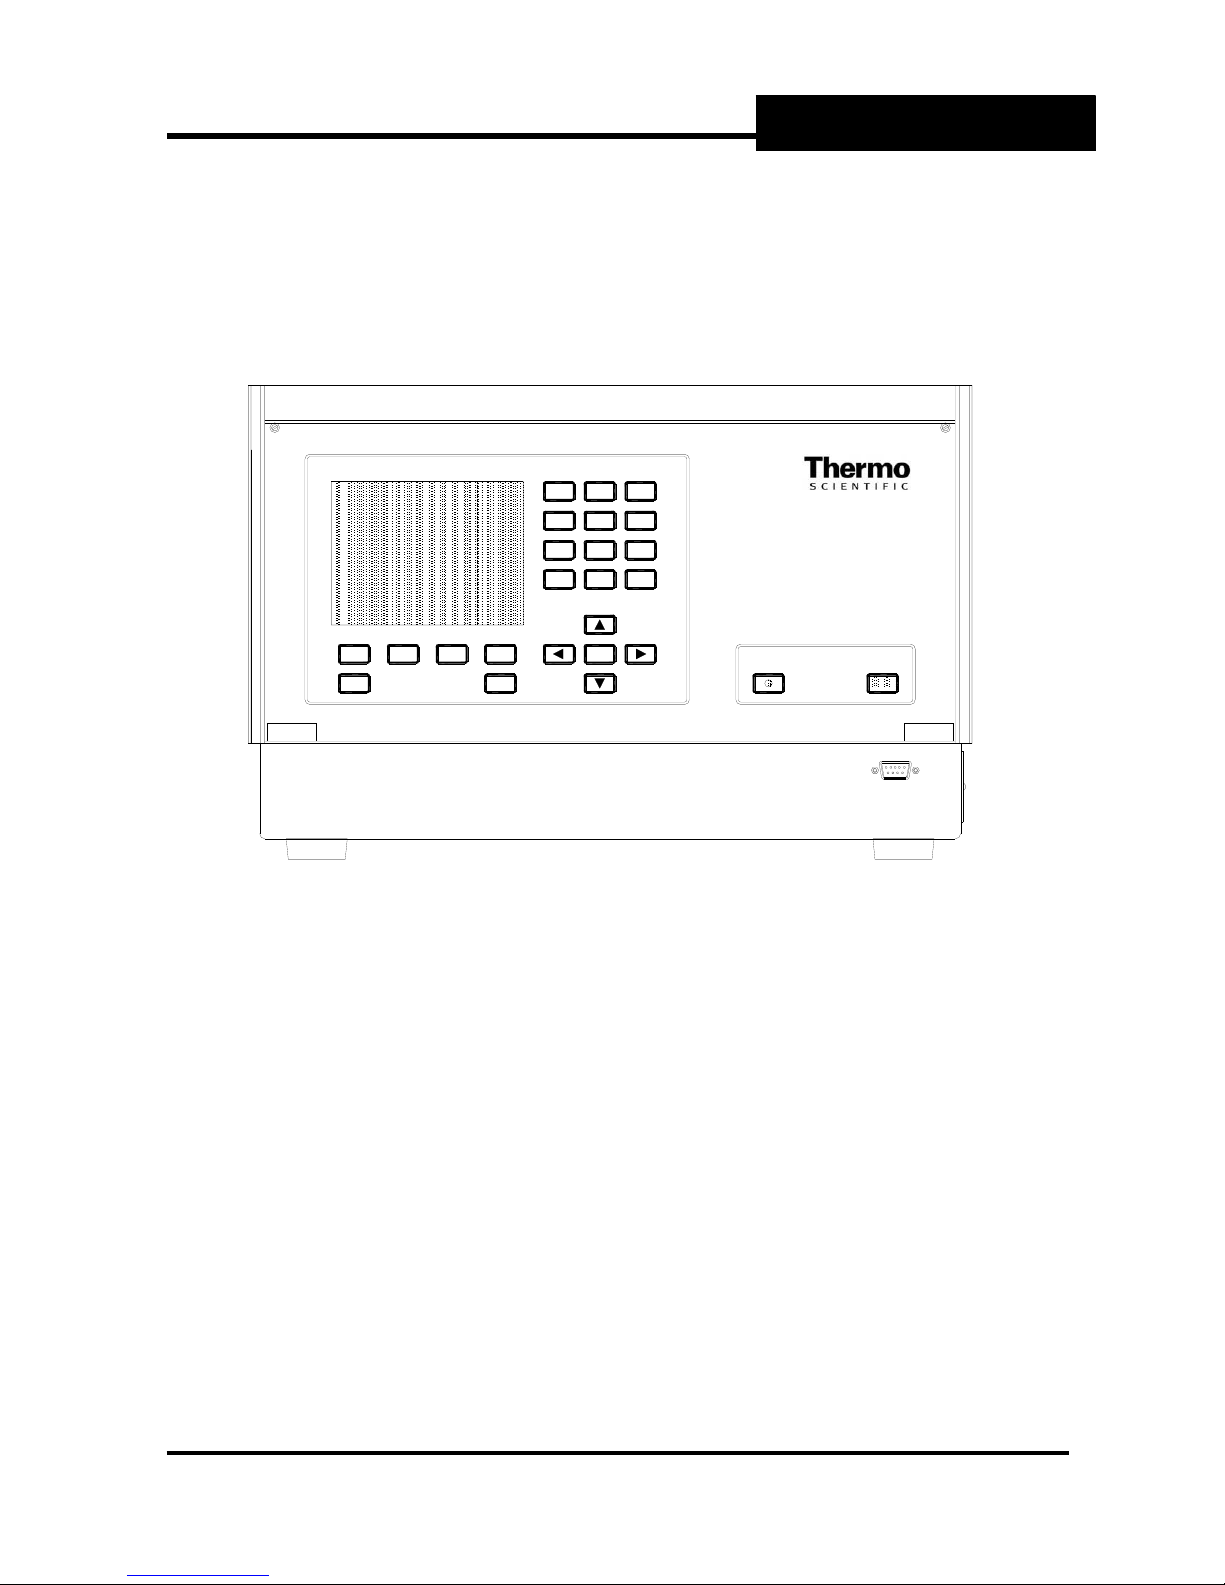
2.3.1 Flowmeter layout
Fig 1 Sarasota 2000 Flowmeter
Fig 1 shows the front panel view with keyboard, LCD display and status indicator. Also shown
are the IR link and RS232 port, which are alternative methods of connection to a PC, see
Section 2.6.
The contents are described in Sections 2.3.2 (the “core” items which are always present) and
Section 2.3.3 (the items which are optional depending on the number of paths and I/O
requirements).
The keyboard allows access to the flowmeter firmware for setting up and interrogation
purposes, using the display. This is described in Section 2.5
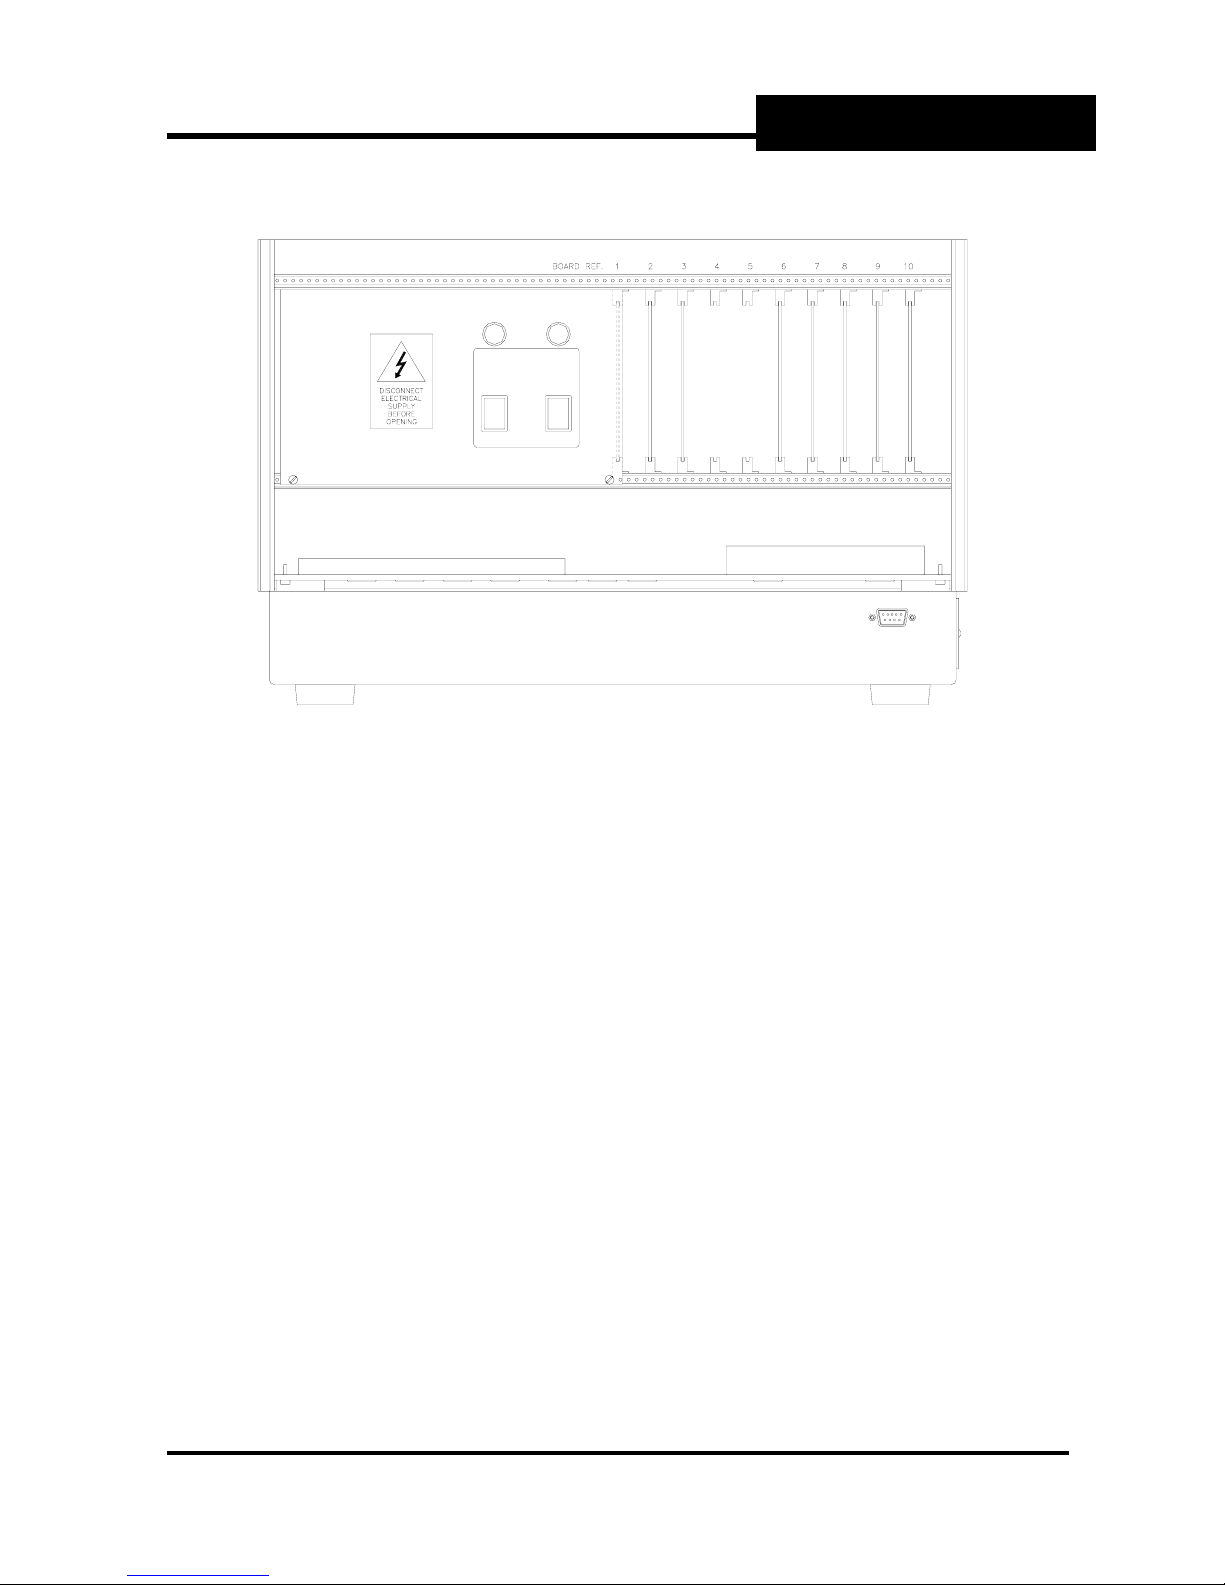
Fig 2 is the same view with the front panel removed to show the layout of the electronic cards,
fuses and power switches.
s„˜„™•š„@m›’šŒ–„š‹@u’š˜„™•”Œ†@f’•ž@mˆšˆ˜
esc
alarm
reset
RS
TQUV
W
XY
P
KOMN
enter
SYSTEM COMPONENTS
status
i˜da
rsRSR
Section 2, SYSTEM COMPONENTS, Page 2-3
Thermo Fisher Scientific
Page 22
Sarasota 2000 Ultrasonic Multipath
Flowmeter
T3.15A F5A
MAINS ISOLATE
SYSTEM COMPONENTS
RS232
Fig 2 Sarasota 2000 Flowmeter internal components
Main rack, from left to right:-
Power supply with fuses and powe r s wi t c h es ( s e e 2. 3 .2.1)
Card position 1 - Status/power management card
Card position 2 - I/O card 1 (if fitted) (see 2.3.3.2)
Card position 3 - I/O card 2 (if fitted)
Card position 4 – Reserved for future enhancements
Card position 5 – Reserved for future enhancements
Card position 6 - TIF 4 (Transducer interface card 4) (if fitted)
For connection to up to 8 velocity paths (16 transducers) via rear panel connectors G
and H, upstream (u/s) and downstream (d/s) and up to 4 ultrasonic depth transducers via
connector Z (see Fig 4 and 2.3.3.1)
Card position 7 - TIF 3 (if fitted)
Rear panel connectors E,F for up to 8 velocity paths and Y for up to 4 depths.
Card position 8 - TIF 2 (if fitted)
Rear panel connectors C,D for up to 8 velocity paths and X for up to 4 depths.
Card position 9 - TIF 1 (always fitted)
Rear panel connectors A,B for up to 8 velocity paths and W for up to 4 depths.
Card position 10 - Central Processor (CPU) (see 2.3.2.2)
The plinth, beneath the main rack, houses the internal battery (see Section 2.3.2.1), the
connectors (see Fig 5) and the relay card.
Note
Power should be switched off and the isolate switch turned off before any cards are
removed or plugged in.
Section 2, SYSTEM COMPONENTS, Page 2-4
Thermo Fisher Scientific
Page 23

Sarasota 2000 Ultrasonic Multipath
Flowmeter
2.3.2 Core items
The enclosur e houses t he followi ng core it ems as well as the opt ional items listed i n Sectio n
2.3.3:
• power supply and status/power management.
• internal battery
• central processor
• display and keyboard
• connectors for transducers and peripheral devices.
2.3.2.1 Power supply
The standard power supply requires a mains input between 85 and 264 volts AC, 47 to 64 Hz,
backed by an internal 12 V battery for operation in the event of AC power failure.
The fuses shown above are 3.15AT (slow blow) for the mains electricity input and 5AF (quick
blow) for the low voltage from the power supply module.
The “POWER” switch isolates the flowmeter and its internal battery from the external (AC)
power source. When switched off, the flowmeter will continue to operate from the internal
battery unless the “ISOLATE” switch is also off. The “ISOLA TE” switc h disco nnect s all powe r
from the flowmeter.
The internal battery is automatically charged by the power supply when external power is
being supplied and the “POWER” switch is on, regardless of the position of the ISOLATE
switch. When the external supply is off the battery is capable of operating the flowmeter for a
minimum of 24 hours. This period will be longer in cases when INTERMITTENT OPERATION
is being used.
Alternatives of 12 V dc and 24 V dc power sources are available as described in Appendix 3:
Specification.
See Appendix 3: Specification for details of power saving through intermittent operation
2.3.2.2 Central processor (CPU)
The central processor carries out the control and timing functions, stores and runs the
operating program and stores the data logs. It controls the status indicator, see “controls and
displays”, Section 2.5.
It also controls the three s erial i/o ports. See section 2.3.2.4
2.3.2.3 Keyboard and display
The keyboard allows the operator to program the flowmeter and to display measurements,
computed results and diagnostic information via the display (see Section 2.5). These
functions may alternatively be performed via the PC based GAFA software (see Appendix 2:
GAFA Screens).
SYSTEM COMPONENTS
.
Section 2, SYSTEM COMPONENTS, Page 2-5
Thermo Fisher Scientific
Page 24
Sarasota 2000 Ultrasonic Multipath
Flowmeter
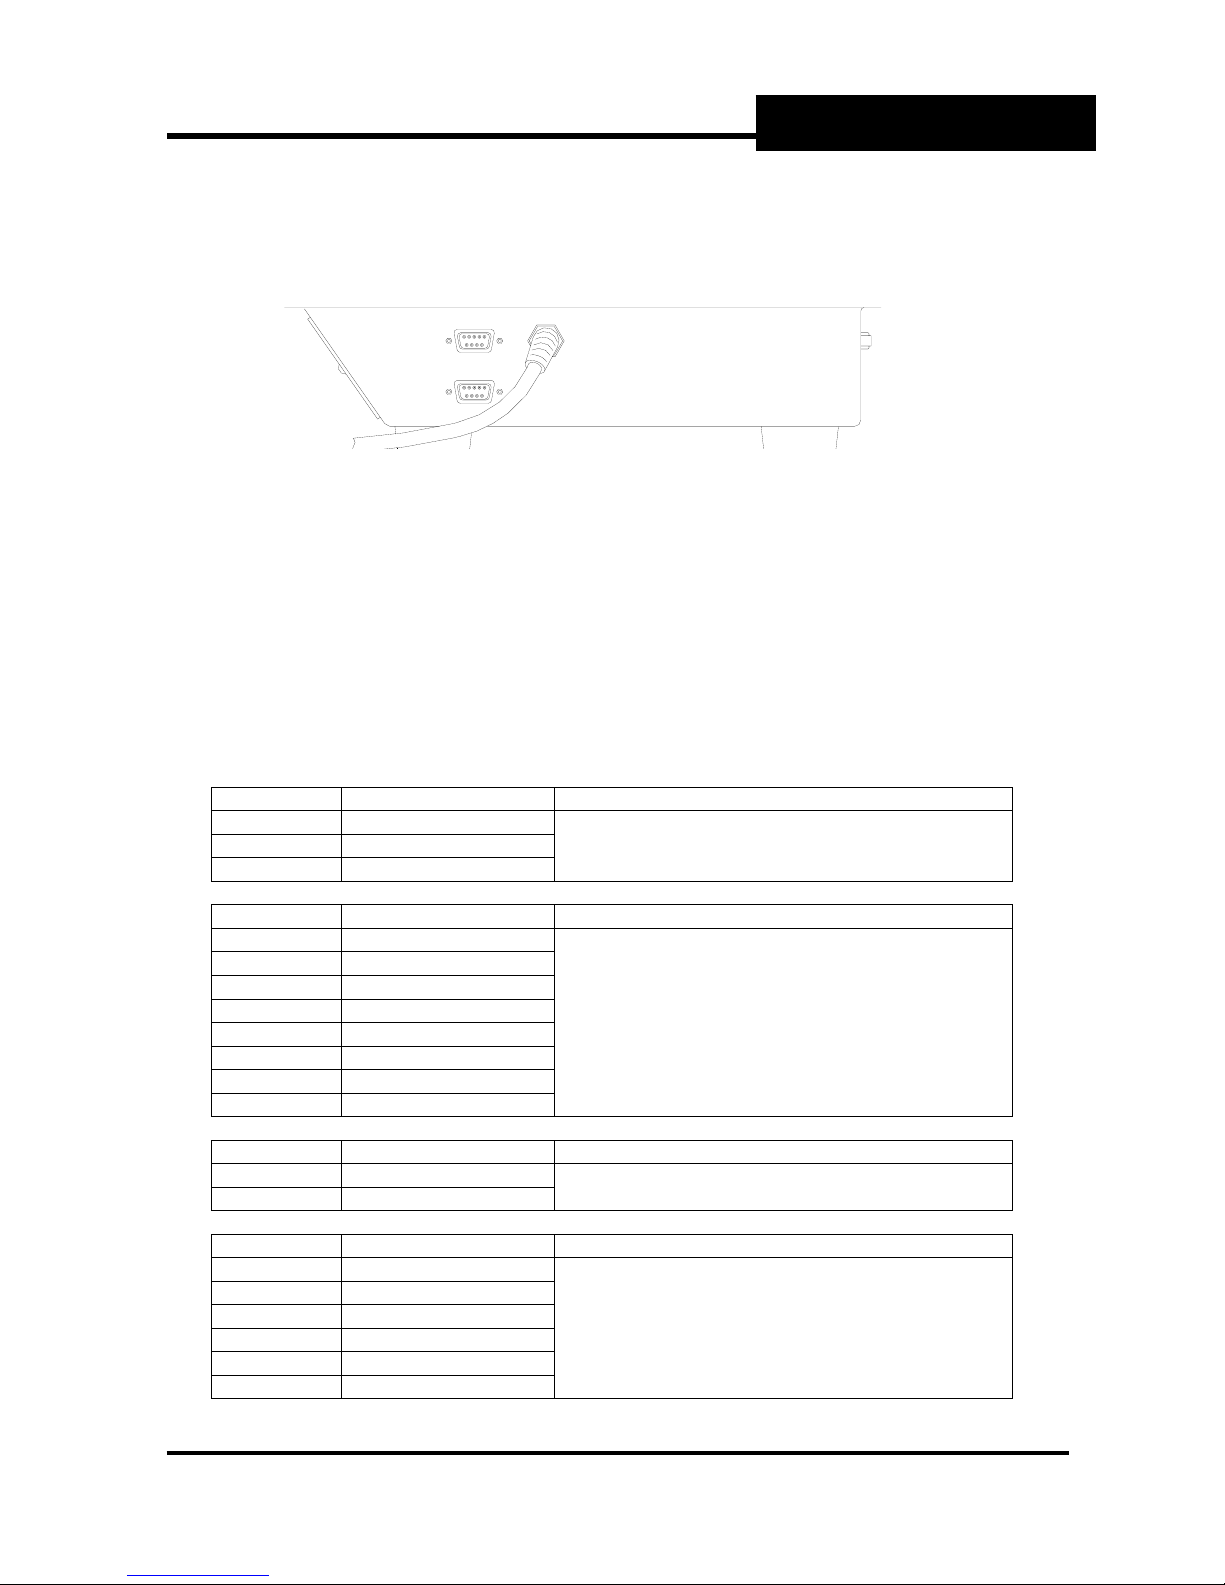
2.3.2.4 Serial connections
MODEM (RS232)
RS485
Fig 3 Side panel serial connections
There are 3 serial ports:
• RS232 via 9 way D connector (female) on the front of the plinth. See Figs 1 & 2. This port
is used for connection to a PC.
• RS232 via 9 way D connector (male) on the side of the plinth. See Fig 3. This port is used
for connection to a modem.
• RS485 via 9 wa y D connect or (female) on the side of the plinth. See Fig 3. This port is
used for multi-drop instrument connection networks using Modbus protocol in full or half
duplex as set up via the front panel (Appendix 1: LCD Screens). Jumper links on the CPU
board may need to be altered depending on the load conditions. Please consult Thermo
Fisher Scientific for instructions on setting these links.
Pin (F) Signal Comment
2 TxD
3 RxD
5 0V
Pin (M) Signal Comment
1 CD
2 RxD
3 TxD
4 DTR
5 0V
7 RTS
8 CTS
9 R1
Pin (F) Signal Comment
8 B
9 A
Pin (F) Signal Comment
3 0V
4 -RxD
5 +RxD
7 0V
8 -TxD
9 +TxD
RS232, PC connection
Front panel 9 way female D connector
RS232, Modem connection
Side panel 9 way male D connector
RS485, 2 wire connection
Side panel 9 way female D connector
RS485, 4 wire connection
Side panel 9 way female D connector
SYSTEM COMPONENTS
Section 2, SYSTEM COMPONENTS, Page 2-6
Thermo Fisher Scientific
Page 25
Sarasota 2000 Ultrasonic Multipath
Flowmeter
2.3.3 Optional items
The flowmeter enclosure also houses an optional number of the following cards:
• Transducer interface cards (TIFs) (up to 4 may be fitted).
• I/O card (none, 1 or 2 may be fitted)
• Relay (VFC) card (none or 1 may be fitted)
Details are given in Appendix 3: Specification section, but in summary:
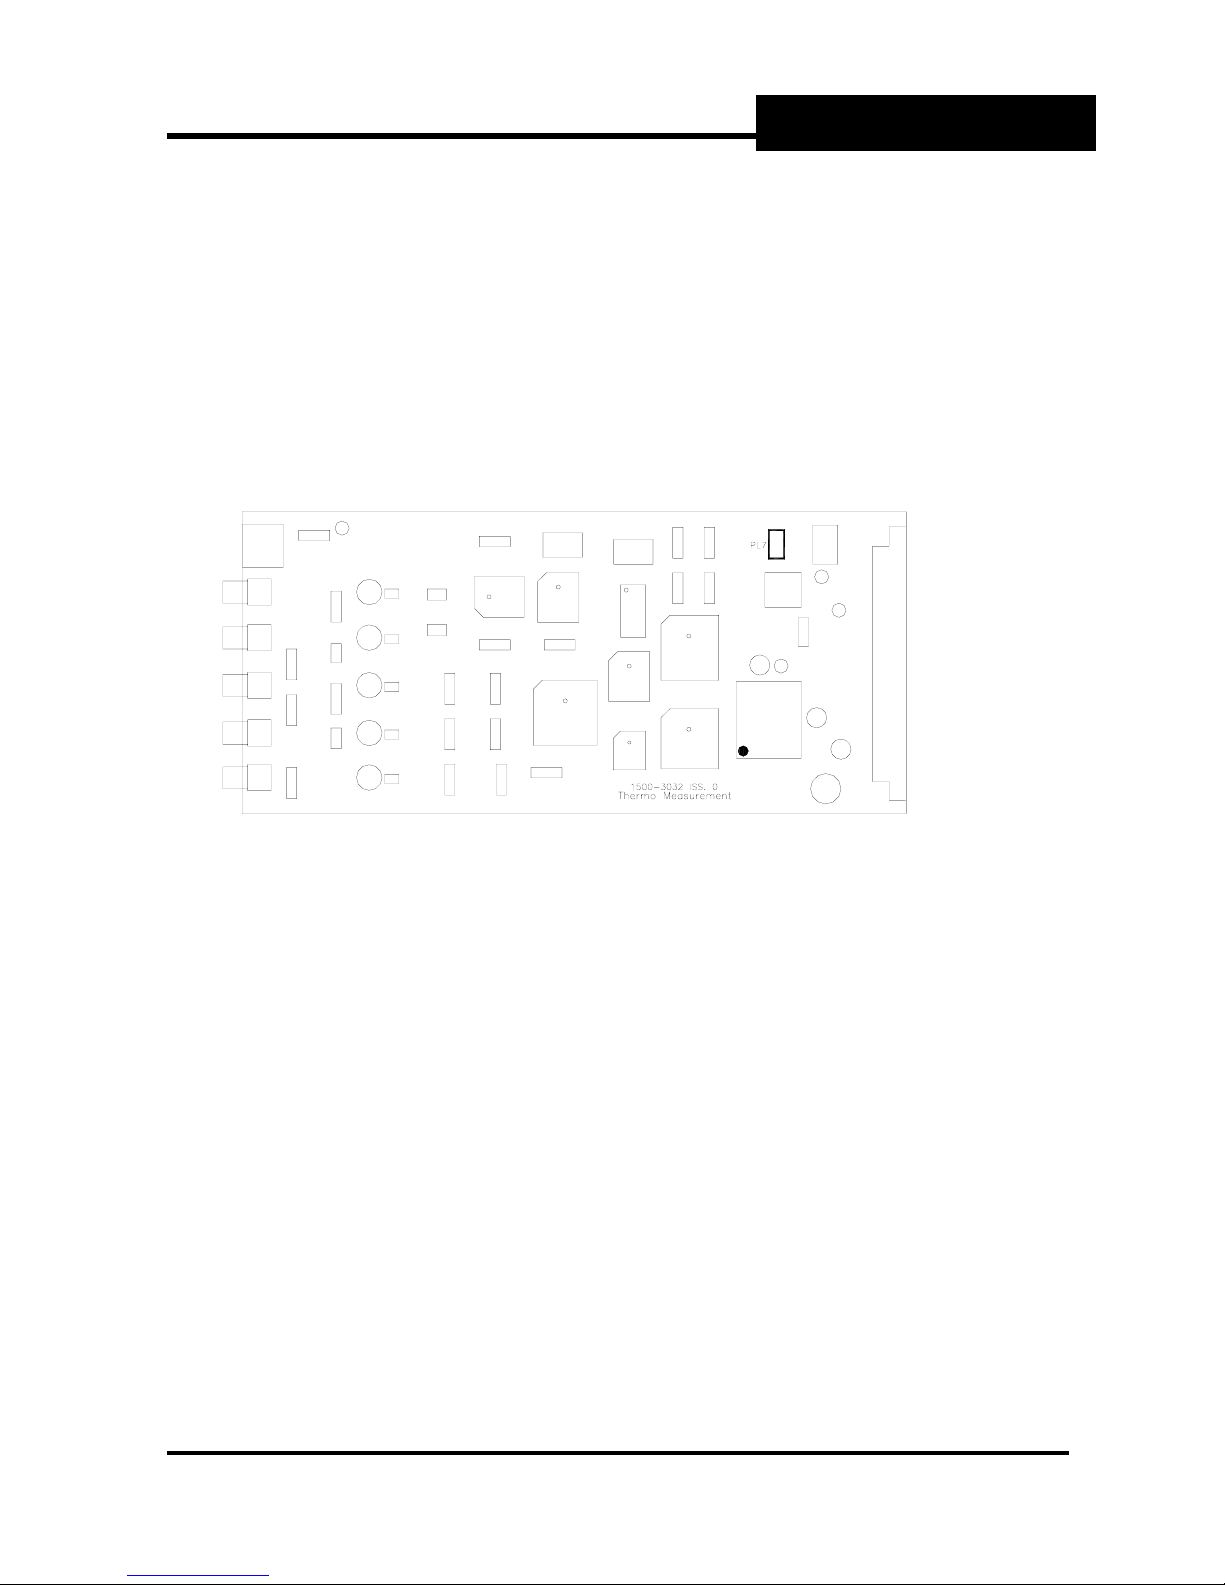
2.3.3.1 Transducer interface card (TIF)
SYSTEM COMPONENTS
Fig 4 Transducer Interface Card (TIF)
The flowmet er has capacity for up to four TIFs as st andard. Each one is capable o f being
connected to 2 velocity paths (4 transducers) directly or 8 paths (16 transducers) by multidrop, and 1 ultrasonic depth transducer directly or 4 by multi-drop. Each TIF must have its
address set via the jumper links PL7 shown in the diagram above. The addresses are in the
form of a binary code with the least significant digit at the top of PL7. No link for 0; link present
for 1.
TIF1, card position 9, address 4, PL7 Links 0100
TIF2, card position 8, address 5, PL7 Links 0101
TIF3, card position 7, address 6, PL7 Links 0110
TIF4, card position 6, address 7, PL7 Links 0111
When setting up the flowmeter, the cards and their addresses are programmed via the
keyboard and screens as described in Appendix 1: LCD Sc reens or v ia GA FA as desc ribed in
Appendix 2: GAFA Screens. When a TIF is changed during service, the replacement must
have the same address set.
Section 2, SYSTEM COMPONENTS, Page 2-7
Thermo Fisher Scientific
Page 26
Sarasota 2000 Ultrasonic Multipath
Flowmeter
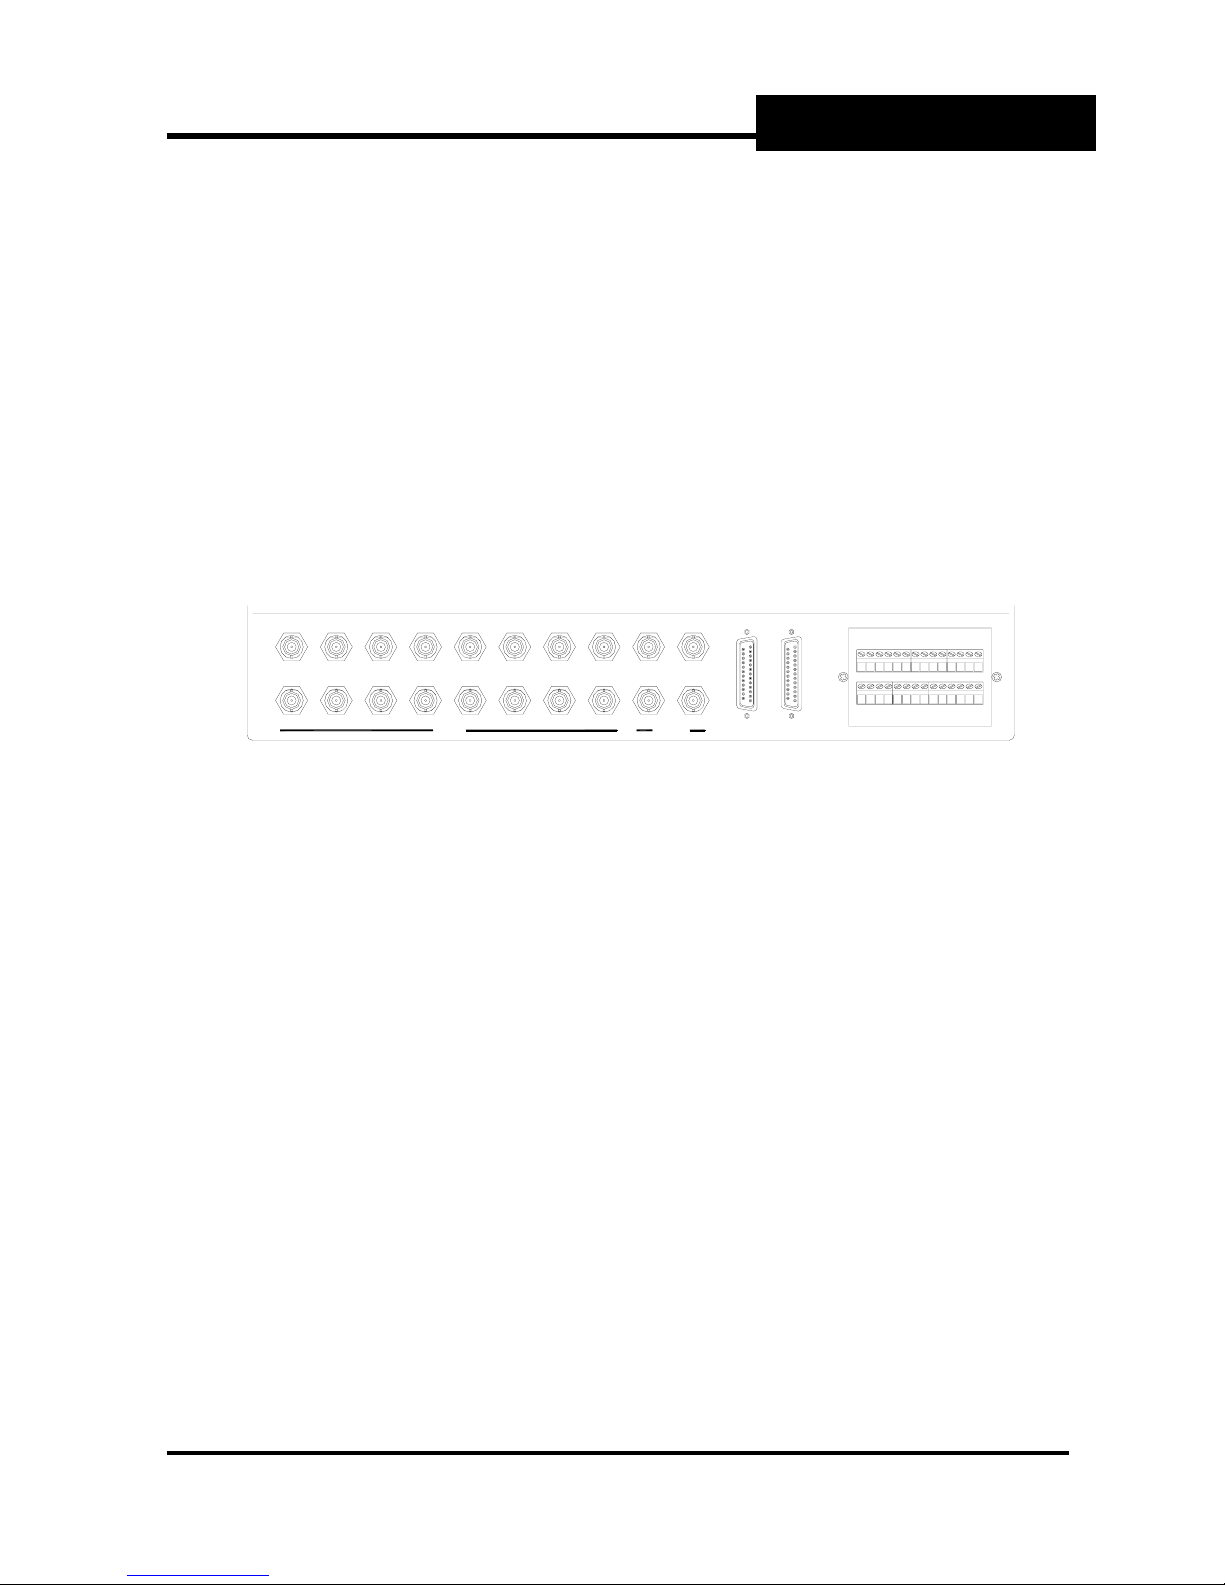
Each TIF plugs into the main rack and is wired to the back panel co-axial connector pairs A to
H for onward connection to the velocity path transducers and W to Z for connection to
ultrasonic depth transducers at the time of installation. Fig 5 shows the rear panel connectors.
TIF 1 in card position 7 is connected to A and B and to W.
TIF 2 in card position 6 is connected to to C and D and X etc.
Note that the upstream velocity transducers must be connected to the upper row of A to H
and the downstream ones to the lower row.
The standard rear panel allows connections to 32 velocity paths (64 transducers) and 16
ultrasonic depths via “multi-drop” wiring of the smart transducers.
The velocity transducers may be allocated to up to 4 water channels without any restriction
other than the total number and cable lengths. Ultrasonic depth transducers are limited to 4
per channel via multi-drop. See Section 2.4.
SYSTEM COMPONENTS
PATH A B C D E F G H
FLOW
W Y
X Z
DEPTH
BCD1
BCD2
21
16
15
543876
1817 19 2120 22
9
1210 11 13 14
23
2624 25 2827
Fig 5 Rear panel connections
The top row of coaxial connectors are for the upstream transducers, the bottom row for the
downstream ones.
Paths may be connected individually, for example, path 1 to A, 2 to B etc, or multi-dropped via
star junction boxes. For example, paths 1 to 4 connected to A etc.
Ultrasonic depths may be connected individually to W,X,Y,Z or multi-dropped via star boxes.
For BCD and analogue connections, see Section 2.3.3.2
Section 2, SYSTEM COMPONENTS, Page 2-8
Thermo Fisher Scientific
Page 27
Sarasota 2000 Ultrasonic Multipath
Flowmeter
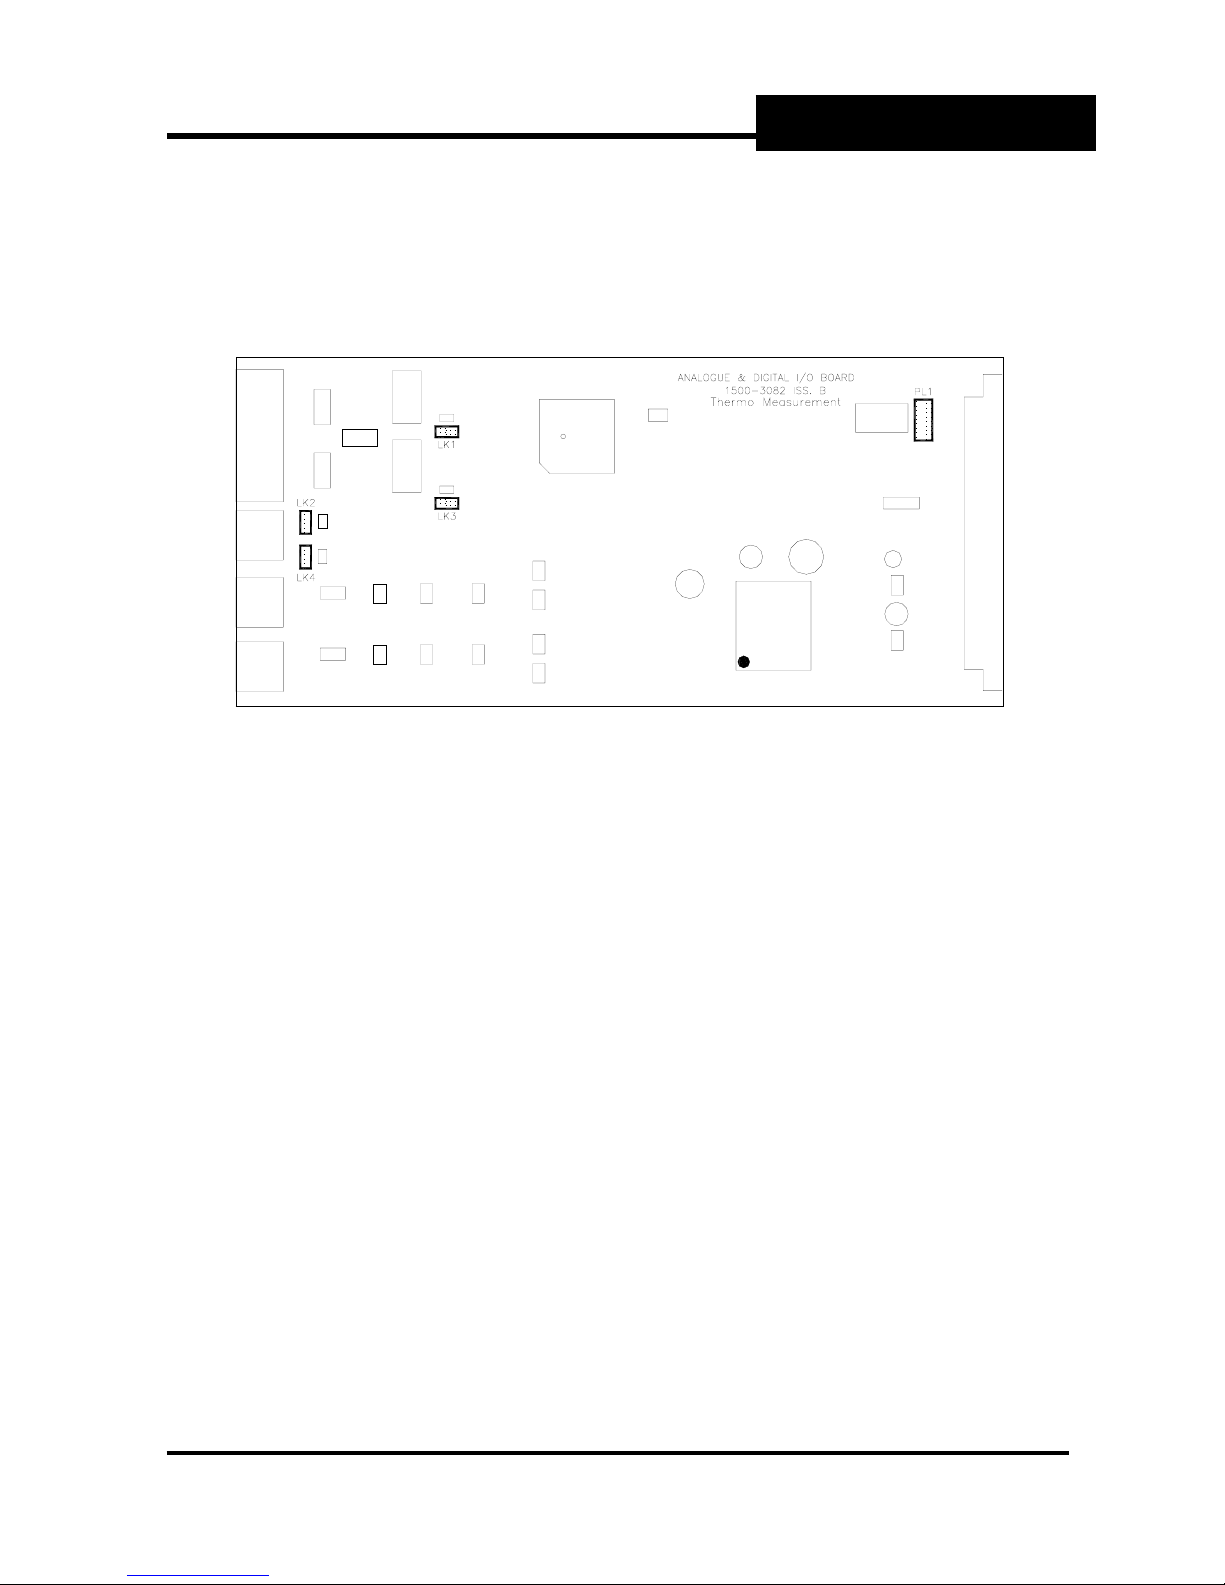
2.3.3.2 Input/Output card.
2.3.3.2.1 I/O card layout
SYSTEM COMPONENTS
Fig 6 I/O card
Most flowmeters will require this facility. Up to two I/O cards may be fitted.
The cards have an address which is set on the links PL1 as shown in Fig 6. This is similar to
the TIF addressing, with least significant digit at the top.
I/O 1, card position 2, address 2, PL1 Links 0010
I/O 2, card position 3, address 3, PL1 Links 0011
Each I/O card has:
• Two analogue outputs (normally 4-20 mA)
• Two analogue inputs (normally 4-20 mA)
• 16 bi t di gi ta l I /O (4 x 4 bit b i na ry c od e d dec i mal dig it s (B C D)). I n p ut or ou tp ut , s ele c te d b y
jumper on I/O card.
• Phased encoder depth i/p
Fig 5 shows the positions of the connectors. The phased encoder depth inputs share the BCD
connectors .
Section 2, SYSTEM COMPONENTS, Page 2-9
Thermo Fisher Scientific
Page 28

Sarasota 2000 Ultrasonic Multipath
Flowmeter
2.3.3.2.2 Analogue I/O
Analogue connections are normally 4-20 mA and are made to the screw terminal blocks at the
right of the rear panel. The upper block connects to I/O board 1 and the lower to I/O board 2.
Connections 1 to 6 (upper) and 15 to 20 (lower) are the analogue inputs. Connections 7 to 14
(upper) and 21 to 28 (lower) are the 4-20 mA outputs.
The table whi c h f ol l o ws s hows the connections.
Analogue inputs, 4-20 mA (0-20mA) or 0-5V
The total input range is 0-20mA though analogue inputs are normally set up as 4-20 mA. On
board links LK2 and LK4 may be removed to accept 0 to 5 volts instead (Fig 6).
Each i/p has 3 connections, 18 V excitation, input and 0V.
If the external signal source supplies the power, connections are made to input (4-20 mA +)
and to 0V (4-20 mA-).
If the Sarasota 2000 flowmeter is to power the loop, connections are made to 18V (4-20 mA+)
and to Input (4-20 mA-)
Analogue outputs, 4-20 mA
Analogue outputs are always 4-20 mA.
Each o/p has 4 connections, 18V excitation, +V, -V and 0V.
If the Sarasota 2000 flowmeter is to power the loop, the output will not be isolated. A link is
made between 18V and +V and the 4-20 mA loop is between –V and 0V.
If the external device powers the loop, the output is isolated. The 4-20 mA loop is between +V
and -V
Note For compliance with EMC emissions control, analogue i/o cables should be screened
and the screen connected to one of the 0V pins for each i/o card.
See the following table for connection details.
SYSTEM COMPONENTS
Section 2, SYSTEM COMPONENTS, Page 2-10
Thermo Fisher Scientific
Page 29

Sarasota 2000 Ultrasonic Multipath
Flowmeter
4-20 mA CONNECTIO N S (Refer to Fig 5)
Pin Signal Connect for Internal
loop power
1 0V N/C 4-20 mA 2 Input 4-20 mA - 4-20 mA +
3 18V excitation 4-20 mA + N/C
4 0V N/C 4-20 mA 5 Input 4-20 mA - 4-20 mA +
6 18V excitation 4-20 mA + N/C
7 0V 4-20 mA - N/C
8 -V 4-20 mA + 4-20 mA 9 +V 4-20 mA +
10 18V
11 0V 4-20 mA - N/C
12 -V 4-20 mA + 4-20 mA 13 +V 4-20 mA +
14 18V
15 0V N/C 4-20 mA 16 Input 4-20 mA - 4-20 mA +
17 18V excitation 4-20 mA + N/C
18 0V N/C 4-20 mA 19 Input 4-20 mA - 4-20 mA +
20 18V excitation 4-20 mA + N/C
21 0V 4-20 mA - N/C
22 -V 4-20 mA + 4-20 mA 23 +V 4-20 mA +
24 18V
25 0V 4-20 mA - N/C
26 -V 4-20 mA + 4-20 mA 27 +V 4-20 mA +
28 18V
Link 9-10
Link 13-14
Link 23-24
Link 27-28
0 – 5 V CONNECTIONS (Refer to Fig 5)
Alternative connections require links LK2 and LK4 to be removed (Fig 6).
Pin Signal Connection Comment
1 0V 0-5 V –ve
2 Input 0-5 V +ve
4 0V 0-5 V –ve
5 Input 0-5 V +ve
15 0V 0-5 V –ve
16 Input 0-5 V +ve
18 0V 0-5 V –ve
19 Input 0-5 V +ve
Connect for external
loop power
N/C
N/C
N/C
N/C
I/O card 1, input 1
I/O card 1, input 2
I/O card 2, input 1
I/O card 2, input 2
SYSTEM COMPONENTS
Comment
I/O card 1, Input 1
I/O card 1, Input 2
I/O card 1, Output 1
Int powered, not isolated
Ext powered, isolated
I/O card 1, Output 2
Int powered, not isolated
Ext powered, isolated
I/O card 2, Input 1
I/O card 2, Input 2
I/O card 2, Output 1
Int powered, not isolated
Ext powered, isolated
I/O card 2, Output 2
Int powered, not isolated
Ext powered, isolated
Section 2, SYSTEM COMPONENTS, Page 2-11
Thermo Fisher Scientific
Page 30

Sarasota 2000 Ultrasonic Multipath
Flowmeter
2.3.3.2.3 16 bit BCD I/O and encoder input
The 16 bit parallel BCD signal may act as either input or output according to the jumper links
LK1 and 3 on the board. See Fig 6. The default condition is for BCD INPUT
example from a shaft encoder counter.
The format is 5 Volt positive logic, though the input can accept inverted logic if specified via
the screens (Appendix 1: LCD Screens).
Handshaking is via strobes STRB1 and STRB2. STRB1 relates to bits 1 to 8 and STRB2 to
bits 9 to 16.
There are two 25 way female D connectors labelled BCD1 and BCD2. BCD1 is connected to
I/O option card 1 if fitted and BCD2 to I/O option card 2 if fitted.
BCD input
• When used as an input, the 4 digit BCD number is normally used as an auxiliary level.
• Operating units are selected via the screens (Appendix 1: LCD Screens) or GAFA
(Appendix 2: GAFA Screens).
• The BCD number may have an offset applied – “level above datum” if B CD zero does not
correspond to the flowmeter zero level.
• The BCD number may also have a scaling factor applied, for example if a BCD
incremental value of 10 corresponds to 5 mm, the scaling factor is 0.5.
• If the scaling factor is given a negative sign, the BCD input will be taken as negative logic
(low is “1”)
• For BCD input, the STRB is pulled low for 0.2 ms by the Sarasota 2000 when it wants
data.
BCD Output
• When used as an output, the function of the 4 digit BCD number and operating units are
selected via the screens (Appendix 1) or GAFA (Appendix 2). Typically the function will
be flow or water level.
•
For BCD output, the STRB is pulled low for 0.2 ms whilst valid data is being presented.
•
BCD output may be uncoded, in which case the BCD number is taken as it appears, or
coded in which case the first digit indicates a range/sign and the remaining 3 digits the
value. The coding is defined as follows:
Coding for flow
The data is represented as a 4 digit number where the most significant digit is the code:
0 = multiply by 10
1 = multiply by 10
2 = multiply by 10
3 = fault condition, no data
4 = negative flow multiply by 10
5 = negative flow multiply by 10
6 = negative flow multiply by 10
The three remaining digits are the three most significant digits of the reading;
e.g. Flow + 4.28 m3/s Output 0428
Flow +34.28 m3/s Output 1342
Flow - 0.15 m3/s Output 4015
Coding for level
The level data is presented as a 4-digit number, representing the last 4 digits of the displayed
value.
e.g. Flow + 4.123 m Output 4123
Flow +52.678 m Output 2678
0
(i.e. x 1)
1
(i.e. x 10)
2
(i.e. x 100)
0
(i.e. x -1)
1
(i.e. x -10)
2
(i.e. x -100)
SYSTEM COMPONENTS
– no links, for
Section 2, SYSTEM COMPONENTS, Page 2-12
Thermo Fisher Scientific
Page 31

Sarasota 2000 Ultrasonic Multipath
Flowmeter
Encoder input
The BCD connector also provides the means of connection to the two-phase outputs direct
from a shaft encoder as an optional means of depth input. The Sarasota 2000 flowmeter will
count the pulses up and down to track the depth changes. It is necessary to set the pulse
scale, i.e. the distance corresponding to each pulse, and the counter value at a known depth.
See Appendix 1: LCD Screens (screen C213: Encoder Input Configuration) for the method of
setting up.
BCD/ENCODER CONNECTIONS (Refer to Fig 5)
25 D Pin Signal Comment
1 0V
2 D1
3 D3
4 D5
5 D7
6 0V
7 D9
8 D11
9 D13
10 D15
11 0V
12 INT Encoder phase 2
13 +5V
14 D0
15 D2
16 D4
17 D6
18 STRB1
19 D8
20 D10
21 D12
22 D14
23 STRB2
24 TC0 Encoder phase 1
25 0V
Note For compliance with EMC emissions control, BCD/Encoder i/o cables should be
screened and the screen connected to one of the 0V pins for each i/o card.
SYSTEM COMPONENTS
Section 2, SYSTEM COMPONENTS, Page 2-13
Thermo Fisher Scientific
Page 32

Sarasota 2000 Ultrasonic Multipath
Flowmeter
2.3.3.3 Relay (Volt free contact) card
The relay card consists of 4 programmable relays and a fa ult relay wit h both normally open
and normally closed contacts. The connections are accessible by removing the cover plate on
the side of the plinth.
Fig 7 Relay connections
The function of each relay is specified by the operator. See Section 2.5.2 and Appendix 1:
LCD Screens.
For example, relay 2 coul d be programmed as a high flow alarm to switch on at a high flow
and off again at a lower value (hysteresis).
Note that if pulses are required for an external totaliser, the selection is limited to relay 1 on
the relay card. However, the standard relay may not be suitable for this if the pulse rate is
high. For this reason the relay card is being changed so that a solid state relay will replace
relay 1. The switching capacity will be lower but the pulse rate will be higher and there will be
no specified limit on the number of operations. Relay 1 will then only have “normally open”
connections. See Appendix 3: Specificat ion.
Please consult Thermo Fisher Scientific if in doubt about which type is fitted.
SYSTEM COMPONENTS
Section 2, SYSTEM COMPONENTS, Page 2-14
Thermo Fisher Scientific
Page 33

Sarasota 2000 Ultrasonic Multipath
Flowmeter
2.4 Ultrasonic transducers
Each velocity path requi res two transducers and each ultrasonic depth requi res one.
The transducers are available in a number of frequencies. See Section 1.2.6 for frequency
selection. The frequency of the ultrasonic depth transducer, if used, is not normally critical.
1 MHz is usually used if the velocity transducer frequency is 1 MHz or 500 kHz otherwise.
The diameter of the transducer is different for different frequencies. This is to maintain the
angular spr ead of the beam which is a function of frequency and di ameter.
The transducers for the Sarasota 2000 are “smart”, with local circuits for the drive voltage
(HT) generation and the receiver amplifier built in to minimise losses and optimise signal-tonoise ratio. In the case of the 1 MHz transducers the size of the transducer is limited and the
local circuit is separated from the transducer in a potted in-line housing called a “Tbox”,
Transducers may be wired individually to the flowmeter (rear panel connections A to H for
velocity and W to Z for depths) or, using the multi-drop method, via “star” junction boxes in
each transducer array. In the latter case up to 4 transducers may be joined to each rear panel
connector. A mixture of multi-drop and direct connections may be used. For example, if there
are 5 transducers in an array, 4 may be wired via a star box and the fifth wired directly.
The maximum capacity with direct connections is 8 paths and 4 ultrasonic depths.
The maximum capacity with multi-drop is 32 paths and 16 depths.
The transducers have programmable addresses. Addresses 1 to 4 are normally used. When
using multi-drop, the transducers connected to each star box must be pre-programmed with
different addresses to enable each one to be operated separately by the flowmeter. Specialist
equipment is necessary to programme the transducers and it is usual to supply them with
specified ad d r esses.
2.4.1 1 MHz transducers
For use with path lengths up to 10 metres. In cases where serious attenuation is anticipated
(for example, sewage) it is recommended that the use be restricted to 5 metres and a lower
frequency be used above that. Of course the lower frequency requires a greater depth of
water in which to operate and this must be taken into account (see Section 1).
An in-line Tbox is fitted in line with each transducer.
The co-axial cable from the T box must be connected t o a star b ox or exten ded to run direc tly
to the flowmeter. Coaxial cables to the flowmeter enclosure are usually made up on site.
Cables may be supplied to length with made up ends if specified with the order but this often
makes the installation more difficult where there is the need to pull cables through ducts.
2.4.2 500 kHz Transducers
For use with path lengths above 10 metres. In cases where serious attenuation is anticipated
(for example, sewage) it is recommended that 500 kHz transducer be used above 5 metres.
At the upper end, they may normally be used up to 80 metres. For cases where serious
attenuation is anticipated, lower frequency transducers should be used for paths above 50
metres.
SYSTEM COMPONENTS
Section 2, SYSTEM COMPONENTS, Page 2-15
Thermo Fisher Scientific
Page 34

Sarasota 2000 Ultrasonic Multipath
Flowmeter
The 500 kHz transducers have the HT and signal amplifiers built in. They are connected
directly to the flowmeter or via star boxes. If ultrasonic depth transducer(s) are being used, it
is usual to use 500 kHz frequency when that frequency is being used for water velocity
measurement.
The transducers are supplied with 5 metres of cable which is connected to a star box or
extended to run directly to the flowmeter. Coaxial cables to the flowmeter enclosure are
usually made up on site. Cables may be supplied to length if so ordered with made up ends
but this often makes the installation more difficult where there is the need to pull cables
through ducts.
2.4.3 Lower frequency transducers
Consult Thermo Fisher Scientific about low frequency transducers for path lengths above 80
metres or where conditions might attenuate higher frequency signals.
If ultrasonic depth transducer(s) are being used, it is usual to use 500 kHz frequency when
lower frequency transducers are being used for water velocity measurement.
2.4.4 Maximum cable lengths
Item From To Max
length
1 500 kHz transducer
(velocity or depth)
2 1 MHz TBox
(velocity or depth)
3 Star box Flowmeter 300 m Multi-drop
4 500 kHz transducer Star box 5 m Multi-drop
5 1 MHz Tbox Star box 5 m Multi-drop
6 500 kHz depth transducer Star box 50 m Multi-drop depth option
7 1 MHz depth TBox Star box 50 m Multi-drop depth option
Flowmeter 300 m Direct connection
Flowmeter 300 m Direct connection
SYSTEM COMPONENTS
Comment
(but see depth options items 6 & 7)
(but see depth option item 6)
(but see depth option item 7)
(star box max 5 m from flowmeter)
(star box max 5 m from flowmeter)
Section 2, SYSTEM COMPONENTS, Page 2-16
Thermo Fisher Scientific
Page 35

Sarasota 2000 Ultrasonic Multipath
Flowmeter
2.5 Controls and displays
2.5.1 Panel layout
Fig 1 shows the layout of the front panel. It contains the keyboard and liquid crystal display
(LCD). The keyboard is used to access the LCD and to:-
• programme the flowmeter with site data, for example. path lengths, angles, heights
• set up the inputs and outputs (including simulation for test purposes)
• set up the relay functions and values on which to switch
• display ultrasonic waveforms
• display measurements and results
• display diagnostic data
2.5.2 Screen organisation
The LCD screens are all numbered as listed in Appendix 1: LCD Screens.
The screens are arranged in levels, the lower levels being selected and accessed from the
one above.
When a lower level is displayed, it overlays the one above so that each is visible.
The ARROW keys move a highlighted area around each screen.
The ENTER key actions the highlighted instruction, for example to select a lower level screen.
The ESCAPE key reverts to the previous screen.
When the highlighted box requires data, the NUMBER keys are used.
The ENTER key st or es t ha t da t a in me m ory.
There are 4 FUNCTION keys at the bottom of the screen. Their function changes according to
what is dis played above them on the screen.
The display goes blank to save power 15 minutes after the last key stroke. Pushing any key
powers it up.
2.5.3 The status in dicator
The status indi cator operat es as fo l l o ws:
• Continuous green – contentment
• Continuous red – alarm condition exists or has occurred earlier and has not been
acknowledged. The meaning of this is defined by the user via screen S30: Fault Relay
Configuration, and details of the fault can be identified in screen S10: Fault Status (for
example, all faulty ultrasonic paths or depth paths).
• Either light flashing evenly – running on battery.
• Either light “blipping” on intermittently – running in power save intermittent mode.
• No light at all – power off and battery run down.
With the alarm reset key the operator acknowledges the alarm and resets it.
The operation and setting up are described in Section 4: Installation, Appendix1: LCD
Screens and Appendix 2: GAFA Screens.
Note that the GAFA PC software provides similar facilities either locally via the front RS232
connector or the IR link, or remotely via a modem.
SYSTEM COMPONENTS
Section 2, SYSTEM COMPONENTS, Page 2-17
Thermo Fisher Scientific
Page 36

Sarasota 2000 Ultrasonic Multipath
Flowmeter
2.6 Software & firmware
There are 2 types of software:
• The internal pre-loaded operating software, normally called “firmware”
• The PC software for communicating with the flowmeter, called “GAFA”
2.6.1 Operating firmware
The flowmeter is supplied with the operating firmware already loaded. It would not normally
be necessary to re-load the firmware. In the event that new firmware is to be loaded, Thermo
Fisher Scientific will provide the procedure or carry out the operation.
2.6.2 “GAFA” PC software
An optional facility is the GAFA software, which runs on a PC under Windows. This allows
communication with the flowmeter:-
• Via the RS232 port on the front of the plinth
• Via the IrDA link on the front panel
• Remotely via a modem connected to the RS232 port on the rear of the plinth
The functions possible via GAFA are:-
• S etting up the flowmete r in the same way as v ia the flowmeter control s and display as
described in 2.5 but with the benefit of superior PC display
• Interrogating the flowmeter for measured parameters and calculated results as 2.5 with
the same benefit
• Downloading logged data.
Appendix 2: GAFA Screens des cribes the GAFA.
2.7 Documentation
In addition to the hardware described in 2.3 and 2.4, and possible peripheral equipment, the
following documentation may also be supplied:
• A copy of this ma nual (additional copies m ay be supplied)
• Site specific data (Appendix A5: Site Data). Configuration and program data completed
by installation and commissioning engineers.
• Site specific drawings – transducer mounts, site layout, civil details (if part of contract)
• Certificate of conformity (specific test sheets available on request)
• Certificate of approval for Quality Management Sys tem
• On site calibration certificate (if included in the installation contract)
SYSTEM COMPONENTS
Section 2, SYSTEM COMPONENTS, Page 2-18
Thermo Fisher Scientific
Page 37

Sarasota 2000 Ultrasonic Multipath
Flowmeter
PERIPHERAL EQUIPMENT
3 PERIPHERAL EQUIPMENT
3.1 Additional items
A number of additional items will be required to complete a flowmeter system. These may
include:-
• Hardware to be installed in the channel on which to mount the transducers.
• Auxiliary depth gauge(s)
• Kiosk to house the flowmeter
• Communications equipment – for example modems, telemetry outstations, GSM
modems.
• Power supplies, for example solar power systems.
plus, often, some civil work for cable ducts, supporting piles etc.
The additional items are often supplied and installed by Thermo Fisher Scientific as part of
the contract, in which case details will be included in Appendix 5: Site Data Book.
3.2 Transducer mounting hardware
Thermo Fisher Scientific has extensive experience of transducer mounting system design and
maintains a comprehensive computerised library. Please consult Thermo Fisher Scientific for
a quotation to design and supply a suitable system.
Section 3, PERIPHERAL EQUIPMENT, Page 3-1
Thermo Fisher Scientific
Page 38

Sarasota 2000 Ultrasonic Multipath
Flowmeter
This page is blank
PERIPHERAL EQUIPMENT
Section 3, PERIPHERAL EQUIPMENT, Page 3-2
Thermo Fisher Scientific
Page 39

Sarasota 2000 Ultrasonic Multipath
Flowmeter
4 INSTALLATION
4.1 Safety
SAFETY NOTICE
The installation of the Thermo Scientific Sarasota 2000
flowmeter may involve a number of steps which require
special skills, training and special equipment. Examples
include:
• Electrical installation
• Working on construction sites
• Working near water (may be deep or fast flowing)
• Lifting equipment
• Working at height
• Working from boats
• Confined space working
It is recommended that prior to the installation the installer
should write a method statement detailing:
• The scope and purpose of the work,
• The steps in the operation,
• Interaction with others,
• The personnel to be involved,
• Their qualifications for the work,
• Protective clothing and equipment,
• Machinery, tools etc.
• Emergency contacts and procedures.
A risk assessment should be carried out and both the
method statement and risk assessment should be
approved by the person responsible for Health and Safety
on the site.
Thermo Fisher Scientific accepts no responsibility for the
safety of personnel other than its own employees in the
installation and commissioning of the Sarasota 2000
flowmeter and accessories supplied.
INSTALLATION
Section 4 INSTALLATION Page 4-1
Thermo Fisher Scientific
Page 40

Sarasota 2000 Ultrasonic Multipath
Flowmeter
4.2 General
It is usually necessary for some preparatory work to be carried out prior to installation of the
flowmeter system. This work is often performed under a separate contract and typically
includes:-
• Installation of supporting structures for transducer mounts, for example, piles in a river,
brackets on concrete channel walls.
• Installation of ducts o r cable tray for the interconnecting cables.
• Installation of a suitable housing for the flowmeter and peripheral equipment. This could
be an existing building or a kiosk.
• Provision of a power supply.
• Provision of a PSTN connection.
The installation of the equipment on site follows the above. It is normal practice to carry out a
risk assessment and to write a method statement to be agreed by the client before startin g
work. The installation work is often restricted to times when suitable site conditions apply.
It is recommended that the installer of the flowmeter should inspect the preparatory work prio r
to mobilising resources for the installation.
4.3 Unpacking and laying out
If site and general assembly drawings were specified as part of the supply contract they will
normally have been supplied and accepted prior to delivery of the equipment. The drawings
will be a useful guide to checking the inventory of equipment delivered.
The equipment supplied should be carefully unpacked and checked for content and damage.
The transducers may have been supplied in rack assemblies ready to be installed to the
supporting structure. There will normally be two or four racks (for in-line or crossed paths). In
large channels or those with complex shapes, there may be more than two racks, for
example, in a stepped channel with a low level channel and a wider high one.
If the racks have not been assembled, this may be carried out on site according to the
assembly drawings.
It is important to check that sufficient cable has been supplied for connecting transducers and
that suitable fixings for all the items have been supplied or separately procured.
4.4 Installing transducer assemblies
WARNING – Installing transducer racks may involve working near deep or
contaminated water and/or in confined spaces. Appropriate precautions and suitably
qualified personnel should be used.
The transducer rack assemblies should be installed in their prepared positions according to
the drawin gs and method statements.
Care must be taken not to damage the coaxial cables during this operation.
See Section 2.4 for transducer and junction box configuration.
Depth gauge transducers or transmitters may be fitted to one or more of the transducer racks
or have a separate fitting.
INSTALLATION
Section 4 INSTALLATION Page 4-2
Thermo Fisher Scientific
Page 41

Sarasota 2000 Ultrasonic Multipath
Flowmeter
4.5 Connecting transducers to flowmeter
Cables for the ultrasonic transducers should be labelled for identification, cut and pulled
through the ducts or laid in trays back to the flowmeter. Connectors should be fitted to each
end according to the instructions supplied with the connectors.
Where 1 MHz transducers are being installed, the connections are via the transducer boxes
(see Section 2.4.1) which are fitted at the rack assemblies.
Cables for depth gauges other than Sarasota ultrasonic transducers should also be pulled
back to the flowmeter. Gene rally, if the de pth gauge is a pres sure transmitt er, the attached
cable will be supplied long enough for this purpose without joining.
The transducer cables are to be terminated at the flowmeter end and plugged in to the
flowmeter back panel as shown in Section 2.3.3.1.
Ultrasonic path numbers are as shown, numbered from the lowest path. If 2 paths are at the
same height the firmware will take them as crossed for the purposes of slice allocation and
flow calculation (see 1.2.5). Upstream transducers should be plugged into the upper row on
the back panel and downstream ones to the lower.
4.6 Transducer alignment
At this stage it is usual practice to align the transducers. Each transducer should point at its
partner to within ±1
• Pre-set alignment derived from construction drawings.
• Visual methods involving pointers and sighting arrangements.
• Low power laser methods.
If the transducers are in the water, only the first of these may be possible and final adjustment
should then be carried out by adjustments to maximise signals during commissioning.
4.7 Output connections
Output signals should be wired to the peripheral devices according to the connection tables
given in section 2.3. In some cases standard cables will hav e been provided, eg RS232, or
pre-made cables will have been ordered as part of the contract.
Note For compliance with EMC emissions control, analogue, BCD and serial i/o cables
should be screened and the screen connected to a 0V pin. Where the connector is a ‘D’ type
connector, the screen may alternatively be connected to the connector body if metal.
4.8 Power Connection
Connection should be made to the external power source according to local or national
regulations. The flowmeter is supplied with a standard 230 volt mains cable for connection to
an AC source in the range 85 to 264 volt AC, 47 to 64 Hertz. This may be connected to the
power outlet via a plug or, more usually via a switched spur. This work should be carried out
by a person with the appropriate qualifications.
See the site data book for details of flowmeters supplied for DC operation.
o
. The method used will vary according to the conditions.
INSTALLATION
Section 4 INSTALLATION Page 4-3
Thermo Fisher Scientific
Page 42

Sarasota 2000 Ultrasonic Multipath
Flowmeter
This page is blank
INSTALLATION
Section 4 INSTALLATION Page 4-4
Thermo Fisher Scientific
Page 43

Sarasota 2000 Ultrasonic Multipath
Flowmeter
COMMISSIONING
5 COMMISSIONING
5.1 Site dimensions
If this information is not already available, it will be necessary to carry out a dimensional
survey of the installed transducers and the channel in order to programme the flowmeter. It
will be necessary to determine the following:-
• length, angle and the heights of each path,
• average cross section profile, if different from that defined by the paths,
• mean bed level (MBL),
• height offset of the level transducers and,
• relationship between the local heights and a fixed datum if not
MBL.
This manual does not cover surveying techniques. However, for small sites physical
measurements are easily carried out by measurement with a tape. Angles may be determined
by triangulation.
5.2 Powering up
Check that the flowmeter contains the specified modules and the cards are plugged in to the
correct rack positions, see Section 2. Also, Appendix 5: Site Data may already have been
partially filled in prior to shipping to indicate the card positions.
Switch on the power source and ensure that the internal power switch is on (Section 2.3).
The main STATION HOME screen will be displayed (Appendix 1: LCD Screens).
5.3 Programming
The flowmeter should be programmed as described in Appendix 1: LCD Screens.
Alternatively a PC may be used rather than the built-in screen and keyboard as shown in
Appendix 2: GAFA Screens. The programme details should be recorded to become part of
Appendix 5: Site Data.
Appendix 5: Site Data is a useful checklist covering all programmed data, some of which may
not be required for any particular site.
5.4 Setting up
5.4.1 Ultrasonic levels
Select “Manual” and set the gain and voltage for each level (screen C216: Level Transducer
Setup) to obtain a clean waveform and detection point (screen C218: Level Waveform
Display).
5.4.2 Auxiliary levels – analogue input
Set the input range via screen C212: Analogue Input Configuration. This allows the input to
be linearised, but most level devices will be suffic iently linear and only n eed 2 points to define
the input. On the table, define 4 mA as the minimum, 20 mA as the maximum and enter the
depth offset (level above datum).
working with respect to
Section 5, COMMI SS I O NIN G Page 5-1
Thermo Fisher Scientific
Page 44

Sarasota 2000 Ultrasonic Multipath
Flowmeter
5.4.3 Auxiliary level – encoder input
Screen C213: Encoder Input Configuration allows the details of a direct input from a shaft
encoder to be programmed. This involves setting a point of reference from which to count up
and down (the current level) and the scaling factor of pulses per unit of depth.
5.4.4 Auxiliary levels – BCD input
Screen C214: BCD Input Configuration is used to define the relationship between the BCD
input and actual depth. The level of the counter zero above datum is entered and the
conversion factor relating counter value to the depth units.
5.5 Outputs
The outputs are selected from analogue, BCD and relays. (Set up via screens S25: Output
Configuration, screen S250: Analogue Output Configuration, screen S251: BCD Output
Configuration and screen S252: Test Output Configuration).
Correspondence between the displayed selected parameter value and the output should be
checked. It is possible to force the outputs by temporarily changing the set-up, for ex ample
changing the level datum will affect not only the apparent level measurement but also the
flow. Alarm thresholds may be altered to check relay operation.
Analogue outputs may be checked by a calibrated multi-meter and verified as being received
by the destination device.
BCD outputs are more difficult to check with a multi-meter and are usually verified by reading
the destination device. A BCD test box with a display is available through Thermo Fisher
Scientific.
Alarm outputs may be checked by a calibrated multi-meter and verified as being received by
the destination device.
COMMISSIONING
Section 5, COMMI SS I O NIN G Page 5-2
Thermo Fisher Scientific
Page 45

Sarasota 2000 Ultrasonic Multipath
Flowmeter
CALIBRATION/
VERIFICATION
6 CALIBRATION/VERIFICATION
Flowmeters of this type do not normally require calibration. Exceptions are where there are
significant unmeasured areas, for example, behind transducers, or where local conditions
might create atypical velocity profiles and a small number of velocity paths are deployed. See
Section 1: Introduction and Appendix 4: References.
However, it is normal to carry out periodic checks to verify the overall performance of the flow
determination.
Whether for calibration or verification purposes, the comparison method to be used will be the
same and will depend on the site.
Reference is made to ISO 748 for details of methods. See Appendix 4: References.
The most common method used is by current metering using a calibrated rotating element or
electromagnetic current meter.
Care should be taken to use repeated checks and to minimise the experimental uncertainties
which could otherwise be greater than the uncertainty of the ultrasonic flowmeter.
Section 6 CALIBRATION/VERIFICATION Page 6-1
Thermo Fisher Scientific
Page 46

Sarasota 2000 Ultrasonic Multipath
Flowmeter
This page is blank
CALIBRATION/
VERIFICATION
Section 6 CALIBRATION/VERIFICATION Page 6-2
Thermo Fisher Scientific
Page 47

Sarasota 2000 Ultrasonic Multipath
Flowmeter
MAINTENANCE
7 MAINTENANCE
There is little maintenance as such relating to the flowmeter itself. However, the river or
channel must be kept free of weed, silt and other obstructions to avoid interruption of the
ultrasonic paths or changing the cross section area which would affect the accuracy of flow
determination.
Periodic checks on the functioning of the flowmeter and verification of the flow as calculated
are recommended.
7.1 Channel maintenance
7.1.1 Weed
• If weed tends to grow in the channel, it must be kept cut.
• Weed must be kept clear from between the transducer arrays where it may stop the
passage of sound between the transducers.
• Weed should also be controlled on the approach to the gauged section and immediately
downstream of it where its presence c ould distort the velocity profile.
The user must decide on the season al cu t t i n g re gime to suit the ch an n el .
7.1.2 Profile
Periodically the channel shape should be checked to determine whether it has changed since
the flowmeter was programmed. It is particularly important to check the bed where silt might
have been deposited or scouring could have occurred.
Changes may be required to the programmed channel shape or mean bed level.
In serious cases, it may be necessary to dredge the channel, taking care not to damage the
transducers.
The user must decide on the che cking regime to suit the channel.
7.1.3 Debris
Under high flow conditions it is not uncommon for debris to be washed along the channel.
Whilst the design of the transducer supports should be such as to minimise the risk of
snagging this debris, separate deflectors or devices intended to capture it may be employed.
If the channel is prone to this phenomenon, the user must instigate an appropriate debrisclearing regime.
7.2 Flowmeter maintenance
There are no parts requiring maintenance except that the transducers should be checked
occasionally for a build-up of surface coating, for example by grease, and for misalignment
caused by physical shocks. These checks may be carried out along with the channel
maintenance.
Normally it is possible to obtain advance warning of problems by checking the signal quality.
This may be done on site or remotely via GAFA (Appendix 2: GAFA Screens).
Section 7, MAI N T E NANCE Page 7-1
Thermo Fisher Scientific
Page 48

Sarasota 2000 Ultrasonic Multipath
Flowmeter
7.3 Routine checks
7.3.1 Remote
Remote checks of operation of all velocity paths and depths are easily carried out via GAFA.
It is recommended that a monthly routine should be set up to handle this.
If the flowmeter is fitted with the relay option, one of the relays may be programmed to initiate
an early warning call via a telemetry outstation.
7.3.2 On site
It is recommended that an annual check be made on site. This should include:
• A visual observation of the equipment in the channel and the flowmeter.
• A functional check of the operation of the paths, levels and outputs.
• A c h ec k on t he operation of the i nternal battery .
• A verification of calculated flow by a comparison method, see Section 6: Calibration
Any corrective work should be taken at the time if possible or reported for subsequent action.
MAINTENANCE
Section 7, MAI N T E NANCE Page 7-2
Thermo Fisher Scientific
Page 49

Sarasota 2000 Ultrasonic Multipath
Flowmeter
APPENDIX 1 LCD SCREENS
APPENDIX 1. LCD SCREENS
Appendix 1. LCD Screens Index................................. .... ......... ..... .... .......... .... ..... ......... .... ..... .1
A1.1 Screen Organisation Chart......................................... ...................................................3
A1.2 Screen Types and Identities................................................................................ ..........6
A1.3 Screen Selection and Data Entry/Edit Methods.............................................................7
A1.4 Power-off Mode.............................................................................................................8
A1.5 Sample Screens ...........................................................................................................9
STATION DATA HOME Screen....................................................................................9
CHANNEL DATA HOME Screen (for channels 1-4)....................................................10
C1: Channel Diagnostics.............................................................................................10
C10:Instantaneous Flow & Level................................................. .... ......... ..... .... ....11
C11:Instantaneous Path Velocities.......................................................................11
C12:Path Temperatures........................................................................................12
S0:Station Menu..........................................................................................................12
S1:Station Diagnostics................................................................................................13
S10:Fault Status ...................................................................................................13
S11:Power Rails ...................................................................................................14
S12:Software Version...........................................................................................14
G1:Password...............................................................................................................15
G2:Setup Menu...........................................................................................................15
S2:Station Setup.........................................................................................................16
S20:Measurement Units........................................................................................17
S21:Real Time Clock ............................................................................................18
S22:Station Configuration.....................................................................................19
S23:Card Address Map.........................................................................................20
S230:Path Allocation ......................................................................................20
S24:Flow Calculation............................................................................................21
S25:Output Configuration......................................................................................22
S250:Analogue Output Configuration .............................................................23
S251:BCD Output Configuration.....................................................................24
S252: Analogue Test Output Configuration ....................................................24
S26:Auxiliary Input Configuration ..........................................................................25
S260:Auxiliary Input Allocation .......................................................................25
S27:Transducer Configuration..............................................................................26
S3:Relay Configuration................................................................................................27
S30:Fault Relay Configuration . .............................................................................28
S31:Other Relay Configuration ............................................................................. 29
S311:Relay Ultrasonic paths ..........................................................................30
S4:Serial Port A Configuration.....................................................................................31
S5:Serial Port B Configuration.....................................................................................32
S6:Serial Port C Configuration ....... ....................................................... ......................32
S7:Power Management...............................................................................................33
S8:Data Logging..........................................................................................................34
C2:Channel Setup............................................................................. ..........................35
C20:Channel Configuration...................................................................................35
C21:Level Measurement.......................................................................................36
C210:Level Allocation Menu ...........................................................................37
Appendix 1 SCREEN FLOW DIAGRAMS, Page A1-1
Thermo Fisher Scientific
Page 50

Sarasota 2000 Ultrasonic Multipath
Flowmeter
C211:Ultrasonic Level Input Menu............................................ ......................38
C212:Analogue Input Configuration................................................................38
C213:Encoder Input Configuration..................................................................39
C214:BCD Input Configuration.......................................................................40
C215:Ultrasonic Level Configuration ..............................................................40
C216:Level Transducer Setup ........................................................................41
C217:Waveform Capture Setup (Level)..........................................................42
C218:Waveform Display (Level) .....................................................................43
C22:Ultrasonic Paths Menu (Velocity)...................................................................44
C220:Path Menu.............................................................................................45
C221:Ultrasonic Path Configuration................................................................45
C222:Transducer Setup (Velocity)..................................................................46
C223:Waveform Capture Setup (Velocity)......................................................47
C224:Path Constants......................................................................................48
C225:Waveform Display (Velocity) .................................................................49
C226:Transducer Re-allocation......................................................................50
C23:Channel Profile..............................................................................................50
C230:Channel Profile Edit ..............................................................................51
C24:Flow Estimate Table......................................................................................51
C240:Flow Table Edit .....................................................................................52
APPENDIX 1 LCD SCREENS
Appendix 1 SCREEN FLOW DIAGRAMS, Page A1-2
Thermo Fisher Scientific
Page 51

Sarasota 2000 Ultrasonic Multipath
Flowmeter
APPENDIX 1. LCD SCREENS
A1.1 Screen organisation chart (page 1 of 3)
(R)
STATION
HOME
APPENDIX 1 LCD SCREENS
(R)
CHANNEL 1
HOME
(R)
CHANNEL 2
HOME
CHANNEL 3
C1(M)
CHANNEL
DIAGNOSTICS
C10(R)
INSTANTANEOUS
FLOW & LEVEL
C11(R)
INSTANTANEOUS
PATH VELOCITIES
C12(R)
PATH
TEMPERATURES
(R)
HOME
(R)
CHANNEL 4
HOME
S0(M)
STATION
SETUP
S1(M)
STATION
DIAGNOSTICS
S10(R)
FAULT
STATUS
S11(R)
POWER
RAILS
S12(R)
SOFTWA RE
VERSION
G1(G)
PASSWORD
G2(G)
SETUP MENU
GO TO
CHANNEL SETUP
SCREENS
GO TO
STATION SETUP
SCREENS
S3(E)
RELAY
CONFIGURATION
S4(E)
SERIAL PORT A
CONFIGURATION
S5(E)
SERIAL PORT B
CONFIGURATION
S6(E)
SERIAL PORT C
CONFIGURATION
S7(E)
POWER
MANAGEMENT
S8(E)
DATA
LOGGING
Appendix 1 SCREEN FLOW DIAGRAMS, Page A1-3
S30(E)
FAULT RELAY
CONFIGURATION
S31(E)
OTHER RELAY
CONFIGURATION
S311(E)
RELAY U/S
PATH ALLOCATION
Thermo Fisher Scientific
Page 52

Sarasota 2000 Ultrasonic Multipath
Flowmeter
Screen organisation chart (page 2 of 3)
APPENDIX 1 LCD SCREENS
C2(M)
CHANNEL
SETUP
C20(E)
CHANNEL
CONFIGURATION
C21(M/R)
LEVEL
MEASUREMENT
C210(E)
LEVEL
ALLOCATION
C211(M)
ULTRASONIC
LEVEL
INPUT MENU
C215 (E)
ULTRASONIC
LEVEL
CONFIGURATION
C216 (E)
TRANSDUCER
SET UP
C217 (E)
LEVEL
WAVEFORM
CAPTURE
C218 (W)
LEVEL
WAVEFORM
DISPLAY
C212(E)
ANALOGUE
CONFIGURATION
C22(M)
ULTRASONIC
VELOCITY
PATHS
C220(M)
U/S VELOCITY
PATH
MENU
C221(E)
U/S PATH
CONFIGURATION
C222(E)
VELOCITY
TRANSDUCER
SETUP
C223(E)
VELOCITY
WAVEFORM
CAPTURE
C225(W)
VELOCITY
WAVEFORM
DISPLAY
C224(E)
PATH
CONSTANTS
C226(E)
TRANSDUCER
RE-ALLOCATION
C23(M)
CHANNEL
PROFILE
C230(E)
CHANNEL
PROFILE
EDIT
C24(M)
FLOW
ESTIMATE
TABLE
C240(E)
FLOW TABLE
EDIT
Appendix 1 SCREEN FLOW DIAGRAMS, Page A1-4
C213(E)
ENCODER
INPUT
CONFIGURATION
C214 (E)
BCD INPUT
CONFIGURATION
Thermo Fisher Scientific
Page 53

Sarasota 2000 Ultrasonic Multipath
Flowmeter
Screen organisation chart (page 3 of 3)
S2(M)
STATION
SETUP
APPENDIX 1 LCD SCREENS
S20(E)
MEASUREMENT
UNITS
S22(E)
STATION
CONFIGURATION
S24(E)
FLOW
CALCULATION
S26(M)
AUXI LIARY INP UT
CONFIGURATION
S21(E)
REAL TIME
CLOCK
S23(M)
CARD ADDRESS
MAP
S230(E)
PATH ALLOCATIONS
S25(E)
OUTPUT
CONFIGURATION
S250(E)
ANALOGUE OUTPUT
CONFIGURATION
S251(E)
BCD OUTPUT
CONFIGURATION
S252(E)
TEST OUTPUT
CONFIGURATION
S27(E)
TRANSDUCER
CONFIGURATION
AUXILIARY I NP UT
Appendix 1 SCREEN FLOW DIAGRAMS, Page A1-5
S260(E)
ALLOCATION
Thermo Fisher Scientific
Page 54

Sarasota 2000 Ultrasonic Multipath
Flowmeter
A1.2 Screen types and identities
A1.2.1 Screen type
Screens are classified according to their function as follows:
M
ENU Offers selection of lower order screens
G
ATEWAY Access screens for station or channel setup
E
NTRY/EDIT Data is entered or edited via these screens
ESULTS Displays st atus or results measured or calculated by flowmeter
R
AVEFORM Displays ultrasonic waveforms
W
The screen type is indicated for each display screen and is shown on the Screen
Organisat i on Chart above.
A1.2.2 Screen identities
• The flowmeter start up screen has no number and is the STATION HOME screen
• Each configured channel (minimum 1, maximum 4) has a CHANNEL HOME screen
• All menu, entry/edit, results and waveform screen numbers associated with the
station setup are prefixed ‘S’ and those associated with the channel setup are
prefixed ‘C’.
APPENDIX 1 LCD SCREENS
• All screens associated with the station setup can return directly to the STATION
HOME screen via the Station soft key
• All screens associated with each channel setup can return directly to the appropriate
CHANNEL HOME screen via the appropriate Channel soft key
• Screens below the HOME screens have a unique identification number in the top left
corner that corresponds to the Screen Organisation Chart and Index.
• Sample screens f or each display are presented in numerical order. Note: 2 digit
screen numbers are a sub-set of single digit screen numbers. Similarly, 3 digit screen
numbers are a sub-set of 2 digit screen numbers (eg C2; C21; C211)
• Station setup should precede channel setup
A1.2.3 Soft key function
The 4 keys immediately beneath the screen display have a function which varies according to
the screen. The active ‘soft key’ function is indicated on the s creen immedi ately above the
corresponding key.
Soft key functions include:
Station returns user to STATION HOME screen
Channel1 returns user to CHANNEL 1 HOME screen
Channel2 (if configured) returns user to CHANNEL 2 HOME screen. Similarly
for Channel 3 and 4
Text On and Text Off (only available for alphanumeric data entry/edit) turns alphanumeric
mode on and off
Clone function available as a short cut when path configurations are similar
Rebuild to confirm entry/modification of path configurations
Appendix 1 SCREEN FLOW DIAGRAMS, Page A1-6
Thermo Fisher Scientific
Page 55

Sarasota 2000 Ultrasonic Multipath
Flowmeter
A1.3 Screen selection and data entry/edit methods
A1.3.1 MENU screens (including GATEWAY setup menu)
The selection of items from a MENU screen is made as follows:
(a) highlight selection using the UP and DOWN arrow keys
(b) confirm selection by pressing the ENTER key
(c) the selected screen will open and overlay the previous screen
(d) to return to menu screen press ESCAPE or, on completion of data
modification, press ENTER to confirm and return to previous screen
A1.3.2 ENTRY/EDIT screens (including GATEWAY password)
ENTRY/EDIT screens are used to enter or edit data to configure the flowmeter as required.
Data is either entered in alphanumeric format, or chosen from a predefined selection.
Numeric format
Data entry/modification required in numeric format is indicated throughout the following
screen examples by square brackets, […..]. The value is modified by:
a) highlighting data entry point [….] using UP and DOWN arrow keys
b) position the cursor within th e data entry po int using LEFT and RIGHT arrow keys
c) enter values using the numeric keypad
d) save new values for entire screen by pressing the ENTER key
Alphanumeric format
Data entry/modification may be in alphanumeric format where indicated by square brackets
and alphanumeric characters, [abc123]. An alphanumeric character is modified by:
a) highli ghting data entry point [abc123] using UP and DOWN arrow keys
b) select Text On mode using soft key 3
c) move the cursor into position within the data entry point using LEFT and RIGHT
arrow keys
d) use UP and DOWN arrow keys to scroll through available alphanumeric
characters
e) when alphanumeric modification is complete, select Text Off mode using soft key
3
f) modified text/values are saved for entire screen by pressing the ENTER key
g) available characters include:
ABCDEFGHIJKLMNOPQRSTUVWXYZ[¥]^_`abcdefghijklmnopqrstuvwxyz
Parameter selection
The selection of configuration parameters from a predefined list is indicated on the screen
examples by xxxxxxxx. T he parameters available for selection a re listed beneath each
screen. The parameter is selected by:
a) highlighting the par ameter selection point using UP and DOWN arrow key s
b) scrolling through available parameters using LEFT and RIGHT arrow keys
APPENDIX 1 LCD SCREENS
Appendix 1 SCREEN FLOW DIAGRAMS, Page A1-7
Thermo Fisher Scientific
Page 56

Sarasota 2000 Ultrasonic Multipath
Flowmeter
c) selected parameters are saved for the entire screen by pressing the ENTER key
A1.3.3 RESULTS screens
RESULTS screens display the results of calculations, the status of operation, selected
configuration options and flowmeter setup. Values or configuration parameters selected in
associated configuration screens may be shown. However, modifications cannot be made
directly to results screens.
A1.3.4 WAVEFORMS screens
WAVEFORMS screens display waveforms in the format selected in associated configure
screens.
A1.4 Power-off mode
The display will power off after 15 minutes of inactivity. Press ENTER to reactivate display. As
a system security measure the display reverts back to the STATION HOME screen.
APPENDIX 1 LCD SCREENS
Appendix 1 SCREEN FLOW DIAGRAMS, Page A1-8
Thermo Fisher Scientific
Page 57

Sarasota 2000 Ultrasonic Multipath
Flowmeter
A1.5 Sample screens
STATION DATA HOME SCREEN
(Screen accessed via flowmeter power up; STATION soft key; ESC from S0:Station Menu)
23:13 21 June 2002
FLOW CUMECS
******** Ch1
******** Ch2
******** Ch3
******** Ch4
LEVEL metres
******** Ch1
******** Ch2
******** Ch3
******** Ch4
Status OK
Channel1 Channel2 Channel3 Channel4
Station Data
• Channel values for flow and level and Channel1, 2, 3, 4 soft keys are only displayed
for the number of channels selected in S22:Station Configuration
• When summation of channel
a single value for flow is displayed (sum of all channel flows)
• Status conditions can be ‘Status OK’ or ‘Channel Fault’. The soft key relating to the
channel in fault will be highlighted. Details about the fault are given on the appropriate
CHANNEL HOME screen
• To proceed t o sc reen S0:Station Menu, press ENTER
is set to ‘combined’ in screen S22:Station Configuration,
APPENDIX 1 LCD SCREENS
Appendix 1 SCREEN FLOW DIAGRAMS, Page A1-9
Thermo Fisher Scientific
Page 58

Sarasota 2000 Ultrasonic Multipath
Flowmeter
CHANNEL DATA HOME SCREENS
(Screen accessed via CHANNEL soft key, ESC C1:Channel Diagnostics)
APPENDIX 1 LCD SCREENS
CHANNEL 1
Flow: ******** CUMECS
Velocity: ******** metre/sec
Level Above Datum: ******** metres
Cumulative Flow: 234819226 CUMECS
from 12:20 21 June 2002
Path 1 * * .
Path 12 .
Path 24 .
Status OK
Station Channel2 Cha nnel3 Ch annel4
Channel Data
• For each configured channel (1-4), ther e is a channel home screen and soft key
• Fault st atus messages (flow) can be: status OK; initialising; no flow – low level; no
paths & no estimation table; no interface cards; no profile table; level
• ab o v e p r of i l e t ab l e; flow estimate – low level; flow estimate – paths faulty
• Fault st atus messages (depth) can be: no level inputs; level arbitration failed; all level
inputs faulty
• To return to STATION DATA HOME screen use Station soft key
• To proceed t o screen C1:Chann el Diagnostic s, press ENTER.
SCREEN C1: CHANNEL DI AGN O S T I CS (ME NU )
(Screen accesed via CHANNEL HOME screen; ESC C10:Instantaneous Flow & Level; ESC C11:Ultrasonic Path
Velocities; ESC C12:Path Temperatures)
C1 Channel Diagnostics
Appendix 1 SCREEN FLOW DIAGRAMS, Page A1-10
Instantaneous Flow and Level
Ultrasonic Path Velocities
Path Temperatures
Channel1
Thermo Fisher Scientific
Page 59

Sarasota 2000 Ultrasonic Multipath
Flowmeter
SCREEN C10: INSTANTANEOUS FLOW & LEVEL (RESULTS)
(Screen accessed via C1:Channel Diagnostics)
INSTANTANEOUS FLOW AND LEVEL
• Screen available for each configured channel
• For ultrasonic depths (USW): status
and ‘no vos’
• For 4-20mA analogue (AIN): status
• For binary c oded decimal (BCD): status
• For encoder (ENC) auxiliary depths: status
• For arbitrat ion rules see section 1.3:
• Auxiliary levels (1-4) are displayed for all channels. Auxiliary levels are not used to
calculate the channel level and are not affected by arbitration rule s.
• These res ults are instantaneous – see Section 1.3
SCREEN C11: INSTANTANEOUS PATH VELOCITIES (RESULTS)
(Screen accessed via C1:Channel Diagnostics)
INSTANTANEOUS PATH VELOCITIES
• These res ults are instantaneous - see Section 1.3 for definition
• See Section 1.3 for details about Status
C10 Instantaneous Flow & Level
Flow : 1.60 litres/sec
DMD : 0.631 litres/sec
Arbitrated Level: 9.72 metre
i/p Type Status Level
1L USW1 ok 10.45 metre
2L BCD1 ok 9.89 metre
3L ENC1 ok 9.55 metre
4L
Aux
Aux
Aux
Aux
Channel1
can be ‘OK’; ‘no signal’, ‘no transducer’, ‘too low’
can be ‘OK’ or ‘no signal’
can be ‘OK’ or ‘no signal’
can be ‘OK’ or ‘no signal’
C11 Instantaneous Path Veloci ties
Velocity Units: metres/sec mS uS
Path Status Vos Vel tof dif
1 100% 1507 0.027 0.631 0.020
2 100% 1496 0.002 0.615 0.001
Channel1
percentage reading
APPENDIX 1 LCD SCREENS
Appendix 1 SCREEN FLOW DIAGRAMS, Page A1-11
Thermo Fisher Scientific
Page 60

Sarasota 2000 Ultrasonic Multipath
Flowmeter
SCREEN C12: PATH TEMPERATURES (RESULTS)
(Screen accessed via C1:Channel Diagnostics)
C12 Path Temperatures
Average Temperature 22.1 C
Path Upstream Downstre am
1 22.0 C 21.2 C
2 22.3 C 22.0 C
APPENDIX 1 LCD SCREENS
Channel1
PATH TEMPERATURES
• See Section 2.1
SCREEN S0: STATION MENU (MENU)
(Screen accessed via STATION HOME; ESC S1:Station Diagnostics; ESC G1:Password; ESC S2:Relay
Configuration; ESC S4:Serial Port A Configuration; ESC S5:Serial Port B Configuration; ESC S6:Serial Port C
Configuration; ESC S7:Power Management; ESC S8:Data Logging)
S0 Station Menu
Diagnostics
Setup
Relays
Port A RS232 (Modem)
Port B RS485
Port C RS232
Power Management
Data Logging
Station
Appendix 1 SCREEN FLOW DIAGRAMS, Page A1-12
Thermo Fisher Scientific
Page 61

Sarasota 2000 Ultrasonic Multipath
Flowmeter
SCREEN S1: STATION DIAGNOSTICS (MENU)
(Screen accessed via S0:Station Menu; ESC S10:Fault Status; ESC S11:Power Rails; ESC S12:Software Version)
S1 Station Diagnostics
Fault Status
Power Rails
Software Version
APPENDIX 1 LCD SCREENS
Station
SCREEN S10: FAULT STATUS (RESULTS)
(Screen accessed via S1:Station Diagnostics)
FAULT STATUS
• Fault Status
• On this screen ‘fault’ indicates a fatal fault ie. that all paths and levels on the channel
have failed. Non-fatal faults are not indicated on this screen. Refer to screen
C10:Instantaneous Flow & Level
S10 FAULT STATUS
Level Fail Ch1 ok
Level Fail Ch2 ok
Level Fail Ch3 unused
Level Fail Ch4 unused
Path Fail Ch1 ok
Path Fail Ch2 ok
Path Fail Ch3 unused
Path Fail Ch4 unused
CPU Power ok
Main Power ok
Backup Power ok
Clock Battery ok
CPU Fault ok
Interface Card ok
Station
can be ‘ok’, ‘unused’ or ‘fault’
Appendix 1 SCREEN FLOW DIAGRAMS, Page A1-13
Thermo Fisher Scientific
Page 62

Sarasota 2000 Ultrasonic Multipath
Flowmeter
SCREEN S11: POWER RAILS (RESULTS)
(Screen accessed via S1:Station Diagnostics)
S11 POWER RAILS
CPU Power: 5.05 Volts
Main Power: 15.24 Volts
Backup Power: 11.85 Volts
Clock Battery: ok
APPENDIX 1 LCD SCREENS
Station
POWER RAILS
• Typical value - CPU: 5 Volts +/- 0.2
• Typical value - Main: AC powered 14 to 16 Volts. DC powered as back-up
• Typical value - Back up: 11.5 to 14 Volts
• Clock battery
can be ‘ok’ or ‘replace’
SCREEN S12: SOFTWARE VERSION (RESULTS)
(Screen accessed via S1:Station Diagnostics)
SOFTWARE VERSION
• The card numbers are addres ses, not
• Addres ses are set by jumper links on the cards, see Section 2.3
• See Appendix 5: Site Data for relation between card type/address/position as
supplied.
S12 Software Version
Boot Rom : 2.1
CPU Card : 2.1
Card 2 : 2.0
Card 3 : 2.0
Card 4 : 2.0
Card 5 : 2.0
Card 6 : 2.0
Card 7 : 2.0
positions in the rack.
Appendix 1 SCREEN FLOW DIAGRAMS, Page A1-14
Thermo Fisher Scientific
Page 63

Sarasota 2000 Ultrasonic Multipath
Flowmeter
SCREEN G1: PASSWORD (GATEWAY)
(Screen accessed via S0:Station Menu)
PASSWORD
• This is a number (up to 6 digits) which must be entered to progress beyond this point.
• The unit is supplied with a default number 999999.
• Password may be changed via screen S22:Station Configuration.
SCREEN G2: SETUP MENU (GATEWAY MENU)
(Screen accessed via G1:Password; ESC S2:Station Setup; ESC C2:Channel Setup)
G1 Enter Password
Password: [……………]
Station
G2 Setup Menu
Station
Channel 1
Channel 2
Channel 3
Channel 4
APPENDIX 1 LCD SCREENS
Appendix 1 SCREEN FLOW DIAGRAMS, Page A1-15
Station
Thermo Fisher Scientific
Page 64

Sarasota 2000 Ultrasonic Multipath
Flowmeter
SCREEN S2: STATION SETUP (MENU)
(Screen accessed via G2:Setup Menu; ESC S20:Measurement Units; ESC S21:Real Time Clock; ESC S22:Station
Configuration; ESC S23:Card Address Map; ESC S24: Flow Calculation; ESC S25:Output Configuration; ESC
S26:Auxiliary Output Configuration; ESC S27:Transducer Configuration)
S2 Station Setup
Measurement Units
Real Time Clock
Station Configuration
Card Address Map
Flow Calculation
Output Configuration
Aux Input Configuration
Transducer Configuration
Station
APPENDIX 1 LCD SCREENS
Appendix 1 SCREEN FLOW DIAGRAMS, Page A1-16
Thermo Fisher Scientific
Page 65

Sarasota 2000 Ultrasonic Multipath
Flowmeter
SCREEN S20: MEASUREMENT UNITS (ENTRY/EDIT)
(Screen accessed via S2:Station Setup)
MEASUREMENT UNITS
Selection : Level:
metres
cm
mm
ft
inches
Selection: Flow:
litre/sec
litre/min
litre/hour
MLH
MLD
TCMD
m3/sec
CUMECS
m3/min
m3/hour
ft3/sec
ft3/min
CFM
ft3/hour
USgalls/sec
USgalls/min
USgalls/hour
MGD
Selection: Cumulative Flow and Totaliser Relay:
litres
m3
ML
ft3
USgalls
S20 Measurement Units
LEVEL metres
FLOW litre/sec
Cumulative Flow: litres
Totaliser Relay: litres
Station
APPENDIX 1 LCD SCREENS
Appendix 1 SCREEN FLOW DIAGRAMS, Page A1-17
Thermo Fisher Scientific
Page 66

Sarasota 2000 Ultrasonic Multipath
Flowmeter
SCREEN S21: REAL TIME CLOCK (ENTRY/EDIT)
(Screen accessed via S2:Station Setup)
REAL TIME CLOCK
Selection: Month:
January – December
Selection: Date Format:
dd month yyyy
month dd yyyy
yyyy month dd
S21 Real Time Clock
Hours: [10]
Minutes: [58]
Day: [16]
Month: June
Year: [2001]
Date Format: dd mm yyyy
Station
APPENDIX 1 LCD SCREENS
Appendix 1 SCREEN FLOW DIAGRAMS, Page A1-18
Thermo Fisher Scientific
Page 67

Sarasota 2000 Ultrasonic Multipath
Flowmeter
SCREEN S22: STATION CONFIGURATION (ENTRY/EDIT)
(Screen accessed via S2:Station Setup)
STATION CONFIGURATION:
Selection: Station name:
Alphanumeric name of up to 17 characters
Selection: Num ber of Channels:
Selection: Summation of Channels:
Separate
Combined
Selection: C ycle Time: (See Section 1.3)
1 minute
10 seconds
Selection: Password:
Default password 999999. Can be changed to other numerical password of
S22 Station Configuration
Station Name: [abc123]
Number of Channels: [1]
Summation of Channels: Separate
Cycle Time: 10 seconds
Password: […………]
Station Text Off
1, 2, 3 or 4.
up to 6 digit s
APPENDIX 1 LCD SCREENS
Appendix 1 SCREEN FLOW DIAGRAMS, Page A1-19
Thermo Fisher Scientific
Page 68

Sarasota 2000 Ultrasonic Multipath
Flowmeter
SCREEN S23: CARD ADDRESS MAP (MENU)
(Screen accessed via S2:Station Setup)
• The card numbers are addresses, not
• Addresses are set by jumper links on the cards, see Section 2.3
• See Appendix 5: site data for relation between card type/address/position as supplied
• By pressing ENTER on selected card (paths 4-7), screen S230: PATH ALLOCATION is
accessed. Part 1 lists paths A1-4 and B1-4, part 2 lists paths C1-4 and D1-4, part 3 lists
paths E1-4 and F1-4 and part 4 lists paths G1-4 and H1-4
SCREEN S230: PATH ALLOCATION (ENTRY/EDIT)
(Screen accessed via S23:Card Address Map)
PATH ALLOCATION:
Selection: Path type:
Normal Path
Reflected Path
• A1, A 2 etc are Hardware Identifiers (HWIDs), where A, B, C, D are rear panel BNC
connections and 1, 2, 3, 4 are multi-drop transducer addresses.
• See Fig 5, Section 2.3.3
S23 Card Address Map
1 No Card
2 No Card
3 I/O card #1
4 Path A & B & Level W
5 No Card
6 No Card
7 No Card
Station Rebuild
positions in the rack.
S230 Path Allocation
A1 * Channel1 Path […1] Normal Path
A2 * Channel1 Path […2] Reflec ted Path
A3 * Disabled Path [……] Normal Path
A4 * Disabled Path [……] Normal Path
B1 * Channel1 Path […3] Normal Path
B2 * Channel1 Path […4] Normal Path
B3 * Disabled Path [……] Normal Path
B4 * Disabled Path [……] Normal Path
Station
APPENDIX 1 LCD SCREENS
Appendix 1 SCREEN FLOW DIAGRAMS, Page A1-20
Thermo Fisher Scientific
Page 69

Sarasota 2000 Ultrasonic Multipath
Flowmeter
SCREEN S24: FLOW CALCULATION (ENTRY/EDIT)
(Screen accessed via S2:Station Setup)
FLOW CALCULATIONS:
• S ee section 1.2.5
Selection : Method: (See section 1.2.5)
Selection : Averaging Period:
Selection : Reset Cumulative Flow: (Use this to reset totaliser)
S24 Flow Calculation
Method : Mean Section
Averaging Period: 10 seconds
Reset Cumulative Flow: No
Station
Mean Section
Mid Section
10 seconds
30 seconds
1 minute
5 minute
10 minute
15 minute
30 minute
No
Yes
APPENDIX 1 LCD SCREENS
Appendix 1 SCREEN FLOW DIAGRAMS, Page A1-21
Thermo Fisher Scientific
Page 70

Sarasota 2000 Ultrasonic Multipath
Flowmeter
SCREEN S25: OUTPUT CONFIGURATION (ENTRY/EDIT)
(Screen accessed via S2:Station Setup; ESC S250:Analogue Output Configuration; ESC S251:BCD Output
Configuration)
OUTPUT CONFIGURATION
• Analogue 1 t o 4 (2 available per I/O card; BCD 1 to 2 (1 available per I/O module)
• Select ion of analogue output type access es screen S250:Analogue Output
Configuration
• Selection of BCD output type accesses sc reen S251:BCD Output Configuration
Selection : Outputs:
S25 Output Configration
Analogue 1 Flow
Analogue 2 Test O/P
BCD 1 Level
Analogue 3 Velocity
Analogue 4 DMD
BCD 2 None
Station
None (disabled)
Flow
Level
Velocity
Daily mean discharge (DMD)
Test O/P (Note: not selectable for BCD outputs)
APPENDIX 1 LCD SCREENS
Appendix 1 SCREEN FLOW DIAGRAMS, Page A1-22
Thermo Fisher Scientific
Page 71

Sarasota 2000 Ultrasonic Multipath
Flowmeter
SCREEN S250: ANALOGUE OUTPUT CONFIGURATION (ENTRY/EDIT)
(Screen accessed via selection of analogue output type on screen S25:Output Configuration)
S250 Analogue Output 1
Output Variable : Flow
Source: Channel1
Units: CUMECS
Zero Scale [0.00]
Full Scale [0.00]
APPENDIX 1 LCD SCREENS
Station
ANALOGUE OUTPUT CONFIGURATION
• Available for each analogue output (up to 4)
• Output variable
Selection : Output Source:
Station
Channel1-4
determined by input on screen S25:Output Configuration
Appendix 1 SCREEN FLOW DIAGRAMS, Page A1-23
Thermo Fisher Scientific
Page 72

Sarasota 2000 Ultrasonic Multipath
Flowmeter
SCREEN S251: BCD OUTPUT CONFIGURATION (ENTRY/EDIT)
(Screen accessed via selection of BCD output type on screen S25:Output Configuration)
BCD OUTPUT CONFIGURATION
• Screen available for each BCD output (max 2, if BCD is not
• Output variable determined by selection on screen S25:Output Configuration except
‘none’ and ‘test o/p’
• See Section 2.3.3.2.3
Selection : Source:
Station
Channel1-4
Selection: Decimal Places:
0, 1, 2, 3 or Coded
SCREEN S252: TEST OUTPUT CONFIGURATION (ENTRY/EDIT)
(Screen accessed via selection of test o/p type on S25:Output Configuration)
S251 BCD Output
Output Variable : DMD
Source: Channel1
Decimal Places: 0
Units: CUMECS
Station
S252 ANALOGUE OUTPUT 1
APPENDIX 1 LCD SCREENS
allocated as an input)
TEST OUPUT CONFIGURATION
• Screen S252:Test Output only available for each analogue output where ‘test O/P’
output variable is selected
Appendix 1 SCREEN FLOW DIAGRAMS, Page A1-24
Output Variable : Test O/P
Test Value: [0.000] mA
Station
Thermo Fisher Scientific
Page 73

Sarasota 2000 Ultrasonic Multipath
Flowmeter
SCREEN S26: AUXILIARY INPUT CONFIGURATION (MENU)
(Screen accessed via S2:Station Setup; ESC C211:Ultrasonic Level; ESC C212:Analogue Input; ESC C213:ENC
Input; ESC 214:BCD Input)
S26 Aux Input Configuration
Aux : [ USW – 4 ]
Aux : [Disabled ]
Aux : [Disabled ]
Aux : [Disabled ]
APPENDIX 1 LCD SCREENS
Station
AUXILIARY INPUT CONFIGURATION
• By selecting auxiliary input and pressing LEFT or RIGHT arrow key, screen
S260:Auxiliary Input Configuration is accessed
• By pressing ENTER on US, screen C211:Ultrasonic Level US is accessed
• By pressing ENTER on AIN, screen C212:Analogue Input AIN is accessed
• By pressing ENTER on ENC, screen C213:Encoder Input ENC is accessed
• By pressing ENTER on BCD, screen C214:BCD Input BCD is accessed
SCREEN S260: AUXILIARY INPUT ALLOCATION (ENTRY/EDIT)
(Screen accessed via S26:Auxiliary Input Configuration)
S260 Aux Input Allocation
Disabled
Level USW-1 IF Card 1
Level USW-2 IF Card 1
Level USW-3 IF Card 1
Level USW-4 IF Card 1
Level AIN-1 I/0 Card 1
Level AIN-1 I/O Card 1
Level ENC-1 I/O Card 1
Station
Appendix 1 SCREEN FLOW DIAGRAMS, Page A1-25
Thermo Fisher Scientific
Page 74

Sarasota 2000 Ultrasonic Multipath
Flowmeter
SCREEN S27: TRA NSDUCER CONFIGURATION (ENTRY/EDIT)
(Screen accessed via S2:Station Setup)
TRANSDUCER CONFIGURATION
Selection: US Input:
W,X,Y,Z,A,B,C,D,E,F,G,H,
Selection: Up/Dn:
Level, upstream, downstream
WARNING: THI S SCREEN SHOULD ONLY BE ACCESSED BY AUTHORISED
S27 Transducer Configuration
US Input: W
Up/Dn: level
Wr Txdr:[.]Addr:[.]Data:[. ]
Rd Txdr:[.]Addr:[.]Data:[. ]
Station WrRAM RdRAM WrEEROM
THERMO FISHER SCIENTIFIC
APPENDIX 1 LCD SCREENS
Appendix 1 SCREEN FLOW DIAGRAMS, Page A1-26
Thermo Fisher Scientific
Page 75

Sarasota 2000 Ultrasonic Multipath
Flowmeter
SCREEN S3: RELAY CONFIGURATION (ENTRY/EDIT)
(Screen accessed via S0:Station Menu; ESC S30:Fault Relay Configuration; ESC S31:Relay Configuration)
FAULT RELAY CONFIGURATION
Selection: Fault Relay:
Enabled
Selection: Relays 1-4:
• When f ault relay selec t ion is ENTERED, sc reen S30:Relay Configuration is accessed
• When relay 1, 2, 3 or 4 selection is ENTERED, screen S31:Relay 1, 2, 3 or 4 is
accessed
S3 Relay Configuration
Fault Relay Enabled
Relay 1 Disabled
Relay 2 Disabled
Relay 3 Disabled
Relay 4 Disabled
Station
Disabled
Disabled
Totaliser
Flow estimate ala rm
Path fail
Level fail
Level low alarm
Level high alarm
Flow low alarm
Flow high alarm
APPENDIX 1 LCD SCREENS
Appendix 1 SCREEN FLOW DIAGRAMS, Page A1-27
Thermo Fisher Scientific
Page 76

Sarasota 2000 Ultrasonic Multipath
Flowmeter
SCREEN S30: FAULT RELAY CONFIGURATION (ENTRY/EDIT)
(Screen accessed via selection on ‘Fault Relay’ on screen S3: Relay Configuration)
FAULT RELAY CONFIGURATION
• Any one or more of the enabled conditions would activate the fault relay.
this relay, path fail alarm requires all paths to hav e failed see Section 1.3
S30 Fault Relay Configuration
Conditions To Activate Relay
Level Fail Ch1 Enabled
Level Fail Ch2 Disabled
Level Fail Ch3 Disabled
Level Fail Ch4 Disabled
Path Fail Ch1 Enabled
Path Fail Ch2 Enabled
Path Fail Ch3 Disabled
Path Fail Ch4 Disabled
CPU Power Enabled
Main Power Enabled
Backup Power Enabled
Clock Battery Enabled
CPU Fault Enabled
Interface Card Enabled
Station
APPENDIX 1 LCD SCREENS
Note that for
Appendix 1 SCREEN FLOW DIAGRAMS, Page A1-28
Thermo Fisher Scientific
Page 77

Sarasota 2000 Ultrasonic Multipath
Flowmeter
SCREEN S31: OTHER RELAY CONFIGURATION (ENTRY/EDIT)
(Screen accessed via selection of Relay on screen S3: Relay Configuration; ESC S311:Ultrasonic Paths)
S31 Relay 1
APPENDIX 1 LCD SCREENS
Source: Paths <>
toggle
Relay
On/off
Action: Level High Alarm
Polarity: Normally Energised
Delay: [ ] seconds
Latch: Enabled
Setpoint: [ ] metre
Station
RELAY CONFIGURATION (FOR RELAY 1, 2, 3 and 4)
Selection : Source:
Station
Channel1-4
Paths <> (only av ailable for path:relay allocation)
(use LE F T an d RIGHT arrow key t o t og gle allocatio n o n/off)
Selection : Polarity:
Normally Energised
Normally De-energised
Selection: Latch:
Enabled
Disabled
Selection : Scaler
(totaliser only):
x1, x2, x 5, x10, x20, x50, x100,x 200, x500
Selection: Setpoint:
(low level alarm, level high alarm, flow low alarm, flow high alarm only)
Numeric input
Appendix 1 SCREEN FLOW DIAGRAMS, Page A1-29
Thermo Fisher Scientific
Page 78

Sarasota 2000 Ultrasonic Multipath
Flowmeter
SCREEN S311: RELAY ULTRASONIC PATHS ALLOCATION
(ENTRY/EDIT)
(Screen accessed via S31: Relay 1-4)
S311 Ultrasonic Paths
Path 1 [A1] Relay 1
Path 2 [A2] Disabled
APPENDIX 1 LCD SCREENS
Station
RELAY CONFIGURATION (FOR RELAY 1, 2, 3 and 4)
• All configured channels and paths shown on scrollable list
• If path is unallocated, highlight selected path, press ENTER to allocate relay to path
• If path already allocated, press ENTER to disable allocation
Selection : Source:
Relay 1-4
Disabled
Appendix 1 SCREEN FLOW DIAGRAMS, Page A1-30
Thermo Fisher Scientific
Page 79

Sarasota 2000 Ultrasonic Multipath
Flowmeter
SCREEN S4: SERIAL PORT A CONFIGURATION (ENTRY/EDIT)
(Screen accessed via S0:Station Menu)
SERIAL PORT A CONFIGURATION
Selection : Protocols:
Selection: Baud Rates:
S4 Serial Port Configuration
Port A RS232 (modem)
Protocol : ModBus ASCII
Baud Rate: 9600
Station
ASCII
RTU
1200
2400
4800
9600
19200
APPENDIX 1 LCD SCREENS
Appendix 1 SCREEN FLOW DIAGRAMS, Page A1-31
Thermo Fisher Scientific
Page 80

Sarasota 2000 Ultrasonic Multipath
Flowmeter
SCREEN S5: SERIAL PORT B CONFIGURATION (ENTRY/EDIT)
(Screen accessed via S0:Station Menu)
SERIAL PORT B CONFIGURATION
Selection : Port B RS 485:
Selection: Protocol, Baud Rate
Selection: Parity:
SCREEN S6: SERIAL PORT C CONFIGURATION (ENTRY/EDIT)
(Screen accessed via S0:Station Menu)
SERIAL PORT C CONFIGURATION
S5 Serial Port Configuration
Port B RS485 Full Duplex
Protocol: ModBus RTU
Baud Rate: 19200
Parity: ODD
Station
Full duplex
Half duplex
As for Serial Port A
None
Even
Odd
S6 Serial Port Configuration
Port C RS232
Protocol: ModBus ASCII
Baud Rate: 9600
Parity: EVEN
Station
APPENDIX 1 LCD SCREENS
Appendix 1 SCREEN FLOW DIAGRAMS, Page A1-32
Thermo Fisher Scientific
Page 81

Sarasota 2000 Ultrasonic Multipath
Flowmeter
Selection : As Port B but additional Baud Rate of 38400
SCREEN S7: POWER MANAGEMENT (ENTRY/EDIT)
(Screen accessed via S0:Station Menu)
POWER MANAGEMENT
• this affects test threshold for alarm
• See Appendix 3: Specification
Selection: Power source:
Selection: Low Power Control:
Disabled
External
Timer
S7 Power Management
Display: Off after 15 minutes
Power source: AC
Low Power Control: Disabled
On Time(HHMMSS): 00:00:45
Off Time(HHMMSS): 00:00:45
Station
AC
DC 12V
APPENDIX 1 LCD SCREENS
Appendix 1 SCREEN FLOW DIAGRAMS, Page A1-33
Thermo Fisher Scientific
Page 82

Sarasota 2000 Ultrasonic Multipath
Flowmeter
SCREEN S8: DATA LOGGING (ENTRY/EDIT)
(Screen accessed via S0:Station Menu)
DATA LOGGING
Selection : Logging Interval:
Selection : Log Wrap:
Selection : Log Variable:
(those marked * have an index of ‘0’, all other indices relate to individual paths or depths)
Selection: Source:
Station
Channel 1-4
S8 Data Logging
Log Id : [abc123]
Logging Interval:30 seconds
Log Wrap : yes
Source Index
Var 1 :Flow Channel1 []
Var 2 :Cumulative Channel1 []
Var 3 :Velocity Channel1 []
Var 4 :Level Channel1 []
Var 5 :DMD Channel1 []
Var 6 :Temperature Channel1 []
Var 7 :Path Velocity Channel1 []
Var 8 :Path Vos Channel1 []
Var 9 :Path tof Channel1 []
Var 10:Path % good Channel1 []
Var 11:Diff Time Channel1 []
Var 12:iLevel Channel1 []
Station Text Off
30 seconds
1 minute
5 minutes
10 minutes
15 minutes
30 minutes
off
Yes
No
None
Flow*
Cumulative*
Velocity*
Level
DMD*
Temperature*
Path velocity
Path vos
Path tof
Path % good
Diff time
iLevel
APPENDIX 1 LCD SCREENS
Appendix 1 SCREEN FLOW DIAGRAMS, Page A1-34
Thermo Fisher Scientific
Page 83

Sarasota 2000 Ultrasonic Multipath
Flowmeter
SCREEN C2: CHANNEL SETUP (MENU)
(Screen accessed via G2:Setup Menu; ESC/ENTER C20:Channel Configuration; ESC C21:Level Measurement; ESC
C22:Ultrasonic Paths; ESC C23:Channel Profile; ESC C24:Flow Estimate Table)
CHANNEL SETUP
• Screen available for each configured channel
SCREEN C20: CHANNEL CONFIGURATION (ENTRY/EDIT)
(Screen accessed via C2:Channel Setup)
CHANNEL CONFIGURATION
• See Section 1.3
• Screen available for each configured channel
Selection : Level Datum:
Fixed datum
Mean bed level
Selection : Xdr Fire Sequence:
Simultaneous
Alternate (use alternate if there is risk of reflections from submerged objects)
C2 Channel Setup
Channel Configuration
Level Measurement
Ultrasonic Paths
Channel Profile
Flow Estimate Table
Station
C20 Channel Configuration
Channel No.: 1
Level Datum: Fixed Datum
Bed Level: [0.12]metre
Level Arbitration:[0.05]metre
Xdr Fire Sequence:Simultaneous
Bottom Slice Factor: [0.80]
Top Slice Factor: [0.5]
Channel1
APPENDIX 1 LCD SCREENS
Appendix 1 SCREEN FLOW DIAGRAMS, Page A1-35
Thermo Fisher Scientific
Page 84

Sarasota 2000 Ultrasonic Multipath
Flowmeter
SCREEN C21: LEVEL MEASUREMENT (MENU/RESULTS)
(Screen accessed via C2:Channel Setup; selection or ESC C210:Level Allocation; ESC C211:Ultrasonic Level US
Menu; selection or ESC C212:Analogue Input Configuration; ESC C213:Encoder Input Configuration; ESC
C214:BCD Input Configuration)
LEVEL MEASUREMENT
• Screen available for each configured channel
• Use of LEFT and RIGHT arr ow keys on selected pa t h ac c e s s e s sc reen C210:Level
Allocation for selection
• Pressing ENTER on selected US (ultrasonic level input) links to screen
C211:Ultrasonic Level US
• Pressing ENTER on selected AIN (analogue input) links to screen C212:Analogue
Input AIN
• Pressing ENTER on selected ENC (encoder input) links to screen C213:Encoder
Input ENC
• Pressing ENTER on selected BCD (binary coded decimal input) links to screen
C214:BCD Input BCD
C21 Level Measurement
1L USW - 1
2L AIN - 2
3L ENC - 1
4L BCD - 1
Station
APPENDIX 1 LCD SCREENS
Appendix 1 SCREEN FLOW DIAGRAMS, Page A1-36
Thermo Fisher Scientific
Page 85

Sarasota 2000 Ultrasonic Multipath
Flowmeter
SCREEN C210: LEVEL ALLOCATION (ENTRY/EDIT)
(Screen accessed via C21:Level Measurement)
• Screen available for each configured channel
• Com plete s election on scrollable screen using UP and DOWN arrow keys.
• The sample screen shown above shows one interface card (level USW, paths 1-4).
Additional cards will be shown as USX, USY and USZ as appropriate, each with path
number 1-4.
• Refer to Fig 5, Section 2.3.3.
Selection: Level Inputs:
Disabled
USW 1-4
USX 1-4
USY 1-4
USZ 1-4
AIN 1-4
ENC 1-2
BCD 1-2
C210 Level Allocation
Disabled
Level USW-1 IF Card 1
Level USW-2 IF Card 1
Level USW-3 IF Card 1
Level USW-4 IF Card 1
Level AIN-1 IO Card 1
Level AIN-1 IO Card 1
Level ENC-1 IO Card 1
Level BCD-1 IO Card 1
Station
APPENDIX 1 LCD SCREENS
Appendix 1 SCREEN FLOW DIAGRAMS, Page A1-37
Thermo Fisher Scientific
Page 86

Sarasota 2000 Ultrasonic Multipath
Flowmeter
SCREEN C211: ULTRASONIC LEVEL INPUT MENU (MENU)
(Screen accessed via US selection on C21:Level Measurement and US selection on S26:Auxiliary Input
Configuration)
ULTRASONIC LEVEL MENU
• Screen available for each configured ultrasonic level input
SCREEN C212: ANALOGUE INPUT CONFIGURATION (ENTRY/EDIT)
(Screen accessed via AIN selection on C21:Level Measurement and AIN selection on S26:Auxiliary Input
Configuration)
ANALOGUE LEVELCONFIGURATION
• Screen available for each configured analogue input
Selection: Input Range:
0-5V
C211 Ultrasonic Level USW
Level Configuration
Level Transducer Setup
Waveform Capture
Station
C212 Analogue Input AIN
Input Range: 0–20 mA Units: mm
Level above Datum : [0.00]
Input Level
0 [4.00] [0]
1 [20.00] [5]
2
3
4
5
6
7
8
9
Station
0-20mA
APPENDIX 1 LCD SCREENS
Appendix 1 SCREEN FLOW DIAGRAMS, Page A1-38
Thermo Fisher Scientific
Page 87

Sarasota 2000 Ultrasonic Multipath
Flowmeter
SCREEN C213: ENCODER INPUT CONFIGURATION (ENTRY/EDIT)
(Screen accessed via ENC selection on C21:Level Measurement an d ENC selection on S26:Auxiliary Input
Configuration)
C213 Encoder Input ENC
Current Level : [0.00]metre
Scaling Factor: [0.00]metre
Station
ENCODER LEVEL CONFIGURATION
• Screen available for each configured encoder input
• See Section 2.3.3.2.3
APPENDIX 1 LCD SCREENS
Appendix 1 SCREEN FLOW DIAGRAMS, Page A1-39
Thermo Fisher Scientific
Page 88

Sarasota 2000 Ultrasonic Multipath
Flowmeter
SCREEN C214: BCD INPUT CONFIGURATION (ENTRY/EDIT)
(Screen accessed via BCD selection on C21:Level Measurement and selection of BCD on S26:Auxiliary Input
Configuration)
BCD LEVEL CONFIGURATION
• Screen available for each configured BCD input
• See Section 2.3.3.2.3
• The conversion factor is a factor which determines the scaling (including decimal
place) and polarity
SCREEN C215: (ULTRASONIC) LEVEL CONFIGURATION (ENTRY/EDIT)
(Screen accessed via C211:Ultrasonic Level Input Menu)
(ULTRASONIC) LEVEL CONFIGURATION
• Screen available for each configured ultrasonic level input
• See Section 2.3.3
Selection: Transducer siting:
Channel1-4
C214 BCD Input BCD
Level Above Datum:[0.00]metre
Conversion Factor(+/-): [0.00]
Station
C215 Level Configuration
Transducer Id: USW-1 Type: 500kHz
Transducer Siting: Channel 1
Transducer Level: [3.9]me tres
Min Submersion : [0.03]metres
Station
Disabled
APPENDIX 1 LCD SCREENS
Appendix 1 SCREEN FLOW DIAGRAMS, Page A1-40
Thermo Fisher Scientific
Page 89

Sarasota 2000 Ultrasonic Multipath
Flowmeter
SCREEN C216: LEVEL TRANSDUCER SETUP (ENTRY/EDIT)
(Screen accessed via C211:Ultrasonic Level Menu)
LEVEL TRANSDUCER SETUP
• See Appendix 5: Site Data
• Screen available for each configured ultrasonic level input
Selection: Setup:
Manual
Auto
Selection: Gain:
1
2
5
10
Selection: Setup:
1 (11 volts)
2 (23 volts)
3 (36 volts)
4 (62 volts)
5 (100 volts)
6 (144 volts)
7 (185 volts)
0 (0 volts)
Selection: Charge Mode:
Continuous
Single shot
Selection: Shape Recognition:
Yes
No
C216 Transducer Setup
Setup: Manual
Gain: 1
Drive: 1(11 volts)
Charge Mode: Continuous
Shape Recognition: No
Station
APPENDIX 1 LCD SCREENS
Appendix 1 SCREEN FLOW DIAGRAMS, Page A1-41
Thermo Fisher Scientific
Page 90

Sarasota 2000 Ultrasonic Multipath
Flowmeter
SCREEN C217: LEVEL WAVEFORM CAPTURE SETUP (ENTRY/EDIT)
(Screen accessed via C211:Ultrasonic Level Menu; ESC C218:Waveform Display)
WAVEFORM CAPTURE SETUP
• Screen available for each configured channel
• Trigger delay value is typically equal to the time of flight (tof) value displayed on
screen C218:Waveform Display
Selection: Capture:
Auto
Single shot
Selection: Sample Period:
256 uS
512 uS
1 mS
4 mS
8 mS
16 mS
32 mS
64 mS
128 mS
256 mS
409 mS
C217 Waveform Capture Setup
Capture : Off
Sample Period: 1 mS
Trigger Delay: [0.00]mS
Station
APPENDIX 1 LCD SCREENS
Appendix 1 SCREEN FLOW DIAGRAMS, Page A1-42
Thermo Fisher Scientific
Page 91

Sarasota 2000 Ultrasonic Multipath
Flowmeter
SCREEN C218: WAVEFORM DISPLAY (WAVEFORM)
(Screen accessed via C217:Waveform Capture Setup)
Tof:0.637mS
APPENDIX 1 LCD SCREENS
level
0.600mS Level W1 1.112mS
WAVEFORM DISPLAY
• Screen available for each configured ultrasonic level input
• Time of flight (tof) value typically taken as trigger value input for screen
C217:Waveform Capture Setup
• Detection levels shown as horizontal dotted lines.
• Initial number shown at bottom left of screen is trigger delay. Initial number shown at
bottom right of screen is duration (trigger delay + sample period)
• On access to C218:Waveform Display - Level from C217:Waveform Capture Setup,
the initial waveform relates to sample period input in C217:Waveform Capture Setup
• UP and DOWN arrow keys can be used to zoom in and out and LEFT and RIGHT
arrow keys can be used to shift the display window
Appendix 1 SCREEN FLOW DIAGRAMS, Page A1-43
Thermo Fisher Scientific
Page 92

Sarasota 2000 Ultrasonic Multipath
Flowmeter
SCREEN C22: ULTRASONIC VELOCITY PATHS (MENU)
(Screen accessed via C2:Channel Setup; ESC C220:Path Menu)
ULTRASONIC PATH ALLOCATION
• Screen available for each configured channel
• See Section 2.3.3
• Paths shown have been selected via screen S230:Path Allocation
• In the exampl e above, the transduc er f or paths 1 and 2 are multi-dropped and
connected to rear terminal A. Similarly, paths 3 and 4 are multi-dropped and
connected to re ar t er m i na l B.
• Highlighting the selected path and pressing ENTER accesses C220:Path Menu to
enable configuration of each path
• Alternatively, a ‘cloning’ function is available via the Clone soft key as a shor t cut for
applications where path configuration is similar (eg. a vertical sided channel). The
configuration of the highlighted path is applied to all paths below in the list, however
path height will still need to be entered via screen C221:Path Configuration Edit.
• On completion of configuration, press Rebuild soft key
C22 Ultrasonic Paths
Path 1 [A1] IF Card 1
Path 2 [A2] IF Card 1
Path 3 [B1] IF Card 1
Path 4 [B2] IF Card 1
Station Clone Rebuild
APPENDIX 1 LCD SCREENS
Appendix 1 SCREEN FLOW DIAGRAMS, Page A1-44
Thermo Fisher Scientific
Page 93

Sarasota 2000 Ultrasonic Multipath
Flowmeter
SCREEN C220: PATH MENU (MENU)
(Screen accessed via C22:Ultrasonic Paths; ESC C:221:Path Configuration Edit; ESC C222:Transducer Setup; ESC
C223:Waveform Capture Setup; ESC C224:Path Constants)
PATH MENU
• Screen available for each configured path
SCREEN C221: ULTRASONIC PATH CONFIGURATION (ENTRY/EDIT)
(Screen accessed via C220:Ultrasonic Velocity Path Menu)
ULTRASONIC PATH CONFIGURATION
• Screen available for each configured path
• See Section 1
• Path X Factor
exceptional circumstances. Consult Thermo Fisher Scientific.
Selection : Path Status:
Disabled
Enabled
C220 Path1 [A1]
Path Configuration
Transducer Setup
Waveform Capture
Path Constants
Station
C221 Path A1 Configuration Edit
Transducer Type: 500 kHz
Path Type: Normal Path
Path Length: [95]cm
Path Angle: [20.00]degrees
Path Height: [203.0]cm
Path X Factor: [1.0]
Min. Submersion: [4.0] cm
Path Status: Enabled
Station
is normally 1. This value may be adjusted for calibration purposes in
APPENDIX 1 LCD SCREENS
Appendix 1 SCREEN FLOW DIAGRAMS, Page A1-45
Thermo Fisher Scientific
Page 94

Sarasota 2000 Ultrasonic Multipath
Flowmeter
SCREEN C222: VELOCITY TRANSDUCER SETUP (ENTRY/EDIT)
(Screen accessed via C220:Ultrasonic Velocity Path Menu)
VELOCITY TRANSDUCER SETUP
• Screen available for each configured path
Selection: Setup:
Manual
Auto
Selection: Gain:
1
2
5
10
Selection: Drive:
1 (11 volts)
2 (23 volts)
3 (36 volts)
4 (62 volts)
5 (100 volts)
6 (144 volts)
7 (185 volts)
0 (0 volts)
Selection: Charge Mode:
Continuous
Single shot
Selection: Shape Recognition:
No
Yes
C222 Transducer Setup
Setup: Manual
Seed Current
Gain: 10 1
Drive: 3(36V) 1(11 V)
Charge Mode: Continuous
Shape Recognition: No
Station
APPENDIX 1 LCD SCREENS
Appendix 1 SCREEN FLOW DIAGRAMS, Page A1-46
Thermo Fisher Scientific
Page 95

Sarasota 2000 Ultrasonic Multipath
Flowmeter
SCREEN C223: VELOCITY WAVEFORM CAPTURE SETUP (ENTRY/EDIT)
(Screen accessed via C220:Ultrasonic Velocity Path Menu; ESC C225:Waveform Display-Velocity)
C223 Waveform Capture Setup
Capture: Off
Source: Upstream
Sample Period: 256 uS
Trigger Delay: [0.02] mS
Station
APPENDIX 1 LCD SCREENS
WAVEFORM CAPTURE SETUP - VELOCITY
• Screen available for each configured path
• Trigger delay value is typically equal to the time of flight (tof) value displayed on
screen C225:Waveform Display-Velocity
Selection: Capture:
Off
Single shot
Auto
Selection: Source:
Downstream
Upstream
Both
Selection: Sample Period:
256 uS
512 uS
1 mS
4 mS
8 mS
16 mS
32 mS
64 mS
128 mS
256 mS
409 mS
Appendix 1 SCREEN FLOW DIAGRAMS, Page A1-47
Thermo Fisher Scientific
Page 96

Sarasota 2000 Ultrasonic Multipath
Flowmeter
SCREEN C224: PATH CONSTANTS (ENTRY/EDIT)
(Accessed via screen C220:Ultrasonic Path Velocity Menu)
PATH CONSTANTS
• Screen available for each configured path
• Selection of upstream or downstream transducers allows re-a llocation of a different
transducer from a different path.
• LE FT or RI GHT arrow key on US Txdr or DS Txdr accesses screen C226:Transducer
Re-allocation for select ion.
WARNING: CONSULT THERMO FISHER SCIENTIFIC BEFORE MAKING CHANGES TO
THIS SCREEN
C224 Path Constants
Hi-Limit A: [114]
Low-Limit B: [108]
Cable Offset: [0.00] ns
US Txdr: [A1] DS Txdr: [A1]
Station
APPENDIX 1 LCD SCREENS
Appendix 1 SCREEN FLOW DIAGRAMS, Page A1-48
Thermo Fisher Scientific
Page 97

Sarasota 2000 Ultrasonic Multipath
Flowmeter
SCREEN C225: WAVEFORM DISPLAY – VELOCITY (WAVEFORM)
(Screen accessed via C223:Waveform Capture Setup)
Tof:0.637Ms diff:0.02 uS
APPENDIX 1 LCD SCREENS
Upstream
Downstream
0.600mS Path A1 1.112mS
WAVEFORM DISPLAY – DUAL TRACE (VELOCITY)
• Screen available for each configured path
• Detection levels shown as horizontal dotted lines.
• Initial number shown at bottom left of screen is trigger delay. Initial number shown at
bottom right of screen is duration (trigger delay + sample period)
• On access to C225:Waveform Display – Velocity from C223:Waveform Capture
Setup, the initial waveform relates to sample period input in C223:Waveform Capture
Setup
• UP and DOWN arrow keys can be used to zoom in and out, and LEFT and RIGHT
arrow keys can be used to shift the display window
Appendix 1 SCREEN FLOW DIAGRAMS, Page A1-49
Thermo Fisher Scientific
Page 98

Sarasota 2000 Ultrasonic Multipath
Flowmeter
SCREEN C226: TRANSDUCER RE-ALLOCATION (ENTRY/EDIT)
(Screen accessed via C224:Path Constants)
TRANSDUCER RE-ALLOCATION
• Screen available for each configured path
• Path velocity transducers may be re-allocated in exceptional circumstances, for
example where a low level transducer is obscured. Therefore, path 1 upstream
transducer may fire to path 2 downstream transducer
SCREEN C23: CHANNEL PROFILE (MENU)
(Screen accessed via C2:Channel Setup)
C226 Transducer Re-Allocation
Path 1 [A1] IF Card 1
Path 2 [B1] IF Card 1
Path 3 [C1] IF Card 2
Path 4 [D1] IF Card 2
Station
C23 Channel Profile
Edit Channel Profile page 1
Edit Channel Profile page 2
Edit Channel Profile page 3
Station
APPENDIX 1 LCD SCREENS
Appendix 1 SCREEN FLOW DIAGRAMS, Page A1-50
Thermo Fisher Scientific
Page 99

Sarasota 2000 Ultrasonic Multipath
Flowmeter
SCREEN C230: CHANNEL PROFILE EDIT (ENTRY/EDIT)
(Screen accessed via C23:Channel Profile)
CHANNEL PROFILE
• Def ined independently from the path dimensions
• See Section 1.3
• Edit pages 2 and 3 are available for table entries in excess of 9 ie. for table entries
10-19 and 20-29 respectively.
SCREEN C24: FLOW ESTIMATE TABLE (MENU)
(Screen accessed via C2: Channel Setup)
C230 Channel Profile Edit
Channel Height Channel Width
metres metres
Bed[ ] [ ]
1 [ ] [ ]
2 [ ] [ ]
3 [ ] [ ]
4 [ ] [ ]
5 [ ] [ ]
6 [ ] [ ]
7 [ ] [ ]
8 [ ] [ ]
9 [ ] [ ]
Station
C24 Flow Estimate Table
APPENDIX 1 LCD SCREENS
Edit Flow Table page 1
Edit Flow Table page 2
Edit Flow Table page 3
Station
FLOW ESTIMATE TABLE
• Level to flow conversion table may be used when velocity is not calculable, e.g. at low
water level
• See Section 1.3
Appendix 1 SCREEN FLOW DIAGRAMS, Page A1-51
Thermo Fisher Scientific
Page 100

Sarasota 2000 Ultrasonic Multipath
Flowmeter
SCREEN C240: FLOW TABLE EDIT (ENTRY/EDIT)
(Screen accessed via C24: Flow Estimation Table)
FLOW TABLE EDIT
• Edit pages 2 and 3 are same, levels from 10 to 19 and 20 to 29 respectively
• See Section 1.3
C240 Flow Table Edit
River Level
metre
0 [……] [………]
1 [……] [………]
2 [……] [………]
3
4
5
6
7
8
9
Station
Flow Estimate
CUMECS
APPENDIX 1 LCD SCREENS
Appendix 1 SCREEN FLOW DIAGRAMS, Page A1-52
Thermo Fisher Scientific
 Loading...