

Page 1
Model 42i
Instruction Manual
Chemiluminescence NO-NO2-NOx Analyzer
Part Number 101350-00
28Dec2007
Page 2

© 2007 Thermo Fisher Scientific Inc. All rights reserved.
Specifications, terms and pricing are subject to change. Not all products are available in all countries. Please
consult your local sales representative for details.
Thermo Fisher Scientific
Air Quality Instruments
27 Forge Parkway
Franklin, MA 02038
1-508-520-0430
www.thermo.com/aqi
Page 3

WEEE Compliance
This product is required to comply with the European Union’s Waste
Electrical & Electronic Equipment (WEEE) Directive 2002/96/EC. It is
marked with the following symbol:
Thermo Fisher Scientific has contracted with one or more
recycling/disposal companies in each EU Member State, and this product
should be disposed of or recycled through them. Further information on
Thermo Fisher Scientific’s compliance with these Directives, the recyclers
in your country, and information on Thermo Fisher Scientific products
which may assist the detection of substances subject to the RoHS Directive
are available at: www.thermo.com/WEEERoHS.
Thermo Fisher Scientific WEEE Compliance
Page 4

Page 5

Reference Method Designation
The Thermo Scientific Model 42i is designated by the United States
Environmental Protection Agency (US EPA) as a Reference Method for the
measurement of ambient concentrations of nitrogen dioxide pursuant with
the requirements defined in the Code of Federal Regulations, Title 40, Part
53.
Designated Reference Method Number: RFNA-1289-074
EPA Designation Date: December 11, 1989 (amended for Model 42i)
The Model 42i Chemiluminescence NO-NO2-NOx Analyzer meets EPA
reference designation requirements when operated with the following:
Range 50 to 1000 ppb
Averaging Time 10 to 300 seconds
Temperature Range 15 to 35 °C
Line Voltage 90 to 110 Vac @50/60 Hertz
105 to 125 Vac @50/60 Hertz
210 to 250 Vac @50/60 Hertz
Pressure Compensation ON or OFF
Temperature Compensation ON or OFF
Flow Rate 0.5 to 1 LPM
RS-232/RS-485 Interface
With or without the following options:
Teflon Particulate Filter
Ozone Particulate Filter
Internal Zero/Span and Sample Valves
Ozone Permeation Dryer
Permeation Oven
Rack Mounts
I/O Expansion Board
Thermo Fisher Scientific Reference Method Designation
Page 6

Page 7

About This Manual
This manual provides information about operating, maintaining, and
servicing the analyzer. It also contains important alerts to ensure safe
operation and prevent equipment damage. The manual is organized into
the following chapters and appendixes to provide direct access to specific
operation and service information.
● Chapter 1 “Introduction” provides an overview of product features,
describes the principles of operation, and lists the specifications.
● Chapter 2 “Installation” describes how to unpack, setup, and startup
the analyzer.
● Chapter 3 “Operation” describes the front panel display, the front
panel pushbuttons, and the menu-driven software.
● Chapter 4 “Calibration” provides the procedures for calibrating the
analyzer and describes the required equipment.
● Chapter 5 “Preventive Maintenance” provides maintenance procedures
to ensure reliable and consistent instrument operation.
● Chapter 6 “Troubleshooting” presents guidelines for diagnosing
analyzer failures, isolating faults, and includes recommended actions for
restoring proper operation.
● Chapter 7 “Servicing” presents safety alerts for technicians working on
the analyzer, step-by-step instructions for repairing and replacing
components, and a replacement parts list. It also includes contact
information for product support and technical information.
● Chapter 8 “System Description” describes the function and location of
the system components, provides an overview of the software structure,
and includes a description of the system electronics and input/output
connections.
● Chapter 9 “Optional Equipment” describes the optional equipment
that can be used with this analyzer.
● Appendix A “Warranty” is a copy of the warranty statement.
● Appendix B “C-Link Protocol Commands” provides a description of
the C-Link protocol commands that can be used to remotely control an
analyzer using a host device such as a PC or datalogger.
Thermo Fisher Scientific Model 42i Instruction Manual i
Page 8
About This Manual
Safety
● Appendix C “MODBUS Protocol” provides a description of the
MODBUS Protocol Interface and is supported both over RS-232/485
(RTU protocol) as well as TCP/IP over Ethernet.
● Appendix D “Geysitech (Bayern-Hessen) Protocol” provides a
description of the Geysitech (Bayern-Hessen or BH) Protocol Interface
and is supported both over RS-232/485 as well as TCP/IP over
Ethernet.
Safety
Safety and Equipment
Damage Alerts
Review the following safety information carefully before using the analyzer.
This manual provides specific information on how to operate the analyzer,
however, if the calibrator is used in a manner not specified by the
manufacturer, the protection provided by the equipment may be impaired.
This manual contains important information to alert you to potential safety
hazards and risks of equipment damage. Refer to the following types of
alerts you may see in this manual.
Safety and Equipment Damage Alert Descriptions
Alert Description
DANGER A hazard is present that will result in death or serious
WARNING A hazard is present or an unsafe practice can result in
CAUTION The hazard or unsafe practice could result in minor to
personal injury if the warning is ignored.
serious personal injury if the warning is ignored.
moderate personal injury if the warning is ignored.
▲
▲
▲
Equipment Damage The hazard or unsafe practice could result in property
damage if the warning is ignored.
▲
ii Model 42i Instruction Manual Thermo Fisher Scientific
Page 9
Safety and Equipment Damage Alerts
Safety and Equipment damage Alerts in this Manual
Alert Description
About This Manual
WARNING If the equipment is operated in a manner not specified by
the manufacturer, the protection provided by the
equipment may be impaired.
▲
The service procedures in this manual are restricted to
qualified service personnel only.
▲
The Model 42i is supplied with a three-wire grounding
cord. Under no circumstances should this grounding
system be defeated.
CAUTION If the LCD panel breaks, do not to let the liquid crystal
contact your skin or clothes. If the liquid crystal contacts
▲
your skin or clothes, wash it off immediately using soap
and water.
Equipment Damage Do not attempt to lift the analyzer by the cover or other
external fittings.
Some internal components can be damaged by small
▲
▲
amounts of static electricity. A properly grounded
antistatic wrist strap must be worn while handling any
internal component.
This adjustment should only be performed by an
instrument service technician.
Handle all printed circuit boards by the edges only.
Do not remove the panel or frame from the LCD module.
▲
▲
▲
▲
The LCD module polarizing plate is very fragile, handle it
carefully.
▲
Do not wipe the LCD module polarizing plate with a dry
cloth, it may easily scratch the plate.
▲
Do not use Ketonics solvent or aromatic solvent to clean
the LCD module, use a soft cloth moistened with a
naphtha cleaning solvent.
Do not place the LCD module near organic solvents or
corrosive gases.
▲
Do not shake or jolt the LCD module.
▲
▲
Thermo Fisher Scientific Model 42i Instruction Manual iii
Page 10

About This Manual
W
W
FCC Compliance
FCC Compliance
EEE Symbol
Changes or modifications to this unit not expressly approved by the party
responsible for compliance could void the user’s authority to operate the
equipment.
Note This equipment has been tested and found to comply with the limits
for a Class A digital device, pursuant to Part 15 of the FCC Rules. These
limits are designed to provide reasonable protection against harmful
interference when the equipment is operated in a commercial environment.
This equipment generates, uses, and can radiate radio frequency energy
and, if not installed and used in accordance with the instruction manual,
may cause harmful interference to radio communications. Operation of this
equipment in a residential area is likely to cause harmful interference in
which case the user will be required to correct the interference at his own
expense. ▲
The following symbol and description identify the WEEE marking used on
the instrument and in the associated documentation.
Symbol Description
here to Get Help
Marking of electrical and electronic equipment which applies to electrical and
electronic equipment falling under the Directive 2002/96/EC (WEEE) and the
equipment that has been put on the market after 13 August 2005.
▲
Service is available from exclusive distributors worldwide. Contact one of
the phone numbers below for product support and technical information
or visit us on the web at www.thermo.com/aqi.
1-866-282-0430 Toll Free
1-508-520-0430 International
iv Model 42i Instruction Manual Thermo Fisher Scientific
Page 11

Contents
Chapter 1
Chapter 2
Chapter 3
Introduction........................................................................................................ 1-1
Principle of Operation ........................................................................ 1-2
Specifications ...................................................................................... 1-3
Installation .........................................................................................................2-1
Lifting................................................................................................. 2-1
Unpacking and Inspection .................................................................. 2-1
Setup Procedure .................................................................................. 2-3
Connecting External Devices .............................................................. 2-5
Terminal Board PCB Assemblies...................................................... 2-5
I/O Terminal Board...................................................................... 2-5
D/O Terminal Board .................................................................... 2-7
25-Pin Terminal Board ................................................................. 2-8
Startup ................................................................................................ 2-9
Operation ............................................................................................................ 3-1
Display................................................................................................ 3-1
Pushbuttons ........................................................................................ 3-2
Soft Keys.......................................................................................... 3-3
Software Overview .............................................................................. 3-4
Power-Up Screen ............................................................................. 3-6
Run Screen....................................................................................... 3-6
Main Menu...................................................................................... 3-7
Range Menu ....................................................................................... 3-8
Single Range Mode .......................................................................... 3-8
Dual Range Mode............................................................................ 3-9
Auto Range Mode.......................................................................... 3-11
Gas Units....................................................................................... 3-13
NO, NO2, and NO
Ranges........................................................... 3-13
x
Set Custom Ranges ........................................................................ 3-15
Custom Ranges ........................................................................... 3-16
Averaging Time................................................................................. 3-16
Calibration Factors Menu .................................................................3-17
NO and NO
NO, NO2, and NO
Backgrounds............................................................ 3-18
x
Coefficients ................................................... 3-19
x
Calibration Pressure ....................................................................... 3-20
Reset User Calibration Default....................................................... 3-20
Calibration Menu ............................................................................. 3-21
Calibrate NO and NO
Backgrounds............................................. 3-22
x
Thermo Fisher Scientific Model 42i Instruction Manual v
Page 12

Contents
Calibrate NO, NO2, and NO
Coefficients.................................... 3-22
x
Calibrate Pressure........................................................................... 3-23
Zero/Span Check ........................................................................... 3-23
Next Time .................................................................................. 3-24
Period Hours............................................................................... 3-24
Zero/Span/Purge Duration Minutes ........................................... 3-25
Zero/Span Averaging Time ......................................................... 3-25
Zero/Span Ratio.......................................................................... 3-26
Instrument Controls Menu ............................................................... 3-26
Ozonator........................................................................................ 3-26
PMT Supply .................................................................................. 3-27
Auto/Manual Mode ....................................................................... 3-27
Datalogging Settings ...................................................................... 3-28
Select SREC/LREC..................................................................... 3-28
View Logged Data....................................................................... 3-29
Number of Records..................................................................... 3-29
Date and Time............................................................................ 3-30
Erase Log .................................................................................... 3-30
Select Content............................................................................. 3-31
Choose Item Type....................................................................... 3-31
Concentrations............................................................................ 3-32
Other Measurements................................................................... 3-32
Analog Inputs.............................................................................. 3-33
Commit Content ........................................................................ 3-33
Reset to Default Content ............................................................ 3-34
Configure Datalogging................................................................ 3-34
Logging Period Min.................................................................... 3-35
Memory Allocation Percent......................................................... 3-35
Data Treatment .......................................................................... 3-35
Communication Settings................................................................ 3-36
Baud Rate ................................................................................... 3-36
Instrument ID............................................................................. 3-37
Communication Protocol............................................................ 3-37
Streaming Data Configuration .................................................... 3-37
Streaming Data Interval .............................................................. 3-38
Choose Item Signal ..................................................................... 3-39
Concentrations............................................................................ 3-39
Other Measurements................................................................... 3-39
Analog Inputs.............................................................................. 3-40
RS-232/RS-485 Selection............................................................ 3-40
TCP/IP Settings.......................................................................... 3-41
Use DHCP ................................................................................. 3-41
IP Address................................................................................... 3-42
Netmask...................................................................................... 3-42
Default Gateway ......................................................................... 3-43
Host Name ................................................................................. 3-43
vi Model 42i Instruction Manual Thermo Fisher Scientific
Page 13

Contents
I/O Configuration.......................................................................... 3-43
Output Relay Settings ................................................................. 3-44
Logic State .................................................................................. 3-44
Instrument State ......................................................................... 3-44
Alarms......................................................................................... 3-45
Non-Alarm ................................................................................. 3-46
Digital Input Settings.................................................................. 3-46
Logic State .................................................................................. 3-46
Instrument Action....................................................................... 3-47
Analog Output Configuration..................................................... 3-47
Select Output Range ................................................................... 3-48
Minimum and Maximum Value ................................................. 3-48
Choose Signal to Output ............................................................ 3-50
Analog Input Configuration........................................................ 3-51
Descriptor ................................................................................... 3-52
Units........................................................................................... 3-52
Decimal Places ............................................................................ 3-53
Number of Table Points.............................................................. 3-53
Table Point ................................................................................. 3-53
Volts ........................................................................................... 3-54
User Value .................................................................................. 3-54
Temperature Compensation........................................................... 3-55
Pressure Compensation .................................................................. 3-55
Screen Contrast.............................................................................. 3-56
Service Mode ................................................................................. 3-56
Date/Time ..................................................................................... 3-57
Diagnostics Menu ............................................................................. 3-57
Program Version ............................................................................ 3-58
Voltages ......................................................................................... 3-58
Motherboard Voltages................................................................. 3-58
Interface Board Voltages ............................................................. 3-59
I/O Board Voltages ..................................................................... 3-59
Temperatures ................................................................................. 3-59
Pressure.......................................................................................... 3-60
Flow............................................................................................... 3-60
Analog Input Readings................................................................... 3-61
Analog Input Voltages.................................................................... 3-61
Digital Inputs................................................................................. 3-61
Relay States .................................................................................... 3-62
Test Analog Outputs...................................................................... 3-62
Set Analog Outputs..................................................................... 3-62
Instrument Configuration.............................................................. 3-63
Contact Information ...................................................................... 3-63
Alarms Menu .................................................................................... 3-64
Internal Temperature ..................................................................... 3-64
Min and Max Internal Temperature Limits................................. 3-65
Thermo Fisher Scientific Model 42i Instruction Manual vii
Page 14

Contents
Chamber Temperature................................................................... 3-65
Min and Max Chamber Temperature Limits .............................. 3-66
Cooler Temperature....................................................................... 3-66
Min and Max Cooler Temperature Limits .................................. 3-67
Converter Temperature.................................................................. 3-67
Min and Max Converter Temperature Limits ............................. 3-67
Permeation Oven Gas Temperature ............................................... 3-68
Min and Max Permeation Oven Temperature Limits.................. 3-68
Pressure.......................................................................................... 3-69
Min and Max Pressure Limits ..................................................... 3-69
Flow............................................................................................... 3-69
Min and Max Flow Limits .......................................................... 3-70
Ozonator Flow............................................................................... 3-70
Zero and Span Check..................................................................... 3-71
Max Zero and Span Offset .......................................................... 3-71
Zero and Span Auto Calibration ....................................................3-71
NO, NO2, and NO
Min and Max NO, NO2, and NO
Concentration ............................................... 3-72
x
Concentration Limits........... 3-72
x
Min Trigger ................................................................................ 3-73
Service Menu .................................................................................... 3-73
PMT Voltage Adjustment .............................................................. 3-74
Range Mode Select......................................................................... 3-74
Converter Set Temperature ............................................................ 3-75
Pressure Calibration ....................................................................... 3-75
Calibrate Pressure Zero ............................................................... 3-76
Calibrate Pressure Span............................................................... 3-76
Restore Default Pressure Calibration........................................... 3-77
Flow Calibration ............................................................................ 3-77
Calibrate Flow Zero .................................................................... 3-78
Calibrate Flow Span.................................................................... 3-78
Restore Default Flow Calibration................................................ 3-79
Input Board Calibration................................................................. 3-79
Manual Input Calibration ........................................................... 3-79
Automatic Input Calibration....................................................... 3-80
Input Frequency Display............................................................. 3-81
Temperature Calibration................................................................ 3-81
Analog Output Calibration ............................................................ 3-82
Analog Output Calibrate Zero .................................................... 3-83
Analog Output Calibrate Full-Scale ............................................ 3-83
Analog Input Calibration ............................................................... 3-83
Analog Input Calibrate Zero ....................................................... 3-84
Analog Input Calibrate Full-Scale ............................................... 3-84
Permeation Oven Settings.............................................................. 3-85
Calibrate Gas Thermistor............................................................ 3-85
Water Bath.................................................................................. 3-86
Resistor ....................................................................................... 3-86
viii Model 42i Instruction Manual Thermo Fisher Scientific
Page 15

Contents
Calibrate Oven Thermistor ......................................................... 3-86
Permeation Oven Selection ......................................................... 3-87
Factory Calibrate Gas Thermistor ............................................... 3-87
Low and High Points .................................................................. 3-87
Set Defaults................................................................................. 3-88
Factory Calibrate Oven Thermistor............................................. 3-88
Low and High Points .................................................................. 3-89
Set Defaults................................................................................. 3-89
Ozonator Safety ............................................................................. 3-89
Dilution Ratio................................................................................ 3-90
Display Pixel Test .......................................................................... 3-90
Restore User Defaults..................................................................... 3-91
Password Menu................................................................................. 3-91
Set Password .................................................................................. 3-92
Lock Instrument ............................................................................... 3-92
Change Password .............................................................................. 3-92
Remove Password.............................................................................. 3-93
Unlock Instrument............................................................................ 3-93
Chapter 4
Calibration.......................................................................................................... 4-1
Equipment Required........................................................................... 4-1
Zero Gas Generator.......................................................................... 4-2
Compression ................................................................................. 4-2
Drying .......................................................................................... 4-2
Oxidation...................................................................................... 4-2
Scrubbing...................................................................................... 4-2
Gas Phase Titrator............................................................................ 4-3
Flow Controllers ...........................................................................4-3
Pressure Regulator......................................................................... 4-3
Ozone Generator .......................................................................... 4-4
Diverter Valve............................................................................... 4-4
Reaction Chamber ........................................................................ 4-4
Mixing Chamber........................................................................... 4-4
Output Manifold .......................................................................... 4-4
Reagents........................................................................................... 4-4
NO Concentration Standard......................................................... 4-4
Assaying a Working NO Standard Against a NIST-traceable NO
Standard........................................................................................ 4-5
Zero Air ........................................................................................ 4-6
Dynamic Parameter Specifications for Gas Titrator.......................... 4-6
Determining GPT System Flow Conditions ................................. 4-6
Pre-Calibration ................................................................................... 4-8
Calibration.......................................................................................... 4-9
Connect GPT Apparatus to the Analyzer ....................................... 4-10
Adjust Instrument Gain .................................................................4-10
Set NO and NO
Background to Zero........................................ 4-10
x
Thermo Fisher Scientific Model 42i Instruction Manual ix
Page 16

Contents
Calibrate the NO Channel to the NO Calibration Gas............... 4-12
Calibrate the NOx Channel to the NO
Preparing NO, NOx, and NO
Calibration Curves ..................... 4-13
2
Alternative Calibration Procedure Using NO
Calibration Gas............. 4-12
x
Permeation Tube.... 4-16
2
Calibration in Dual Range and Auto Range Mode............................ 4-16
Set NO and NO
Background Readings to Zero............................ 4-16
x
Calibrate Low NO ......................................................................... 4-17
Calibrate Low NO
Calibrate Low NO
........................................................................ 4-18
x
........................................................................ 4-18
2
Calibrate High NO........................................................................ 4-19
Calibrate High NO
Calibrate High NO
....................................................................... 4-19
x
....................................................................... 4-20
2
Zero and Span Check........................................................................ 4-21
Chapter 5
Chapter 6
Chapter 7
Preventive Maintenance .................................................................................5-1
Safety Precautions ............................................................................... 5-1
Replacement Parts............................................................................... 5-2
Cleaning the Outside Case.................................................................. 5-2
Ozonator Air Feed Drying Column Replacement ............................... 5-2
Capillaries Inspection and Replacement .............................................. 5-2
Thermoelectric Cooler Fins Inspection and Cleaning.......................... 5-4
Fan Filters Inspection and Cleaning .................................................... 5-4
Pump Rebuilding................................................................................ 5-5
Troubleshooting.................................................................................................6-1
Safety Precautions ............................................................................... 6-1
Troubleshooting Guides...................................................................... 6-1
Board-Level Connection Diagrams ..................................................... 6-6
Connector Pin Descriptions................................................................ 6-8
Service Locations............................................................................... 6-21
Servicing.............................................................................................................7-1
Safety Precautions ............................................................................... 7-2
Firmware Updates............................................................................... 7-4
Accessing the Service Mode................................................................. 7-4
Replacement Parts List ........................................................................ 7-4
Cable List............................................................................................ 7-6
External Device Connection Components .......................................... 7-6
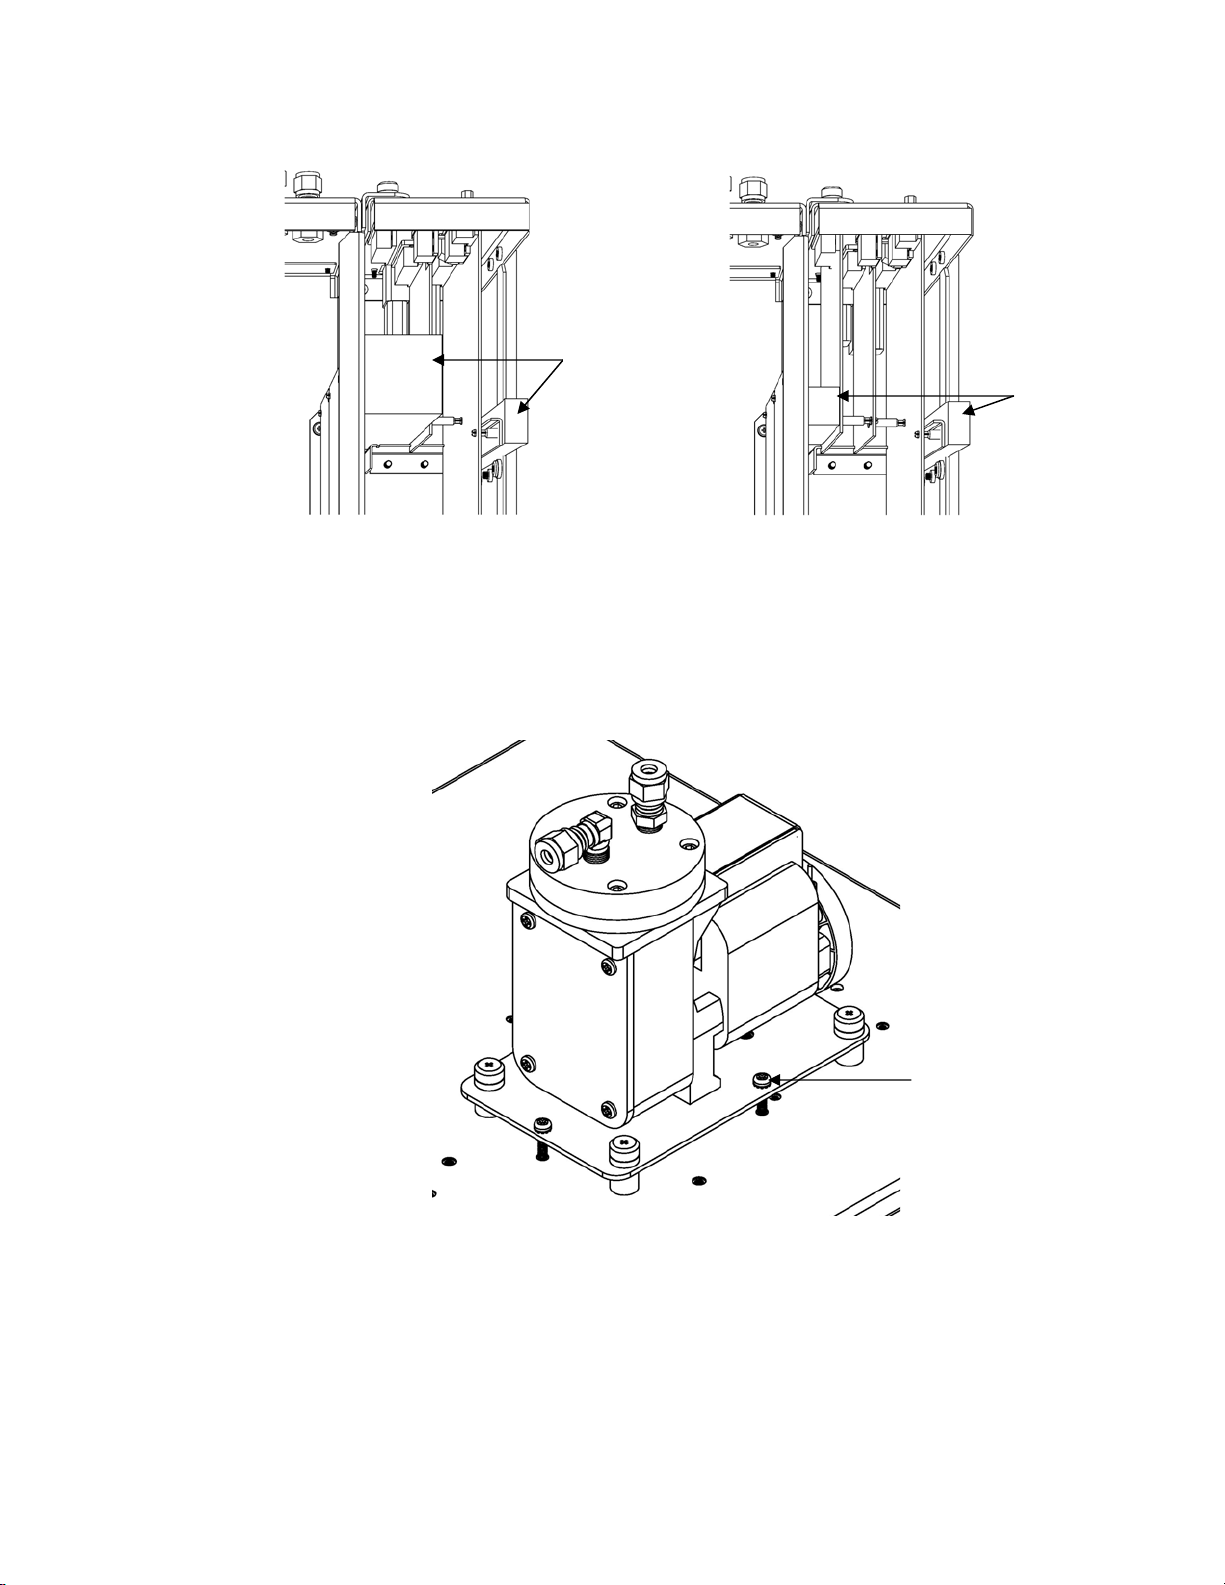
Removing the Measurement Bench and Lowering the Partition Panel 7-8
Pump Replacement ............................................................................. 7-9
Fan Replacement............................................................................... 7-10
PMT Cooler and Reaction Chamber Assembly Replacement............ 7-11
Photomultiplier Tube Replacement .................................................. 7-13
PMT High Voltage Power Supply Replacement................................ 7-14
PMT Voltage Adjustment ................................................................. 7-16
x Model 42i Instruction Manual Thermo Fisher Scientific
Page 17

Contents
Reaction Chamber Cleaning or Removal .......................................... 7-17
NO
-to-NO Converter Replacement ................................................ 7-18
2
Solenoid Valve Replacement ............................................................. 7-20
Ozonator Assembly Replacement ...................................................... 7-21
Ozonator Transformer Replacement ................................................. 7-23
Input Board Replacement ................................................................. 7-23
Input Board Calibration.................................................................... 7-25
DC Power Supply Replacement ........................................................ 7-25
Analog Output Testing ..................................................................... 7-26
Analog Output Calibration ............................................................... 7-29
Analog Input Calibration .................................................................. 7-30
Calibrating the Input Channels to Zero Volts ................................ 7-30
Calibrating the Input Channels to Full-Scale ................................. 7-30
Pressure Transducer Assembly Replacement...................................... 7-31
Pressure Transducer Calibration........................................................ 7-32
Temperature Control Board Replacement......................................... 7-34
Ambient Temperature Calibration .................................................... 7-35
Fuse Replacement ............................................................................. 7-36
Scrubber Replacement....................................................................... 7-36
I/O Expansion Board (Optional) Replacement ................................. 7-37
Digital Output Board Replacement................................................... 7-39
Motherboard Replacement................................................................ 7-39
Measurement Interface Board Replacement ...................................... 7-40
Flow Transducer Replacement .......................................................... 7-41
Flow Transducer Calibration............................................................. 7-42
Front Panel Board Replacement........................................................ 7-44
LCD Module Replacement ............................................................... 7-45
Service Locations............................................................................... 7-46
Chapter 8
System Description ..........................................................................................8-1
Hardware ............................................................................................ 8-1
-to-NO Converter ....................................................................... 8-2
NO
2
Mode Solenoid................................................................................. 8-2
Reaction Chamber .............................................................................. 8-2
Optical Filter.................................................................................... 8-3
Pressure Transducer ......................................................................... 8-3
Sample Flow Sensor ......................................................................... 8-3
Ozonator............................................................................................. 8-3
Ozonator Flow Switch ..................................................................... 8-3
Photomultiplier Tube ......................................................................... 8-3
Photomultiplier Tube Cooler.............................................................. 8-3
Pump .................................................................................................. 8-3
Sample Capillary .............................................................................. 8-3
Dry Air Capillary ............................................................................. 8-4
Software .............................................................................................. 8-4
Instrument Control.......................................................................... 8-4
Thermo Fisher Scientific Model 42i Instruction Manual xi
Page 18

Contents
Monitoring Signals........................................................................... 8-4
Measurement Calculations ............................................................... 8-5
Output Communication .................................................................. 8-5
Electronics .......................................................................................... 8-6
Motherboard.................................................................................... 8-6
External Connectors...................................................................... 8-6
Internal Connectors ...................................................................... 8-6
Measurement Interface Board .......................................................... 8-7
Measurement Interface Board Connectors..................................... 8-7
Flow Sensor Assembly ...................................................................... 8-7
Pressure Sensor Assembly ................................................................. 8-7
Temperature Control Board............................................................. 8-7
PMT Power Supply Assembly.......................................................... 8-8
Input Board Assembly...................................................................... 8-8
Digital Output Board....................................................................... 8-8
I/O Expansion Board (Optional) ..................................................... 8-8
Front Panel Connector Board .......................................................... 8-9
I/O Components................................................................................. 8-9
Analog Voltage Outputs................................................................... 8-9
Analog Current Outputs (Optional) .............................................. 8-10
Analog Voltage Inputs (Optional) .................................................. 8-10
Digital Relay Outputs .................................................................... 8-10
Digital Inputs................................................................................. 8-10
Serial Ports ..................................................................................... 8-11
RS-232 Connection ....................................................................... 8-11
RS-485 Connection ....................................................................... 8-12
Ethernet Connection...................................................................... 8-12
External Accessory Connector ........................................................ 8-12
Chapter 9
Optional Equipment...........................................................................................9-1
Internal Zero/Span and Sample Valves................................................ 9-1
Internal Permeation Span Source ........................................................ 9-2
Permeation Tube Installation ........................................................... 9-3
Computation of Concentrations ...................................................... 9-4
Oven Installation and Configuration................................................ 9-4
Permeation Tube Oven Calibration ................................................. 9-6
Setting Perm Oven Temperature................................................... 9-6
Setting Temperature with Water Bath........................................... 9-7
Setting Temperature with Known Resistance ................................ 9-8
Determining Permeation Rate by Weight Loss................................. 9-9
Determining Release Rate by Transfer Standard............................... 9-9
Ozonator Permeation Dryer.............................................................. 9-10
Sample Permeation Dryer ................................................................. 9-10
Lag Volume ...................................................................................... 9-10
Principle of Operation ................................................................... 9-10
Lag Volume Test............................................................................ 9-12
xii Model 42i Instruction Manual Thermo Fisher Scientific
Page 19

Contents
Ammonia Scrubber ........................................................................... 9-12
Teflon Particulate Filter .................................................................... 9-12
Ozone Particulate Filter .................................................................... 9-13
NO
-to-NO Converter ..................................................................... 9-13
2
I/O Expansion Board Assembly......................................................... 9-13
Terminal Block and Cable Kits ......................................................... 9-13
Cables ............................................................................................... 9-13
Mounting Options............................................................................ 9-15
Appendix A
Appendix B
Warranty ............................................................................................................ A-1
C-Link Protocol Commands............................................................................ B-1
Instrument Identification Number......................................................B-1
Commands .........................................................................................B-2
Commands List................................................................................B-2
Measurements .....................................................................................B-9
Alarms...............................................................................................B-13
Diagnostics .......................................................................................B-17
Datalogging.......................................................................................B-17
Calibration........................................................................................B-25
Keys/Display .....................................................................................B-29
Measurement Configuration .............................................................B-31
Hardware Configuration ...................................................................B-35
Communications Configuration .......................................................B-39
I/O Configuration.............................................................................B-42
Record Layout Definition .................................................................B-47
Format Specifier for ASCII Responses............................................B-48
Format Specifier for Binary Responses ...........................................B-48
Format Specifier for EREC Layout.................................................B-49
Text ............................................................................................B-49
Value String ................................................................................B-49
Value Source ...............................................................................B-49
Alarm Information......................................................................B-50
Translation Table........................................................................B-50
Selection Table............................................................................B-50
Button Designator.......................................................................B-50
Examples.....................................................................................B-51
Appendix C
MODBUS Protocol ............................................................................................C-1
Serial Communication Parameters ..................................................... C-1
TCP Communication Parameters ...................................................... C-2
Application Data Unit Definition ...................................................... C-2
Slave Address................................................................................... C-2
MBAP Header ................................................................................ C-2
Function Code................................................................................ C-3
Thermo Fisher Scientific Model 42i Instruction Manual xiii
Page 20

Contents
Data................................................................................................ C-3
Error Check .................................................................................... C-3
Function Codes.................................................................................. C-3
(0x01/0x02) Read Coils / Read Inputs ............................................ C-3
(0x03/0x04) Read Holding Registers / Read Input Registers........... C-5
(0x05) Force (Write) Single Coil..................................................... C-7
MODBUS Parameters Supported ...................................................... C-8
Appendix D
Geysitech (Bayern-Hessen) Protocol...........................................................D-1
Serial Communication Parameters .....................................................D-1
TCP Communication Parameters ...................................................... D-2
Instrument Address ............................................................................ D-2
Abbreviations Used ............................................................................ D-2
Basic Command Structure ................................................................. D-2
Block Checksum <BCC> ................................................................... D-3
Geysitech Commands ........................................................................D-3
Instrument Control Command (ST)............................................... D-3
Data Sampling/Data Query Command (DA).................................. D-4
Measurements reported in response to DA command .....................D-6
Single Range Mode ...................................................................... D-6
Dual/Auto Range Mode............................................................... D-6
Operating and Error Status ............................................................. D-6
xiv Model 42i Instruction Manual Thermo Fisher Scientific
Page 21

Figures
Figure 1–1. Model 42i Flow Schematic ............................................................. 1-3
Figure 2–1. Remove the Packing Material ......................................................... 2-2
Figure 2–2. Remove the Shipping Screws ......................................................... 2-2
Figure 2–3. Model 42i Rear Panel...................................................................... 2-3
Figure 2–4. Atmospheric Dump Bypass Plumbing ............................................. 2-4
Figure 2–5. I/O Terminal Board Views ............................................................... 2-6
Figure 2–6. D/O Terminal Board Views.............................................................. 2-7
Figure 2–7. 25-Pin Terminal Board Views.......................................................... 2-8
Figure 3–1. Front Panel Display.......................................................................... 3-2
Figure 3–2. Front Panel Pushbuttons.................................................................. 3-2
Figure 3–3. Flowchart of Menu-Driven Software .............................................. 3-5
Figure 3–4. Pin-Out of Rear Panel Connector in Single Range Mode ............... 3-9
Figure 3–5. Pin-Out of Rear Panel Connector in Dual Range Mode................ 3-10
Figure 3–6. Analog Output in Auto Range Mode............................................. 3-11
Figure 3–7. Pin-Out of Rear Connector in Auto Range Mode.......................... 3-12
Figure 4–1. GPT System...................................................................................... 4-3
Figure 5–1. Inspecting and Replacing the Capillaries ....................................... 5-3
Figure 5–2. Inspecting and Cleaning the Fan Filters.......................................... 5-5
Figure 5–3. Rebuilding the Pump........................................................................ 5-7
Figure 6–1. Board-Level Connection Diagram - Common Electronics............... 6-6
Figure 6–2. Board-Level Connection Diagram - Measurement System ............ 6-7
Figure 7–1. Properly Grounded Antistatic Wrist Strap ...................................... 7-4
Figure 7–2. Component Layout........................................................................... 7-7
Figure 7–3. Removing the Measurement Bench and Lowering the Partition
Panel ..................................................................................................................... 7-8
Figure 7–4. Replacing the Pump....................................................................... 7-10
Figure 7–5. Replacing the Fan .......................................................................... 7-11
Figure 7–6. PMT Cooler and Reaction Chamber.............................................. 7-12
Figure 7–7. Replacing the PMT ........................................................................ 7-14
Figure 7–8. Replacing the PMT HVPS .............................................................. 7-15
Figure 7–9. Cleaning or Removing the Reaction Chamber .............................. 7-18
Figure 7–10. NO
Figure 7–11. Replacing the Solenoid Valve ..................................................... 7-21
Figure 7–12. Replacing the Ozonator Assembly .............................................. 7-22
Figure 7–13. Replacing the Input Board........................................................... 7-24
-to-NO Molybdenum Converter Assembly ........................... 7-19
2
Thermo Fisher Scientific Model 42i Instruction Manual xv
Page 22

Figures
Figure 7–14. Replacing the DC Power Supply.................................................. 7-26
Figure 7–15. Rear Panel Analog Input and Output Pins ...................................7-27
Figure 7–16. Replacing the Pressure Transducer............................................. 7-32
Figure 7–17. Replacing the Scrubber................................................................7-37
Figure 7–18. Replacing the I/O Expansion Board (Optional)............................7-38
Figure 7–19. Rear Panel Board Connectors...................................................... 7-38
Figure 7–20. Replacing the Measurement Interface Board............................. 7-41
Figure 7–21. Replacing the Flow Transducer ................................................... 7-42
Figure 7–22. Replacing the Front Panel Board and the LCD Module............... 7-45
Figure 8–1. Hardware Components ....................................................................8-2
Figure 9–1. Flow Diagram, Zero/Span Option.................................................... 9-2
Figure 9–2. Flow Diagram, Internal Permeation with Zero/Span Valve ............9-3
Figure 9–3. Flow Diagram, Lag Volume............................................................9-12
Figure 9–4. Rack Mount Option Assembly ....................................................... 9-15
Figure 9–5. Bench Mounting............................................................................. 9-16
Figure 9–6. EIA Rack Mounting ........................................................................9-17
Figure 9–7. Retrofit Rack Mounting..................................................................9-18
Figure B–1. Flags ..............................................................................................B-13
xvi Model 42i Instruction Manual Thermo Fisher Scientific
Page 23

Tables
Table 1–1. Model 42i Specifications ................................................................. 1-3
Table 1–2. Model 42i Optional Permeation Oven Specifications...................... 1-4
Table 2–1. I/O Terminal Board Pin Descriptions ................................................ 2-6
Table 2–2. D/O Terminal Board Pin Descriptions............................................... 2-7
Table 2–3. 25-Pin Terminal Board Pin Descriptions........................................... 2-8
Table 3–1. Front Panel Pushbuttons................................................................... 3-3
Table 3–2. Default Analog Outputs in Single Range Mode............................... 3-9
Table 3–3. Default Analog Outputs in Dual Range Mode ............................... 3-10
Table 3–4. Default Analog Outputs in Auto Range Mode ............................... 3-12
Table 3–5. Standard Ranges............................................................................. 3-14
Table 3–6. Extended Ranges ............................................................................ 3-15
Table 3–7. Analog Output Zero to Full-Scale Table......................................... 3-49
Table 3–8. Signal Type Group Choices............................................................. 3-51
Table 4–1. Scrubbing Materials ......................................................................... 4-2
Table 6–1. Troubleshooting - General Guide ..................................................... 6-2
Table 6–2. Troubleshooting - Alarm Messages ................................................. 6-4
Table 6–3. Motherboard Connector Pin Descriptions........................................ 6-8
Table 6–4. Measurement Interface Board Connector Pin Descriptions .......... 6-13
Table 6–5. Front Panel Board Connector Pin Diagram..................................... 6-15
Table 6–6. I/O Expansion Board (Optional) Connector Pin Descriptions ......... 6-17
Table 6–7. Digital Output Board Connector Pin Descriptions.......................... 6-18
Table 6–8. Input Board Connector Pin Descriptions ........................................ 6-20
Table 6–9. Temperature Control Board Connector Pin Descriptions............... 6-20
Table 7–1. Model 42i Replacement Parts.......................................................... 7-4
Table 7–2. Model 42i Cables.............................................................................. 7-6
Table 7–3. External Device Connection Components ........................................ 7-6
Table 7–4. Analog Output Channels and Rear Panel Pin Connections............ 7-28
Table 7–5. Analog Input Channels and Rear Panel Pin Connections............... 7-28
Table 8–1. RS-232 DB Connector Pin Configurations ...................................... 8-12
Table 8–2. RS-485 DB Connector Pin Configuration........................................ 8-12
Table 9–1. Cable Options.................................................................................. 9-14
Table 9–2. Color Codes for 25-Pin and 37-Pin Cables ..................................... 9-14
Table 9–3. Mounting Options ........................................................................... 9-15
Table B–1. C-Link Protocol Commands .............................................................. B-2
Table B–2. Averaging Times ............................................................................B-10
Thermo Fisher Scientific Model 42i Instruction Manual xvii
Page 24

Tables
Table B–3. Alarm Trigger Values......................................................................B-17
Table B–4. Record Output Formats...................................................................B-22
Table B–5. Stream Time Values .......................................................................B-25
Table B–6. Standard Ranges ............................................................................B-32
Table B–7. Extended Ranges............................................................................B-32
Table B–8. Contrast Levels...............................................................................B-36
Table B–9. Reply Termination Formats ............................................................B-41
Table B–10. Analog Current Output Range Values..........................................B-43
Table B–11. Analog Voltage Output Range Values .........................................B-44
Table B–12. Default Output Assignment..........................................................B-45
Table C–1. Read Coils for 42i.............................................................................C-8
Table C–2. Read Registers for 42i......................................................................C-9
Table C–3. Write Coils for 42i..........................................................................C-11
Table D–1. Operating Status for Model 42i...................................................... D-7
Table D–2. Error Status for Model 42i .............................................................. D-7
xviii Model 42i Instruction Manual Thermo Fisher Scientific
Page 25

Chapter 1
Introduction
The Model 42i Chemiluminescence NO-NO2-NOx Analyzer combines
proven detection technology, easy to use menu-driven software, and
advanced diagnostics to offer unsurpassed flexibility and reliability. The
Model 42i has the following features:
● 320 x 240 graphics display
● Menu-driven software
● Field programmable ranges
● User-selectable single/dual/auto range modes
● Multiple user-defined analog outputs
● Analog input options
● High sensitivity
● Fast response time
● Linearity through all ranges
● Internal sample pump (except with internal permeation span source
option)
● Independent NO-NO
● Replaceable NO
● User-selectable digital input/output capabilities
● Standard communications features include RS232/485 and Ethernet
● C-Link, MODBUS, Geysitech (Bayern-Hessen), and streaming data
2
-NOx ranges
2
converter cartridge
protocols
For details of the analyzer’s principle of operation and product
specifications, see the following topics:
● “Principle of Operation” on page 1-2
● “Specifications” on page 1-3
Thermo Fisher Scientific Model 42i Instruction Manual 1-1
Page 26

Introduction
ν
Principle of Operation
Thermo Fisher Scientific is pleased to supply this NO-NO2-NOx analyzer.
We are committed to the manufacture of instruments exhibiting high
standards of quality, performance, and workmanship. Service personnel are
available for assistance with any questions or problems that may arise in the
use of this analyzer. For more information on servicing, see Chapter 7,
“Servicing”.
Principle of
Operation
The Model 42i operates on the principle that nitric oxide (NO) and ozone
(O3) react to produce a characteristic luminescence with an intensity
linearly proportional to the NO concentration. Infrared light emission
results when electronically excited NO2 molecules decay to lower energy
states. Specifically:
O + NO
→
NO
h + O +
223
Nitrogen dioxide (NO2) must first be transformed into NO before it can
be measured using the chemiluminescent reaction. NO2 is converted to
NO by a molybdenum NO2-to-NO converter heated to about 325 °C (the
optional stainless steel converter is heated to 625 °C).
The ambient air sample is drawn into the Model 42i through the sample
bulkhead, as shown in Figure 1–1. The sample flows through a capillary,
and then to the mode solenoid valve. The solenoid valve routes the sample
either straight to the reaction chamber (NO mode) or through the NO2-toNO converter and then to the reaction chamber (NOx mode). A flow
sensor to the reaction chamber measures the sample flow.
Dry air enters the Model 42i through the dry air bulkhead, passes through
a flow switch, and then through a silent discharge ozonator. The ozonator
generates the ozone needed for the chemiluminescent reaction. At the
reaction chamber, the ozone reacts with the NO in the sample to produce
excited NO
molecules. A photomultiplier tube (PMT) housed in a
2
thermoelectric cooler detects the luminescence generated during this
reaction. From the reaction chamber, the exhaust travels through the ozone
(O3) converter to the pump, and is released through the vent.
The NO and NOx concentrations calculated in the NO and NOx modes
are stored in memory. The difference between the concentrations is used to
calculate the NO
concentration. The Model 42i outputs NO, NO2, and
2
NOx concentrations to the front panel display, the analog outputs, and also
makes the data available over the serial or Ethernet connection.
1-2 Model 42i Instruction Manual Thermo Fisher Scientific
Page 27
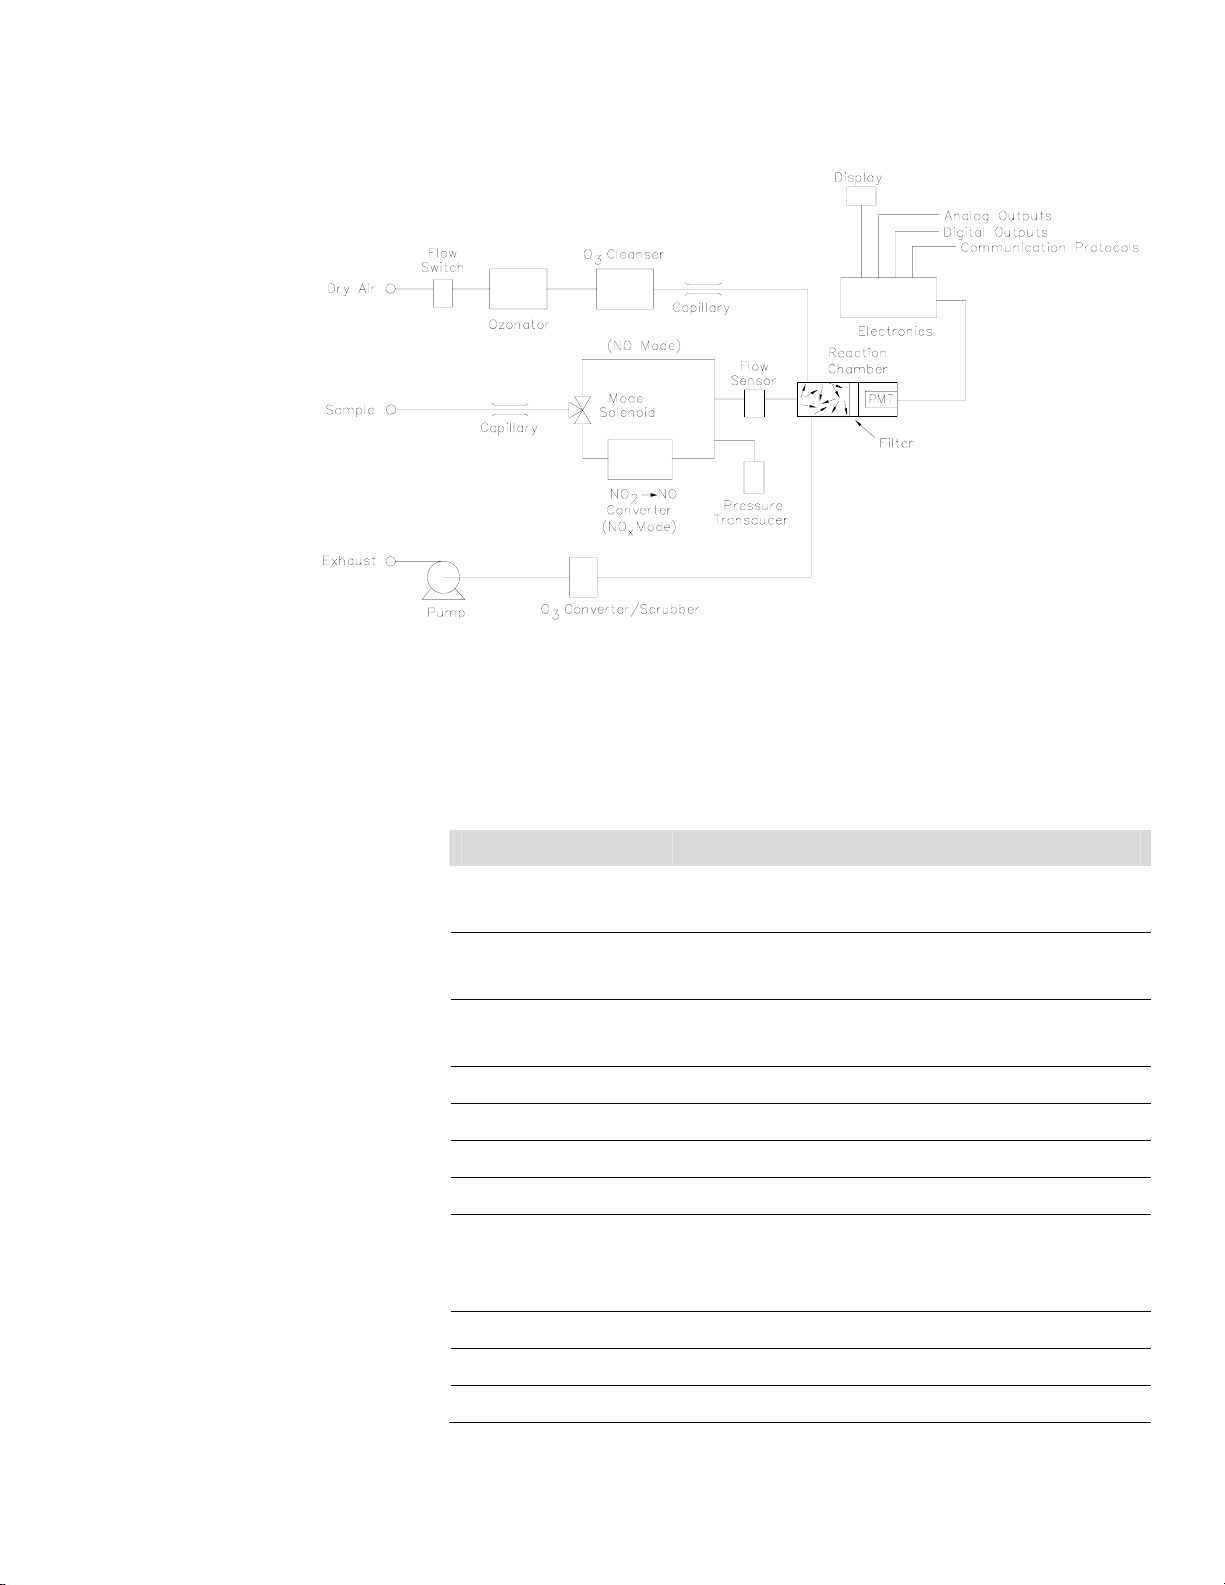
Figure 1–1. Model 42i Flow Schematic
Introduction
Specifications
Specifications
Table 1–1 lists the specifications for the Model 42i.
Table 1–1. Model 42i Specifications
Preset ranges 0-0.05, 0.1, 0.2, 0.5, 1, 2, 5, 10, 20 ppm
0-0.1, 0.2, 0.5, 1, 2, 5, 10, 20, 30 mg/m
Extended ranges 0-0.2, 0.5, 1, 2, 5, 10, 20, 50, 100 ppm
0-0.5, 1, 2, 5, 10, 20, 50, 100, 150 mg/m
Custom ranges 0-0.05 to 20 ppm (0-0.2 to 100 ppm in extended ranges)
0-0.1 to 30 mg/m
Zero roise 0.20 ppb RMS (60 second averaging time)
Lower detectable limit 0.40 ppb (60 second averaging time)
Zero drift (24 hour) < 0.40 ppb
Span drift ±1% full-scale
Response time (in
automatic mode)
Linearity ±1% full-scale
40 seconds (10 second averaging time)
80 seconds (60 second averaging time)
300 seconds (300 second averaging time)
3
(0-0.5 to 150 mg/m3 in extended ranges)
3
3
Sample flow rate 0.6–0.8 LPM
Operating temperature 15–35 °C (may be safely operated over the 0–45 °C)*
Thermo Fisher Scientific Model 42i Instruction Manual 1-3
Page 28

Introduction
Specifications
Power requirements
Physical dimensions 16.75” (W) X 8.62” (H) X 23” (D)
Weight Approximately 55 lbs.
Analog outputs 6 voltage outputs; 0–100 mV, 1, 5, 10 V (User selectable), 5% of
Digital outputs 1 power fail relay Form C, 10 digital relays Form A, user
Digital inputs 16 digital inputs, user select programmable, TTL level, pulled
Serial Ports 1 RS-232 or RS-485 with two connectors, baud rate 1200–
Ethernet connection RJ45 connector for 10Mbs Ethernet connection, static or
*In non-condensing environments. Performance specifications based on operation in 15–35 °C range.
100 VAC @ 50/60 Hz
115 VAC @ 50/60 Hz
220–240 VAC @ 50/60 Hz
300 watts
full-scale over/under range, 12 bit resolution, user
programmable
selectable alarm output, relay logic, 100 mA @ 200 VDC
high
115200, Protocols: C-Link, MODBUS, Geysitech (Bayern-Hessen),
and streaming data (all user selectable)
dynamic TCP/IP addressing
Table 1–2. Model 42i Optional Permeation Oven Specifications
Temperature control Single Point 45
Temperature stability ±0.1
Warm-up time 1 hour (permeation device can take 24 to 48 hours to stabilize)
Carrier gas flow ≈ 70 scc/min
Chamber size Accepts permeation tubes up to 9 cm in total length; 1 cm in
Temperature range 15–30 °C
Power requirements 120 VAC @ 50/60 Hz, 50 watts (in addition to the standard
Weight Approximately 5 lbs. (in addition to the standard Model 42i)
°C
diameter
Model 42i)
°C
1-4 Model 42i Instruction Manual Thermo Fisher Scientific
Page 29

Chapter 2
Installation
Installing the Model 42i includes the following recommendations and
procedures:
● “Lifting” on page 2-1
● “Unpacking and Inspection” on page 2-1
● “Setup Procedure” on page 2-3
● “Connecting External Devices” on page 2-5
● “Startup” on page 2-9
Lifting
Unpacking and
Inspection
When lifting the instrument, use procedure appropriate to lifting a heavy
object, such as, bending at the knees while keeping your back straight and
upright. Grasp the instrument at the bottom in the front and at the rear of
the unit. Although one person can lift the unit, it is desirable to have two
persons lifting, one by grasping the bottom in the front and the other by
grasping the bottom in the rear.
Equipment Damage Do not attempt to lift the instrument by the cover or
other external fittings. ▲
The Model 42i is shipped complete in one container. If there is obvious
damage to the shipping container when you receive the instrument, notify
the carrier immediately and hold for inspection. The carrier is responsible
for any damage incurred during shipment.
Use the following procedure to unpack and inspect the instrument.
1. Remove the instrument from its shipping container and set it on a table
or bench that allows easy access to both the front and rear.
2. Remove the cover to expose the internal components.
3. Remove the packing material (Figure 2–1).
Thermo Fisher Scientific Model 42i Instruction Manual 2-1
Page 30
Installation
Unpacking and Inspection
Remove Packing
(2 pieces)
Remove Packing
(2 pieces)
Units without Optional I/O Board Units with Optional I/O Board
Figure 2–1. Remove the Packing Material
4. Remove the three shipping screws (Figure ).
Shipping Screws (3)
Figure 2–2. Remove the Shipping Screws
5. Check for possible damage during shipment.
6. Check that all connectors and circuit boards are firmly attached.
2-2 Model 42i Instruction Manual Thermo Fisher Scientific
Page 31

Setup Procedure
7. Re-install the cover.
8. Remove any protective plastic material from the case exterior.
Installation
Setup Procedure
Use the following procedure to setup the instrument:
1. Connect the sample line to the SAMPLE bulkhead on the rear panel
(Figure 2–3). Ensure that the sample line is not contaminated by dirty,
wet, or incompatible materials. All tubing should be constructed of
FEP Teflon®, 316 stainless steel, borosilicate glass, or similar tubing
with an OD of 1/4-inch and a minimum ID of 1/8-inch. The length of
the tubing should be less than 10 feet.
Figure 2–3. Model 42i Rear Panel
Note Gas must be delivered to the instrument free of particulates. It may
be necessary to use the Teflon particulate filter as described in “Teflon
Particulate Filter” on page 9-12.
▲
Note Gas must be delivered to the instrument at atmospheric pressure. It
may be necessary to use an atmospheric bypass plumbing arrangement as
shown in Figure 2–4 if gas pressure is greater than atmospheric pressure.
Thermo Fisher Scientific Model 42i Instruction Manual 2-3
▲
Page 32

Installation
Setup Procedure
SAMPLE
Instrument Bulkhead
Vent to Exhaust Line at
Atmospheric Pressure
Input Gas Line
Figure 2–4. Atmospheric Dump Bypass Plumbing
2. Connect the air dryer to the DRY AIR bulkhead.
3. Connect the EXHAUST bulkhead to a suitable vent or ozone scrubber.
The exhaust line should be 1/4-inch OD with a minimum ID of 1/8inch. The length of the exhaust line should be less than 10 feet. Verify
that there is no restriction in this line.
4. Connect a suitable recording device to the rear panel connector. For
detailed information about connecting to the instrument, refer to:
“Connecting External Devices” on page 2-5
“External Device Connection Components” on page 7-6
“Terminal Block and Cable Kits” on page 9-13
“Instrument Controls Menu” on page 3-26
For detailed information about troubleshooting a connection, refer to
“Analog Output Testing” on page 7-26.
5. Plug the instrument into an outlet of the appropriate voltage and
frequency.
WARNING The Model 42i is supplied with a three-wire grounding cord.
Under no circumstances should this grounding system be defeated. ▲
2-4 Model 42i Instruction Manual Thermo Fisher Scientific
Page 33

Installation
Connecting External Devices
Connecting
External Devices
Terminal Board PCB
Assemblies
Several components are available for connecting external devices to iSeries
instruments.
These connection options include:
● Individual terminal board PCB assemblies
● Terminal block and cable kits (optional)
● Individual cables (optional)
For detailed information on the optional connection components, refer to
the “Optional Equipment” chapter. For associated part numbers, refer to
“External Device Connection Components” on page 7-6.
The following terminal board PCB assemblies are available for iSeries
instruments:
● I/O terminal board PCB assembly, 37 pin (standard)
● D/O terminal board PCB assembly, 37 pin (standard)
● 25-pin terminal board PCB assembly, (included with optional I/O
Expansion Board)
I/O Terminal Board
Figure 2–5 shows the recommended method for attaching the cable to the
terminal board using the included tie-down and spacer. Table 2–1
identifies the connector pins and associated signals.
Note All of the I/O available in the instrument are not brought out on this
terminal board, if more I/O is desired, an alternative means of connection
is required.
▲
Thermo Fisher Scientific Model 42i Instruction Manual 2-5
Page 34

Installation
Connecting External Devices
See Detail “A”
See Detail “B”
Component Side Viewed from Top of Board
Assembled Connector
Figure 2–5. I/O Terminal Board Views
Table 2–1. I/O Terminal Board Pin Descriptions
Pin Signal Description Pin Signal Description
1 Analog1 13 Power_Fail_NC
2 Analog ground 14 Power_Fail_COM
3 Analog2 15 Power_Fail_NO
4 Analog ground 16 TTL_Input1
Detail “A”
Detail “B”
5 Analog3 17 TTL_Input2
6 Analog ground 18 TTL_Input3
7 Analog4 19 TTL_Input4
8 Analog ground 20 Digital ground
9 Analog5 21 TTL_Input5
10 Analog ground 22 TTL_Input6
11 Analog6 23 TTL_Input7
12 Analog ground 24 Digital ground
2-6 Model 42i Instruction Manual Thermo Fisher Scientific
Page 35

Installation
Connecting External Devices
D/O Terminal Board
See Detail “A”
Component Side Viewed from Top of Board
Figure 2–6 shows the recommended method for attaching the cable to the
terminal board using the included tie-down and spacer. Table 2–2
identifies the connector pins and associated signals.
See Detail “B”
Detail “A” Detail “B”
Assembled Connector
Figure 2–6. D/O Terminal Board Views
Table 2–2. D/O Terminal Board Pin Descriptions
Pin Signal Description Pin Signal Description
1 Relay1_ContactA 13 Relay7_ContactA
2 Relay1_ContactB 14 Relay7_ContactB
3 Relay2_ContactA 15 Relay8_ContactA
4 Relay2_ContactB 16 Relay8_ContactB
5 Relay3_ContactA 17 Relay9_ContactA
6 Relay3_ContactB 18 Relay9_ContactB
7 Relay4_ContactA 19 Relay10_ContactA
8 Relay4_ContactB 20 Relay10_ContactB
9 Relay5_ContactA 21 (not used)
10 Relay5_ContactB 22 +24V
11 Relay6_ContactA 23 (not used)
12 Relay6_ContactB 24 +24V
Thermo Fisher Scientific Model 42i Instruction Manual 2-7
Page 36

Installation
Connecting External Devices
25-Pin Terminal Board
See Detail “A”
Component Side Viewed from Top of Board
The 25-pin terminal board is included with the optional I/O Expansion
Board.
See Detail “B”
Detail “A” Detail “B”
Assembled Connector
Figure 2–7. 25-Pin Terminal Board Views
Table 2–3. 25-Pin Terminal Board Pin Descriptions
Pin Signal Description Pin Signal Description
1 IOut1 13 Analog_In1
2 Isolated ground 14 Analog_In2
3 IOut2 15 Analog_In3
4 Isolated ground 16 GNDD
5 IOut3 17 Analog_In4
6 Isolated ground 18 Analog_In5
7 IOut4 19 Analog_In6
8 Isolated ground 20 GNDD
9 IOut5 21 Analog_In7
10 Isolated ground 22 Analog_In8
11 IOut6 23 GNDD
12 Isolated ground 24 GNDD
2-8 Model 42i Instruction Manual Thermo Fisher Scientific
Page 37

Installation
Startup
Startup
Use the following procedure when starting the instrument.
1. Turn the power ON.
2. Allow 90 minutes for the instrument to stabilize.
Note it is best to turn the ozonator on and let the instrument run
overnight before calibration in order to obtain the most accurate
information. ▲
3. Set instrument parameters such as operating ranges and averaging times
to appropriate settings. For more information about instrument
parameters, see the “Operation” chapter.
4. Before beginning the actual monitoring, perform a multipoint
calibration as described in the “Calibration” chapter.
Thermo Fisher Scientific Model 42i Instruction Manual 2-9
Page 38

Page 39

Chapter 3
Operation
This chapter describes the front panel display, front panel pushbuttons, and
menu-driven software. For details, see the following topics:
● “Display” on page 3-1
● “Pushbuttons” on page 3-2
● “Software Overview” on page 3-4
● “Range Menu” on page 3-8
● “Averaging Time” on page 3-16
Display
● “Calibration Factors Menu” on page 3-17
● “Calibration Menu” on page 3-21
● “Instrument Controls Menu” on page 3-26
● “Diagnostics Menu” on page 3-57
● “Alarms Menu” on page 3-64
● “Service Menu” on page 3-73
● “Password Menu” on page 3-91
The 320 x 240 graphics liquid-crystal display (LCD) shows the sample
concentrations, instrument parameters, instrument controls, help, and error
messages. Some menus contain more items than can be displayed at one
time. For these menus, use
and to move the cursor up and
down to each item.
Thermo Fisher Scientific Model 42i Instruction Manual 3-1
Page 40

Operation
Pushbuttons
Pushbuttons
Figure 3–1. Front Panel Display
CAUTION If the LCD panel breaks, do not to let the liquid crystal contact
your skin or clothes. If the liquid crystal contacts your skin or clothes, wash
it off immediately using soap and water. ▲
The Pushbuttons allow the user to traverse the various screens/menus.
Figure 3–2. Front Panel Pushbuttons
3-2 Model 42i Instruction Manual Thermo Fisher Scientific
Page 41

Table 3–1 lists the front panel pushbuttons and their functions.
Table 3–1. Front Panel Pushbuttons
Key Name Function
= Soft Keys The (soft keys) are used to provide shortcuts that
allow the user to jump to user-selectable menu screens. For
more information on processing soft keys, see “Soft Keys”
below
Operation
Pushbuttons
= Run The
= Menu The is used to display the Main Menu when in the
= Help The is context-sensitive, that is, it provides
= Enter The is used to select a menu item, accept/set/save
= Up, Down
= Left, Right
screen normally displays the NO, NO
concentrations.
Run screen, or back up one level in the menu system. For
more information about the Main Menu, see “Main Menu”
later in this chapter.
additional information about the screen that is being
displayed. Press
current screen or menu. Help messages are displayed using
lower case letters to easily distinguish them from the
operating screens. To exit a help screen, press
return to the Run screen.
The four arrow pushbuttons (
change values and states in specific screens.
a change, and/or toggle on/off functions.
is used to display the Run screen. The Run
, and NOx
2
for a brief explanation about the
to return to the previous screen, or to
, , , and
) move the cursor up, down, left, and right or
or
Soft Keys
The Soft Keys are multi-functional keys that use part of the display to
identify their function at any moment. The function of the soft keys allows
immediate access to the menu structure and most often used menus and
screens. They are located directly underneath the display and as the keys'
functions change this is indicated by user-defined labels in the lower part of
the display, so that the user knows what the keys are to be used for.
To change a soft key, place the menu cursor “>” on the item of the selected
menu or screen you wish to set. Press followed by the selected soft
key within 1 second of pressing the right-arrow key. The edit soft key
prompt will be displayed for configuration for the new label.
Thermo Fisher Scientific Model 42i Instruction Manual 3-3
Page 42

Operation
Software Overview
Note Not all menu items may be assigned to soft keys. If a particular menu
or screen item cannot be assigned, the key assignment screen will not come
up upon entering right-arrow-soft key combinations. All items under the
Service menu (including the menu itself) cannot be assigned soft keys. ▲
EDIT SOFT KEY PROMPT:
CURRENTLY:RANGE
RANGE
ABCDEFGHIJKLMN BKSP
OPQRSTUVWXYZ PAGE
0123456789 ./- SAVE
RANGE AVG DIAGS ALARM
Software
Overview
The Model 42i utilizes the menu-driven software as illustrated by the
flowchart in Figure 3–3. The Power-Up screen, shown at the top of the
flowchart, is displayed each time the instrument is turned on. This screen is
displayed while the instrument is warming up and performing self-checks.
After the warm-up period, the Run screen is automatically displayed. The
Run screen is the normal operating screen. It displays the NO, NO2, and
NOx concentrations, depending on operating mode. From the Run screen,
the Main Menu can be displayed by pressing . The Main Menu
contains a list of submenus. Each submenu contains related instrument
settings. This chapter describes each submenu and screen in detail. Refer to
the appropriate sections for more information.
3-4 Model 42i Instruction Manual Thermo Fisher Scientific
Page 43

Operation
Software Overview
Password
Set Password
Change Password
Unlock Instrument
Lock Instrument
Remove Password
Power−up
Service
Temp Cal
Analog Ou tput Cal
Flow Cal
Conv Temp
Analog Input Readings
Flow
Comm Settings
I/O Config
X
Cal NO Coef
Cal Pressure
Analog Input Cal
Ozonator Safety
Input Bd Cal
Pressure
Extended Ranges
Dilution Ratio
Display Pixel Test
Restore User Defaults
2
Span Check
X
Zero Autocal
Instrumen t Config
Date/Time
Cal Hi NO Coef
X
Span Autocal
NO Conc
NO Conc
NO Conc
MB Status
Int. Bd. Status
I/O Exp. Bd. Status
Contact Info
2
X
X
2
Cal Hi NO Coef
Cal Hi NO Coef
Cal Lo NO Coef
Cal Lo NO Coef
Cal Lo NO Coef
Cal Pressure
Ozonator Flow
Zero Check
Flow
Test Analog Outputs
Analog Input Voltages
Digital Inputs
Relay States
Temp Compensation
Screen Contrast
Service Mode
Pres Compensation
Zero/Span Check
Cal NO Bkg
Cal NO Bkg
Conv Set Temp
PMT Voltage Adj
Range Mode Select
Pressure Cal
Alarms
Alarms Detected
Chamber Temp
Cooler Temp
Internal Temp
Diagnostics
Temps
Voltages
Program Version
Pressure
Screen
Screen
Self Test
Main Menu
Run Screen
Controls
Instrument
Auto/Man Mode
Ozonator
PMT Supply
Datalogging Settings
2
X
Calibration
Cal NO Bkg
Cal NO Bkg
Cal NO Coef
Cal NO Coef
X
2
X
Lo Avg Time
Hi NO Range
NO Bkg
Lo NO Range
X
NO Bkg
2
Hi NO Range
2
Hi NO Coef
Lo NO Range
X
Lo NO Coef
Lo NO Coef
Set Custo m Ranges
Cal Pressure
Lo NO Coef
Reset User Cal Defaults
For Dual or Auto Range Only
Hi NO Coef
Hi NO Coef
2
X
Lo NO Range
Hi NO Range
Calibration
Averaging
Factors
X
2
X
NO Bkg
Cal Pressure
NO Bkg
NO Coef
NO Coef
NO Coef
Reset User Cal Defaults
Time
Avg Time
Range
Gas Units
NO Range
NO Range
Hi Avg Time
X
2
Set Custo m Ranges
Gas Units
NO Range
Figure 3–3. Flowchart of Menu-Driven Software
Thermo Fisher Scientific Model 42i Instruction Manual 3-5
Page 44

Operation
Software Overview
Power-Up Screen
Run Screen
The Power-Up screen is displayed on power up of the Model 42i. The SelfTest is displayed while the internal components are warming up and
diagnostic checks are performed.
Please wait while booting...
The Run screen displays the NO, NO2, and NOx concentrations. The
status bar displays optional zero/span solenoid valves, if installed, time, and
alarm status. The word “SAMPLE” on the bottom left of the display
indicates the analyzer has the span/zero valve option and is in “SAMPLE”
mode. Other modes appear in the same area of the display as “ZERO” or
“SPAN”. For more information about the optional solenoid valves, see
Chapter 9, “Optional Equipment”.
When operating in dual or auto range mode two sets of coefficients are
used to calculate the NO-NO
-NOx “High” and “Low” concentrations.
2
Also, two averaging times are used—one for each range. The title bar
indicates which range concentrations are displayed. The words “LOW
RANGE CONCENTRATION” on the top of the display indicates that
the low concentration is displayed. In dual range mode, pressing the
and
arrows will toggle between high and low concentrations. The
example below shows the Run screen in single range mode.
3-6 Model 42i Instruction Manual Thermo Fisher Scientific
Page 45

Operation
Software Overview
X CONCENTRATION W
NO 62.7 PPB 28.7 PPB
NO2 25.5 PPB
NOx 88.2 PPB 29.2 PPB
SAMPLE 12:34 ALARMx
RANGE AVG DIAGS ALARM
Main Menu
The Main Menu contains a number of submenus. Instrument parameters
and settings can be read and modified within the submenus according to
their function. The concentration appears above the main menu and
submenus in every screen. The SERVICE menu is visible only when the
instrument is in service mode. For more information on the service mode,
see “Service Mode” later in this chapter.
● Use and to move the cursor up and down.
● Press to select a choice.
● Press to return to the Main Menu or to return to the Run
screen.
XXLO WCONCENTRATIONXXLO W
NO 62.7 PPB
NO2 25.5 PPB
NOx 88.2 PPB
xSAMPLE 12:34 ALARMx
MAIN MENU:
>RANGE
AVERAGING TIME
CALIBRATION FACTORS
CALIBRATION
INSTRUMENT CONTROLS
DIAGNOSTICS
ALARMS
RANGE AVG DIAGS ALARM
SERVICE
PASSWORD
ª
Thermo Fisher Scientific Model 42i Instruction Manual 3-7
Page 46

Operation
Range Menu
Range Menu
RANGE:
>GAS UNITS PPB
NO RANGE 50
NO2 RANGE 50
NOx RANGE 50
SET CUSTOM RANGES
RANGE AVG DIAGS ALARM
The Range menu allows the operator to select the gas units, NO-NO2-NOx
ranges, and to set the custom ranges. The screens below show the range
menu in single range mode and dual/auto range modes. The only
difference between the screens are the words “HI” and “LO” to indicate
which range is displayed. For more information about the single, dual and
auto range modes, see “Single Range Mode”, “Dual Range Mode”, and
“Auto Range Mode” below.
● In the Main Menu, choose Range
RANGE:
>GAS UNITS PPB
HI NO RANGE 100
LO NO RANGE 50
HI NO2 RANGE 100
LO NO2 RANGE 50
HI NOx RANGE 100
LO NOx RANGE 50ª
RANGE AVG DIAGS ALARM
SET CUSTOM RANGES
Single Range Mode
In the single range mode, the NO, NO2, and NOx channels each have one
range, one averaging time, and one span coefficient.
By default, the three analog outputs are arranged on the rear panel
connector as shown in Figure 3–4. See Table 3–2 for channels and pin
connections. Single range mode may be selected from the “Range Mode
Select” on page 3-74.
3-8 Model 42i Instruction Manual Thermo Fisher Scientific
Page 47

Figure 3–4. Pin-Out of Rear Panel Connector in Single Range Mode
Operation
Range Menu
Dual Range Mode
Table 3–2. Default Analog Outputs in Single Range Mode
Channel Connector Pin I/O Terminal Pin Description
1 14 1 NO Analog Output
2 33 3 NO
3 15 5 NOx Analog Output
4 34 7 None
5 17 9 None
6 36 11 None
Ground 16, 18, 19, 35, 37 2, 4, 6, 8, 10, 12 Signal Ground
Analog Output
2
Note All channels are user definable. If any customization has been made
to the analog output configuration, the default selections my not apply. ▲
In the dual range mode, there are two independent analog outputs. These
are labeled simply as the “High Range” and the “Low Range”. Each
channel has its own analog output range, averaging time, and span
coefficient.
This enables the sample concentration reading to be sent to the analog
outputs at two different ranges. For example, the low NO analog output
can be set to output concentrations from 0 to 50 ppb and the high NO
analog output set to output concentrations from 0 to 500 ppb.
Thermo Fisher Scientific Model 42i Instruction Manual 3-9
Page 48

Operation
Range Menu
In addition to each channel having two ranges, each channel has two span
coefficients. There are two span coefficients so that each range can be
calibrated separately. This is necessary if the two ranges are not close to one
another. For example, the low NO range is set to 0–50 ppb and the high
NO range is set to 0–20,000 ppb.
By default, in the dual range mode, the analog outputs are arranged on the
rear panel connector as shown in Figure 3–5. See Table 3–3 for channels
and pin connections. Dual range mode may be selected from the “Range
Mode Select” on page 3-74.
Figure 3–5. Pin-Out of Rear Panel Connector in Dual Range Mode
Table 3–3. Default Analog Outputs in Dual Range Mode
Channel Connector Pin I/O Terminal Pin Description
1 14 1 NO High Range
2 33 3 NO Low Range
3 15 5 NO2 High Range
4 34 7 NO2 Low Range
5 17 9 NOx High Range
6 36 11 NOx Low Range
Ground 16, 18, 19, 35, 37 2, 4, 6, 8, 10, 12 Signal Ground
Note All channels are user definable. If any customization has been made
to the analog output configuration, the default selections my not apply. ▲
3-10 Model 42i Instruction Manual Thermo Fisher Scientific
Page 49

Operation
Range Menu
Auto Range Mode
The auto range mode switches the NO, NO2, and NOx analog outputs
between high and low ranges, depending on the NO
concentration level.
x
The high and low ranges are defined in the Range menu.
For example, suppose the low range is set to 50 ppb and the high range is
set to 100 ppb (Figure 3–6). Sample concentrations below 50 ppb are
presented to the low ranges analog outputs and sample concentrations
above 50 ppb are presented to the high ranges analog outputs. When the
low range is active, the status output is at 0 volts. When the high range is
active, the status output is at half of full-scale.
When the high ranges are active, the NOx concentration must drop to 95%
of the low NO
range for the low ranges to become active.
x
In addition to each channel having two ranges, each channel has two span
coefficients. There are two span coefficients so that each range can be
calibrated separately. This is necessary if the two ranges are not close to one
another. For example, the low NO range is set to 0–50 ppb and the high
NO range is set to 0–20,000 ppb.
Figure 3–6. Analog Output in Auto Range Mode
Thermo Fisher Scientific Model 42i Instruction Manual 3-11
Page 50

Operation
Range Menu
By default, in the auto range mode, the analog outputs are arranged on the
rear panel connector as shown in Figure 3–7. See Table 3–4 for channels
and pin connections. Auto range mode may be selected from the “Range
Mode Select” on page 3-74.
Figure 3–7. Pin-Out of Rear Connector in Auto Range Mode
Table 3–4. Default Analog Outputs in Auto Range Mode
Channel Connector Pin I/O Terminal Pin Description
1 14 1 NO Analog Output
2 33 3 NO
3 15 5 NOx Analog Output
4 34 7 Range Status:
5 17 9 None
6 36 11 None
Ground 16, 18, 19, 35, 37 2, 4, 6, 8, 10, 12 Signal Ground
Analog Output
2
half-scale = high range
zero scale = low range
Note All channels are user definable. If any customization has been made
to the analog output configuration, the default selections my not apply.
▲
3-12 Model 42i Instruction Manual Thermo Fisher Scientific
Page 51

Operation
Range Menu
Gas Units
The Gas Units screen defines how the NO, NO2, and NOx concentration
readings are expressed. Gas units of parts per billion (ppb), parts per
million (ppm), micrograms per cubic meter (μg/m3), or milligrams per
cubic meter (mg/m3) are available. The μg/m3 and mg/m3 gas
concentration modes are calculated using a standard pressure of 760
mmHg and a standard temperature of 20 °C.
When switching the selected units from ppb or ppm to μg/m3 or mg/m3,
the analog ranges all default to the highest range in that mode. For
example, when switching from mg/m3 to ppm, all the ranges default to 20
ppm. Therefore, whenever you change units, you should also check the
range settings.
● In the Main Menu, choose Range > Gas Units.
Note If the units change from ppb/ppm to μg/m3/mg/m3or vice versa, the
instrument should be re-calibrated, particularly if the user’s standard
temperature is different from 20 °C. A display warning will appear that
ranges will be defaulted and calibration parameters reset. ▲
NO, NO
, and NOx
2
Ranges
GAS UNITS:
CURRENTLY: PPB
SET TO: UG/M3 ?
AND SET RANGES AND CAL TOX
DEFAULT SETTINGSXXXXXXXXXX
©ª CHANGE VALUE SAVE
RANGE AVG DIAGS ALARM
The NO, NO2, and NOx Ranges screen defines the concentration range of
the analog outputs. For example, a NO
range of 0–50 ppb restricts the
2
NO2 analog output to concentrations between 0 and 50 ppb.
The display shows the current NO, NO2, or NOx range. The next line of
the display is used to change the range. The range screen is similar for the
single, dual, and auto range modes. The only difference between the
screens are the words “High” and “Low” to indicate which range is
displayed. The example below shows the NO range screen in single mode.
For more information about the dual and auto range modes, see “Single
Range Mode”, “Dual Range Mode”, and “Auto Range Mode” earlier in
this chapter.
Thermo Fisher Scientific Model 42i Instruction Manual 3-13
Page 52

Operation
Range Menu
Table 3–5 lists the available operating ranges. Table 3–6 lists the extended
ranges. When switching from standard to extended ranges, the PMT
voltage must be readjusted. For more information about readjusting the
PMT voltage, see Chapter 7, “Servicing”.
● In the Main Menu, choose Range > NO, NO2, or NOx Range.
RANGE:
CURRENTLY: 50
SET TO: 100 ?
©ª CHANGE VALUE
SAVE VALUE
RANGE AVG DIAGS ALARM
Table 3–5. Standard Ranges
ppb ppm μgm3 mgm3
50 0.05 100 0.1
100 0.10 200 0.2
200 0.20 500 0.5
500 0.50 1,000 1.0
1,000 1.00 2,000 2.0
2,000 2.00 5,000 5.0
5,000 5.00 10,000 10.0
10,000 10.00 20,000 20.0
20,000 20.00 30,000 30.0
C1 C1 C1 C1
C2 C2 C2 C2
C3 C3 C3 C3
3-14 Model 42i Instruction Manual Thermo Fisher Scientific
Page 53

Range Menu
Table 3–6. Extended Ranges
ppb ppm μgm3 mgm3
200 0.2 500 0.5
500 0.5 1,000 1
1,000 1 2,000 2
2,000 2 5,000 5
5,000 5 10,000 10
10,000 10 20,000 20
20,000 20 50,000 50
50,000 50 100,000 100
100,000 100 150,000 150
C1 C1 C1 C1
C2 C2 C2 C2
C3 C3 C3 C3
Operation
Set Custom Ranges
C1, C2, and C3 are custom ranges. For more information about custom
ranges, see “Set Custom Ranges” below.
The Set Custom Ranges menu lists three custom ranges: C1, C2, and C3.
Custom ranges are user-defined ranges. In the standard range mode, any
value between 50 ppb (0.05 ppm) and 20,000 ppb (20 ppm) can be
specified as a range. In the μg/m3 (mg/m3) mode, any value between 100
μg/m3 (0.1 mg/m3) and 30,000 μg/m3 (30 mg/m3) can be specified as a
range. In the extended range mode, any value between 200 ppb (0.02 ppm)
and 100,000 ppb (100 ppm) can be specified as a range. In the μg/m3
3
(mg/m
) mode, any value between 500 μg/m3 (0.5 mg/m3) and 150,000
μg/m3 (150 mg/m3) can be specified as a range.
● In the Main Menu, choose Range > Set Custom Ranges.
CUSTOM RANGES:
>CUSTOM RANGE 1 55.6
CUSTOM RANGE 2 75.0
CUSTOM RANGE 3 125.0
RANGE AVG DIAGS ALARM
Thermo Fisher Scientific Model 42i Instruction Manual 3-15
Page 54

Operation
Averaging Time
Custom Ranges
Averaging Time
The Custom Ranges screen is used to define the custom ranges.
The display shows the current custom range. The next line of the display is
used to set the range. To use the custom full-scale range, be sure to select it
(Custom range 1, 2, or 3) in the NO, NO2, or NOx Ranges screen. For
more information about selecting ranges, see “NO, NO2, and NOx
Ranges” above.
● In the Main Menu, choose Range > Set Custom Ranges > Custom
range 1, 2, or 3.
CUSTOM RANGE 1:
CURRENTLY: 55.6
SET TO: 000055.7 ?
§¨ MOVE CURSOR
©ª CHANGE VALUE SAVE
RANGE AVG DIAGS ALARM
The Averaging Time defines a time period (10 to 300 seconds) over which
NO, NO2, and NOx measurements are taken. The average concentration of
the NO, NO2, and NOx readings are calculated for that time period. The
front panel display and analog outputs are updated every 10 seconds for
averaging times between 10 and 300 seconds. An averaging time of 10
seconds, for example, means that the average concentration of the last 10
seconds will be output at each update. An averaging time of 300 seconds
means that the moving average concentration of the last 300 seconds will
be output at each update. Therefore, the lower the averaging time the faster
the front panel display and analog outputs respond to concentration
changes. Longer averaging times are typically used to smooth output data.
The Averaging Time screen for the single range mode is shown below. In
the dual and auto range modes, an Averaging Time Menu is displayed
before the averaging time screens. This additional menu is needed because
the dual and auto range modes have two averaging times (high and low).
The Averaging Time screen functions the same way in the single, dual, and
auto range modes. The following averaging times are available: 10, 20, 30,
60, 90, 120, 180, 240, and 300 seconds. Additional averaging times are
available in NO and NOx modes: 1, 2, and 5 seconds. For more
information about the manual mode, see “Auto/Manual Mode” later in this
chapter.
3-16 Model 42i Instruction Manual Thermo Fisher Scientific
Page 55

● In the Main Menu, choose Averaging Time.
AVERAGING TIME:
CURRENTLY: 30 SEC
SET TO: 10 SEC ?
©ª CHANGE VALUE
SAVE VALUE
RANGE AVG DIAGS ALARM
Operation
Calibration Factors Menu
Calibration Factors
Menu
CALIBRATION FACTORS:
>NO BKG 0.0
NOx BKG 0.0
NO COEF 1.000
NO2 COEF 1.000
NOx COEF 1.000
CAL PRESSURE 150.0 mmHg
RESET USER CAL DEFAULTS ª
RANGE AVG DIAGS ALARM
LO NOx COEF 1.000
Calibration factors are used to correct the NO, NO2, and NOx
concentrations readings that the instrument generates using its own
internal calibration data. The Calibration Factors menu displays the
calibration factors. The screens below show the calibration factors menu in
single mode and dual/auto range modes. The only difference between the
screens are the words “HI” and “LO” to indicate which range is displayed.
Normally, the instrument is calibrated automatically using the Calibration
menu described in “Calibration Menu” later in this chapter. However, the
instrument can also be calibrated manually using the Calibration Factors
menu.
To manually calibrate the instrument, see “NO and NOx Backgrounds”,
“NO, NO2, and NOx Coefficients” and “Calibration Pressure” below for
more information.
● In the Main Menu, choose Calibration Factors.
CALIBRATION FACTORS:
>NO BKG 0.0
NOx BKG 0.0
HI NO COEF 1.000
HI NO2 COEF 1.000
HI NOx COEF 1.000
LO NO COEF 1.000
LO NO2 COEF 1.000ª
RANGE AVG DIAGS ALARM
CAL PRESSURE 150.0 mmHg
RESET USER CAL DEFAULTS
Thermo Fisher Scientific Model 42i Instruction Manual 3-17
Page 56

Operation
Calibration Factors Menu
NO and NOx Backgrounds
The NO and NOx background corrections are determined during zero
calibration. The NO background is the amount of signal read by the
analyzer in the NO channel while sampling zero air. The NOx background
is the amount of signal read by the analyzer in the NOx channel while
sampling zero air. Although the background is expressed in terms of
concentration, the background signal is actually the combination of
electrical offsets, PMT dark currents, and trace substances undergoing
chemiluminescence. Before the analyzer sets the NO and NOx readings to
zero, it stores these values as the NO and NOx background corrections,
respectively. The NO2 background correction is determined from the NO
and NOx background corrections and is not displayed. The background
corrections are typically below 15 ppb.
The NO and NOx Background screens are used to perform a manual zero
calibration of the instrument. Before performing a zero calibration, allow
the analyzer to sample zero air until stable readings are obtained. The NO
channel should be calibrated first. Both the NO and NOx Background
screens operate the same way. Therefore, the following description of the
NO background applies to the NOx background screen as well. The first
line of the display shows the current NO reading. The second line of the
display shows the NO background correction that is stored in memory.
The NO background correction is a value, expressed in the current gas
units, that is subtracted from the NO reading to produce the NO reading
that is displayed.
In the example below, the analyzer is displayed 4.4 ppb of NO while
sampling zero air. A background correction is 0.0 ppb means that 0 ppb is
being subtracted from the NO concentration being displayed. Therefore,
the background correction must be increased to 4.4 ppb in order for the
NO reading to be at 0 ppb, i.e., a NO reading of 4.4 ppb minus a NO
background reading of 4.4 ppb gives the corrected NO reading of 0 ppb.
To set the NO reading in the example below to zero, use
to
increment the NO background correction to 4.4 ppb. As the NO
background correction is increased, the NO concentration is decreased.
Note that at this point, pressing and however, has no affect
on the analog outputs or the stored NO background correction of 0.0 ppb.
A question mark following both the NO reading and the NO background
correction indicates that these are proposed changes as opposed to
implemented changes. To escape this screen without saving any changes,
press to return to the Calibration Factors menu or to return
to the Run screen. Press
to actually set the NO reading to 0 ppb and
store the new background correction of 4.4 ppb. Then the question mark
prompt beside the NO reading disappears.
3-18 Model 42i Instruction Manual Thermo Fisher Scientific
Page 57

Operation
Calibration Factors Menu
● In the Main Menu, choose Calibration Factors > NO or NOx Bkg.
NO BACKGROUND:
NO: 4.4
SET BKG TO: 0.00
©ª INC/DEC
SAVE VALUE
RANGE AVG DIAGS ALARM
NO, NO2, and NOx
Coefficients
The NO, NO2, and NOx span coefficient are usually calculated by the
instrument processor during calibration. The span coefficients are used to
correct the NO, NO2, and NOx readings. The NO and NOx span
coefficients normally has a value near 1.000. The NO2 span coefficient
normally has a value between 0.95 and 1.050.
The NO, NO2, and NOx Coefficient screens allow the NO, NO2, and
NOx span coefficients to be manually changed while sampling span gas of
known concentration. The NO, NO2, and NOx Coefficient screens operate
the same way. Therefore, the following description of the NO coefficient
screen applies to the NO2, and NOx coefficient screens as well.
The display shows the current NO concentration reading. The next line of
the display shows the NO span coefficient that is stored in memory and is
being used to correct the NO concentration. Notice that as the span
coefficient value is changed, the current NO concentration reading on the
above line also changes. However, no real changes are made to the value
stored in memory until is pressed. Only proposed changes, as
indicated by a question mark prompt, are displayed until
is pressed.
In dual or auto range modes, “HIGH” or “LOW” is displayed to indicate
the calibration of the high or low coefficient. The example below shows the
coefficient screen in dual/auto range mode.
Note The concentration value will show “ERROR” if the measured
concentration is not a valid span value (either higher than the selected
range, or 0 or lower). ▲
● In the Main Menu, choose Calibration Factors > NO, NO2, or NOx
Coef.
Thermo Fisher Scientific Model 42i Instruction Manual 3-19
Page 58

Operation
Calibration Factors Menu
NO COEFFICIENT:
NO: 51.4
SET COEF TO: 1.000
©ª INC/DEC
SAVE VALUE
RANGE AVG DIAGS ALARM
Calibration Pressure
The Calibration Pressure screen reports the reactor pressure at which
current calibration was performed. The screen also allows this value to be
edited by the operator. This value should not be changed unless a complete
manual calibration is being performed. The calibration pressure is set equal
to the reactor pressure at the time of calibration. The acceptable range for
calibration pressure is between 150 and 300 mmHg.
Note Turning the pressure compensation ON and OFF can produce
significant artificial jumps in the apparent sample concentration. If the
pressure compensation feature is to be used, the instrument must be
calibrated with the pressure compensation feature ON. For more
information about calibration, see Chapter 4, “Calibration”. ▲
CALIBRATION PRESSURE:
PRESSURE: 232.5
SET CAL PRES TO: 150.0
©ª INC/DEC
SAVE VALUE
RANGE AVG DIAGS ALARM
Reset User Calibration
Default
The Reset User Calibration Default screen allows the user to reset the
calibration configuration values to factory defaults.
● In the Main Menu, choose Service > Calibration Factors > Reset User
Cal Defaults.
3-20 Model 42i Instruction Manual Thermo Fisher Scientific
Page 59

Operation
Calibration Menu
RESTORE DEFAULT CAL:
RESTORE
RANGE AVG DIAGS ALARM
Calibration Menu
RESTORE DEFAULT CAL:
RESTORE
ARE YOU SURE YOU WANT TO?x
PRESS ¨ TO CONFIRM RESTORE
RANGE AVG DIAGS ALARM
The Calibration menu is used to calibrate the analyzer, including zero
backgrounds, the NO, NO2, and NOx coefficients, and the calibration
pressure. The screens below show the calibration menu in single mode and
dual/auto range modes. The zero/span check is visible only if the zero/span
option is installed in single range mode.
The calibration procedure is the same in dual, auto, or single range,
however, there are two sets of gas coefficients in dual or auto range (i.e. low
and high coefficients). This enables each range to be calibrated separately.
When calibrating the instrument in dual or auto range, be sure to use a low
span gas to calibrate the low range and a high span gas to calibrate the high
range.
Whether dual or singe range, the first step in calibrating the instrument is
to assign the calibration pressure. The calibration pressure is used to
account for slight pressure fluctuation brought on by changing weather.
The calibration pressure is set equal to the reactor pressure at the time of
calibration. For more information about calibration, see Chapter 4,
“Calibration”.
● In the Main Menu, choose Calibration.
CALIBRATION:
>CAL NO BACKGROUND
CAL NOx BACKGROUND
CAL NO COEFFICIENT
CAL NO2 COEFFICIENT
CAL NOx COEFFICIENT
CAIBRATE PRESSURE
ZERO/SPAN CHECK ª
RANGE AVG DIAGS ALARM
CAL LO NOx COEFFICIENT
CALIBRATION:
>CAL NO BACKGROUND
CAL NOx BACKGROUND
CAL HI NO COEFFICIENT
CAL HI NO2 COEFFICIENT
CAL HI NOx COEFFICIENT
CAL LO NO COEFFICIENT
CAL LO NO2 COEFFICIENT ª
RANGE AVG DIAGS ALARM
CALIBRATE PRESSURE
Thermo Fisher Scientific Model 42i Instruction Manual 3-21
Page 60

Operation
Calibration Menu
Calibrate NO and NOx
Backgrounds
The Calibrate NO and NOx Background screens are used to adjust the
background, or perform a “zero calibration”. Be sure the analyzer samples
zero air until the readings stabilize. The display shows the current NO or
NOx reading.
It is important to note the averaging time when calibrating. The longer the
averaging time, the more accurate the calibration will be. To be most
accurate, use the 300-second averaging time. For more information about
calibration, see Chapter 4, “Calibration”.
● In the Main Menu, choose Calibration > Calibrate NO or NOx
Background.
NO BACKGROUND:
NO: 1.2
CURRENTLY: 0.00 ?
SET CO TO ZERO
RANGE AVG DIAGS ALARM
Calibrate NO, NO2, and
NOx Coefficients
The Calibrate NO Coefficient screen is used to adjust the NO span
concentration while sampling span gas of known concentration. All
calibration screens operate the same way. Therefore, the following
description of the NO calibration screen applies to the NO2 and NOx
calibration screens as well.
The display shows the current NO concentration reading and the current
NO range. The next line of the display is where the NO calibration gas
concentration is entered.
It is important to note the averaging time when calibrating. The longer the
averaging time, the more accurate the calibration will be. To be most
accurate, use the 300-second averaging time. For more information about
calibration, see Chapter 4, “Calibration”.
● In the Main Menu, choose Calibration > Cal NO, NO2 or NOx
Coefficient.
3-22 Model 42i Instruction Manual Thermo Fisher Scientific
Page 61

Operation
Calibration Menu
CALIBRATE NO:
NO: 25.5
SPAN CONC: 0001.000 ?
§¨ MOVE CURSOR
©ª CHANGE VALUE SAVE
RANGE AVG DIAGS ALARM
Calibrate Pressure
Zero/Span Check
The Calibrate Pressure screen is used to set the calibration pressure.
The Calibration pressure should be set only when calibrating the
instrument.
● In the Main Menu, choose Calibration > Calibrate Pressure.
CALIBRATE PRESSURE:
CUR CAL PRES: 150.0 mmHg
CURRENT PRES: 232.5 mmHg ?
SAVE CURRENT PRESSURE
AS CAL PRESSURE
RANGE AVG DIAGS ALARM
The Zero/Span Check menu is available with the zero/span valve option
when in NO or NOx measurement modes. It is used to program the
instrument to perform fully automated zero and span checks or
adjustments. Total Duration Hour is the sum of zero, span, and purge
duration minutes. Zero and Span Calibration Reset are toggle items that
change between yes or no when selected, and displayed if auto calibration is
installed.
● In the Main Menu, choose Calibration > Zero/Span Check.
Thermo Fisher Scientific Model 42i Instruction Manual 3-23
Page 62

Operation
Calibration Menu
ZERO/SPAN CHECK:
>NEXT TIME 01Jan05 12:00
PERIOD HR 24
TOTAL DURATION HR 2.5
ZERO DURATION MIN 30
SPAN DURATION MIN 30
PURGE DURATION MIN 30
ZERO/SPAN AVG SEC 60 ª
RANGE AVG DIAGS ALARM
ZERO CAL RESET ON
SPAN CAL RESET OFF
ZERO/SPAN RATIO 1
Next Time
The Next Time screen is used to view and set the next zero/span check date
and time. Once the initial zero/span check is performed, the date and time
of the next zero/span check is calculated and displayed.
● In the Main Menu, choose Calibration > Zero/Span Check > Next
Time.
NEXT DATE AND TIME:
19 MAR 2005 12:34
PRESS § TO EDIT
RANGE AVG DIAGS ALARM
Period Hours
The Zero/Span Period Hours screen defines the period or interval between
zero/span checks. Periods between 0 and 999 hours are acceptable. To turn
the zero/span check off, set the period to 0.
NEXT DATE AND TIME:
19 MAR 2005 12:34:56
SETTING: DAYS
¨ SET MONTHS
©ª CHANGE VALUE
SAVE VALUE
RANGE AVG DIAGS ALARM
● In the Main Menu, choose Calibration > Zero/Span Check > Period
Hours.
ZERO/SPAN PERIOD:
CURRENTLY: 024 HRS
SET TO: 025 HRS ?
§¨ MOVE CURSOR
©ª CHANGE VALUE SAVE
RANGE AVG DIAGS ALARM
3-24 Model 42i Instruction Manual Thermo Fisher Scientific
Page 63

Operation
Calibration Menu
Zero/Span/Purge
Duration Minutes
The Zero Duration Minutes screen defines how long zero air is sampled by
the instrument. The span and purge duration screens look and function the
same way as the zero duration screen, and are used to set how long the span
gas and sample gas are sampled by the instrument. Durations between 0
and 60 minutes are acceptable. Each time a zero/span check occurs the zero
check is done first, followed by the span check. To perform just a zero
check, set the span and purge duration screen to 0 (off). The same applies
to perform just a span or purge check.
● In the Main Menu, choose Calibration > Zero/Span Check > Zero,
Span or Purge Duration Min.
ZERO DURATION:
CURRENTLY: 30 MIN
SET TO: 31 MIN ?
§¨ MOVE CURSOR
©ª CHANGE VALUE SAVE
RANGE AVG DIAGS ALARM
Zero/Span Averaging
Time
The Zero/Span Averaging Time screen allows the user to adjust the
zero/span averaging time. The zero/span averaging time is used by the
analyzer only when performing an automatic zero or span check. The
analyzer’s averaging time is used for all other functions. The following
averaging times are available: 1, 2, 5, 10, 20, 30, 60, 90, 120, 180, 240,
and 300 seconds.
● In the Main Menu, choose Calibration > Zero/Span Check >
Zero/Span Avg Sec.
ZERO/SPAN AVERAGING TIME:
CURRENTLY: 60 SEC
SET TO: 90 SEC ?
©ª CHANGE VALUE
SAVE VALUE
RANGE AVG DIAGS ALARM
Thermo Fisher Scientific Model 42i Instruction Manual 3-25
Page 64

Operation
Instrument Controls Menu
Zero/Span Ratio
Instrument Controls
Menu
The Zero/Span Ratio screen is used to adjust the ratio of zeros to spans. For
example, if this value is set to 1, a span check will follow every zero check.
If this value is set to 3, there will be two zero checks between each
zero/span check. This value may be set from 1 to 10, with 1 as default.
● In the Main Menu, choose Calibration > Zero/Span Check >
Zero/Span Ratio.
ZERO/SPAN RATIO:
CURRENTLY: 1:1
SET TO: 2:1 ?
©ª CHANGE VALUE
SAVE VALUE
RANGE AVG DIAGS ALARM
The Instrument Controls menu contains a number of items. The software
controls listed in this menu enable control of the listed instrument
functions.
Ozonator
● In the Main Menu, choose Instrument Controls.
INSTRUMENT CONTROLS:
>OZONATOR
PMT SUPPLY
AUTO/MANUAL MODE
DATALOGGING SETTINGS
COMMUNICATION SETTINGS
I/O CONFIGURATION
TEMPERATURE COMPENSATIONª
RANGE AVG DIAGS ALARM
PRESSURE COMPENSATION
SCREEN CONTRAST
SERVICE MODE
DATE/TIME
The Ozonator screen is used to turn the internal ozonator on or off. The
display shows the status of the control line that turns the ozonator on or
off. The next line of the display shows the user-specified ozonator setting.
Under most conditions, the control line status and ozonator set status are
the same. However, as a safety precaution, the microprocessor can override
the user-specified ozonator setting. This occurs only if the ozonator flow
3-26 Model 42i Instruction Manual Thermo Fisher Scientific
Page 65

Operation
Instrument Controls Menu
doesn’t indicate any flow or if the NO2 converter temperature is below the
minimum alarm limit. In this case, an alarm is activated and the ozonator is
turned off. This is done to prevent the ozonator from overheating, which
will result in permanent damage to the ozonator, or if the converter
temperature drops below the minimum limit, which reduces the
effectiveness of the ozone destruct.
It is possible, however, to override the ozonator shut-off due to converter
temperature being out of range, by setting the ozonator safety “OFF” in the
“Service Mode”.
Note The ozonator must be “ON” to obtain NO, NO2, and NOx
readings. As an additional safety precaution, a lit LED mounted on the
measurement interface board indicates that the ozonator is on. ▲
● In the Main Menu, choose Instrument Controls > Ozonator.
PMT Supply
OZONATOR:
CURRENTLY: OFF
SET TO: ON ?
TOGGLE VALUE
RANGE AVG DIAGS ALARM
The PMT Supply screen is used to turn the PMT power supply on or off.
This is useful in a troubleshooting situation.
● In the Main Menu, choose Instrument Controls > PMT Supply.
PMT SUPPLY:
CURRENTLY: OFF
SET TO: ON ?
TOGGLE VALUE
RANGE AVG DIAGS ALARM
Auto/Manual Mode
The Auto/Manual Mode screen allows selection of the automatic mode
(NO/NO
), NO mode (manual NO), or NOx mode (manual NOx). The
x
auto cycle mode switches the mode solenoid valve automatically on a 10
Thermo Fisher Scientific Model 42i Instruction Manual 3-27
Page 66

Operation
Instrument Controls Menu
second cycle so that NO, NO2, and NOx concentrations are determined.
The manual NO mode puts the mode solenoid valve into the open position
so that the sample gas bypasses the NO2-to-NO converter. Therefore, only
the NO concentration is determined. The manual NOx mode puts the
mode solenoid valve into the closed position so that the sample gas passes
through the NO2-to-NO converter. Therefore, only the NOx concentration
is determined. In the manual modes, additional averaging times of 1, 2,
and 5 seconds are available from the Averaging Times screen.
● In the Main Menu, choose Instrument Controls > Auto/Manual
Mode.
MODE:
CURRENTLY: MANUAL NO
SET TO: NO/NOX ?
©ª CHANGE VALUE
SAVE VALUE
RANGE AVG DIAGS ALARM
Datalogging Settings
Select SREC/LREC
The Datalogging Settings menu deals with datalogging.
● In the Main Menu, choose Instrument Controls > Datalogging
Settings.
DATALOGGING SETTINGS:
>SELECT SREC/LREC SREC
VIEW LOGGED DATA
ERASE LOG
SELECT CONTENT
COMMIT CONTENT
RESET TO DEFAULT CONTENT
CONFIGURE DATALOGGING
RANGE AVG DIAGS ALARM
The Select SREC/LREC is used to select short record or long record format
for other operations in this menu.
● In the Main Menu, choose Instrument Controls > Datalogging Settings
> Select SREC/LREC.
3-28 Model 42i Instruction Manual Thermo Fisher Scientific
Page 67

Operation
Instrument Controls Menu
SELECT LOG TYPE:
CURRENTLY: SREC
SET TO: LREC ?
TOGGLE VALUE
RANGE AVG DIAGS ALARM
View Logged Data
Number of Records
The View Logged Data screen is used to select the start point to view the
logged data by number of records or date and time.
● In the Main Menu, choose Instrument Controls > Datalogging Settings
> Select SREC or LREC > View Logged Data.
SELECT START POINT BY:
SET TO: # OF RECS
©ª CHANGE ACCEPT
RANGE AVG DIAGS ALARM
The Number of Records screen is used to select the starting point to display
the number of records back to view.
SET # BACK FROM CURRENT:
0000000
TOTAL LRECS: 20
§¨ MOVE CURSOR
©ª CHANGE VALUE SAVE
RANGE AVG DIAGS ALARM
The Record Display screen (read only) displays the selected records.
Thermo Fisher Scientific Model 42i Instruction Manual 3-29
Page 68

Operation
Instrument Controls Menu
Time date flags
10:01 06/20/05 FC0088900
10:02 06/20/05 FC0088900
10:03 06/20/05 FC0088900
10:04 06/20/05 FC0088900
©ª PGUP/DN §¨ PAN L/R
RANGE AVG DIAGS ALARM
Date and Time
The Date and Time screen is used to set a start date and time for which to
view logged data. For example, if “20 JUN 2005 10:00” is entered, then
the first logged data record that is displayed is the first record after this
time. If set to one minute logging, this would be at “20 JUN 2005 10:01”.
DATE AND TIME:
20 JUN 2005 10:00
©ª CHG DAYS
¨ SET CURSOR TO MONTHS
ACCEPT AS SHOWN
RANGE AVG DIAGS ALARM
The Record Display screen (read only) displays the selected records.
Time date flags
10:01 06/20/05 FC0088900
10:02 06/20/05 FC0088900
10:03 06/20/05 FC0088900
10:04 06/20/05 FC0088900
©ª PGUP/DN §¨ PAN L/R
RANGE AVG DIAGS ALARM
Erase Log
The Erase Log is used to erase all saved data for the selected record type
(not all short records and long records).
● In the Main Menu, choose Instrument Controls > Datalogging Settings
> Erase Log.
3-30 Model 42i Instruction Manual Thermo Fisher Scientific
Page 69

Operation
Instrument Controls Menu
ERASE LREC LOG FILE DATA?
ERASE
RANGE AVG DIAGS ALARM
Select Content
The Select Content submenu displays a list of 32 record fields to use and a
submenu list of the analog output signal group choices to choose from.
Choices are Concentrations, Other Measurements, and Analog Inputs (if
the I/O expansion board is installed). This is a temporary list of items for
the selected record type that must be committed via the datalogging menu
before the changes will apply. Note that committing any changes to this list
will erase all currently logged data, as the format of the stored data is
changed.
● In the Main Menu, choose Instrument Controls > Datalogging Settings
> Select Content.
ERASE LREC LOG FILE DATA?
ERASE
ARE YOU SURE YOU WANT TO?x
PRESS ¨ TO CONFIRM ERASURE
RANGE AVG DIAGS ALARM
Choose Item Type
LREC FIELDS:
>FIELD 1 NO
FIELD 2 NOX
FIELD 3 PRES
FIELD 4 PMTT
FIELD 5 INTT
FIELD 6 CONVT
FIELD 7 NONE ª
RANGE AVG DIAGS ALARM
The Choose Item Type submenu displays a list of data that can be loggd
for the current field. Choices are Concentrations, Other Measurements,
and Analog Inputs (if the I/O expansion board is installed).
● In the Main Menu, choose Instrument Controls > Datalogging Settings
> Select Content > Field 1-32.
Thermo Fisher Scientific Model 42i Instruction Manual 3-31
Page 70

Operation
Instrument Controls Menu
DATA IN SREC FIELD 1:
>CONCENTRATIONS
OTHER MEASUREMENTS
ANALOG INPUTS
RANGE AVG DIAGS ALARM
Note The ANALOG INPUTS item is only displayed if the I/O Expansion
Board option is installed. ▲
Concentrations
The Concentrations screen allows the user to select the output signal that is
tied to the selected field item. The selected item is shown by “<--” after it.
Note that at this point, pressing indicates that these are proposed
changes as opposed to implemented changes. To change the selected record
format and erase record log file data, see “Commit Content” below. Range
(NOx) is visible only in auto range mode.
● In the Main Menu, choose Instrument Controls > Datalogging Settings
> Select Content > Select Field > Concentrations.
CONCENTRATIONS:
>NONE
NO <- NO2
NOx
LO NO
LO NO2
LO NOx ª
RANGE AVG DIAGS ALARM
HI NO
HI NO2
HI NOx
RANGE (NOX)
Other Measurements
The Other Measurements screen allows the user to select the output signal
that is tied to the selected field item. The selected item is shown by “<--”
after it. Items displayed are determined by the options installed. Note that
at this point, pressing indicates that these are proposed changes as
opposed to implemented changes. To change the selected record format
and erase record log file data, see “Commit Content” below.
● In the Main Menu, choose Instrument Controls > Datalogging Settings
> Select Content > Select Field > Other Measurements.
3-32 Model 42i Instruction Manual Thermo Fisher Scientific
Page 71

Operation
Instrument Controls Menu
OTHER MEASUREMENTS:
>NONE
INT TEMP
CHAMBER TEMP
COOLER TEMP
NO2 CNV TEMP
PERM VON GAS
PERM OVN HTR ª
RANGE AVG DIAGS ALARM
CHAMBER PRES
FLOW
PMT VOLTS
OZONATOR FLOW
Analog Inputs
Commit Content
The Analog Inputs screen allows the user to select the output signal (none
or analog inputs 1-8) that is tied to the selected field item. The selected
item is shown by “<--” after it. Note that at this point, pressing
indicates that these are proposed changes as opposed to implemented
changes. To change the selected record format and erase record log file
data, see “Commit Content” below.
● In the Main Menu, choose Instrument Controls > Datalogging Settings
> Select Content > Select Field > Analog Inputs.
ANALOG INPUTS:
>NONE
ANALOG IN 1
ANALOG IN 2
ANALOG IN 3
ANALOG IN 4
ANALOG IN 5
ANALOG IN 6 ª
RANGE AVG DIAGS ALARM
The Commit Content screen is used to save the selected output signal that
is tied to the selected field item. If no changes have been made “NO
CHANGES TO RECORD LIST!” will appear. For more information
about selecting the analog output signal group choices, see “Select
Content” above.
● In the Main Menu, choose Instrument Controls > Datalogging Settings
> Commit Content.
Thermo Fisher Scientific Model 42i Instruction Manual 3-33
Page 72

Operation
Instrument Controls Menu
CHANGE LREC DATA AND
ERASE LREC LOG FILE DATA?
COMMIT
RANGE AVG DIAGS ALARM
Reset to Default Content
RESET LREC DATA AND
ERASE LREC LOG FILE DATA?
RESET
RANGE AVG DIAGS ALARM
CHANGE LREC DATA AND
ERASE LREC LOG FILE DATA?
COMMIT
ARE YOU SURE YOU WANT TO?x
PRESS ¨ TO CONFIRM ERASURE
RANGE AVG DIAGS ALARM
The Reset to Default Content screen is used to reset all of the datalogging
field items to default values. For more information about selecting the
analog output signal group choices, see “Select Content” above.
● In the Main Menu, choose Instrument Controls > Datalogging Settings
> Reset to Default Content.
RESET LREC DATA AND
ERASE LREC LOG FILE DATA?
RESET
ARE YOU SURE YOU WANT TO?x
PRESS ¨ TO CONFIRM RESETxx
RANGE AVG DIAGS ALARM
Configure Datalogging
The Configure Datalogging menu deals with datalogging configuration for
the currently selected record type.
● In the Main Menu, choose Instrument Controls > Datalogging Settings
> Configure Datalogging.
DATALOGGING SETTINGS:
>LOGGING PERIOD MIN 60
MEMORY ALLOCATION % 50
DATA TREATMENT AVG
RANGE AVG DIAGS ALARM
3-34 Model 42i Instruction Manual Thermo Fisher Scientific
Page 73

Operation
Instrument Controls Menu
Logging Period Min
Memory Allocation
Percent
The Logging Period Min screen is used to select the logging period in
minutes for the record format (srec or lrec). List of choices include: off, 1,
5, 15, 30, and 60 minutes (default).
● In the Main Menu, choose Instrument Controls > Datalogging Settings
> Configure Datalogging > Logging Period Min.
SET PERIOD FOR SREC:
CURRENTLY: 60 MIN
SET TO: OFF MIN
©ª CHANGE VALUE SAVE
RANGE AVG DIAGS ALARM
The Memory Allocation Percent screen is used to select the percentage of
each record type for both short records and long records. Percentages
between 0 and 100% are available in increments of 10. Changing this value
results in log erasure for both short records and long records.
Data Treatment
● In the Main Menu, choose Instrument Controls > Datalogging Settings
> Configure Datalogging > Memory Allocation %.
SET PERCENT LRECS:
CURRENTLY: 50%
SET TO: 60% ?
©ª CHANGE VALUE SAVE
RANGE AVG DIAGS ALARM
The Data Treatment screen is used to select the data type for the selected
record type: whether the data should be averaged over the interval, the
minimum or maximum measured during the interval, or the current value
(last value measured). Data treatment doesn’t apply to all data, just to the
concentration measurement. All other data points log the current value at
the end of the interval.
● In the Main Menu, choose Instrument Controls > Datalogging Settings
> Configure Datalogging > Data Treatment.
Thermo Fisher Scientific Model 42i Instruction Manual 3-35
Page 74

Operation
Instrument Controls Menu
SET LREC DATA TYPE:
CURRENTLY: AVG
SET TO: CUR
©ª CHANGE VALUE SAVE
RANGE AVG DIAGS ALARM
Communication
Settings
Baud Rate
The Communication Settings menu is used with communications control
and configuration.
● In the Main Menu, choose Instrument Controls > Communication
Settings.
COMMUNICATION SETTINGS:
>BAUD RATE
INSTRUMENT ID
COMMUNICATION PROTOCOL
STREAMING DATA CONFIG
RS-232/RS-485 SELECTION
TCP/IP SETTINGS
RANGE AVG DIAGS ALARM
The Baud Rate screen is used to set the RS-232/RS-485 interface baud rate.
Baud rates of 1200, 2400, 4800, and 9600, 19200, 38400, 57600, and
115200 are available.
● In the Main Menu, choose Instrument Controls > Communication
Settings > Baud Rate.
BAUD RATE:
CURRENTLY: 9600
SET TO: 19200 ?
©ª CHANGE VALUE
SAVE VALUE
RANGE AVG DIAGS ALARM
3-36 Model 42i Instruction Manual Thermo Fisher Scientific
Page 75

Operation
Instrument Controls Menu
Instrument ID
The Instrument ID screen allows the operator to edit the instrument ID.
The ID is used to identify the instrument when using the C-Link or
MODBUS protocols to control the instrument or collect data. It may be
necessary to edit the ID number if two or more of the same instruments are
connected to one computer. Valid Instrument ID numbers are from 0 to
127. The Model 42i has a default Instrument ID of 42. For more
information about the Instrument ID, see Appendix B “C-Link Protocol
Commands” or Appendix C “MODBUS Protocol”.
● In the Main Menu, choose Instrument Controls > Communication
Settings > Instrument ID.
INSTRUMENT ID:
CURRENTLY: 42
SET TO: 50 ?
©ª CHANGE VALUE
SAVE VALUE
RANGE AVG DIAGS ALARM
Communication Protocol
Streaming Data Configuration
The Communication Protocol screen is used to change the instrument
communication protocol for serial communications.
● In the Main Menu, choose Instrument Controls > Communication
Settings > Communication Protocol.
COMMUNICATION PROTOCOL:
CURRENTLY: CLINK
SET TO: STREAMING ?
©ª CHANGE VALUE
SAVE VALUE
RANGE AVG DIAGS ALARM
The Streaming Data Configuration menu is used to allow for configuration
of the 8 streaming data output items, streaming interval, current data
format, and current timestamp setting. The Choose Item Signal submenu
displays a list of the analog output signal group choices to choose from.
Thermo Fisher Scientific Model 42i Instruction Manual 3-37
Page 76

Operation
Instrument Controls Menu
Choices are Concentrations, Other Measurements, and Analog Inputs (if
the I/O expansion board option is installed).
Note Add Labels, Prepend Timestamp, and Add Flags are toggle items that
change between yes or no when selected. ▲
● In the Main Menu, choose Instrument Controls > Communication
Settings > Streaming Data Config.
STREAMING DATA CONFIG
>INTERVAL 10 SEC
ADD LABELS NO
PREPEND TIMESTAMP YES
ADD FLAGS YES
ITEM 2 NO
ITEM 3 NO2
ITEM 4 NOX ª
RANGE AVG DIAGS ALARM
Streaming Data Interval
CHOOSE STREAM DATA:
>CONCENTRATIONS
OTHER MEASUREMENTS
ANALOG INPUTS
RANGE AVG DIAGS ALARM
The Streaming Data Interval screen is used to adjust the streaming data
interval. The following interval times are available: 1, 2, 5, 10, 20, 30, 60,
90, 120, 180, 240, and 300 seconds.
● In the Main Menu, choose Instrument Controls > Communication
Settings > Streaming Data Config > Streaming Data Interval.
STREAMING DATA INTERVAL:
CURRENTLY: 10 SEC
SET TO: 20 SEC ?
©ª CHANGE VALUE
SAVE VALUE
RANGE AVG DIAGS ALARM
3-38 Model 42i Instruction Manual Thermo Fisher Scientific
Page 77

Operation
Instrument Controls Menu
Choose Item Signal
Concentrations
The Choose Signal screen displays a submenu of the analog output signal
group choices. Group choices are Concentrations, Other Measurements,
and Analog Inputs (if the I/O expansion board is installed).
● In the Main Menu, choose Instrument Controls > Communication
Settings > Streaming Data Config > Item 1-8.
CHOOSE STREAM DATA:
>CONCENTRATIONS
OTHER MEASUREMENTS
ANALOG INPUTS
RANGE AVG DIAGS ALARM
The Concentrations screen allows the user to select the output signal that is
tied to the selected streaming data item. The selected item is shown by
“<--” after it. In dual or auto range mode, “HI” or “LO” is displayed to
indicate high or low concentrations. Range (NOx) is visible only in auto
range mode
Other Measurements
● In the Main Menu, choose Instrument Controls > Communication
Settings > Streaming Data Config > Select Item > Concentrations.
CONCENTRATIONS:
>NONE
NO
NO2 <- NOx
RANGE (NOX)
RANGE AVG DIAGS ALARM
The Other Measurements screen allows the user to select the output signal
that is tied to the selected streaming data item. The selected item is shown
by “<--” after it. Items displayed are determined by the options installed.
● In the Main Menu, choose Instrument Controls > Communication
Settings > Streaming Data Config > Select Item > Other
Measurements.
Thermo Fisher Scientific Model 42i Instruction Manual 3-39
Page 78

Operation
Instrument Controls Menu
OTHER MEASUREMENTS:
>NONE
INT TEMP
CHAMBER TEMP
COOLER TEMP
NO2 CNV TEMP
CHAMBER PRES
FLOW ª
RANGE AVG DIAGS ALARM
PMT VOLTS
OZONATOR FLOW
Analog Inputs
RS-232/RS-485 Selection
The Analog Inputs screen allows the user to select the analog input signal
(none or analog inputs 1-8) that is tied to the selected streaming data item.
The selected item is shown by “<--” after it.
● In the Main Menu, choose Instrument Controls > Communication
Settings > Streaming Data Config > Select Item > Analog Inputs.
ANALOG INPUTS:
>NONE
ANALOG IN 1
ANALOG IN 2
ANALOG IN 3
ANALOG IN 4
ANALOG IN 5
ANALOG IN 6 ª
RANGE AVG DIAGS ALARM
The RS-232/RS-485 Selection screen allows the user to choose between the
RS-232 or RS-485 specification for serial communication.
Note Disconnect the serial cable before changing RS-232 and RS-485
selection to prevent damage to the connected equipment.
▲
● In the Main Menu, choose Instrument Controls > Communication
Settings > RS-232/RS-485 Selection.
3-40 Model 42i Instruction Manual Thermo Fisher Scientific
Page 79

Operation
Instrument Controls Menu
RS-232/RS-485 SELECTION:
XXXXXX** WARNING **XXXXXXX
DISCONNECT THE SERIALX X
CABLES BEFORE CHANGING X
THE SELECTION!XXXXXX
TO CONTINUE
RANGE AVG DIAGS ALARM
TCP/IP Settings
The TCP/IP Settings menu is used for defining TCP/IP settings
Note The instrument power must be cycled after any of these parameters
have been changed for the change to take effect. ▲
● In the Main Menu, choose Instrument Controls > Communication
Settings > TCP/IP Settings.
RS-232/RS-485 SELECTION:
CURRENTLY: RS-232
SET TO: RS-485 ?
MAKE SURE THAT THE CABLEXX
IS OFF: PRESS ¨ TO CONFIRM
TOGGLE VALUE
RANGE AVG DIAGS ALARM
Use DHCP
TCP/IP SETTINGS:
>USE DHCP OFF
IP ADDR 10.209.43.237
NETMASK 255.255.254.0
GATEWAY 10.209.42.1
HOST NAME iSeries
RANGE AVG DIAGS ALARM
The Use DHCP screen is used to specify whether to use DHCP or not.
When DHCP is enabled, the network dynamically provides an IP address
for the instrument.
● In the Main Menu, choose Instrument Controls > Communication
Settings > TCP/IP Settings > Use DCHP.
Thermo Fisher Scientific Model 42i Instruction Manual 3-41
Page 80

Operation
Instrument Controls Menu
DHCP:
CURRENTLY: OFF
SET TO: ON ?
TOGGLE VALUE
CYCLE POWER TO CHANGE DHCP
RANGE AVG DIAGS ALARM
IP Address
Netmask
The IP Address screen is used to edit the IP address. The IP address can
only be changed when DHCP is OFF. For more information on DHCP,
see “Use DHCP” above.
● In the Main Menu, choose Instrument Controls > Communication
Settings > TCP/IP Settings > IP Address.
IP ADDRESS:
CURRENT: 10.209.43.237
SET TO: 10.209.43.237 1
§¨ MOVE CURSOR
©ª CHANGE VALUE
SAVE VALUE
RANGE AVG DIAGS ALARM
The Netmask screen is used to edit the netmask. The netmask is used to
determine the subnet for which the instrument can directly communicate
to other devices on. The netmask can only be changed when DHCP is
OFF. For more information on DHCP, see “Use DHCP” above.
● In the Main Menu, choose Instrument Controls > Communication
Settings > TCP/IP Settings > Netmask.
NETMASK:
CURRENT: 255.255.254.0
SET TO: 255.255.254.0 0
§¨ MOVE CURSOR
©ª CHANGE VALUE
SAVE VALUE
RANGE AVG DIAGS ALARM
3-42 Model 42i Instruction Manual Thermo Fisher Scientific
Page 81

Operation
Instrument Controls Menu
Default Gateway
Host Name
The Default Gateway screen is used to edit the gateway address. The
default gateway can only be changed when DHCP is OFF. For more
information on DHCP, see “Use DHCP” above. Any traffic to addresses
that are not on the local subnet will be routed through this address.
● In the Main Menu, choose Instrument Controls > Communication
Settings > TCP/IP Settings > Gateway.
DEFAULT GATEWAY:
CURRENT: 10.209.42.1
SET TO: 10.209.42.1 1
§¨ MOVE CURSOR
©ª CHANGE VALUE
SAVE VALUE
RANGE AVG DIAGS ALARM
The host name screen is used to edit the host name. When DHCP is
enabled, this name is reported to the DHCP server.
● In the Main Menu, choose Instrument Controls > Communication
Settings > TCP/IP Settings > Host Name.
I/O Configuration
HOST NAME:
CURRENT: ISERIES
ISERIES SSSSS ?
ABCDEFGHIJKLMN BKSP
OPQRSTUVWXYZ PAGE
0123456789 ./- SAVE
RANGE AVG DIAGS ALARM
The I/O Configuration menu deals with configuration of the analyzer’s
I/O system. The analog input configuration is displayed only if the I/O
expansion board option is installed.
● In the Main Menu, choose Instrument Controls > I/O Configuration.
Note The digital outputs may take up to one second after the assigned
state occurs to show up on the outputs. ▲
Thermo Fisher Scientific Model 42i Instruction Manual 3-43
Page 82

Operation
Instrument Controls Menu
I/O CONFIGURATION:
>OUTPUT RELAY SETTINGS
DIGITAL INPUT SETTINGS
ANALOG OUTPUT CONFIG
ANALOG INPUT CONFIG
RANGE AVG DIAGS ALARM
Output Relay Settings
Logic State
The Output Relay Settings menu displays a list of the 10 digital output
relays available, and allows the user to select the logic state or instrument
parameter for the relay selected.
● In the Main Menu, choose Instrument Controls > I/O Configuration >
Output Relay Settings.
OUTPUT RELAY SETTINGS:
>1 NOP GEN ALARM
2 NOP NONE
3 NOP UNITS
4 NOP CONC ALARM
5 NOP NONE
6 NOP NONE
7 NOP NO MODE ª
RANGE AVG DIAGS ALARM
The Logic State screen is used to change the I/O relay to either normally
open or normally closed.
● Press to toggle and set the logic state open or closed.
OUTPUT RELAY SETUP:
>LOGIC STATE OPEN
INSTRUMENT STATE
RANGE AVG DIAGS ALARM
Instrument State
The Instrument State submenu allows the user to select the instrument
state that is tied to the selected relay output. A submenu lists signal types of
either alarm or non-alarm to choose from.
3-44 Model 42i Instruction Manual Thermo Fisher Scientific
Page 83

Operation
Instrument Controls Menu
● In the Main Menu, choose Instrument Controls > I/O Configuration >
Output Relay Settings > Select Relay > Instrument State.
CHOOSE SIGNAL TYPE:
>ALARMS
NON-ALARM
RANGE AVG DIAGS ALARM
Alarms
The Alarms status screen allows the user to select the alarm status for the
selected relay output. The selected item is shown by “<--” after it. The I/O
board status alarm is only present if the I/O expansion board is installed.
The zero and span check/calibration alarms are only present if the
zero/span valve option is installed and the instrument is operating in
manual mode.
● In the Main Menu, choose Instrument Controls > I/O Configuration >
Output Relay Settings > Select Relay > Instrument State > Alarms.
ALARM STATUS ITEMS:
>NONE
GEN ALARM <--
NO CONC MAX
NO CONC MIN
NO2 CONC MAX
NO2 CONC MIN
NOx CONC MAX ª
RANGE AVG DIAGS ALARM
NOx CONC MIN
INT TEMP
CHAMB TEMP
COOLER TEMP
NO2 CV TMEP
PRESSURE
FLOW
OZONE FLOW
MB STATUS
MIB STATUS
I/O BD STATUS
CONC ALARM
ZERO CHK/CAL
SPAN CHK/CAL
Thermo Fisher Scientific Model 42i Instruction Manual 3-45
Page 84

Operation
Instrument Controls Menu
Non-Alarm
Digital Input Settings
The Non-Alarm status screen allows the user to select the non-alarm status
for the selected relay output. The selected item is shown by “<--” after it.
● In the Main Menu, choose Instrument Controls > I/O Configuration >
Output Relay Settings > Select Relay > Instrument State > Non-Alarm.
NON ALARM STATUS ITEMS:
>NONE
AUTORANGE (NOx)
SERVICE
UNITS
ZERO MODE
SPAN MODE
NO MODE ª
RANGE AVG DIAGS ALARM
NOX MODE
SAMPLE MODE
PURGE MODE
The Digital Input Settings menu displays a list of the 16 digital inputs
available, and allows the user to select the logic state and instrument
parameter for the relay selected.
Logic State
Note The digital inputs must be asserted for at least one second for the
action to be activated. ▲
● In the Main Menu, choose Instrument Controls > I/O Configuration >
Digital Input Settings.
DIGITAL INPUT SETTINGS:
>1 NOP NO MODE
2 NOP NOX MODE
3 NOP SET BACKGROUND
4 NOP CAL TO LO SPAN
5 NOP AOUTS TO ZERO
6 NOP AOUTS TO FS
7 NOP NONE ª
RANGE AVG DIAGS ALARM
The Logic State screen is used to change the I/O relay to either normally
open or normally closed. The default state is open, which indicates that a
relay connected between the digital input pin and ground is normally open
3-46 Model 42i Instruction Manual Thermo Fisher Scientific
Page 85

Operation
Instrument Controls Menu
and closes to trigger the digital input action. If nothing is connected to the
digital input pin, the state should be left at open to prevent the action from
being triggered.
● Press to toggle and set the logic state open or closed.
DIGITAL INPUT SETUP:
>LOGIC STATE OPEN
INSTRUMENT STATE
RANGE AVG DIAGS ALARM
Instrument Action
Analog Output
Configuration
The Instrument Action screen allows the user to choose the instrument
action that is tied to the selected digital input.
● In the Main Menu, choose Instrument Controls > I/O Configuration >
Digital Input Settings > Select Relay > Instrument Action.
CHOOSE ACTION:
>NONE
ZERO MODE
SPAN MODE
NO MODE <- NOX MODE
SET BACKGROUND
CAL TO LO SPAN ª
RANGE AVG DIAGS ALARM
AOUTS TO ZERO
AOUTS TO FS
CAL TO HI SPAN
The Analog Output Configuration menu displays a list of the analog
output channels available for configuration. Channel choices include all
voltage channels, all current channels, voltage channels 1-6, and current
channels 1-6 (if the I/O expansion board option is installed). Configuration
choices include selecting range, setting minimum/maximum values, and
choosing signal to output.
● In the Main Menu, choose Instrument Controls > I/O Configuration >
Analog Output Config.
Thermo Fisher Scientific Model 42i Instruction Manual 3-47
Page 86

Operation
Instrument Controls Menu
OUTPUT CHANNELS:
>ALL VOLTAGE CHANNELS
ALL CURRENT CHANNELS
VOLTAGE CHANNEL 1
VOLTAGE CHANNEL 2
VOLTAGE CHANNEL 3
VOLTAGE CHANNEL 4
VOLTAGE CHANNEL 5 ª
RANGE AVG DIAGS ALARM
ANALOG OUTPUT CONFIG:
>SELECT RANGE
SET MINIMUM VALUE
SET MAXIMUM VALUE
CHOOSE SIGNAL TO OUTPUT
RANGE AVG DIAGS ALARM
Select Output Range
Minimum and Maximum
Value
The Select Output Range screen is used to select the hardware range for the
selected analog output channel. Possible ranges for the voltage outputs are:
0-100 mV, 0-1, 0-5, 0-10 V.
● In the Main Menu, choose Instrument Controls > I/O Configuration >
Analog Output Config > Select Channel > Select Range.
SELECT OUTPUT RANGE:
SELECTED OUTPUT: V ALL
CURRENTLY: 0-10V
SET TO: 0-5V ?
©ª CHANGE VALUE SAVE
RANGE AVG DIAGS ALARM
The Minimum Value screen is used to edit the zero (0) to full-scale (100)
value in percentages for the selected analog output channel. See Table 3–7
for a list of choices. In dual or auto range mode, “HI” or “LO” is displayed
to indicate high or low concentrations. Range Status is visible only in auto
range mode. The minimum and maximum output value screens function
the same way. The example below shows the set minimum value screen.
● In the Main Menu, choose Instrument Controls > IO Configuration >
Analog Output Config > Select Channel > Set Minimum or
Maximum Value.
3-48 Model 42i Instruction Manual Thermo Fisher Scientific
Page 87

Instrument Controls Menu
MINIMUM OUTPUT PERCENT:
SELECTED OUTPUT: V ALL
CURRENTLY: N/A %
SET TO: 0000.5 % ?
©ª CHANGE VALUE SAVE
RANGE AVG DIAGS ALARM
Table 3–7. Analog Output Zero to Full-Scale Table
Output Zero % Value Full-Scale 100% Value
NO Zero (0) Range Setting
NO
Zero (0) Range Setting
2
NOx Zero (0) Range Setting
LO NO Zero (0) Range Setting
Operation
LO NO2 Zero (0) Range Setting
LO NOx Zero (0) Range Setting
HI NO Zero (0) Range Setting
HI NO2 Zero (0) Range Setting
HI NOx Zero (0) Range Setting
Range (NOx) Recommend not to change the setting for this output
Internal Temp User-set alarm min value User-set alarm max value
Chamber Temp User-set alarm min value User-set alarm max value
Cooler Temp User-set alarm min value User-set alarm max value
NO2 Converter Temp User-set alarm min value User-set alarm max value
Perm Oven Gas Temp Perm Oven Gas alarm min value Perm Oven Gas alarm max value
Perm Oven Heater Temp Perm Oven Heater alarm min
value
Perm Oven Heater alarm max
value
Chamber Pressure User-set alarm min value User-set alarm max value
Flow User-set alarm min value User-set alarm max value
PMT Volts 700 volts 1100 volts
Ozonator Flow User-set alarm min value User-set alarm max value
Everything Else 0 Units 10 Units
Thermo Fisher Scientific Model 42i Instruction Manual 3-49
Page 88

Operation
Instrument Controls Menu
Choose Signal to Output
The Choose Signal to Output screen displays a submenu list of the analog
output signal group choices. Group choices are Concentrations, Other
Measurements, and Analog Inputs (if the I/O expansion board option is
installed). This allows the user to select the output signal to the selected
output channel. In dual or auto range mode, “HI” or “LO” is displayed to
indicate high or low concentrations. Range (NOx) is visible only in auto
range mode. The Concentrations screen is shown below. See Table 3–8
below for a list of items for each signal group choice.
● In the Main Menu, choose Instrument Controls > I/O Configuration >
Analog Output Config > Select Channel > Choose Signal to Output.
CHOOSE SIGNAL TYPE:
>CONCENTRATIONS
OTHER MEASUREMENTS
ANALOG INPUTS
RANGE AVG DIAGS ALARM
CHOOSE SIGNAL - CONC
SELECTED OUTPUT: V1
CURRENTLY: NO
SET TO: NONE ?
©ª CHANGE VALUE SAVE
RANGE AVG DIAGS ALARM
3-50 Model 42i Instruction Manual Thermo Fisher Scientific
Page 89

Operation
Instrument Controls Menu
Table 3–8. Signal Type Group Choices
Concentrations Other Measurements Analog Inputs
None None None
NO (single/auto range mode) Internal Temp Analog Input 1
NO2 (single/auto range mode) Chamber Temp Analog Input 2
NOx (single/auto range mode) Cooler Temp Analog Input 3
LO NO (dual mode) NO2 Converter Temp Analog Input 4
LO NO2 dual mode) Perm Oven Gas Analog Input 5
LO NOx (dual mode) Perm Oven Heater Analog Input 6
HI NO (dual mode) Chamber Pressure Analog Input 7
HI NO2 (dual mode) Flow Analog Input 8
HI NOx dual mode) PMT Volts
Range (NOx) (auto range mode) Ozonator Flow
Analog Input
Configuration
The Analog Input Configuration menu displays a list of the 8 analog input
channels available for configuration. This screen is only displayed if the I/O
expansion board option is installed. Configuration includes entering
descriptor, units, decimal places, choice of 1-10 points in the table, and
corresponding number of points selected.
● In the Main Menu, choose Instrument Controls > I/O Configuration >
Analog Input Config.
ANALOG INPUT CONFIG:
>CHANNEL 1 IN1
CHANNEL 2 IN2
CHANNEL 3 IN3
CHANNEL 4 IN4
CHANNEL 5 IN5
CHANNEL 6 IN6
CHANNEL 7 IN7ª
RANGE AVG DIAGS ALARM
Thermo Fisher Scientific Model 42i Instruction Manual 3-51
Page 90

Operation
Instrument Controls Menu
ANALOG INPUT 01 CONFIG:
>DESCRIPTOR IN1
UNITS V
DECIMAL PLACES 2
TABLE POINTS 2
POINT 1
POINT 2
RANGE AVG DIAGS ALARM
Descriptor
Units
The Descriptor screen allows the user to enter the descriptor for the
selected analog input channel. The descriptor is used in datalogging and
streaming data to report what data is being sent out. The descriptor may be
from 1 to 3 characters in length, and defaults to IN1 to IN8 (user input
channel number).
● In the Main Menu, choose Instrument Controls > I/O Configuration >
Analog Input Config > Select Channel > Descriptor.
ANALOG INPUT DESCRIPTOR:
CURRENTLY: IN1
IN1
ABCDEFGHIJKLMN BKSP
OPQRSTUVWXYZ PAGE
0123456789 ./- SAVE
RANGE AVG DIAGS ALARM
The Units screen allows the user to enter the units for the selected analog
input channel. The units are displayed on the diagnostic screen and in
datalogging and streaming data. The units may be from 1 to 3 characters in
length, and defaults to V (volts).
● In the Main Menu, choose Instrument Controls > I/O Configuration >
Analog Input Config > Select Channel > Units.
ANALOG INPUT UNITS:
CURRENTLY: V
VN1
ABCDEFGHIJKLMN BKSP
OPQRSTUVWXYZ PAGE
0123456789 ./- SAVE
RANGE AVG DIAGS ALARM
3-52 Model 42i Instruction Manual Thermo Fisher Scientific
Page 91

Operation
Instrument Controls Menu
Decimal Places
Number of Table Points
The Decimal Places screen allows the user to select how many digits are
displayed to the right of the decimal, from 0 to 6, with a default of 2.
● In the Main Menu, choose Instrument Controls > I/O Configuration >
Analog Input Config > Select Channel > Decimal Places.
DECIMAL PLACES:
CURRENTLY: 2
SET TO: 3 ?
©ª CHANGE VALUE
SAVE VALUE
RANGE AVG DIAGS ALARM
The Number of Table Points screen allows the user to select how many
points are used in the conversion table. The points range from 2 to 10,
with a default of 2.
● In the Main Menu, choose Instrument Controls > I/O Configuration >
Analog Input Config > Select Channel > Table Points.
Table Point
NUMBER OF TABLE POINTS:
CURRENTLY: 2
SET TO: 10 ?
©ª CHANGE VALUE
SAVE VALUE
RANGE AVG DIAGS ALARM
The Table Point submenu allows the user to set up an individual table
point.
● In the Main Menu, choose Instrument Controls > I/O Configuration >
Analog Input Config > Select Channel > Point 1-10.
Thermo Fisher Scientific Model 42i Instruction Manual 3-53
Page 92

Operation
Instrument Controls Menu
TABLE POINT 01 CONFIG:
>VOLTS 0.00
USER VALUE 0.00
RANGE AVG DIAGS ALARM
Volts
User Value
The Volts screen allows the user to set the input voltage for the selected
table point in the conversion table, from 0.00 to 10.50. The default table is
a two-point table with point 1: 0.00 V = 000.0 U and point 2: 10.00 V =
10.0 U.
● In the Main Menu, choose Instrument Controls > I/O Configuration >
Analog Input Config > Select Channel > Select Point > Volts.
TABLE POINT 01 VOLTS:
CURRENTLY: 0.00
SET TO: 00.00
§¨ MOVE CURSOR
©ª CHANGE VALUE SAVE
RANGE AVG DIAGS ALARM
The User Value screen allows the user to set the output value for the
corresponding input voltage for the selected table point in the conversion
table, from -9999999 to 99999999. The default table is a two-point table
with point 1: 0.00 V = 000.0 U and point 2: 10.00 V = 10.0 U.
● In the Main Menu, choose Instrument Controls > I/O Configuration >
Analog Input Config > Select Table Point > User Value.
TABLE POINT 01 USER VAL:
CURRENTLY: 0.00
SET TO: 00000.00
§¨ MOVE CURSOR
©ª CHANGE VALUE SAVE
RANGE AVG DIAGS ALARM
3-54 Model 42i Instruction Manual Thermo Fisher Scientific
Page 93

Operation
Instrument Controls Menu
Temperature
Compensation
Temperature compensation provides compensation for any changes to the
instrument's output signal due to internal instrument temperature
variations. The effects of internal instrument temperature changes on the
analyzer's subsystems and output have been empirically determined. This
empirical data is used to compensate for any changes in temperature. This
compensation can be used for special applications, or when operating the
instrument outside the recommended temperature range, even though the
Model 42i does not require temperature compensation for EPA
equivalency.
When temperature compensation is on, the display shows the current
internal instrument temperature (measured by a thermistor on the Interface
board). When temperature compensation is off, the display shows the
factory standard temperature of 30 °C.
● In the Main Menu, choose Instrument Controls > Temperature
Compensation.
TEMPERATURE COMPENSATION:
COMP TEMP: 30.0 oC
CURRENTLY: OFF
SET TO: ON ?
TOGGLE VALUE
RANGE AVG DIAGS ALARM
Pressure Compensation
Pressure compensation provides compensation for any changes to the
instrument's output signal due to reaction chamber pressure variations. The
effects of reaction chamber pressure changes on the analyzer's subsystems
and output have been empirically determined. This empirical data is used
to compensate for any change in reaction chamber pressure. This
compensation can be used even though the Model 42i does not require
pressure compensation for EPA equivalency.
When pressure compensation is on, the first line of the display represents
the current pressure in the reaction chamber. When pressure compensation
is off, the first line of the display shows the factory standard pressure of 150
mmHg.
● In the Main Menu, choose Instrument Controls > Pressure
Compensation.
Thermo Fisher Scientific Model 42i Instruction Manual 3-55
Page 94

Operation
Instrument Controls Menu
PRESSURE COMPENSATION:
COMP PRES: 150.0 mmHg
CURRENTLY: OFF
SET TO: ON ?
TOGGLE VALUE
RANGE AVG DIAGS ALARM
Screen Contrast
Service Mode
The Screen Contrast screen is used to change the contrast of the display.
Intensities between 0 and 100% in increments of 10 are available.
Changing the screen contrast may be necessary if the instrument is
operated at extreme temperatures.
● In the Main Menu, choose Instrument Controls > Screen Contrast.
SCREEN CONTRAST:
CURRENTLY: 50 %
SET TO: 60 % ?
©ª CHANGE VALUE
SAVE VALUE
RANGE AVG DIAGS ALARM
The Service Mode screen is used to turn the service mode on or off. The
service mode locks out any remote actions and includes parameters and
functions that are useful when making adjustments or diagnosing the
Model 42i. For more information about the service mode, see “Service
Menu” later in this chapter.
Note The service mode should be turned off when finished, as it prevents
remote operation.
● In the Main Menu, choose Instrument Controls > Service Mode.
▲
3-56 Model 42i Instruction Manual Thermo Fisher Scientific
Page 95

Operation
Diagnostics Menu
SERVICE MODE:
CURRENTLY: OFF
SET TO: ON ?
TOGGLE VALUE
RANGE AVG DIAGS ALARM
Date/Time
DATE AND TIME:
19 MAR 2005 12:34:56
PRESS TO EDIT
RANGE AVG DIAGS ALARM
Diagnostics Menu
The Date/Time screen allows the user to view and change the system date
and time (24-hour format). The internal clock is powered by its own
battery when instrument power is off.
● In the Main Menu, choose Instrument Controls > Date/Time.
DATE AND TIME:
19 MAR 2005 12:34:56 ?
SETTING: DAYS
¨ SET MONTHS
©ª CHANGE VALUE
SAVE VALUE
RANGE AVG DIAGS ALARM
The Diagnostics menu provides access to diagnostic information and
functions. This menu is useful when troubleshooting the instrument. The
analog input readings and analog input voltages are only displayed if the
I/O expansion board option is installed.
● In the Main Menu, choose Diagnostics.
DIAGNOSTICS:
>PROGRAM VERSION
VOLTAGES
TEMPERATURES
PRESSURE
FLOW
ANALOG INPUT READINGS
ANALOG INPUT VOLTAGES ª
Thermo Fisher Scientific Model 42i Instruction Manual 3-57
RANGE AVG DIAGS ALARM
DIGITAL INPUTS
RELAY STATES
TEST ANALOG OUTPUTS
INSTRUMENT CONFIGURATION
CONTACT INFORMATION
Page 96

Operation
Diagnostics Menu
Program Version
Voltages
The Program Version screen (read only) shows the version number of the
program installed. Prior to contacting the factory with any questions
regarding the instrument, please note the product model name and
program version number.
● In the Main Menu, choose Diagnostics > Program Version.
PROGRAM VERSIONS:
PRODUCT: MODEL 42i
VERSION: 01.00.01.074
FIRMWARE: 09.06.19
RANGE AVG DIAGS ALARM
The Voltages menu displays the current diagnostic voltage readings. This
screen enables the power supply to be quickly read for low or fluctuating
voltages without having to use a voltage meter. The I/O board is only
displayed if the I/O expansion board option is installed.
Motherboard Voltages
● In the Main Menu, choose Diagnostics > Voltages.
VOLTAGES:
>MOTHERBOARD
INTERFACE BOARD
I/O BOARD
RANGE AVG DIAGS ALARM
The Motherboard screen (read only) is used to display the current voltage
readings on the motherboard.
● In the Main Menu, choose Diagnostics > Voltages > Motherboard
Voltages.
3-58 Model 42i Instruction Manual Thermo Fisher Scientific
Page 97

Operation
Diagnostics Menu
MOTHERBOARD VOLTAGES:
3.3 SUPPLY 3:3 V
5.0 SUPPLY 5.0 V
24.0 SUPPLY 24.1 V
-3.3 SUPPLY -3.3 V
RANGE AVG DIAGS ALARM
Interface Board Voltages
I/O Board Voltages
The Interface Board screen (read only) is used to display the current voltage
readings on the interface board.
● In the Main Menu, choose Diagnostics > Voltages > Interface Board
Voltages.
INTERFACE BOARD VOLTAGES:
PMT SUPPLY 785.5 V
3.3 SUPPLY 3.3 V
5.0 SUPPLY 5.0 V
15.0 SUPPLY 15.0 V
P15.0 SUPPLY 15.0 V
24.0 SUPPLY 24.0 V
-15.0 SUPPLY -15.0 V
RANGE AVG DIAGS ALARM
The I/O Board screen (read only) is used to display the current voltage
readings on the I/O expansion board. This menu is only displayed if the
I/O expansion board option is installed.
● In the Main Menu, choose Diagnostics > Voltages > I/O Board
Voltages.
I/O BOARD VOLTAGES:
3.3 SUPPLY 3:3 V
5.0 SUPPLY 5.0 V
15.0 SUPPLY 5.0 V
24.0 SUPPLY 24.0 V
-3.3 SUPPLY -3.3 V
RANGE AVG DIAGS ALARM
Temperatures
The Temperatures screen (read only) displays the internal temperature,
reaction chamber temperature, cooler temperature, converter temperatures,
and perm oven temperatures (if the permeation oven option is installed).
Thermo Fisher Scientific Model 42i Instruction Manual 3-59
Page 98

Operation
Diagnostics Menu
The internal temperature is the air temperature measured by a sensor
located on the interface board.
● In the Main Menu, choose Diagnostics > Temperatures.
TEMPERATURES:
INTERNAL 28.6 oC
CHAMBER 49.0 oC
COOLER -10.0 oC
NO2 CONVERTER 320.7 oC
NO2 CONV SET 325.0 oC
PERM OVEN GAS 45.0 oC
PERM OVEN HEATER 45.0 oC
RANGE AVG DIAGS ALARM
Pressure
Flow
The Pressure screen (read only) displays the reaction chamber pressure. The
pressure is measured by a pressure transducer at the reaction chamber.
● In the Main Menu, choose Diagnostics > Pressure.
PRESSURE: 232.5 mmHg
RANGE AVG DIAGS ALARM
The Flow screen (read only) displays the sample and ozonator flow rate.
The flows are measured by internal flow sensors.
● In the Main Menu, choose Diagnostics > Flow.
FLOW: 0.700 LPM
OZONATOR FLOW OK
RANGE AVG DIAGS ALARM
3-60 Model 42i Instruction Manual Thermo Fisher Scientific
Page 99

Operation
Diagnostics Menu
Analog Input Readings
Analog Input Voltages
The Analog Input Readings screen (read only) displays the 8 current userscaled analog readings (if the I/O expansion board option is installed).
● In the Main Menu, choose Diagnostics > Analog Input Readings.
ANALOG INPUT READINGS:
>CO 10.2 PPM
SO2 18.2 PPB
CO2 250 PPM
FL1 20.42 LPM
WND 9.86 V
FL2 1.865 LPM
IO7 0.0 Vª
RANGE AVG DIAGS ALARM
The Analog Input Voltages screen (read only) displays the 8 raw analog
voltage readings (if the I/O expansion board option is installed).
● In the Main Menu, choose Diagnostics > Analog Input Voltages.
ANALOG INPUT VOLTAGES:
>ANALOG IN 1 6.24 V
ANALOG IN 2 4.28 V
ANALOG IN 3 0.00 V
ANALOG IN 4 0.00 V
ANALOG IN 5 0.00 V
ANALOG IN 6 0.00 V
ANALOG IN 7 0.00 Vª
RANGE AVG DIAGS ALARM
Digital Inputs
The Digital Inputs screen (read only) displays the state of the 16 digital
inputs.
● In the Main Menu, choose Diagnostics > Digital Inputs.
DIGITAL INPUTS:
>INPUT 1 1
INPUT 2 1
INPUT 3 1
INPUT 4 1
INPUT 5 1
INPUT 6 1
INPUT 7 1ª
RANGE AVG DIAGS ALARM
Thermo Fisher Scientific Model 42i Instruction Manual 3-61
Page 100

Operation
Diagnostics Menu
Relay States
Test Analog Outputs
The Relay States screen displays the state of the 10 digital outputs and
allows toggling of the state to either on (1) or off (0). The relays are
restored to their original states upon exiting this screen.
● In the Main Menu, choose Diagnostics > Relay States.
● Press to toggle and set the relay state open or closed.
RELAY STATE:
>OUTPUT 1 0
OUTPUT 2 0
OUTPUT 3 0
OUTPUT 4 1
OUTPUT 5 0
OUTPUT 6 0
OUTPUT 7 1ª
RANGE AVG DIAGS ALARM
The Test Analog Outputs menu contains a number of digital to analog
converter (DAC) calibration items. Channel choices include all analog
outputs, 6 voltage channels, and 6 current channels (if the I/O expansion
board option is installed).
Set Analog Outputs
● In the Main Menu, choose Diagnostics > Test Analog Outputs.
TEST ANALOG OUTPUTS:
>ALL
VOLTAGE CHANNEL 1
VOLTAGE CHANNEL 2
VOLTAGE CHANNEL 3
VOLTAGE CHANNEL 4
VOLTAGE CHANNEL 5
VOLTAGE CHANNEL 6
RANGE AVG DIAGS ALARM
The Set Analog Outputs screen contains three choices: Set to full-scale, set
to zero, or reset to normal. Full-scale sets the analog outputs to the fullscale voltage, zero sets the analog outputs to 0 volts, and normal operation.
The example below shows the selected output state “ALL” is set to normal.
● In the Main Menu, choose Diagnostics > Test Analog Outputs > ALL,
Voltage Channel 1-6, or Current Channel 1-6.
3-62 Model 42i Instruction Manual Thermo Fisher Scientific
 Loading...