

Page 1
TECHNICAL NOTE Qubit Protein BR Assay
Qubit Protein BR Assay—fast,
accurate protein quantitation
Protein quantitation is an integral part of many protein
biology workflows and a necessary step before commonly
used techniques such as protein electrophoresis, western
blotting, mass spectrometry, and immunoassays. The
Invitrogen™ Qubit™ Protein BR Assay is a fluorometric
assay that combines accuracy, compatibility, and ease of
use, making protein concentration determination easier
and fas te r.
The Qubit Protein BR Assay is optimized to work with a
wide range of sample concentrations and components.
Add 150 or 160 µL
Add 10 or 20 µL
Std 2Std 1 Sample
Blank
Protein BR
Assay Buer
Add 30 µL
Protein
BR
Reagent
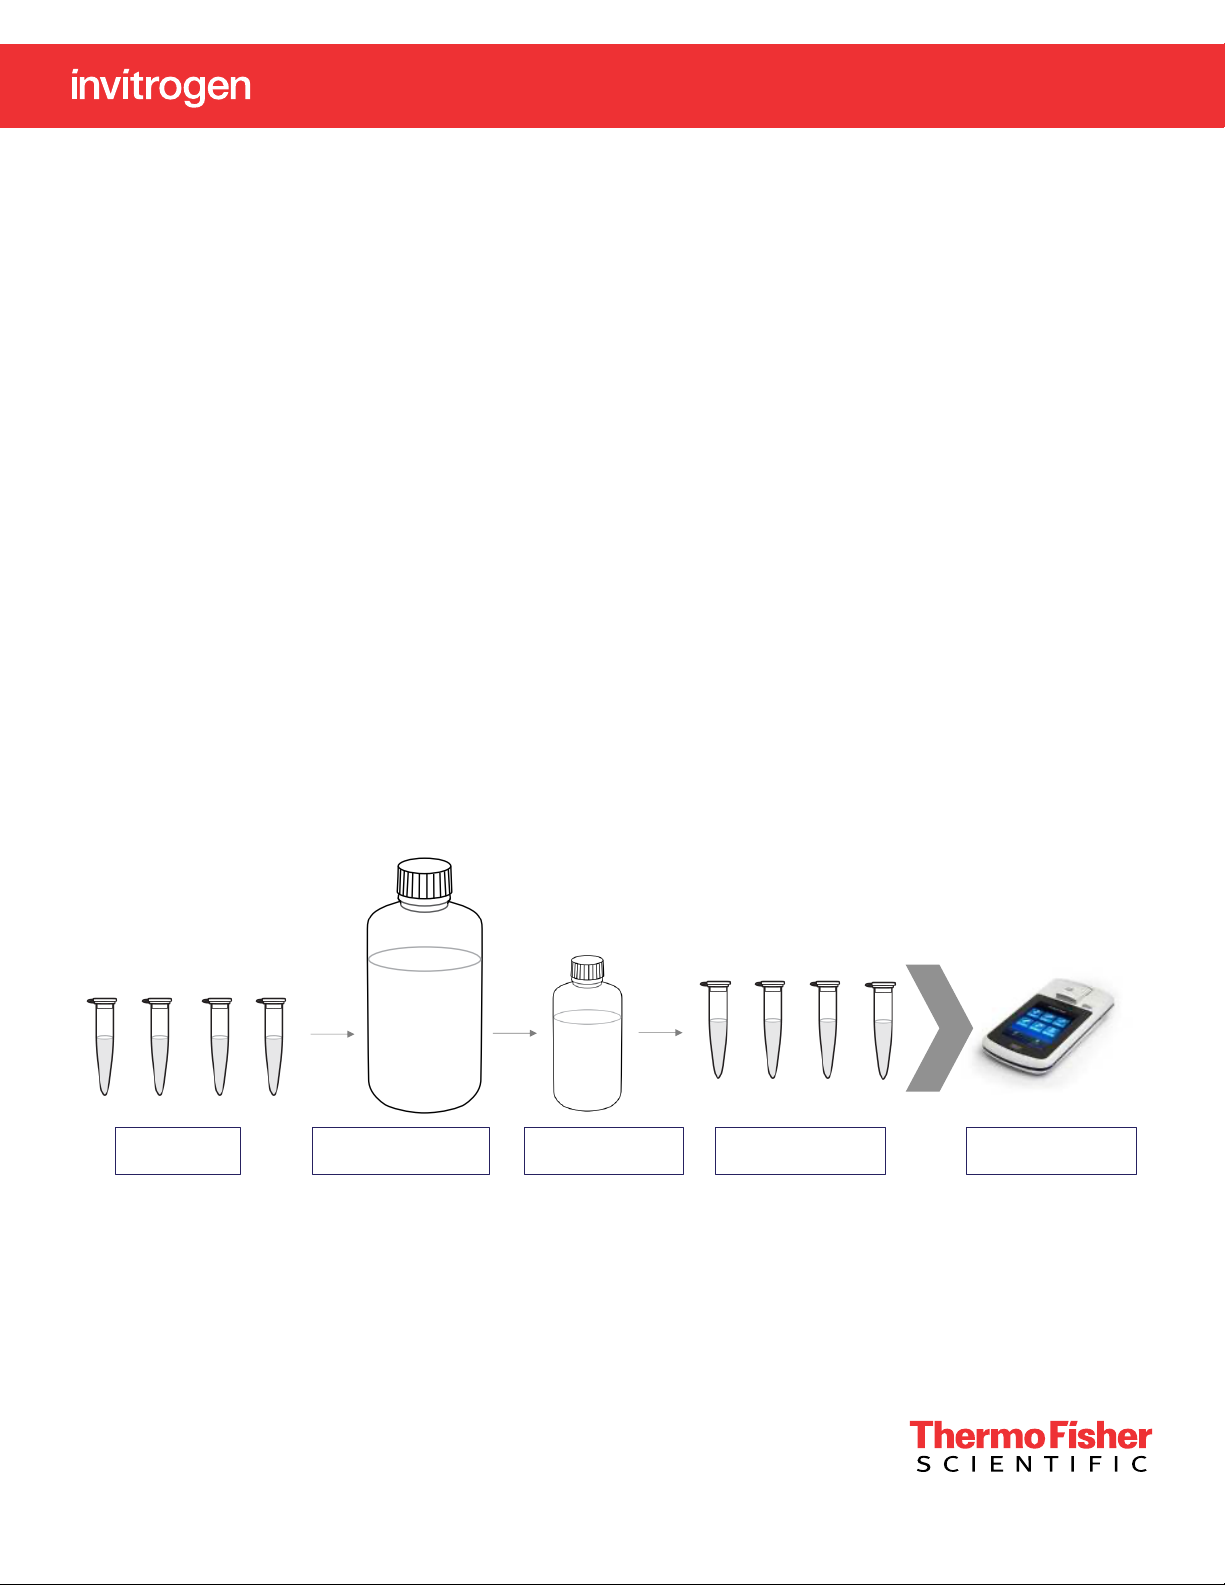
The assay is easy to perform and only requires a 10 minute
incubation at room temperature (RT), eliminating the need
to wait for long incubation periods or expose samples to
elevated temperatures. The assay protocol, seen in Figure
1, is easy to set up with just two standards to prepare,
unlike traditional assays that typically require a 7-point
standard curve for quantitation.
Here we demonstrate the utility of the Qubit Protein BR
Assay and compare it with many well-known assays used
for protein quantitation.
Mix and vortex for 5 sec
Final volume is 200 µL
Step 1: Prepare
assay tubes
Figure 1. Qubit Protein BR Assay protocol.
Step 2: Add Protein
BR Assay Buer
Step 3: Add Protein
BR Reagent
Step 4: Incubate for
10 min at RT
Step 5: Read samples
Page 2
Key features
0
1,000
2,00 0
3,000
4,000
5,000
6,000
7,000
0.0
1.0
2.0
3.0
4.0
5.0
6.0
7.0
0 5,000 10,000 15,000 20,000 25,000
RFU
Absorbance
Sample concentration (µg/mL)
Qubit Protein BR Assay
Bradford
BCA
HepG2
HepG2
• Rapid assay with only 2 standards to prepare and
10 min incubation
• Compatible with detergents and reducing agents
• Broad dynamic range, 100–20,000 µg/mL
Broad dynamic range
One of the major advantages of using the Qubit Protein
BR Assay is its broad dynamic range in comparison to
standard colorimetric protein assays. The broad linear
response allows accurate determination of unknown protein
concentrations and provides a higher dynamic range than
other standard protein assays (Figure 2). The Qubit Protein
BR Assay can be used to detect protein concentrations
from 100 to 20,000 µg/mL, allowing most samples to
be used neat (undiluted), eliminating the guesswork and
dilution steps that accompany standard protein quantitation
methods.
Accurate protein determination
The Qubit Protein BR Assay provides accurate protein
quantitation with low protein-to-protein variability as
compared to traditional assays such as the Bradford assay.
Proteins are diverse in their composition and structure, and
dierences in amino acid sequence, isoelectric point (pI),
secondary structure, and side chains or prosthetic groups
can result in variation in the quantitated concentration.
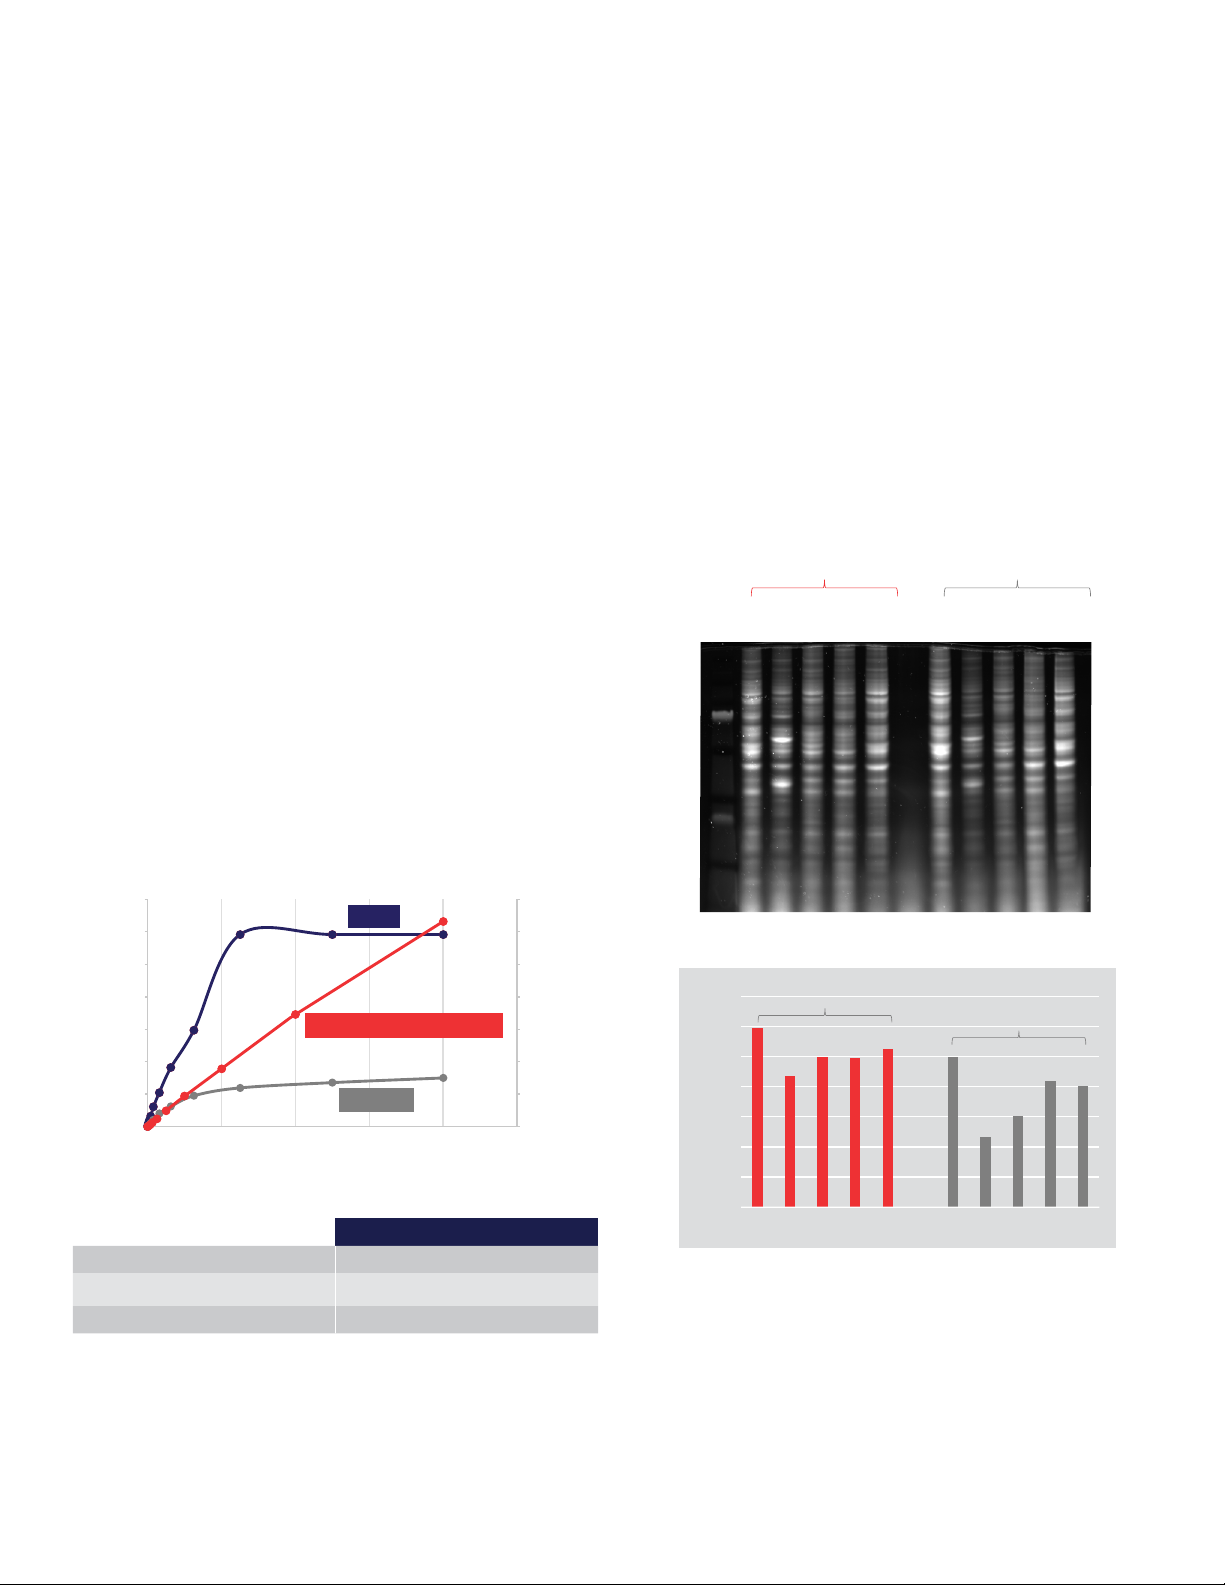
To demonstrate the accuracy and low protein-to-protein
variability of the Qubit Protein BR Assay, several dierent
cell lysates were generated, and total protein concentration
was determined with the Qubit Protein BR Assay and
a Bradford protein assay. Based on the calculated
concentrations, the amount of each lysate containing 10
µg of protein was loaded onto a protein gel. The accuracy
of the total protein loads was evaluated using Invitrogen™
No-Stain™ Protein Labeling Reagent in combination with
lane normalization analysis on an Invitrogen™ iBright™
FL1500 Imaging System. The load variation produced
by the Qubit Protein BR Assay was relatively low, with
a coecient of variation (CV) of 11%, whereas the load
variation produced by the Bradford assay was 2.5 times
higher, with a CV of 28% (Figure 3).
A
Protein BR Assay
Lysate
293T
10 µg protein loads
A549
HepG2
HeLa
iPSC
Bradford assay
293T
A549
HepG2
HeLa
iPSC
a Working range
Qubit Protein BR Assay 100–20,000 µg/mL
BCA Assay 20–2,000 µg/mL
Bradford Assay 125–1,500 µg/mL
Figure 2. Standard curves for protein quantitation assays. Purified
bovine serum albumin (BSA) in 0.9% saline (0–20 mg/mL) was used to
generate standard curves for the Qubit Protein BR Assay (red), Thermo
Scientific
Assays were conducted following the manufacturers’ protocols. The BCA
and Bradford assays were performed in microplate format.
™
Pierce™ BCA Protein Assay (blue), and the Bradford assay (gray).
B
1.4 0
1.2 0
1.0 0
0.80
0.60
0.40
Normalization factor
0.20
0.00
293T
Figure 3. Accurate determination of protein load from complex
protein mixtures. The Qubit Protein BR Assay and a standard Bradford
assay were used to determine the protein concentration of lysates from
several mammalian cell types: 293T, A549, HepG2, HeLa, and iPSCs.
Lysates were separated on an Invitrogen
Mini Protein Gel and labeled with No-Stain Protein Labeling Reagent.
(A) Gel image was acquired on the iBright FL1500 Imaging System, and
(B) normalization factors were determined using the Invitrogen
Analysis Software.
Total lane normalization
CV: 11%
iPSC
A549
HeLa
™
NuPAGE™ 4–12% B i s-Tris
293T
CV: 28%
A549
HeLa
iPSC
™
iBright™
Page 3

Reagent compatibility
The Qubit Protein BR Assay has a unique advantage over
other standard protein quantitation assays such as the BCA
and Bradford assays—it is compatible with samples that
contain up to 5% detergent and compatible with commonly
used reducing agents. The Qubit Protein BR Assay can be
performed with many of the commonly used buers and
tolerates contaminants found in typical protein analysis
buers. Table 1 presents a summary of the substances
tested and their compatible concentrations. Table 2
provides the formulations of the buers tested.
Qubit quantitation platform—fast and easy to use
The Qubit Protein BR Assay is optimized for the Invitrogen™
Qubit™ 4 Fluorometer. The Qubit 4 Fluorometer provides
the combination of a user-friendly fluorometer and
capability to run highly sensitive fluorescence-based
quantitation assays. The Qubit 4 Fluorometer is a small,
economical instrument designed to work seamlessly with
Invitrogen™ Qubit™ assay kits for routine protein, DNA,
and RNA quantitation. All settings and calculations are
performed directly on the instrument. The system is simple,
fast, and easy to use, yet enables consistently accurate
results for subsequent applications. Only small sample
volumes of 1–20 μL are required for all assays.
Assay setup
Results
Table 1. Assay compatibility with common buer components.
Contaminant
β-Mercaptoethanol 1 mM
Acetonitrile 20%
Ammonium sulfate 200 mM
Bicine 100 mM
Borate (50 mM), pH 8.5 Undiluted
B-PER Reagent Undiluted
CHAPS 5%
Carbonate-bicarbonate Undiluted
Dithiothreitol (DTT) 5 mM
DMSO 10%
EDTA 50 mM
Glucose 1 M
Glycerol 10%
Guanidine-HCl 4 M
Imidazole 200 mM
I-PER Reagent Undiluted
Mem-PER Protein Extraction Reagent Undiluted
MES 125 mM
MOPS 10 0 mM
M-PER Reagent Undiluted
NE-PER (CER) Reagent Undiluted
NE-PER (NER) Reagent Undiluted
NP-40 5%
Phosphate-buered saline (PBS), pH 7.4 Undiluted
PMSF 1 mM
RI PA Undiluted
SDS 5%
Sodium acetate 100 mM
Sodium chloride 5 M
Sucrose 20%
T-PER Tissue Protein Extraction Reagent Undiluted
Tricine 50 mM
Tris-buer saline (TBS) Undiluted
Tris-glycine, pH 8.0 Ø*
Tris-glycine SDS, pH 8.3 Ø*
Tris-HCl 500 mM
Tris-HEPES SDS, pH 8.0 Undiluted
Triton X-100 5%
Twe e n 20 3%
Urea 3 M
Y-PER Yeast Protein Extraction Reagent Ø*
Pierce GPCR Extraction and Stabilization Reagent 50%
Pierce Cell Surface Protein Isolation Kit Undiluted
* Ø denotes incompatibility at the lowest concentration tested.
Concentration in
sample buer
Figure 4. User interface for the Qubit Protein BR Assay on the
Qubit 4 Fluorometer.
Table 2. Buer formulations used in compatibility testing.
Buer Formulation
Sodium carbonatebicarbonate
PBS 100 mM sodium phosphate, 150 mM NaCl, pH 7.2
RIPA buer
TBS 25 mM Tris, 150 mM NaCl, pH 7.4
Tris-glycine 25 mM Tris, 192 mM glycine, pH 8.0
Tris-glycine-SDS 25 mM Tris, 192 mM glycine, 0.1% SDS, pH 8.3
Tris-HEPES-SDS 100 mM Tris, 100 mM HEPES, 3 mM SDS
0.2 M sodium carbonate-bicarbonate, pH 9.4
25 mM Tris, 150 mM NaCl, 1% DOC, 1% NP-40,
0.1% SDS, pH 7.6
Page 4

Methods
Qubit Protein BR Assay
For each standard or sample, 20 µL was dispensed in
replicate into 0.5 mL thin-walled PCR tubes. To each assay
tube, 150 µL of Qubit Protein BR Assay Buer was added,
followed by the addition of 30 µL of Qubit Protein BR Assay
Reagent. The assay tubes were immediately vortexed for
5–7 sec after the addition of the Qubit Protein BR Assay
Reagent and incubated at RT for 10 min. Assay tubes were
read on the Qubit 4 Fluorometer.
the manufacturer’s instructions in a microplate format.
An amount of each lysate containing 10 µg of protein was
separated on an Invitrogen™ Nu PAGE™ Bis-Tris 4 –12% g e l
(Cat. No. NP0321BOX) following the protein assays. The gel
was labeled with No-Stain Protein Labeling Reagent (Cat.
No. A44449) according to the manufacturer’s instructions.
The labeled gel was imaged on an iBright FL1500 Imaging
System, and data were analyzed using cloud-based iBright
Imaging Analysis Software.
Gel loading accuracy
Lysates from 293T, A549, HepG2, HeLa, and iPSC
mammalian cell lines were grown to 80% confluency. Cells
were lysed with Thermo Scientific™ M-PER™ Mammalian
Protein Extraction Reagent containing Thermo Scientific™
Halt™ Protease Inhibitor Cocktail (Cat. No. 78439). The
protein concentration of each lysate was determined using
the Qubit Protein BR Assay and a standard Bradford assay.
The Qubit Protein BR Assay was performed as described
above. The Bradford assay was performed according to
Reagent compatibility
The Qubit Protein BR Assay was performed as described
above with samples of 1,000 μg/mL of BSA containing
commonly used buers and contaminants. Assays were
performed in triplicate, and RFU values were compared
to those of BSA in 0.9% saline, 0.05% sodium azide.
The assay was considered compatible with the tested
substance at the indicated concentration if there was less
than 10% error in the protein concentration estimation in
the presence of the substance.
Ordering information
Product Initial sample concentration Quantitation range Quantity Cat. No.
Protein kits
Qubit Protein BR Assay Kit 100 µg/mL–20 mg/mL 1–400 µg
Qubit Protein Assay Kit 12.5 μg/mL–5 mg/mL 0.25–5 μg
DNA kits
Qubit ssDNA Assay Kit 50 pg/μL–200 ng/μL 1–200 ng 100 assays Q10212
Qubit dsDNA BR Assay Kit 100 pg/μL–1,000 ng/μL 2–1,000 ng
Qubit dsDNA HS Assay Kit 10 p g/μL–100 ng /μ L 0.2–100 ng
Qubit 1X dsDNA BR Assay Kit 200 pg/μL–4,000 ng/μL 4–4,000 ng
Qubit 1X dsDNA HS Assay Kit 10 p g/μL–100 ng /μ L 0.2–10 0 ng
RNA kits
Qubit RNA BR Assay Kit 1 ng/μL–1,000 ng /μL 20–1,000 ng
Qubit RNA HS Assay Kit 250 pg/μL–100 ng /μL 5–100 ng
Qubit RNA XR Assay Kit 1 ng/μL–8 μg/μL 20 ng–8 μg
Qubit microRNA Assay Kit 50 pg/µL–100 ng/µ L 1–100 ng
Qubit RNA IQ Assay Kit NA NA
Instruments and accessories
Qubit 4 Fluorometer with Wi-Fi 1 instrument Q33238
Qubit 4 Protein BR Starter Kit 1 kit A512 92
Qubit Assay Tubes 500 tubes Q32856
Qubit 4 Quantitation Starter Kit, with Wi-Fi 1 kit Q33239
100 assays A50668
500 assays A50669
100 assays Q3 3 2 11
500 assays Q3 32 12
100 assays Q32850
500 assays Q32853
100 assays Q32851
500 assays Q32854
100 assays Q33265
500 assays Q33266
100 assays Q33230
500 assays Q33231
100 assays Q10210
500 assays Q1 0 211
100 assays Q32852
500 assays Q32855
100 assays Q33223
500 assays Q33224
100 assays Q32880
500 assays Q32881
75 assays Q3 3221
275 assays Q33222
Find out more at thermofisher.com/qubit
For Research Use Only. Not for use in diagnostic procedures. © 2021 Thermo Fisher Scientific Inc. All rights reserved.
All trademarks are the proper ty of Thermo Fisher Scienti fic and its subsidiaries unless otherwise specified. Triton is a trademark of Union
Carbide Corporation. Tween is a trademark of Croda Americas, Inc. COL24844 0321
 Loading...