

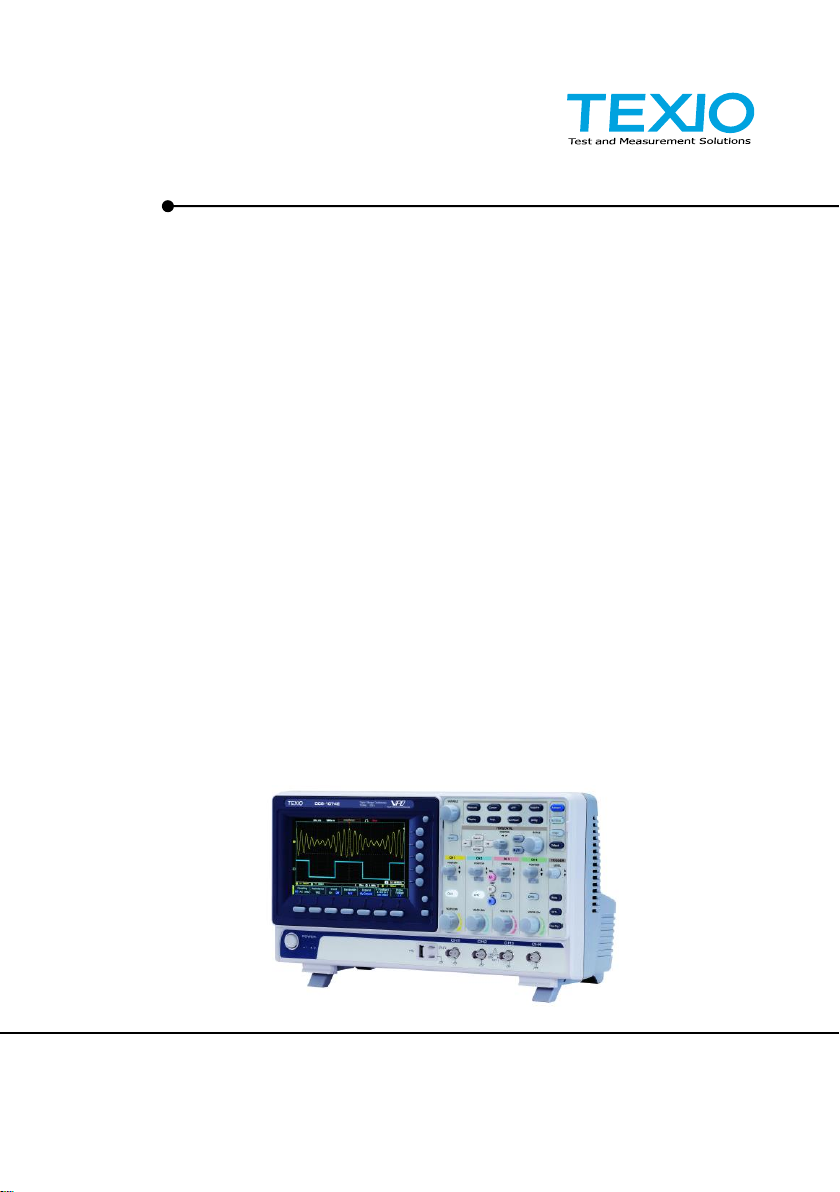
DIGITAL STORAGE OSCILLOSCOPE
DCS-1000B SERIES
DCS-1072B
DCS-1102B
DCS-1054B
DCS-1074B
DCS-1104B
INSTRUCTION MANUAL
B71-0463-01

■ About a trademark, a registered trademark
A company name and the brand name mentioned in this instruction
manual are the trademark or the registered trademark of each
company or group in each country and region.
■ About this instruction manual
When copying the part or all of contents of this instruction manual,
seek the copyright holder.
In addition, the specifications of the product and the contents of
this instruction manual are subject to change without notice for
improvement. Please check to our website for the latest version.
This manual is the contents as of May 2018.
■ About export
When export or ship the product to overseas, please confirm laws
and regulations about the export.

Table of Contents
USING THE PRODUCT SAFELY...................................................Ⅰ-Ⅴ
1. GETTING STARTED ................................................................... 1
1-1. Main Features ...................................................................... 1
1-2. Accessories .......................................................................... 3
Panel Overview ........................................................................... 4
1-2-1. Front Panel ........................................................................................ 4
1-2-2. Rear Panel ........................................................................................ 9
1-2-3. Display............................................................................................. 10
1-3. Set Up ................................................................................ 11
1-3-1. Tilt Stand ......................................................................................... 11
1-3-2. Power Up ......................................................................................... 12
1-3-3. First Time Use ................................................................................. 12
1-3-4. How to Use This Manual ................................................................. 14
1-4. Built-in Help ....................................................................... 18
2. MEASUREMENT ...................................................................... 19
2-1. Basic Measurement ............................................................ 19
2-1-1. Channel Activation .......................................................................... 19
2-1-2. Autoset ............................................................................................ 20
2-1-3. Run/Stop ......................................................................................... 21
2-1-4. Horizontal Position/Scale................................................................. 22
2-1-5. Vertical Position/Scale ..................................................................... 23
2-2. Automatic Measurement ...................................................... 24
2-2-1. Measurement Items ......................................................................... 24
2-2-2. Add Measurement ........................................................................... 27
2-2-3. Remove Measurement .................................................................... 28
2-2-4. Gated mode ..................................................................................... 29
2-2-5. Display All mode .............................................................................. 29
2-2-6. High Low Function ........................................................................... 30
2-2-7. Statistics .......................................................................................... 31
2-2-8. Reference Levels ............................................................................ 33
2-3. Cursor Measurement .......................................................... 34
2-3-1. Use Horizontal Cursors ................................................................... 34
2-3-2. Use Vertical Cursors ....................................................................... 36
2-4. Math Operation ................................................................... 39
2-4-1. Basic Math Overview & Operators .................................................. 39
2-4-2. FFT Overview & Window Functions ................................................ 41
2-4-3. Advanced Math Overview ................................................................ 43
2-4-4. Advanced Math Operation ............................................................... 44
3. CONFIGURATION .................................................................... 46
3-1. Acquisition ......................................................................... 46
3-1-1. Select Acquisition Mode .................................................................. 46
3-1-2. Show Waveform in XY Mode ........................................................... 47
3-1-3. Set the Record Length..................................................................... 49
3-2. Segmented Memory Acquisition (Option) .............................. 49
3-2-1. Segments Display ........................................................................... 51
3-2-2. Set the Number of Segments .......................................................... 51

3-2-3. Run Segmented Memory................................................................. 52
3-2-4. Navigate Segmented Memory ......................................................... 53
3-2-5. Play Through Each Segment ........................................................... 54
3-2-6. Segment Measurement ................................................................... 54
3-2-7. Automatic Measurement.................................................................. 54
3-2-8. Segment Info ................................................................................... 57
3-2-9. Save Segment ................................................................................. 57
3-3. Display ............................................................................... 60
3-3-1. Display Waveform as Dots or Vectors ............................................. 60
3-3-2. Set the Level of Persistence ............................................................ 60
3-3-3. Set the Intensity Level ..................................................................... 61
3-3-4. Select Display Graticule .................................................................. 62
3-3-5. Freeze the Waveform (Run/Stop) .................................................... 62
3-3-6. Turn Off Menu ................................................................................. 63
3-4. Horizontal View .................................................................. 63
3-4-1. Move Waveform Position Horizontally ............................................. 63
3-4-2. Select Horizontal Scale ................................................................... 64
3-4-3. Select reference point of the horizontal expansion .......................... 64
3-4-4. Select Waveform Update Mode ....................................................... 65
3-4-5. Zoom Waveform Horizontally .......................................................... 65
3-4-6. Play/Pause ...................................................................................... 67
3-5. Vertical View (Channel) ....................................................... 69
3-5-1. Move Waveform Position Vertically ................................................. 69
3-5-2. Select Vertical Scale ....................................................................... 69
3-5-3. Select Coupling Mode ..................................................................... 70
3-5-4. Input Impedance .............................................................................. 70
3-5-5. Invert Waveform Vertically ............................................................... 70
3-5-6. Limit Bandwidth ............................................................................... 71
3-5-7. Expand by Ground/Center ............................................................... 71
3-5-8. Select Probe Type ........................................................................... 72
3-5-9. Select Probe Attenuation Level ....................................................... 73
3-5-10. Set the Deskew ............................................................................. 73
3-6. Bus Key Configuration(Option) ............................................ 74
3-6-1. Bus Display ..................................................................................... 74
3-6-2. Serial Bus ........................................................................................ 75
3-6-3. Threshold Configuration .................................................................. 82
3-7. Trigger ............................................................................... 89
3-7-1. Trigger Type Overview .................................................................... 89
3-7-2. Trigger Parameter Overview ........................................................... 91
3-7-3. Setup Holdoff Level ......................................................................... 94
3-7-4. Setup Trigger Mode ......................................................................... 95
3-7-5. Using the Edge Trigger.................................................................... 95
3-7-6. Using Advanced Delay Trigger ........................................................ 96
3-7-7. Using Pulse Width Trigger ............................................................... 97
3-7-8. Using Video Trigger ......................................................................... 98
3-7-9. Pulse Runt trigger ............................................................................ 99
3-7-10. Using Rise and Fall Trigger ......................................................... 100
3-7-11. Using the Timeout Trigger ........................................................... 101

3-7-12. Using the Bus Trigger (Option) .................................................... 102
3-7-13. Bus Trigger Mode ........................................................................ 109
3-8. Search (Option) ................................................................. 110
3-8-1. Configuring Search Events ............................................................ 110
3-8-2. Copying Search Event To/From Trigger Events ............................ 111
3-8-3. Search Event Navigation ............................................................... 112
3-8-4. Save Search Marks ....................................................................... 112
3-8-5. Setting/Clearing Single Search Events .......................................... 113
3-8-6. FFT Peak ....................................................................................... 113
3-9. System Settings and Miscellaneous Settings ....................... 116
3-9-1. Select Menu Language.................................................................. 116
3-9-2. View System Information ............................................................... 116
3-9-3. Erase Memory ............................................................................... 117
3-9-4. Probe Compensation Frequency ................................................... 117
4. Applications ............................................................................ 118
4-1. Overview ................................................................ ........... 118
4-2. Running Applications ......................................................... 118
4-3. Using Go-NoGo ................................................................. 119
4-4. Using the DVM (Option) ..................................................... 123
4-5. Using the Data Logger (Option) .......................................... 124
4-6. Using the Digital Filter (Option) .......................................... 126
4-7. Remote Disk ...................................................................... 127
5. SAVE/RECALL ........................................................................ 130
5-1. File Format/Utility .............................................................. 130
5-1-1. Image File Format ......................................................................... 130
5-1-2. Waveform File Format ................................................................... 130
5-1-3. Spreadsheet File Format ............................................................... 131
5-1-4. Setup File Format .......................................................................... 132
5-2. Create/Edit Labels ............................................................. 134
5-3. Save ................................................................................. 136
5-3-1. File Type/Source/Destination ........................................................ 136
5-3-2. Save Image ................................................................................... 136
5-3-3. Save Waveform ............................................................................. 138
5-3-4. Save Setup .................................................................................... 139
5-4. Recall ............................................................................... 141
5-4-1. File Type/Source/Destination ........................................................ 141
5-4-2. Recall Default Panel Setting .......................................................... 141
5-4-3. Recall Waveform ........................................................................... 143
5-4-4. Recall Setup .................................................................................. 144
5-5. Reference Waveforms ........................................................ 145
5-5-1. Recall and Display Reference Waveforms .................................... 145
6. FILE UTILITIES ...................................................................... 147
6-1-1. File Navigation ............................................................................... 147
6-1-2. Create Folder ................................................................................ 148
6-1-3. Rename File .................................................................................. 149
6-1-4. Delete File or Folder ...................................................................... 150
6-1-5. Copy File to USB ........................................................................... 150
6-1-6. Installing Optional Apps and Functions ......................................... 151

7. HARDCOPY ............................................................................ 152
7-1-1. Printer I/O Configuration ................................................................ 152
7-1-2. Print Output ................................................................................... 152
7-1-3. Save - Hardcopy Key..................................................................... 153
8. REMOTE CONTROL ............................................................... 155
8-1-1. Configure USB Interface................................................................ 155
8-1-2. Configure the Ethernet Interface ................................................... 155
8-1-3. Configure Socket Server ............................................................... 157
8-1-4. USB Functionality Check ............................................................... 158
8-1-5. Socket Server Functionality Check ................................................ 158
9. MAINTENANCE ...................................................................... 163
9-1-1. How to use SPC function............................................................... 163
9-1-2. Vertical Accuracy Calibration ......................................................... 163
9-1-3. Probe Compensation ..................................................................... 164
10. APPENDIX ............................................................................ 166
10-1. FAQ ................................................................................ 166
10-2. Updating the Firmware ..................................................... 168
10-3. SPECIFICATIONS ............................................................ 169
10-3-1. Model Specifications.................................................................... 169
10-3-2. Common Specifications ............................................................... 169
10-3-3. Probe Specifications .................................................................... 172
10-4. DIMENSIONS .................................................................. 173
USING THE PRODUCT SAFELY
<Pictorial indication>
Some part of this product or the instruction
manual may shows this pictorial indication. In
this case, if the product is incorrectly used in that
part, a serious danger may be brought about on
the user’s body or the product.
To use the part with this pictorial indication, be
sure to refer to this instruction manual.
WARNING
!
If you use the product, ignoring this indication,
you may get killed or seriously injured. This
indication shows that the warning item to avoid
the danger is provided.
CAUTION
!
If you incorrectly use the product, ignoring this
indication, you may get slightly injured or the
product may be damaged. This indication shows
that the caution item to avoid the danger is
provided.
■ Preface
To use the product safely, read this instruction manual to the end.
Before using this product, understand how to correctly use it.
If you read this manual but you do not understand how to use it, please
ask us or your local dealer. After you read this manual, save it so that
you can read it, anytime as requied.
■ Pictorial indication
This instruction manual and product show the warning and caution items
required to safely use the product. The following pictorial indication and
warning character indication are provided.
Please be informed that we are not responsible for any damages to the user
or to the third person, arising from malfunctions or other failures due to
wrong use of the product or incorrect operation, except such responsibility
for damages as required by law.
I

USING THE PRODUCT SAFELY
WARNING
!
CAUTION
!
■ Do not remove the product’s covers and panels
Never remove the product’s covers and panels for any purpose.
Otherwise, the user’s electric shock or fire may be incurred.
■ Warning on using the product
Warning items given below are to avoid danger to user’s body and life and
avoid the damage or deterioration of the product.
Use the product, observing the following warning and caution items.
■ Warning items on power supply
● Power supply voltage
The rated power supply voltages of the product are 100, 120, 220
and 240VAC. The rated power supply voltage for each product
should be confirmed by reading the label attached on the back of
the product or by the “rated” column shown in this instruction manual.
The specification of power cord attached to the products is rated to
125VAC for all products which are designed to be used in the
areas where commercial power supply voltage is not higher than
125VAC. Accordingly, you must change the power cord if you want
to use the product at the power supply voltage higher than 125VAC.
If you use the product without changing power cord to 250VAC
rated one, electric shock or fire may be caused.
When you used the product equipped with power supply voltage
switching system, please refer to the corresponding chapter in the
instruction manuals of each product.
● Power cord
(Important) The attached power cord set can be used for this
device only.
If the attached power cord is damaged, stop using the product and
call us or your local dealer. If the power cord is used without the
damage being removed, an electric shock or fire may be caused.
● Protective fuse
If an input protective fuse is blown, the product does not operate. For a
product with external fuse holder, the fuse may be replaced. As for
how to replace the fuse, refer to the corresponding chapter in this
instruction manual.
If no fuse replacement procedures are indicated, the user is not
permitted to replace it. In such case, keep the case closed and
consult us or your local dealer. If the fuse is incorrectly replaced, a
fire may occur.
II

USING THE PRODUCT SAFELY
■ Warning item on Grounding
If the product has the GND terminal on the front or rear panel surface,
be sure to ground the product to safely use it.
■ Warnings on Installation environment
● Operating temperature and humidity
Use the product within the operating temperature indicated in the
“rating” temperature column. If the product is used with the vents of
the product blocked or in high ambient temperatures, a fire may occur.
Use the product within the operating humidity indicated in the “rating”
humidity column. Watch out for condensation by a sharp humidity
change such as transfer to a room with a different humidity. Also, do
not operate the product with wet hands. Otherwise, an electric shock
or fire may occur.
● Use in gas
Use in and around a place where an inflammable or explosive gas or
steam is generated or stored may result in an explosion and fire. Do
not operate the product in such an environment.
Also, use in and around a place where a corrosive gas is generated or
spreading causes a serious damage to the product. Do not operate
the product in such an environment.
● Installation place
Avoid installing the product on inclined places or on places subject to
vibration. Otherwise, the product may slip or fall down to cause
damages or injury accidents.
■ Do not let foreign matter in
Do not insert metal and inflammable materials into the product from its
vent and spill water on it. Otherwise, electric shock or fire may occur.
■ Warning item on abnormality while in use
In abnormal situations, such as “smoke”, “fire”, “abnormal smell” or
“irregular noise” occur from the product while in use, stop using the
product, turn off the switch, and remove the power cord plug from the
outlet. After confirming that no other devices catch fire, ask us or your
local dealer.
III
USING THE PRODUCT SAFELY
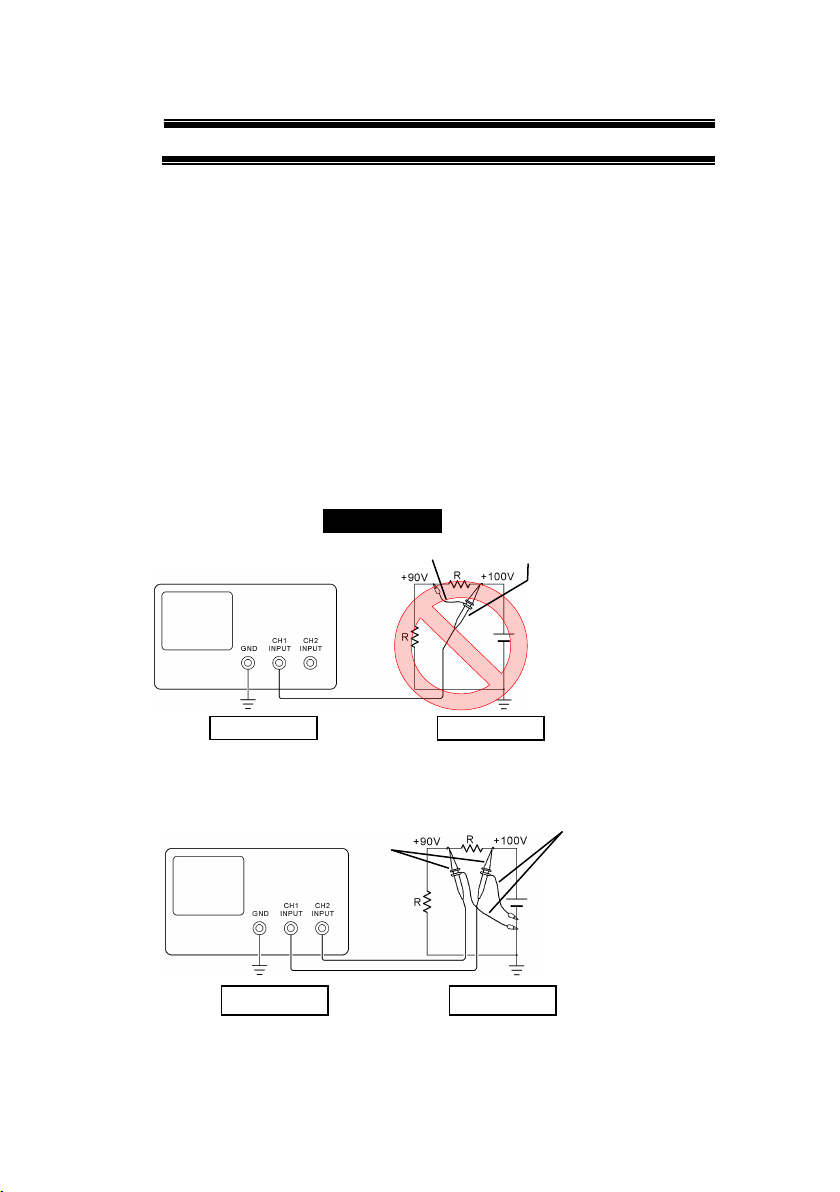
At connecting as Bad
Example, +90V and chassis
are shorted, and damages
substance a measured.
Therefore do not make such
connection.
If the instrument is not
grounded, a potential of the
chassis is +90V.
Ground a chassis, in order to
prevent an electric shock
accident.
Setting of panel switches of an
oscilloscope
CH2 INV: ON (CH2 inverted)
ADD : ON (CH1+CH2)
Grounding
Oscilloscope
Earth Lead
Probe
Grounding
Oscilloscope
Grounding
Grounding
Earth Lead
Probe
■ Warning Item for the Measurement
● When you measure a part of a high voltage, be careful not to touch a
hand to a measurement part directly. There is a risk of an electric shock.
● Be sure to connect the probe or the cable and the ground side of the input
connector to the ground potential (ground) of the substance measured.
Since the chassis of this instrument is connected to the ground of the
input block, connecting the earth lead of the probe to the potential
floating from the ground potential may result in the following:
Electric shock
A high current flows and damages the substance measured, this
instrument, and other connected device.
The following parts are connected to the chassis:
Probe for each channel and ground side of the input BNC connector
Grounding conductor of the accessory 3-core power cord
Ground pin for an interface signal
“Bad example” Prohibition
When measuring the floating potential, a differential method of
measurement is recommended ( refer to the figure below ).
“Good example”
IV

USING THE PRODUCT SAFELY
■ Input / Output terminals
Maximum input to terminal is specified to prevent the product
from being damaged. Do not supply input, exceeding the
specifications that are indicated in the "Rating" column in the
instruction manual of the product.
Also, do not supply power to the output terminals from the
outside.
Otherwise, a product failure is caused.
■ Calibration
Although the performance and specifications of the product are
checked under strict quality control during shipment from the factory,
they may be deviated more or less by deterioration of parts due to their
aging or others.
It is recommended to periodically calibrate the product so that it is used
with its performance and specifications stable.
For consultation about the product calibration, ask us or your local
dealer.
■ Daily Maintenance
When you clean off the dirt of the product covers, panels, and
knobs, avoid solvents such as thinner and benzene. Otherwise, the
paint may peel off or resin surface may be affected.
To wipe off the covers, panels, and knobs, use a soft cloth with neutral
detergent in it. During cleaning, be careful that water, detergent, or
other foreign matters do not get into the product.
If a liquid or metal gets into the product, an electric shock and fire are
caused. During cleaning, remove the power cord plug from the outlet.
Use the product correctly and safely, observing the above warning and
caution items. Because the instruction manual indicates caution items even
in individual items, observe those caution items to correctly use the product.
If you have questions or comments about the instruction manual, ask us or
E-Mail us.
V
Model name
Frequency
bandwidth
Input
channels
Real-time
Sampling Rate
DCS-1054B
50MHz
4
1GSa/s
DCS-1074B
70MHz
4
1GSa/s
DCS-1104B
100MHz
4
1GSa/s
DCS-1072B
70MHz
2
1GSa/s
DCS-1102B
100MHz
2
1GSa/s
Note
This instruction manual has been described as the
4ch model. In 2ch model, Can't set the ch3 and ch4.
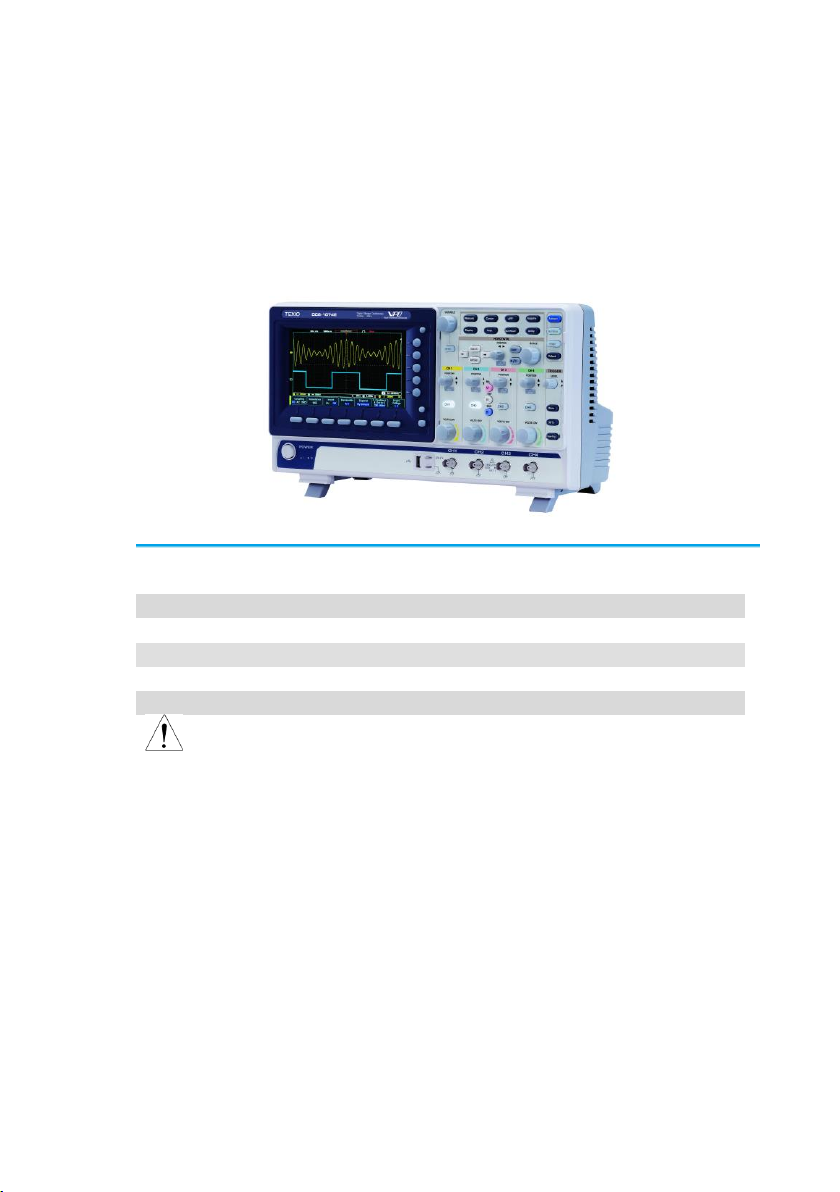
1. GETTING STARTED
This chapter describes the DCS-1000B in a nutshell, including its
main features and front / rear panel introduction. After going through
the overview, follow the Set Up section to properly set up the
oscilloscope for first time use. The Set Up section also includes a
starter on how to use this manual effectively.
1-1. Main Features
1

Features
7 inch, 800 x 480, WVGA TFT display.
Available from 70MHz to 100MHz.
Real-time sampling rate of 1GSa/s.
Deep memory: 10M points record length.
Waveform capture rate of 50,000 waveforms per
second.
Vertical sensitivity: 1mV/div~10V/div.
On-screen Help.
32 MB internal flash disk.
Go-NoGo application.
Remote Disk application.
Additional
Feature
Segmented Memory: Optimizes the acquisition
memory to selectively capture only the
important signal details. Up to 29000 successive
waveform segments can be captured with a
time-tag resolution of 4ns.
Waveform Search: Allows the scope to search
for a number of different signal events.
Serial Bus Decode: Serial bus decoding of
UART, I2C, SPI, CAN & LIN buses.
Interface
USB host port: front panel, for storage devices.
USB device port: rear panel, for remote control
or printing.
Probe calibration output with selectable output
frequency (1kHz ~ 200kHz).
Ethernet port (4ch Model Only)
Calibration output.
2

Standard
Accessories
Part number
Description
Power cord
N/A region dependent
Passive probe
x4 or x2
for 50MHz
/70MHz
Model
GTP-070B-4
70 MHz probe
for 100MHz
Model
GTP-100B-4
100MHz probe
Standard
Apps
Name
Description
Go-NoGo
Go-NoGo testing app.
Remote Disk
Allows the scope to mount a
network share drive.
Optional
Apps
Name
Description
Data Log
Waveform or image data logging
app.
DVM
Digital Volt Meter app.
Digital Filter
High or low pass digital filter for
analog inputs.
Optional
Function
Part number
Description
Segment
Segment memory Function
Search
Search Function
Bus
Bus trigger & analysis Function
Optional
Accessories
Part number
Description
GTC-001
Instrument cart, 470(W)x430(D)mm
(U.S. type input socket)
GTC-002
Instrument cart, 330(W)x430(D)mm
(U.S. type input socket)
GTL-110
test lead, BNC to BNC heads
GTL-246
USB2.0 A - B type cable
Drivers
USB driver
1-2. Accessories
* Note: We reserves the right to change the probe model type at anytime without
notice for probe model types of similar specification.
3
VARIABLE
POSITION
HORIZONTAL
POSITION
POSITION
POSITION
POSITION
VERTICAL
MATH
REF
BUS
TRIGGER
LEVEL
PUSH TO
ZERO
PUSH TO
ZERO
PUSH TO
ZERO
PUSH TO
ZERO
PUSH TO
ZERO
PUSH TO
ZERO
SCALE
POWER
CH1 CH2 CH3 CH4
2V
1MW16pF
Digital Storage Oscilloscope
200 MHz 1 GS/s
Visual Persistence Oscilloscope
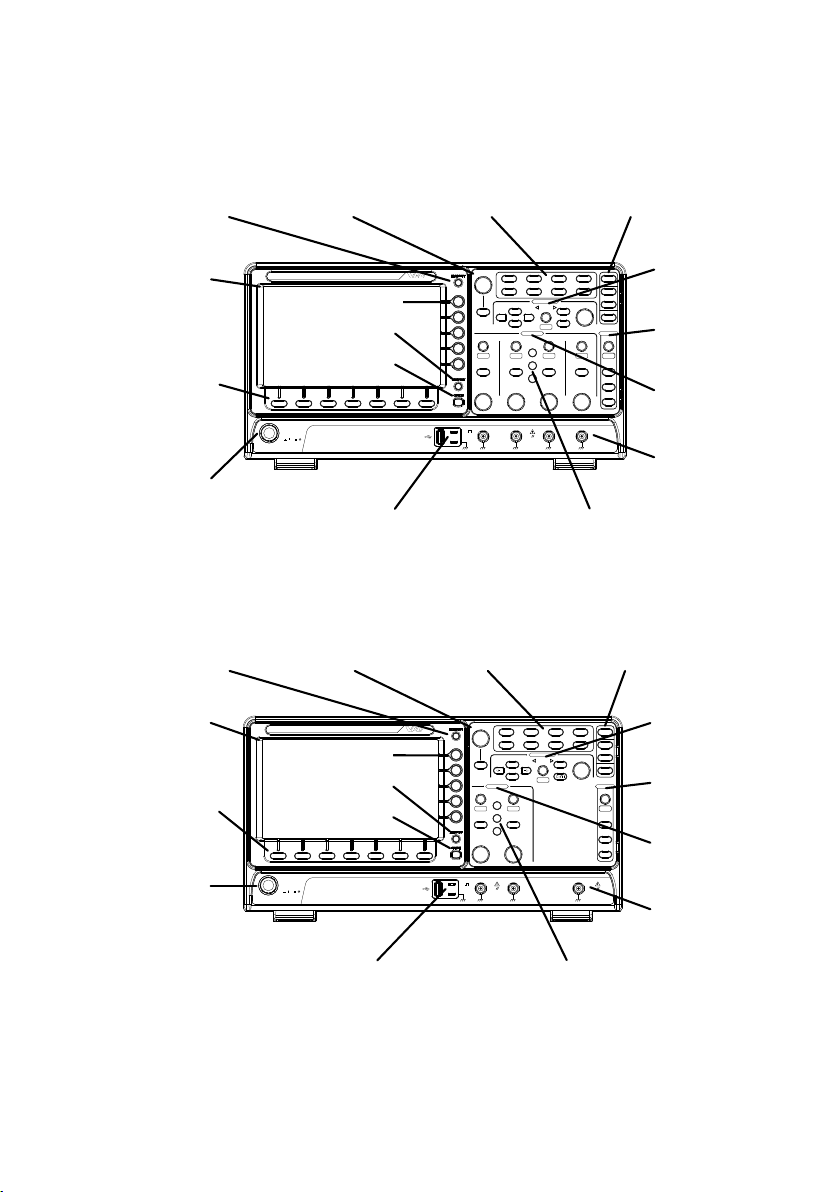
LCD
Variable knob
and Select key
Autoset, Run/Stop, Single
and Default settings
CH1~CH4
Trigger
controls
Function
keys
USB Host port, Probe
Compensation terminals
Power
button
Hardcopy key
Option key
Math, Reference
and Bus keys
Bottom
menu
keys
Horizontal
controls
Menu key
Vertical
controls
Side menu keys
VARIABLE
POSITION
HORIZONTAL
TRIGGER
LEVEL
PUSH TO
ZERO
PUSH TO
ZERO
SCALE
Measure
Display
Cursor
Help
App
Save/Recall
Acquire
Utility
Autoset
Run/Stop
Single
Default
Select
Search
Set/Clear
Zoom
Menu
50 %
Force-Trig
POSITION
POSITION
VERTICAL
MATH
REF
BUS
PUSH TO
ZERO
PUSH TO
ZERO
M
R
B
Digital Storage Oscilloscope
200 MHz 1 GS/s
Visual Persistence Oscilloscope
POWER
CH1 CH2 EXT TRIG
2V
1MW16pF 1MW16pF
LCD
Variable knob
and Select key
Autoset, Run/Stop, Single
and Default settings
CH1~CH2,
EXT TRIG
Trigger
controls
Function
keys
USB Host port, Probe
Compensation terminals
Power
button
Hardcopy key
Option key
Math, Reference
and Bus keys
Bottom
menu
keys
Horizontal
controls
Menu key
Vertical
controls
Side menu keys
Panel Overview
1-2-1. Front Panel
4ch Model
2ch Model
4

LCD Display
7” WVGA TFT color LCD. 800 x 480 resolution,
wide angle view display.
Menu Off Key
Use the Menu Off key to hide the
onscreen menu system.
Option Key
The Option key is used to access
future installed options.
Menu Keys
The side menu and bottom menu keys are used to
make selections from the soft-menus on the LCD
user interface.
To choose menu items, use the 7 Bottom menu
keys located on the bottom of the display panel.
To select a variable or option from a menu, use the
side menu keys on the side of the panel. See page
14 for details.
Digital Storage Oscilloscope
GDS-2202E
200 MHz 1 GS / s
Visual Persistence Oscilloscope
Side menu
keys
Bottom menu keys
Hardcopy Key
The Hardcopy key is a quick-save
or quick-print key, depending on its
configuration.
Variable Knob
and Select Key
Select
VARIABLE
The Variable knob is used to
increase/decrease values or to
move between parameters.
The Select key is used to make
selections.
Function Keys
The Function keys are used to enter and configure
different functions on the DCS-1000B.
Measure
Measure
Configures and runs automatic
measurements.
5
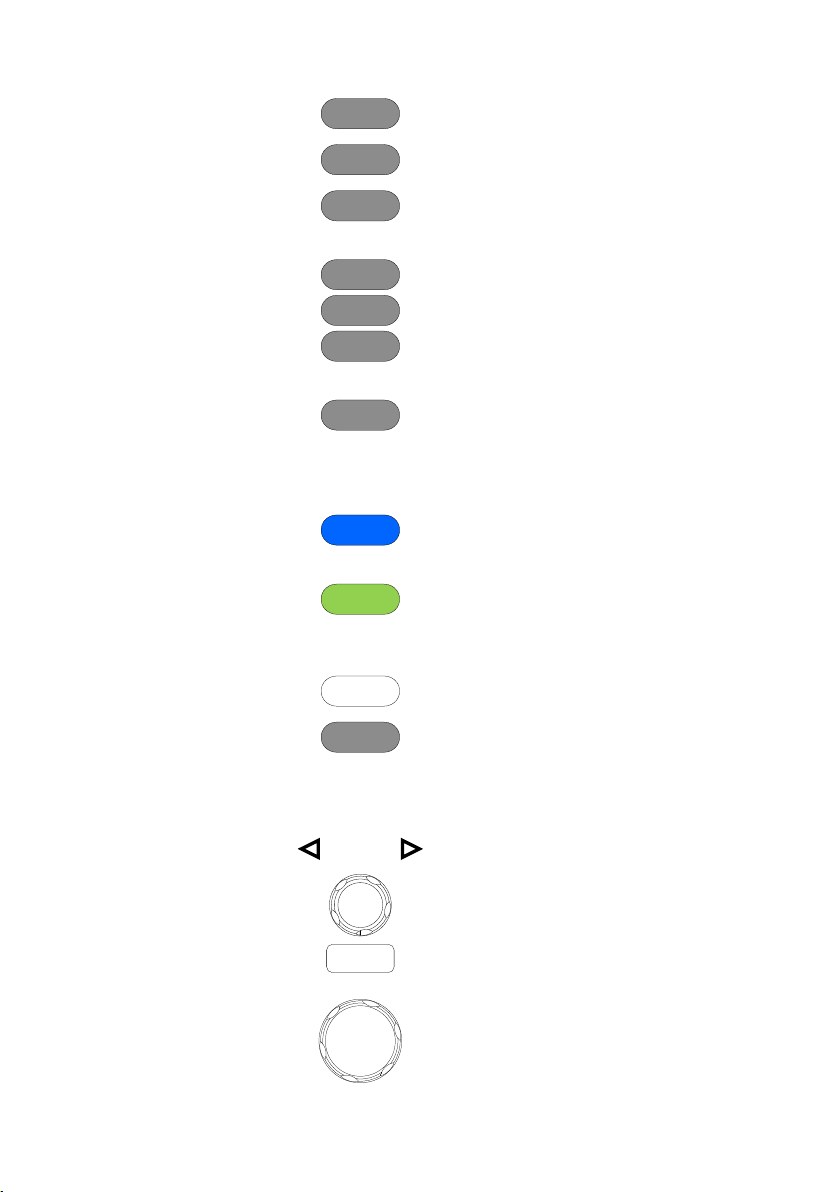
Cursor
Cursor
Configures and runs cursor
measurements.
APP
APP
Configures and runs optional
applications.
Acquire
Acquire
Configures the acquisition mode,
including Segmented Memory
acquisition.
Display
Display
Configures the display settings.
Help
Help
Shows the Help menu.
Save/Recall
Save/Recall
Used to save and recall
waveforms, images, panel
settings.
Utility
Utility
Configures the Hardcopy key,
display time, language, probe
compensation and calibration. It
also accesses the file utilities
menu.
Autoset
Autoset
Press the Autoset key to
automatically set the trigger,
horizontal scale and vertical scale.
Run/Stop Key
Run/Stop
Press to Freeze (Stop) or continue
(Run) signal acquisition. The run
stop key is also used to run or stop
Segmented Memory acquisition .
Single
Single
Sets the acquisition mode to single
triggering mode.
Default Setup
Default
Resets the oscilloscope to the
default settings.
Horizontal
Controls
The horizontal controls are used to change the
position of the cursor, set the time base settings,
zoom into the waveforms and search for events.
Horizontal
Position
POSITION
PUSH TO
ZERO
The Position knob is used to
position the waveforms
horizontally on the display screen.
Pressing the knob will reset the
position to zero.
SCALE
SCALE
The Scale knob is used to change
the horizontal scale (TIME/DIV).
6
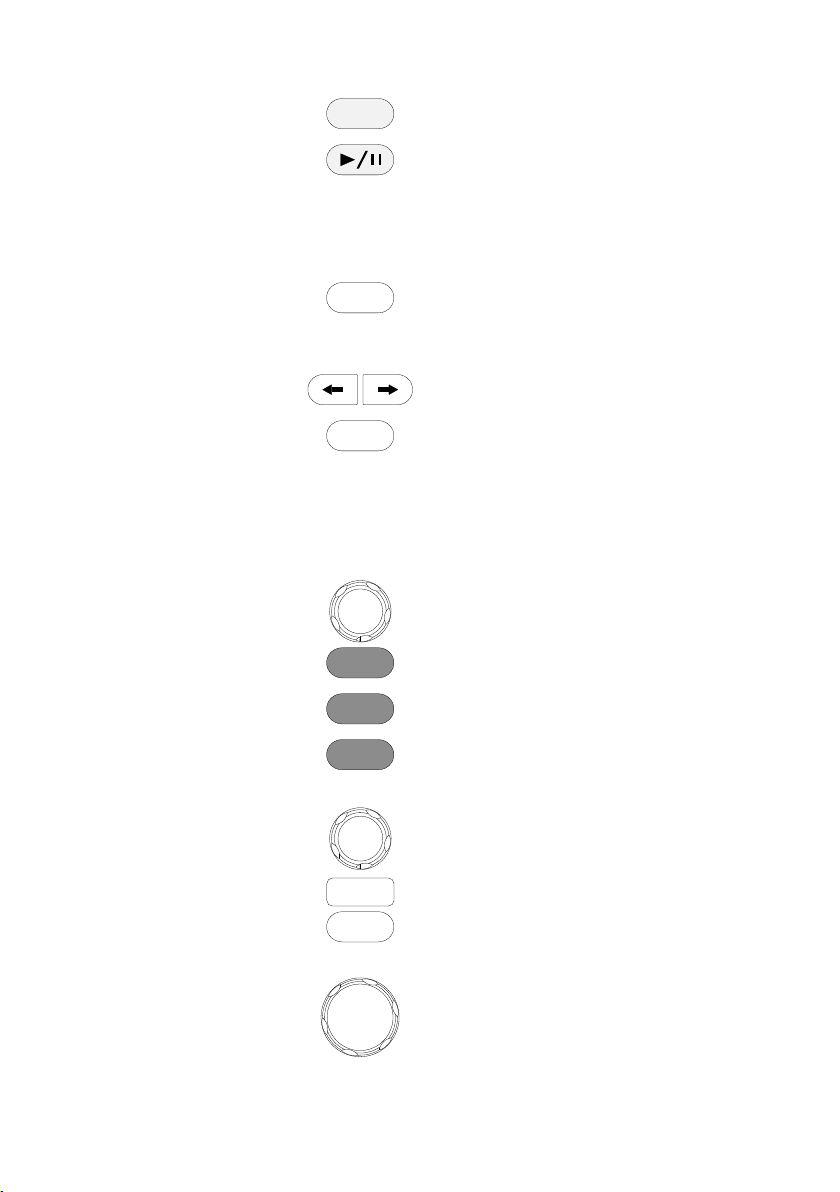
Zoom
Zoom
Press Zoom in combination with
the horizontal Position knob.
Play/Pause
The Play/Pause key allows you to
view each search event in
succession – to effectively “play”
through each search event. It is
also used to play through a
waveform in zoom mode.
Search
Search
The Search key accesses the
search function menu to set the
search type, source and threshold.
(Optional function)
Search Arrows
Use the arrow keys to navigate the
search events. (Optional function)
Set/Clear
Set/Clear
Use the Set/Clear key to set or
clear points of interest when using
the search function.
(Optional function)
Trigger Controls
The trigger controls are used to control the trigger
level and options.
Level Knob
LEVEL
Used to set the trigger level.
Pressing the knob will reset the
level to zero.
Trigger Menu
Key
Menu
Used to bring up the trigger menu.
50% Key
50 %
Sets the trigger level to the half
way point (50%).
Force - Trig
Force-Trig
Press to force an immediate
trigger of the waveform.
Vertical
POSITION
POSITION
PUSH TO
ZERO
Sets the vertical position of the
waveform. Push the knob to reset
the vertical position to zero.
Channel Menu
Key
CH1
Press the CH1~4 key to set and
configure the channel.
VOLTS/DIV
Knob
VOLTS/DIV
Sets the vertical scale of the
channel (VOLTS/DIV).
7
External Trigger
Input
EXT TRIG
Accepts external trigger signals
(page 89). Only on 2 channel
models.
Input impedance: 1MΩ
Voltage input: ±15V(peak), EXT
trigger capacitance:16pF.
Math Key
MATH
M
Use the Math key to set and
configure math functions.
Reference Key
REF
R
Press the Reference key to set or
remove reference waveforms.
BUS Key
BUS
B
The Bus key is used for parallel
and serial bus (UART, I2C, SPI,
CAN, LIN) configuration.
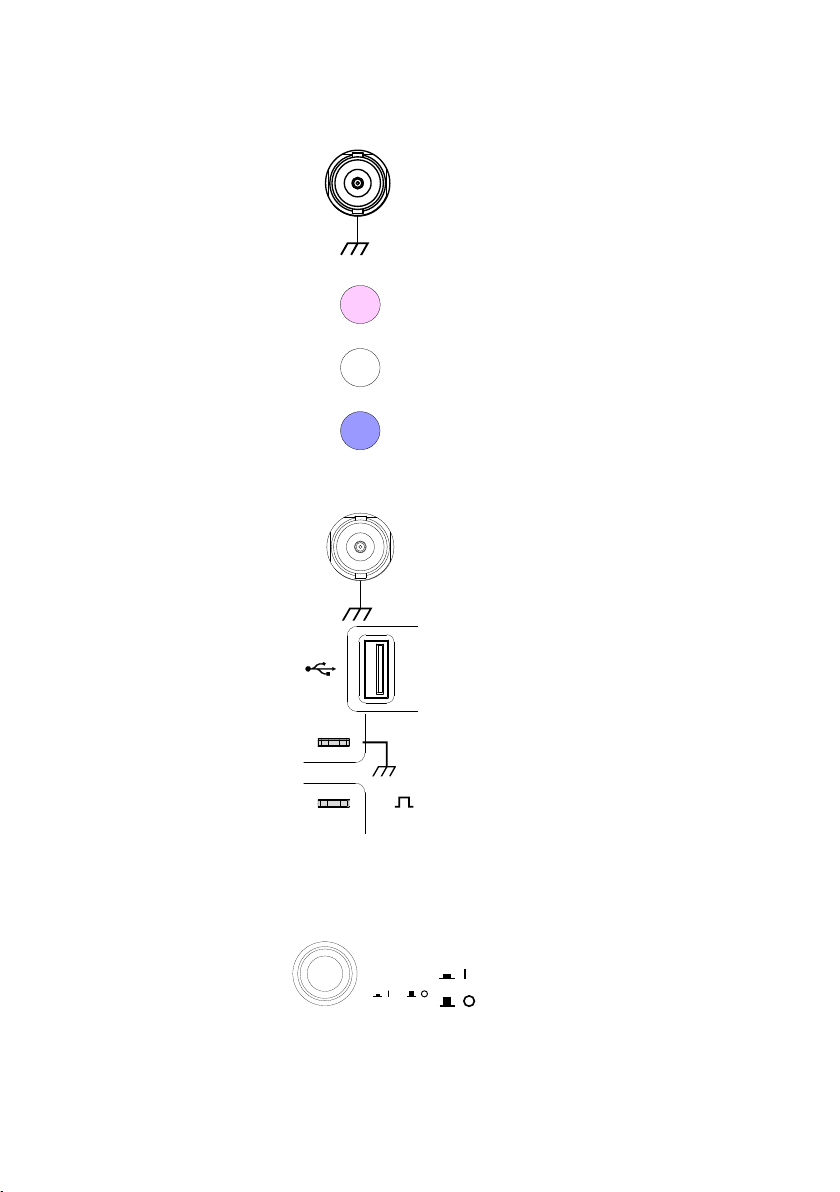
Channel Inputs
CH1
Accepts input signals.
Input impedance: 1MΩ.
Capacitance: 16pF
CAT I 300V
USB Host Port
2V
TypeA, 1.1/2.0 compatible.
Used for USB memory.
Ground Terminal
2V
Accepts the DUT ground lead for
common ground.
Probe
Compensation
Outputs
2V
The probe compensation output is
used for probe compensation. It
also has an adjustable output
frequency.
By default this port outputs a
2Vpp, square wave signal at 1kHz
for probe compensation.
Power Switch
POWER
Used to turn the power on/off.
: ON
: OFF
8
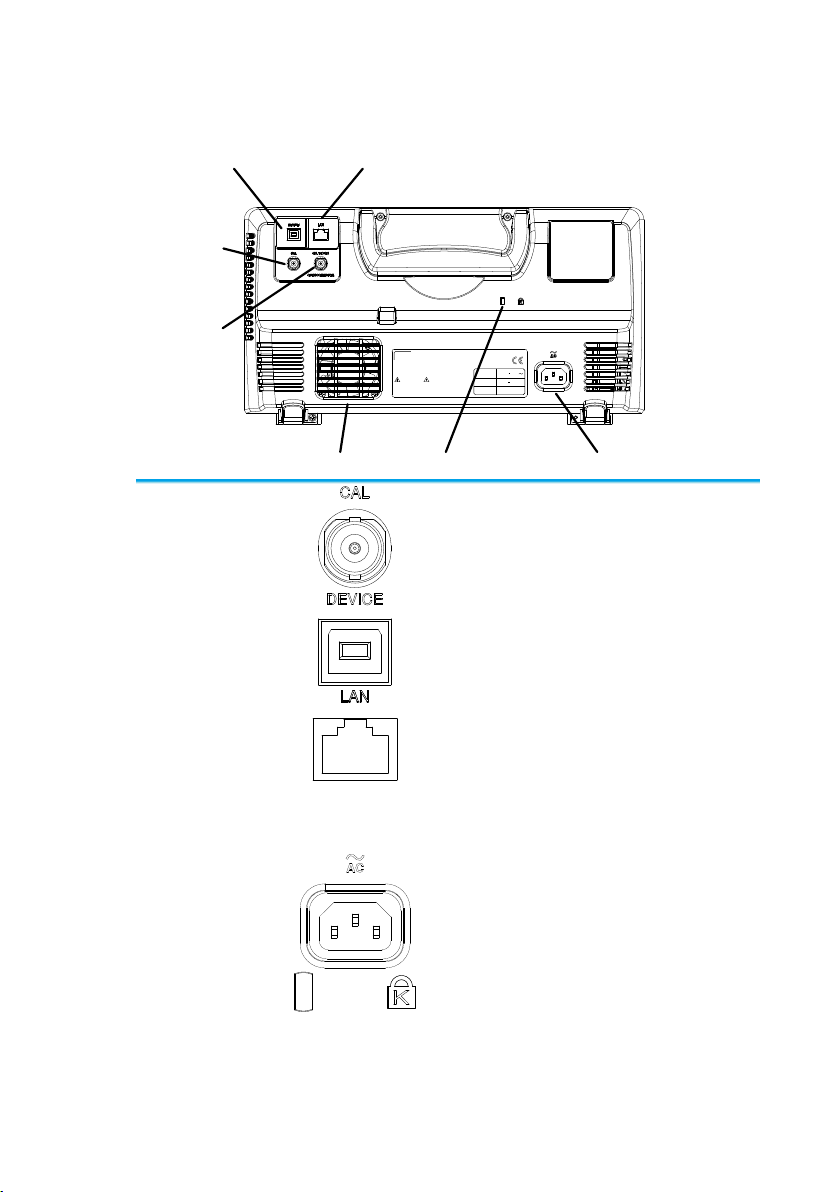
Calibration
output
Key lock Power input socketFan
Go/ No Go
output
LAN portUSB Device port
LINE VOLTAGE
AC 100 240V
RANGE
FREQUENCY 50 60Hz
POWER MAX. 30 Watts
CAUTION
TO AVOID ELECTRIC SHOCK THE POWER CORD PROTECTIVE GROUNDING
DO NOT REMOVE COVERS. REFER SERVICING TO QUALIFIED PERSONNEL.
CONDUCTOR MUST BE CONNECTED TO GROUND.
Ser. No. Label
Calibration
Output
Outputs the signal for vertical scale
accuracy calibration.
USB Device Port
The USB Device port is used for
remote control.
LAN (Ethernet)
Port
The LAN port is used for remote
control over a network or when
combined with the Remote Disk
app, allows the scope to be
mounted to a share disk.
The LAN port is only available for
the 4 channel models
Power Input
Socket
Power cord socket accepts AC
mains, 100 ~ 240V, 50/60Hz.
Security Slot
Kensington security slot compatible.
1-2-2. Rear Panel
9
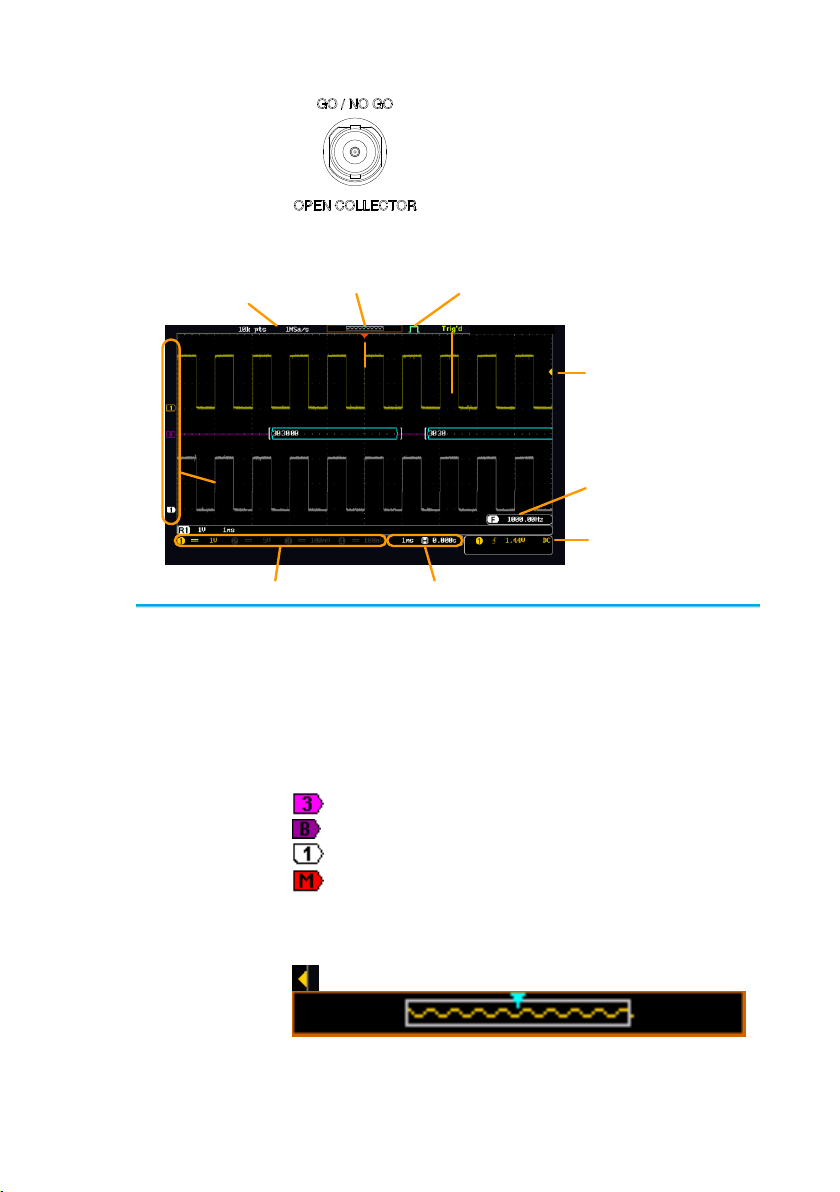
Go-No Go
Output
Outputs Go-No Go test results as a
500us pulse signal.
Memory bar
Reference
waveform
Analog
Waveform
Bus
Channel status Horizontal status
Trigger
configuration
Waveform
frequency
Trigger position
Trigger status
Acquistion mode
Trigger level
Channel
Indicators
Memory length
and sample rate
Analog
Waveforms
Shows the analog input signal waveforms.
Channel 1: Yellow
Channel 2: Blue
Channel 3: Pink
Channel 4: Green
Bus Waveforms
Shows the bus waveforms for serial buses. The
values are displayed in hex or binary.
Channel
Indicators
The channel indicators show the zero volt level of
the signal waveform for each activated channel.
Any active channel is shown with a solid color.
Analog channel indicator
Bus indicator(B)
Reference waveform indicator
Math indicator
Trigger Position
Shows the position of the trigger.
Horizontal
Status
Shows the horizontal scale and position.
Trigger Level
Shows the trigger level on the graticule.
Memory Bar
The ratio and the position of the displayed
waveform compared to the internal memory
1-2-3. Display
10
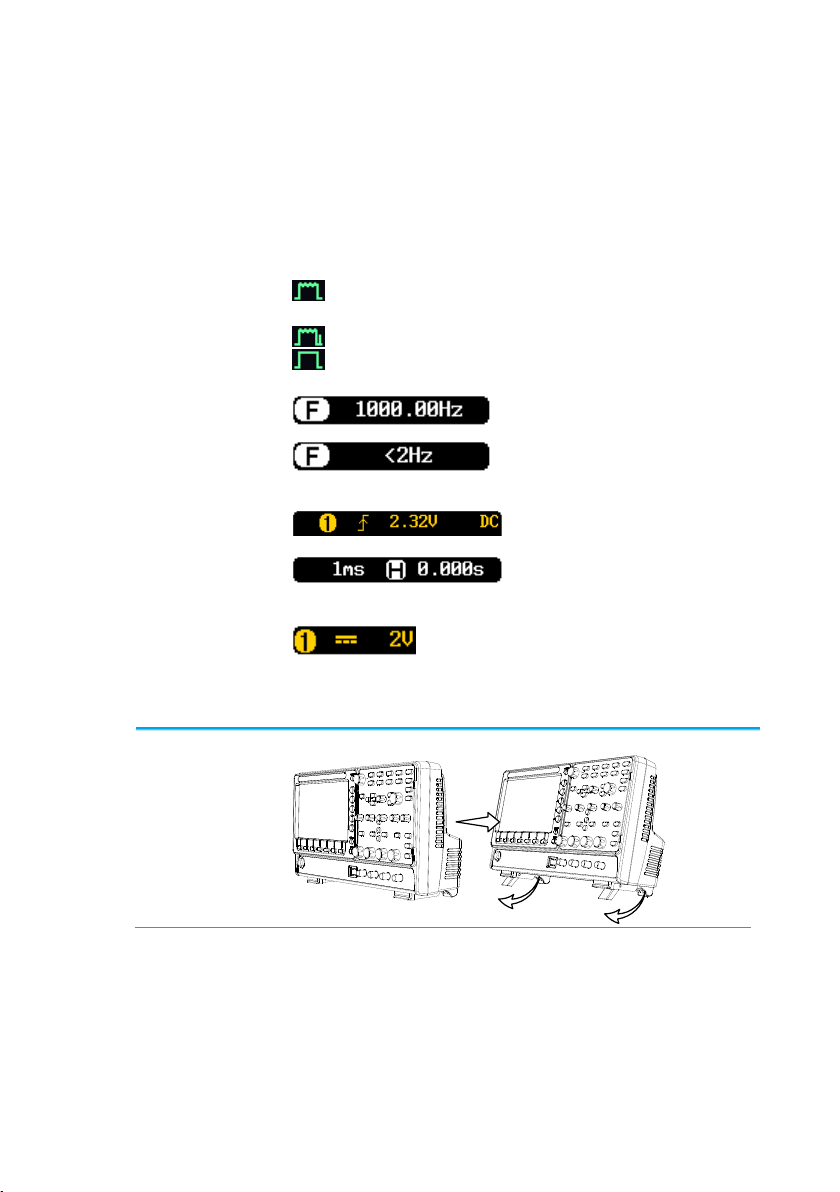
Trigger Status
Trig’d
Triggered.
PrTrig
Pre-trigger.
Trig?
Not triggered, display not updated.
Stop
Trigger stopped. Also appears in
Run/Stop (page 21).
Roll
Roll mode.
Auto
Auto trigger mode.
For trigger details, see page 89.
Acquisition
Mode
Normal mode
Peak detect mode
Average mode
For acquisition details, see page 46.
Signal
Frequency
Shows the trigger source
frequency.
Indicates the frequency is
less than 2Hz (lower
frequency limit).
Trigger
Configuration
Trigger source, slope,
voltage, coupling.
Horizontal
Status
Horizontal scale,
horizontal position.
For trigger details, see page 89.
Channel Status
Channel 1, DC coupling, 2V/Div.
Tilt
To tilt, pull the legs forward, as shown below.
1-3. Set Up
1-3-1. Tilt Stand
11
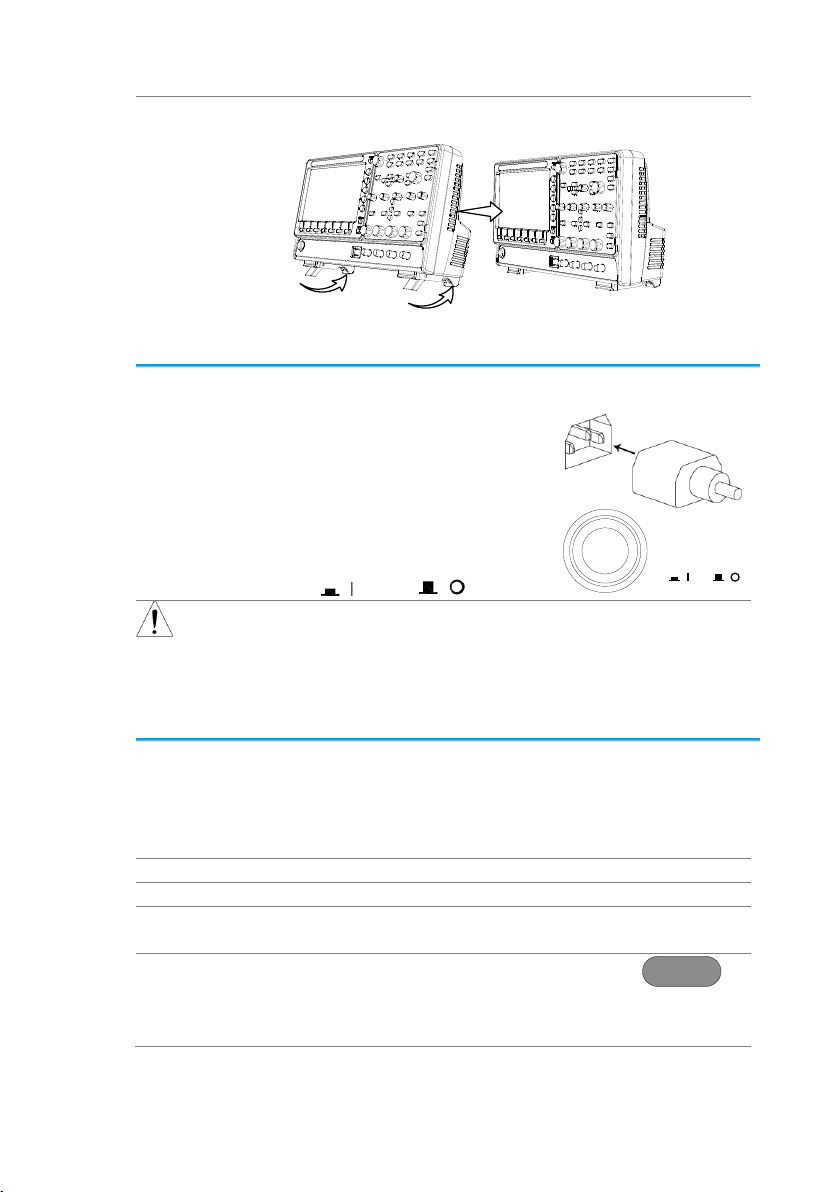
Stand
To stand the scope upright, push the legs back
under the casing as shown below.
Requirements
The DCS-1000B accepts line voltages of 100 ~
240V at 50 or 60Hz.
Step
1. Connect the power cord to
the rear panel socket.
2. Press the POWER key.
The display becomes
active in ~ 30 seconds.
: ON : OFF
POWER
Note
The DCS-1000B recovers the state right before the
power is turned OFF. The default settings can be
recovered by pressing the Default key on the front
panel. For details, see page 141.
Background
This section describes how to connect a signal,
adjust the scale, and compensate the probe.
Before operating the DCS-1000B in a new
environment, run these steps to make sure the
instrument performs at its full potential.
1. Power On
Follow the procedures on the previous page.
2. Firmware
Update to the latest firmware.
Page 168
3. Optional
appliction
Add the Optional application,
depending on the necessity.
Page 118
4. Reset System
Reset the system by recalling the
factory settings. Press the Default key
on the front panel. For details, see
page 141.
Default
1-3-2. Power Up
1-3-3. First Time Use
12
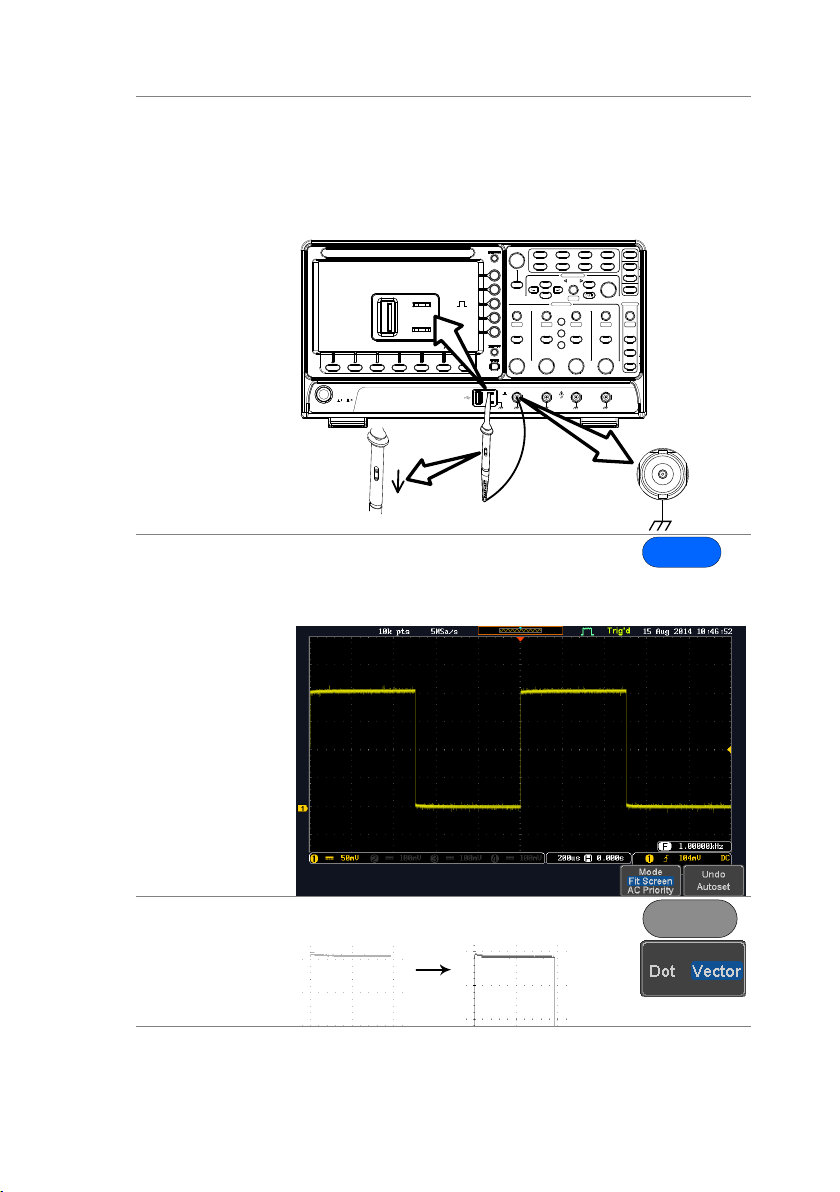
5. Connect
Probe
Connect the probe to the Channel 1 input and to
the CAL signal output. This output provides a 2Vpp, 1kHz square wave for signal compensation by
default.
Set the probe attenuation to x10 if the probe has
adjustable attenuation.
VARIABLE
POSITION
HORIZONTAL
POSITION
POSITION
POSITION
POSITION
VERTICAL
MATH
REF
BUS
TRIGGER
LEVEL
PUSH TO
ZERO
PUSH TO
ZERO
PUSH TO
ZERO
PUSH TO
ZERO
PUSH TO
ZERO
PUSH TO
ZERO
SCALE
POWER
CH1 CH2 CH3 CH4
2V
1MW 16pF
.
Measure
Display
Cursor
Help
Test
Save/Recall
Acquire
Utility
Autoset
Run/Stop
Single
Default
Select
Search
Set/Clear
Zoom
CH1 CH2 CH3 CH4
M
R
B
Menu
50 %
Force-Trig
x1
x10
X
10
X
1
CH1
2V
6. Capture
Signal (Autoset)
Press the Autoset key. A square
waveform appears on the center of
the screen. For Autoset details, see
page 20.
Autoset
7. Select Vector
Waveform
Press the Display key, and set the
display to Vector on the bottom menu.
Display
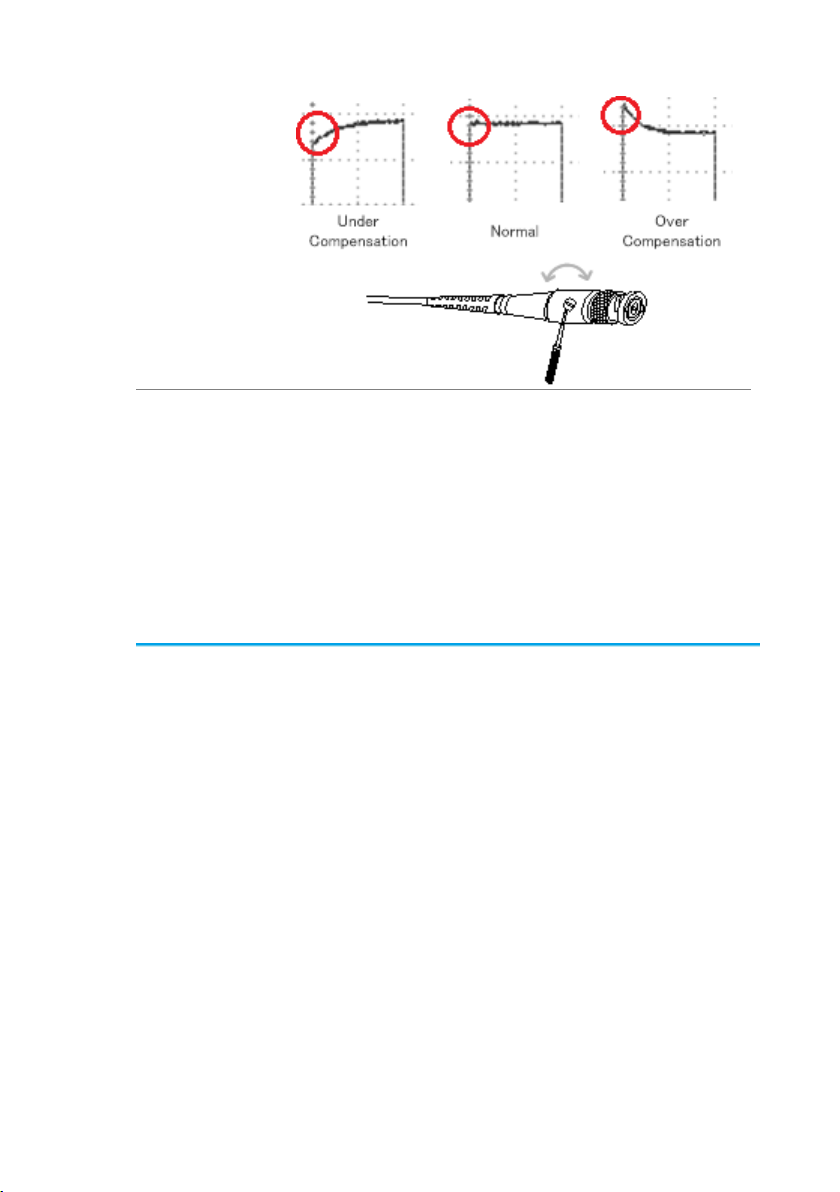
8. Compensate
Probe
Turn the adjustment point on the probe to make
the square waveform edge flat.
13
9. Start
Operation
Continue with the other operations.
Measurement:
page 19
Configuration:
page 46
Save/Recall:
page 130
File Utilities:
page 147
Apps:
page 118
Hardcopy key:
page 152
Remote Control:
page 155
Maintenance:
page 163
Background
This section describes the conventions used in
this manual to operate the DCS-1000B.
Throughout the manual any reference to pressing
a menu key refers to the keys directly below or
beside any menu icons or parameters.
When the user manual says to “toggle” a value or
parameter, press the corresponding menu item.
Pressing the item will toggle the value or
parameter.
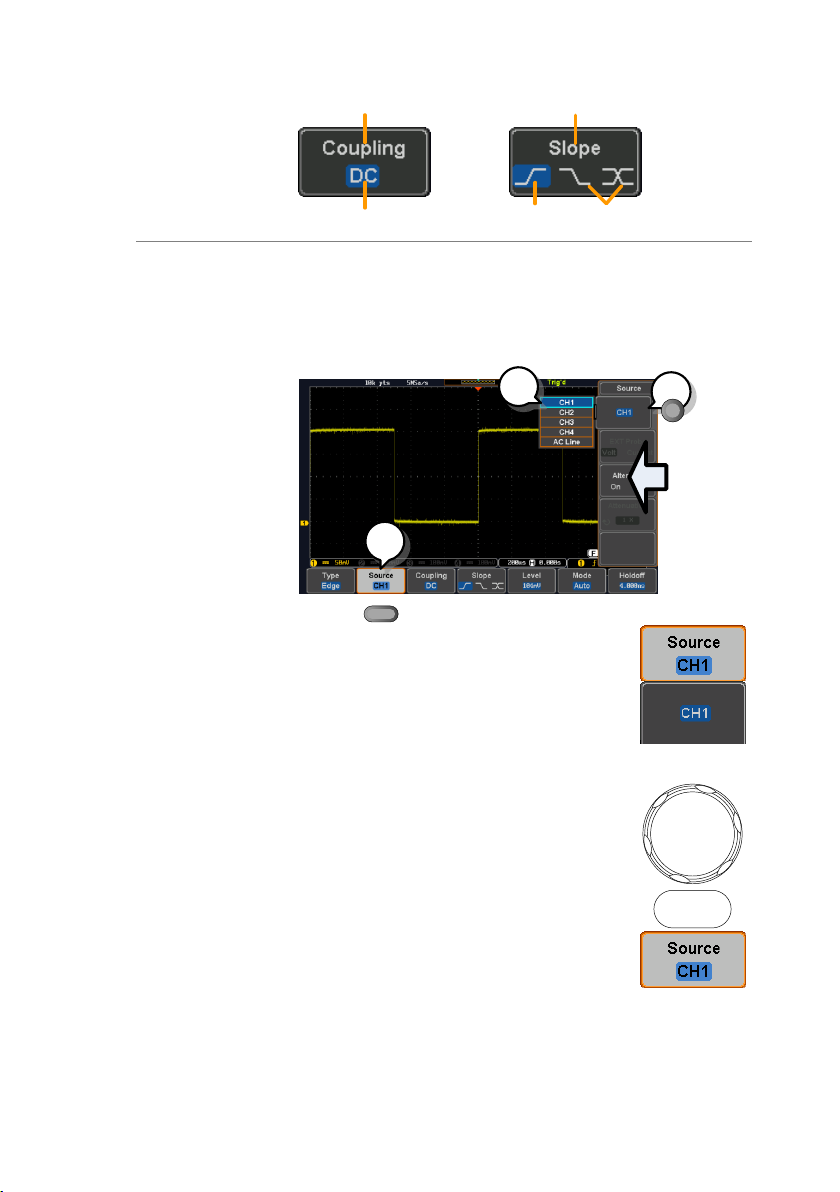
Active parameters are highlighted for each menu
item. For example in the example below, Coupling
is currently set to DC.
If a menu item can be toggled from one value or
parameter to another, the available options will be
visible, with the current option highlighted. In the
example below the slope can be toggled from a
rising slope to a falling slope or either slope.
1-3-4. How to Use This Manual
14
Menu item
Parameter
Menu item
Active
parameter
Optional
parameters
Menu item
Selecting a
Menu Item,
Parameter or
Variable
When the user manual says to “select” a value
from one of the side menu parameters, first press
the corresponding menu key and use the Variable
knob to either scroll through a parameter list or to
increase or decrease a variable.
Example 1
1
2
3
1. Press a bottom menu key to
access the side menu.
2. Press a side menu key to either
set a parameter or to access a sub
menu.
3. If accessing a sub menu or setting
a variable parameter, use the
Variable knob to scroll through
menu items or variables. Use the
Select key to confirm and exit.
VARIABLE
Select
4. Press the same bottom menu key
again to reduce the side menu.
Example 2
For some variables, a circular arrow icon indicates
that the variable for that menu key can be edited
with the Variable knob.
15
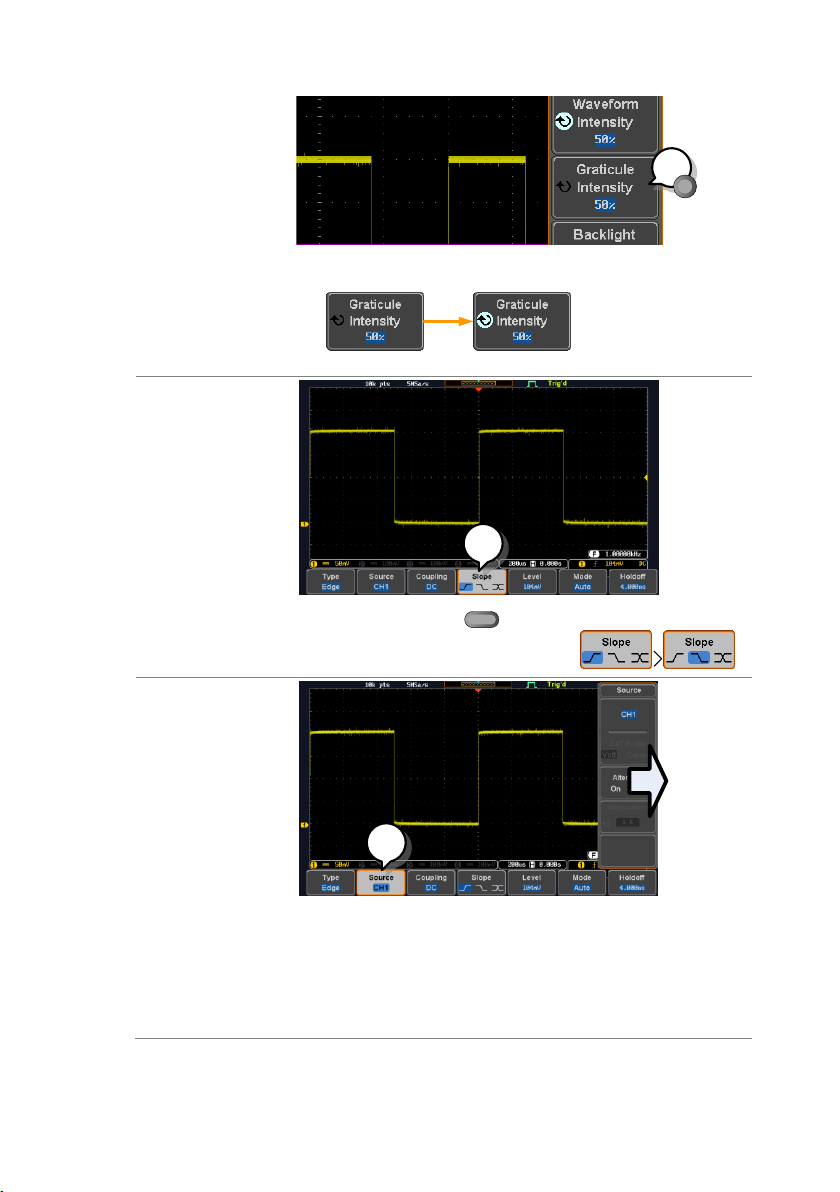
1
1. Press the desired menu key to select it. The
circular arrow will become highlighted.
2. Use the Variable knob to edit the value.
Toggling a Menu
Parameter
1
1. Press the bottom menu key
to toggle the parameter.
Reduce Side
Menu
1
2. To reduce the side menu, press the
corresponding bottom menu that brought up
the side menu.
For example: Press the Source soft-key to
reduce the Source menu.
16

Reduce Lower
Menu
1. Press the relevant function
key again to reduce the
bottom menu. For example:
press the Trigger Menu key
to reduce the trigger menu.
POSITION
POSITION
TRIGGER
LEVEL
PUSH TO
ZERO
PUSH TO
ZERO
PUSH TO
ZERO
SCALE
Test
Save/Recall
Acquire
Utility
Autoset
Run/Stop
Single
Default
Zoom
Menu
50 %
Force-Trig
1
Remove All
Menus
1. Press the Menu Off key to
reduce the side menu,
press again to reduce the
bottom menu.
VARIABLE
POSITION
HORIZONTAL
POSITION
POSITION
POSITION
POSITION
VERTICAL
MATH
REF
BUS
SCALE
TRIGGER
LEVEL
PUSH TO
ZERO
SCALESCALE
PUSH TO
ZERO
PUSH TO
ZERO
PUSH TO
ZERO
PUSH TO
ZERO
PUSH TO
ZERO
SCALE
CH1 CH2 CH3 CH4
2V
Measure
Display
Cursor
Help
Test
Save/Recall
Acquire
Utility
Autoset
Run/Stop
Single
Default
Select
Search
Set/Clear
Zoom
CH1 CH2 CH3 CH4
M
R
B
Menu
50 %
Force-Trig
1
17
Remove OnScreen
Messages
2. The Menu Off key can also
be used to remove any on
screen messages.
VARIABLE
POSITION
HORIZONTAL
POSITION
POSITION
POSITION
POSITION
VERTICAL
MATH
REF
BUS
SCALE
TRIGGER
LEVEL
PUSH TO
ZERO
SCALESCALE
PUSH TO
ZERO
PUSH TO
ZERO
PUSH TO
ZERO
PUSH TO
ZERO
PUSH TO
ZERO
SCALE
CH1 CH2 CH3 CH4
2V
Measure
Display
Cursor
Help
Test
Save/Recall
Acquire
Utility
Autoset
Run/Stop
Single
Default
Select
Search
Set/Clear
Zoom
CH1 CH2 CH3 CH4
M
R
B
Menu
50 %
Force-Trig
2
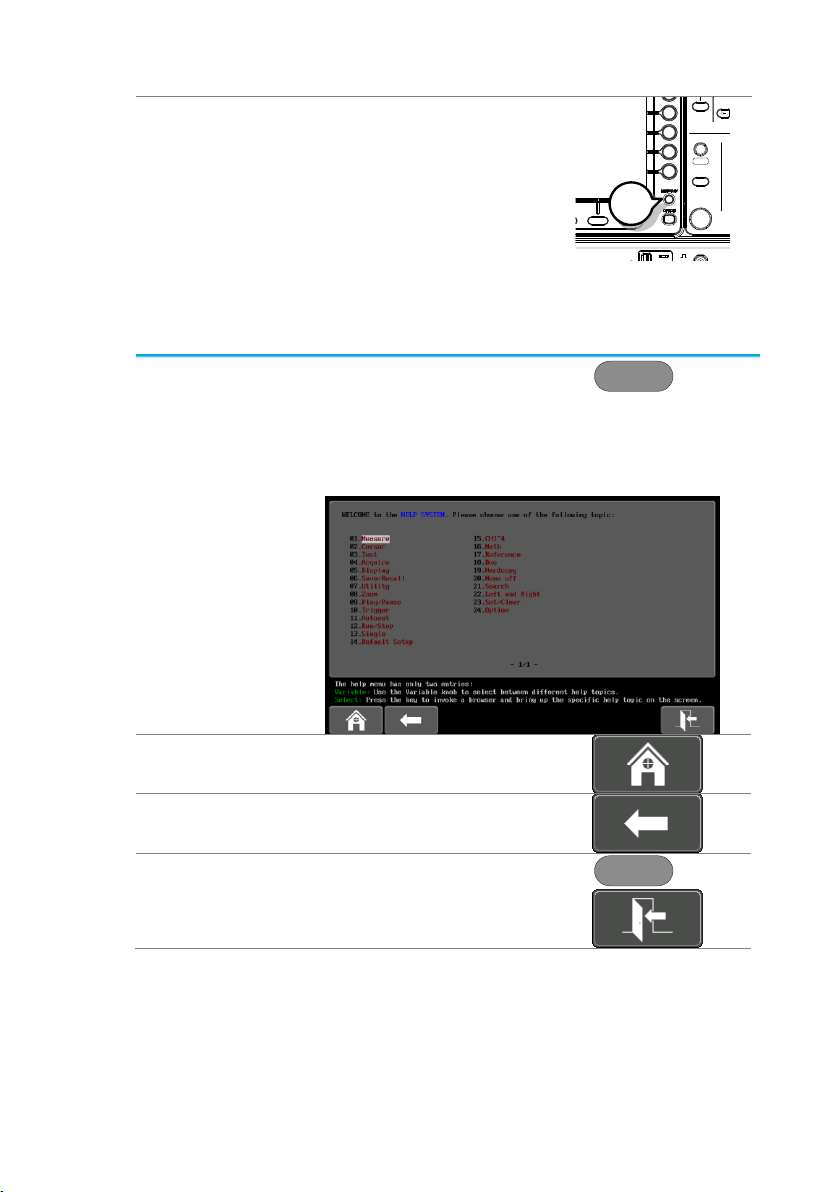
The Help key accesses a context sensitive help menu. The help
menu contains information on how to use the front panel keys.
Panel Operation
1. Press the Help key. The
display changes to Help
mode.
Help
2. Use the Variable knob to scroll up and down
through the Help contents. Press Select to view
the help on the selected item.
Example: Help
on the Display
key
Home Key
Press the Home key to return to
the main help screen.
Go Back
Press the Back key to go to the
previous menu page.
Exit
Press the Help key again or
press the Exit key to exit the
Help mode.
Help
1-4. Built-in Help
18
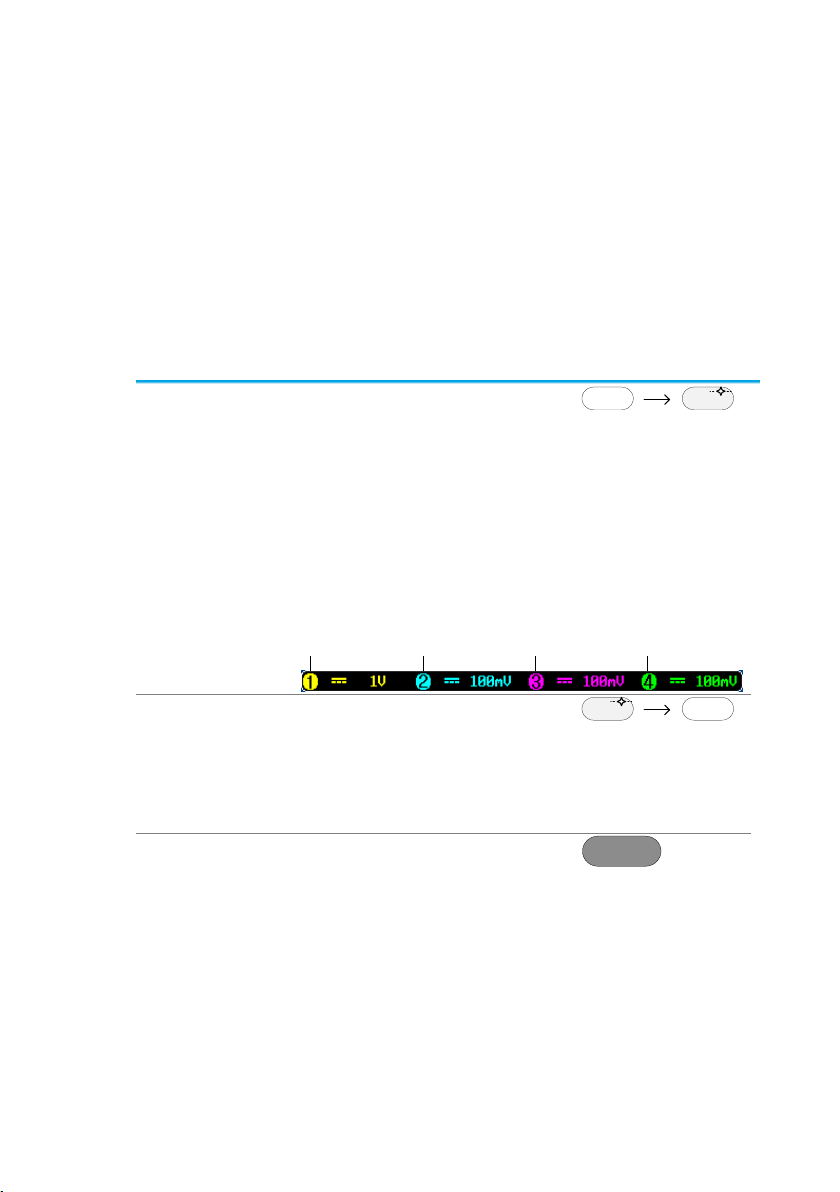
Activate
Channel
To activate an input channel,
press a channel key.
When activated, the channel
key will light up. The
corresponding channel menu
will also appear.
CH1 CH1
Each channel is associated with the color shown
beside each channel’s VOLT/DIV knob: CH1:
yellow, CH2: blue, CH3: pink and CH4: green.
When a channel is activated, it is shown above the
bottom menu system.
CH1 CH3CH2 CH4
De-activate
Channel
To de-activate a channel, press
the corresponding channel key
again. If the channel menu is
not open, press the channel
key twice (the first press shows
the Channel menu).
CH1 CH1
Default Setup
To activate the default state,
press Default.
Default
2. MEASUREMENT
2-1. Basic Measurement
This section describes the basic operations required in capturing
and viewing the input signal. For more detailed operations, see the
following chapters.
Cursor Measurement → from page 34
Configuration → from page 46
Before operating the oscilloscope, please see the Getting Started
chapter, page4.
2-1-1. Channel Activation
19
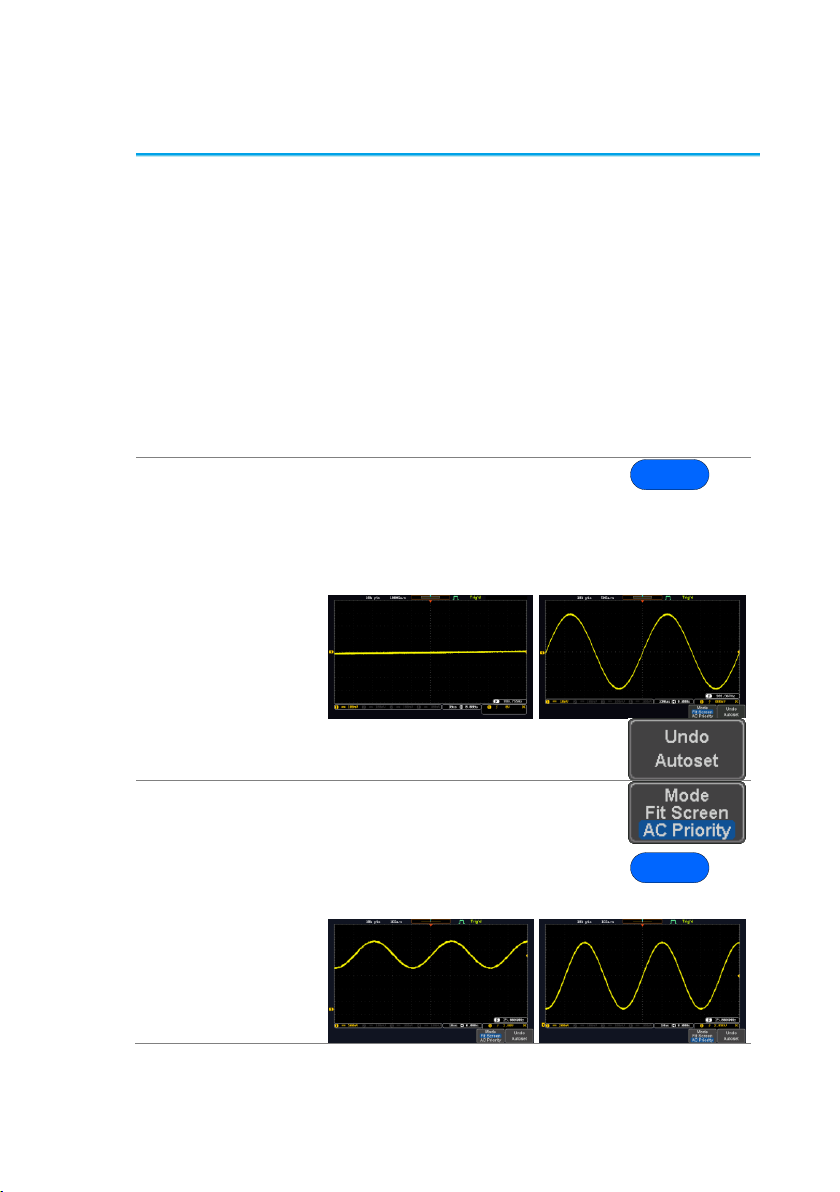
Background
The Autoset function automatically configures the
panel settings to position the input signal(s) to the
best viewing condition. The DCS-1000B
automatically configures the following parameters:
Horizontal scale
Vertical scale
Trigger source channel
There are two operating modes for the Autoset
function: Fit Screen Mode and AC Priority Mode.
Fit Screen Mode will fit the waveform to the best
scale, including any DC components (offset). AC
priority mode will scale the waveform to the screen
by removing any DC component.
Panel Operation
1. Connect the input signal to the
DCS-1000B and press the
Autoset key.
Autoset
2. The waveform appears in the center of the
display.
Before
After
3. To undo Autoset, press Undo
Autoset from the bottom menu.
Change modes
4. Choose between Fit Screen
Mode and AC Priority Mode from
the bottom menu.
5. Press the Autoset key again to
use Autoset in the new mode.
Autoset
Fit Screen Mode
AC Priority
2-1-2. Autoset
20
Limitation
Autoset does not work in the following situations:
Input signal frequency is less than 20Hz
Input signal amplitude is less than 10mV
Note
The Autoset key does NOT automatically activate
the channels to which input signals are connected.
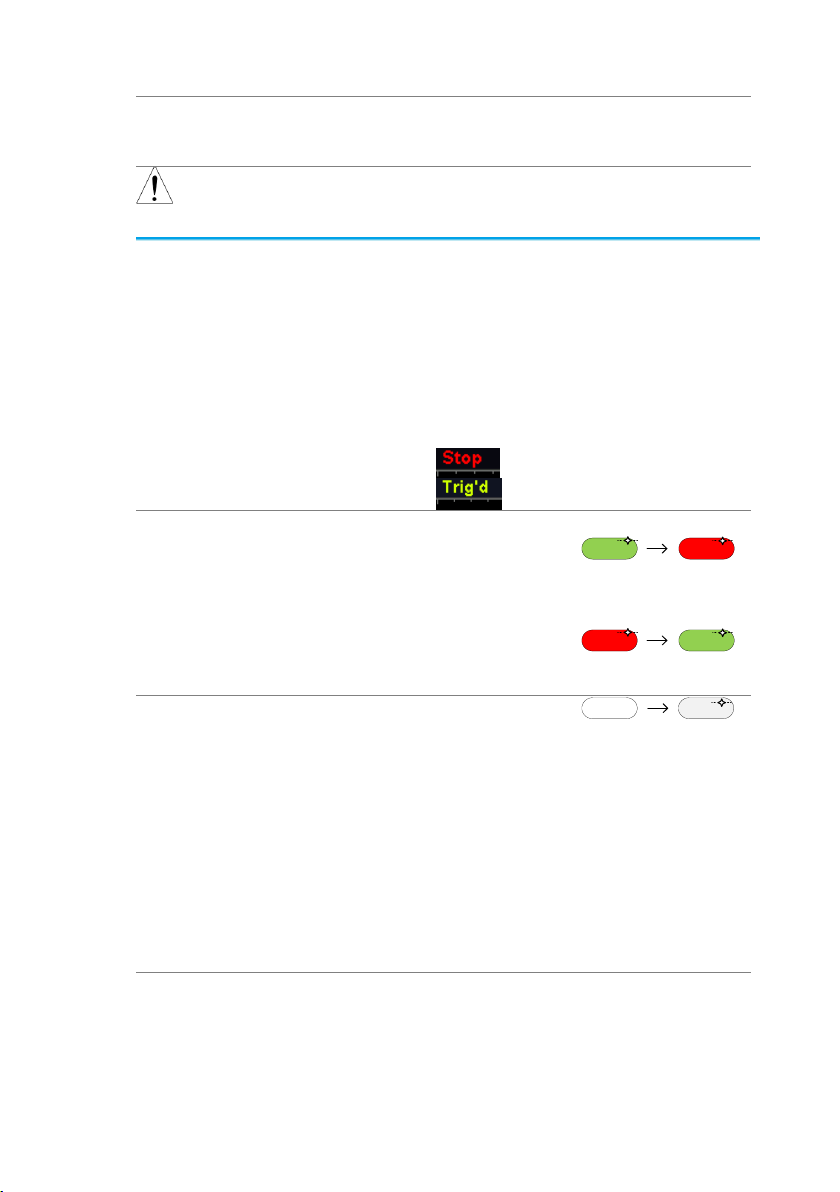
Background
By default, the waveform on the display is
constantly updated (Run mode). Freezing the
waveform by stopping signal acquisition (Stop
mode) allows flexible observation and analysis. To
enter Stop mode, two methods are available:
pressing the Run/Stop key or using the Single
Trigger mode.
Stop mode icon
When in Stop mode, the Stop icon
appears at the top of the display.
Triggered icon
Freeze
Waveform using
the Run/Stop
Key
Press the Run/Stop key once.
The Run/Stop key turns red.
The waveform and signal
acquisition freezes.
Stop:
Run/Stop Run/Stop
To unfreeze, press the
Run/Stop key again. The
Run/Stop key turns green
again.
Run:
Run/Stop Run/Stop
Freeze
Waveform by
Single Trigger
Mode
Press the Single key to go into
the Single Trigger mode. The
Single key turns bright white.
In the Single Trigger mode, the
scope will be put into the pretrigger mode until the scope
encounters the next trigger
point. After the scope has
triggered, it will remain in Stop
mode, until the Single key is
pressed again or the Run/Stop
key is pressed.
SingleSingle
Waveform
Operation
The waveform can be moved or scaled in both Run
and Stop mode, but in different manners. For
details, see page 63 (Horizontal position/scale) and
page 69 (Vertical position/scale).
2-1-3. Run/Stop
21
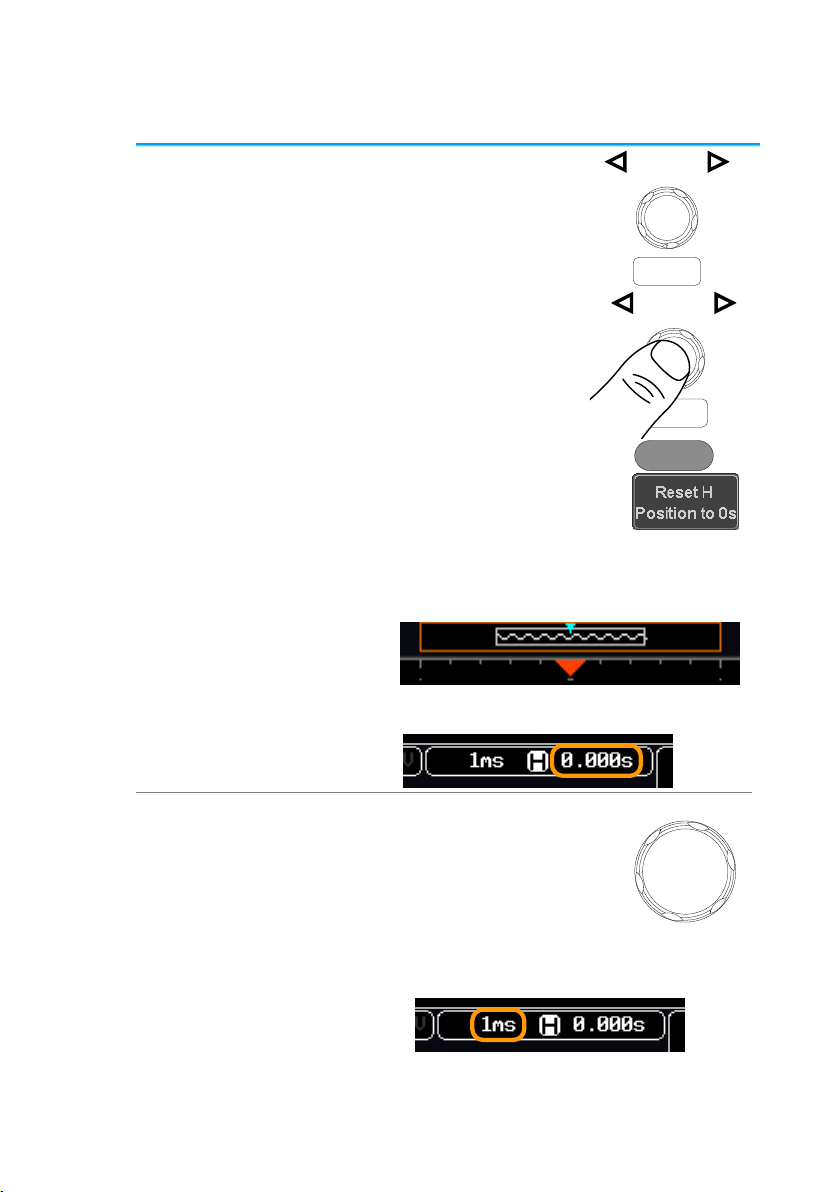
Set Horizontal
Position
The horizontal position knob
moves the waveform left and
right.
POSITION
PUSH TO
ZERO
Set Horizontal
Position to 0
Pressing the horizontal position
knob will reset the horizontal
position to 0.
POSITION
PUSH TO
ZERO
Alternatively, pressing the Acquire
key and then pressing Reset H
Position to 0s from the bottom menu
will also reset the horizontal position.
Acquire
As the waveform moves, the display bar on the top
of the display indicates the portion of the waveform
currently shown on the display and the position of
the horizontal marker on the waveform.
Position
Indicator
The horizontal position is shown at the bottom of
the display grid to the right of the H icon.
Select
Horizontal Scale
To select the timebase, turn the
horizontal SCALE knob; left (slow) or
right (fast).
SCALE
Range
5ns/div ~ 100s/div, 1-2-5 increments
The scale is displayed to the left of the H icon at
the bottom of the screen.
2-1-4. Horizontal Position/Scale
For more detailed configuration, see page 63.
22
Display bar
The display bar indicates how much
of the waveform is displayed on the
screen at any given time. Changes to
timebase will be reflected on the
display bar.
Fast
Medium
Slow
Stop mode
In the Stop mode, the waveform size
changes according to the scale.
Note
The Sample rate changes according to the
timebase and record length. See page 49.
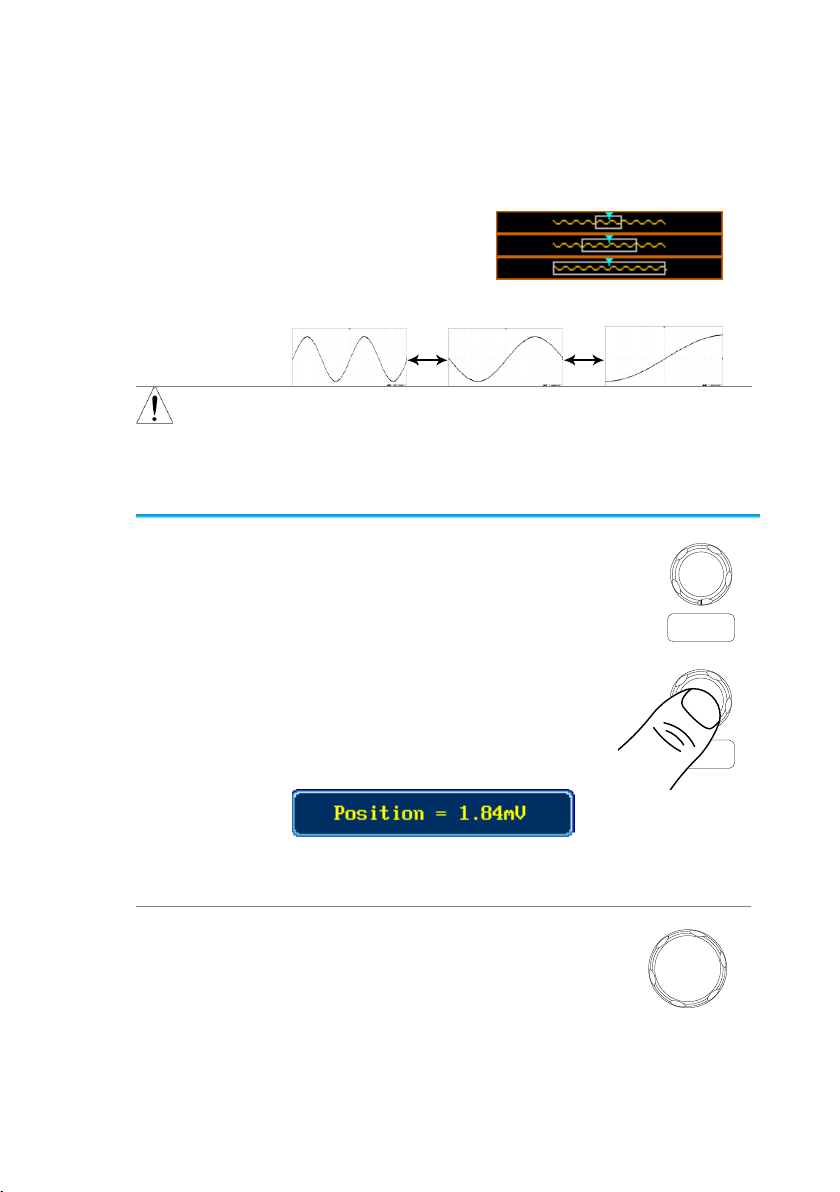
Set Vertical
Position
To move the waveform up or down, turn
the vertical position knob for each
channel.
POSITION
PUSH TO
ZERO
Push the vertical position knob to
reset the position to 0.
As the waveform moves, the
vertical position of the cursor
appears on the display.
POSITION
PUSH TO
ZERO
Run/Stop
mode
The waveform can be moved
vertically in both Run and Stop
mode.
Select Vertical
Scale
To change the vertical scale, turn the
vertical VOLTS/DIV knob; left (down) or
right (up).
VOLTS/DIV
Range
1mV/div ~ 10V/div
1-2-5 increments
2-1-5. Vertical Position/Scale
For more detailed configuration, see page 69.
23
The vertical scale indicator for
each channel on the bottom of
the display changes
accordingly.
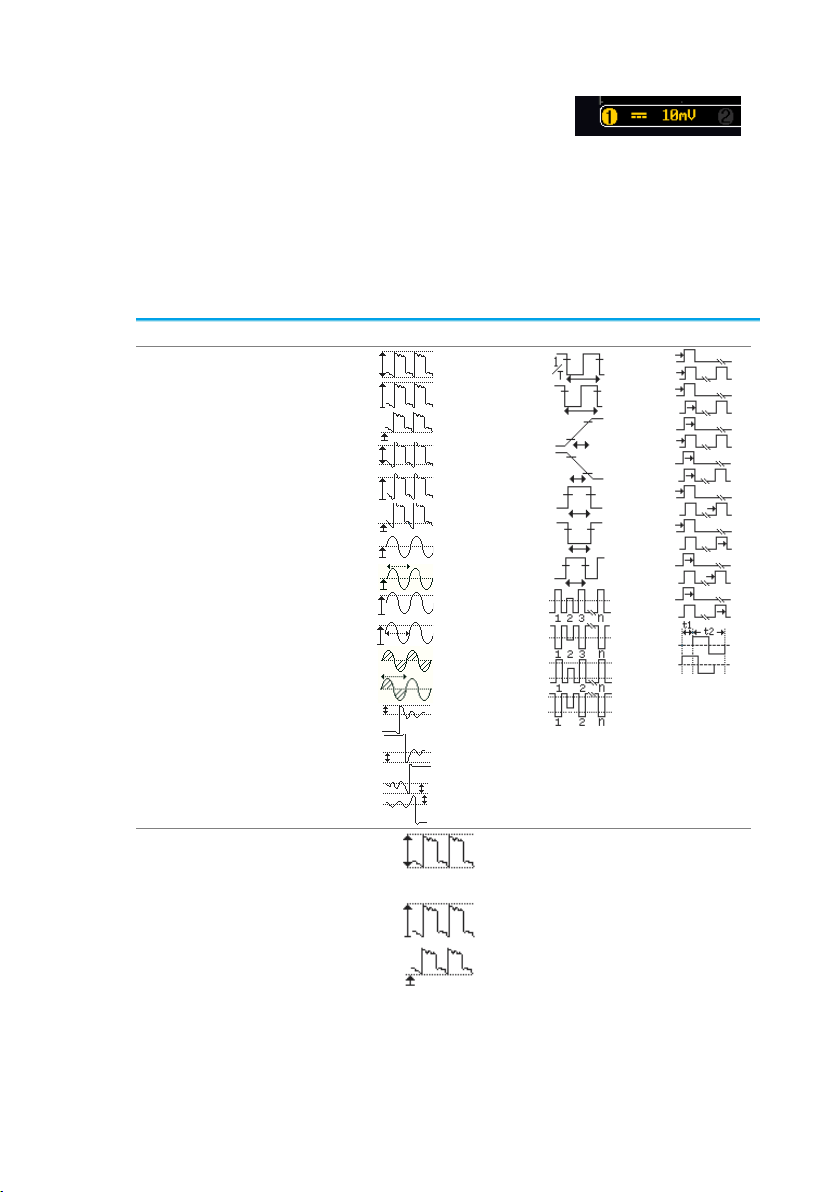
V/I Measurements
Time Meas.
Delay Meas.
Overview
FPREShoot
RPREShoot
FOVShoot
ROVShoot
Cycle Area
Area
Cycle RMS
RMS
Cycle Mean
Mean
Low
High
Amplitude
Min
Max
Pk-Pk
Frequency
Dutycycle
-Width
+Width
FallTime
RiseTime
Period
-Edges
+Edges
-Pulses
+Pulses
FRR
FRF
FFR
Phase
LFF
LFR
LRF
LRR
FFF
Voltage/Current
Measurement
Pk-Pk
(peak to
peak)
Difference between positive
and negative peak.
(=max − min)
Max
Positive peak.
Min Negative peak.
2-2. Automatic Measurement
The automatic measurement function measures and updates major
items for Voltage/Current, Time, and Delay type measurements.
2-2-1. Measurement Items
24

Amplitude
Difference between the
global high value and the
global low value, measured
over the entire waveform or
gated region. (=high − low)
High
Global high voltage. See
page 30 for details.
Low
Global low voltage. See page
30 for details.
Mean
The arithmetic mean value is
calculated for all data
samples as specified by the
Gating option.
Cycle
Mean
The arithmetic mean value is
calculated for all data
samples within the first cycle
found in the gated region.
RMS
The root mean square of all
data samples specified by
the Gating option.
Cycle RMS
The root mean square value
is calculated for all data
samples within the first cycle
found in the gated region.
Area
Measures the positive area
of the waveform and
subtracts it from the negative
area. The ground level
determines the division
between positive and
negative areas.
Cycle Area
The Summation based on all
data samples within the first
cycle found in the gated
region.
ROVShoot
Rise overshoot
FOVShoot
Fall overshoot
RPREShoot
Rise preshoot
FPREShoot
Fall preshoot
25

Time
Measurement
Frequency
Frequency of the waveform.
Period
Waveform cycle time.
(=1/Freq)
RiseTime
The time required for the
leading edge of the first pulse
to rise from the low reference
value to the high reference
value.
FallTime
The time required for the
falling edge of the first pulse
to fall from the high reference
value to the low reference
value.
+Width
Positive pulse width.
–Width
Negative pulse width.
Duty Cycle
Ratio of signal pulse
compared with whole cycle.
=100x (Pulse Width/Cycle)
+Pulses
Measures the number of
positive pulses.
-Pulses
Measures the number of
negative pulses.
+Edges
Measures the number of
positive edges.
-Edges
Measures the number of
negative edges.
Delay
Measurement
FRR
Time between:
Source 1 first rising edge and
Source 2 first rising edge.
FRF
Time between:
Source 1 first rising edge and
Source 2 first falling edge.
FFR
Time between:
Source 1 first falling edge
and Source 2 first rising
edge.
FFF
Time between:
Source 1 first falling edge
and Source 2 first falling
edge.
26

LRR
Time between:
Source 1 first rising edge and
Source 2 last rising edge.
LFR
Time between:
Source 1 first rising edge and
Source 2 last falling edge.
LRF
Time between:
Source 1 first falling edge
and Source 2 last rising
edge.
LFF
Time between:
Source 1 first falling edge
and Source 2 last falling
edge.
Phase
The phase difference of two
signals, calculated in
degrees.
360x
t2
t1
Note
The in-built help system can be used to see
detailed automatic measurement definitions.
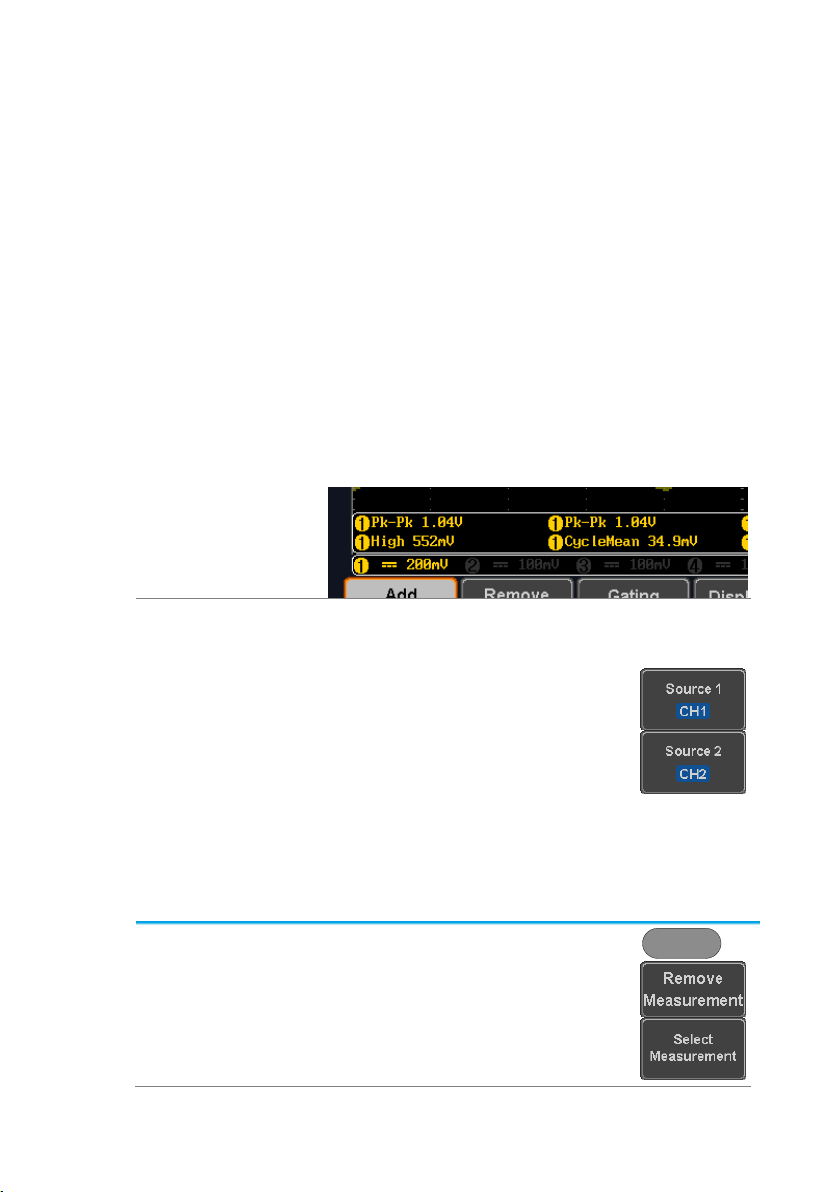
Add
Measurement
Item
1. Press the Measure key.
Measure
2. Press Add Measurement from the
bottom menu.
3. Choose either a V/I, Time or Delay
measurement from the side menu
and choose the type of
measurement you wish to add.
2-2-2. Add Measurement
The Add Measurement function allows you to add up to eight
automatic measurement items on the bottom of the screen from any
channel source.
27
V/I
(Voltage/
Current)
Pk-Pk, Max, Min, Amplitude, High,
Low, Mean, Cycle Mean, RMS,
Cycle RMS, Area, Cycle Area,
ROVShoot, FOVShoot,
RPREShoot, FPREShoot
Time
Frequency, Period, RiseTime,
FallTime, +Width, –Width, Duty
Cycle, +Pulses, -Pulses, +Edges, Edges
Delay
FRR, FRF, FFR, FFF, LRR, LRF,
LFR, LFF, Phase
4. All of the chosen automatic measurements will
be displayed in a window on the bottom of the
screen. The channel number and channel color
indicate the measurement source.
For the analog inputs: yellow = CH1,
blue = CH2, pink = CH3, green = CH4.
Choose a
Source
The channel source for measurement items can be
set either before or when selecting a measurement
item.
5. To set the source, press either the
Source1 or Source2 key from the
side menu and choose the source.
Source 2 is only applicable for
delay measurements.
Range
CH1~ CH4, Math
Remove
Measurement
Item
1. Press the Measure key.
Measure
2. Press Remove Measurement from
the bottom menu.
3. Press Select Measurement and
select the item that you want to
remove from the measurement list.
2-2-3. Remove Measurement
Individual measurements can be removed at any time using the
Remove Measurement function.
28
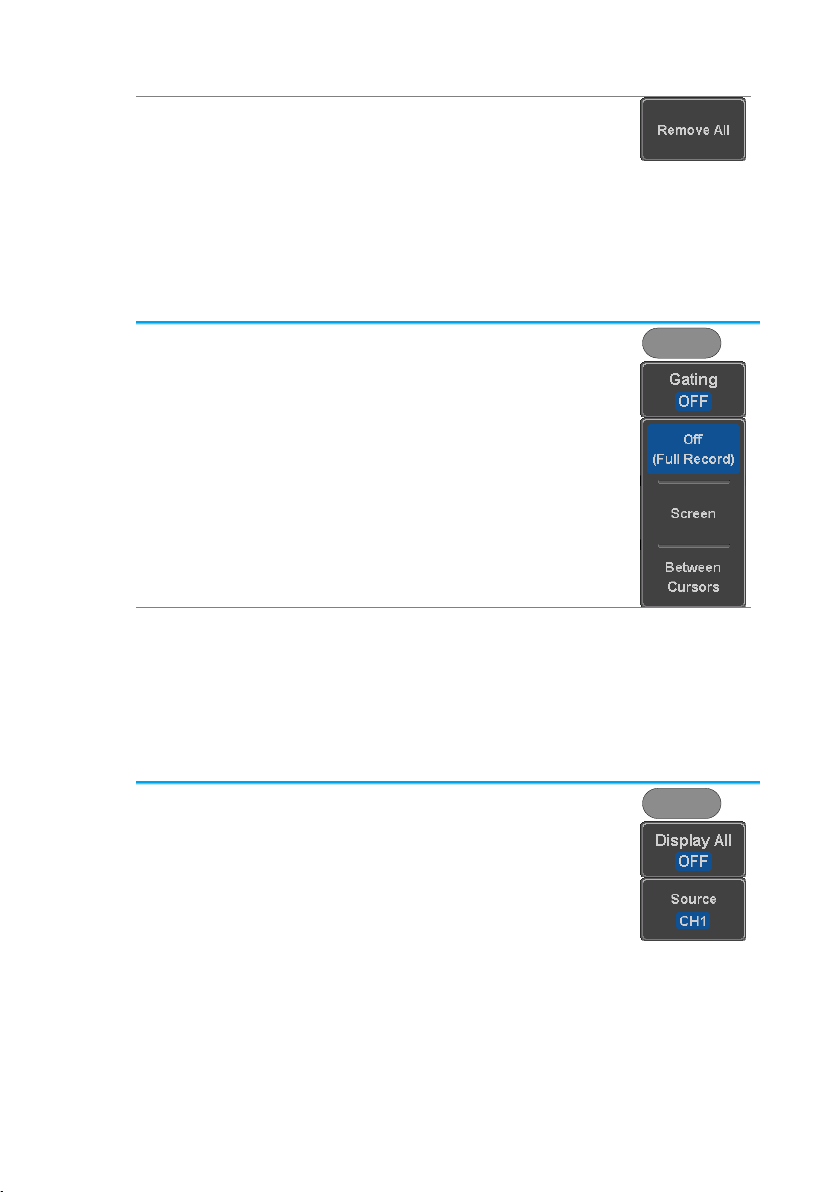
Remove All
Items
Press Remove All to remove all the
measurement items.
Set Gating Mode
1. Press the Measure key.
Measure
2. Press Gating from the bottom
menu.
3. Choose one of the gating modes
from the side menu: Off (full
record), Screen, Between Cursors.
Cursors On
Screen
If Between Cursors is selected, the
cursor positions can be edited by
using the cursor menu.
Page 34
View
Measurement
Results
1. Press the Measure key.
Measure
2. Press Display All from the bottom
menu.
3. Press Source from the side menu
and choose a measurement
source.
Range
CH1~CH4, Math
4. The results of Voltage and Time type
measurements appear on the display.
2-2-4. Gated mode
Some automatic measurements can be limited to a “gated” area
between cursors. Gating is useful for measuring a magnified
waveform or when using a fast time base. The Gated mode has
three possible configurations: Off (Full Record), Screen and
Between Cursors.
2-2-5. Display All mode
Display All mode shows and updates all items from Voltage and
Time type measurements.
29
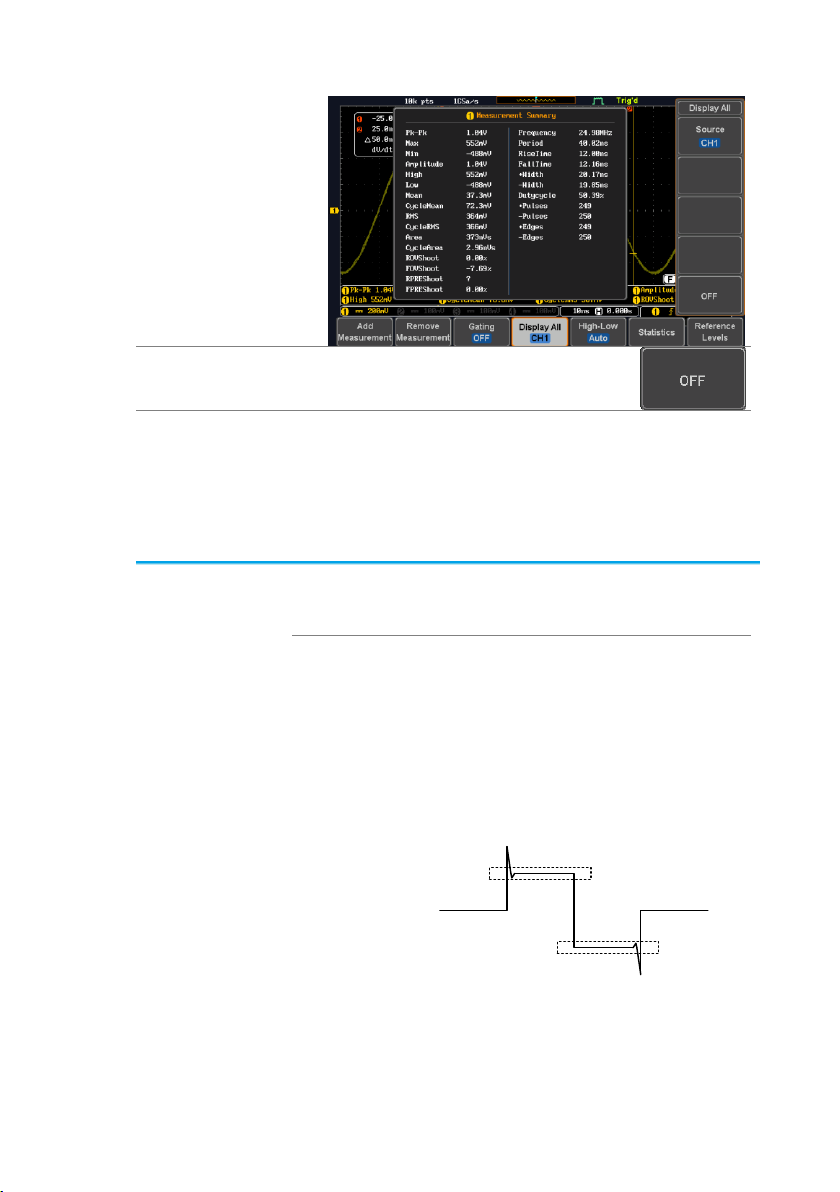
Remove
Measurements
To remove the measurement results,
press OFF.
Delay
Measurements
Delay type measurements are not available in this
mode as only one channel is used as the source.
Use the individual measurement mode (page 27)
instead.
Background
The High-Low function is used to select the
method for determining the value of the High-Low
measurement values.
Auto
Automatically chooses the best
high-low setting for each waveform
when measuring.
Histogram
Uses histograms to determine the
high-low values. This mode
ignores any preshoot and
overshoot values. This mode is
particularly useful for pulse-type
waveforms
low
high
2-2-6. High Low Function
30

Min-max
Sets the high-low values as the
minimum or maximum measured
values.
low
high
Set High-Low
1. Press the Measure key.
Measure
2. Press High-Low from the bottom
menu.
3. Select the type of High-Low settings from the
side menu.
High-Low Settings:
Histogram, Min-Max, Auto
Restore Default
High-Low
Settings
To return to the default High-Low
settings, press Set to Defaults.
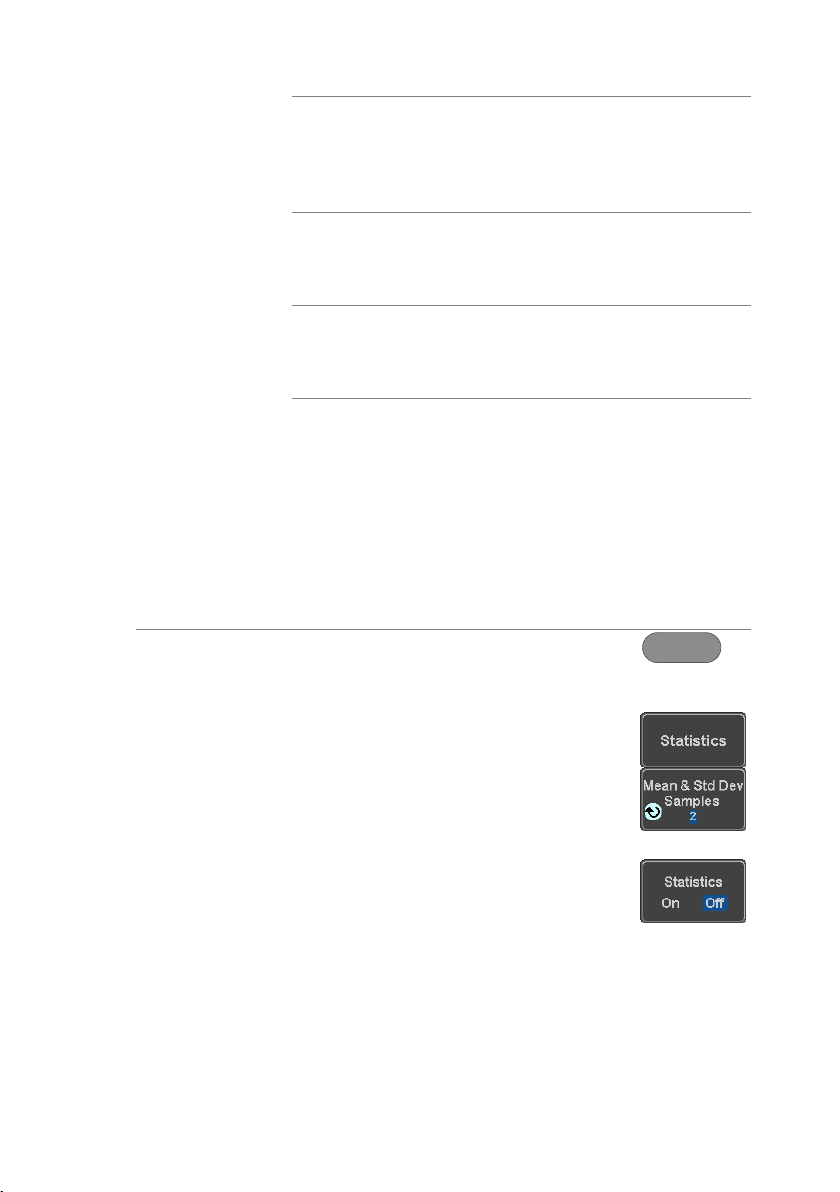
Background
The Statistics function can be used to view a
number of statistics for the selected automatic
measurements. The following information is
displayed with the Statistics function:
Value
Currently measured value
2-2-7. Statistics
31
Mean
The mean value is calculated from
a number of automatic
measurement results. The number
of samples used to determine the
mean can be user-defined.
Min
The minimum value observed from
a series of measured results for
the selected automatic
measurement items.
Max
The maximum value observed
from a series of measured results
for the selected automatic
measurement items.
Standard
Deviation
The variance of the currently
measured value from the mean.
The standard deviation equals the
squared root of the variance value.
Measuring the standard deviation
can, for example, determine the
severity of jitter in a signal.
The number of samples used to
determine the standard deviation
can be user-defined.
Panel Operation
1. Press the Measure key.
Measure
2. Select at least one automatic
measurement.
Page 27
3. Press Statistics from the bottom
menu.
4. Set the number of samples to be
used in the mean and standard
deviation calculations.
Samples:
2~1000
5. Press Statistics and turn Statistics
on.
6. The statistics for each automatic measurement
will appear at the bottom of the display in a
table.
32

Reset Statistics
To reset the standard deviation
calculations, press Reset Statistics.
Background
The reference level settings determine the
measurement threshold levels for some
measurements like the Rise Time measurement.
High Ref: Sets the high reference
level.
Mid Ref: Sets the middle reference
for the first and second
waveforms.
Low Ref: Sets the low reference
level.
Panel Operation
1. Press the Measure key.
Measure
2. Press Reference Levels from the
bottom menu.
3. Set the reference levels from the side menu.
Ensure the reference levels do not cross over.
High Ref
0.0% ~ 100%
Mid Ref(1)
0.0% ~ 100%
Mid Ref(2)
0.0% ~ 100%
Low Ref
0.0% ~ 100%
Default Settings
4. Press Set to Defaults to set the
reference levels back to the default
settings.
2-2-8. Reference Levels
33

Panel Operation
1. Press the Cursor key once.
Cursor
2. Press H Cursor from the bottom
menu if it is not already selected.
3. When the H Cursor is selected,
repeatedly pressing the H Cursor
key or the Select key will toggle
which cursor is selected.
OR
Select
Range
Description
Left cursor ( ) movable, right
cursor position fixed
Right cursor ( ) movable, left
cursor position fixed
Left and right cursor ( + )
movable together
4. The cursor position
information appears on the
top left hand side of the
screen
Cursor
Hor. position, Voltage/Current
Cursor
Hor. position, Voltage/Current
Delta (difference between cursors)
dV/dt or dI/dt
5. Use the Variable knob to move the
movable cursor(s) left or right.
VARIABLE
Select Units
6. To change the units of the
horizontal position, press H Unit.
Units
S, Hz, % (ratio), ˚(phase)
2-3. Cursor Measurement
Horizontal or vertical cursors are used to show the position and
values of waveform measurements and math operation results.
These results cover voltage, time, frequency and other math
operations. When the cursors (horizontal, vertical or both) are
activated, they will be shown on the main display unless turned off.
2-3-1. Use Horizontal Cursors
34

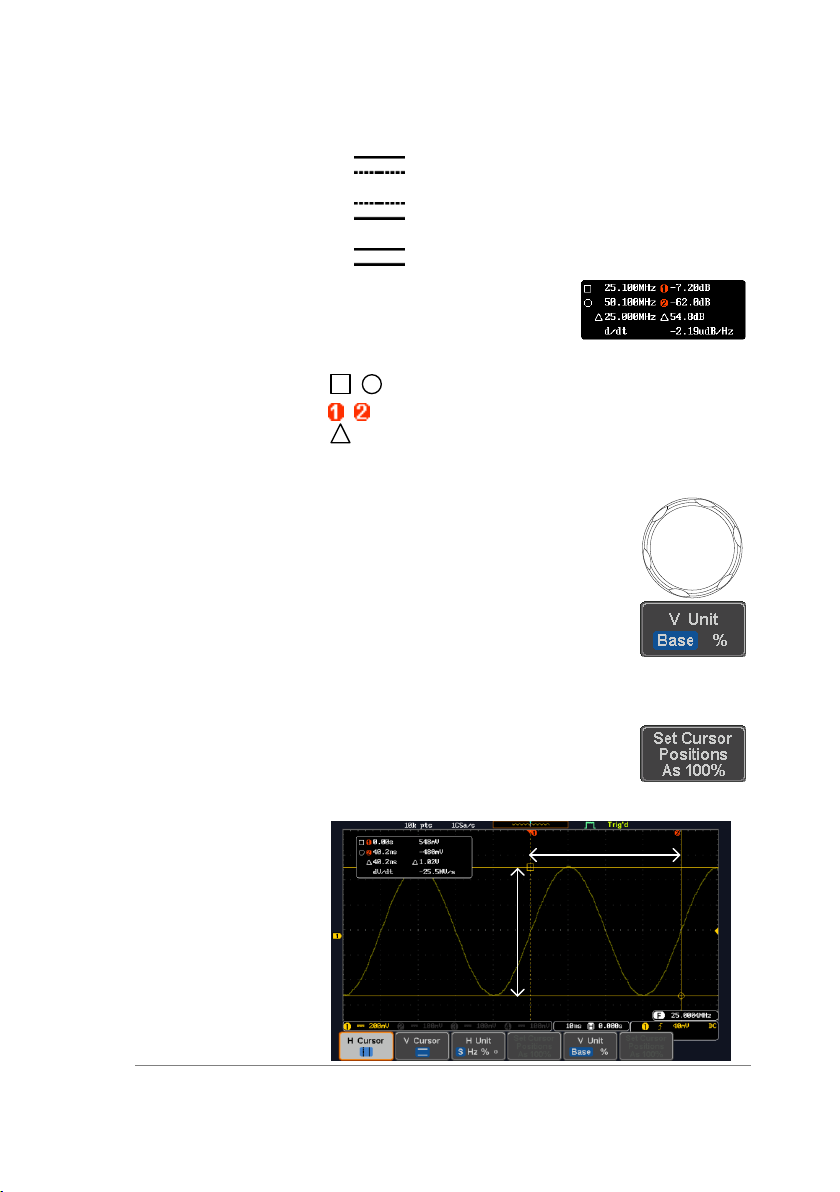
Phase or Ratio
Reference
7. To set the 0% and 100% ratio or
the 0˚ and 360˚ phase references
for the current cursor positions,
press Set Cursor Positions As
100%.
Example
Horizontal
cursors
FFT
FFT cursors can use different
units. For FFT details, see page
41. Cursor
Hor. position, dB/Voltage
Cursor
Hor. Position, dB/Voltage
Delta (difference between cursors)
dV/dt or d/dt
Example
Horizontal
cursors
XY Mode
XY mode cursors measure a number of X by Y
measurements.
35
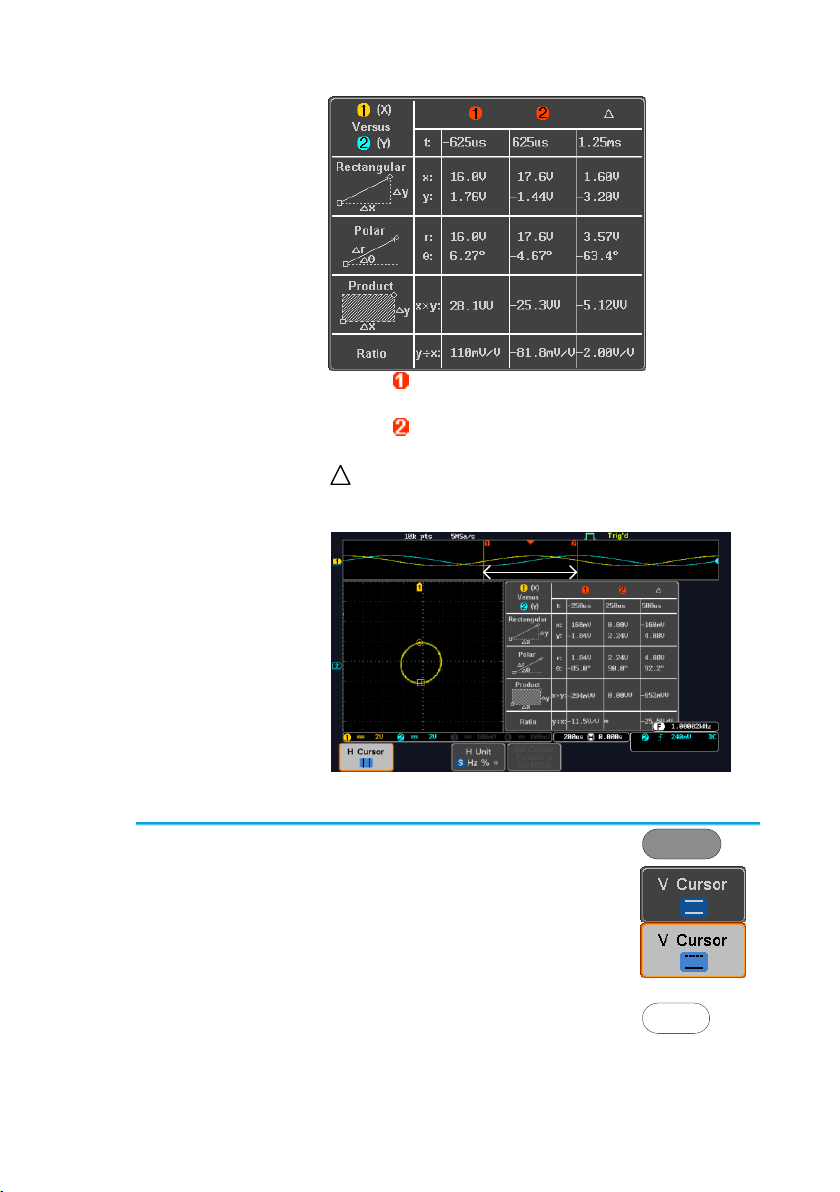
Cursor
Time, rectangular, polar coordinates, product, ratio.
Cursor
Time, rectangular, polar coordinates, product, ratio.
Delta (difference between cursors)
Example
Horizontal
cursors
Panel Operation/
Range
1. Press the Cursor key twice.
Cursor
x2
2. Press V Cursor from the bottom
menu if it is not already selected.
3. When the V Cursor is selected,
repeatedly pressing the V Cursor
key or the Select key will toggle
which vertical cursor is selected.
OR
Select
2-3-2. Use Vertical Cursors
36
Range
Upper cursor movable, lower
cursor position fixed
Lower cursor movable, upper
cursor position fixed
Upper and lower cursor movable
together
4. The cursor position
information appears on the
top left hand side of the
screen.
,
Time: cursor 1, cursor 2
,
Voltage/Current: cursor1, cursor2
Delta (difference between cursors)
dV/dt or dI/dt
5. Use the Variable knob to move the
cursor(s) up or down.
VARIABLE
Select Units
6. To change the units of the vertical
position, press V Unit.
Units
Base (source wave units), %
(ratio)
Base or Ratio
Reference
7. To set the 0% and 100% ratio
references for the current cursor
position, press Set Cursor
Positions As 100%.
Example
Horizontal
cursors
Vertical
cursors
37

FFT
FFT has different content. For
FFT details, see page 41.
,
Frequency/Time: cursor1, cursor2
,
dB/V: cursor1, cursor2
Delta (difference between cursors)
d/dt
Example
Horizontal
cursors
Vertical
cursors
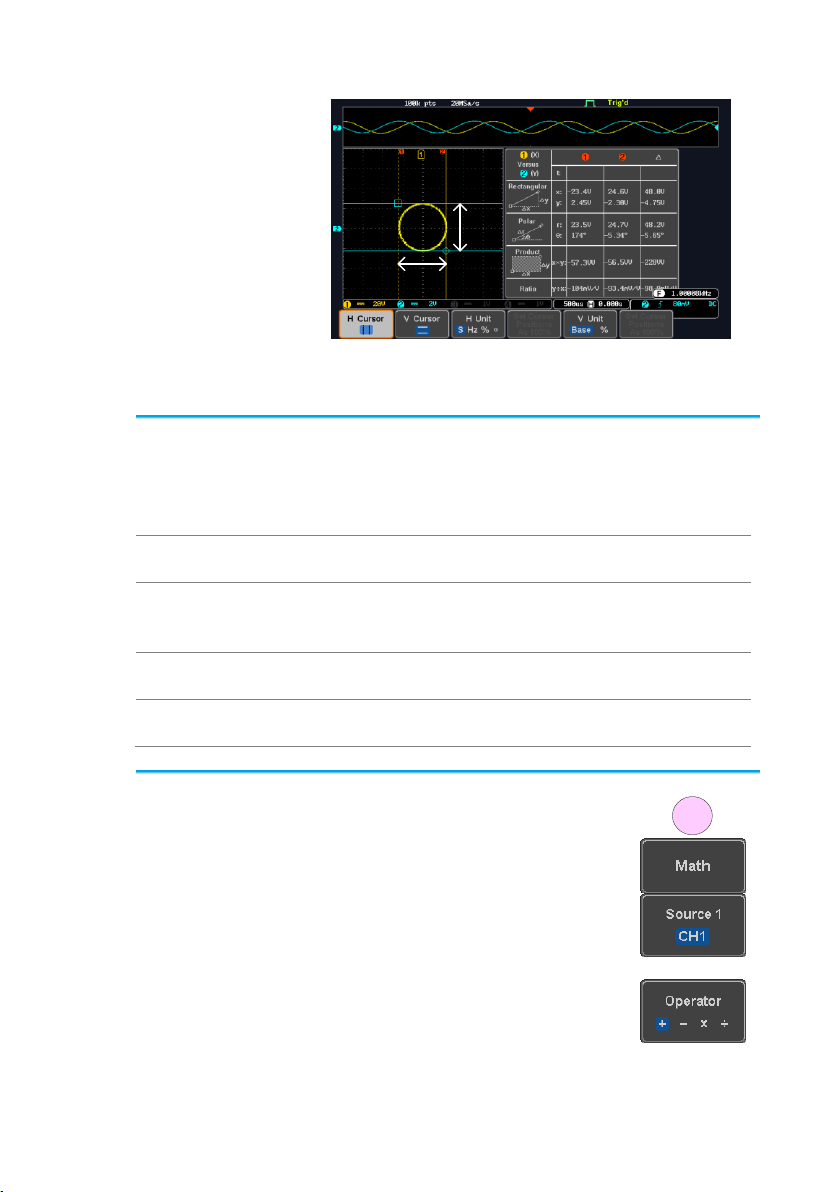
XY Mode
XY mode cursors measure a number of X by Y
measurements.
Cursor
Rectangular, polar co-ordinates,
product, ratio.
Cursor
Rectangular, polar co-ordinates,
product, ratio.
Delta (difference between cursors)
38
Example
Horizontal
cursors
Vertical
cursors
Background
The Math function performs basic math functions
(addition, subtraction, multiplication, division) on
the input signals or the reference waveforms. The
resultant waveform will be shown on the screen in
real-time.
Addition (+)
Adds the amplitude of two signals.
Source
CH1~4, Ref1~4
Subtraction (–)
Extracts the amplitude difference between two
signals.
Source
CH1~4, Ref1~4
Multiplication (×)
Multiplies the amplitude of two signals.
Source
CH1~4, Ref1~4
Division (÷)
Divides the amplitude of two signals.
Source
CH1~4, Ref1~4
Panel Operation
1. Press the Math key.
MATH
M
2. Press the Math key on the lower
bezel.
3. Select Source 1 from the side
menu
Range
CH1~4, Ref1~4
4. Press Operator to choose the math
operation.
Range
+, -, ×, ÷
2-4. Math Operation
2-4-1. Basic Math Overview & Operators
2-4-1-1. Addition/Subtraction/Multiplication/Division
39

5. Select Source 2 from the side
menu.
Range
CH1~4, Ref1~4
6. The math measurement result appears on the
display. The vertical scale of the math waveform
appears at the bottom of the screen.
From left: Math function, source1, operator,
source2, Unit/div
Example
Math
Source 2
Source 1
Position and
Unit
To move the math waveform vertically,
press the Position key from the side
menu and use the Variable knob to set
the position.
Range
–12.00 Div ~ +12.00 Div
To change the unit/div settings, press
Unit/div, then use the Variable knob to
change the unit/div.
The units that are displayed depend
on which operator has been selected,
and whether the probe for the
selected channel has been set to
voltage or current.
Operator:
Unit/div:
Multiplication
Division
Addition/Subtraction
VV, AA or W
V/V, A/A
V or A
Turn Off Math
To turn off the Math result from the
display, press the Math key again.
MATH
M
40

Background
The FFT Math function performs a Fast Fourier
Transform on one of the input signals or the
reference waveforms. The resultant spectrum will
be shown on the screen in real-time. Four types of
FFT windows are available: Hanning, Hamming,
Rectangular, and Blackman, as described below.
Hanning FFT
Window
Frequency resolution
Good
Amplitude resolution
Not good
Suitable for....
Frequency measurement on
periodic waveforms
Hamming FFT
Window
Frequency resolution
Good
Amplitude resolution
Not good
Suitable for....
Frequency measurement on
periodic waveforms
Rectangular FFT
Window
Frequency resolution
Very good
Amplitude resolution
Bad
Suitable for....
Single-shot phenomenon
(this mode is the same as
having no window at all)
Blackman FFT
Window
Frequency resolution
Bad
Amplitude resolution
Very good
Suitable for....
Amplitude measurement on
periodic waveforms
Panel Operation
1. Press the Math key.
MATH
M
2. Press FFT from the bottom menu.
3. Select the Source from the side
menu.
Range
CH1~4, Ref~4
4. Press the Vertical Units key from
the side menu to select the vertical
units used.
Range
Linear RMS, dBV RMS
2-4-2. FFT Overview & Window Functions
2-4-2-1. FFT Operation
41

5. Press the Window key from the
side menu and select the window
type.
Range
Hanning, Hamming, Rectangular,
and Blackman.
6. The FFT result appears. For FFT, the horizontal
scale changes from time to frequency, and the
vertical scale from voltage/current to dB/RMS.
Math
Source
Position and
Scale
To move the FFT waveform vertically,
press Vertical until the Div parameter
is highlighted and then use the
Variable knob.
Range
–12.00 Div ~ +12.00 Div
To select the vertical scale of the FFT
waveform, press Vertical until the dB
or voltage parameters are highlighted
and then use the Variable knob.
Range
2mV~1kV RMS, 1~20 dB
Horizontal
Position and
Scale
To move the FFT waveform
horizontally, press Horizontal until the
Frequency parameter is highlighted
and then use the Variable knob.
Range
0Hz ~ 2.5MHz
To select the horizontal scale of the
FFT waveform, press Horizontal
repeatedly until the Hz/div parameter
is highlighted and then use the
Variable knob.
Range
10kHz/Div ~ 250kHz/Div
42

Background
The advanced math function allows complex math
expressions to be created based on the input
sources, reference waveforms or even the
automatic measurements available from the
Measure menu (see page 24).
An overview of each of the major parameters that
can be used in the advanced math function are
shown below:
Expression
Displays the function expression as it is created.
Source
Selects the source signal.
Source
CH1~4, Ref1~4
Function
Adds a mathematical function to the expression.
Function
Intg, Diff, log, Ln, Exp, Sqrt, Abs,
Rad, Deg, Sin, Cos, Tan, Asin,
Acos, Atan
Variable
Adds a user-specified variable to the expression.
Source
CH1~4, Ref1~4
Operator
Adds an operator or parenthesis to the function
expression.
Operator
+, -, *, /, (, ), !(, <, >, <=, >=, ==, !=,
||, &&
Figure
Adds a value to the expression.
Figure
Integers, floating point, or floating
point with exponent values.
Measurement
Adds automatic measurements to the expression.
Not all automatic measurements are supported.
Measurement
Pk-Pk, Max, Min, Amp, High, Low,
Mean, CycleMean, RMS,
CycleRMS, Area, CycleArea,
ROVShoot, FOVShoot, Freq,
Period, Rise, Fall, PosWidth,
NegWidth, Dutycycle, FRR, FRF,
FFR, FFF, LRR, LRF, LFR, LFF,
Phase, RPRFShoot, FPREShoot,
+Pulses, -Pulses, +Edges, -Edges
2-4-3. Advanced Math Overview
43
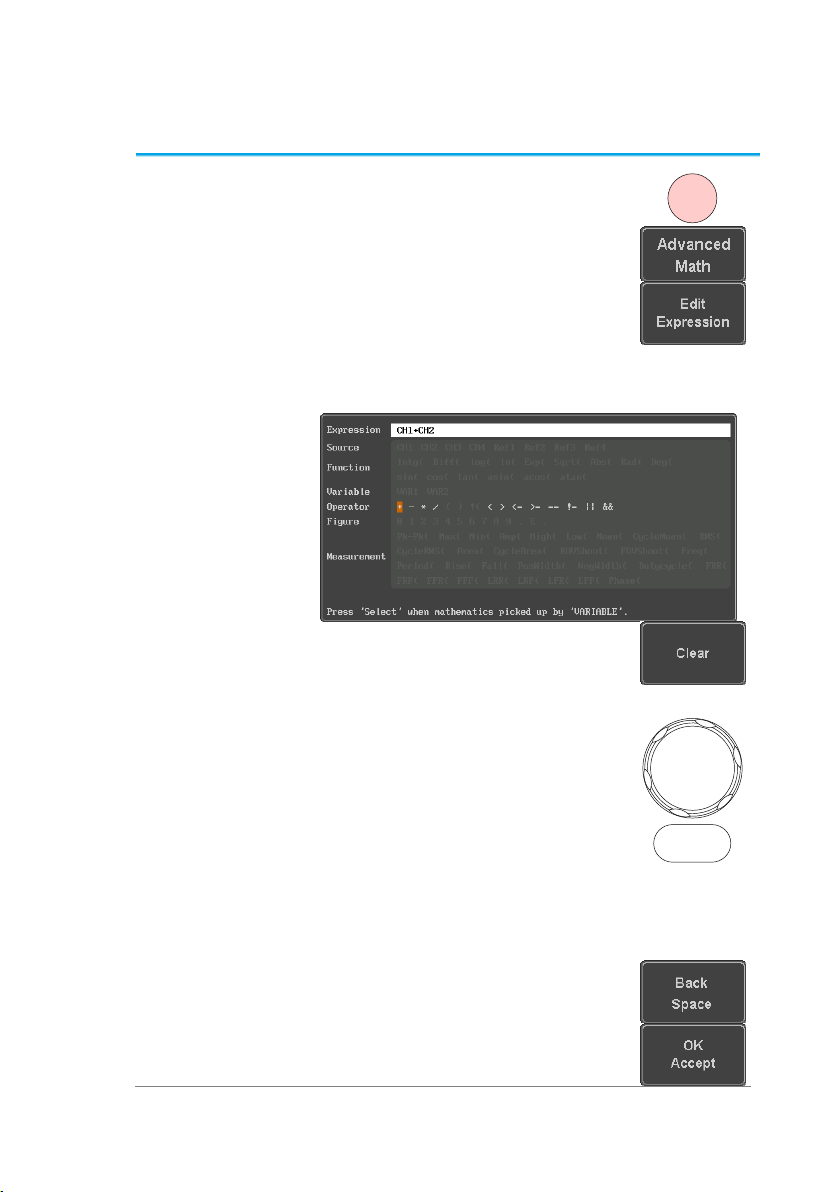
Panel Operation
1. Press the Math key.
M
MATH
2. Press Advanced Math from the
bottom menu.
3. Press Edit Expression.
4. The Edit f(x) screen appears. CH1 + CH2 is
shown in the expression box as an example at
startup.
5. Press Clear to clear the expression
entry area.
6. Use the Variable knob and Select
key to create an expression.
Use the Variable knob to highlight
a source, function, variable,
operator, figure or measurement in
orange.
Press the Select key to make the
selection.
If a particular parameter is grayed
out, it indicates that that particular
parameter is not available at that
time.
VARIABLE
Select
Back Space
1. To delete the last parameter press
Back Space.
2. When the expression is complete,
press OK Accept.
2-4-4. Advanced Math Operation
44
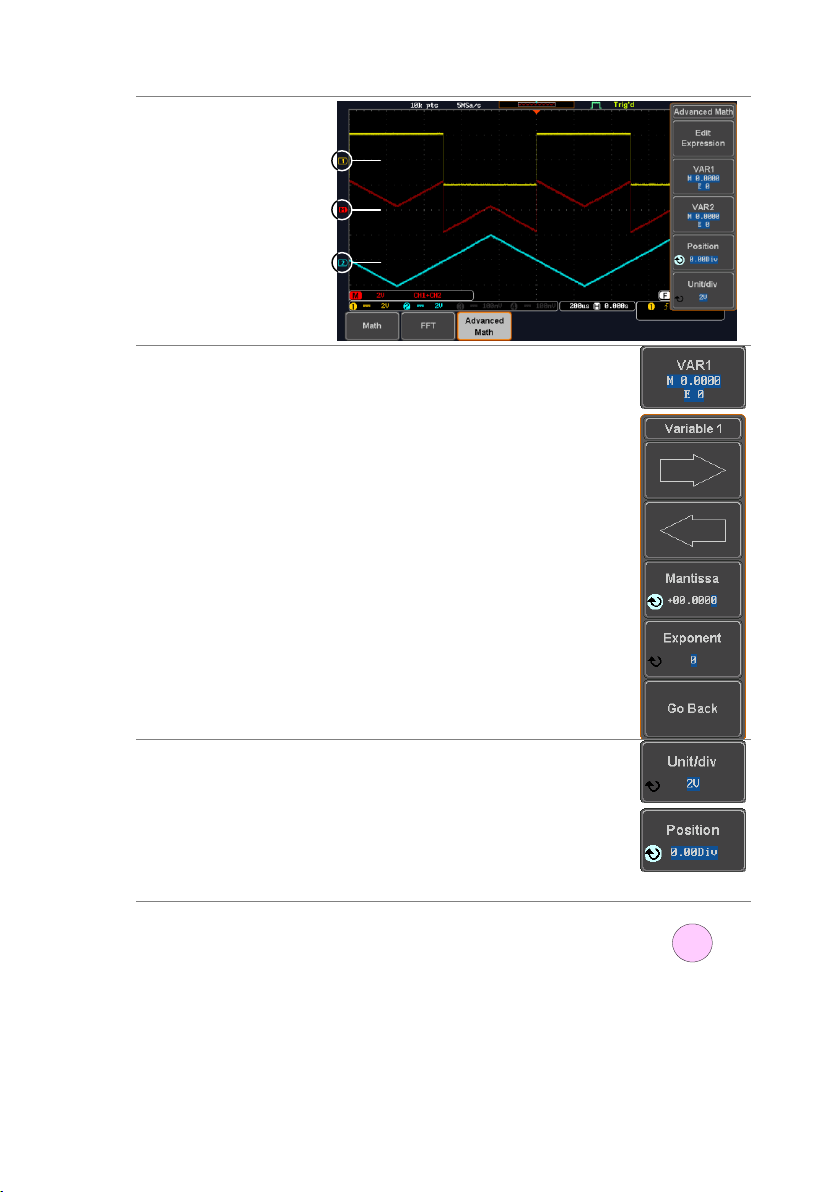
Example:
CH1 + CH2
Advanced Math
Source1
Source2
Set the VAR1 &
VAR2
1. Press VAR1 or VAR2 to set
VAR1/VAR2 if they were used in
the expression created previously.
2. Press Mantissa.
Use the Left and Right arrow keys
to select a digit and use the
variable knob to set the value of
the selected digit.
3. Press Exponent.
Use the Variable knob to set the
exponent of the variable.
4. Press Go Back to finish editing
VAR1 or VAR2.
Vertical Position
and Scale
1. Press Unit/div and use the Variable
knob to set the vertical scale of the
math waveform.
2. Press Position and use the
Variable knob to set the vertical
position of the math waveform on
the display.
Clear Advanced
Math
To clear the advanced math result
from the display, press the Math key
again.
MATH
M
45

Background
The acquisition mode determines how the samples
are used to reconstruct a waveform.
Sample
This is the default acquisition
mode. Every sample from each
acquisition is used.
Peak detect
Only the minimum and maximum
value pairs for each acquisition
interval (bucket) are used. This
mode is useful for catching
abnormal glitches in the signal.
Average
Multiple acquired data is
averaged. This mode is useful for
drawing a noise-free waveform. To
select the average number, use
the Variable knob.
Average number: 2, 4, 8, 16, 32,
64, 128, 256
Panel Operation
1. Press the Acquire key.
Acquire
2. To set the Acquisition mode, press
Mode on the bottom menu.
3. Select an acquisition mode from
the side menu.
4. If Average was chosen, set the
number of samples to be used for
the average function.
Mode
Sample, Peak
Detect, Average
Average
sample
2, 4, 8, 16, 32, 64,
128, 256
3. CONFIGURATION
3-1. Acquisition
The Acquisition process samples the analog input signals and
converts them into digital format for internal processing.
3-1-1. Select Acquisition Mode
46
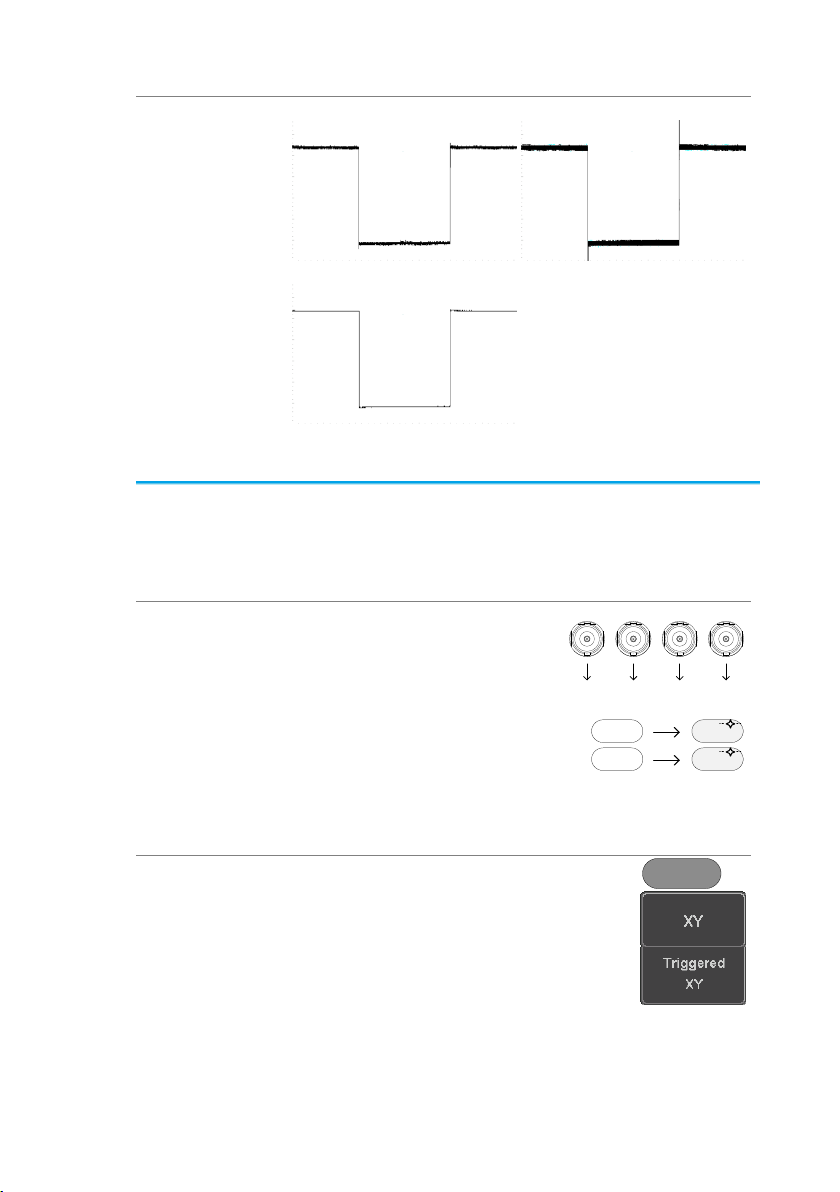
Example
Sample
Peak Detect
Average (256 times)
Background
The XY mode maps the input of channel 1 to the
input of channel 2. In 4 channel models, the input
of channel 3 can be mapped to the input of
channel 4. This mode is useful for observing the
phase relationship between waveforms.
Connection
1. Connect the signals to
Channel 1 (X-axis) and
Channel 2 (Y-axis) or
Channel 3 (X2-axis) and
Channel 4 (Y2-axis).
CH3CH2CH1 CH4
YX X2 Y2
2. Make sure a channel pair is
active (CH1&CH2 or
CH3&CH4). Press the
Channel key if necessary. A
channel is active if the
channel key is lit.
CH1 CH1
CH2 CH2
Panel Operation
3. Press the Acquire menu key.
Acquire
4. Press XY from the bottom menu.
5. Choose Triggered XY from the side
menu.
3-1-2. Show Waveform in XY Mode
47
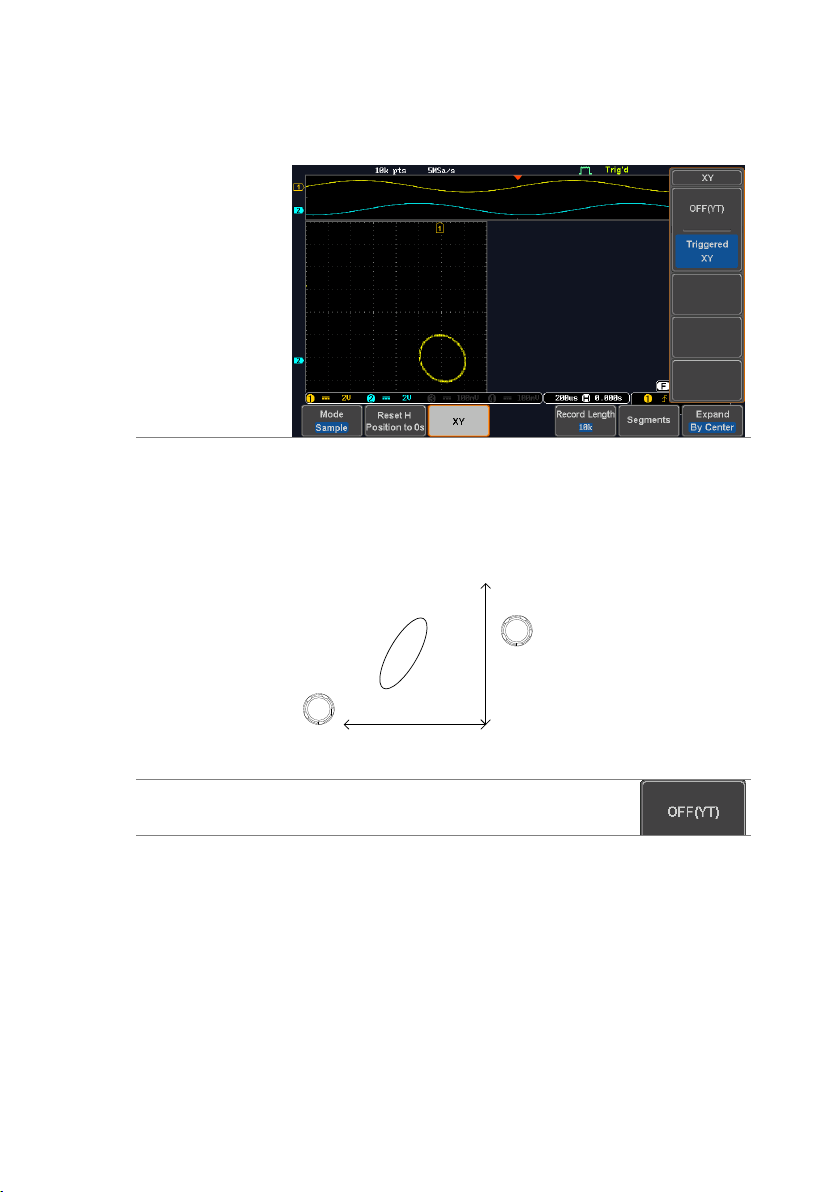
X-Y mode is split into two windows. The top
window shows the signals over the full time range.
The bottom window shows XY mode.
To move the X Y waveform position, use the
vertical position knob: Channel 1 knob moves the
X Y waveform horizontally, Channel 2 knob moves
the X Y waveform vertically. Similarly, the X2 and
Y2 axis can be positioned using the channel 3 and
channel 4 vertical position knobs.
POSITION
CH1
POSITION
CH2
The horizontal position knob and horizontal Scale
knob can still be used under the XY mode.
Turn Off XY
Mode
To turn off XY mode, choose OFF (YT)
mode.
Cursors and XY
Mode
Cursors can be used with XY mode.
See the Cursor chapter for details.
Page 33
48

Background
The number of samples that can be stored is set
by the record length. Record length is important in
an oscilloscope as it allows longer waveforms to be
recorded.
The maximum record length for the DCS-1000B
depends on operating mode. The table below
describes the record lengths that are available for
each mode.
Limitations
Record
Length
Normal
Zoom
FFT
FFT in Zoom
Window
1k
✓ ✗ ✓
✗
10k
✓ ✓ ✓
✓
100k
✓ ✓ ✓
✓
1M
✓ ✓ ✓
✗
10M
✓ ✓ ✗
✗
Panel Operation
1. Press the Acquire key.
Acquire
2. Press the Record Length key on
the bottom menu and choose the
record length.
Record length
1000, 10k, 100k, 1M, 10M
points
Note
The sampling rate may also be changed when the
record length is changed.
3-1-3. Set the Record Length
3-2. Segmented Memory Acquisition (Option)
The advanced segmented memory utility allows the scope memory
to be divided into different segments. Each time the scope is
triggered, it only acquires data for one segment of memory at a time.
This allows you to optimize the scope memory to only perform signal
acquisition during important signal events.
For example, for a signal with a number of pulses, normally the
oscilloscope will acquire the signal until the acquisition memory of
the scope is filled up and then it will re-arm the trigger and then
capture again. This could result in a number of events not being
captured or captured at a less-than-desired resolution (depending
on the horizontal scale and sampling rate). However, the segmented
memory function would effectively allow you to capture more of the
49

Normal memory acquisition period Rearm time Next trigger
SegmentnSegment
n+1
Segment
n+2
Segment
n+3
Segment
n+4
Segment
n+5
signal than you would otherwise. The diagrams below illustrate this
point.
Normal acquisition mode example:
Segmented memory acquisition example:
As shown above, the memory is divided into segments to increase
the number of events that can be effectively captured with the same
acquisition memory. Also notice that the scope doesn’t need to
rearm the trigger between each segment, this makes the segmented
memory function especially useful for high speed signals. The time
between each segment is also recorded so that accurate signal
timing can also be measured.
The segmented memory function also supports automatic
measurements for each segment or statistics for all the captured
segments.
50
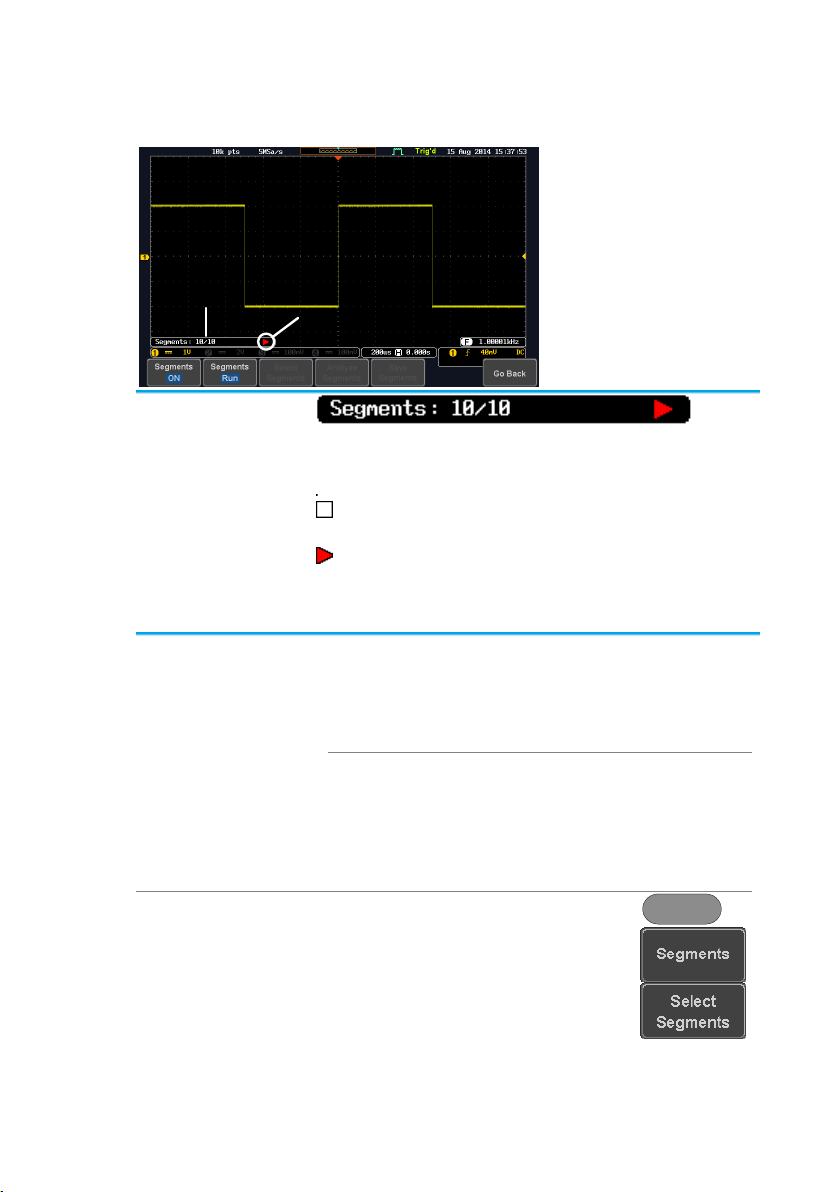
Run/Stop Indicator
Progress Indicator
Progress Indicator
Indicates the number of segments that have to
been captured relative to the set number of
segments.
Run/Stop Indicator
Stop: The segments have finished
acquiring or have been stopped.
Run: The scope is ready to acquire
segments.
Note
Before the Segment function can be used, set the
trigger settings as appropriate for the signal you
wish to use. The number of segments that can be
used depends wholly on the record length. See
page 49 to set the record length.
Record length
Number of segments
1000 pt.
1 ~ 29000
10k pt.
1 ~ 2900
100k pt.
1 ~ 290
1M pt.
1 ~ 20
10M pt.
1 ~ 2
Panel Operation
1. Press the Acquire key.
Acquire
2. Press Segments on the bottom
menu.
3. Press Select Segments and set the
number of segments from the side
menu.
3-2-1. Segments Display
3-2-2. Set the Number of Segments
51
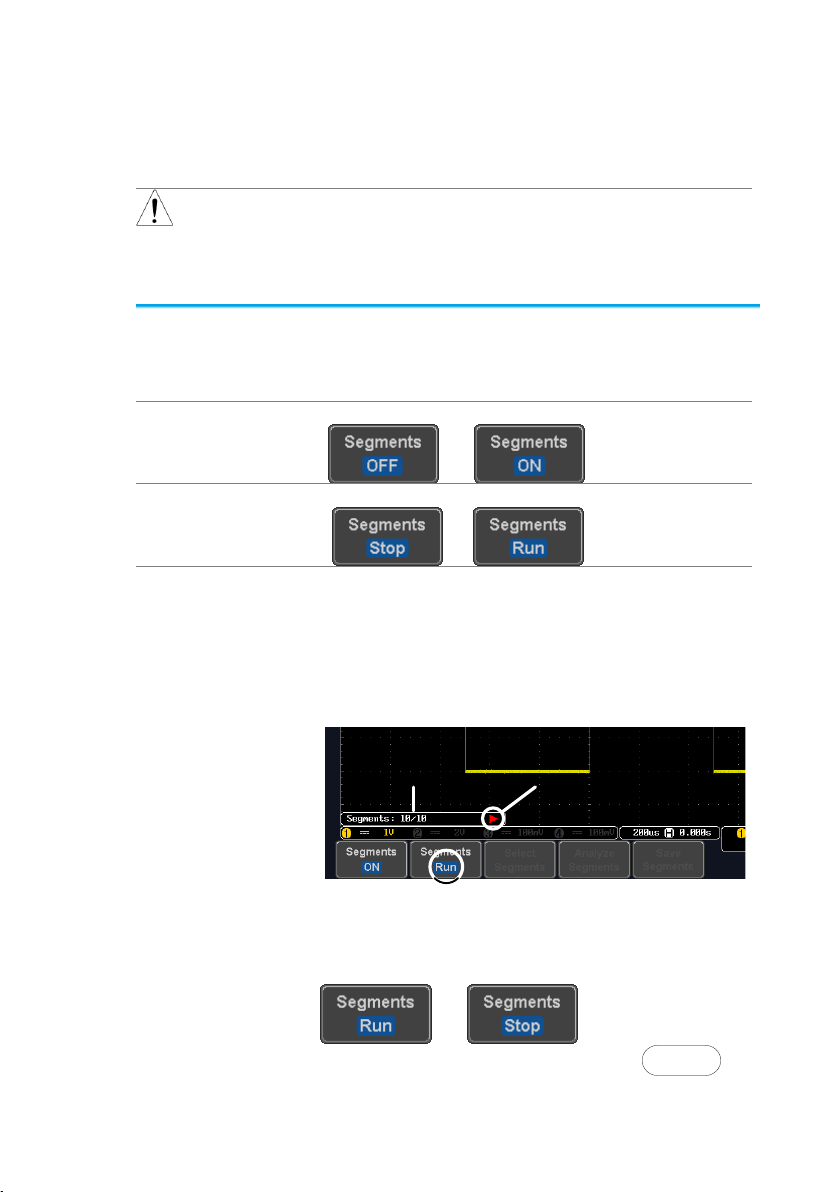
Num of Seg
1~29000 (record length
dependant)
Set to Maximum
Sets to the maximum number
Set to Minimum
Sets to 1 segment
Note
The Select Segments icon is only available when
when Segments = OFF or when Segments is in the
STOP mode (see the section below).
Background
Before the Segmented Memory function can be
used, set the trigger settings as appropriate for the
signal you wish to use. See page 89 for configuring
the trigger settings.
Run Segments
1. Toggle Segments On from the bottom menu.
2. Toggle Segments Run from the bottom menu.
3. The scope will automatically start acquiring
segments. The progress of the segmented
memory capture is shown in the Progress
Indicator.
4. The Run Indicator will be shown when in the
Run mode and the Segments icon will also
indicate that the function is in run mode.
Run Indicator
Progress Indicator
Segment (Run )icon
5. When the scope has finished acquiring
segments, press Segments Run to toggle the
mode to the Segments Stop mode.
Alternatively, the Run/Stop key can
be pressed.
Run/Stop
3-2-3. Run Segmented Memory
52
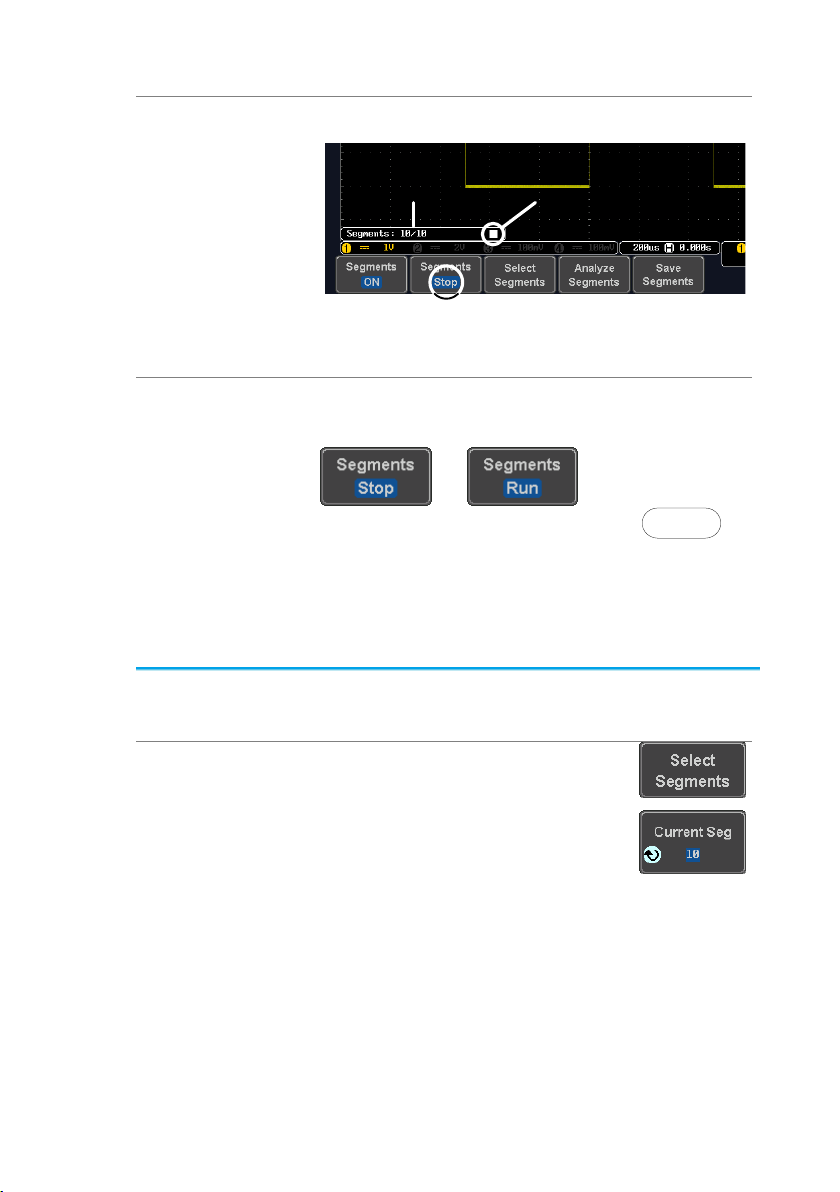
6. The Stop Indicator will be shown when in the
Stop mode.
Stop Indicator
Progress Indicator
Segment (Stop )icon
The scope is now ready to navigate or analyze the
acquired segments.
Rerun
Segmented
Acquisition
7. To rerun the segments, press the Segments
Stop key to toggle the mode back to the
Segments Run mode.
Alternatively, press the Run/Stop
key again.
Run/Stop
8. Repeat steps 3 and 4 in the section above
when the segmented acquisition has
completed.
Background
After the segmented memory acquisitions have
been captured you can navigate through each
segment one at a time.
Operation
1. Press Select Segments from the
bottom menu. This key will be
available in the Stop mode.
2. To navigate to the segment of
interest, press Current Seg from
the side menu and use the Variable
knob to scroll to the segment of
interest.
Alternatively, the Set to Minimum
and Set to Maximum keys can be
used to jump to the first and last
segment respectively.
3-2-4. Navigate Segmented Memory
53

3. The position in time of the selected
segment relative to the time of the
first segment is shown in the
Segments Time key.
Background
When all the segments have been acquired, the
play/pause key can be used to play back through
each segment.
Operation
1. Make sure the scope is in Segments Stop
mode. See page 52 for details.
2. Press the Play/Pause key to run
through the acquired segments in
numerical order.
Press the Play/Pause key again
to pause the playback.
When the scope has played
through to the last segment,
pressing the Play/Pause key
again will play through each
segment again in reverse order.
Background
The Segmented memory function can be used in
conjunction with the automatic measurements in
the Measurement menu.
Modes
Segments
Measure
This function will either perform
statistics calculations on the
segments or tabulate a list of the
measurement results.
Segments
Info
Provides configuration information
common for all the acquired
memory segments.
Background
The Segments Measure function allows you to
view automatic measurements for the segments in
statistical bins or as a list displaying the result of
each automatic measurement.
3-2-5. Play Through Each Segment
3-2-6. Segment Measurement
3-2-7. Automatic Measurement
54

Statistics
This function will bin the
measurement results of a single
automatic measurement into a
user-defined number of bins.
This allows you to easily view
statistics for a large number of
segments. For example, the
statistics function will display
the number of results for each
bin and the measurement range
of each bin for the selected
automatic measurement.
Measurement
List
Puts all the measurement
results for a segment in a list.
All the currently selected
automatic measurement results
are listed. A maximum of 8
automatic measurements can
be used with this function.
Note
To use automatic measurements with the
segmented memory, automatic measurements
must first be selected from the Measure menu
before the segmented memory function is run.
Setup
Press the Measure key and select
any single source measurement
from the Add Measurement menu.
See page 27 for details on how to
add automatic measurements.
Measure
Operation
1. Press Analyze Segments from the
Segments menu.
Note: This key will only be
available in the Stop mode.
2. Press Segments Measure.
3. Select either the
statistics or the
measurement list from
the side menu.
Statistics
List
55
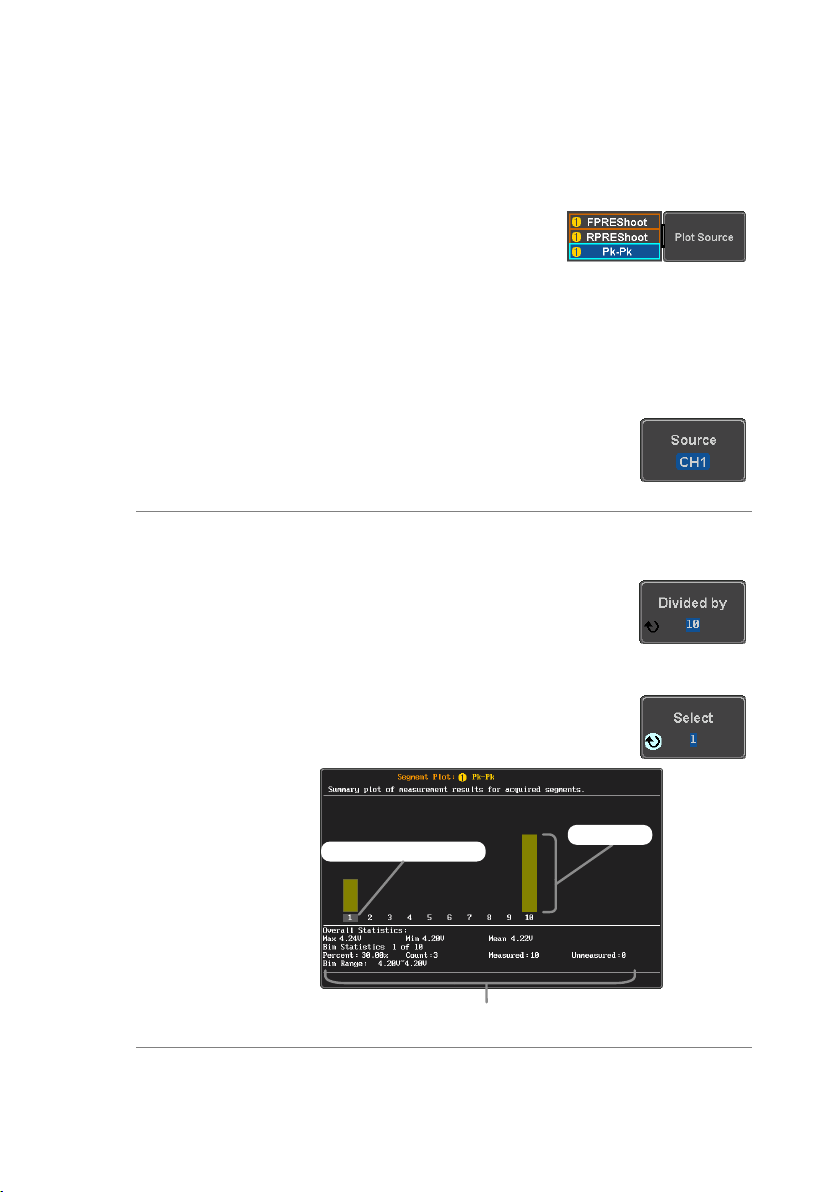
4. The statics table or measurement list appears
on the display.
Note that the more segments that you have, the
longer it will take to calculate the statics or list
the measurement results.
5. For statistic
measurements, press Plot
Source to choose which
automatic measurement to
use for the statistics
calculations. The statistics
for only one automatic
measurement can be
viewed at a time.
6. For the measurement list, press
Source and select the source
channel for measurement.
Range
CH1 ~ CH4
Statistics
Results
This function will bin the measurement results of
the selected automatic measurement into a userdefined number of bins.
Setup
1. To select the number of bins for the
statistics, press Divided by and
select the number of bins with the
Variable knob.
Range
1~20 bins
2. Press Select and use the Variable
knob to view the measurement
results for each bin.
Example:
Statistics
Statistics of currently
selected bin
Cursor/selected bin
Bin count
Measurement
List
Puts all the measurement results for a segment in
a list.
56
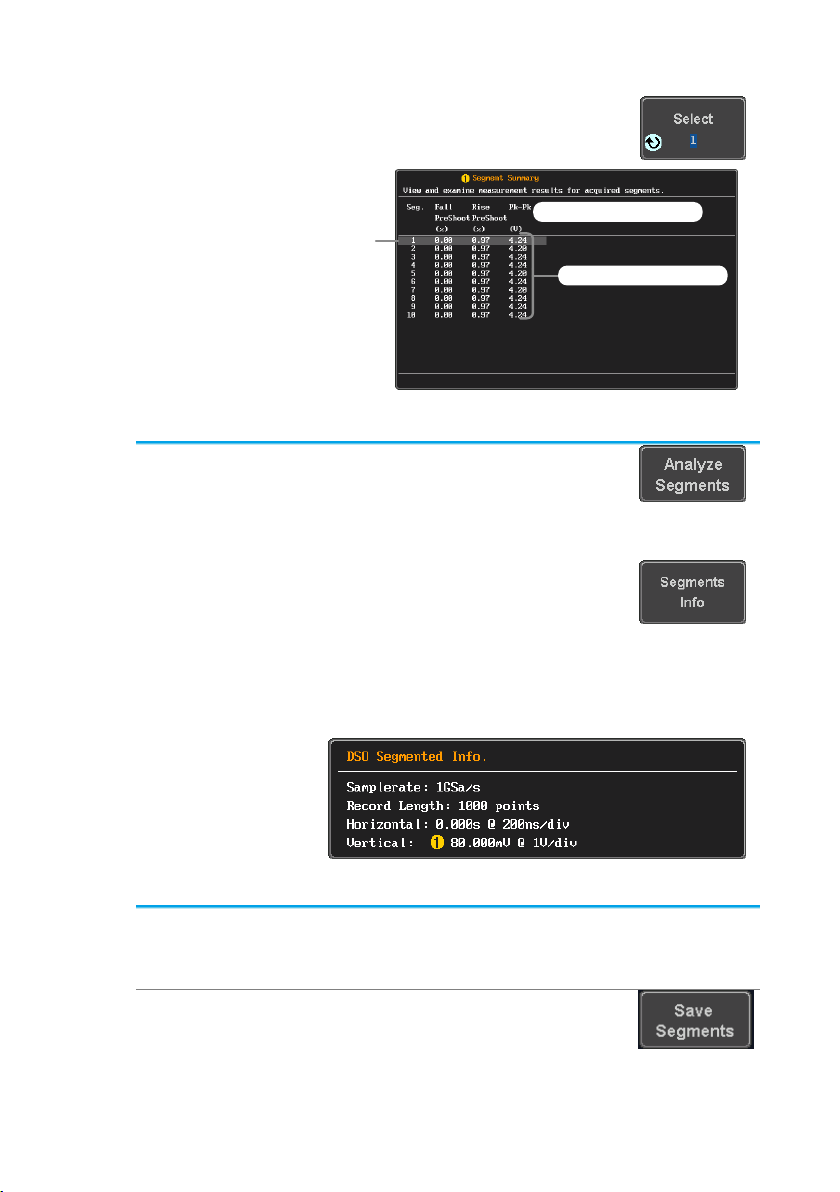
Setup
1. Press Select and use the variable
knob to scroll through each
segment.
Example:
Measurement
List
Select
cursor
Measurement results
Measurement types
Operation
1. Press Analyze Segments from the
bottom menu.
Note: This key will only be
available in the Stop mode.
2. Press Segments Info.
3. A table showing all general setting information
for the segmented memory acquisitions is
shown on the display.
Info:
Sample rate, Record length,
Horizontal, Vertical
Background
Segments waveform data can be saved in CSV
format by specifying a section.
Operation
1. Press Save Segment from the
bottm menu.
3-2-8. Segment Info
3-2-9. Save Segment
57
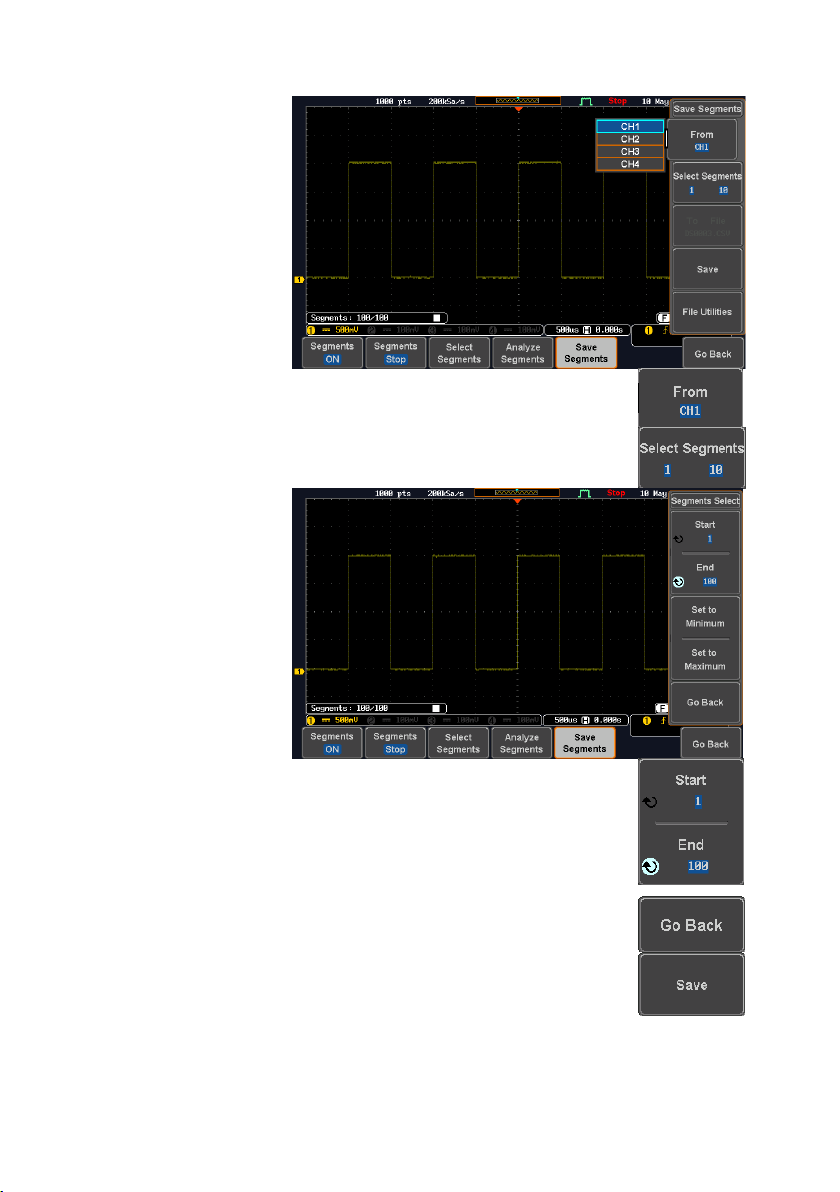
2. Press From key and Select
channel.
3. Press Select Segment.
4. Press Start from the side menu
and use the Variable knob to scroll
to the segment of Start.
5. Press End from the side menu and
use the Variable knob to scroll to
the segment of End.
6. Press Go Back to return to the
previous menu.
7. Press Save to save the file.
58
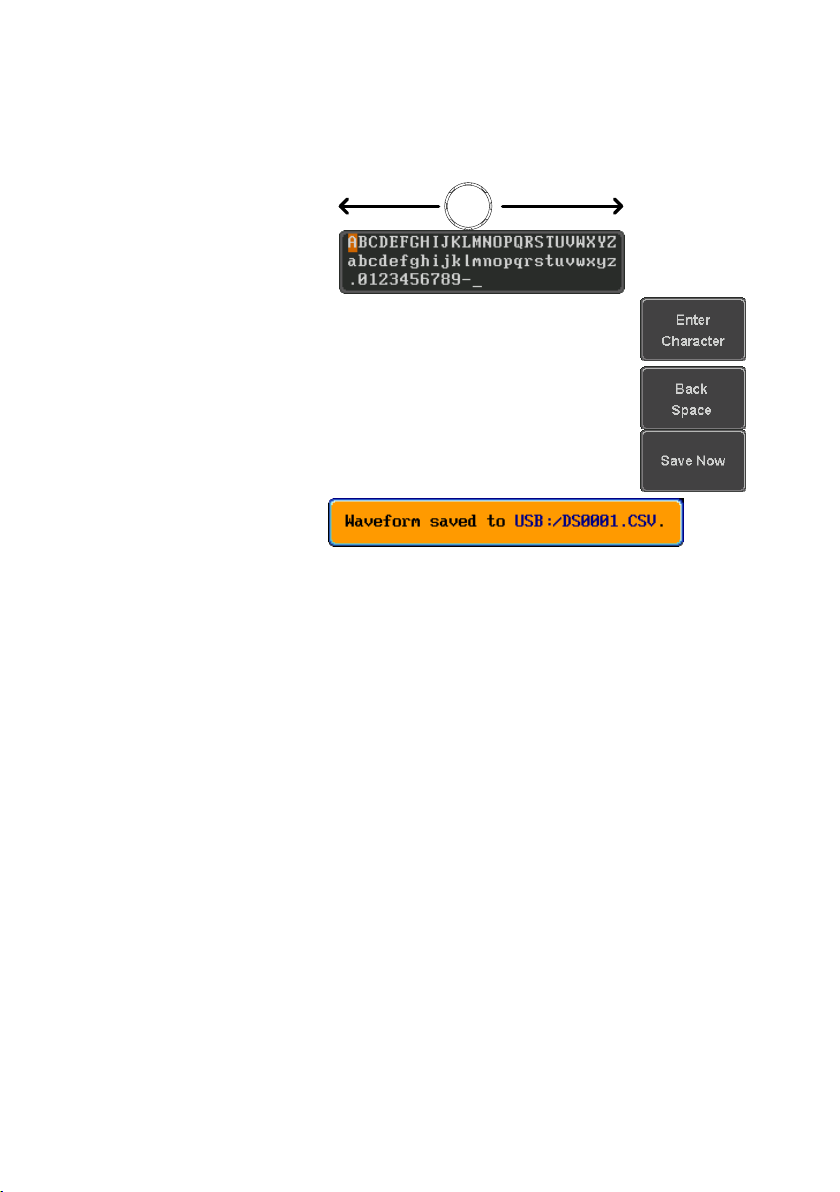
8. To edit the filename, use the Variable knob to
highlight a character.
VARIABLE
Press Enter Character or the
Select key to select a number or
letter.
Press Back Space to delete a
character.
9. Press Save Now to save the file.
The filename need not have been
edited to save the file.
10. There are two types of waveform data, Fast
CSV format and Detail CSV format .
Please switch as necessary. (See 5-3-3. )
If LSF format is selected, it is saved with Detail
CSV format.
59
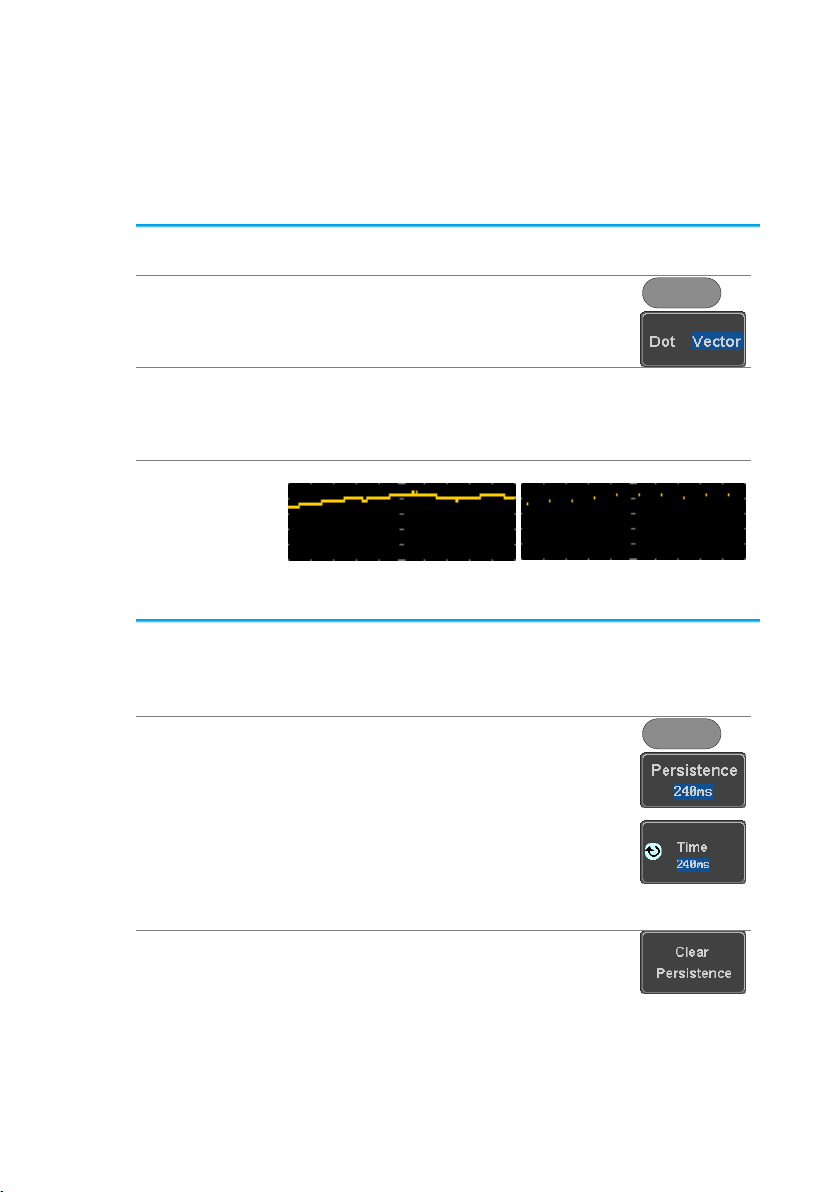
Background
When the waveform is displayed on the screen, it
can be displayed as dots or vectors.
Panel Operation
1. Press the Display menu key.
Display
2. Press Dot / Vector to toggle
between Dot and Vector mode.
Range
Dots
Only the sampled dots are
displayed.
Vectors
Both the sampled dots and the
connecting line are displayed.
Example:
Vectors
Dots
Background
The persistence function allows the DCS-1000B to
mimic the trace of a traditional analog oscilloscope.
A waveform trace can be configured to “persist” for
a designated amount of time.
Panel Operation
1. Press the Display menu key.
Display
2. To set the persistence time, press
the Persistence menu button on
the bottom bezel.
3. Use the Variable knob to select a
persistence time.
Time
16ms, 30ms, 60ms, 120ms, 240ms,
0.5s, 1s, 2s,~4s, Infinite, Off
Clear
To clear persistence, press Clear
Persistence.
3-3. Display
The Display menu defines how the waveforms and parameters
appear on the main LCD display.
3-3-1. Display Waveform as Dots or Vectors
3-3-2. Set the Level of Persistence
60
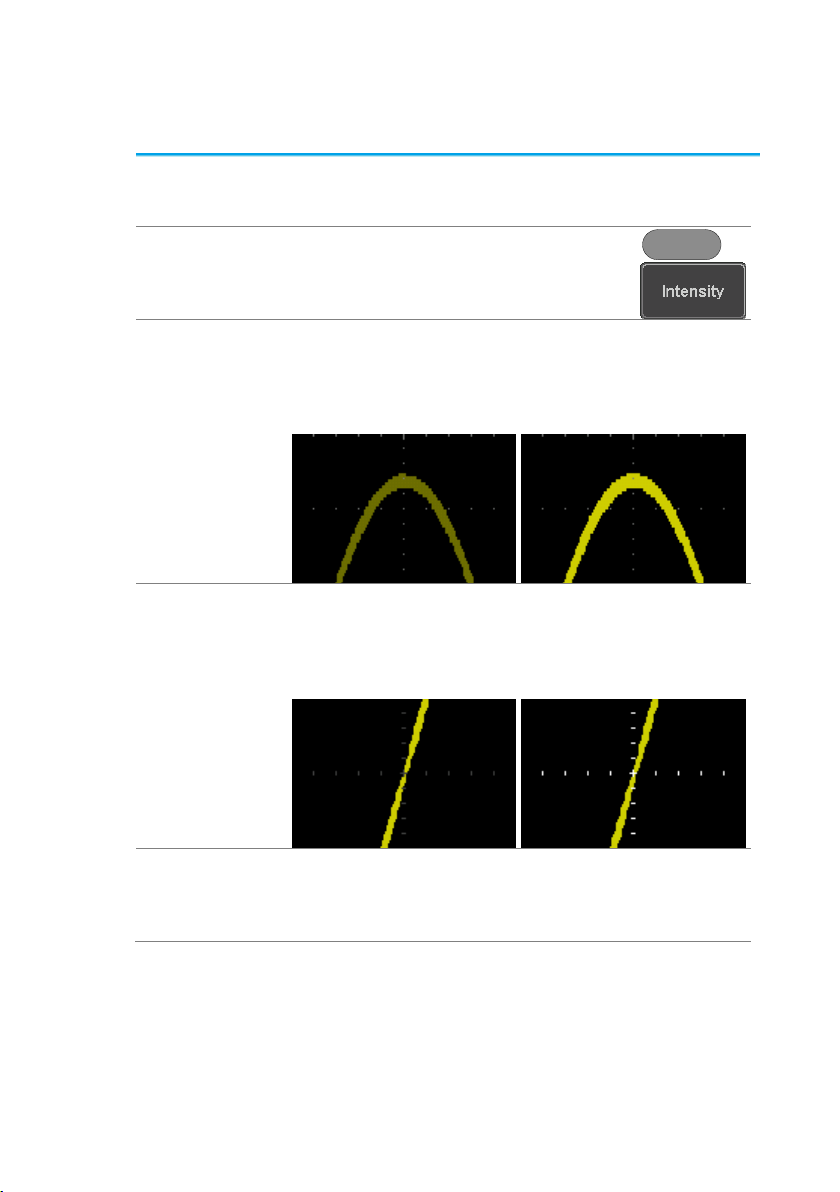
Background
The intensity level of a signal can also be set to
mimic the intensity of an analog oscilloscope by
setting the digital intensity level.
Panel Operation
1. Press the Display menu key.
Display
2. Press Intensity from the bottom
menu.
Waveform
Intensity
3. To set the waveform intensity, press Waveform
Intensity and edit the intensity.
Range
0~100%
Example
Waveform Intensity 50%
Waveform Intensity
100%
Graticule
Intensity
4. To set the graticule intensity, press Graticule
Intensity from the side menu and edit the
intensity value.
Range
10~100%
Example
Graticule Intensity 10%
Graticule Intensity 100%
Backlight
Intensity
5. To set the LCD backlight intensity, press
Backlight Intensity from the side menu and edit
the intensity value.
Range
2~100%
3-3-3. Set the Intensity Level
61

Backlight AutoDim
6. To automatically dim the backlight after a set
duration, set Backlight Auto-Dim to On and then
set Time to the appropriate time.
After the set amount of time with no panel
activity, the screen will dim until a panel key is
pressed again. This function will prolong the life
of the LCD display.
Range
1~180 min
Panel Operation
1. Press the Display menu key.
Display
2. Press Graticule from the bottom
menu.
3. From the side menu choose the
graticule display type.
Full: Shows the full grid; X and Y
axis for each division.
Grid: Show the full grid without the
X and Y axis.
Cross Hair: Shows only the center X
and Y frame.
Frame: Shows only the outer frame.
Panel Operation
1. Press the Run/Stop key. The
Run/Stop key turns red and
waveform acquisition is
paused.
Run/Stop Run/Stop
2. The waveform and the trigger
freezes. The trigger indicator on
the top right of the display shows
Stop.
3-3-4. Select Display Graticule
3-3-5. Freeze the Waveform (Run/Stop)
For more details about Run/Stop mode, see page 21.
62
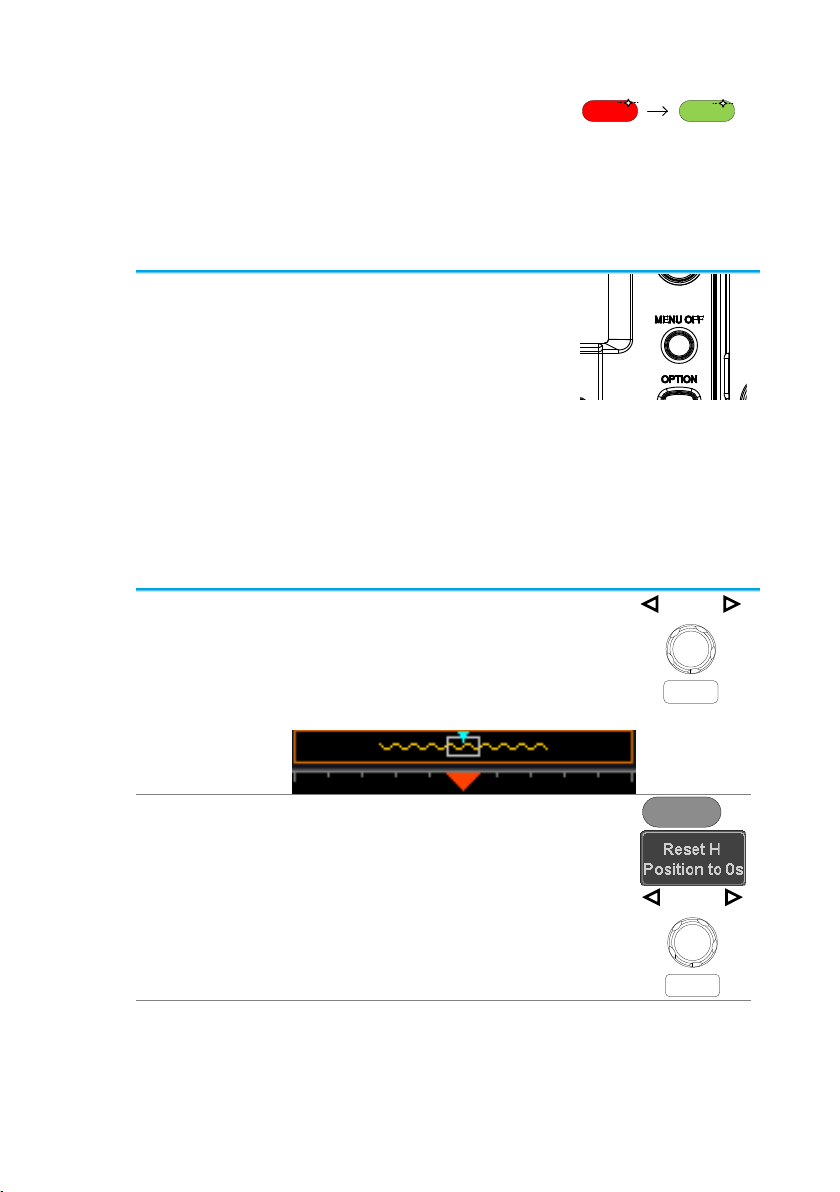
3. To unfreeze the waveform,
press the Run/Stop key
again. The Run/Stop key
turns green again and
acquisition resumes.
Run/Stop Run/Stop
Panel Operation
4. Press the Menu Off key
below the side menu keys to
reduce a menu. The menu
key needs to be pressed
each time to reduce one
menu.
See page 14 for more
information.
VARIABLE
POSITION
HORIZONTAL
POSITION
POSITION
POSITION
POSITION
VERTICAL
MATH
REF
BUS
SCALE
TRIGGER
LEVEL
PUSH TO
ZERO
SCALESCALESCALE
PUSH TO
ZERO
PUSH TO
ZERO
PUSH TO
ZERO
PUSH TO
ZERO
PUSH TO
ZERO
SCALE
Measure
Display
Cursor
Help
Test
Save/Recall
Acquire
Utility
Autoset
Run/Stop
Single
Default
Select
Search
Set/Clear
Zoom
CH1 CH2 CH3 CH4
M
R
B
Menu
50 %
Panel Operation
The horizontal position knob moves
the waveform left/right.
As the waveform moves, a position
indicator on the on the top of the
display indicates the horizontal
position of the waveform in memory.
POSITION
PUSH TO
ZERO
Reset Horizontal
Position
1. To reset the horizontal position,
press the Acquire key and then
press Reset H Position to 0s from
the bottom menu.
Alternatively, pushing the
horizontal position knob will also
reset the position to zero.
Acquire
POSITION
PUSH TO
ZERO
Run Mode
In Run mode, the memory bar keeps its relative
position in the memory since the entire memory is
continuously captured and updated.
3-3-6. Turn Off Menu
3-4. Horizontal View
This section describes how to set the horizontal scale, position, and
waveform display mode.
3-4-1. Move Waveform Position Horizontally
63
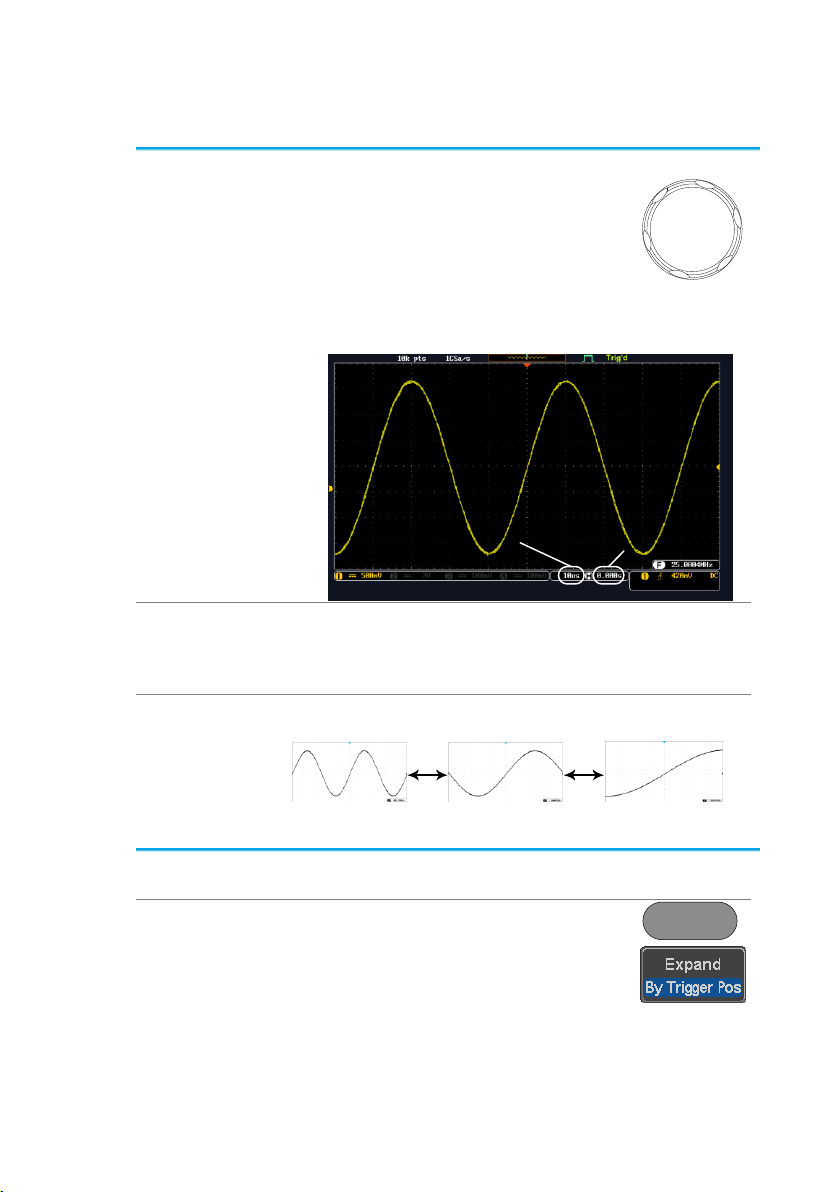
Select
Horizontal Scale
To select the timebase (time/div), turn
the horizontal Scale knob; left (slow)
or right (fast).
SCALE
Range
5ns/div ~ 100s/div, 1-2-5 increment
The timebase indicator updates as the horizontal
scale is adjusted.
Horizontal
position
Timebase
Run Mode
In Run mode, the memory bar and waveform size
keep their proportion. When the timebase
becomes slower, roll mode is activated (if the
trigger is set to Auto).
Stop Mode
In Stop mode, the waveform size changes
according to the scale.
Background
Tthe ability to change the center point of the
horizontal expansion.
Panel Operation
1. press the Acquire key
Acquire
2. Press the Expand key and choose
By Center or By Trigger Pos.
3-4-2. Select Horizontal Scale
3-4-3. Select reference point of the horizontal expansion
64

Background
The display update mode is switched automatically
or manually according to the timebase and trigger.
Normal
Updates the whole displayed waveform at
once. Automatically selected when the
timebase (sampling rate) is fast.
Timebase
≤50ms/div
Trigger
all modes
Roll Mode
Updates and moves the waveform
gradually from the right side of the display
to the left. Automatically selected when the
timebase (sampling rate) is slow.
Timebase
≥100ms/div
Trigger
all modes
Roll mode
Select Roll
Mode Manually
1. Press the Trigger Menu key.
Menu
2. Press Mode from the bottom menu
and select Auto (Untriggered Roll)
from the side menu.
Background
When in Zoom mode, the screen is split into 2
sections. The top of the display shows the full
record length, while the bottom of the screen
shows the normal view.
Panel Operation
1. Press the Zoom key.
Zoom
2. The Zoom mode screen appears.
3-4-4. Select Waveform Update Mode
3-4-5. Zoom Waveform Horizontally
65
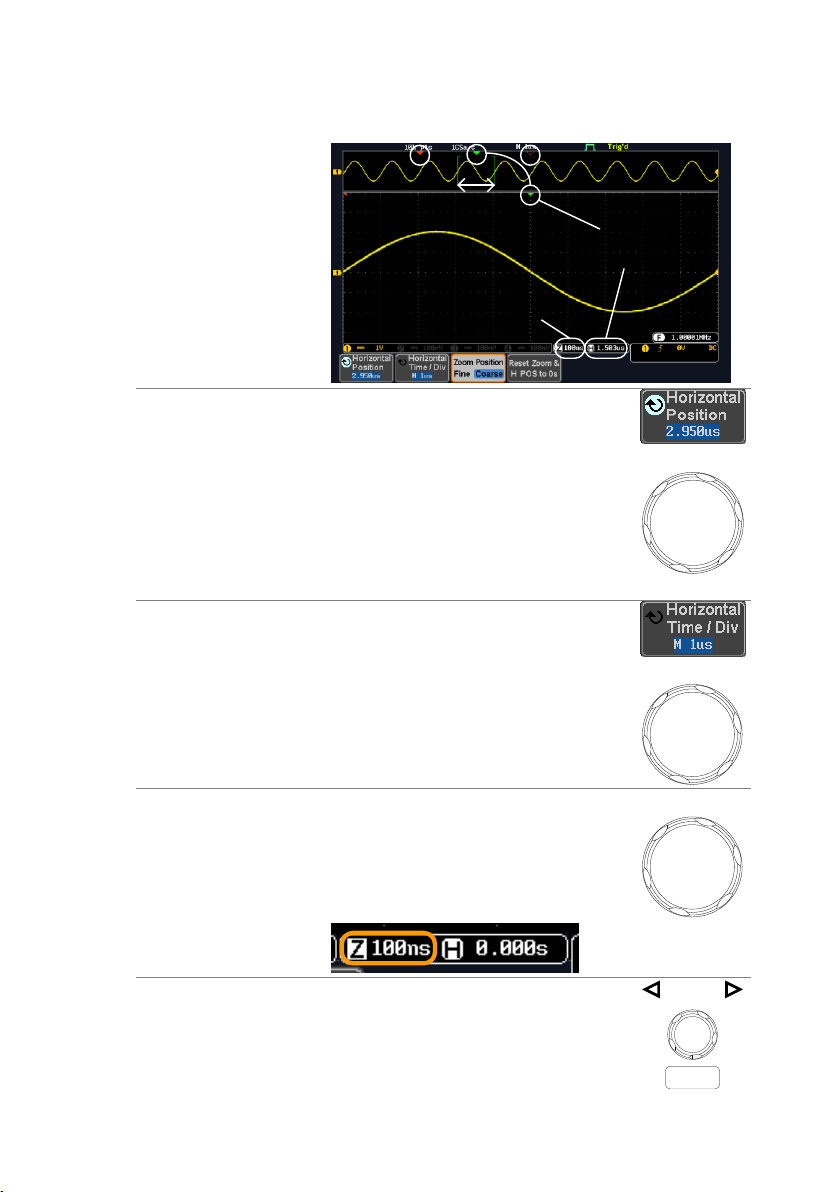
Zoom
timebase
Zoom
position
Zoom
window
Horizontal
position
Trigger
position
Horizontal
Navigation
To scroll the waveform left or right,
press Horizontal Position and use the
Variable Position knob.
The horizontal position will be shown
on the Horizontal Position icon.
VARIABLE
Horizontal Scale
To change the horizontal scale, press
Horizontal Time/Div and use the
Variable Position knob.
The scale will be shown on the
Horizontal Time/Div icon.
VARIABLE
Zoom
To increase the zoom range, use the
horizontal Scale knob.
The zoom time base (Z) at the bottom
of the screen will change accordingly.
SCALE
Move the Zoom
Window
Use the Horizontal Position knob to
pan the zoom window horizontally.
To reset the zoom position, press the
Horizontal Position knob.
POSITION
PUSH TO
ZERO
66
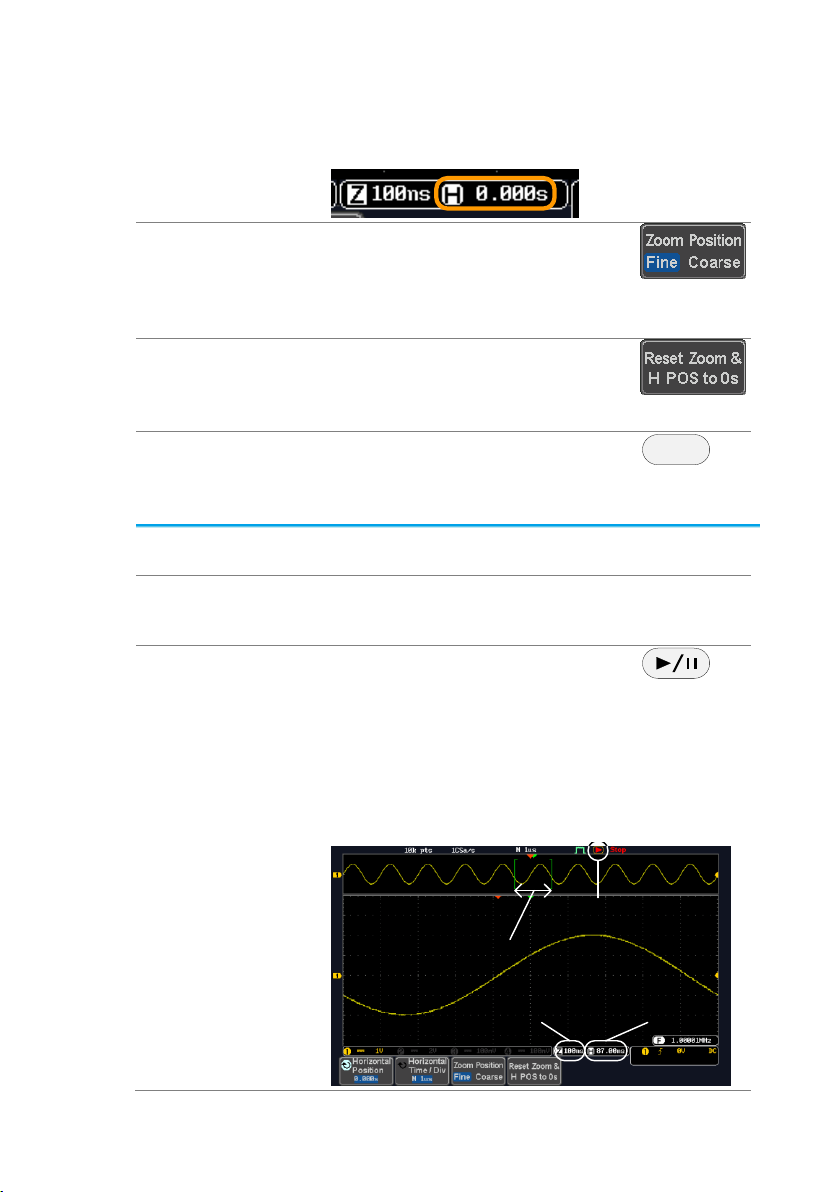
The position of the zoom window, relative to the
horizontal position is shown at the bottom of the
screen next to the Zoom timebase.
Scroll Sensitivity
To alter the scrolling sensitivity of the
zoom window, press the Zoom
Position key to toggle the scrolling
sensitivity.
Sensitivity
Fine, Coarse
Reset the Zoom
& Horizontal
Position
To reset both the zoom and horizontal
position, press Reset Zoom & H POS
to 0s.
Exit
To go back to the original view, press
the Zoom key again.
Zoom
Background
The Play/Pause key can be used to play through
signals in the Zoom mode.
Note
If the Segmented memory function is turned on,
pressing the play pause key will play through
memory segments. See page 54 for information.
Panel Operation
1. Press the Play/Pause menu key.
2. The scope will go into the Zoom Play mode and
begin to scroll through the acquisition (from left
to right).
The full-record length waveform will be shown
at the top and the zoomed section will be
shown at the bottom. The Play/Pause indicator
shows the play status.
Zoom
timebase
Zoom
position
Zoom
window
Play/Pause
indicator
3-4-6. Play/Pause
67
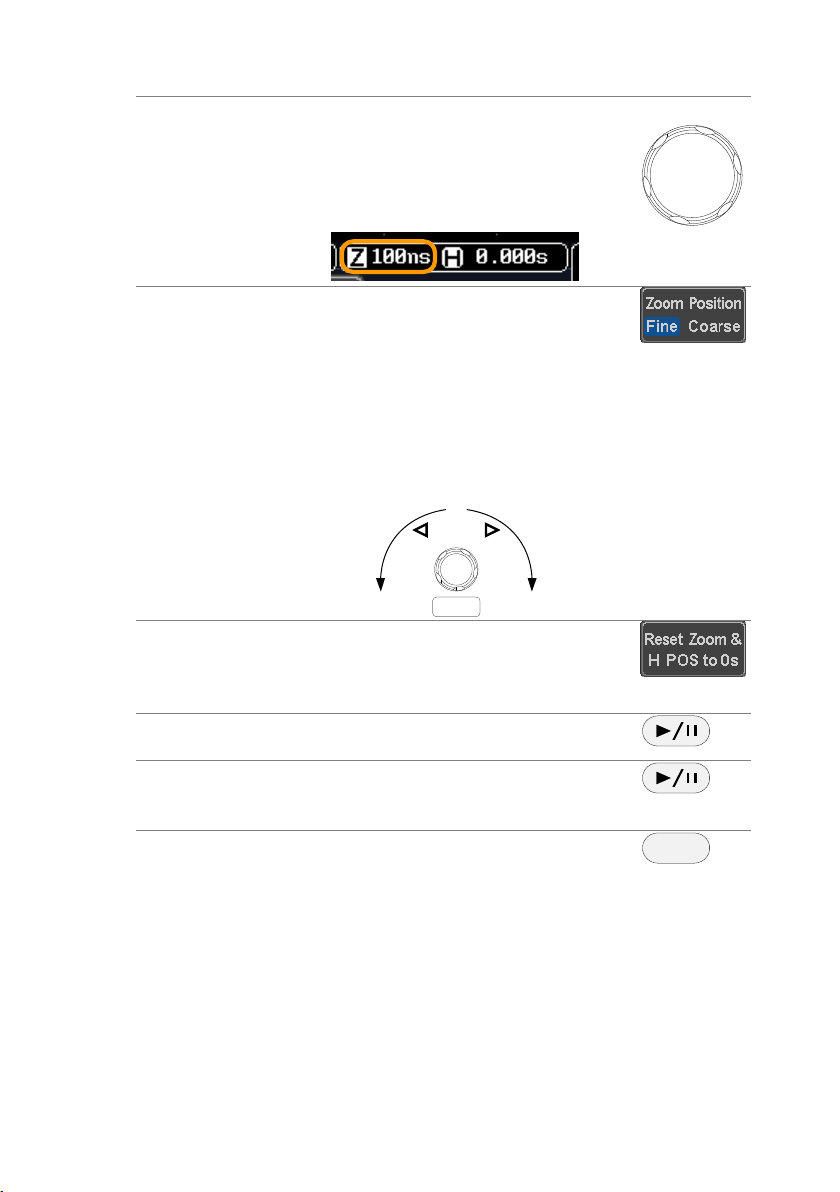
Zoom
To increase the zoom range, use the
horizontal Scale knob.
The zoom time base (Z) at the bottom
of the screen will change accordingly.
SCALE
Scroll Speed
To alter the scrolling speed of the
zoom window, press the Zoom
Position key to toggle the scrolling
speed.
Sensitivity
Fine, Coarse
Alternatively, use the horizontal position knob to
control the scroll speed.
Turning the Horizontal knob determines the
speed and direction of the scrolling.
Speed
Left
Speed
Right
POSITION
PUSH TO
ZERO
Reset the Zoom
Position
To reset both the zoom position and
horizontal position, press Reset Zoom
& H POS to 0s.
Pause
Press the Play/Pause key to pause or
resume playing the waveform.
Reverse
Direction
Press the Play/Pause key when at the
end of the record length to play back
through the waveform in reverse.
Exit
To exit, press the Zoom key.
Zoom
68

Panel Operation
1. To move the waveform up or down,
turn the vertical position knob for
each channel.
POSITION
PUSH TO
ZERO
2. As the waveform moves, the vertical position of
the cursor appears at the bottom half of the
display.
View or Set the
Vertical Position
3. Press a channel key. The vertical
position is shown in the Position /
Set to 0 soft key.
4. To change the position, press
Position / Set to 0 to reset the
vertical position or turn the vertical
position knob to the desired level.
CH1
POSITION
PUSH TO
ZERO
Run/Stop Mode
The waveform can be moved vertically in both Run
and Stop mode.
Panel Operation
To change the vertical scale, turn the
VOLT/DIV knob; left (down) or right
(up).
VOLTS/DIV
The vertical scale indicator on the
bottom left of the display changes
accordingly for the specific channel.
Range
1mV/div ~ 10V/div. 1-2-5 increments
Stop Mode
In Stop mode, the vertical scale setting can be
changed.
3-5. Vertical View (Channel)
This section describes how to set the vertical scale, position, and
coupling mode.
3-5-1. Move Waveform Position Vertically
3-5-2. Select Vertical Scale
69
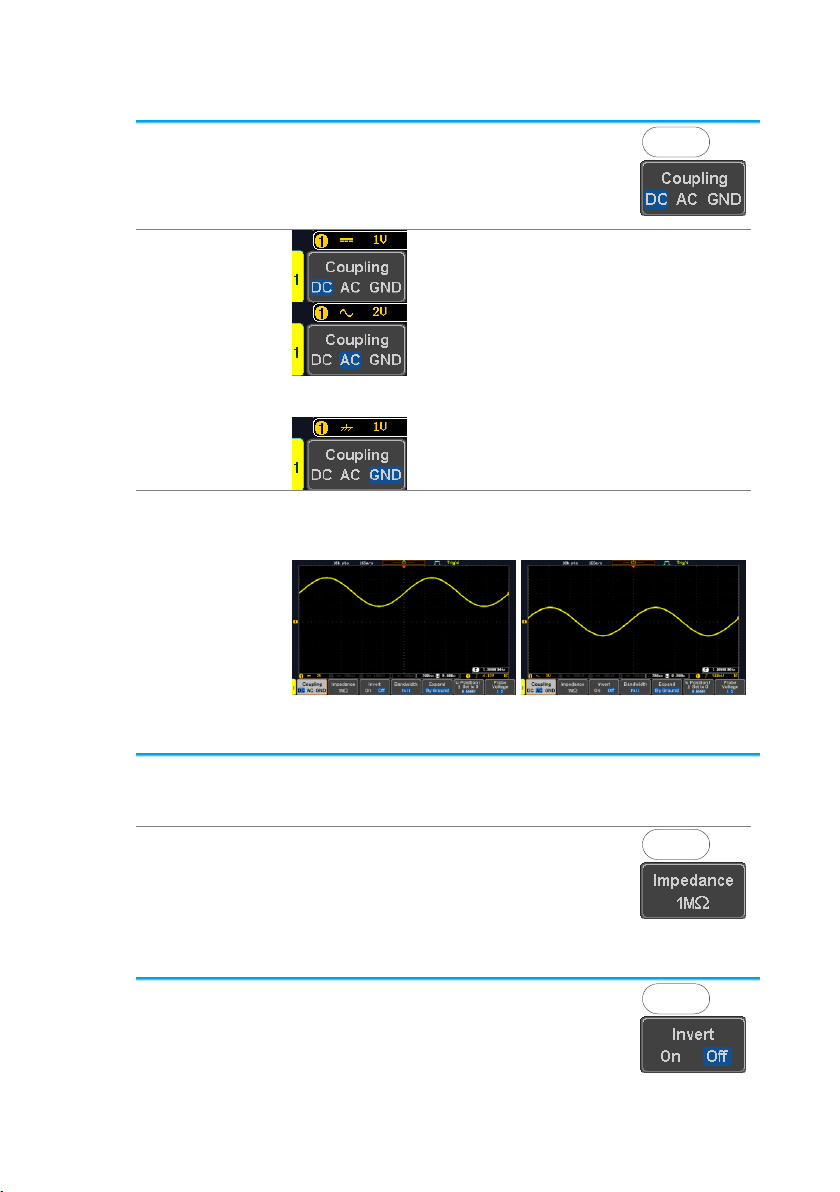
Panel Operation
1. Press a channel key.
CH1
2. Press Coupling repeatedly to
toggle the coupling mode for the
chosen channel.
Range
DC coupling mode. The whole
portion (AC and DC) of the signal
appears on the display.
AC coupling mode. Only the AC
portion of the signal appears on the
display. This mode is useful for
observing AC waveforms mixed with
DC signals.
Ground coupling mode. The display
shows only the zero voltage level as
a horizontal line.
Example
Observing the AC portion of the waveform using
AC coupling
DC coupling
AC coupling
Background
The input impedance of the DCS-1000B is fixed at
1MΩ. The impedance is displayed in the channel
menu.
View Impedance
1. Press the Channel key.
CH1
2. The impedance is displayed in the
bottom menu.
Panel Operation
1. Press the Channel key.
CH1
2. Press Invert to toggle Invert On or
Off.
3-5-3. Select Coupling Mode
3-5-4. Input Impedance
3-5-5. Invert Waveform Vertically
70

Background
Bandwidth limitation puts the input signal into a
selected bandwidth filter.
This function is useful for cutting out high
frequency noise to see a clear waveform shape.
The bandwidth filters available are dependent on
the bandwidth of the oscilloscope model.
Panel Operation
1. Press the Channel key.
CH1
2. Press Bandwidth from the bottom
menu.
3. Choose a bandwidth* from the side menu.
*Depending on the bandwidth of the
oscilloscope.
Range
70MHz models: Full, 20MHz
100MHz models: Full, 20MHz
Example
BW Full
BW Limit 20MHz
Background
When the voltage scale is changed, the Expand
function designates whether the signal expands
from the center of the screen or from the signal
ground level. Expand by center can be used to
easily see if a signal has a voltage bias. Expand by
ground is the default setting.
Panel Operation
1. Press a channel key.
CH1
2. Press Expand repeatedly to toggle
between expand By Ground and
Center.
Range
By Ground, By Center
3-5-6. Limit Bandwidth
3-5-7. Expand by Ground/Center
71
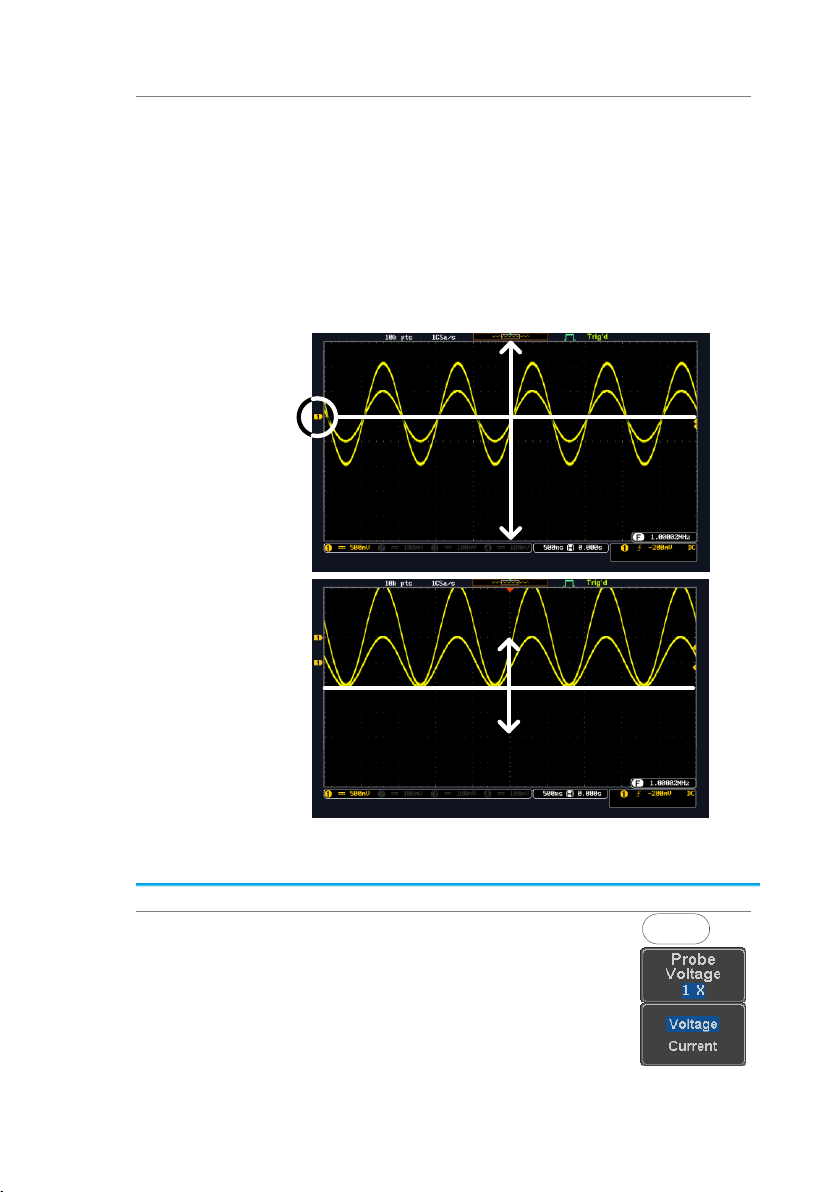
Example
If the vertical scale is changed when the Expand
function is set to ground, the signal will expand
from the ground level*. The ground level does not
change when the vertical scale is changed.
If the vertical scale is changed when the Expand
function is set to center, the signal will expand from
the center of the screen. The ground level will suit
to match the signal position.
*Or from the upper or lower edge of the screen if
the ground level is off-screen.
Expand by
Ground
Expand by Ground
Expand by
Center
Expand by Center
Background
A signal probe can be set to voltage or current.
Panel Operation
1. Press the Channel key.
CH1
2. Press Probe from the bottom
menu.
3. Press the Voltage/Current soft-key
to toggle between voltage and
current.
3-5-8. Select Probe Type
72

Background
An oscilloscope probe has an attenuation switch to
lower the original DUT signal level to the
oscilloscope input range, if necessary. The probe
attenuation selection adjusts the vertical scale so
that the voltage level on the display reflects the
real value on a DUT.
Panel Operation
1. Press the Channel key.
CH1
2. Press Probe from the bottom
menu.
3. Press Attenuation on the side
menu and use the Variable knob to
set the attenuation.
Alternatively, press Set to 10X.
Range
1mX ~1kX (1-2-5 step)
Note
The attenuation factor adds no influence on the
real signal. It just changes the voltage/current
scale on the display.
Background
The deskew function is used to compensate for the
propagation delay between the oscilloscope and
the probe.
Panel Operation
1. Press one of the Channel keys.
CH1
2. Press Probe from the bottom
menu.
3. Press Deskew on the side menu
and use the Variable knob to set
the deskew time.
Alternatively, press Set to 0s to
reset the deskew time.
Range
-50ns~50ns, 10ps increments
4. Repeat the procedure for another channel if
necessary.
3-5-9. Select Probe Attenuation Level
3-5-10. Set the Deskew
73

Bus indicator
Trigger
configuration
Data Start bit Stop bit
Start Bit/Start
of Frame
The Start bit is shown as an open bracket.
Stop Bit/End
of Frame
The Stop bit is shown as a closed bracket.
Data
Data packets/frames can be shown in Hex or
Binary. The color of the bus data indicates the type
of data or the channel the data is coming from,
depending on the bus type.
UART:
Color of packet = Color of source
channel.
I2C:
Color packet = SDA source channel.
SPI:
Color of packet = MOSI or MISO source
channel.
CAN:
Purple = Error frame, Data length control
(DLC), Overload.
Yellow = Identifier.
Cyan = Data.
Orange = CRC.
Red = Bit stuffing error
3-6. Bus Key Configuration(Option)
The Bus key is used to configure the Serial bus inputs. The Bus
menu also features event tables to track and save your bus data.
The Bus key is used in conjunction with the Bus trigger (page 102)
to decode serial bus signals.
3-6-1. Bus Display
74

LIN:
Purple = Break, Sync and Checksum
errors, Wakeup
Yellow = Identifier, Parity
Cyan = Data
Red = Error type
Error
Indicator/
Missing Ack
If there is an error/missing acknowledge in
decoding the serial data, a red error indicator will
be shown.
Bus Indicator
The Bus indicator shows the bus position. The
active bus is shown with a solid color. The Variable
knob can be used to horizontally position the Bus
indicator when it is active.
Active bus
(solid indicator)
Activated bus
(transparent indicator)
Trigger
Configuration
Shows the bus trigger (B) and the Trigger On
settings.
UART
Universal Asynchronous Receiver Transmitter. The
UART bus is able to accommodate a wide range of
various common UART serial communications.
The UART serial bus software is suitable for a
number of RS-232 protocol variants.
Inputs
Tx, Rx
Threshold
Tx, Rx
Configuration
Baud rate, Parity, Packets, End of
packets, Input polarity
Trigger On
Tx Start Bit, Rx Start Bit, Tx End of
Packet, Rx End of Packet, Tx Data,
Rx Data, Tx Parity Error, Rx Parity
Error
I2C
Inter Integrated Circuit is a two line serial data
interface with a serial data line (SDA) and serial
clock line (SCLK). The R/W bit can be configured.
Inputs
SCLK, SDA
3-6-2. Serial Bus
The Serial Bus includes support for 5 common serial interfaces, SPI,
UART, I2C, CAN and LIN. Each interface is fully configurable to
accommodate variations in the basic protocols.
Each input can be displayed as binary, hexadecimal or ASCII. An
event table can also be created to aid in debugging.
3-6-2-1. Serial Bus Overview
75

Threshold
SCLK, SDA
Configuration
Addressing mode, Read/Write in
address
Trigger On
Start, Repeat Start, Stop, Missing
Ack, Address, Data, Address/Data
SPI
The SPI (Serial Interface Peripheral) bus is fully
configurable to accommodate the wide variety of
SPI interfaces. This bus is only available on 4
channel models.
Inputs
SCLK, SS, MOSI, MISO
Threshold
SCLK, SS, MOSI, MISO
Configuration
SCLK edge, SS logic level, Word
size, Bit order
Trigger On
SS Active, MOSI, MISO,
MOSI&MISO
CAN
The CAN (Controller Area Network) bus is a 2-wire,
message-based protocol.
Inputs
CAN Input
Threshold
CAN Input
Configuration
Signal Type, Bit Rate
Trigger On
Start of Frame, Type of Frame,
Identifier, Data, Id & Data, End of
Frame, Missing Ack, Bit Stuffing Err.
LIN
The LIN (Local Interconnect Network) bus is used
to decode a wide range of common LIN
configurations.
Inputs
LIN Input
Threshold
LIN Input
Configuration
Bit Rate, LIN Standard, Include
Parity Bits with Id
Trigger On
Sync, Identifier, Data, Id & Data,
Wakeup Frame, Sleep Frame, Error
76

Background
Basic RS-232 protocol uses single-ended data
transmissions. The signal voltage levels can be
high (±15V) and employ active low signaling.
High speed variants of RS-232, such as RS-422
and RS-485 use differential signaling and
commonly employ low voltage differential signals
with active high signaling.
Universal Asynchronous Receiver/Transmitter
(UART) or RS-232 driver/receiver ICs commonly
used for embedded applications typically use
active high signaling with standard IC signal levels.
Operation
1. Connect each of the bus signals (Tx, Rx) to one
of the oscilloscope channels. Connect the
ground potential of the bus to one of the probes’
ground clip.
GND
Rx
Tx
X
10
X
1
X
10
X
1
2. Press the BUS key.
BUS
B
3. Press Bus from the bottom menu
and choose the UART serial bus
on the side menu.
Define Inputs
1. Press Define Inputs from the
bottom menu.
2. From the side menu choose the Tx
Input and the Rx
Input source and the signal
polarity.
Tx
OFF, CH1 ~ CH4
Rx
OFF, CH1 ~ CH4
3-6-2-2. UART Serial Bus Configuration
The UART bus menu is designed to decode RS-232 and other
common RS-232 variants such as RS-422, RS-485. The software
configuration is also flexible enough to decode the many proprietary
protocols based on RS-232.
77

Polarity
Normal (High = 0), Inverted (High = 1)
Configuration
The Configure key sets the baud rate, number of
data bits and parity.
1. Press Configure from the bottom
menu.
2. From the side menu select the Baud rate, Data
bits, Parity, Packets and End of Packet bits.
Baud
Rate
50, 75, 110, 134, 150, 300, 600,
1200, 1800, 2000, 2400, 3600,
4800, 7200, 9600, 14400, 15200,
19200, 28800, 31250, 38400,
56000, 57600, 76800, 115200,
128000, 230400, 460800, 921600,
1382400, 1843200, 2764800
Data Bits
8 (fixed)
Parity
Odd, Even, None
Packets
On, Off
End of
Packet
(Hex)
00(NUL), 0A(LF), 0D(CR), 20(SP),
FF
Panel operation
1. Connect each of the bus signals (SCLK, SDA)
to one of the oscilloscope channels. Connect
the ground potential to one of the probes’
ground clip.
GND
SCLK
SDA
X
10
X
1
X
10
X
1
3-6-2-3. I2C Serial Bus Interface
The I2C bus is a 2 wire interface with a serial data line (SDA) and
serial clock line (SCLK). The I2C protocol supports 7 or 10 bit
addressing and multiple masters. The scope will trigger on any of
the following conditions: a start/stop condition, a restart, a missing
acknowledge message, Address, Data or Address&Data frames.
The I2C trigger can be configured for 7 or 10 bit addressing with the
option to ignore the R/W bit as well as triggering on a data value or
a specific address and direction (read or write or both).
78
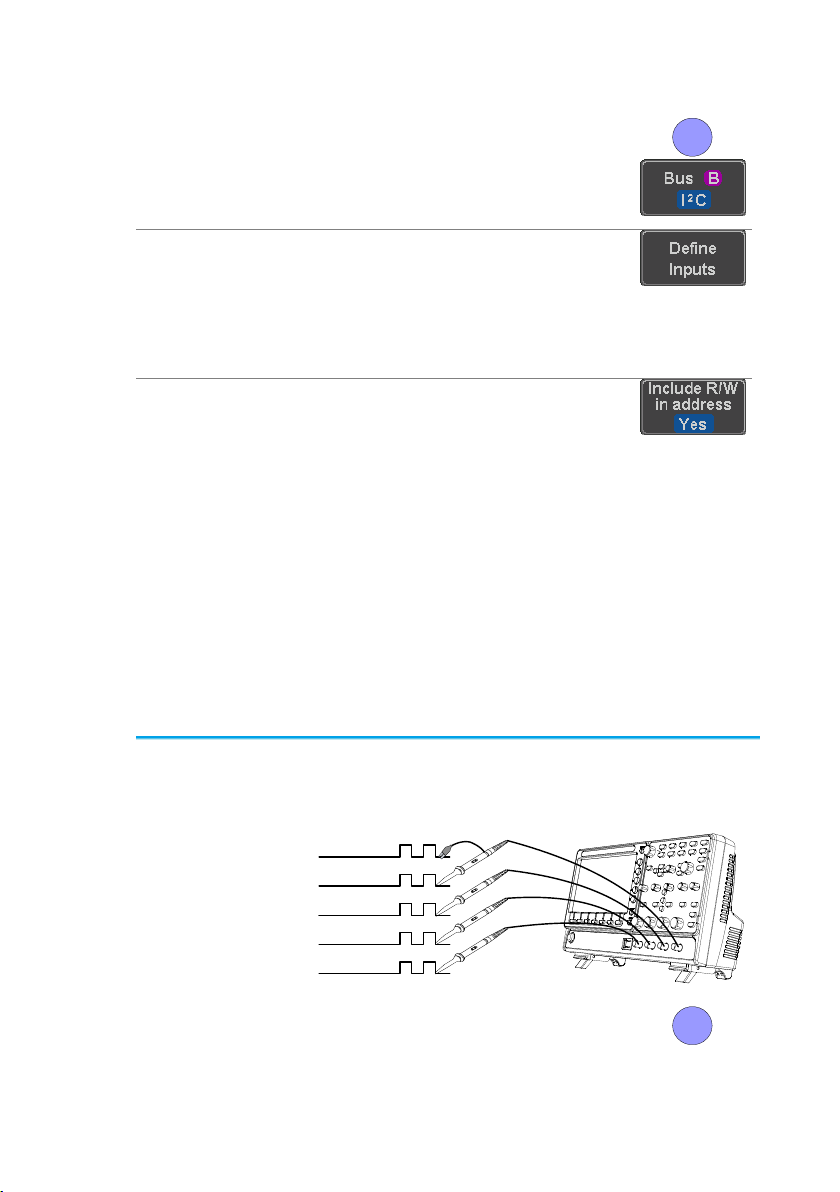
2. Press the Bus key.
BUS
B
3. Press Bus from the bottom menu
and choose I2C from the side
menu.
Define Inputs
1. Press Define Inputs from the
bottom menu.
2. From the side menu choose the
SCLK input and the SDA Input.
SCLK
CH1 ~ CH4
SDA
CH1 ~ CH4
Include R/W in
address
To configure whether you want the
R/W bit to be included in the
address, press Include R/W in
address and set to Yes or No in the
side menu.
R/W Bit
Yes, No
Panel operation
1. Connect each of the bus signals (SCLK, SS,
MOSI, MISO) to one of the channel inputs.
Connect the ground potential of the bus to one
of the probes’ ground clip.
SS
MOSI
MISO
X
10
X
1
X
10
X
1
GND
SCLK
X
10
X
1
X
10
X
1
2. Press the Bus key.
BUS
B
3-6-2-4. SPI Serial Bus Interface
The serial peripheral interface (SPI) is a full duplex 4 wire
synchronous serial interface. The 4 signals lines: Serial clock line
(SCLK), slave select (SS), Master output/slave input (MOSI, or
SIMO) and the Master input/slave output (MISO, or SOMI). The
word size is configurable from 4 to 32 bits. The SPI triggers on the
data pattern at the start of each framing period. Note: The SPI bus is
only available for 4 channel models.
79
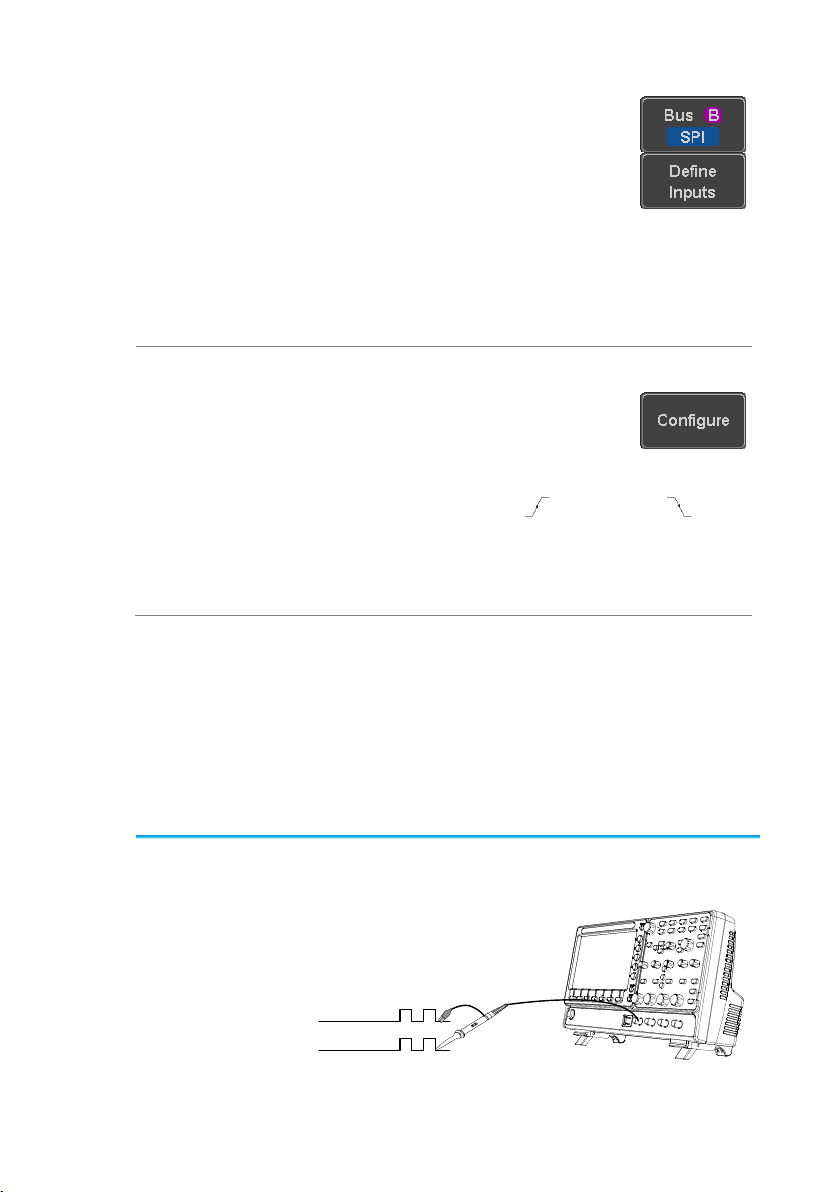
3. Press Bus from the bottom menu
and choose the SPI serial bus.
Define Inputs
1. Press Define Inputs from the lower
menu.
2. From the side menu choose the
SCLK, SS, MOSI and MISO inputs.
SCLK
CH1 ~ CH4
SS
CH1 ~ CH4
MOSI
OFF, CH1 ~ CH4
MISO
OFF, CH1 ~ CH4
Configuration
The Configure menu sets the data line logic level,
SCLK edge polarity, word size and bit order.
1. Press Configure from the bottom
menu.
2. From the side menu select SCLK edge, SS
logic level, word Size and Bit order.
SCLK
rising edge , falling edge
SS
Active High, Active Low
Word
Size
4 ~ 32 bits
Bit Order
MS First, LS First
Panel operation
1. Connect the bus signal (CAN Input) to one of
the channel inputs. Connect the ground
potential of the bus to the probe’s ground clip.
GND
CAN Input
X
10
X
1
3-6-2-5. CAN Serial Bus Interface
The controller area network (CAN) bus is a half duplex 2 wire
synchronous serial interface. The CAN bus is a multi-master
communication system that relies on arbitration to solve contention
issues. The DCS-1000B supports both CAN 2.0A and 2.0B. The
CAN bus uses two wires, CAN-High and CAN-Low. These wires are
voltage inverted, and as such, the DCS-1000B only needs one wire,
CAN-High or CAN-Low for decoding.
80

2. Press the Bus key.
BUS
B
3. Press Bus from the bottom menu
and choose the CAN serial bus.
Define Inputs
1. Press Define Inputs from the lower
menu.
2. From the side menu choose the
CAN Input inputs and the signal
type.
CAN Input
CH1 ~ CH4
Signal Type
CAN_H, CAN_L, Tx, Rx.
Note
The Sample Point soft-key indicates the sampling
position of each bit. This parameter is fixed.
Bit Rate
The Bit Rate menu sets the bit rate of the bus. The
bit rate is usually tied to the bus length.
3. Press Bit Rate from the bottom
menu and set the bit rate.
Bit Rate
10kbps, 20kbps, 50kbps, 125kbps,
250kbps, 500kbps, 800kbps, 1Mbps
Panel operation
1. Connect the bus signal (LIN Input) to one of the
channel inputs. Connect the ground potential of
the bus to the probe’s ground clip.
LIN
CAN Input
X
10
X
1
2. Press the Bus key.
BUS
B
3. Press Bus from the bottom menu
and choose the LIN serial bus.
Define Inputs
1. Press Define Inputs from the lower
menu.
3-6-2-6. LIN Serial Bus Interface
The local interconnect network (LIN) bus is a single wire interface.
81
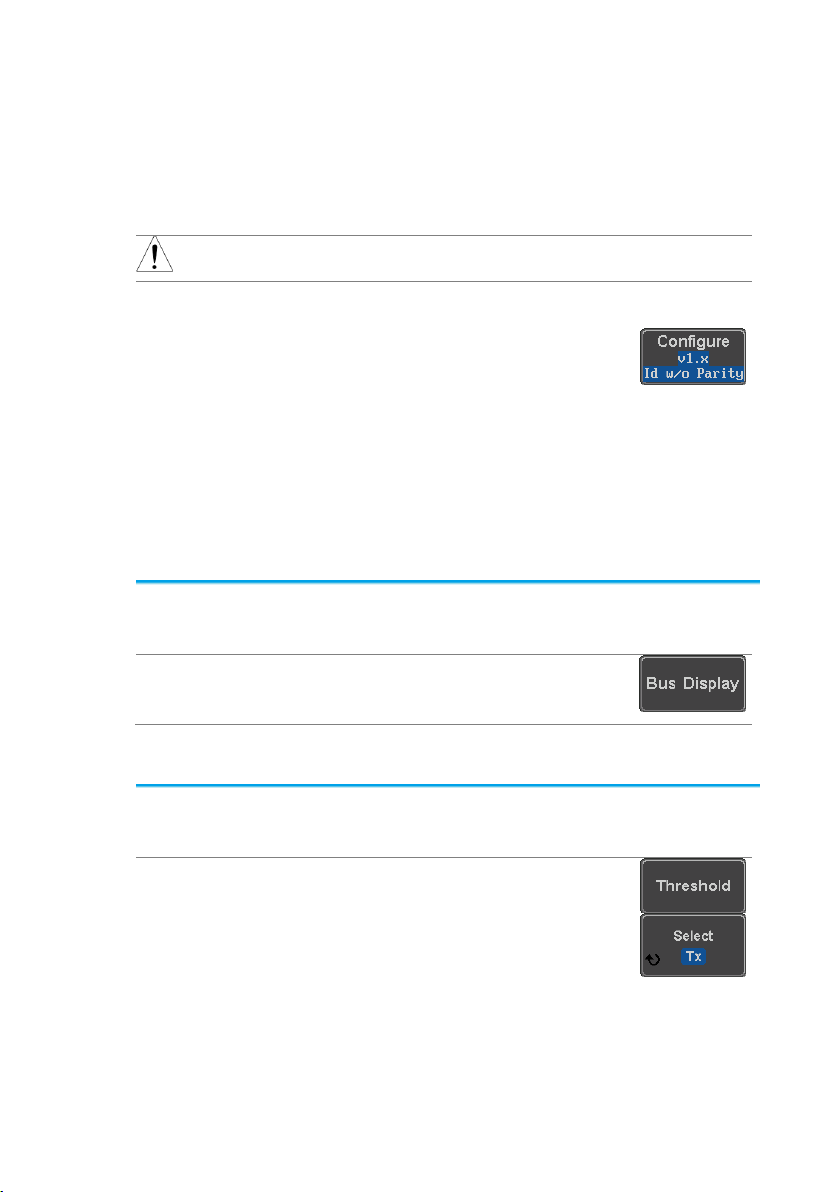
2. From the side menu choose the
LIN input and the polarity of the
bus.
LIN Input
CH1 ~ CH4
Polarity
Normal (High = 1),
Inverted(High = 0)
Note
The Sample Point soft-key indicates the sampling
position of each bit. This parameter is fixed.
Configuration
The Configure menu sets the bit rate, the LIN
standard and the parity options for the Id frame.
1. Press Configure from the bottom
menu.
2. From the side menu select configuration items.
Bit Rate
1.2kbps, 2.4kbps, 4.8kbps,
9.6kbps, 10.417kbps, 19.2kbps
LIN Standard
V1.x, V2.x, Both
Include Parity
Bits with Id
On, Off
Background
The bus that is displayed on the screen or in the
event tables can be set to either hex or binary
formats.
Operation
Press Bus Display from the Bus menu
and choose either Hex or Binary from
the side menu.
Background
The threshold levels for the Serial buses can be
set to either a user-defined threshold level or to
pre-set threshold.
Set the
Threshold
1. Press Threshold from the bottom
menu.
2. Press Select from the side menu
and choose a one of the serial bus
lines.
UART
Tx, Rx
I2C
SCLK, SDA
SPI
SCLK, SS, MOSI, MOSI
CAN
CAN_H, CAN_L, Tx, Rx
3-6-2-7. Bus Encoding
3-6-3. Threshold Configuration
82

LIN
LIN Input
3. Press Choose Preset to select a
pre-set logic threshold.
Logic Type
Threshold
TTL
1.4V
5.0V CMOS
2.5V
3.3V CMOS
1.65V
2.5V CMOS
1.25V
ECL
-1.3V
PECL
3.7V
0V
0V
4. Press Threshold to set a user
defined threshold for the currently
selected group. The threshold level
depends on vertical scale.
Scale
Range
Scale
Range
10V/Div
±290V
50mV/Div
±5.2V
5V/Div
±270V
20mV/Div
±580mV
2V/Div
±33V
10mV/Div
±540mV
1V/Div
±29V
5mV/Div
±520mV
500mV/Div
±27V
2mV/Div
±508mV
200mV/Div
±5.8V
1mV/Div
±504mV
100mV/Div
±5.4V
Background
The serial bus event tables list when each data
event on the bus occurred. The data is displayed
as either hex or binary, depending on the bus
display settings.
Event tables can be saved to disk in a CSV format.
The files will be named “Event_TableXXXX.CSV”,
where XXXX is a number from 0000 to 9999. See
page 86 for details.
Operation
1. Press Event Table from the bottom
menu.
2. Press Event Table from the side
menu to turn the event table on or
off.
Event
On, Off
Use the Variable knob to scroll through the
event table.
3-6-3-1. Serial Bus Event Tables
83
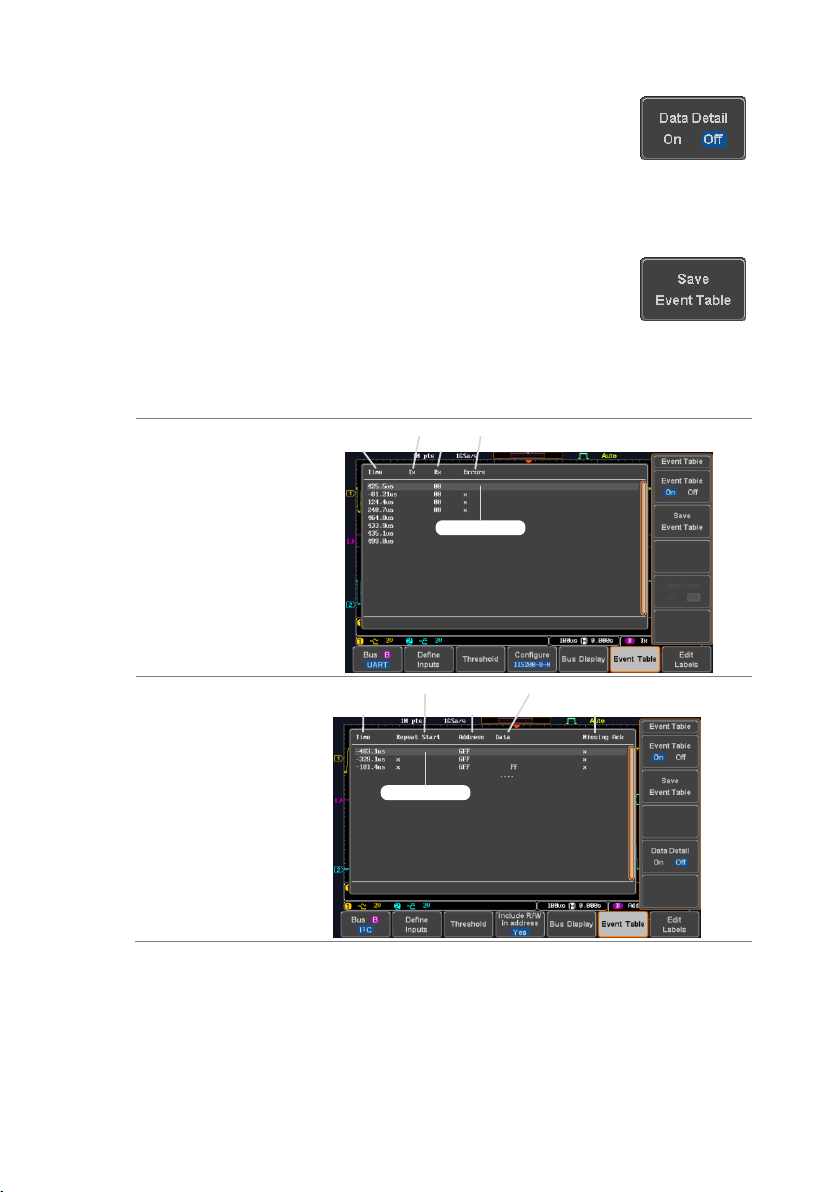
Data Detail
(I2C only)
1. To view the data at a particular
address in more detail, turn Data
Detail On. This is only available for
the I2C bus.
Detail
On, Off
Use the Variable knob to scroll through the Data
Detail event table.
Save Event
Table
1. To save the event table, press
Save Event Table. The Event table
will be saved to the current file path
in a CSV format. See page 86 for
details.
Use the variable knob to scroll through the
event table.
Example:
UART Event
table
Time of triggerTxRx
Errors
Select cursor
Example:
I2C Event table
Time of trigger
Repeat Start
Address
Data at address
Missing Ack
Select cursor
84

Example:
I2C Data Detail
Time of trigger Address
Data at cursor
position
Select cursor
Note
Data Detail is only available with the 12C bus.
Example:
SPI Event table
Time of trigger
MOSI MISO
Select cursor
Example:
CAN Event table
Time of trigger
DLC
Data
CRC Missing ACK
Select cursor
Identifier
85

Example:
LIN Event table
Time of trigger
Identifier
Checksum
Errors
Select cursor
Parity
Data
File Type
Each event table is saved as
Event_TableXXXX.CSV into the designated file
path. Each event table is numbered sequentially
from 0000 to 9999. For example the first event
table will be saved as Event_Table0000.CSV, the
second as Event_Table0001.CSV, and so on.
Event Table
Data
Each event table saves a timestamp of each event
relative to the trigger as well as the data in each
frame/packet at the time of an event. The
frame/packet data is saved in HEX format.
The table below lists in order the data saved for
each event table.
UART
Time, Tx frame data, Rx frame data,
Errors.
I2C
Time, Repeat Start, Address, Data,
Missing Ack.
SPI
Time, MISO frame data, MOSI frame
data.
CAN
Time, Identifier, DLC, Data, CRC,
Missing Ack.
LIN
Time, Identifier, Parity, Data,
Checksum, Errors.
Example
Below shows the data associated with an SPI
event table in a spreadsheet.
3-6-3-2. Event Tables Format
Each bus type (UART, I2C, SPI, CAN, LIN) can have an event table
saved containing each bus event as a .CSV file. For serial buses, an
event is defined as the data on the bus when a Stop or End of
Packet (UART) is encountered. The data associated with each event
and the time of each event is recorded.
86
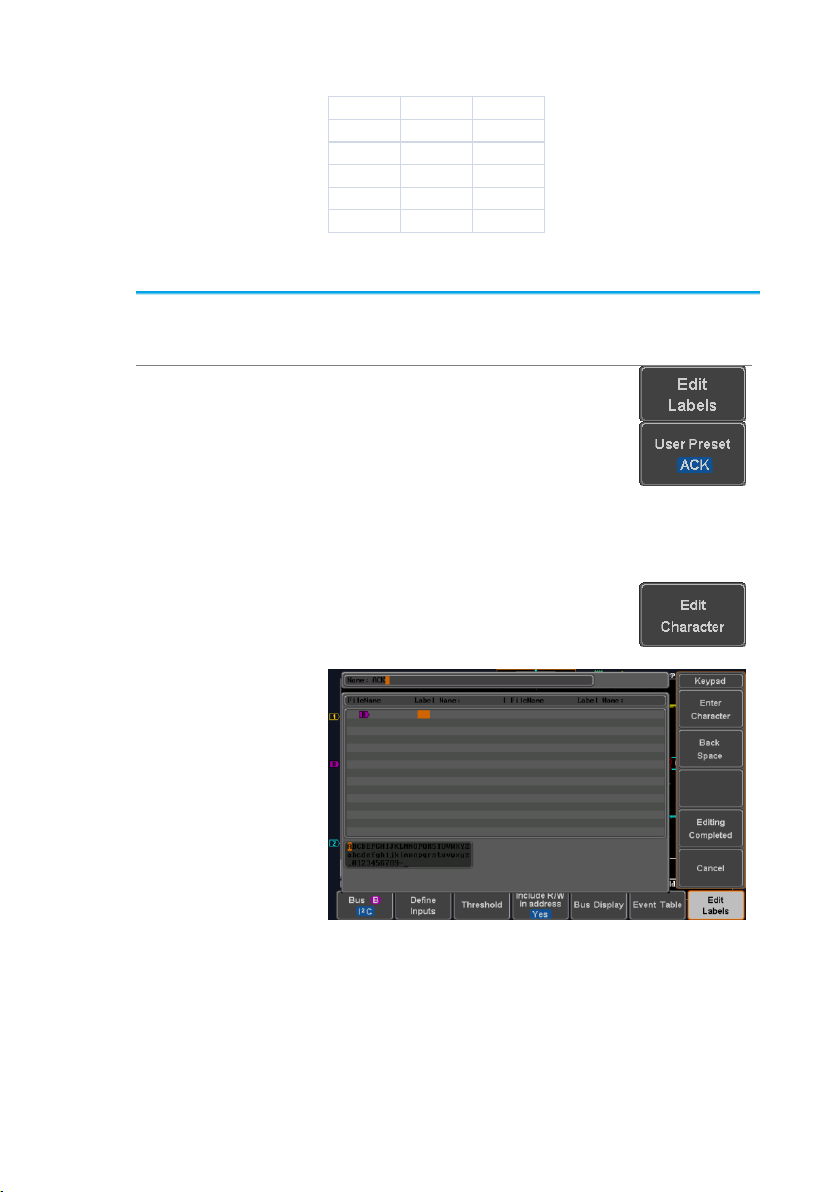
Time MOSI MISO
-11.60us 0D87 0D87
-10.16us 06C0 06C0
-8.720us 8343 343
-7.282us 243 243
-5.840us 0C88 0C88
Background
A Label can be added to the serial buses. This
label will appear next to the bus indicator on the
left hand-side of the display.
Panel Operation
1. To add a label to the bus, press
Edit Labels from the Bus menu.
2. To choose a preset label, Press
User Preset from the side menu
and choose a label.
Labels
ACK, AD0, ADDR, ANALOG, BIT,
CAS, CLK, CLOCK, CLR, COUNT,
DATA, DTACK, ENABLE, HALT,
INT, IN, IRQ, LATCH, LOAD, NMI
Edit Label
1. Press Edit Character to edit the
current label.
2. The Edit Label window appears.
3. Use the Variable knob to highlight
a character.
3-6-3-3. Adding a Label to the Serial Bus
87

VARIABLE
Press Enter Character to select a
number or letter.
Press Back Space to delete a
character.
Press Editing Completed to create
the new label and return to the
previous menu.
Note: this key must be pressed to
save the label, even for the preset
labels.
Press Cancel to cancel the editing
and return to the Edit Label menu.
4. The label will appear next to the bus indicator.
Below, the label “ACK” was created for the bus.
The bus is labeled
as ACK
Remove Label
Press Label Display to toggle the label
on or off.
Background
The cursors can be used to read bus values at any
position.
Note
Ensure that one of the serial buses has been
selected and is activated.
Panel Operation
1. Press the Cursor key. Horizontal
cursors appear on the display.
Cursor
2. Press the H Cursor soft-key and
select which cursor(s) you wish to
position.
3-6-3-4. Using Cursors with the Serial Bus
88
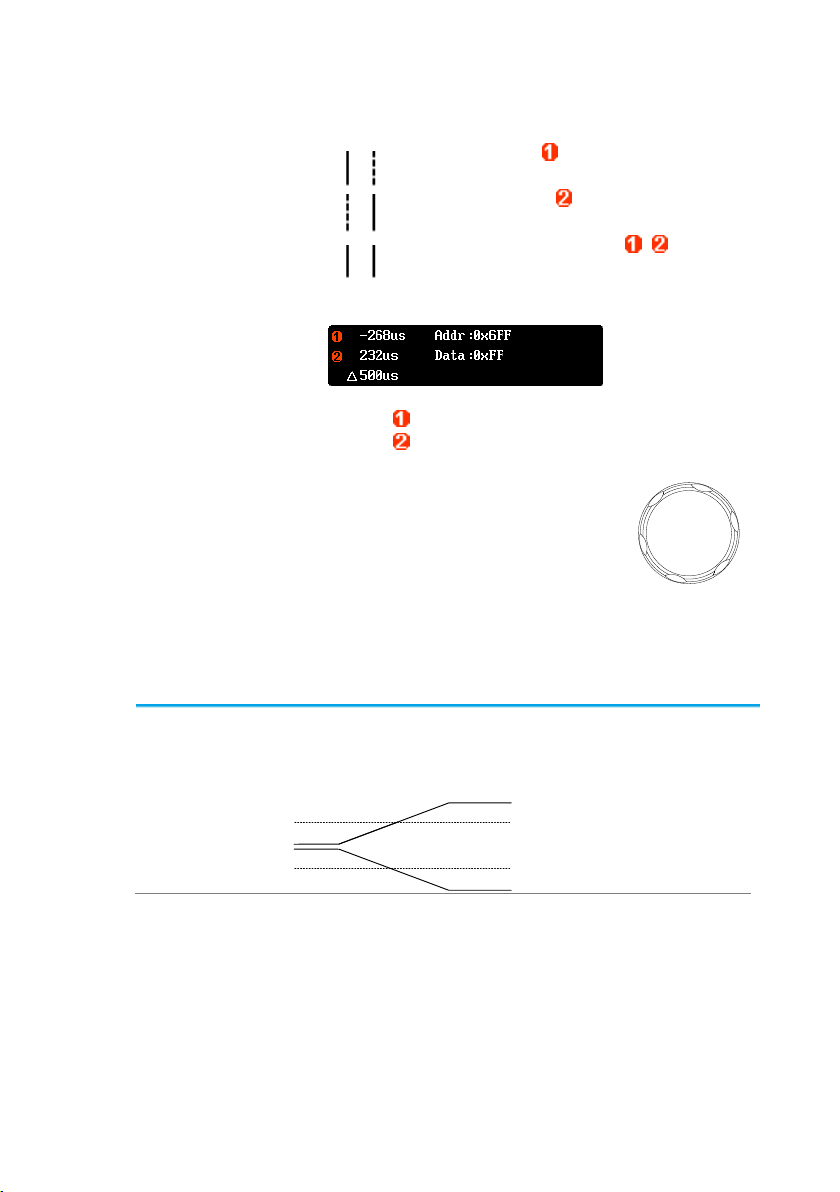
Range
Description
Left cursor ( ) movable, right
cursor position fixed
Right cursor ( ) movable, left
cursor position fixed
Left and right cursor ( + )
movable together
3. The cursor position information appears on the
top left hand side of the screen.
Example: I2C cursors.
Cursor
Hor. position, Bus value(s)
Cursor
Hor. position, Bus value(s)
4. Use the Variable knob to move
the movable cursor(s) left or right.
VARIABLE
Edge
The edge trigger is the simplest trigger type. An
edge trigger triggers when the signal crosses an
amplitude threshold with either a positive or
negative slope.
Rising edge trigger
Falling edge trigger
3-7. Trigger
The trigger configures the conditions for when the DCS-1000B
captures a waveform.
3-7-1. Trigger Type Overview
89
 Loading...