

Page 1
Measurement data monitoring system:
testo Saveris
Software:
testo Saveris P
Instruction manual
rofessional Edition V4.6 SP1
Page 2

Page 3

Contents
Contents
1 About this document ........................................................................... 7
1.1 Symbols and writing standards ............................................................................. 7
1.2 Warning notices .................................................................................................... 8
2 Safety and disposal .............................................................................. 8
2.1 Safety .................................................................................................................... 8
2.2 Batteries ................................................................................................................ 9
3 Protecting the environment ................................................................. 9
4 Support ................................................................................................. 9
5 Using the system .................................................................................. 9
5.1 Fields of application .............................................................................................. 9
5.2 How it works ........................................................................................................ 10
5.2.1 Measurement data monitoring for monitoring in the stationary area .......................... 10
5.2.2 Measurement data monitoring for transport monitoring with radio data loggers (“mobile
5.3 Exclusion of liability ............................................................................................. 11
6 Product description ........................................................................... 11
6.1 System overview ................................................................................................. 11
6.2 testo Saveris base .............................................................................................. 13
6.2.1 Front ........................................................................................................................... 13
6.2.2 Rear ........................................................................................................................... 14
6.2.3 Underside ................................................................................................................... 15
6.2.4 Control keys ............................................................................................................... 15
6.2.5 Displays ...................................................................................................................... 15
6.3 Radio data logger for testo Saveris ..................................................................... 21
6.3.1 Saveris radio data logger without display ................................................................... 21
6.3.2 Saveris radio data logger with display ........................................................................ 22
6.3.2.1 Displays .............................................................................................................................. 23
6.3.3 testo Saveris radio data logger LED status displays .................................................. 23
6.4 testo Saveris 2 H2 ............................................................................................... 24
6.4.1 Short description ........................................................................................................ 24
6.4.2 Display and control elements ..................................................................................... 25
6.4.2.1 Overview ............................................................................................................................. 25
6.4.2.2 Display icons ....................................................................................................................... 25
6.5 Ethernet data logger for testo Saveris ................................................................ 26
6.6 Saveris wireless analog coupler ......................................................................... 28
6.7 testo Saveris router ............................................................................................. 29
6.8 testo Saveris converter ....................................................................................... 30
6.9 testo Saveris extender ........................................................................................ 31
monitoring”) ................................................................................................................ 10
Page 4

Contents
6.10 testo Saveris cockpit unit .................................................................................... 32
6.10.1 Front ........................................................................................................................... 32
6.10.2 Rear ............................................................................................................................ 32
6.10.3 Control keys ............................................................................................................... 33
6.10.4 Displays ...................................................................................................................... 33
7 Using the product .............................................................................. 38
7.1 Starting the Saveris software .............................................................................. 38
7.2 Use of testo Saveris software for monitoring in the stationary area ................... 38
7.2.1 General ....................................................................................................................... 38
7.2.2 User interface ............................................................................................................. 39
7.2.3 Menus and commands ............................................................................................... 40
7.2.3.1 Start .................................................................................................................................... 40
7.2.3.2 Edit ...................................................................................................................................... 42
7.2.3.3 Axes .................................................................................................................................... 46
7.2.3.4 Template ............................................................................................................................. 46
7.2.3.5 Service ................................................................................................................................ 47
7.2.3.6 Select projects..................................................................................................................... 47
7.2.3.7 Style template ..................................................................................................................... 47
7.2.4 Analyzing measurement series .................................................................................. 47
7.2.4.1 Diagram view ...................................................................................................................... 47
7.2.4.2 Table view ........................................................................................................................... 55
7.2.4.3 Floorplan view ..................................................................................................................... 58
7.2.4.4 Histogram view .................................................................................................................... 58
7.2.4.5 Archiving with automatic reports .......................................................................................... 59
7.2.4.6 Generating an evaluation .................................................................................................... 59
7.2.4.7 Printing measurement data ................................................................................................. 59
7.2.4.8 Creating automatic reports .................................................................................................. 60
7.2.4.9 Configuring automatic reports ............................................................................................. 61
7.2.5 Managing zones ......................................................................................................... 63
7.2.5.1 Creating zones .................................................................................................................... 63
7.2.5.2 Changing zones .................................................................................................................. 64
7.2.5.3 Deleting zones .................................................................................................................... 64
7.2.5.4 Assigning zones .................................................................................................................. 65
7.2.6 Configuring alarms ..................................................................................................... 66
7.2.6.1 Setting up Saveris base alarms ........................................................................................... 67
7.2.6.2 Setting up time control......................................................................................................... 69
7.2.6.3 Setting up alarm groups ...................................................................................................... 70
7.2.6.4 Creating recipient ................................................................................................................ 75
7.2.6.5 Creating alarm rule .............................................................................................................. 78
7.2.6.6 Alarm overview .................................................................................................................... 83
7.2.6.7 Comments for acknowledging alarms .................................................................................. 83
Page 5

Contents
7.3 Use of testo Saveris software for transport monitoring with radio data loggers
(“mobile monitoring”) ........................................................................................... 84
7.3.1 General ...................................................................................................................... 84
7.3.2 Setting up tours .......................................................................................................... 85
7.3.2.1 Tour description................................................................................................................... 85
7.3.2.2 Planning tours ..................................................................................................................... 86
7.3.2.3 Defining tours ...................................................................................................................... 87
7.3.2.4 Displaying tours ................................................................................................................... 88
7.3.2.5 Searching for tours .............................................................................................................. 89
7.3.2.6 Changing tours .................................................................................................................... 89
8 Tips and assistance ........................................................................... 90
8.1 Questions and answers ...................................................................................... 90
8.2 Saveris base alarm messages ............................................................................ 90
8.3 Accessories ......................................................................................................... 92
Page 6

Page 7
1 About this document
• …
Action: one step or optional step.
Requirement
Position numbers for the clarification of the relationship
Elements of the instrument, the instrument display or the
program interface.
Control keys of the instrument or buttons of the program
interface.
... | ...
Functions/paths within a menu.
1 About this document
• The instruction manual is an integral part of the testo Saveris measurement
data monitoring system.
• Keep this documentation to hand so that you can refer to it when necessary.
• Please read this instruction manual through carefully and familiarize yourself
with the product before putting it to use.
• Hand this instruction manual on to any subsequent users of the product.
• Pay particular attention to the safety instructions and warning advice in order
to prevent injury and damage to the product.
• Please read this instruction manual through carefully and familiarize yourself
with the product before putting it to use.
1.1 Symbols and writing standards
Display Explanation
Note: basic or further information.
1. ...
Action: several steps, the sequence must be followed.
2. ...
List
> ...
- ...
Result of an action.
✓ …
...
between text and picture.
...
Menu
[OK]
“...” Example entries
7
Page 8
2 Safety and disposal
Life
Indicates possible serious injuries.
Indicates possible minor injuries.
ATTENTION
Indicates possible damage to equipment.
s below 5°C, the (rechargeable) batteries will not charge;
1.2 Warning notices
Always pay attention to any information marked with the following warning
notices along with warning pictograms. Implement the specified precautionary
measures!
DANGER
-threatening danger!
WARNING
CAUTION
2 Safety and disposal
2.1 Safety
• Always operate the product properly, for its intended purpose and within the
parameters specified in the technical data. Do not use any force.
• Never use the Saveris probes to measure on or near live parts.
• Only carry out maintenance and repair work on the components of the testo
Saveris measurement data monitoring system that are described in the
documentation. Follow the prescribed steps exactly when doing the work.
Use only original spare parts from Testo.
• The use of the wireless module is subject to the regulations and stipulations
of the respective country of use and, in each case, the module may only be
used in countries for which a country certification has been granted. The
user and every owner undertake to adhere to these regulations and
prerequisites for use and acknowledge that the re-sale, export, import, etc. in
particular in, to or from countries without wireless permits, is their
responsibility.
• When selecting the mounting location, ensure that the permissible ambient
and storage temperatures are adhered to.
At temperature
there is only a limited possibility of reliable system operation in this
temperature range.
8
Page 9

3 Protecting the environment
• Do not use the product if there are signs of damage to the housing.
• Do not commission the instrument if there are signs of damage on the
housing.
• Dangers may also arise from objects being measured or the measuring
environment. Always comply with the locally valid safety regulations when
carrying out measurements.
• Do not store the product together with solvents.
2.2 Batteries
The batteries in the Saveris base, the Saveris Ethernet data loggers and the
Saveris analog couplers are wearing parts which have to be replaced after
approx. 2 years. If batteries are faulty, it is not possible to guarantee full
operability of the GSM module. In the event of a power failure, data loss cannot
be ruled out for all components. When a component's batteries are no longer
fully functional, it triggers a Defective battery system alarm.
The batteries (order no. 0515 5021) should then be replaced immediately to
ensure full functionality and data security.
3 Protecting the environment
• Dispose of faulty and spent batteries in accordance with the valid legal
specifications.
• At the end of its useful life, deliver the product to the separate collection
point for electric and electronic devices (observe local regulations) or return
the product to Testo for disposal.
• WEEE Reg. No. DE 75334352
4 Support
You can find up-to-date information on products, downloads and links to contact
addresses for support queries on the Testo website at: www.testo.com.
5 Using the system
5.1 Fields of application
The testo Saveris measurement data monitoring system can be used anywhere
where temperature and humidity-sensitive products are produced, stored or
transported; for example in the food industry (cold rooms, deep freeze rooms
and refrigerated/deep freeze transporters), in smaller food production
companies, such as bakeries and butcher’s shops, or in the pharmaceutical
industry (temperature-controlled cabinets, storage and transportation of drugs).
9
Page 10
5 Using the system
But the testo Saveris measurement data monitoring system can also be used in
other industries for monitoring IAQ in buildings, as well as for quality assurance
in store rooms for products in every phase of production.
The testo Saveris measurement data monitoring system is only used to
monitor readings, not to control and regulate them.
The Saveris base with the SMS module may not be operated in
environments where, for example, use of a mobile phone is prohibited.
Mobile monitoring is only available for countries with appropriate radio
authorization of 868 MHz.
5.2 How it works
5.2.1 Measurement data monitoring for
monitoring in the stationary area
The testo Saveris measurement data monitoring system enables ambient or
process data for temperature and humidity in closed areas (production plants,
warehouses) to be measured and saved. The values measured by the probes in
the system are transmitted to the Saveris base, either wirelessly or via cable
(Ethernet), by data loggers, which are also used as a buffer memory for the
measurement data, and the values are then saved in the base. A connected
computer transfers the measurement data of the Saveris base to permanent
archiving in a database.
5.2.2 Measurement data monitoring for transport
monitoring with radio data loggers (“mobile
monitoring”)
The monitoring of ambient parameters during the transport of sensitive goods is
done by radio data loggers which are fitted in the transport container (e.g. in a
truck). If the transport container returns to the base, the readings recorded by
the data logger are transmitted via extender (or also directly) to the Saveris base
as soon as there is an adequate radio link. The Saveris cockpit unit can be used
in the truck for direct checking of readings. If radio data loggers are registered in
mobile zones, all the radio data loggers are in one radio cell on the same
channel. The Saveris extenders work as external antennas of the Saveris base
with a spatial distribution. All of these radio data loggers are registered on the
Saveris base.
10
Page 11

6 Product description
saved in a database.
mounted on these externally.
Saveris radio data loggers record readings
radio link.
connection.
5.3 Exclusion of liability
The testo Saveris measurement data monitoring system was developed to
consolidate a large amount of measurement data from spatially separated data
loggers in the Saveris software, to document them without interruption and to
provide alarms in the event of irregularities.
The design of the testo Saveris measurement data monitoring system is not
intended for the purpose of undertaking control and regulation tasks. In
particular, the alarms are not to be seen as so-called critical alarms which are
able to avert dangers to life and limb or damage to property.
Liability on the part of Testo SE & Co. KGaA for damages from this type of
application is excluded.
6 Product description
6.1 System overview
Component Function
Readings are transmitted wirelessly or via an
Ethernet connection to the Saveris base which
testo Saveris base
then saves them. The data are then called up
by a computer from the Saveris base and
Probes
Radio data loggers for
testo Saveris
Ethernet data loggers for
testo Saveris
Probes measure temperature, humidity and
other parameters and supply their
measurement data to data loggers. In the
testo Saveris measurement data monitoring
system, probes are either structurally
integrated into the data loggers or can be
from probes and transmit these wirelessly via
Saveris Ethernet data loggers record readings
from probes and transmit these via Ethernet
11
Page 12

6 Product description
Saveris analog couplers enable the integration
Ethernet connection.
The radio link can be improved or extended in
range.
By connecting a Saveris converter to an
paths.
over long transmission paths.
value violations.
Component Function
of additional measurement parameters into the
testo Saveris measurement data monitoring
Wireless analog couplers
Ethernet analog couplers
and transmitters for testo
Saveris
testo Saveris router
testo Saveris converter
system by incorporating all transmitters with
standardized current/voltage interfaces.
Transmitters record readings from data
loggers and transmit these via an optional
additional component (Ethernet module) by
poor structural conditions by using a Saveris
router. Several Saveris routers are possible in
the testo Saveris measurement data
monitoring system. At the same time, the
series connection of up to 3 routers (V 2.0
offers optimum flexibility in terms of wireless
Ethernet jack, the signal of a Saveris radio
data logger can be converted into an Ethernet
signal. This combines the flexible connection
of the Saveris radio data logger with use of the
existing Ethernet, even over long transmission
By connecting a Saveris extender to an
Ethernet jack, the signal of a Saveris radio
data logger, whether being used in a
testo Saveris extender
stationary or mobile mode, can be converted
into an Ethernet signal. This combines the
flexible connection of the Saveris radio data
logger with use of the existing Ethernet, even
The testo Saveris cockpit unit permits reading
control of Saveris radio data loggers during
transport operations. The testo Saveris cockpit
testo Saveris cockpit unit
unit enables drivers of the transport vehicles to
keep an eye on the measurement data at all
times and they are alerted if there are limit
12
Page 13
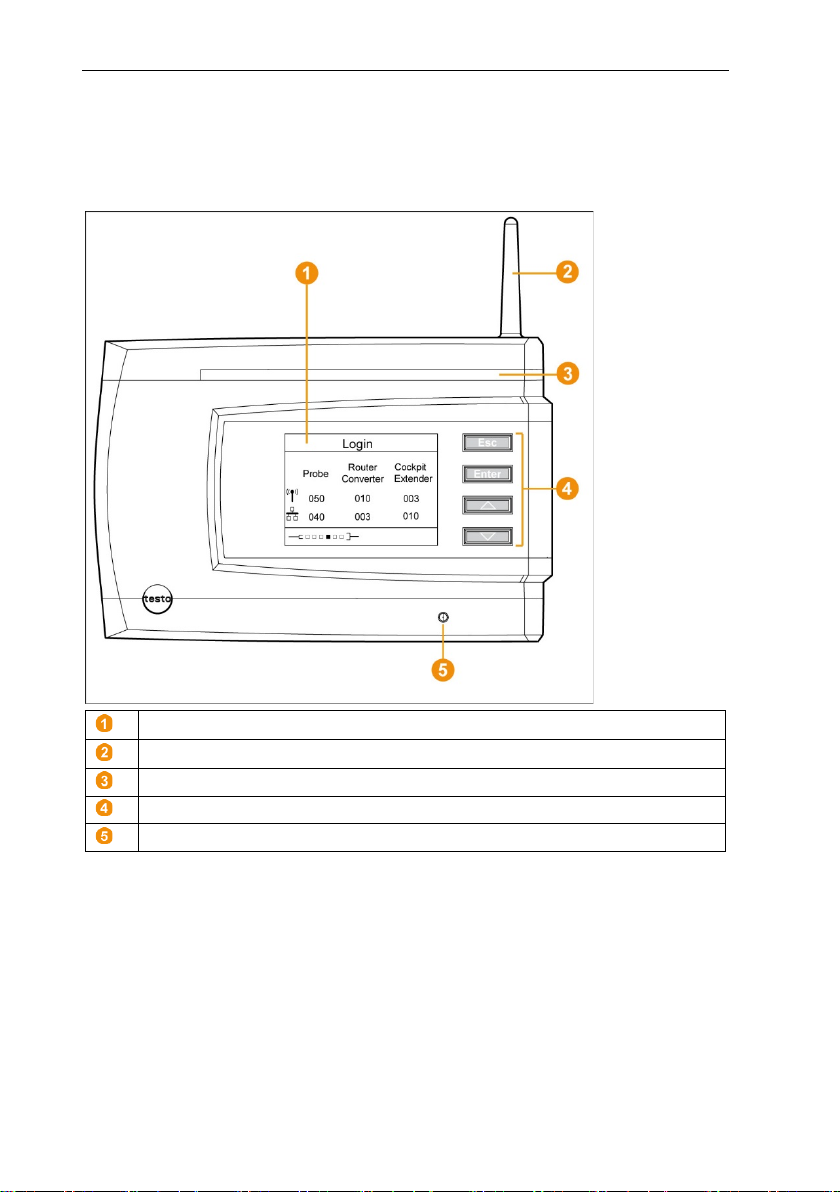
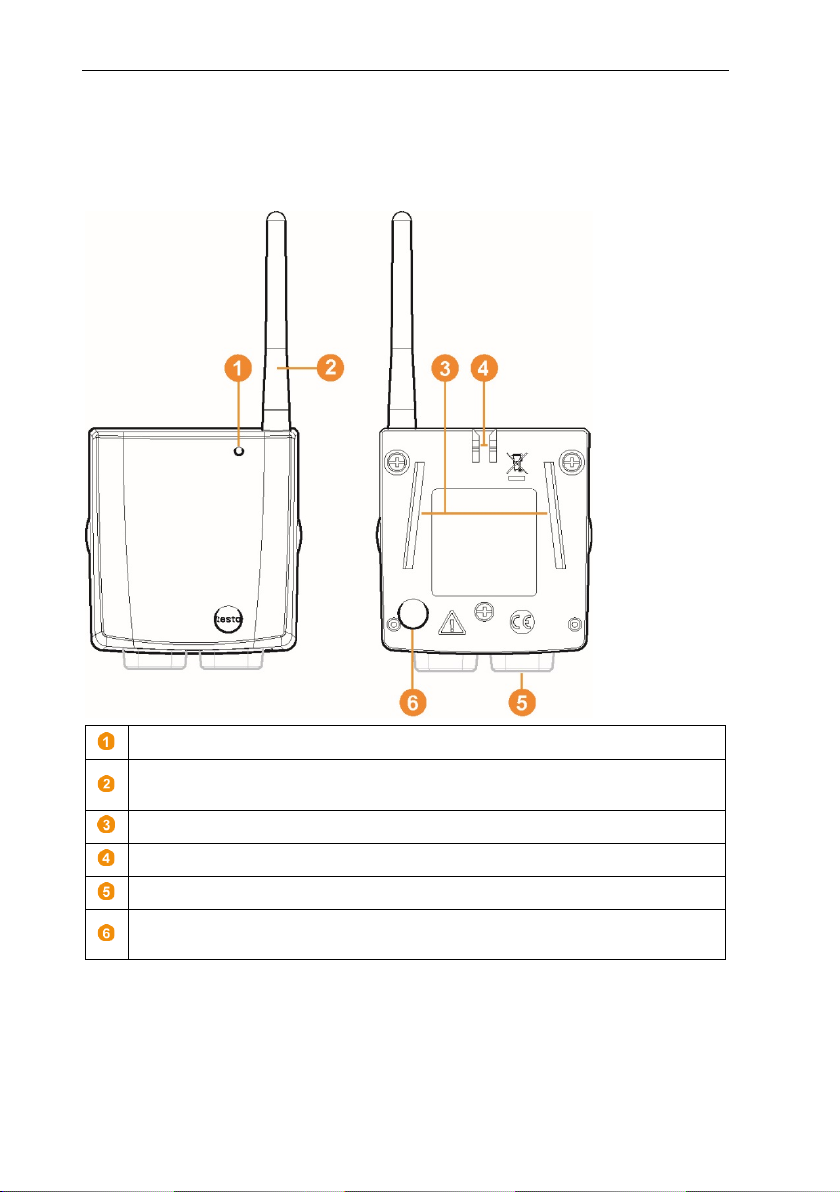
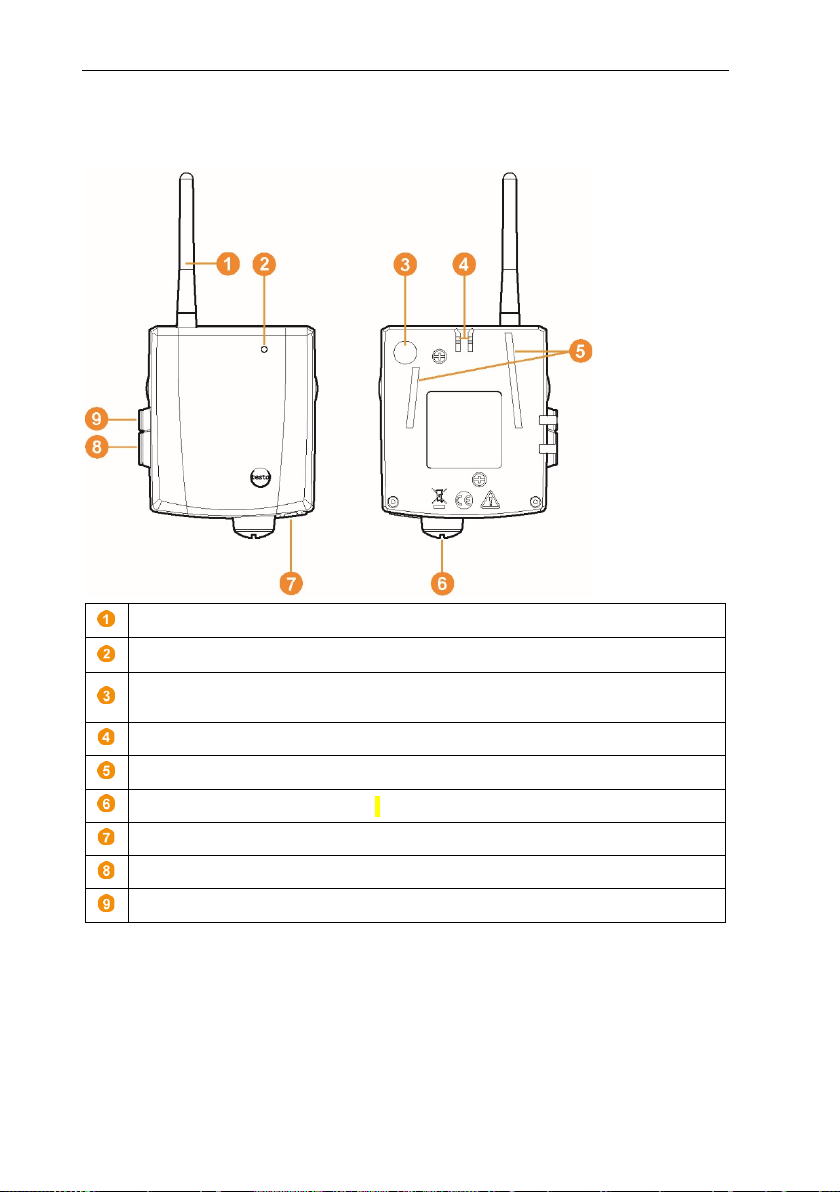
6.2.1
Display for the visualization of alarms and user guidance
Antenna
Warning LED
Keypad for operation of the Saveris base
LED for status display
6.2 testo Saveris base
Front
6 Product description
13
Page 14
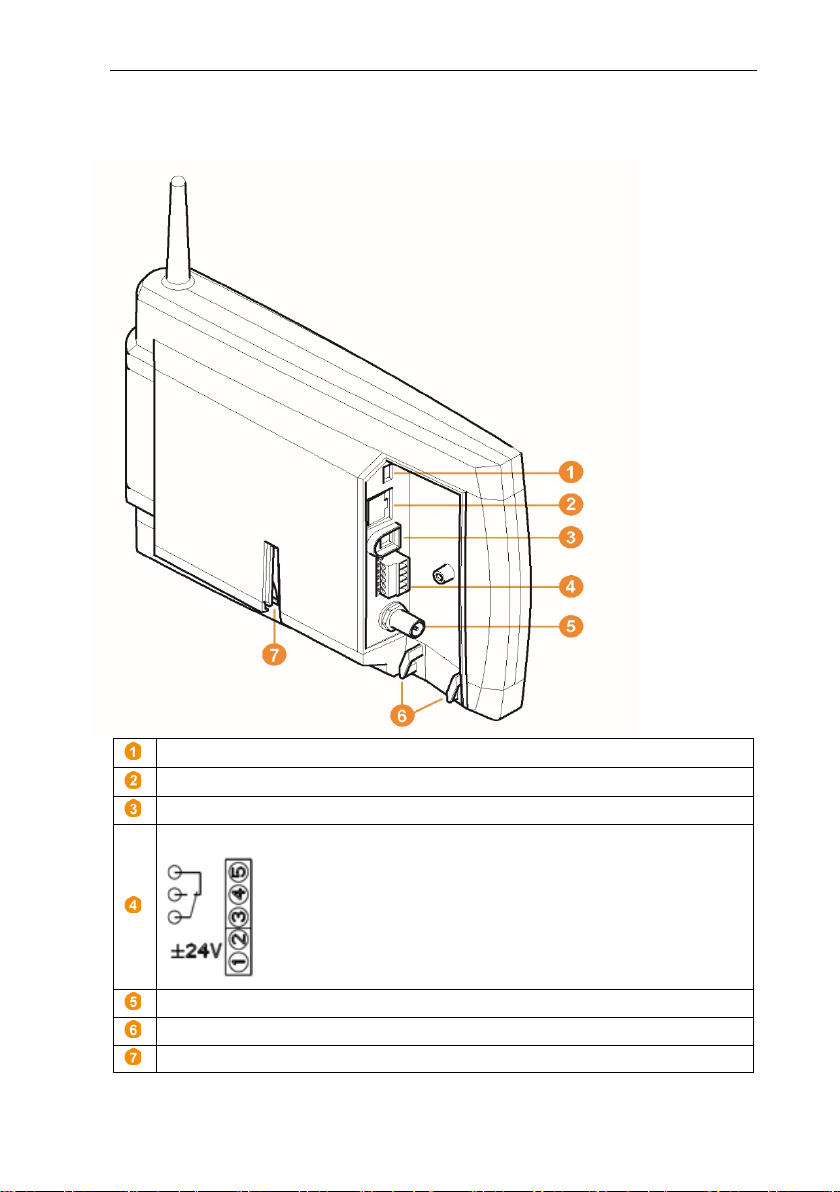
6 Product description
USB cable connection
Network cable connection
Power supply connection via mains plug
Power supply connection via 24 V AC/DC and alarm relay
Connection for external GSM antenna
Eyelets for strain relief
Guide for stand or wall bracket
6.2.2 Rear
14
Page 15
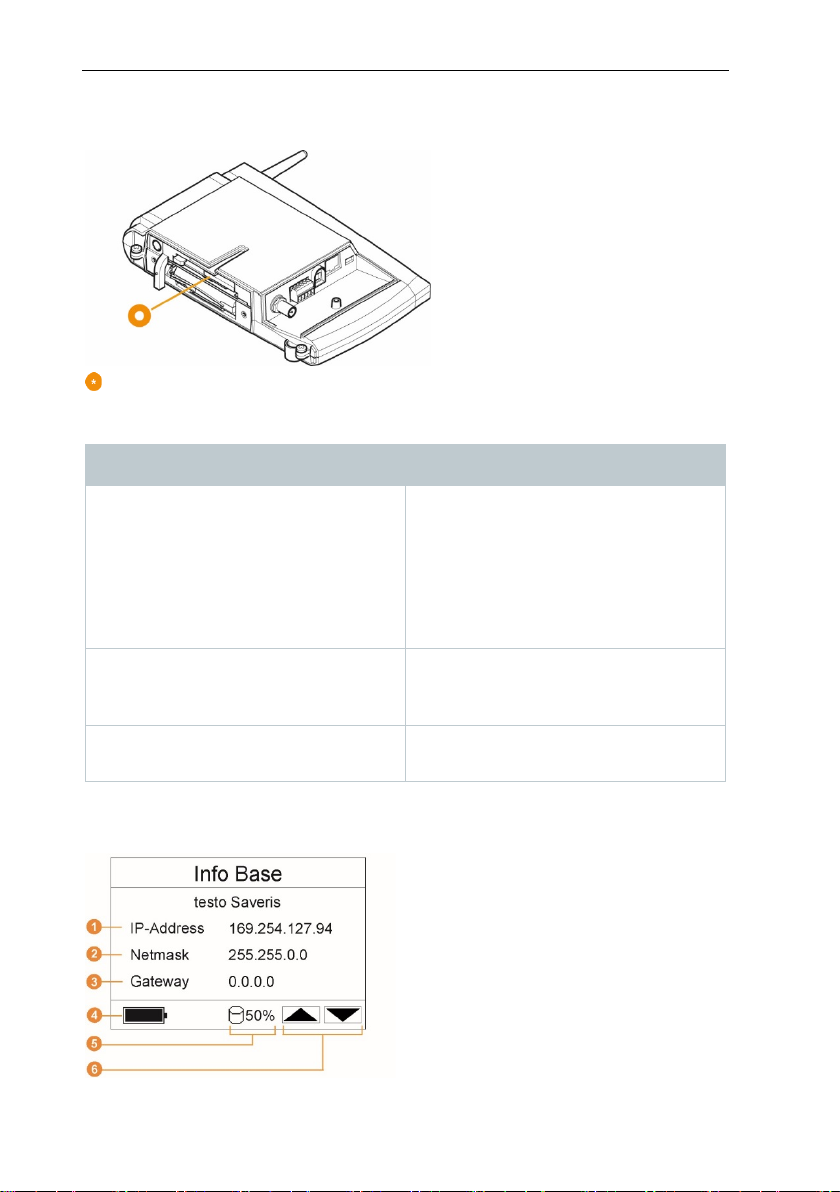
6.2.3 Underside
[Esc]
[Enter]
[ ▲ ], [ ▼ ]
Insertion slot for the SIM card
6.2.4 Control keys
Key Explanation
Switches from the Login menu to the
Info System menu.
In the Info Base menu, briefly press
[Esc] twice: shuts down the Saveris
base
press and hold down [Esc]: starts up
the Saveris base
6 Product description
6.2.5 Displays
Info Base menu
Starts the login status for the Saveris
radio data loggers in the Info System
menu.
Navigation keys for changing the
menus.
15
Page 16
6 Product description
IP address of the Saveris base
within the network
Netmask which is saved in the Saveris base.
is integrated into.
format is then performed by the gateway in each case.
been interrupted.
Indicator that there is free capacity in the Saveris base’s data memory.
Keys that are assigned functions in this menu.
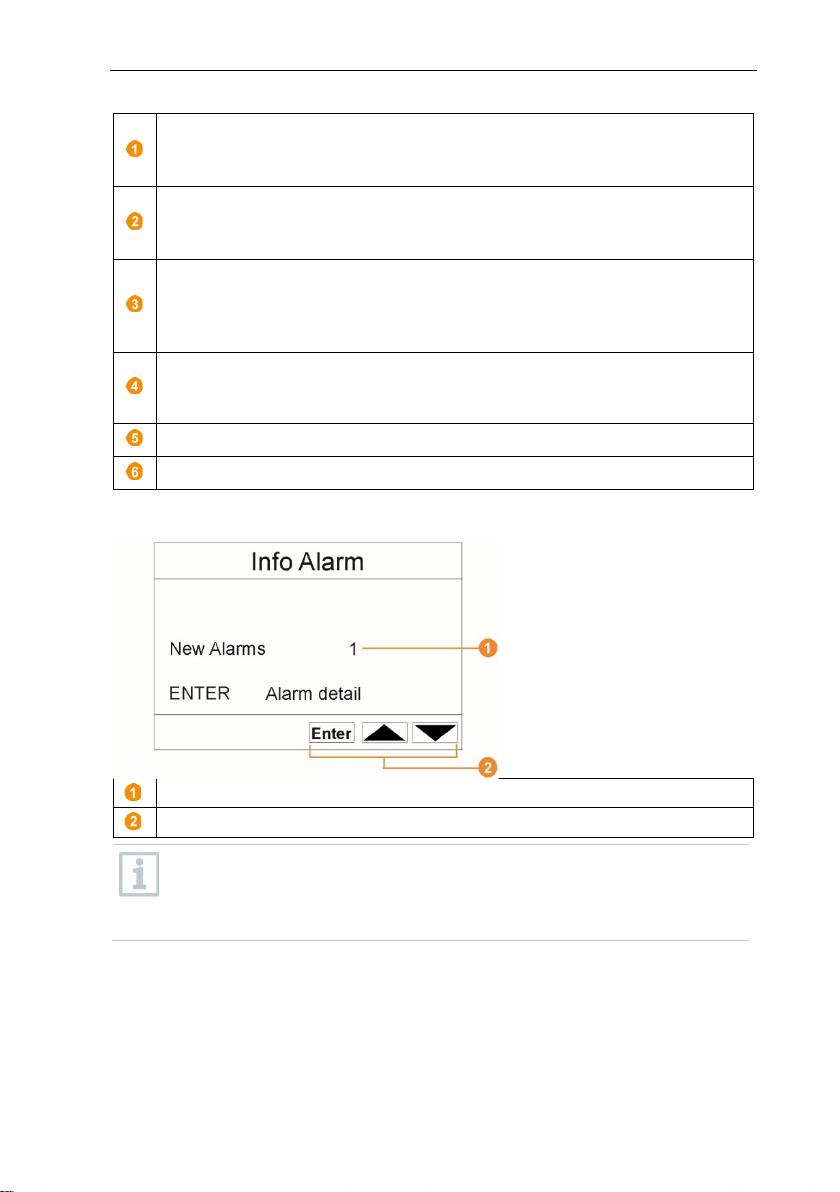
Number of newly triggered alarms
Keys that are assigned functions in this menu.
New alarms have to be checked and acknowledged at regular intervals.
The IP address is the unique identification number of the Saveris base
The netmask is the basic address of the network which the Saveris base
Gateway which is saved in the Saveris base.
A gateway is a transfer point between networks that work with different
protocols or data formats. A "translation" into the other protocol or data
Indicator for interrupted power supply. Indicator flashes when the
Saveris base is being operated by batteries and the power supply has
Info Alarm menu
A large number (>100) of unacknowledged alarms will impair the
system performance. The system automatically acknowledges
unacknowledged alarms once these number 200 or more.
16
Page 17
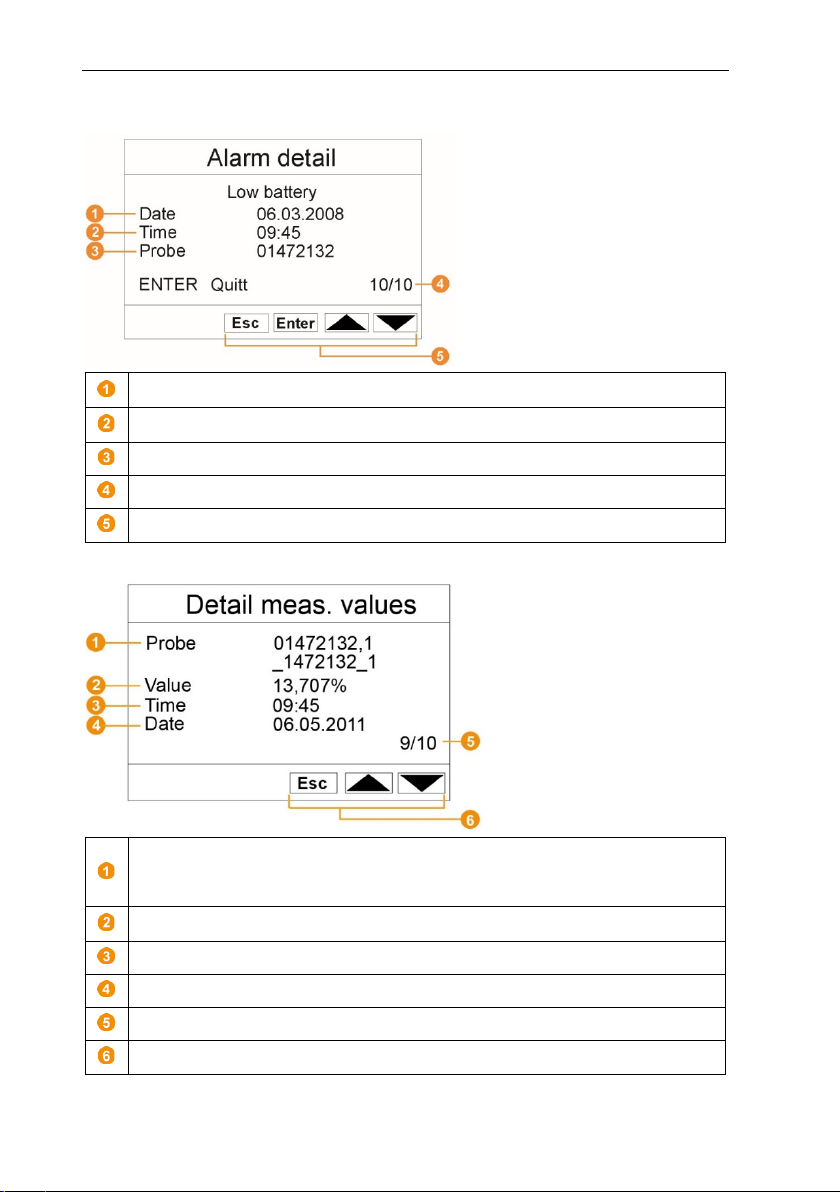
Alarm detail menu
Date on which the alarm was triggered.
Time
Probe for which the alarm was triggered.
Alarm number and total number of alarms.
Keys that are assigned functions in this menu.
Probe: Radio data logger and channel for which the reading was
and the second line the channel name in the system.
Value: Reading with associated unit.
Time: Time at which the reading was transferred.
Date: Date on which the reading was transferred.
Reading number and total number of readings.
Keys that are assigned functions in this menu.
6 Product description
at which the alarm was triggered.
Detail meas. values menu
transferred. The first number specifies the serial number with the channel
17
Page 18
6 Product description
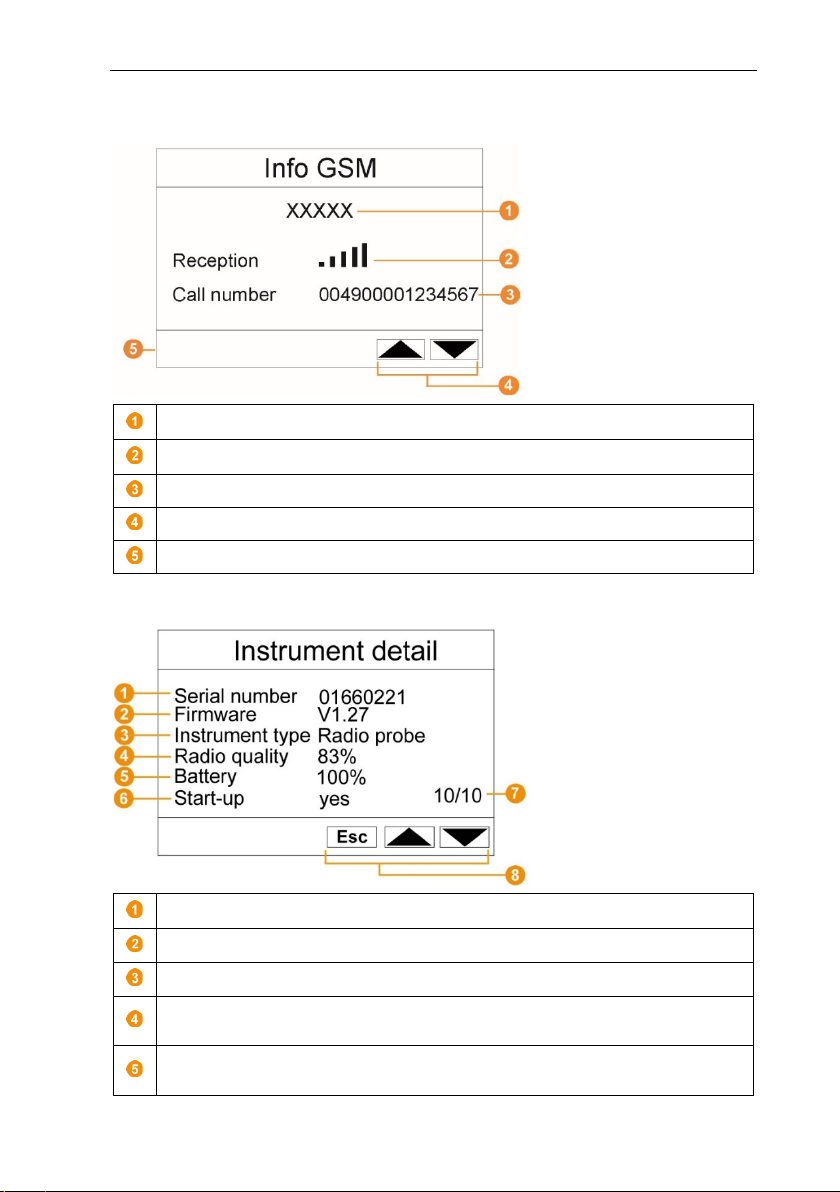
Name of network operator.
Reception: Display of the reception quality.
Call number: Telephone number which is saved on the SIM card.
Keys that are assigned functions in this menu.
Version number of the internal GSM module.
Serial number: Serial number of the registered instrument.
Firmware: Firmware version of the registered instrument.
Instrument type: Type designation of the registered instrument.
Radio quality: Radio quality of the registered instrument (does not apply
to Saveris Ethernet data loggers and Saveris extender).
Battery: Battery status of the instrument (does not apply to Saveris
extender, Saveris converter and Saveris cockpit unit).
Info GSM menu
Instrument detail menu
18
Page 19
Start-up: Start-up indicates whether the instrument has been configured
by the startup wizard.
Number of registered instruments.
Keys that are assigned functions in this menu.
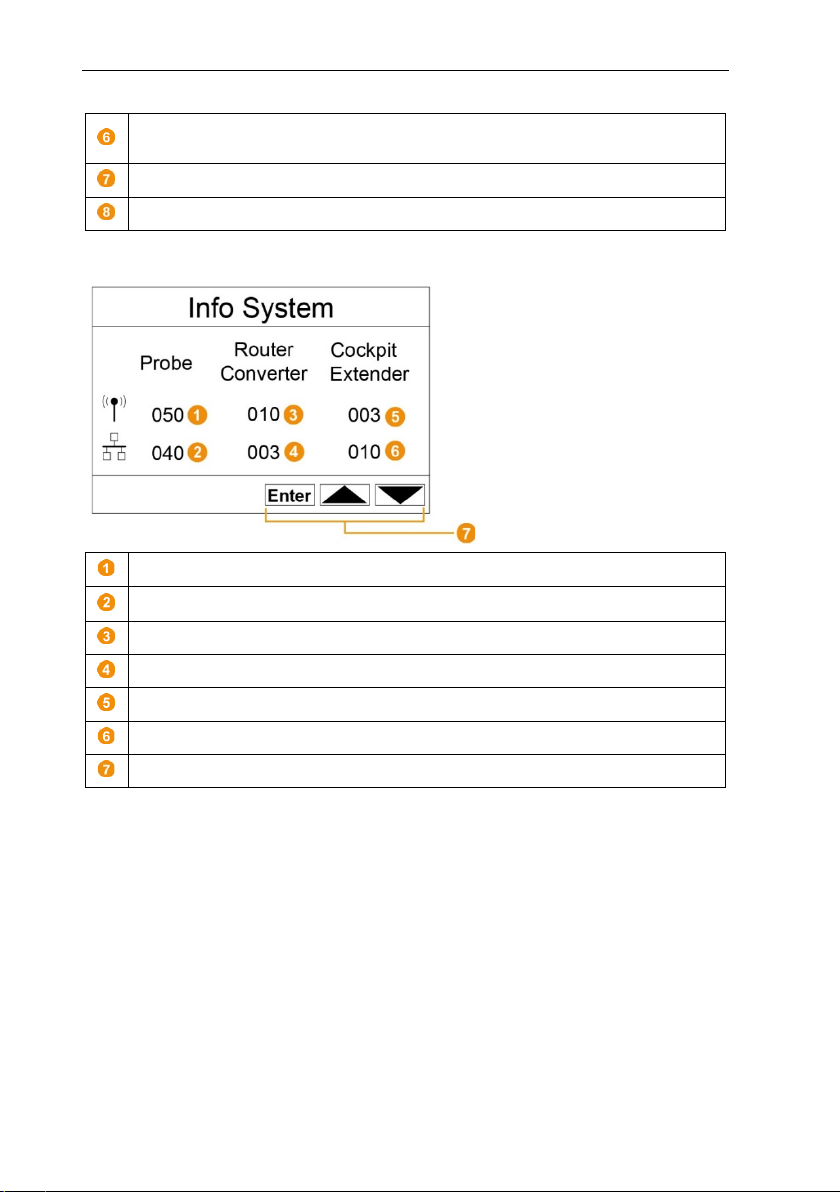
Probe
Probe: Number of registered Saveris Ethernet data loggers.
Router Converter: Number of registered Saveris routers.
Router Converter: Number of registered Saveris converters.
Cockpit Extender: Number of registered Saveris cockpit units.
Cockpit Extender: Number of registered Saveris extenders.
Keys that are assigned functions in this menu.
Info System menu
: Number of registered Saveris radio data loggers.
6 Product description
19
Page 20
6 Product description
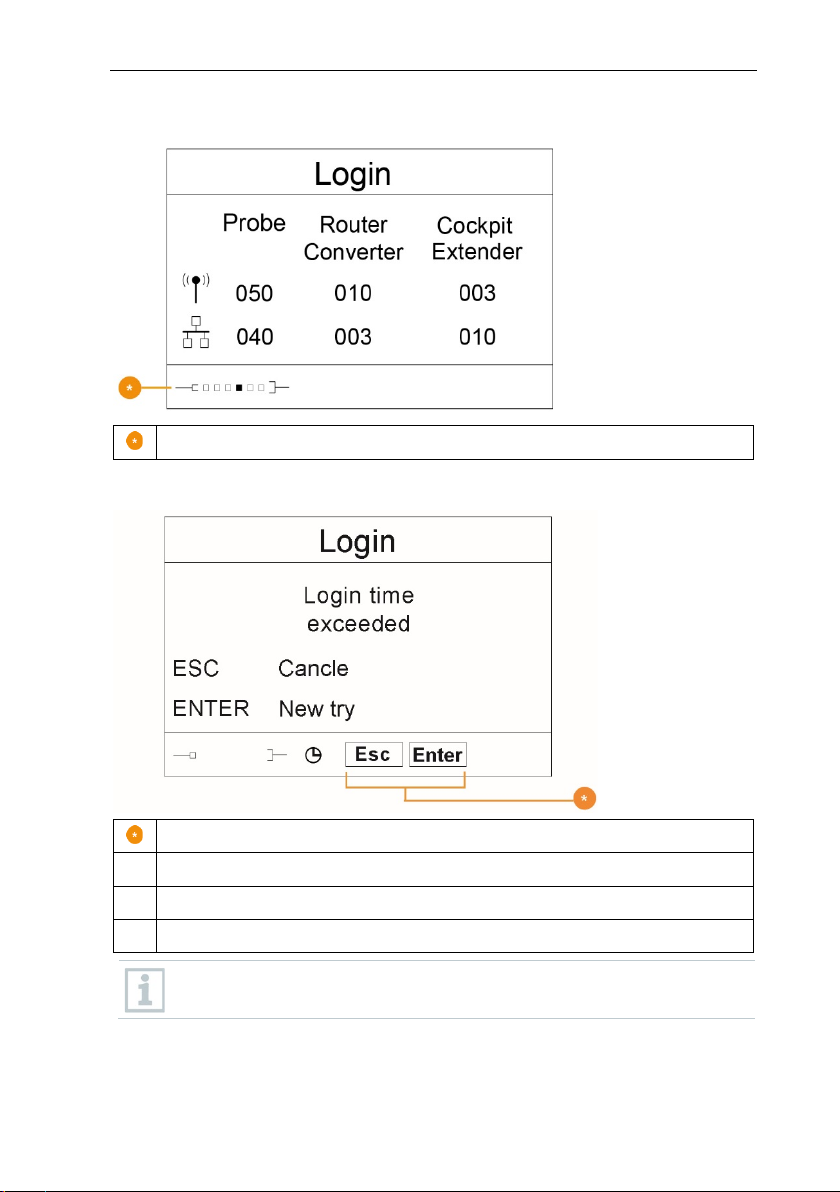
Status display when registering data loggers.
Keys that are assigned functions in this menu.
Login time exceeded
ESC Cancel
ENTER New try
Login 1/2 (Login) menu
Login 2/2 (Login) menu
This display is shown if no registration signal has been received from a
data logger within approx. 30 seconds.
20
Page 21
6 Product description
LED for status display.
Antenna for radio transmission of measurement data to the Saveris
base.
Guide rails for the wall bracket.
Catch for the wall bracket.
Ports, depending on the type.
Connect key for registering the probe on the Saveris base and for a
status request during operation.
6.3 Radio data logger for testo Saveris
6.3.1 Saveris radio data logger without display
21
Page 22
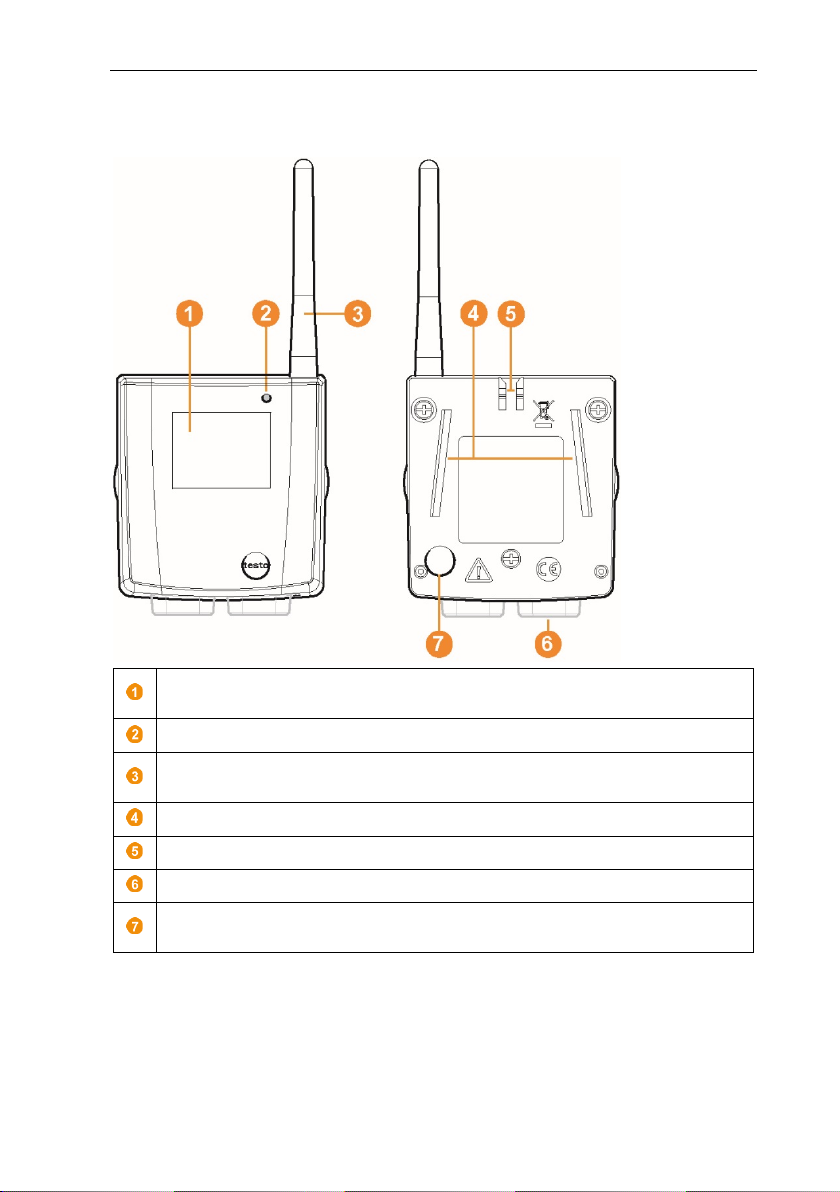
6 Product description
Display for showing readings, battery and connection status, along with
the field status of the radio link.
LED for status display.
base.
Guide rails for the wall bracket.
Catch for the wall bracket.
Ports, depending on the type.
Connect key for registering the Saveris data logger on the Saveris base
and for a status request during operation.
6.3.2 Saveris radio data logger with display
Antenna for radio transmission of measurement data to the Saveris
22
Page 23
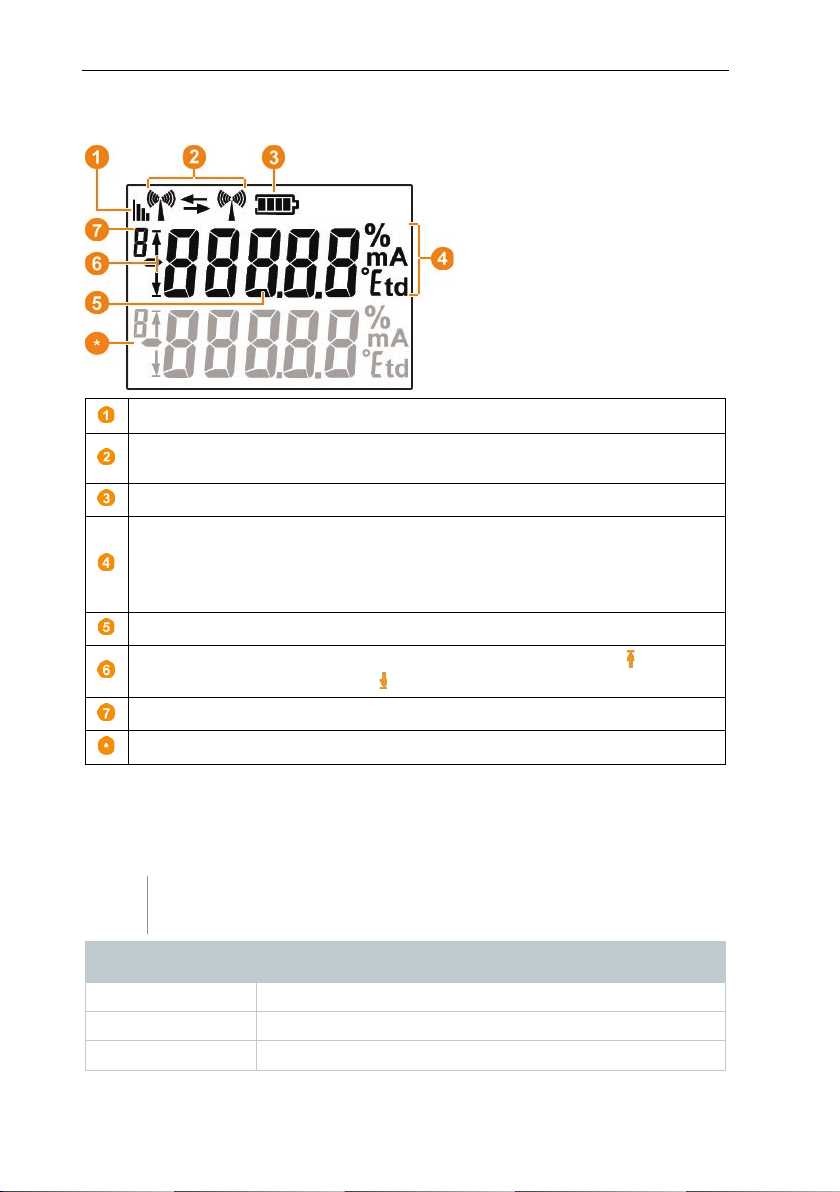
6 Product description
Quality of the radio link.
Saveris router or Saveris converter is being carried out.
Status of batteries.
Unit of the reading:
- °Ctd or °Ftd for dewpoint measurement.
Reading.
value or undershot the lower ( ) limit value.
Number of the channel.
Display for a second sensor in the probe.
-
Hold down the connect key on the rear of the data logger until the LED
Flashing orange
Attempt to establish the connection to the Saveris base.
Lit up green
Registration on the Saveris base was successful.
Lit up red
Registration on the Saveris base failed.
6.3.2.1 Displays
Indicator as to whether a communication with the Saveris base or a
- % for humidity measurement
- mA for current measurement
Indication as to whether the reading has overshot the upper ( ) limit
6.3.3 testo Saveris radio data logger LED status
displays
Registering on the Saveris base
begins to flash orange.
Display Explanation
23
Page 24
6 Product description
-
Briefly press the connect key on the rear of the data logger once and
Display
Explanation
Flashing 3 x green
There is a very good connection to the Saveris base.
Flashing 2 x green
There is a good connection to the Saveris base.
Flashing 1 x green
There is a borderline connection to the Saveris base.
Flashing 3 x red
Registration on the Saveris base failed.
Saveris WLAN data logger for WLAN
Status displays during operation
the LED shows the status of the connection to the Saveris base.
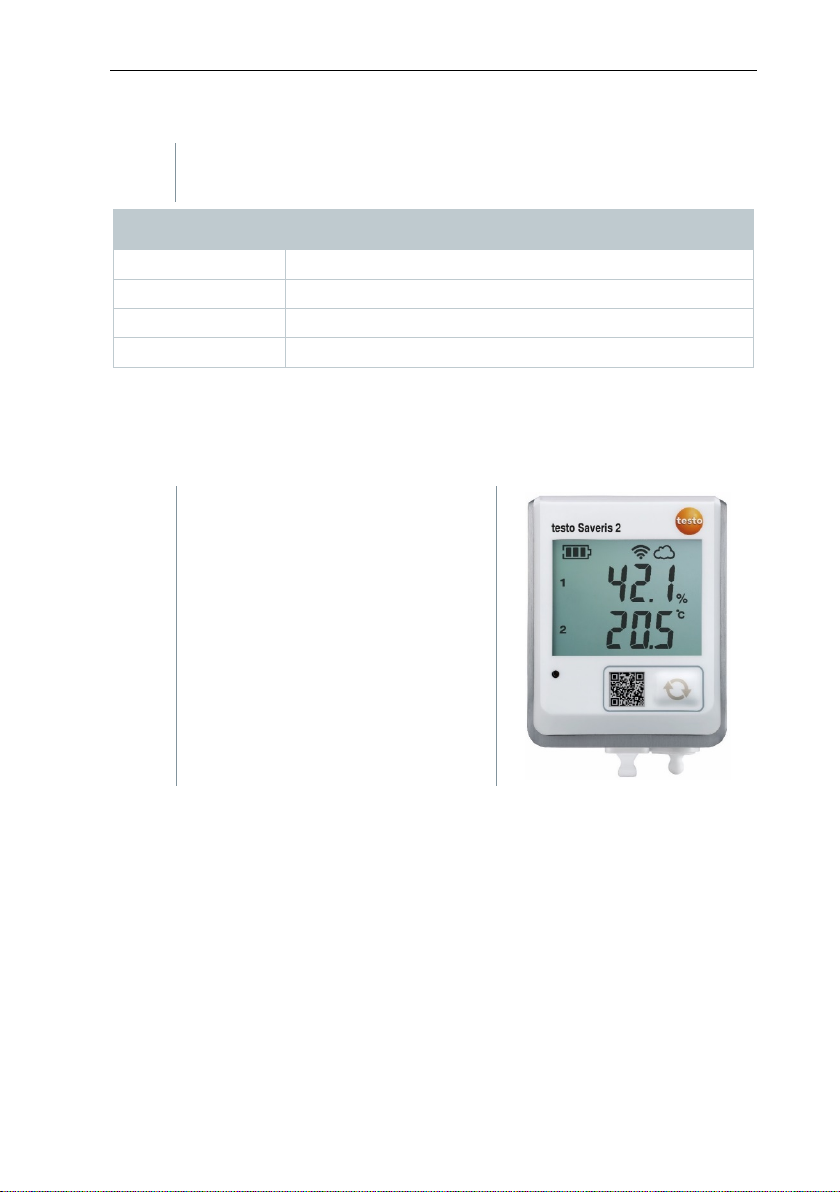
6.4 testo Saveris 2 H2
6.4.1 Short description
integration. The product version with
order number 0572 2035 01 is
compatible with testo Saveris, but not
with the testo Saveris 2 data logger
system.
24
Page 25
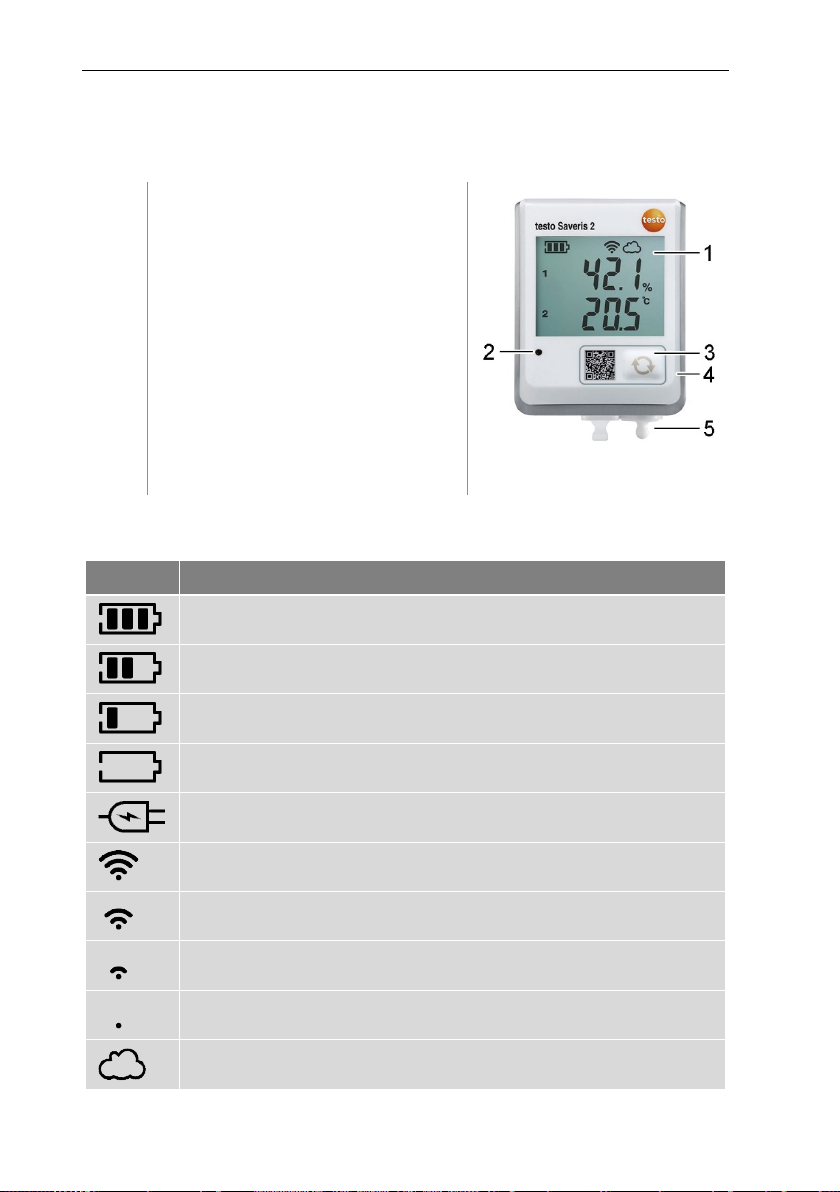
6.4.2 Display and control elements
6.4.2.1 Overview
1 Display
2 Status LED:
- flashes red for an alarm,
- flashes green for
communication
3 Control key, to start data transfer
manually
4 Battery compartment (rear)
5 USB and probe ports (bottom,
instrument-specific)
6.4.2.2 Display icons
Symbol Description
Battery capacity 75% to 100%
Battery capacity 50% to 74%
Battery capacity 25% to 49%
Battery capacity 5% to 24%, icon flashes: Battery capacity < 5%
External power supply (via USB port)
WLAN signal strength 100%
WLAN signal strength 75%
WLAN signal strength 50%
WLAN signal strength 25%
There is a data connection to the Saveris base, icon flashes: data connection to
testo Saveris is being established.
6 Product description
25
Page 26
6 Product description
Display for showing readings and transmission information.
LED for status display.
Connect key.
Catch for the wall bracket.
Guide rails for the wall bracket.
Input for external probes.
Input for external 24 V AC/DC power supply, M1.6 x 1.5 cable coupling.
Input for Ethernet interface
Input for service interface
Symbol Description
Alarm message
Measurement channel 1
Measurement channel 2
Alarm status: upper limit value overshot
Alarm status: lower limit value undershot
6.5 Ethernet data logger for testo Saveris
26
Page 27
6 Product description
Input for power supply via mains unit.
Status of batteries
carried out.
- °Ctd or °Ftd for dewpoint measurement.
Reading.
Indication as to whether the reading has overshot the upper ( ) limit
value or undershot the lower ( ) limit value.
Number of the channel.
Display for a second sensor in the probe.
Displays
-
Indicator as to whether a communication with the Saveris base is being
Unit of the reading:
- % for humidity measurement
- mA for current measurement
27
Page 28
6 Product description
measurement data.
LED for status display.
Connect key for registering the wireless analog coupler on the Saveris
Catch for the wall bracket.
Guide rails for the wall bracket.
Input for external 24 V AC/DC power supply, M1.6 x 1.5 cable coupling.
Only with Saveris Ethernet analog coupler U1E: Input for connecting the
network cable.
Input for service interface
Input for power supply via mains unit
6.6 Saveris wireless analog coupler
Only with wireless analog coupler U1: antenna for sending the
base and for a status request during operation.
28
Page 29
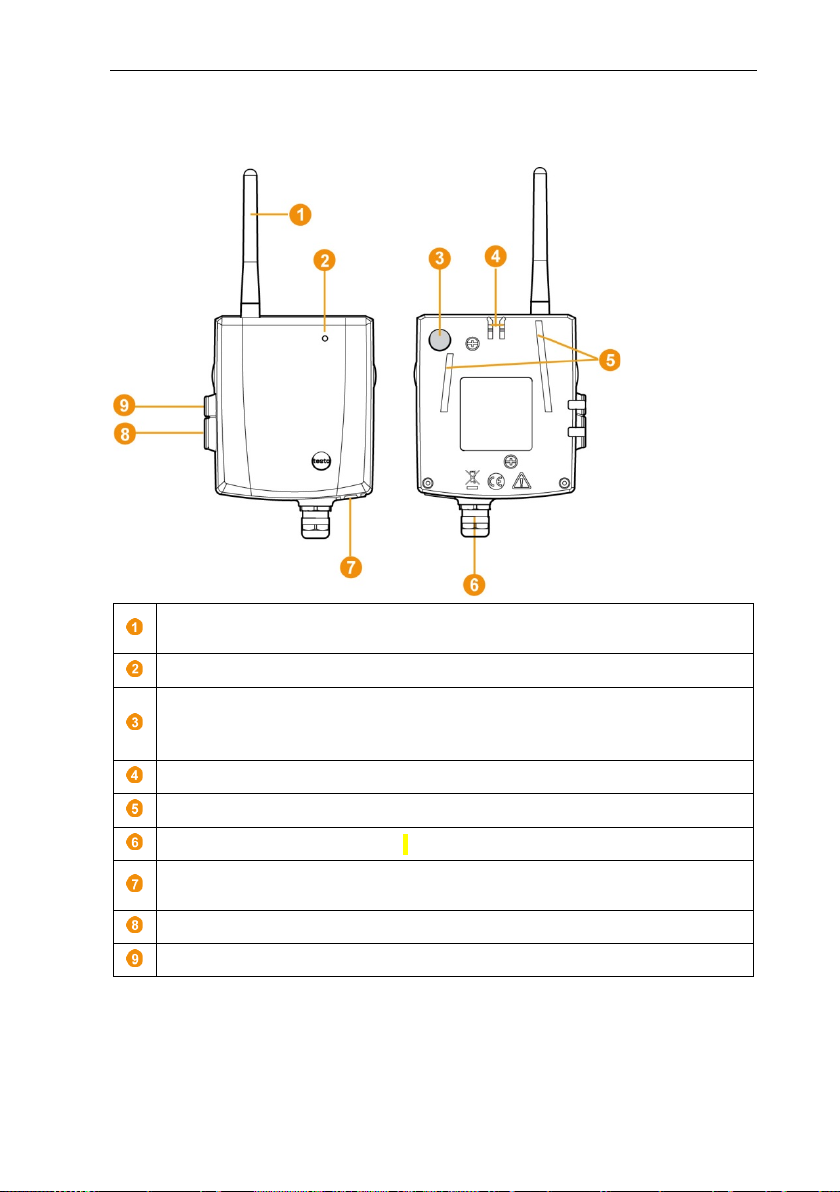
Antenna for radio transmission of the measurement data.
Connect key for registering the Saveris router on the Saveris base and
for a status request during operation.
Catch for the wall bracket.
Guide rails for the wall bracket.
Input for external 24 V AC/DC power supply, M1.6 x 1.5 cable coupling.
- Input for service interface.
Input for power supply via mains unit
6.7 testo Saveris router
6 Product description
LED for status display.
29
Page 30

6 Product description
Antenna for radio transmission of the measurement data.
Connect key for registering the Saveris router on the Saveris base and
for a status request during operation.
Catch for the wall bracket.
Guide rails for the wall bracket.
Input for external 24 V AC/DC power supply, M1.6 x 1.5 cable coupling.
Input for connecting the network cable (optional power supply via PoE).
Input for service interface
Input for power supply via mains unit
6.8 testo Saveris converter
LED for status display.
30
Page 31

Antenna for radio transmission of the measurement data.
Connect key to query the status during operation.
Catch for the wall bracket.
Guide rails for the wall bracket.
Input for external 24 V AC/DC power supply, M1.6 x 1.5 cable coupling.
Input for connecting the network cable (optional power supply via PoE).
Input for service interface
Input for power supply via mains unit
6.9 testo Saveris extender1
6 Product description
LED for status display.
1
Component is only permitted for mobile monitoring in all countries with a radio frequency of 868 MHz.
Saveris extender cannot be operated via VPN.
31
Page 32

6 Product description
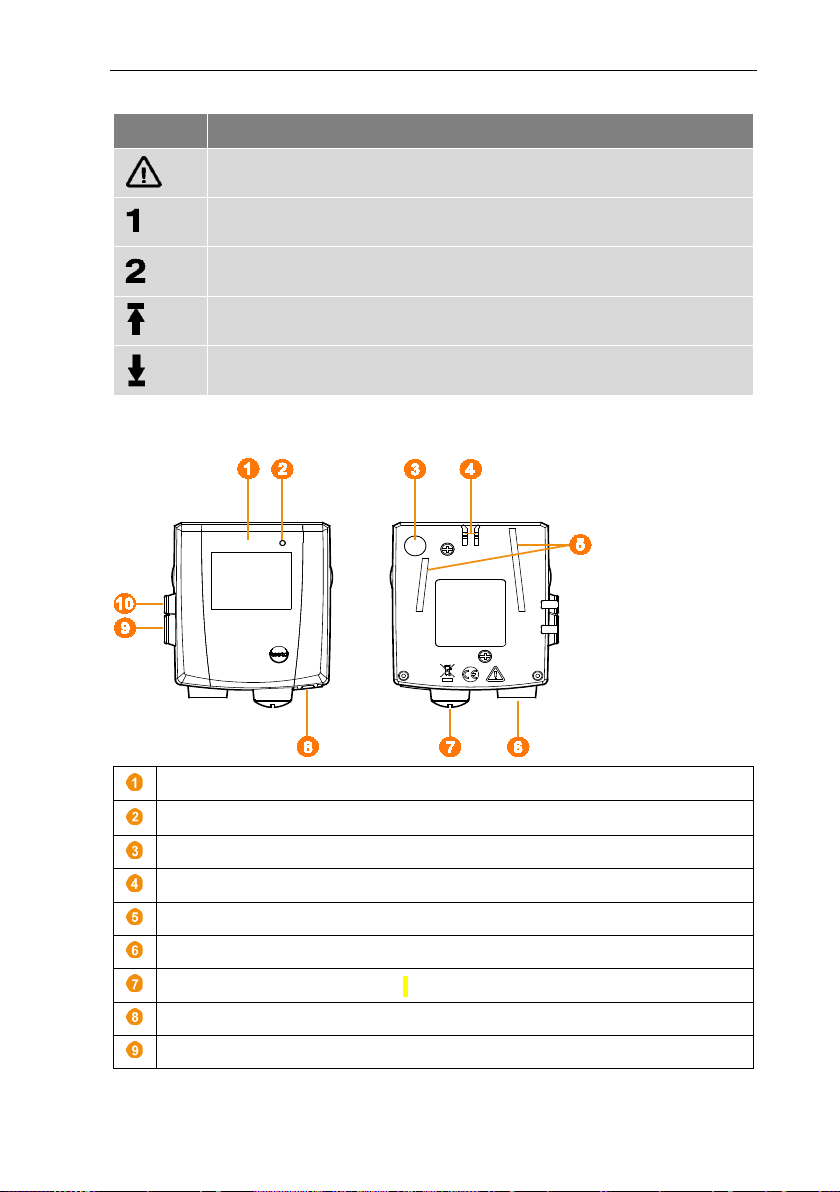
6.10.1
Display for the visualization of alarms and user guidance
Warning LED and PC interface
Keypad for operating the Saveris cockpit unit
6.10.2
Mini USB cable connection
Guide for bracket
6.10 testo Saveris cockpit unit2
Front
Rear
2
Component is only permitted for mobile monitoring in all countries with a radio frequency of 868 MHz.
32
Page 33

6 Product description
Key
Explanation
[Enter]
Hold down [Enter] for 3 seconds:
Confirm selected functions.
[Esc]
Saveris cockpit unit is not registered
down the Saveris cockpit unit.
[ ▲ ], [ ▼ ]
Navigation keys to switch menus or to
select an option.
Data transfer is running between the following
zone and Saveris extender/Saveris base
!
Feedback informing the driver that a Saveris data logger
30 minutes.
6.10.3 Control keys
Switch on the Saveris cockpit unit.
Starts the login status for the Saveris
cockpit unit in the Login menu.
Switch to the next menu level down.
on the Saveris base:
In the Select language menu, press
[Esc] briefly once: Shut down the
Saveris cockpit unit.
Switch to the next menu level up.
Saveris cockpit unit is registered on
the Saveris base:
Hold down [Esc] for 3 seconds: Shut
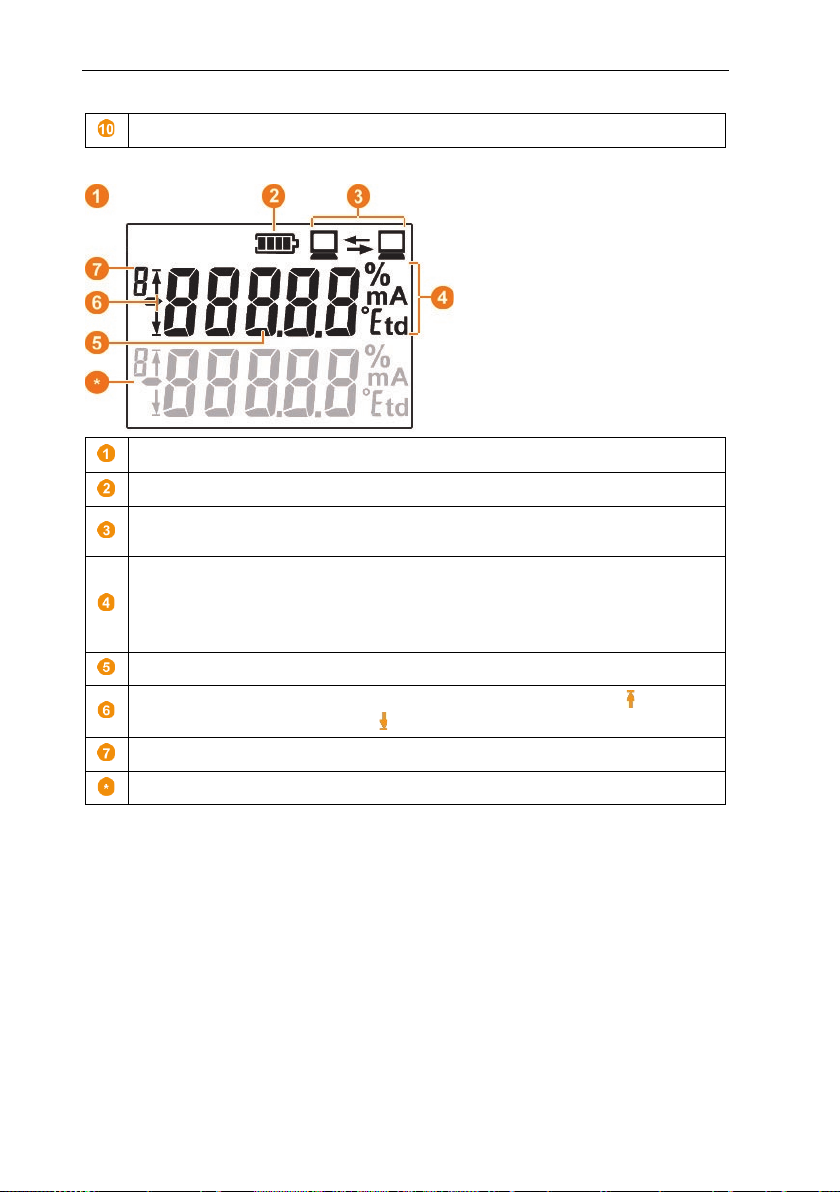
6.10.4 Displays
Icons
The following icons are displayed at the top right of all views
Display Explanation
Tour started.
components:
- Saveris cockpit unit and Saveris extender/Saveris
base
- Saveris data logger in the currently selected mobile
of the selected tour contains measurement data that
have not yet been transferred to the Saveris base. The
symbol only appears after a second measuring cycle or
33
Page 34

6 Product description
Description of why an alarm has been triggered.
Channel name (Probe): Data logger which the alarm was triggered for.
Date: Date on which the alarm was triggered.
Time: Time at which the alarm was triggered.
Alarm number and total number of alarms.
Keys that are assigned functions in this menu.
transferred.
Time at which the reading was transferred / date on which the
reading was transferred (shown alternately in this row).
Reading with associated unit.
Indication of limit values being exceeded.
Keys that are assigned functions in this menu.
Device settings menu
Sub-menus:
• Day/night settings
• Illumination
• Reading display settings
• Factory reset
Alarm menu
Readings menu
Data logger and associated mobile zone for which the reading was
34
Page 35

Data logger and associated mobile zone for which the reading was
transferred.
Min. reading with associated unit.
Max. reading with associated unit
Keys that are assigned functions in this menu.
Selection of the first mobile zone (with [ ▲ ], [ ▼ ]).
Selection of the second mobile zone (with [ ▲ ], [ ▼ ]).
Selection of the action: Change tour, Start tour, Stop tour (with [ ▲ ],
[ ▼ ]).
Keys that are assigned functions in this menu.
Min/Max menu
Tour settings (Tour)menu
6 Product description
35
Page 36

6 Product description
Selection of the output type.
Keys that are assigned functions in this menu.
Status display when the Saveris cockpit unit is registering on the Saveris
base.
Print menu
The print data can be sent via infrared to the Testo printer 0554 0549.
Login 1/2 menu
36
Page 37

Login 2/2 menu
Keys that are assigned functions in this menu.
Login time exceeded
ESC Cancel
ENTER New try
Login time exceeded
This display appears when the Saveris cockpit unit was unable to
register on the Saveris base within approx. 30 seconds.
6 Product description
37
Page 38

7 Using the product
7 Using the product
7.1 Starting the Saveris software
1. Select [Start] | All programs | Testo | Saveris.
- The Testo Saveris software program window is opened with the Select
project dialogue.
2. Select the
• Only active project option, if you need to open the data for an ongoing
project
• All projects option, if you need to open the data for a finished project.
3. Select the project that is to be opened in the tree structure.
4. Confirm by clicking on [OK].
- The Testo Saveris software program window is displayed with the selected
data record in the foreground.
It can take a few minutes for the first readings to be displayed.
7.2 Use of testo Saveris software for
7.2.1 General
The following section deals with the functionality of the testo Saveris software
which is relevant for measurement data monitoring in closed areas (production
plants, warehouses).
38
monitoring in the stationary area
Page 39

7 Using the product
1
Menu bar
4
Display area
switch between them via the tab
2
Menu functions
5
Navigation area
3
Data area
6
Calendar and alarm
fast navigation within the data records.
you confirm the alarms received.
7.2.2 User interface
In this section, you will find out how the user interface of the Saveris software is
designed.
The readings are represented in the
display area as diagrams and tables,
as well as the alarms received being
listed.
The data from several measurements
series can be opened and you can
The data area is used for
measurement data
management. You can create
new groups of readings and
copy the data from individual
channels within the groups
acknowledgement
In offline mode (see section 7.2.3.1
Start → Start | Operating mode), the
calendar is displayed which allows
Open data records in the display area
by clicking on a certain day in the
calendar or by marking a period of
several days in the calendar with the
mouse button held down.
In the online mode, this area shows
the alarm acknowledgement where
39
Page 40

7 Using the product
clipboard.
Edit zone
Changes the allocation of the
channels to the marked zone.
New zone
Creates a new reading group.
Delete
Deletes the marked element.
Rename
Renames the marked zone.
One-off report
Define report contents and create
one-off report.
MKT report
activation energy can be selected.
Online
The measurement is performed at the
the calendar in the online mode.
7.2.3 Menus and commands
In this section, you find out which menus and commands are available to you
and what you can use these commands for.
7.2.3.1 Start
Start | Clipboard menu
Menu functions Description
Copy Copies the marked element onto the
Start | Edit zones menu
Menu functions Description
Start | Create reports menu
Menu functions Description
Start | Operating mode menu
Menu functions Description
40
Generates a retrospective MKT (Mean
Kinetic Temperature) calculation as a
pdf report for the selected zone.
Reporting period, channels and
same time, meaning that the data are
automatically updated.
No time period can be selected using
Page 41

7 Using the product
Offline
The measurement is performed with a
view or opening another group.
from the database.
database.
Graphic
Shows the graphic display of the
readings if the checkbox is activated.
Table
Shows the tabular display of the
readings if the checkbox is activated.
Alarms
Shows the list of the triggered alarms
if the checkbox is activated.
Diagram
readings are shown as a diagram.
current reading is shown as a column.
Monitor
Option for the graphic display. The
can position freely on a wallpaper.
Menu functions Description
time delay, meaning that the data that
are called up are not automatically
updated.
The data will not be called up by the
base until you are actively working in
the software, e.g. when changing the
Start | Analysis menu
Menu functions Description
Day Shows the calendar for selecting the
day, in order to call up the data for the
corresponding day or for multiple days
Month Shows the calendar for selecting the
month, in order to call up the data of
the corresponding month from the
Start | View menu
Menu functions Description
Histogram Option for the graphic display. The
Option for the graphic display. The
readings are shown in fields that you
41
Page 42

7 Using the product
Insert
Adds a free comment text to a desired
and deleted via the context menu.
Hash code
Display hash values of the readings.
Search
Opens a search window in the
and
you can search through zones and
channels using a text word search.
Zoom in
Draw a rectangle in the diagram
full size.
Start | Notes menu
Menu functions Description
channel at a point in time that can be
selected.
The note can be seen in the Graphic
view as a yellow icon and as a red
triangle in the table cell in the Table
view. The entered comment text
appears when you move the mouse
over it. The comment can be edited
Start | Hash code menu
Menu functions Description
Start | Search menu
Menu functions Description
System navigation areas where
Data
7.2.3.2 Edit
Edit in the diagram view
The Edit menu (diagram) is only displayed if the diagram has been activated by
clicking on the window.
Edit | Tools menu (diagram)
Menu functions Description
42
window to zoom in on the area
covered. This function can also be
used during a measurement in online
mode. However, this means the
extract shown always displays the
current value.
When you click on [Original size], the
diagram is once again displayed in its
Page 43

7 Using the product
Crosshairs
Crosshairs which can be used to
reading are shown in the process.
Regression curve
Regression curves are an aid to
in the status bar.
limit values in the diagram.
Font
Opens the selection list of available
fonts.
Font size
font sizes.
fonts.
curve.
New formula
Opens an input window for entering a
new calculation formula.
Menu functions Description
follow the curve are shown by clicking
on a point of a measurement curve.
The date, time, reading number and
enabling better evaluation of large,
complex amounts of data. This
involves "outliers" being suppressed
and the actual course of the curve
being reproduced using a theoretical,
mathematical function.
The regression curve is shown by
clicking on a measurement curve.
regression coefficients are displayed
Limit values Activate the checkbox to show the
Edit | Font menu
Menu functions Description
The
Edit | Curves menu (diagram)
Font
C:1, C:n Legend for the diagram. Clicking on
Edit in the table view
The Edit (table) menu is only displayed if the table has been activated by
clicking on the window.
Edit | Formulae menu (table)
Menu functions Description
Opens the selection list of available
Opens the selection list of available
the entry of a curve opens the
dialogue for the characteristics of the
43
Page 44

7 Using the product
Edit formula
Allows an existing formula to be
edited.
Delete formula
Deletes an existing formula.
Mark
range).
Drop marking
Drops the marking.
Add rows (minimum, maximum,
Inserts a row at the end of the table
Compress
Compresses the table to definable
other readings are hidden.
Drop compression
Drops the compression.
fonts.
Font size
Opens the selection list of available
font sizes.
Minimum
selected channel within the table.
selected channel within the table.
Menu functions Description
Edit | Tools menu (table)
Menu functions Description
Marks data over a definable time
period or definable rows (index
mean value)
Edit | Font menu
Menu functions Description
Font Opens the selection list of available
Edit | Search menu (table)
Menu functions Description
Maximum Shows the largest reading of the
with the corresponding value for the
whole table.
The min, max and mean
values cannot be determined
via a time period/index range
defined in the table.
intervals.
Only the first and the last value are
shown for the individual intervals.
The
Shows the smallest reading of the
44
Page 45

7 Using the product
Wallpaper
Opens the Open dialogue to select
Background colour
Opens the Colour dialogue to select
field.
Adjust |
window.
number fields.
Edit wallpaper
The wallpaper can be edited with
Microsoft® Paint.
Delete wallpaper
Deletes the currently displayed
wallpaper.
Insert
Insert arrows and text fields.
Delete
Deletes a selected element.
Colour
Colour setting for a selected element.
Undo
Resets the latest changes.
Edit in the monitor view
The Edit menu (monitor) is only displayed if the diagram window has been
activated by clicking on the window.
Edit | Tools menu (monitor)
Menu functions Description
the wallpaper for the monitor. The
following image formats can be
added: .bmp, .jpg, .wmf, .ico and .gif.
The wallpaper must be
stored locally on the PC.
the background colour for the number
Setting for adapting the wallpaper to
Broadband,
Formatfüllend
the number field:
• Broadband: the image size is
adjusted to the width and/or
height of the window and the
image is centred in the window.
The ratio of image height to image
width is retained in this process.
• Filling Frame: the image is
expanded so that it fills the entire
Rearrange Resets the arrangement of the
Edit | Forms menu (monitor)
Menu functions Description
45
Page 46

7 Using the product
division setting (finer/coarser).
Division
Division setting (finer/coarser).
Edit template
Enables the editing of an existing
template.
Create new template
template.
You can adjust the number fields as required using the right mouse
button. You can thus show or hide their frames or their transparency,
for example.
You can move the fields and change their size with the left mouse
button.
7.2.3.3 Axes
Axes | Axes menu
This menu allows you to configure the value and time axis.
Axes | Value axis menu
Menu function Description
Division Input of upper and lower limits and
Axes | Time axis menu
Menu function Description
7.2.3.4 Template
Template | Template menu
Select a standard template in this menu into which the data that are to be saved
or printed are integrated.
The templates differ in terms of the protocol header, that is in terms of the
company logo, the address field or the specification of statistical values.
Template | Edit menu
Menu function Description
46
Enables the creation of a new
Page 47

7 Using the product
Display service data
Creates an *.html file with the service
The software version number
1
In the Start | View menu, mark the Graphic function if the data are to
histogram
In the Start | View menu, the Diagram command is activated. You now
1
In the calendar, select the day or time period that needs to be
7.2.3.5 Service
Service | Service menu
This menu can be used to display the service data.
Menu function Description
data.
can be found under service
data.
7.2.3.6 Select projects
The project data for all projects already created can be displayed using the
selection menu without having to restart the software.
7.2.3.7 Style template
Selection of the colour scheme for the program window.
7.2.4 Analyzing measurement series
You can represent measurement series as a diagram or a table.
be displayed graphically and choose the form of display.
•
The measurement data can be shown as a diagram,
number field.
• Choose Table if the data are to be displayed in tabular form.
7.2.4.1 Diagram view
In this view, the readings are shown as line diagrams.
have to select the data record that you wish to display.
evaluated.
47
Page 48

7 Using the product
2
In the tree structure of the data area, open the group that contains the
2.1
If necessary, deactivate channels via the checkboxes for the
1
Click on Edit | Tools | Zoom in.
2
In the diagram, press and hold the left mouse button to highlight the
1
Click on Edit | Tools | Crosshairs.
2
In the diagram, click on the point for which the details need to be
data to be displayed.
The data for the selected data is displayed.
display.
You can show or hide the gridlines for the corresponding axis by
clicking on the time axis or the value axis.
Zooming in
Zoom in on a detail of the diagram, for example to check the behaviour of the
readings within a specific time span.
area that needs to be enlarged.
If you click on [Original size], the whole diagram is shown again.
Information on a reading (crosshairs)
If you move the crosshairs along a curve, you will quickly get detailed
information on the individual readings.
shown.
A dialogue is displayed with the following information about the
reading:
• date on which the reading was recorded,
• time at which the reading was recorded,
• number of the reading and
• reading.
You can move along the curve with the left mouse button pressed and
held enabling you to see the detailed information for the readings.
To do this, it is not necessary to follow the course of the curve exactly;
48
the crosshairs do this automatically when you move the mouse to the
right or left.
Page 49

7 Using the product
1
Click on Edit | Tools | Regression curve.
2
Click on the reading curve for which the regression curve needs to be
1
Switch to the diagram view of the measurement series whose
2
In the Edit | Lines menu, click on the entry of a curve whose
[OK]
Applies the changed settings. The
dialogue is closed.
[Cancel]
Closes the dialogue without applying
the changes.
Showing regression curve
Place a regression curve over the diagram to show the course that the
measurement series tends to take.
shown.
The regression curve is shown and its regression coefficients are
Characteristics of a curve
You can adapt the display of a measurement series to your requirements. So,
you can for example change the line width of a curve or the representation of
the limit values in the diagram.
Buttons of the dialogue
displayed in the status bar.
If you click on the curve again, the regression curve is once more
hidden.
characteristics need to be displayed.
characteristics need to be displayed.
The Characteristics of (curve name) dialogue is opened.
The following tabs are available in the dialogue:
• Edit line tab
• Range limits tab
• Statistical computation tab
Button Explanation
49
Page 50

7 Using the product
Smooth
The measuring points are connected
mathematically.
Mark measuring points
The individual measurement points
Colour
Line colour of the curve.
Width
Line width of the curve.
Style
Line style of the curve.
Marker
Symbol for the measuring points.
extreme values.
Edit line tab
Name Explanation
Degree of regression Possible values "0" to "7". "0" degree
50
by an interpolated curve; that is, the
plot-points on the curve between two
measuring points are estimated
are represented by a symbol.
The value shown exactly
corresponds to the measured
value only at these points. The
measuring points are
connected with straight lines
during the measurement.
When the measurement is
paused, the curve can be
smoothed.
of regression corresponds to a pure
mean value calculation, "1" degree to
the linear trend, a higher value helps
in the event of curves with several
Page 51

diagram.
Add limit labels
Specification as to whether the limit
curve).
Area fill
Specification as to whether the areas
marked by means of an area fill.
lines.
Selection lists for line fill
Selection lists for line type and line
thickness.
Overshot
Colour selection for filling the area
above the upper limit value.
below the lower limit value.
Range limits tab
7 Using the product
Name Explanation
Display range limits Specification as to whether the limit
values should be shown in the
values should be labelled
(Upper/Lower limit value: name of
outside the limit values should be
Selection list for area fill Selection of the fill.
Line fill Specification as to whether the limit
values should be shown by horizontal
Undershot Colour selection for filling the area
51
Page 52

7 Using the product
Min. value
Smallest reading of the curve.
Max. value
Largest reading of the curve.
Mean value
Arithmetically-determined average
reading.
Std. deviation
Measure of the scattering of the
readings around the mean value.
Criteria
Setting display criteria: all, date/time
and index range.
Recalculate
Recalculates the curve.
1
Double click on the required value axis in the diagram or use the right
Statistical computation tab
Name Explanation
Settings for the axes in the diagram
Change the settings of the axes in the diagram to adapt the display to your
requirements.
Settings for the value axis
mouse button.
The Change axis [Unit of the
readings] dialogue is displayed.
52
Page 53

Name Explanation
Division linear
Specification that the axes are divided
in a linear manner.
Division logarithmic
Specification that the axes are divided
increments represent powers of ten.
[OK]
Applies the settings until other data
are called up. The dialogue is closed.
[Cancel]
Closes the dialogue without applying
any changes at all.
Automatic scale
Specification as to whether the
value axis.
Range of values from...to
Manual input of the value range when
Automatic scale is disabled.
Division automat.
Specification that the program should
perform the division of the axis.
Division manual
Specification that the division of the
axis should be performed manually.
Grid [<], [>] (when automatic division
is enabled)
By clicking on [<] or [>], make the axis
division larger or smaller.
enabled)
1
With the right mouse button, click on the time axis in the diagram.
logarithmically, meaning the division
program should perform scaling of the
7 Using the product
Interval (when manual division is
Manual entry of the grid.
Settings for the time axis
The Adjust time axis dialogue is
displayed.
53
Page 54

7 Using the product
[OK]
Applies the settings until other data
are called up. The dialogue is closed.
[Cancel]
Closes the dialogue without applying
any changes at all.
Position
diagram.
window.
Extract
Shows a firmly defined extract that
can be moved over the time axis.
Limits from…to (when Position
view is enabled)
Limits for the Position view.
Minimum time cycle (when Extract
view is enabled)
Specification of which time period
should at least be shown.
Selection list for the unit
d (day).
Absolute
All times are the real times at which
the readings were recorded.
Relative
Sets the starting time to 00:00; the
point.
Paging enabled
The function associated with this is
Edition.
Division automat.
Specification that the program should
perform the division of the axis.
axis should be performed manually.
is enabled)
, make the axis
division larger or smaller.
Interval (when manual division is
enabled)
Manual entry of the grid.
Selection list for the unit (when
Unit of the time axis:
d (day).
Name Explanation
Shows a freely-definable extract of the
Automatic scaling... Shows the entire diagram in the
Extract view is enabled)
Division manual Specification that the division of the
Grid [<], [>] (when automatic division
manual division is enabled)
(when
Unit of the time axis in the minimum
time cycle:
sec (second)
min (minute)
h (hour)
time then runs relative to this starting
not available in the Small Business
By clicking on [<] or [>]
sec (second)
min (minute)
h (hour)
54
Page 55

7 Using the product
In the Start | View menu, the Table command is activated. You now
1
In the calendar, select the day or time period that needs to be
2
In the tree structure of the data range, open the zone that contains the
3
If necessary, deactivate channels via the checkboxes for the display.
1
Click on Edit | Tools | Mark.
2
Select the Date/time option if the readings for a specific time period
3
Determine time period or index range.
4
Click on [OK].
7.2.4.2 Table view
The readings are listed in table form in this view.
have to select the data record that you wish to display.
evaluated.
data to be displayed.
Marking readings
Mark specific readings, for example to perform a statistical computation for part
of the measurement series.
The table view of the selected data is displayed.
The min, max and mean values cannot be determined via a time
period/index range defined in the table.
A dialogue for determining the criteria
is displayed.
need to be marked.
•
The selection lists for determining the time period are enabled.
• Select Index range if the readings in specific table rows need to be
marked.
The selection lists for determining the index range are enabled.
55
Page 56

7 Using the product
1
Click on Edit | Tools | Drop marking.
1
Click on Edit | Tools | Add rows | Minimum, Maximum or Mean
2
Repeat step 1 to insert another value into the table.
1
Click on Edit | Tools | Compress.
2
Determine via the checkboxes whether the respective minimum reading
The dialogue is closed and the corresponding readings in the table are
Dropping marking
Inserting extreme values or mean value into the table
Insert the minimum/maximum reading, along with the mean value over the
whole table, at the end of the table.
Compressing tabular values
Compress the table to definable time intervals to make the table clearer when
there are large amounts of data.
Only the first and the last value are shown for the individual intervals. The other
readings are hidden.
In addition, the minimum, maximum and/or mean value can be shown for the
respective time period.
marked.
The selected readings can be copied and further edited using suitable
software (e.g. with Microsoft
®
Excel®).
The marking of the readings is deleted.
value.
A row is added at the end of the table with the appropriate value over
all the readings.
To remove a value from the table, click on the appropriate entry in the
Add rows menu again.
The dialogue for determining the
options is opened.
(Min), maximum reading (Max) and/or mean value (Mean) needs to be
calculated for the individual time spans.
56
Page 57

3
Enter the time span under Extract and determine its unit. Possible
4
Click on [OK].
1
In the Edit | Search | Maximum menu, click on the curve for which the
1
In the Edit | Tools | Add rows menu, activate the selection that needs
1
Click in the Edit | Tools | Compress menu.
2
Set calculation and extract and confirm with OK.
1
Click in the Edit | Tools | Drop compression menu.
At least one of these values must be activated to enable compression
of the table to be carried out.
settings for the unit:
• sec (second)
• min (minute)
• h (hour)
• d (day).
The dialogue is closed and the table is shown in compressed format.
Determining largest reading
largest reading needs to be determined.
The largest reading is displayed as marked in the table.
Adding Rows
7 Using the product
to be displayed in the extra rows.
The additional rows are displayed in the table.
Compressing
Tabular values are displayed in compressed format. The limits for the
compression range and the additional min, max and mean values are displayed.
A selection window is displayed.
The table display is reduced to the selected min, max and mean
values and to the time period entered.
Dropping compression
Table compression is dropped again.
57
Page 58

7 Using the product
1
In the Edit | Search | Minimum menu, click on the curve for which the
In the Start | View menu, the Monitor command is activated. You now
1
In the calendar, select the day or time period that needs to be
2
In the tree structure of the data range, open the zone that contains the
3
If necessary, deactivate channels via the checkboxes for the display.
In the Start | View menu, the Histogram command is activated. You
1
In the calendar, select the day or time period that needs to be
2
In the tree structure of the data area, open the group that contains the
3
If necessary, deactivate channels via the checkboxes for the display.
Determining the smallest reading
smallest reading needs to be determined.
The table is again displayed with all the individual values.
The smallest reading is displayed as marked in the table.
7.2.4.3 Floorplan view
The readings are shown as number fields in this view. If you take advantage of
the opportunity to insert a wallpaper, e.g. a floor plan of a building, you quickly
achieve a spatial overview of the current ambient conditions.
have to select the data record that you wish to display.
evaluated.
data to be displayed.
The monitor display for the selected data is shown.
7.2.4.4 Histogram view
In this view, the readings are shown as a histogram, meaning the last reading of
a channel is shown as a column
now have to select the data record that you wish to display.
evaluated.
data to be displayed.
The histogram for the selected data is displayed.
58
Page 59

7 Using the product
1
Select the day or time period in the calendar for which the report needs
2
In the Start | View menu
2.1
Choose the Diagram command when the table view is
2.2
Choose the Table command when the diagram view is
3
In the Template | Template menu, select the types of report header.
4
Select the Print command in the File menu.
5
If necessary, change print options and click on [OK].
7.2.4.5 Archiving with automatic reports
A simple and reliable option for archiving your data is automatic reporting.
The reports are created by the software and saved on a daily, weekly or monthly
basis at a specified location on the computer or a server; see also section
7.2.4.9 Configuring automatic reports for this.
The reports are saved as pdf files, so that they can easily be viewed or sent by
email, without it being possible to change the data stock.
7.2.4.6 Generating an evaluation
You can print out measurement series or have reports on the data generated
either automatically by the software at definable intervals or manually for the
required time period.
7.2.4.7 Printing measurement data
Measurement data can be printed in diagram or table form.
to be created.
The data for the day or time period are displayed as a diagram or
table, depending on the setting.
activated, but the diagram view needs to be printed.
activated, but the table view needs to be printed.
Via the File (Testo logo) | Page view command, open a preview of the
report.
Use portrait format for printing a table, but landscape format is
recommended for printing a diagram.
Specify the format via File | Page setup...
The Print dialogue is displayed for selection of the print options.
The report is printed.
59
Page 60

7 Using the product
1
Select Stationary zones main menu.
2
Mark required time period on the calendar.
3
In the Start tab under Create reports, click on One-off report.
User is authorized for this.
1
In the System main menu, in the CFR tab, click the Security settings
2
Select pdf settings.
7.2.4.8 Creating automatic reports
Use the One-off report function to generate 21 CFR 11-compliant printouts of
any period of time.
The pdf report contains:
• CFR-compliant cover sheet with hash code of the pdf report
• Graphic, measurement data table and alarms for the selected zone
The pdf report can be saved as a pdf with a master password.
• Audit trail of the time span specified in the calendar
The master password is only requested when the report is opened with
Adobe Acrobat. No request is made when opening with Adobe Reader.
button.
60
Page 61

7 Using the product
1
[New report]
Adds a new reporting task to the list.
List of the reporting tasks
List of the created reporting tasks.
Zones
Selection list of the group for which
the report needs to be generated.
Format
pdf, csv
Content group box
When the option is enabled, the
- Add a signature line
7.2.4.9 Configuring automatic reports
In the report settings, you can determine how automatic reporting should be
done.
In the navigation area, click on Automatic reports.
The Settings for automatic reports submenu is displayed in the data
window.
Name Explanation
corresponding data sheet is attached
to the report
- Detailed acc. to FDA 21CFR11
- Summary
- Brief
- Custom
- Add a logo picture
61
Page 62

7 Using the product
Report schedule
Specify whether the report is to be
can be set (start date/time, end
[Options]
Specification as to how the report is to
Store as file: The report is
Recipient input field
Input field for one or more email
use “;” as a separator.
have been carried out.
Name Explanation
generated daily, weekly, monthly or
at a custom time.
Daily: The report is generated
daily at 1 a.m.
Weekly: The report is
generated every Sunday at 1
a.m.
Monthly: The report is
generated on the last day of
the month at 1 a.m.
Custom: A future time period
date/time) for which a report is
to be generated on a one-off
basis. The report is generated
after the time period has
elapsed.
be used:
Store as file, Send by email, Store
as file and send by email.
Address book Addresses can be selected from the
Apply settings Saves the report configurations that
62
saved on the PC.
Send by email: The report is
sent to one or more email
addresses.
Store as file and send by
email: The report is saved on
the PC and sent to one or
more email addresses.
addresses of the employees to whom
the report is to be sent. When there
are several email addresses, please
address book.
Page 63

7 Using the product
1
In the navigation area, click on Stationary zones or Mobile zones.
2
In the Start | Edit zones menu, select the New zone command.
3
If required, deactivate a channel which is not needed.
The storage location for the reports was determined during the
installation of the Saveris software.
The path specification is shown under the Determine folder field.
7.2.5 Managing zones
Once you have familiarized yourself with the menus of the Saveris software, you
can turn to creating zones, for example to separate the data loggers according
to location. You could perhaps combine data loggers that are located in
storerooms into one zone and data loggers that are located in refrigerated
rooms into another.
Changing or deleting zones during operation will affect subsequent
generation of pdf reports. As these changes also apply retrospectively,
old zone configuration data are overwritten.
If a pdf report is generated retrospectively from the past, only the most
recent zone configuration is used for reporting. Without a database
backup, complete traceability of the changed or deleted zones cannot
Data loggers are assigned to zones in the startup wizard. They can be changed
later via Start | Edit.
7.2.5.1 Creating zones
be guaranteed.
You can assign a maximum of 4 data loggers to one mobile zone and
monitor a maximum of 2 mobile zones simultaneously in one tour.
The available zones are displayed in the data area.
The New zone dialogue is displayed.
At least one channel must be activated.
In mobile zones, all channels of a probe must be assigned to the same
zone.
63
Page 64

7 Using the product
4
In the Name field, enter the name of the new zone.
5
Confirm entries with [OK].
1
In the navigation area, click on Stationary zones or Mobile zones.
2
In the tree structure of the data area, select the zone that needs to be
3
In the Start | Edit zones menu, select the Change zone command.
4
Click on the checkboxes in front of the channels that are to be added to
5
In the Name field, overwrite the zone name.
6
Confirm the input with [OK].
1
In the navigation area, click on Stationary zones or Mobile zones.
2
In the tree structure, mark the zone that should be deleted.
3
In the Start | Edit zones menu, select the Delete command.
Assign names for the zones that are not longer than 15 characters.
The New zone dialogue is closed and the new zone is listed in the tree
structure in the data area.
7.2.5.2 Changing zones
You can add channels to an existing zone. You can delete channels from a zone
that you no longer require there. You can also change the name of the zone.
The available zones are displayed in the data area.
changed.
The Change zone window opens.
the zone or deactivate them to remove the channel from the zone.
7.2.5.3 Deleting zones
64
The available zones are displayed in the data area.
After confirmation, the zone is deleted.
Page 65

7 Using the product
deleted. A disabled zone is only visible in the time period in which it was
Users or user groups are created in the active directory.
1
In the navigation area click on System.
2
In the System | Security menu, select the Authorizations command.
3
Mark zone for which access needs to be limited.
4
Click on [Search].
5
Mark users or user groups that should be given access to the selected
6
Confirm the input with [OK].
7
Click on [OK].
In the database, the zone is marked as deleted and disabled, but not
active.
7.2.5.4 Assigning zones
You can limit zone access to certain users and user groups. Multiple selection is
also possible.
Zones are visible to all users as standard.
The Authorizations window opens.
The Search window opens where the users or user groups from the
Active Directory are listed.
zone.
The selected users are assigned to the relevant zone in the
Authorizations window.
65
Page 66

7 Using the product
7.2.6 Configuring alarms
Information on the alarm function
• The alarms occurring in the Saveris system are primarily used to notify the
user in good time that problems have occurred which jeopardize the
continuous availability of the data in the database. Generally, action is then
required.
• Alarms indicate a one-off, but possibly also regular, malfunction. The aim
must be to minimize the number of alarms that occur during operation and
eliminate such alarms wherever possible. There may be a maximum of 200
outstanding unacknowledged alarms at any one time. An increasing number
of unacknowledged alarms not only makes troubleshooting in serious cases
more difficult, but also slows the system response during operation.
Alarms are configured in four steps:
1. Setting up Saveris base alarms
The configuration of the system alarms allows you to determine the
conditions under which the base triggers an alarm.
2. Set up alarm groups.
The alarm groups allow you to determine for which probes and under what
conditions an alarm is triggered for system alarms and for channel-related
alarms.
3. Enter recipient.
You must enter the recipients to be able to send alarm messages by SMS or
email.
4. Define rules.
The rules allow you to determine which employee should be notified if an
alarm is triggered in a group and which employees receive a message if the
alarm is not acknowledged.
Since the probes that monitor mobile units are not generally operated
under target conditions (e.g. truck is not cooled during idle periods),
limit values are only deemed to be relevant according to the tour blank.
The Saveris base therefore only outputs system alarms for probes in
mobile zones – violations of limit values are suppressed.
66
Page 67

7.2.6.1 Setting up Saveris base alarms
1
Click on Alarm management in the navigation area.
2
Click on Alarm settings base.
No configuration changes are transferred to the probe/base until you
have exited the Alarm management menu!
You should therefore exit the Alarm management menu after any
changes.
The following submenus are displayed in the data area:
• Alarm settings base
• Alarm settings component
• Alarm settings channel
• Alarm recipients
• Alarm rules
• Comments for acknowledging alarms
The alarm settings for the base are shown in the display area.
7 Using the product
67
Page 68

7 Using the product
Device alarm Saveris Base
Setting options for the Saveris base
power supply fails.
Alarm conditions
Re-trigger confirmed alarms after
a specified duration.
Light signal
Advanced settings
No radio signal (stationary) [min]
No radio signal (mobile) [h]
Apply settings
Saves the alarm settings.
Enable alarm time control
Activates the configured time control.
Alarm time control
Opens a window for configuring the
3
Setting up Saveris base alarm settings.
4
Click on Apply settings.
5
Exit Alarm management menu.
Display Explanation
alarms
No PC connection: no response from
the PC.
Memory almost full: alarm when the
Saveris base memory overflows.
No GSM Network: alarm when there
is no GSM connection.
SMS overflow: alarm when an error
occurs in SMS transmission.
Power failure:
[min]: re-triggers alarms that have
already been acknowledged following
Alarm output Saveris Base Relays
Audible signal
No signal from network components
[min]
alarm when the base
68
Alarm settings are transferred to the instruments.
time control.
Page 69

7.2.6.2 Setting up time control
1
Click on Enable time control.
2
Click on Alarm time control.
3
Click on a time entry with the right mouse button and select Delete.
4
Click on the blank time entry with the right mouse button and select
5
Click on [OK] to confirm the entry.
All alarms across the entire system are paused/activated via time
control.
The Alarm time control button is activated.
An input window with a complete time control system is displayed. The
time control is filled out from Monday to Sunday 0:00 – 24:00 ex-works.
The selected time entry is deleted.
New.
An input window is displayed where you can enter the alarm ON times
(from, to or all-day).
7 Using the product
The input window is closed and the modified times are displayed in the
time control overview.
69
Page 70

7 Using the product
6
Confirm by clicking on [OK].
1
Click on Alarm management in the navigation area.
2
In order to create a second time entry for the same day, repeat step 4
and step 5.
7.2.6.3 Setting up alarm groups
Component alarms
Two time periods can be specified per day.
The input window is closed and the modifications to the time control
are accepted.
No configuration changes are transferred to the Saveris radio data
logger/Saveris base until you have exited the Alarm management
menu!
You should therefore exit the Alarm management menu after any
changes.
The following submenus are displayed in the data area:
• Alarm settings base
• Alarm settings component
• Alarm settings channel
• Alarm recipients
• Alarm rules
• Comments for acknowledging alarms
Click on Alarm settings component.
The alarm settings for data loggers are shown in the display area.
70
Page 71

7 Using the product
Display
Explanation
Insert into new group
Move to…
Move component/channel to another
alarm group.
Remove from group
Removes the component/channel
from the specified alarm group.
Delete this group
Deletes the entire alarm group.
Alarm setting components
List of the available components and
Alarm settings for groups
Enter the group name.
signal.
[Apply settings]
Saves the alarm settings of an alarm
group.
Creates a new alarm group.
System settings System alarms: alarm activation for
their affiliation to the selected alarm
group.
notification when there are connection
problems, LoBat and power failure
Alarm conditions: trigger
acknowledged alarms after [min]
Alarm output Saveris base: settings
for relays, audible signal and light
71
Page 72

7 Using the product
1
Right-click on component, then click on Insert into new group.
2
Overwrite the default names in Group alarm settings.
1
Right-click on component, then click on Move to ....
2
Click on required alarm group.
1
Right-click on component, then click on [Remove from group].
1
Right-click on component, then click on [Delete this group].
1
Click on Alarm management in the navigation area.
Create new group
Move to…
Remove from group
Delete group
A new alarm group is created.
A selection of available alarm groups is displayed.
The component is assigned to the selected alarm group.
The component is removed from the assigned alarm group.
The assigned alarm group is deleted, all components that were
assigned to this group are now without an alarm group.
Channel alarms
No configuration changes are transferred to the Saveris data
logger/Saveris base until you have exited the Alarm management
menu!
You should therefore exit the Alarm management menu after any
changes.
The following submenus are displayed in the data area:
• Alarm settings base
• Alarm settings component
• Alarm settings channel
• Alarm recipients
72
Page 73

7 Using the product
• Alarm rules
2
Click on Alarm settings channel.
the measurement parameter is
• Comments for acknowledging alarms
The alarm settings for Saveris data loggers are shown in the display
area.
Name Description
Insert into new group Creates a new alarm group, with a
distinction between alarm, warning
and trend alarm group.
A trend alarm is used to
monitor temporal changes or
the stability of measurement
parameters.
The change in the
measurement parameter is
determined over four
measurement cycles and
projected onto the change per
hour.
To this end, an alarm is useful
unless the absolute value of
supposed to be within
specified limits, but rapid
changes must be avoided.
73
Page 74

7 Using the product
[Move to]
Move component/channel to another
Remove from group
Removes the component/channel
Delete this group
Deletes the entire alarm group.
Alarm settings channels
List of the available channels and their
Alarm settings for groups
Enter the group name.
limit delay [measurements], upper limit
signal.
[Apply settings]
Saves the alarm settings of an alarm
group.
[Print]
Creates a file containing a summary of
and the Saveris base.
1
Right-click on component, then click on [Insert into new group].
2
Overwrite the default names in Group alarm settings.
1
Right-click on component, then click on [Move to …].
2
Click on required alarm group.
Name Description
alarm group.
from the specified alarm group.
affiliation to the selected alarm group.
System settings Alarm conditions: settings for lower
delay [measurements] and trigger
acknowledged alarms after [min]
Alarm output Saveris base: settings
for relays, audible signal and light
the alarm settings for Saveris probes
Create new group
A new alarm group is created.
Move to…
A selection of available alarm groups is displayed.
The component is assigned to the selected alarm group.
Remove from group
74
Page 75

1
Right-click on component, then click on [Remove from group].
1
Right-click on component, then click on [Delete this group].
1
Click on Alarm management in the navigation area.
2
Click on Alarm recipients.
The component is removed from the assigned alarm group.
Delete group
The assigned alarm group is deleted, all components that were
assigned to this group are now without an alarm group.
7.2.6.4 Creating recipient
No configuration changes are transferred to the Saveris data
logger/Saveris base until you have exited the Alarm management
menu!
You should therefore exit the Alarm management menu after any
changes.
The following submenus are displayed in the data area:
• Alarm settings base
• Alarm settings component
• Alarm settings channel
• Alarm recipients
• Alarm rules
• Comments for acknowledging alarms
7 Using the product
The recipient data are displayed in the display area.
75
Page 76

7 Using the product
[New recipient]
Creates a new entry in the recipient
list.
Recipient list
List of possible recipients.
clicking on the number with the
SMS / email
email.
Input field for SMS function
Number to which the SMS should be
sent.
Input field for email function
Recipient’s email address.
Name Description
The telephone number in the
recipient list comes from
commissioning.
You can replace the number
with a recipient name by
checkboxes
76
right mouse button and
choosing the Rename
command.
Specification as to whether the alarm
message should be sent by SMS or
Page 77

Name Description
Readiness
Overview of the recipient’s availability
[Apply settings]
group.
1
Click on [New recipient].
2
Click on the new entry in the recipient list with the right mouse button
1
Activate the SMS checkbox when the recipient needs to be informed via
2
Enter the corresponding numbers.
1
Activate the Email checkbox when the recipient needs to be informed
times.
Time entries are automatically
rounded up/down to 1/4 hour.
To change the availability
time, you must delete the
existing entry using the
right mouse button and
enter a new availability
time.
Saves the alarm settings of an alarm
Create new recipient
A new entry with the same name is added to the recipient list.
If no recipient was defined with clear text beforehand, the telephone
number is used here for the recipient name as an alternative.
7 Using the product
and change the designation.
Recipient’s mobile phone data (optional)
SMS in the event of an alarm.
The Input field for the telephone number is displayed.
If an alarm chain is to be created from several recipients, the output
targets (SMS or email) of the recipients must not be different within the
Entering recipient’s email address (optional)
respective alarm chain.
via email in the event of an alarm.
The Input field for the email address is displayed.
77
Page 78

7 Using the product
2
Enter the recipient’s email address.
1
Exit "Alarm management" menu.
1
Click on Alarm management in the navigation area.
2
Click on Alarm rules.
If an alarm chain is to be created from several recipients, the output
targets (SMS or email) of the recipients must not be different within the
respective alarm chain.
Transfer alarm settings
Alarm settings are transferred to the instruments.
7.2.6.5 Creating alarm rule
No configuration changes are transferred to the Saveris probe/base
until you have exited the Alarm management menu!
You should therefore exit the Alarm management menu after any
A prerequisite for creation of alarm rules is that the Saveris base alarm settings,
the alarm groups of the Saveris probes and the recipients of the alarm
messages have been entered.
changes.
The following submenus are displayed in the data area:
• Alarm settings base
• Alarm settings component
• Alarm settings channel
• Alarm recipients
• Alarm rules
• Comments for acknowledging alarms
A list of the previously created alarm rules is shown in the display area.
78
Page 79

Group
Group for which the alarm rule
applies.
Recipient
Recipient who is to receive the alarm
message.
Message
Text of the alarm message.
acknowledge the alarm.
To 2nd recipient
alarm.
Forward after
Time period since the last dispatch
3) minutes.
Name Description
7 Using the product
Forward after Time period after which the alarm
message needs to be sent to another
recipient if the first recipient does not
Recipient who is to receive the
forwarded alarm message if the first
recipient does not acknowledge the
after which the alarm message should
be sent to another recipient if the
alarm was not acknowledged.
Recipient 3 receives alarm after
(forwarding time from recipient 1 to 2
+ forwarding time from recipient 2 to
79
Page 80

7 Using the product
To 3rd recipient
Recipient who is to receive the
was not acknowledged.
alarm rule.
messages.
1
Click on [New rule...].
2
Specify group in the With alarm in group selection list for which the
new alarm should apply.
3
Enter the alarm message text in the Message input field.
4
Determine the first recipient who is to receive the alarm message in the
5
Click on [Next >].
Name Description
forwarded alarm message if the alarm
[New rule…] Starts the wizard for creating a new
Preview Shows the configured scheduled
Creating new rule
The wizard for creating a new rule is started.
selection list of the same name.
80
Page 81

7 Using the product
6
Either
6.1
click on [Finish], when the alarm message does not need to be
6.2
Or on the With lack of acknowledgement, forward to
7
In the min field, enter the time period after which the alarm message
8
In the to selection list, specify the recipient who is to receive the alarm
9
Click on [Next >].
The dialogue for the forwarding
function or for finishing the alarm rule
is shown.
forwarded if the first recipient does not acknowledge the alarm
[Finish] is only displayed if no forwarding is needed.
The wizard is ended and the new rule is included in the
list of alarm messages.
checkbox if the alarm message needs to be forwarded to
another recipient.
The min input field for specifying the time period after
which the alarm message needs to be forwarded and
the selection list for determining the next recipient is
displayed.
needs to be forwarded. (Time between the alarm being received by
recipient 1 and it being forwarded to recipient 2).
message.
The output targets (SMS or email) for recipient 1 and recipient 2 must
not be different. For all recipients in an alarm chain, the same output
target (all SMS or all email) must be set, otherwise the alarm chain will
be interrupted.
81
Page 82

7 Using the product
10
Either
10.1
click on [Finish], when the alarm message does not need to be
10.2
Or on the With lack of acknowledgement, forward to
11
In the min field, enter the time period after which the alarm message
12
In the to selection list, specify the recipient who is to receive the alarm
13
Click on [Finish].
14
Exit "Alarm management" menu.
The dialogue for the forwarding
function or for finishing the alarm rule
is shown.
forwarded if the alarm is not acknowledged
checkbox if the alarm message needs to be forwarded to
another recipient.
The wizard is ended and the new rule is included in the
list of alarm messages.
The min input field for specifying the time period after
which the alarm message needs to be forwarded and
the selection list for determining the next recipient is
displayed.
needs to be forwarded. (Time between the alarm being sent to recipient
2 and it being forwarded to recipient 3).
message.
The output targets (SMS or email) for recipient 2 and recipient 3 must
not be different. For all recipients in an alarm chain, the same output
target (all SMS or all email) must be set, otherwise the alarm chain will
be interrupted.
The wizard is ended and the new rule is included in the list of alarm
messages.
Alarm settings are transferred to the instruments.
82
Page 83

7 Using the product
1
Click on Alarm management in the navigation area.
2
Click on Alarm rules.
1
Click on Alarm management in the navigation area.
7.2.6.6 Alarm overview
In the alarm overview you will find a list of the groups with their specific alarm
settings.
The following submenus are displayed in the data area:
• Alarm settings base
• Alarm settings component
• Alarm settings channel
• Alarm recipients
• Alarm rules
• Comments for acknowledging alarms
The defined alarms are shown in the display area.
7.2.6.7 Comments for acknowledging alarms
You can create standardized acknowledgement comments, which are displayed
in the acknowledgement window as a selection list.
The following submenus are displayed in the data area:
• Alarm settings base
• Alarm settings component
• Alarm settings channel
83
Page 84

7 Using the product
• Alarm recipients
2
Click on Comments for acknowledging alarms.
3
[Delete]
• Alarm rules
• Comments for acknowledging alarms
The defined acknowledgement comments are shown in the display
area.
[Add]: Create acknowledgement comment.
[Update]: Edit existing acknowledgement comment.
: Delete existing acknowledgement comment.
7.3 Use of testo Saveris software for
transport monitoring with radio data
7.3.1 General
The following section deals with the relevant functionality of the testo Saveris
software for measurement data monitoring in terms of transport monitoring using
Saveris radio data loggers (“mobile monitoring”), see also section 5.2 How it
works.
84
loggers (“mobile monitoring”)
Page 85

1
In the navigation area, click on Tour management.
2
Select [New tour description].
3
Enter the name of the new tour description.
4
Enter information.
7.3.2 Setting up tours
7.3.2.1 Tour description
The Tour description dialogue is displayed in the data area.
7 Using the product
The name appears in the tour calendar and in the Saveris cockpit unit.
85
Page 86

7 Using the product
5
Exit dialogue.
6
Click [Yes].
This description only relates to tours that are planned for the future. The
1
In the navigation area, click on Tour management.
2
Select [Add tour description].
3
Enter the name of the new tour. The name appears in the tour calendar
Query appears asking whether information should be saved.
The tour description is saved and can be added to a tour during tour
planning. The tour description is transferred to the Saveris cockpit unit
and can be selected there.
The Saveris cockpit unit can manage up to 100 tour descriptions.
7.3.2.2 Planning tours
software is used to create a tour for this. This process is recommended
if a Saveris cockpit unit is not used for tour entry.
The Tour planning dialogue is displayed in the data area.
and in the Saveris cockpit unit.
86
Page 87

4
Select mobile zones.
4.1
If required: add tour description.
5
Select time period during which the tour is to be carried out.
6
Exit dialogue.
7
Click [Apply settings].
1
In the navigation area, click on Mobile zone.
2
Select Tour definition.
3
Define required tour. Via [From tour description] the additional
4
Confirm entries using [Finish].
Query appears asking whether information should be saved.
The tour is saved and is displayed in the tour calendar as a planned
tour.
Tours that have not yet taken place can only be changed in the Tour
management navigation area.
7.3.2.3 Defining tours
This function is used to assign existing measurement data to tours at a
later stage.
7 Using the product
The Define tour window is opened.
information of an existing tour description can be included for this tour.
Tour is saved and displayed in the tour calendar.
87
Page 88

7 Using the product
1
In the navigation area, click on Tour management.
2
Select Tour calendar.
7.3.2.4 Displaying tours
• Selection of the displayed mobile zone
• Adjustable filter options
• Calendar view
• Overview of the tours that have taken place and status of data
transfer to the Saveris base:
o Green: Data transfer complete
o Yellow: Data transfer in progress
o Red: Data transfer failed
• Planned tours are shown in white
• Tours that have taken place are shown in orange. Tour data can be
displayed via the context menu in the Tours navigation area.
88
Page 89

7.3.2.5 Searching for tours
1
In the navigation area, click on Tour management.
2
Select Tour finder.
3
Select or enter required search options.
4
Click [Find].
5
Select required entry from the list of results.
6
Click [Show].
1
In the navigation area, click on Tour management.
2
Select Change tour.
When searching for tours within a time frame, the tour is considered as
a whole. No result is shown if only one part of the tour is within the time
frame specified in the search.
7 Using the product
Results are displayed.
Selected tour data are displayed in the Tour management navigation
area.
7.3.2.6 Changing tours
The Define tour window is opened.
89
Page 90

8 Tips and assistance
3
Make required changes.
4
Click [Next] and [Finish].
The Saveris converter does
The cable connection to the converter is faulty.
the factory settings.
Saveris cockpit unit does not
The power supply to the Saveris cockpit unit
Saveris cockpit unit printout
The power supply to the Saveris cockpit unit
L_CommUp
Error during USB or Ethernet initialization.
- Restart the Saveris base.
Tour is changed.
8 Tips and assistance
8.1 Questions and answers
Question Possible cause / solution
not transfer any data to the
base.
• Remove the power supply and check
whether the Ethernet cable is connected
correctly.
• Reconnect the power supply.
The Saveris converter checks its configuration
and if there is an error, it resets all values to
print.
has been interrupted.
• Restore the power supply to the Saveris
cockpit unit.
• Restart printing.
is terminated.
has been interrupted.
• Restore the power supply to the Saveris
cockpit unit.
• Restart printing.
8.2 Saveris base alarm messages
Alarm message Possible cause / solution
L_CommApp
- Disconnect all links to the Saveris base.
- Reconnect all links.
90
Page 91

Alarm message Possible cause / solution
L_GSM
Error during GSM modem initialization.
- Restart the base.
L_RF2010Server,
Error during radio module initialization.
support team.
L_UIPrio
L_DispDrvUI,
Error loading the UI/display. Reboot the base.
- Restart the Saveris base.
L_MemoryMgmt
Error loading memory management.
- Please contact our support team.
L_AlarmCtrl
L_AlarmCfg
Error loading the alarm controller.
- Please contact our support team.
L_AccelFileSys
L_EventLog
L_GsmStatLog
Error loading a log.
L_RFTest2010
Error testing the radio module.
- Please contact our support team.
L_UppElement
- Please contact our support team.
L_Group
L_TourCard
Error loading the basics for mobile zones.
- Please contact our support team.
8 Tips and assistance
L_GSMMenu
L_RF2010IOL_RF2010MemPool,
L_RF2010StreamRip
L_UDPRF2010
L_FileSysChk
L_FileSys
L_AlarmLog
L_TourLog
L_ErrorLog
- Check the GSM module's rechargeable
battery power.
Option 1
- Check in the startup wizard whether the
extreme SMS gateway is enabled.
- Reboot the Saveris base. If there are
problems, please contact our support team.
- Option 2
- Restart the base.
If the problem persists, please contact our
Error loading the mass storage device.
- Please contact our support team.
- Please contact our support team.
L_BaseConf L_LowElement
Error loading basic functionality.
91
Page 92

8 Tips and assistance
Spare batteries for radio probes (4 x AA alkali
manganese Mignon batteries)
0515 0414
Spare batteries for radio probes for operation below 10°C (Energizer L91 photo lithium)
0515 0572
Spare rechargeable battery for Saveris base, Ethernet
probe and analog coupler
0515 5021
converter, Ethernet probe
VDC (2.5 A)
Mains unit (desktop instrument) 90 to 240 VAC / 24 VDC
(350 mA)
0554 1748
Programming adapter (from mini-DIN to USB) for base,
the radio and Ethernet probes.
0440 6723
Antenna with magnetic foot with 3 m cable for base with
GSM module
0554 0524
Antenna with magnetic foot (quad band) for Saveris
base with GSM module
0554 0525
Alarm module (visual & acoustic), can be connected to
2.4 kHz
0572 9999
Saveris protective housing for protection from high-
radio probes T1/T1D/T2/T2D/Pt/PtD/H4D
0572 0200
Testo fast printer with wireless infrared interface, 1 roll of
readings on Saveris cockpit unit
0554 0549
testo Saveris SBE, including USB cable for connection
of the Saveris base to the computer
0572 0180
of the Saveris base to the computer
Saveris adjustment
0572 0183
cable
ISO temperature calibration certificate; temperature
channel/instrument (suitable for Saveris T1/T2)
0520 0171
8.3 Accessories
Description Order no.
100-200 V DC mains unit; for Saveris base, router,
Mains unit (top-hat rail mounting) 90 to 240 VAC / 24
Ethernet probe, converter and extender for the
configuration of IP addresses and for the adjustment of
alarm relay, Ø 700 x 164 mm, 24 V AC/DC / 320 mA,
steady red light, continuous tone: buzzer approx.
pressure cleaning and impacts, IP 69 K, suitable for
thermal paper and 4 Mignon batteries for printing out
testo Saveris PROF, including USB cable for connection
0554 1096
0554 1749
ID no. 0699 6111/1
0572 0181
Saveris CFR, including PC-base Ethernet connection
probe; calibration points -8°C; 0°C; +40°C; per
92
0572 0182
Page 93

8 Tips and assistance
ISO temperature calibration certificate; temperature
channel/instrument (not suitable for Saveris T1/T2)
0520 0151
DAkkS3 temperature calibration certificate; temperature
channel/instrument
0520 0261
ISO humidity calibration certificate; humidity probe;
per channel/instrument
0520 0076
per channel/instrument
Description Order no.
probe;
calibration points -18°C, 0°C, +60°C; per
probe;
calibration points -20°C, 0°C, +60°C; per
calibration points 11.3% RH and 75.3% RH at +25°C;
DAkkS humidity calibration certificate; humidity probe;
calibration points 11.3% RH and 75.3% RH at +25°C;
0520 0246
3
Successor organization of the DKD (German calibration service)
93
Page 94

Testo SE & Co. KGaA
Testo-Strasse 1
D-79853 Lenzkirch
Germany
Phone: +49 7653 681-0
Fax: +49 7653 681-7699
Email: info@testo.de
www.testo.com
0970 4030 en 14 V04.6-SP1
 Loading...