

Page 1

Software
Comsoft 3
Instruction manual
Page 2

This is a legally binding contract between you, as the end user, and Testo.
Once you or another authorised person opens the sealed CD-ROM packaging, the conditions of this
contract are recognised. If you do not agree with the conditions, return the unopened software package
with all accompanying items, including all written documentation and boxes, to the point from which you
purchased the software and your money will be returned in full.
Concession
This licence authorises you to use a copy of the Testo software, acquired with this licence, on a single
computer on condition that the software is only used on one computer at any one time. If you have acquired
multiple licences for the software you can have so many copies in use as you have licences.The software
is deemed as being “in use” on a computer if it is loaded in a cache i.e. RAM or if it is saved in a permanent
memory e.g. on the hard disk of this computer, with the exception of a copy installed in a network server for
the sole purpose of distribution to other computers which is then deemed as not being “in use”. If the
number of persons using the software exceeds the number of licences acquired you are then required to
provide suitable mechanisms or procedures to ensure that the number of persons using the software
simultaneously does not exceed the number of licences.
Copyright
The software is protected against copying by copyright laws, international contracts and other legal
stipulations. It is forbidden to copy the software, product manuals and other accompanying written
documents on the software. The software should not be licenced, rented or leased. If the software is not
provided with technical protection you can make a single copy of the software solely for security and filing
purposes or you can transmit the software to one hard disk on the condition that the original is kept solely
for security or filing purposes. Reverse engineering, decompilation, disassembly are not permitted. For
every infringement of protective rights you or any authorised person are liable to claims from Testo GmbH
& Co Lenzkirch.
Limited warranty
Testo guarantees for a period of 90 days following the acquisition of the software by the buyer or for a
longer minimum time period if stipulated by the laws in the country of purchase that the software generally
corresponds to the standards defined in the accompanying documentation. Testo specifically does not
guarantee that the software will run without interruptions or errors. If the software does not function
normally in accordance with the accompanying documentation, the purchaser then has the right to return
the software to Testo within the warranty time accompanied by a written description on the malfunction(s).
Testo is only obliged, after a reasonable time period, to make a functioning copy of the software available to
the purchaser or to refund the full purchase price if a copy is unavailable for whatever reason.
Any guarantees in relation to the software, the corresponding manuals and written documentation
exceeding the above limited warranty are not admitted.
Neither Testo nor Testo suppliers are obliged to replace any damage occurring during use of this Testo
product or caused by the inability to use this Testo product even if Testo has been informed of the possibility
of such damage. This exclusion does not apply to damage caused deliberately or through gross negligence
by Testo. Likewise claims supported by inalienable legal stipulations are unaffected.
Copyright © by 2000 Testo AG
M. Windows® und Excel® are the registered trade marks of the Microsoft Corporation.
3
2
Licence Agreement Contents
Preparation ..........................................................................
Defined use..............................................................4
Installation ...............................................................5
1st session – Brief instructions.......................................7
Mouse functions ......................................................7
Toolbars and palettes...............................................8
Toolbars ................................................................11
Toolbars, our recommendation .............................12
Menu layout: Main menu ........................................13
Menu layout: Context menus..................................15
Online help.............................................................19
Example 1 ........................................................................20
Demo file without instrument .................................20
Example 2 ........................................................................29
Testo 400 and humidity probes
Logging measurement sequence...........................29
Testo 400 and humidity probes
Analysing measurement series..............................31
testo 400 and humidity probes
Exporting saved data ............................................32
Example 3 ........................................................................33
testo 400 and humidity probes
Displaying readings................................................33
Example 4 ........................................................................35
testo 175/177: Reading out and exporting
sections..................................................................35
Error messages ...............................................................36
Details/Background.........................................................38
Display ranges .......................................................38
Main menu item: “File” ...........................................40
Main menu item: “Instrument” ................................44
Main menu item: “Edit” ...........................................47
Main menu item: “View”..........................................49
Main menu item: “Insert” ........................................52
Main menu item: “Format” ......................................54
Main menu item: “Tools”.........................................55
Main menu item: “Window”.....................................57
Testo worldwide
Page 3

5
4
Minimum system requirements
• PC with operating system
- Microsoft Windows 95 or better (if compatible)
- Microsoft Windows NT 4, Service pack 4, or better
(if compatible).
- Windows 2000 or better (if compatible).
• CD-Rom drive
• Pentium 100 MHz
• 32 MB RAM
• 15 MB hard disk drive space free
• Free serial interface (COM) or corresponding adapter.
Installation
1. Place CD-ROM in drive
2. The installation menu will start up after a short time. If it
fails to start, click twice on “Setup.EXE” on the CD-ROM.
3. You are asked to enter the licence number (see sticker
on CD-ROM).
Restart may be necessary if it is the first installation.
Note: If the number input is not accepted it may be due
to the following:
- Is the shift button activated?
- Is “Num” in the separate digit pad activated?
- Was l entered instead of 1?
- Was o entered instead of 0?
4. Once confirmed, the installation continues and you are
asked to enter your name and company name.
5. The rest of the procedure is then menu-driven. Please
observe the notes and explanations beside the buttons.
Note: If “ protected” is activated, the “Range of
functions” register is not visible to the user and will not
be available later.
Installation
The Comsoft 3 software is used to save, read and analyse
separate measurement values and measurement series.
The main task of this program is the graphic display of
readings.
Readings are taken using Testo´s measuring instruments
and are transmitted via serial interface to your PC.
Data is read using Comsoft 3 software, which activates the
interfaces and makes all functions available.
There are suitable instrument drivers available for installing
each Testo instrument/system. They are especially adapted
to the range of instrument hardware and their operation.
Measured readings are logged with date and time. Values
are constantly updated during ONLINE measurements.
Defined use
PreparationPreparation
Page 4

7
6
General information on using and installing software
The software surface (appearance, operation philosophy )
is defined in accordance with the Microsoft® Office
Standard. Symbols and menu items are selected analog to
this standard. Therefore, if you are already working with
Office programs (Word®, Excel®, PowerPoint® ...), you will
very quickly become familiar with the surface.
Preparation 1st session – Brief instructions
Installation
Certain menu functions can be activated directly via the
mouse, making the software easy to use.
Some menu functions need only to be clicked on once with
the mouse while others need to be clicked twice.
The following options are available depending on where
you are in the program:
Click left on
menu item: Opens sub-menu or
carries out function
Click left on
symbol button: Carries out function
Click left on
name in archive: Selects
Click twice, left: Selects and opens/activates
Click right: Opens (if available)
Context menu
Mouse functions
Page 5

8
Toolbars and palettes
1st session - Brief instructions
File category
Open file
Save active document
Page view
Print view
Set up new location
Set up new folder
Transmit to instrument
Delete element
Undo last action
Copy in clipboard
Insert contents in clipboard
Set up formula
Connect protocols
Use help
Use situation-related help function
9
Toolbars and palettes
1st session - Brief instructions
Instrument category
Device control
Control measurement
Start online measurement
Stop online measurement
Read out memory
View category
View as diagram
View as table
View as digit box
View as histogram
View as form
View as analog instrument
View as parametric graph
Set layout
Search in archive
Page 6

11
Toolbars
You can activate commands, which are often used, directly
by using the icons in the toolbars.
You can easily move the required toolbar to another
position using the mouse. It will appear horizontal, vertical
or as a separate window (palette) depending on the
position.
You can determine the function of the toolbars in
the “Tools/Customize…” menu.
You can put together new toolbars on the register
available and define
· whether the toolbar should be displayed or not
· whether large or small buttons are to be used
· which icons are to appear in the toolbar
· which special functions are to be in the menus
To change the toolbars, open the “Commands”
register and move the corresponding icon to the required
location in the toolbar. Click at the bottom of the symbol for
more information. To delete icons, simply remove from the
toolbar.
Separation marks can be placed between the icons. Simply
move an icon to the side of the toolbar to remove or insert
the marks.
1st session – Brief instructions
10
Toolbars and palettes
1st session - Brief instructions
Left mouse button selects
Left mouse button shows status information
Left mouse enlarges
Left mouse button shows crosshair
Left mouse button marks area to be included in mean
calculation
Left mouse button shows compensating curve
Left mouse shows difference
Select font
Change background colour in diagram. Also edits
pattern/style
Insert text
Remove text from a view
Full screen
Page 7

13
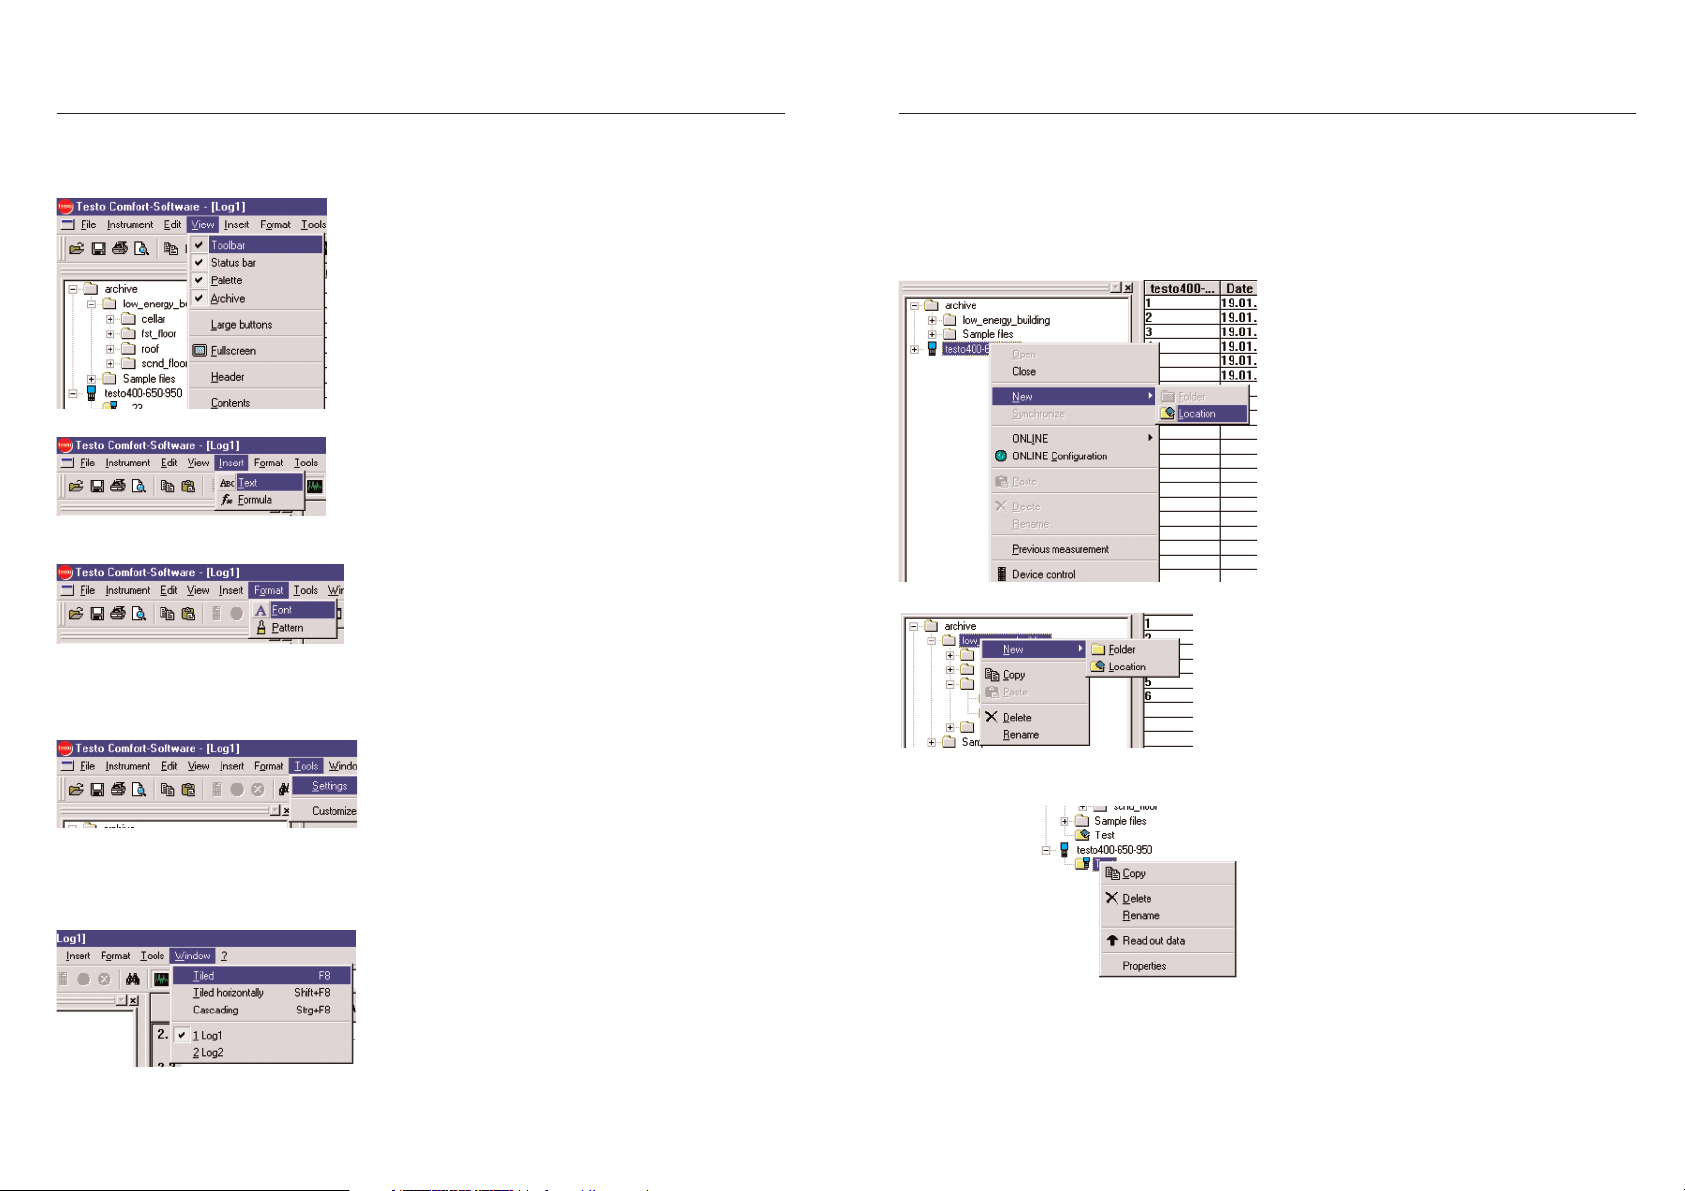
Going from left to right, the main menu
contains the following:
File
All of the functions, which are needed to
open, close, save, delete and print. New
folders and locations are created. The names
of files and folders can be changed and their
properties can be displayed.
The files, which were last used, are available
in a list, which can be opened.
The program can be exited in this menu.
Note
Send
Click on “Send” to send measurements
results by email.
Instrument
Connection to the measuring instruments is
controlled from this menu. New measuring
instruments can be connected and
configured.
Note
Autodetect
A connection to the connected measuring
instrument is set up automatically.
Edit
Measured data can be copied, inserted,
pasted or deleted using these commands
(also self-defined mathematical functions).
Commands can be undone.
Menu layout: Main menu
1st session – Brief instructions
12
Toolbars, our recommendation
1st session – Brief instructions
You can put together your own tools list as required.
The following are some
suggestions:
Easy logger operation
The functions suggested here are used
regularly to program and read out data
loggers and should, therefore, be
placed in the toolbar for direct access.
Main emphasis: Data management
Regular reworking and updating of the
archive tree is necessary in this case.
The tools specified here are particularly
suitable for this purpose.
Main emphasis on printed
documentation
Read out instrument and print as table
or diagram - the range of functions
should be reduced accordingly if no
longer in use.
Page 8
15
This is a special range of commands, selected especially for a certain area. These menus,
which can be selected using the right mouse button, can be opened depending on where
the mouse is placed.
Context: Instrument
New locations can be quickly set up in the
instrument, the current instrument can be
registered and deregistered or all of the
settings in the instrument can also be
undertaken via “Device control” in the PC.
Context: Folders in archive
Click right mouse button on folder and then
you can edit the tree structure:
Set up, delete, rename folder/locations etc.
Context: Folders in instrument
The locations saved in the instrument can
be edited.
Menu layout: Context menus
1st session – Brief instructions
14
View
Included are functions required for graphical
display or screen layout. Toolbars, status bars,
archive or palettes can be made to appear or
disappear, as required.You can choose which
channels of the attached instrument are to be
shown and a protocol header can be defined.
Insert
Text can be added to diagrams. The measured
data can be further offset using a mathematical
function.
Format
The font can be set here. This font is then used for
protocols and to label diagrams.
The appearance of the diagrams and tables can be
improved optically using specific patterns/styles.
Tools
Settings:
Here you have the option of assigning units and
axes.
Customize:
It is also possible to define the range of functions
included in the toolbar.
Window
If you have several files at the same time in the
RAM memory, you have several ways available to
display them.
Menu layout: Main menu
1st session – Brief instructions
Page 9

17
Context: Name of table
The context for the header in the table enables
access to the title and information box, which
can be edited in location. “Measuring protocol”
includes additional data on the protocol itself.
Context menu in diagrams
and other presentation
elements:
“Edit Line” leads to the
settings menu for presenting
the data and editing curves.
Note: This menu can be
reached directly by clicking
twice on the curve.
Menu layout: Context menus
1st session – Brief instructions
16
Context: Location
- Edit contents.
- Change/delete location name
- Edit information on location.
Additional parameters or useful information (if supplied by
instrument), particularly on location, can be entered via
“Properties”. These are also available on site, once they are
transmitted to the instrument.
Context: Work area
In the work area context e.g. table, the data which is
shown or is to be printed can be defined. Channels can
be made to appear or disappear via Edit. Additional
information for printing can be formulated via “Header”.
Menu layout: Context menus
1st session – Brief instructions
Page 10

19
Online help
Online help is available for many functions. This online help
is activated by pressing F1 (function button on the keypad)
or by clicking on “?” in the menu bar.
Press Shift+F1 for direct help.The cursor arrow will then
turn into a question mark with an arrow.You should click on
the area about which you have a question.The online help
for this topic will then be opened.
1st session – Brief instructions
18
Menu layout: Context menus
1st session – Brief instructions
Short menu in digit box
Type of view, pattern/style and content can be
selected.
Page 11

21
You can determine what form the measurement protocol is
to appear in by clicking on one of the following: “Table”,
“Digit box”, “Analog instrument”, “Diagram”, “Histogram” or
“Parametric Graph”.
Diagram
Table
Demo file without instrument
Example 1
20
Demo file without instrument
Measured data has to be opened first before it can be
shown graphically.
The data is located in the memory of Testo instruments or
in a directory on a PC data carrier for data, which has
already been filed (in this case: demo files).
Once the “File” menu item has been selected, the “Open”
menu element is selected.
The “File/Open” dialog mask then appears.
A drive or a folder can be selected in the top
part of the dialog mask. A list with file names
appears in the middle part. The type of files
required is selected in “Files of type”.
The following file types are available:
- *.vi2 Standard files, created by
Comsoft 3
- *.prn Files from the software versions
2.51 and older, saved
as ASCII text file
- *.WKS Files from the software versions
2.51 and older, saved as
WKS
- *.* All files.
- *.viw View files from earlier
software versions are no longer
available.
A file name is picked out and is opened by clicking on it
twice or clicking on the “Open” button.
Example 1
Page 12

23
Demo file without instrument
Example 1
Load the “D1” file from the “Sample
files” folder and then play around with
the toolbar palette in diagram:
Zoom
Zooms sections
The limits for the area to be shown are set by drawing a
rectangle in the diagram window (keep left mouse button
pressed inside window). This function can also be carried
out during an online measurement. The selected section
always shows the current value.
The diagram is returned to its normal size by clicking on
“Actual size”. All of the section zooms are then undone.
“Crosshair”
Select a measurement curve to demonstrate a crosshair,
which follows the curve.The reading number, date, time
and reading are also shown in a window.
“Mark section”
Selective statistics.
You can determine the section in diagrams, which is to be
calculated or saved:
Click on the left of a curve to determine the section to be
calculated, you can move the section limits using the left
mouse button and the complete window using the right
mouse button.
22
Histogram
Digit box
Form
Demo file without instrument
Example 1
Page 13

25
Demo file without instrument
Example 1
If you encounter problems when clicking on a section of the
curve, you have probably clicked on the section of the
curve which is particularly steep. The capturing process
functions better if you select a less steep section. If you are
working with several, which overlap, it is better to work by
zooming sections.
“Display status info”
Provides detailed error description of invalid readings.
“Edit pattern”
Is used in diagrams and parametric graphs to set
background and grid line colour and to change the line type
in the grid.
Used to add/delete Text to/from diagram.
Move text:
Use the left mouse button (drag and drop).
Change font type and colour:
Click with the right mouse button on the text.
Use the “Eraser” mouse function from the palette to delete
the activated diagram text. The activated text now has a
frame around it.
24
Demo file without instrument
Example 1
Notes:
• The section is a time section.
If you have determined a section for a measurement protocol, all of the
calculations apply to this section. Remove the section limits if you wish
to have the whole data sequence calculated.
• Section limits and mean calculation.
Select a measurement curve to determine the time range to which the
following calculations and data saving, if required, are limited. Section
limits, the minimum and maximum of the limited value curve and the
arithmetic mean are all shown in the status bar.
“Compensating curve”
Compensating curves are a help to better assess large amounts of data,
“runaways” are suppressed and the actual curve is imitated using a
theoretical, mathematical function.
Select a measurement curve to show a compensating curve or to switch
it off. The degree of the curve is determined at between 0 to 7 in the
context menu for the curve (right mouse button). 0 degree corresponds
to a pure mean calculation, 1 degree describes the linear trend, a higher
degree helps curves with several minimum and maximum values.
By contrast, if “Mark measurement points” is selected, the measurement
points along the curve are marked. It is only at these points that the
value shown corresponds exactly to the measured value. The curve
between the points comes about through interpolation. If there is a
measurement, the measurement points are interpolated linearly - are
connected by straight lines. The curve can be smoothed if the
measurement is stopped.
Smoothing in this case means that the measurement points are
connected by an interpolating curve. This curve goes through all of the
measurement points. It is, therefore, not a compensating curve. Only the
space between two points is filled by a curve, or a type of spline.
Page 14

27
Edit the time axis:
You can define the resolution, start and finish of
the view window by clicking twice on the time axis.
- “Relative timing” sets the starting time at 00:00,
the time then starts relative to this start mark.
- “Width” defines a fixed frame which can be
moved over the time axis.
- “Position” defines a fixed section.
Optimise the value range/y axis
For an improved overview, it is better to scale the range of
values for the respective curve. Enter the menu by clicking
on the right of the y axis. The grid can be set via the arrow
buttons or can be entered manually.
Demo file without instrument
Example 1
26
Start by clicking on the respective curve twice and first
adapt the line width and pattern, smooth the curve and
mark the measurement points, if required.
Define the required limit values in “Data sequence” and
define how they are to be displayed in “Limit value display”.
You can click away a curve or reactivate a curve by clicking
twice in the diagram section.
Using the right mouse button in the diagram section, you
will find modification possibilities for background and grid
lines in Pattern.
Demo file without instrument
Example 1
Page 15

29
testo 400 and humidity probes
Logging measurement sequence
Example 2
Logging air humidity and temperature values using a testo
400 instrument and connected humidity probes.
For details on application limits, initial operation, error
messages etc. please see the instrument instruction
manual.
Initial operation/Connecting hardware
- Connect humidity probe to instrument
- Connect instrument to PC via cable to RS 232
- Switch on instrument
- Call up software
- Select an instrument from the “Instrument” - “New
device” list: for example “testo400-650-950”
- Follow the assistent until the instrument
symbol appears in Archive.
28
Demo file wihout instrument
Example 1
Printout of table
Printing measurement
data
Measurement data can
be printed in diagram or
table form. A standard
sheet is printed as
follows:
• Protocol header with
title (pre-set with the
file or instrument
name)
- Date,
- Start and finishing
time of a
measurement
(tables only),
- Channel and reading number (tables only)
- Consecutive page number
- Option of entering “Conditions”,
- Other additional comment lines.
Special protocol headers can be selected from a list via the
toolbar.
The printed protocol header contains information on the
whole measurement protocol.
It is recommended to use portrait format when printing
tables, and landscape format when printing diagrams.
Select the format required in the “Page Setup” menu.
Page 16

31
Example 2
testo 400 and humidity probes
Analysing measurement sequence
Reading out instrument
- Open instrument via context menu
- Drag the protocol by mouse into the work area and you go
straight into a table
- Drag the location by mouse into the work area, activates
the readout assistent with automatic search function in
archive.
- Right mouse button on button at top left of table gives
additional infromation on protocol or point of
measurement; comments can be edited.
Context menu in the table
- Content: deactivates columns (insert/remove columns)
- For example, a new dew point column can be generated
via “Insert, Formula”.
View as diagram
Click on curve
- Smooth and mark measuring points
- Define line width and style/pattern
Data sequence
- Upper and lower limit values should have different colours
Click on axis
- Set division
- Select ranges
Context menu in diagrams
- Insert text
- Label header for printout
Protocol
Location
30
testo 400 and humidity probes
Logging measurement sequence
Example 2
Selecting instrument/Device control
- Click, activate context menu via right mouse button, select
“Device control”, then “Delete memory” in Configuration
Instrument
Programming instrument
- “Measuring programs” in register
- PC Start
- Number of values: 200
- Measuring rate: 2 s
- Program, “Start” and cover probe tip with
hand (produces interesting curve)
- Close instrument via context menu.
Page 17

33
Example 3
testo 400 and humidity probes
Displaying readings
Measuring
Measurement is via “Instrument/ONLINE/Start-Stop”. The
measuring rate can be set in advance via
“Instrument/ONLINE Configuration”.
The number of data which can be saved is limited, the
maximum possible duration of the measurement is shown
with the selected setting.
ONLINE data transmission from the measuring instrument
to the measurement protocol can be started, frozen or
continued. The various buttons can be accessed,
depending on the program mode.
Start: starts a new measurement. A new measurement
protocol is set up.
Stop: stops a measurement
Displaying measured data
Measured data can be shown in diagrams or tables.
Several of these views can be shown simultaneously in
windows.
The values shown are updated constantly during
measurements.
Click on the respective symbol in the toolbar.
Saving measurement data
Measurement protocols can be copied as a file
on the hard disk of your computer for editing at
a later stage, printing or to be opened.
32
Example 2
Editing readings
Managing reference data
In diagrams, it is possible to save the data just measured
with the curve of a previous measurement (reference data).
To do this, the reference protocol has to be read from the
file and assigned* to a diagram. Depending on the length of
the reference protocol (relative time scales apply in this
case...), this reference data is visible in addition to the data
from the current measurement, provided it is also shown in
the diagram.
*) determines which view is assigned which curve. Values
can be added to or exchanged in a diagram, table or scale.
Depending on the quality of the view
• 8 measurement sequences from different protocols can
be shown in diagrams
• All of the measurement sequences of a protocol are
shown in tables
Exporting to other programs
for further editing
Open the program parallel to Comsoft 3 to transmit data
e.g. in MS EXCEL®. Drag data from the instrument via
drag&drop over the EXCEL® button to the footnote in the
EXCEL® worksheet.
If a location is dragged to the button, all of the connected
protocols are transmitted to an EXCEL worksheet.
Data can also be transmitted to other programs which
support this function.
You can also use Copy/Paste as an alternative to
drag&drop.
testo 400 and humidity probes
Exporting saved data
Page 18

35
34
Example 3
Last measurement
If data is lost, you can use this method to restore data from
the last measurement. The data comes from a backup file,
which is only updated every 30 seconds. In some cases,
the last measurement data could be missing.
testo 400 and humidity probes
Displaying readings
testo 175/177: Reading out and exporting
sections
Example 4
Consult the Data logger Instruction manual to find out how
to set up a connection between data logger and software
and how to program the data logger.
Place a logger, which has values saved, in the desk-top
holder which is connected to an interface.
The connection is set up by clicking twice on instrument in
the archive. The log saved in the instrument appears under
instrument.
A context menu will appear by clicking right on the log icon.
Select “Reading out sections ...”.
The “Reading out sections” window opens. Select the value
range which you want to show: “Date/Time”, “Lines” or
“From time mark”. The time mark is an intermediate mark
which can be set in the data logger (refer to the Data logger
Instruction manual).
The selected values are shown.
Select “Copy” in the toolbar.
Open Microsoft Excel and select “Edit” > “Paste”.
The readings are accepted into the Excel table.
Page 19

37
36
Error messages
Rename the location/folder and do not use these
characters.
Different names should be used when setting up new
instruments. The same names should not be used for
different instruments.
- You are trying to connect protocols using invalid data.
Overlapping time ranges cannot always be put together in
a common protocol.
Invalid name:
: !,?,*,:,\ cannot be used
in location and folder
names.
An instrument setting
with this name is already
available:
Please select a new
name.
The time ranges overlap
• Check if instrument is switched on.
• Check connection cable.
This message appears if the PC program cannot
communicate with the connected measuring instrument or
if the measuring instrument does not respond.
- Is the instrument switched on?
- Has the instrument sufficient power?
- Is the connection cable connected?
- Is it the correct connection cable?
- Correct COM Port connection?
- You are trying to get an online measurement from an
instrument to which a probe is not connected.
- Connect the corresponding probes.
- Not all of the input variables for the function “...”
are contained in the measurement protocol. You have
selected a pre-defined function, which needs more or
other parameters than those included in the measurement
protocol e.g. you want to calculate the dew point, but only
the temperature is available, the humidity parameter is
missing.
The program does not allow you to simply delete full
folders. First delete the data or locations in the folder in
order to be able to delete the empty folders or delete the
folder in Windows Explorer.
- You want to delete a file, which is still open for editing.
Open files cannot be deleted.
- Close the file.
Error messages
Instrument is not
responding ...:
Your instrument has
indicated that probes are
not working
Measuring impossible.
The folder is not empty.
Not possible to delete:
Not possible to delete
protocol:
Close and delete the file.
Page 20

39
38
A folder is represented by the symbol for
A location is represented by the symbol for
A measurement protocol is represented by the symbol for
The measuring instruments which follow are then
represented by different symbols.The symbol changes if an
instrument has been opened successfully.
Work area
Your data is shown in this area.
If you copy your data from the archive to the work area, the
data will be shown.You can decide which type of display to
take.
It is possible to change the view, if so
required. Simply click on the
corresponding symbol in the toolbar.
Once you have displayed a
measurement in the work area, you
can call up a menu, in which further
settings can be carried out, by clicking
with the right mouse button in the
display:
The exact appearance of this menu
depends on the view selected.
Details/Background
Display ranges
folder
location
protocol
Testo Comfort software has all the functions needed to
control and configure Testo measuring instruments, to
transmit data to your PC and to edit it. This Chapter
describes all the commands necessary.
Testo Comfort-Software is divided into two main parts: the
archive and the work area.
Archive
Your measuring instruments and measurement data
are managed in this area.
All of the measuring instruments are inactive when the
program starts. If you want to activate a measuring
instrument, which is connected, click twice on the
symbol for the measuring instrument. Connection to
the measuring instrument is set up and the symbol for
the instrument changes.
Alternatively, you can click on the symbol for the
instrument with the right mouse button and you will
then receive a context sensitive menu from which to
select. Select “Open”, to activate the required
measuring instrument. The measuring instrument has
to be connected and switched to the correct port.
Locations and directories can be set up in the archive;
familiar to you from Windows Explorer®. You can set up,
copy, delete etc. sub-directories by clicking the right mouse
button on a directory or a location.
If there are saved measurements in the measuring
instrument and these are shown below the measuring
instrument, you can drag and drop the data from the
measuring instrument to a folder in the archive.You can
copy several items by keeping the Control button pressed.
You can also copy the data (from the measuring instrument
or archive) into the work area for display purposes. Mark
the required data with the mouse and drag it into the work
area.
Details/Background
Display ranges
Page 21

41
40
with this or other programs at a later stage, you should
save the data in a file.
Print Preview
The view will be printed exactly as it appears on the screen.
Printing
Measured data can be printed in diagram or table form. A
sheet is printed containing the following elements:
1. Protocol header with title (pre-set with file or instrument
names), date, start or finishing time of a measurement
(tables only), channel and reading number (tables only),
current page number, “Conditions” line and additional
comment lines.
2. Measured data in diagram or table form.
When printed, the protocol header contains
information on the complete measurement protocol.
It is recommended to use portrait format when
printing tables and landscape format when printing
diagrams.
Set the format with “Page Setup”.
Main menu item: “File”
Details/Background
Main menu item: “File”
File/Open
The data of a measurement protocol can be read in. For
example, you can save the current measurement as
reference data or display later, as often as required, for
checking purposes.
Measurement data files have the file name extension “prn”
or “vi2”. Only files which were set up using this version, a
previous version, or the Testo PC adapter software are
accepted! “wks” files can also be read in.
Measurement protocols contain
1. per data block:
A protocol header: The units of the measured
parameters and additional information from the
measuring instrument are located here, depending on
the structure of the measured data.
2. many data items within a data block consisting of:
Time mark: Date and time of respective measurement
Readings: From all the connected channels
File/Save
Measurement protocol data is saved as the name (and
type) displayed in the top line, using this function. If it is
newly created data, which does not yet possess a name, it
is necessary to select one. In this case, the type of protocol
is “vi2” and is marked by the symbol .
File/Save As
Measurement protocol data is saved in a file on the hard
disk of your computer. Data is saved in the RAM memory of
your computer during the measurement. This is deleted
once you exit the program. If you wish to create protocols
with stable values or you wish to analyse, print the data etc.
Details/Background
Page 22

43
42
Opening the files last used
The files last used can be opened here. The required file is
opened by clicking on the respective file name. However, if
you have already deleted or moved this file to another
location, you will, of course, not be able to open it and you
will receive a message.
Setting up a new location
You can assign as many locations as required within
archive, which can then be managed and structured in one
of the tree structures familiar from Windows Explorer®.The
location or also the location name is used to assign
measurement data (reading, unit, time) a name relevant to
a specific location or other attributes.
Preparing the measurement
It is recommended to set up a fixed
structure in archive for comprehensive
measurements at many different
locations e.g. when measuring the
climate data of a whole house.
These locations can then be
transmitted to the testo 400 instrument
with additional information such as
required value, channel dimensions
etc., if so required.
The location names are in the display on site. Selection is
possible via “up/down, OK” or barcode pen. Saved data is
then coupled with a location name until it is filed in the PC
archive.
Main menu item: “File”
Details/Background
Main menu item: “File”
Details/Background
Example of printout: diagram
Page 23

45
44
Device control
This menu item is used to call up the configuration page of
the selected instrument. These are adapted to the
corresponding instruments and make available the
respective setting options on offer.
Main menu item: “Instrument”
Details/Background
testo 400
testo 445 testostor 171
Main menu item: “Instrument”
New device
The assistent for setting up the instrument
supports you when adding additional
measuring instruments to your configuration.
You will get to the next page via “Continue”
and to the previous page via “Back”.
The instrument, which is to be set up, should
be connected to the computer and switched
on, since the New device setup wizard
checks the connection to the measuring
instrument once setup is complete.
1. A list of instruments appears for you to
select. Select the instrument which you
have just connected.
2. The next step is to select the interface to
which the instrument is connected. It is
only when you have selected an interface
that you can leave this page.
3. You can now assign your newly setup
instrument a name, under which it should
appear in the Comfort software. Make sure
that you choose a name which is not
already being used for another instrument.
The name of the measuring instrument is
shown as standard.
4. An attempt is made to set up a connection
to the instrument.
Details/Background
Page 24

47
46
Main menu item: “Edit”
Undo
Undoing the last action
Use this menu item to undo the last action.
Copy
Diagrams, tables or sections of the tables can be copied
into the WINDOWS clipboard which are then available in
other application programs in the PASTE menu item. In this
way, you can get a graph or values from another table into
another program.You can also copy the data within Comfort
software in the same way.
Note:
To prepare the picture of a graph for subsequent printing
using a different program, please first select the line and
background colour or patterns/styles which can be printed.
Paste
Measurement sequences, locations or directories which
were copied from the archive to the clipboard can be
pasted in the required point.
Paste into a new file
The files copied in the WINDOWS clipboard are pasted into
a newly opened file.
Details/Background
Online
One of the following two elements appears
in this menu item, once you have opened an
instrument:
Start
Start the online measurement with this menu
item/icon. Data is shown automatically in the
work area.
Stop
You can hold the current online
measurement with this menu item/icon.You
can now also save the protocol from the
work area on your hard disk.
ONLINE Configuration
The measuring rate for online measurement
is set here. The maximum number of
measurements is calculated from this
measuring rate. The minimum adjustable
measuring rate depends on the instrument
and is checked accordingly.
The data is buffered, at regular intervals, in a
temporary file on the hard disk.
Measurement finishes automatically once
the maximum measurement time has been
reached.
Details/Background
Main menu item: “Instrument”
Page 25

49
48
Main menu item: “View”
All of the functions pertaining to screen layout and graphic
design are located here. The graphical presentation of
readings is the main task of this program. Readings can be
shown in diagrams and tables, for example. Several such
views can be shown simultaneously in a window. The
values shown are constantly updated during measurement.
The following is a list of the functions included in this menu:
Toolbar
Switches functions, which appear in “Tools, Customize”, on
or off, as required. In this way, you have more space on
your screen to show data.
Palette
The palette, used to edit diagrams, is switched on or off as
required.
Status bar
The bottom window line is switched on or off. Information,
statuses and notes normally appear at this point.
Details/Backgrounds
Main menu item: “Edit”
Details/Background
Formula
A complete pre-defined formula can be edited or redefined
using this command.
Delete
Deletes all the formulated functions and contents for this
measurement data.
Page 26

51
50
Details/Background
Contents
Individual channels can be activated or deactivated in the
protocol shown.
Main menu item: “View”
Archive
The archive and registered instruments are activated or
deactivated.
Fullscreen
Enlarges the presentation area to screen size.
Header
Use to fill header of current diagram/table.The appearance
of the protocol header depends on the chosen layout.
Main menu item: “View”
Details/Background
Page 27

53
52
Main menu item: “Insert”
Details/Background
Notes
The decimal point is as follows: 10.50. Values on a
parameter list are separated by a comma e.g.: td (K2,K1).
Syntax
Permitted digits/symbol sequence for a formula and an
arithmetical printout.
Symbols
Numerical constants e.g.: 3.14
Channel references: K<Index> e.g.: K1
Mathematical operators: +, -, *, /, ^ for exponents
Mathematical functions: sqrt(<Printout>)
Trigonometric functions: sin(<Printout>), cos(<Printout>)
Gradient operator “e.g.: K2” to determine the timed
derivation of the parameter measured in channel 2
Case differentiation: if <Condition> then <Printout> else
<Printout>
Main menu item: “Insert”
Text
Text can be added to diagrams.
The text entered in the text box can be moved (hold
right mouse button and drag) to any point on the
diagram area.
If you click twice on the right mouse button when the
text box is activated, the font attributes can be
changed.
The “Eraser” palette symbol deletes a selected text
box from the screen.
Formula
If there are several channels in a measurement protocol
e.g. temperature, humidity, they can be offset. The result is
a new value sequence which can be displayed and edited.
Formulae
You can subject the measured data to
individual calculation by inputting formulae. For
example, the formula “(K<Index>-32)*5/9”
converts a temperature value with “Degree
Fahrenheit” to “Degree Celsius”. Formulae can
be applied to the data sequences of individual
protocols.
Details/Background
Page 28

55
54
Main menu item: “Tools”
Settings
The Settings menu contains the following
elements:
• Diagrams:
Curves: Standard allocation of colour, width
and style to the eight curves shown in a
diagram.
In diagrams and parametric graphs: sets
background and grid colour, line type in
grid.
• Color code: Tick this box to enable the
allocation of the diagram line and histogram
bar to the parameter.The axis in diagrams
is labelled with a colour associated with a
parameter. Histogram bars are coloured
individually within the limit values.
• Common axes: Tick this box to show more
than three different parameters together in
one diagram. Use UP/DOWN to select the
parameters which are to be assigned to a
common variable axis.
Details/Background
Main menu item: “Format”
This menu item contains the following entries:
Font
You can set the fonts to be used here. This font is then used
for protocols and to label diagrams.
Pattern
Used to set units, common axes, background colour and
limit value colours.
Details/Background
Page 29

57
56
Main menu item: “Window”
Window
The following sub-menu items can be selected:
Tiled
Tiled horizontally
Cascading
The names of all the open measurement protocols are
shown. Is ticked when activated (is in foreground)
Details/Background
Customizing
It is possible to influence the appearance of
the Comfort software with this menu item.You
can set the following:
• Display/Not display toolbar
• Use large or small symbols
• Which symbols are to appear in the toolbar
Open the register to change the toolbar
shown and move the corresponding symbol to
the required location. Click on the bottom of
the symbol for more information.
Main menu item: “Tools”
Details/Background
Page 30

Testo worldwide
Testo worldwide
ARGENTINA
Testo Argentina S.A.
C1440ACR - Buenos Aires
Tel. (11) 46 83 - 50 50
Fax (11) 46 83 - 50 50
testo@infovia.com.ar
ASIA
Testo (Asia) Ltd.
Shatin, N. T., Hong Kong
Tel. (2) 26 36 38 00
Fax (2) 26 47 23 39
testo@testo.com.hk
AUSTRALIA
Testo Pty. Ltd.
Bayswater, Victoria 3153
Tel. (3) 97 20 00 11
Fax (3) 97 20 00 22
info@testo.com.au
AUSTRIA
Testo Ges. mbH
1170 Wien
Tel. (1) 4 86 26 11- 0
Fax (1) 4 86 26 11 20
info@testo.at
BELGIUM / LUXEMBURG
S. A. Testo N. V.
1741 Ternat
Tel. (2) 5 82 03 61
Fax (2) 5 82 62 13
info@testo.be
BOLIVIA
T.E.C.
Cochabamba
Tel. (4) 4 40 09 17
Fax (4) 4 28 60 02
tec@supernet.com.bo
BOSNIA-HERZIGOWINA
Tehnounion Sarajevo
Sarajevo
Tel. (33) 20 59 44
Fax (33) 44 40 00
BRAZIL
Testo do Brazil
13028-015 Campinas - SP
Tel. (19) 37 31 - 58 00
Fax (19) 37 31 - 58 19
testo@testo.com.br
BULGARIA
Global Test OOD
1408 Sofia
Tel. (2) 9 53 07 96,
Fax (2) 9 52 51 95
glbl_tst@sps.bg
CHILE
ANWO S.A.
Santiago
Tel. (2) 7 31 00 00
Fax (2) 2 73 04 04
instrumentos@anwo.cl
CHINA
Testo (Far East) Ltd.
Shanghai 200031
Tel. (21) 54 56 - 64 70
Fax (21) 54 56 - 14 70
testo@guomai.sh.cn
CIS
Global Export GmbH
105 023 Moscow
Tel. (0 95) 3 60 53 68
Fax (0 95) 3 60 53 68
global_export@aport2000.ru
COLOMBIA
Arotec Colombiana S. A.
Bogota D. E.
Tel. (1) 2 88 77 99
Fax (1) 2 85 36 04
mantenimiento@arotec.net
COSTA RICA
Representaciones
Corelsa S. A.
Santo Domingo de Heredia
Tel. 2 44 25 50
Fax 2 44 30 90
corelsa@racsa.co.cr
CROATIA
"H.I.P." Zagreb d.o.o.
10090 Zagreb
Tel. (1) 3 73 40 07
Fax (1) 3 73 40 44
hip@inet.hr
CYPRUS
Deksa Ltd.
Nicosia
Tel. (2) 2 45 55 55
Fax (2) 49 70 59
deksa@cytanet.com.cy
CZECH REPUBLIC
Testo s.r.o.
158 00 Praha 5
Tel. (2) 57 29 02 05
Fax (2) 57 29 04 10
info@testo.cz
DENMARK
Buhl & Bonsoe A/S
2830 Virum
Tel. 45 95 04 10
Fax 45 95 04 12
inf@buhl-bonsoe.dk
EASTERN EUROPE
Testo Osteuropa GmbH
79850 Lenzkirch
Tel. (0 76 53) 6 81 - 141
Fax. (0 76 53) 6 81 - 102
pmies@testo.de
EGYPT
Future Plants Contractors
Heliopolis 11361, Cairo
Tel. (2) 4 18 67 79
Fax (2) 4 18 95 04
future98@intouch.com
EL SALVADOR
Eco Control S.A de C.V.
San Salvador
Tel. 2 60 66 01
Fax 2 60 66 02
eco.control@saltel.net
FINLAND
Humitec Oy
00410 Helsinki
Tel. (9) 5 30 84 00
Fax (9) 53 08 40 99
testo@humitec.fi
FRANCE
testo Sàrl
57602 Forbach
Tel. 3 87 29 29 00
Fax 3 87 87 40 79
info@testo.fr
GREECE
Sigma Hellas Ltd.
18536 Piraeus
Tel. (10) 4 18 01 67
Fax (10) 4 51 90 20
sigmahellas@hol.gr
GREAT BRITAIN
Testo Ltd.
Alton, Hampshire GU34 2QJ
Tel. (14 20) 54 44 33
Fax (14 20) 54 44 34
info@testo.co.uk
HONG KONG
Testo Far East Ltd.
Shatin, N. T., Hong Kong
Tel. (2) 26 36 38 00
Fax (2) 26 47 23 39
testo@testo.com.hk
HUNGARY
Testo Kft.
1139 Budapest
Tel. 237 17 47
Fax 237 17 48
testo@testo.hu
ICELAND
Rafn Jensson, Mechanical
Engineers ehf
110 Reykjavik
Tel. 5 67 80 30
Fax 5 67 80 15
rj@rj.is
INDIA
Siskin Instruments Co. (P) Ltd.
Bangalore 560 054
Tel. (80) 3 60 25 60
Fax (80) 3 60 36 79
siskin@eth.net
IRAN
Mehr Kanaz Sanat Co.
Tehran
Tel. (21) 2 26 26 89
Fax (21) 2 22 37 77
info@mehr-kanaz.com
ISRAEL
Manoraz Ltd.
Azur 58001
Tel. (3) 5 59 33 99
Fax (3) 5 58 44 95
david@manoraz.com
ITALY
Testo S.p.A.
20019 Settimo Milanese (Mi)
Tel. (02) 3 35 19 - 1
Fax (02) 3 35 19 - 200
info@testo.it
JAPAN
Testo K.K.
Yokohama 222-0033
Tel. (45) 4 76 22 88
Fax (45) 4 76 22 77
info@testo.co.jp
JORDAN
Al-Masar Technique Est.
Sahab 115-12
Tel. (6) 4 02 95 22
Fax (6) 4 02 35 64
masar@nets.com.jo
KOREA (Republic of)
Testo (Korea) Ltd.
Seoul 150-102
Tel. (2) 6 72 72 00
Fax (2) 6 79 98 53
testo@testo.co.kr
MALTA
Technoline Ltd.
Gzira GZR 06
Tel. (21) 34 23 66
Fax (21) 34 39 52
admin@technoline-mt.com
MACEDONIA
Pharmachem Skopje
1060 Skopje
Tel. (2) 33 11 93
Fax (2) 33 14 34
farmahem@mt.net.mk
MAROC
A.F.M.I.L. SARL
Belevedere-Casablanca
Tel. (22) 24 01 84
Fax (22) 24 01 87
Belha3@caramail.com
MEXICO
Grupo de Instrumentación y
Medición Industrial de México,
S.A. de C.V.
08920 Mexico, D.F.
Tel. (55) 56 34 04 02
Fax (55) 56 33 04 01
scc@gimin.com
NETHERLANDS
Testo B.V.
1314 BH Almere-Stad
Tel. (36) 5 48 70 00
Fax (36) 5 48 70 09
info@testo.nl
NEW ZEALAND
Eurotec Instruments Ltd.
Auckland
Tel. (9) 5 79 19 90
Fax (9) 5 25 33 34
cfarmer@eurotec.co.nz
NICARAGUA
Adolfo Gröber & Cía Ltda.
Managua
Tel. 2 66 51 36
Fax 2 66 51 39
a.grober@cablenet.com.ni
NORWAY
Max Sievert A/S
0134 Oslo
Tel. (22) 17 30 85
Fax (22) 17 25 11
firmapost@maxsievert.no
PERU
JJL Asociados S.A.
Lima 17
Tel. (1) 2 61 17 52
Fax (1) 2 61 46 07
jjlasociados@hotmail.com
PHILIPPINES
Keystone Industrial
Trading Corporation
Pasay City 1300,
Tel. (2) 8 31 95 71
Fax (2) 8 31 40 13
keystone@globenet.com.ph
POLAND
Testo Sp. z.o.o.
02-362 Warszawa
Tel. (22) 8 63 74 22
Fax (22) 8 63 74 15
testo@testo.com.pl
PORTUGAL
Testo Lda.
3800-559 Cacia
Tel. 9 67 60 45 34
Fax 2 34 08 37 08
testo@netvisao.pt
REP. OF SOUTH AFRICA
Unitemp
Landsdowne, Cape Town, 7779
Tel. (21) 7 62 89 95
Fax (21) 7 62 89 96
info@unitemp.com
ROMANIA
Test Line SRL
72217 Bucharest
Tel. (21) 6 87 34 62
Fax (21) 2 42 68 24
testline@customers.digiro.net
SINGAPORE / MALAYSIA /
INDONESIA
Futron Electronics PTE LTD
Singapore 329 714
Tel. (65) 62 50 24 56
Fax (65) 62 50 65 92
futron@cyberway.com.sg
SLOVAKIA
K - Test s.r.o.
042 60 Kosice
Tel. (1) 55 625 36 33
Fax (1) 55 625 36 33
ktest@kbc.sk
SLOVENIA
Tehnounion D.D.
1000 Ljubljana
Tel. (1) 5 13 50 88
Fax (1) 5 13 52 96
matjaz.ponikvar@tehnounion.si
SPAIN
Instrumentos Testo S. A.
08348 Cabrils
Tel. (93) 753 95 20
Fax (93) 753 95 26
info@testo.es
SWEDEN
Nordtec Instrument
40241 Göteborg
Tel. (31) 704 10 70
Fax (31) 12 50 42
nordtec@nordtec.se
SWITZERLAND
Testo AG
8604 Volketswil
Tel. (1) 9 08 40 50
Fax (1) 9 08 40 51
info@testo.ch
SYRIA
Medical Business Center
Damascus
Tel. (11) 2 32 23 01
Fax (11) 2 31 75 55
bahah@net.sy
TAIWAN, R.O.C.
Hot Instruments Co. Ltd.
Chungho City
Tel. (2) 89 23 23 18
Fax (2) 89 23 23 17
info@testotaiwan.com
THAILAND
Entech Associate Co. Ltd.
Bangkok 10210
Tel. (2) 9 54 54 99
Fax (2) 9 54 54 95
info@entech.co.th
TUNISIA
Starepr
Immeuble Mouradi (Touta)
2000 Le Bardo
Tel. (71) 50 92 86
Fax (1) 58 49 20
afri.sta@gnet.tn
TURKEY
Testo Elektronik ve Test Ölcüm
Cihazlari Dis Ticaret Ltd. STi
80280 Esentepe-Istanbul
Tel. (212) 2 75 77 99
Fax (212) 2 72 06 13
info@tetrainc.com.tr
UNITED ARAB EMIATES
Enviro engineering
General Trading
Dubai
Tel. (14) 2 27 70 20
Fax (14) 2 23 36 83
envireng@emirates.net.ae
USA
Testo Inc.
Flanders, NJ. 07836
Tel. (973) 2 52 17 20
Fax (973) 2 52 17 29
info@testo.com
VENEZUELA
G & M International Service,
C. A.
San Antonio de los Altos,
Edo.Miranda
Tel. (2) 3 72 77 70
Fax (245) 5 71 67 74
gminter@cantv.net
VIETNAM
MTC
Measuring and Testing
Equipment Company Ltd.
Hanoi
Tel. (4) 7 33 36 36
Fax (4) 7 33 21 03
mtc-hn@hn.vnn.vn
_________________________
Stand: 01.08.2002
Stets aktualisierte Adressdaten
unserer Töchter und LandesVertriebspartner finden Sie im
Internet unter: www.testo.com
01.08.2002
The most up-to-date address
details of our subsidiaries and
agencies can be found in Internet
at: www.testo.com
Page 31

0971.0425/T/hd/PC_qxd/08.02
Testo AG
Postfach 11 40, D-79849 Lenzkirch
Testo-Straße 1, D-79853 Lenzkirch
Tel. (0 76 53) 6 81 - 0
Fax (0 76 53) 6 81 - 1 00
E-Mail: info@testo.de
http://www.testo.de
 Loading...