

Terraplus KT-10 v2, KT-10 v2 Plus, KT-10 v2 C, KT-10 v2 Cx, KT-10 v2 S/C User Manual
...
KT-10 v2
Magnetic Susceptibility, Conductivity
and Combined Magnetic Susceptibility / Conductivity Meter
with
User’s Guide
Ver. 2.1
Phone: (905) 764-5505
Fax: (905) 764-8093
Web: http://www.terrapl
us.ca

KT-10 v2
Congratulations on your purchase of a KT-10 v2 (version 2) meter! Please
read through this manual to familiarize yourself with your new instrument.
The KT-10 v2 (version 2) is available in a variety of different model
configurations: KT-10 v2, KT-10 v2 Plus, KT-10 v2 C, KT-10 v2 Cx, KT-
10 v2 S/C, KT-10 v2 Plus S/C, or KT-10 v2 Plus S/Cx. All of these models
are available with either a circular or rectangular coil. The basic KT-10 v2
can also be upgraded to include extended magnetic susceptibility,
conductivity and/or extended conductivity measurements. All upgrades can
be performed via the internet. Please contact Terraplus’ Sales Department
at sales@terraplus.ca for further information.
This User’s guide describes the operation of the met
er as a combined
magnetic susceptibility/conductivity meter, a magnetic susceptibility meter,
or a conductivity meter.
The illustrations contained within this manual are of the KT-10 S/C – a
combined Magnetic Susceptibility/Conductivity Meter.
2

Table of Contents
Chapter 1: Introduction
1.1 General Information Page 7
1.2 Operational Theory Page 7
1.2.1 T
1.2.2 Operating Principles Page 8
2.1 Specifications Page 9
2.2 Features Page 10
2.3 Layout Page 13
2.4 Controls Page 14
2.5 Menus Page 15
2.6 Icons Page 16
3.1 Battery Installation Page 17
3.2 Power Page 18
heory Page 7
Chapter 2: The KT-10 v2
Chapter 3: Operating the KT-10 v2
3.2.1 Power On Page 18
3.2.2 Power Off Page 18
3.3 Setup Menu Page 19
3.4 Measure Page 25
3.4.1 Taking a reading Page 25
3.4.2 Storing a reading Page 27
3.4.3 Measurement Sub Menu Page 29
3.4.4 Measure Flow Chart Page 30
3.4.5 Measure Sequence Page 31
3

3.5 Scanner Page 32
3.5.1 Take a reading Page 32
3.5.2 Store a Reading Page 34
3.5.3 Measurement Sub Menu Page 35
3.5.4 Scanner Flow Chart Page 37
3.5.5 Scanner Sequence Page 38
3.6 Borehole Measure mode Page 39
3.6.1 Borehole Configuration Page 39
3.6.2 Scanner setup Wizard Page 41
3.6.3 Scanner measurement Page 43
3.6.4 Discrete mode setup Wizard Page 46
3.7 Voice Recorder Page 49
3.8 PIN Installation Page 50
Chapter 4: Software
4.1 GeoView Page 53
4.1.1 Installation Page 53
4.1.2 GeoView Calendar Interface Page 60
4.1.3 GeoView Data Interface Page 66
4.1.4 Data Download Page 67
4.1.5 Data Export Page 69
4.1.6 Borehole Mode data Display Page 75
4.1.7 Device Settings Page 76
4.1.8 Firmware Upgrade Page 78
3.6.5 Discrete mode measurement Page 47
4.2 Console Page 81
5.1
PC Connections Page 87
4
Chapter 5: Bluetooth Connections

5.2 GeoVision – Android app Page 91
5.2.1 GeoVision Installation Page 91
5.2.2 GeoVision Menu Page 93
5.2.2.1 GeoVision Pairing Page 94
5.2.2.2 Browse records Page 96
5.2.3 Graph / Scale Page 100
5.2.4 Zoom / Pan Page 102
5.2.5 Delete Data Page 102
Chapter 6: Troubleshooting
6.1 Note about switching off Page 103
6.2 Meter turns off during measurement Page 103
6.3 “Error” on screen Page 104
6.4 Maintenance Page 105
6.5 Contact Technical Support Page 105
Appendix A: KT-10 v2 Plus feature Page 106
Appendix B: Advice & Recommandations Page 114
5

This page is intentionally left blank.
6

Chapter 1
Introduction
1.1 General Information
The KT-10 v2 is an advanced hand-held magnetic susceptibility meter. The KT-10 v2
was developed as a joint venture between Terraplus Inc., a geophysical instrument
supplier located in Richmond Hill, Ontario (Canada), and Georadis S.R.O., a Czech
Republic based design and manufacturing company.
The KT-10 v2 is best utilized for obtaining accurate and precise measurements from
outcrops, drill cores and rock samples. The KT-10 v2 is capable of measuring uneven
rock surfaces and is well suited for automated drill-core logging with a digitally recorded
scanning mode.
With its leading edge technology, the KT-10 v2 offers high sensitivity, higher operational
comfort and excellent communication capabilities.
IMPORTANT: Your KT-10 v2 meter is calibrated at the factory and a periodic
calibration is not required.
1.2 Operating Principle and Theory
1.2.1 Theory
Magnetic susceptibility is defined as the degree to which a substance can be magnetized.
In mathematical terms, it is the ratio k of the intensity of the magnetization I to the
magnetic field H that is responsible for the magnetization, i.e.
kH = I
7

From Ampere’s law, it is known that a current (i.e. a moving electrical charge) generates
a magnetic field. The inverse corollary to this is that a magnetic field can also influence a
moving electrical charge. Thus, an oscillating EM field will be influenced to varying
degrees by a magnetically susceptible material.
Conductivity is an intrinsic property of a microscopic volume of material. Apparent
conductivity is a volume average of a heterogeneous half-space except that the averaging is
not mathematical but dependent on each instrument. Only when the earth is a homogenous
half-space is the apparent conductivity the same as the true conductivity. The main advantage
of the electromagnetic conductivity method is that contact with the sample is not required. If
the conductive material is moved near to the measurement coil, new elementary electric
circuits are created. The sample will then behave like small secondary coils and influence the
magnetic flux through the measurement coil caused by mutual inductance. Naturally, this
leads to a change in the frequency. In general, the amplitude of the voltage signal decreases if
the conductivity increases and vice versa. Our method is based on the analysis of this change.
1.2.2 Operating principle
The KT-10 v2 utilizes a 10 kHz LC oscillator with an inductive coil to measure the magnetic
susceptibility and conductivity. Magnetic susceptibility is calculated from the frequency
difference between the sample and free air measurements, while conductivity is calculated
from the difference in amplitude between the two. It also takes into account geometric
corrections to determine the true susceptibility. The frequency of the oscillator is extremely
sensitive to temperature deviations. Any temperature instability is propagated in frequency
deviations and has a direct impact on maximum sensitivity. To minimize these effects, the
KT-10 v2 takes multiple measurements in free air before measuring the sample, and then
multiple free air measurements are taken afterwards. Then using a sophisticated algorithm,
the negative impact of temperature shift is minimized.
The sequence required to obtain a measurement is:
Step 1: The frequency and amplitude of the oscillator is determined in free
air.
Step 2: The oscillator frequency and amplitude is then measured when the
coil is placed on a rock sample, drill core, or outcrop.
Step 3: The frequency and amplitude of the oscillator is then measured
again, in free air, and then the results are displayed.
8

Chapter 2
The KT-10 v2 S/C
2.1 Specifications
Susceptibility Sensitivity: 1x10⁻⁶ SI Units
Conductivity Sensitivity (optional): 1 S/m
Susceptibility Range: 0.001 x 10
Conductivity Range (optional): 1 - 100,000 S/m Units Auto-Ranging
Operating frequency: 10 kHz
Measurement Frequency 20 times per second in Scanner
Mode (5 readings are averaged
together and 4 readings per second
are stored)
Display: High Contrast LCD Graphic
-3
to 1999.99 x 10-3 SI
Display with 104 x 88 pixels
Memory: Up to 4000 measurements with
voice notes.
Control: One button with up and down
functionality. A PIN mode is
available for rough surfaces.
Communication: USB, Bluetooth and GPS link via
Bluetooth
Battery: Two AA batteries - Rechargeable
or Non-rechargeable
Battery life: Up to 3000 readings without
voice recorder, using alkaline
batteries
Operating temperature: -20 °C to 60 °C
Dimensions: 200mm x 57mm X 30mm
Coil Diameter: 65 mm
Weight: 0.30 kg
9

2.2 Features
The KT-10 v2 has many features that make it stand out in the crowd of available hand
held magnetic susceptibility & conductivity meters, and they are as follows:
Multiple Configuration Capability (optional)*
The KT-10 v2 can be upgraded to include conductivity measurements. With this upgrade
it can be configured as a simultaneous magnetic susceptibility/conductivity meter, a
magnetic susceptibility meter, or a conductivity meter.
Android Application for Real Time Profiling (optional)*
The optional GeoVision software can be used to display real time scanner profile on
Android platform operated smart phones. The large display of the smart phone will show
real time graphical output while scanning and can be used as a data browser to display
field measurements/records in the KT-10 v2 memory. The keypad of the smart phone can
be used to enter additional text notes to the current data or any previously stored data on
the KT-10 v2.
True Susceptibility and Conductivity
The KT-10 v2 uses automated correcting routines to display true susceptibility and
volume conductivity.
Uneven Samples
The KT-10 v2 is offered with a PIN for rough surface measurements. When measuring
field samples or outcrops with the PIN, and when the meter is kept parallel to the surface,
it provides a reading with increased accuracy. It also automatically corrects and displays
the true magnetic susceptibility and conductivity.
Fast Scanning
The KT-10 v2 scans up to 20 readings per second; increasing the amount of information
that user can obtain per location or sample.
Please note: 4 readings per second are stored on the KT-10 v2; 5 readings are averaged
together for each of the 4 readings per second.
10

Depth Correlation
Before starting the measurement routine, the user can now enter information such as
borehole ID, box ID and the number of rows in a box, along with the start depth, end
depth and depth interval. The user will have the option to choose between imperial or
metric as their desired unit of measurement. In the Scanner mode, depth intervals can be
recorded with the push of a button while scanning a core. All readings between depth
intervals are interpolated.
Variable Audio
When used in the Scanner Mode, the KT-10 v2 meter’s loudspeaker allows the operator
to monitor the variation in the Magnetic Susceptibility and Conductivity measurements
with a variable audio tone, which reflects the relative intensity of the reading. In the
combined mode, Susceptibility & Conductivity, the variable audio is active for the
primary reading. For example, in Cond+Sucs mode the audio will reflect the intensity of
the Conductivity measurements. The voice recorder allows the recording and replaying
of voice messages through the loudspeaker as well.
Data Storage
The KT-10 v2 can store up to 4000 measurements with two minutes of comments per
reading, to its internal non-volatile memory. Average readings and standard deviation are
also stored. The operator can record comments associated to specific readings through the
KT-10 v2 digital voice recorder.
Data Averaging
Stored results of the measurement are automatically added in an averaging buffer. The
average value is displayed on the LCD along with standard deviation. The operator can
erase the buffer and control how many results will be averaged together.
USB Data Transfer
The KT-10 v2 uses USB communication standards as the default mode of
communication. It allows fast data transfer of measured values and digital voice streams
from the unit to any Windows PC. The USB connection can be also used for firmware
upgrades and device parameter settings.
11

Bluetooth Connectivity
The KT-10 v2 comes standard with Bluetooth capabilities. When the KT-10 v2 is paired
to an external Bluetooth enabled GPS, the user can store the GPS coordinates in the KT-
10 v2’s memory along with the readings. Bluetooth can also be used to download
readings from the unit along with the voice streams to a computer. Alternately, one can
also pair the KT-10 v2 to an Android running smart phone to obtain Real Time Scanner
Profile.
Rain and Dust Proof
The KT-10 v2 meets IP65 standards; therefore it is protected against dust and provides
additional protection in rainy or high humidity conditions.
Large LCD Display
A high contrast LCD is utilized for the display of both the magnetic susceptibility and
conductivity readings and serves as the interface for operating the instrument. Together
with two buttons and graphical menus, operators can interactively navigate between the
different functions. On screen notification icons allows the operator to monitor the
battery status, Bluetooth connectivity, GPS support and more.
Power
Power saving techniques and use of low consumption components allow for the use of
high speed communication standards (USB, Bluetooth) and supports the large LCD
display. The meter is powered by 2 AA type batteries. The user can use any brand of
rechargeable or non-rechargeable battery. The unit does not contain an internal battery
charger. Therefore, rechargeable batteries must be charged outside the KT-10 v2 in a
suitable battery charger provided or similar.
Storage / Transportation
The KT-10 v2 is delivered in small pouch/case with a foam insert. The pouch can be
mounted on a belt and comfortably carried on the waist. A set of spare batteries and PINs
can be also placed in the pouch for storage. Even though the KT-10 v2 has been
designed to be a rugged instrument, it still can be damaged by severe impacts. Also,
please note that the KT-10 v2 is only water resistant, not water proof. Consequently, total
immersion in water or long exposure in heavy rain is not advisable for this instrument.
12
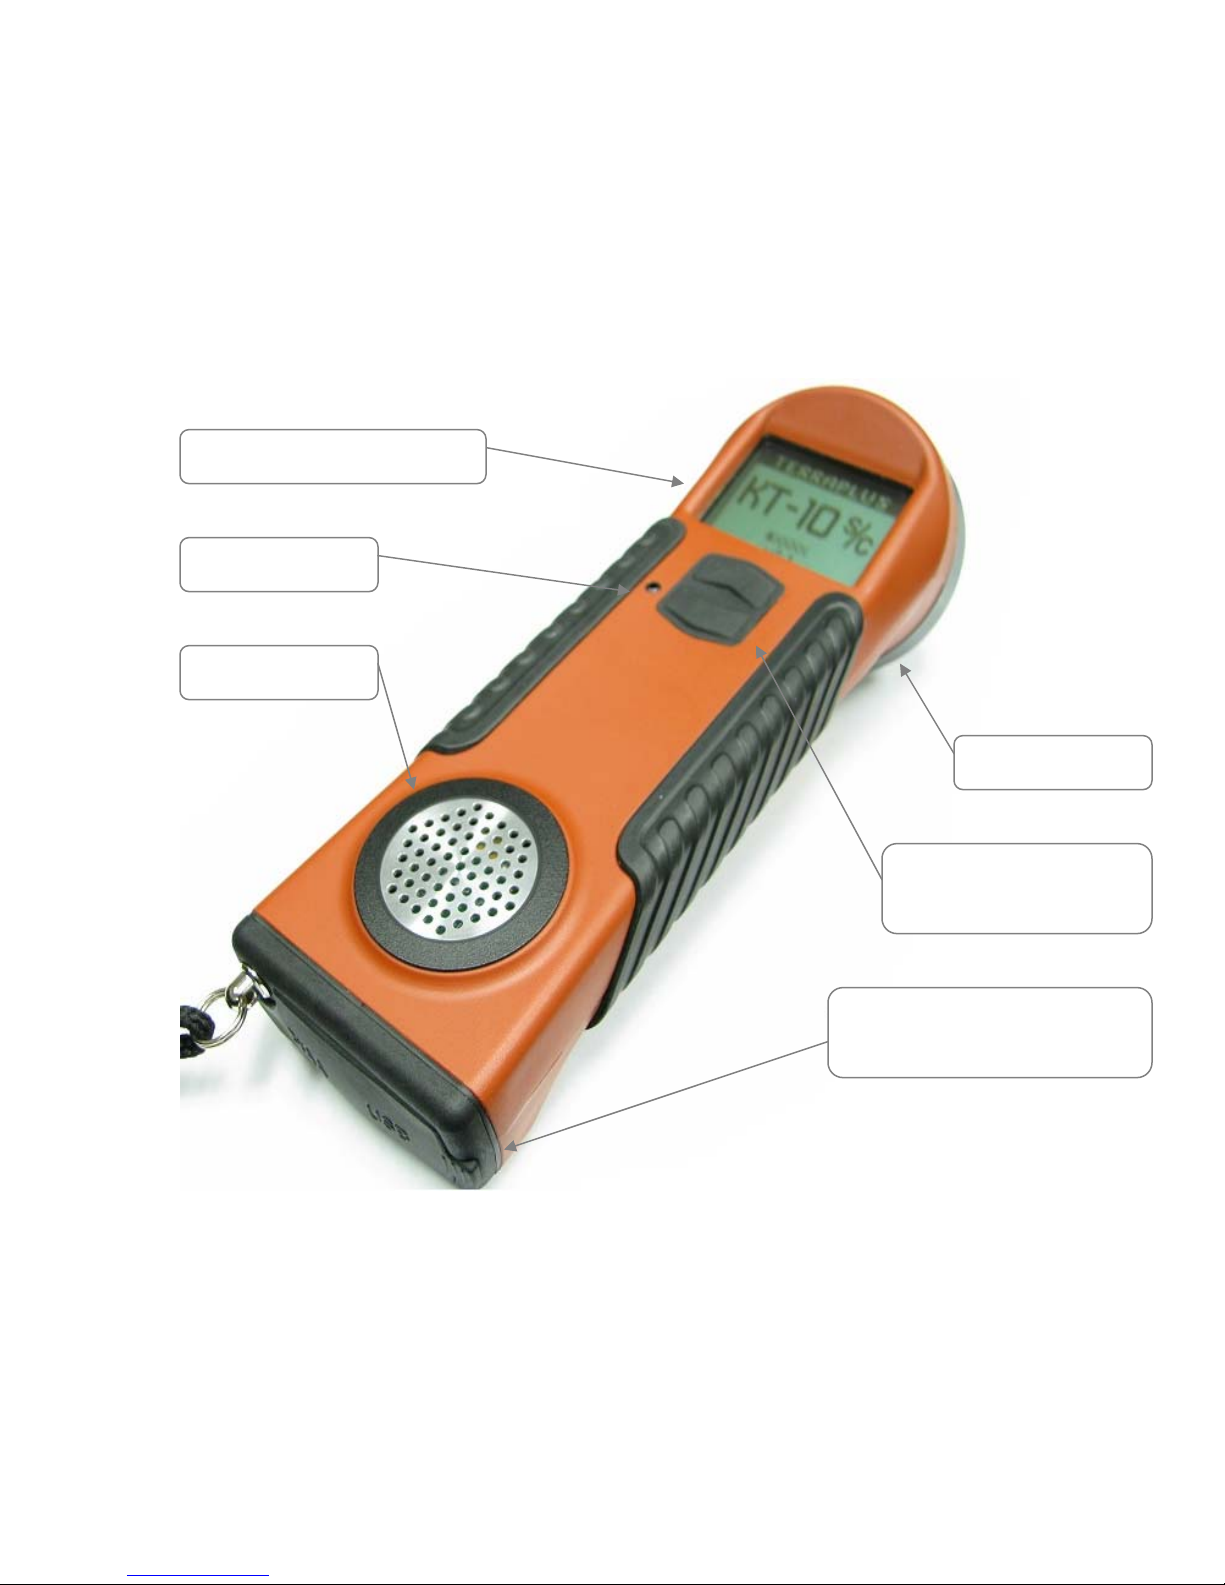
LCD Graphic Display
Microphone
Loud Speaker
2.3 KT-10 v2 Layout
Oscillator Coil
Associated Button
Up/Down
Battery Port & USB
Communication
Figure 1: KT-10 v2 Layout (KT-10 S/C shown)
13
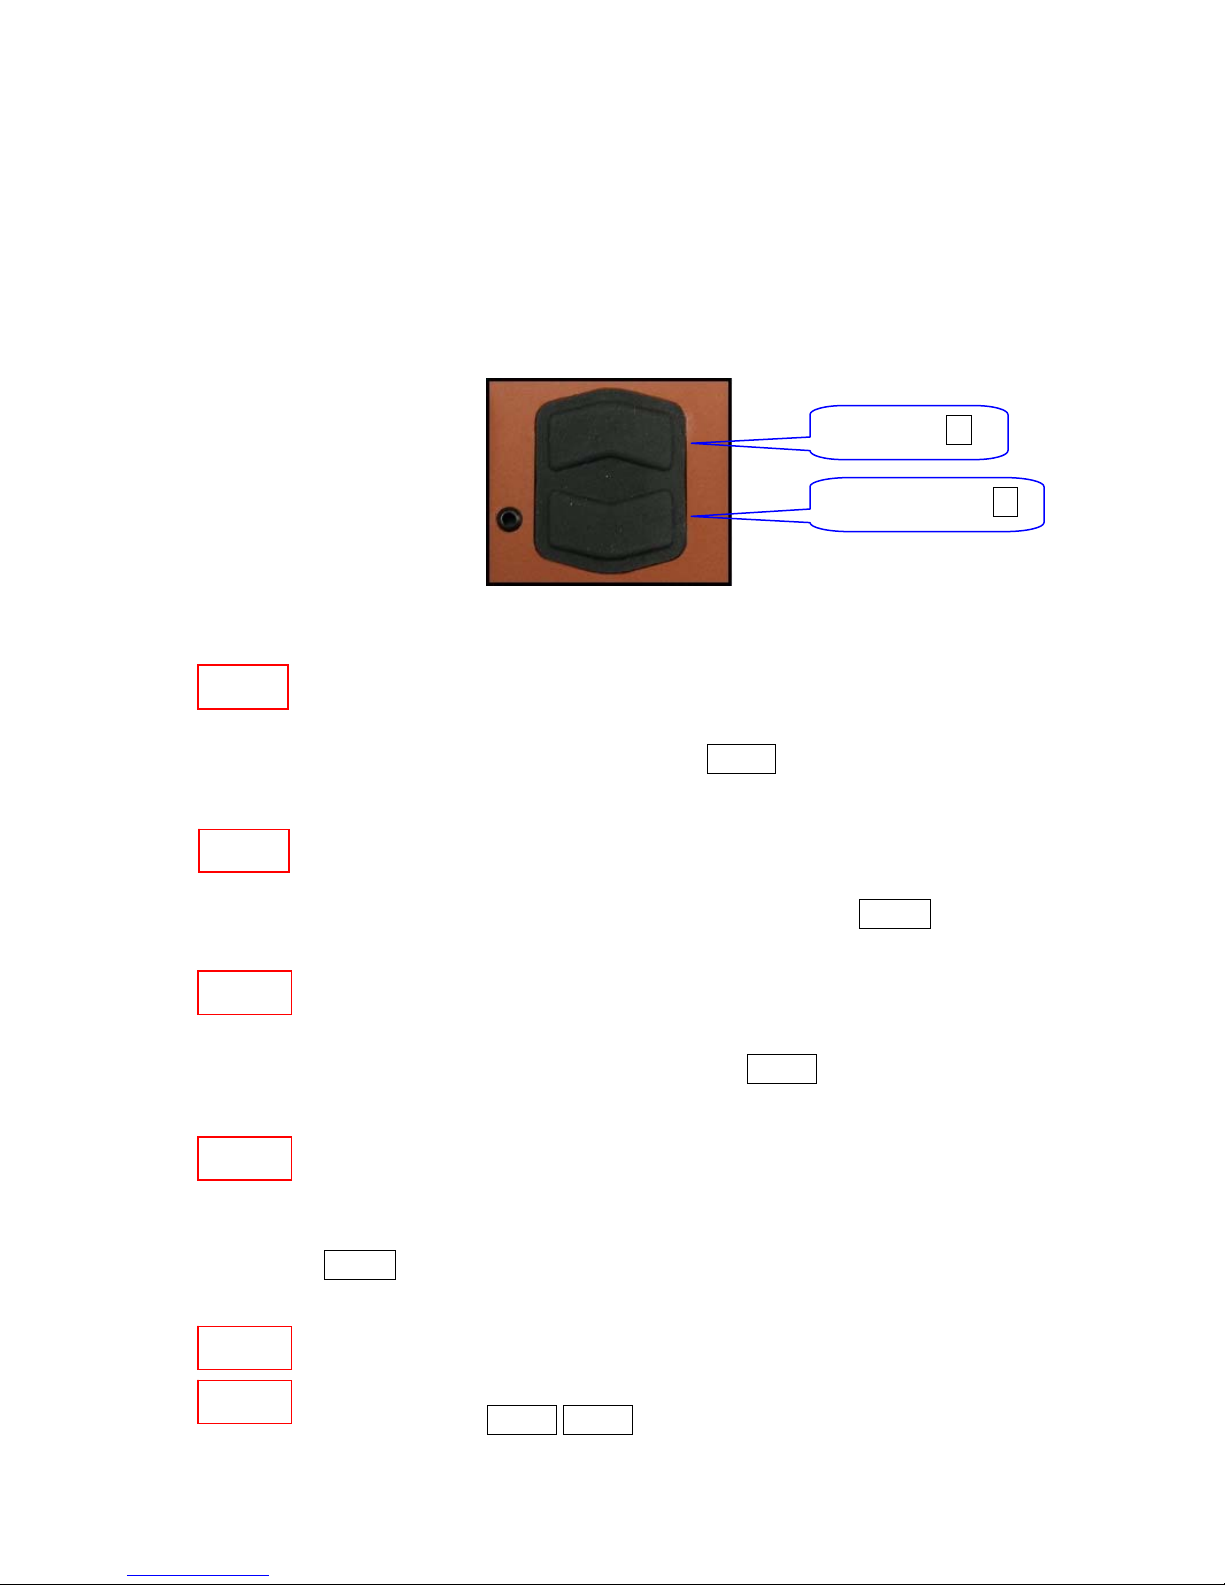
2.4 Controls
To control the KT-10 v2, there is one button with associated UP/DOWN functions. There
are five different options to use this button and they are as follows:
UP Button ▲
DOWN Button ▼
Figure 2: Control Button
SBP▲
LBP▲
SBP▼
LBP▼
Short Button Press UP – is a single short push of the button, pointing to
screen, in its upper half. This symbol will be used throughout this
document to represent this button press SBP▲
Long Button Press UP – hold the button in its upper half for more than one
second or until a reaction appears on display. This symbol will be used
throughout this document to represent this button press LBP▲
Short Button Press DOWN – is a single short push on the button, pointing
away from screen, in its lower half. This symbol will be used throughout
this document to represent this button press SBP▼
Long Button Press DOWN – hold the button in its lower half for more
than one second or until a reaction appears on the display. This symbol
will be used through out this document to represent this button press
LBP▼
SBP▲
Both buttons pressed together will turn the unit off at any time during
operation. This symbol will be used throughout this document to represent
SBP▼
this button press SBP▼ SBP▲
14
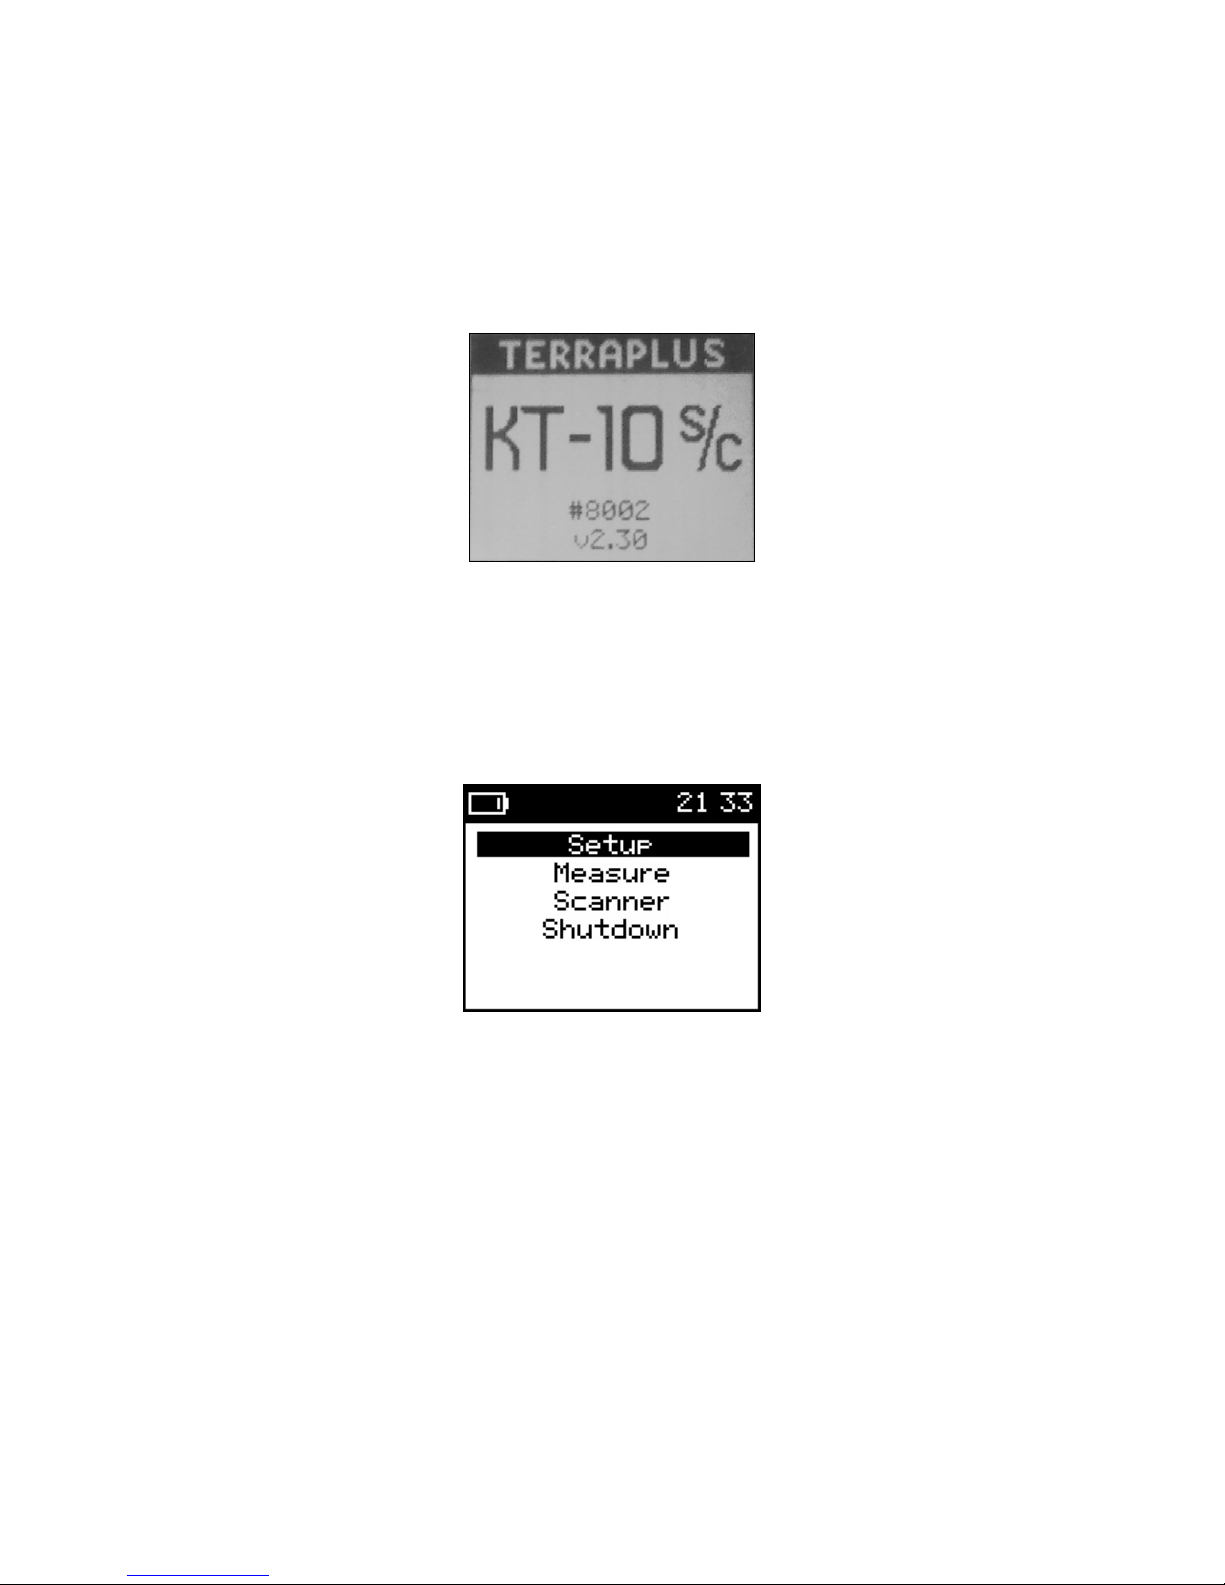
2.5 Menus
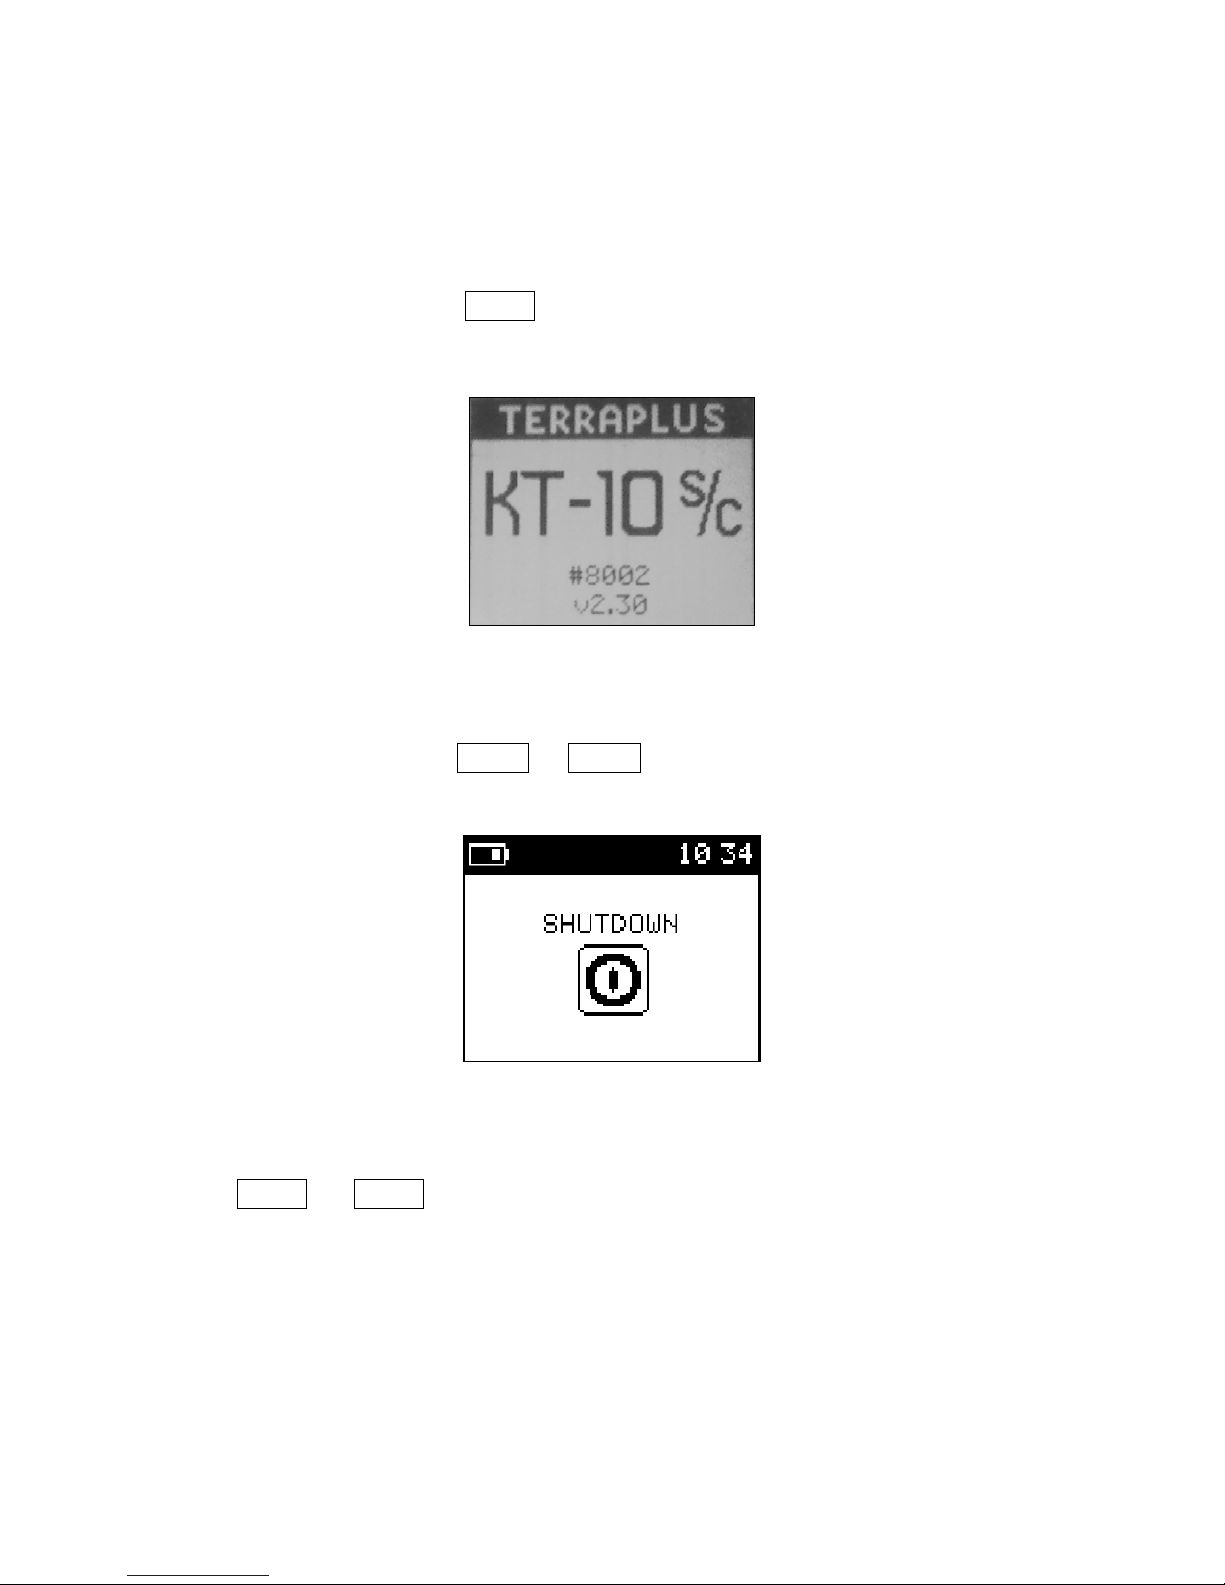
The first screen you will see when you power on the meter will be a start up screen
(shown in Figure 3).
Figure 3: Start-up Screen
The information displayed on the start-up screen will be the unit’s serial number and
firmware revision, which is currently v2.70, at the time of this writing. The start-up
screen will be displayed for about 2 seconds and then the main menu will appear (shown
in Figure 4).
Figure 4: Main Menu
Measure and Scanner are the two modes of operation for the KT-10 v2. Selecting one of
these options will activate the measurement routine for that mode. Setup is used to
configure mode, date & time, core size selection, connection of Bluetooth GPS unit, and
battery type selection along with calibration information. Shutdown will turn the unit off.
For detailed information on each measurement selection and the settings menu please
refer to Chapter 3 for Operation of the KT-10 v2 (starting on Page 17).
15
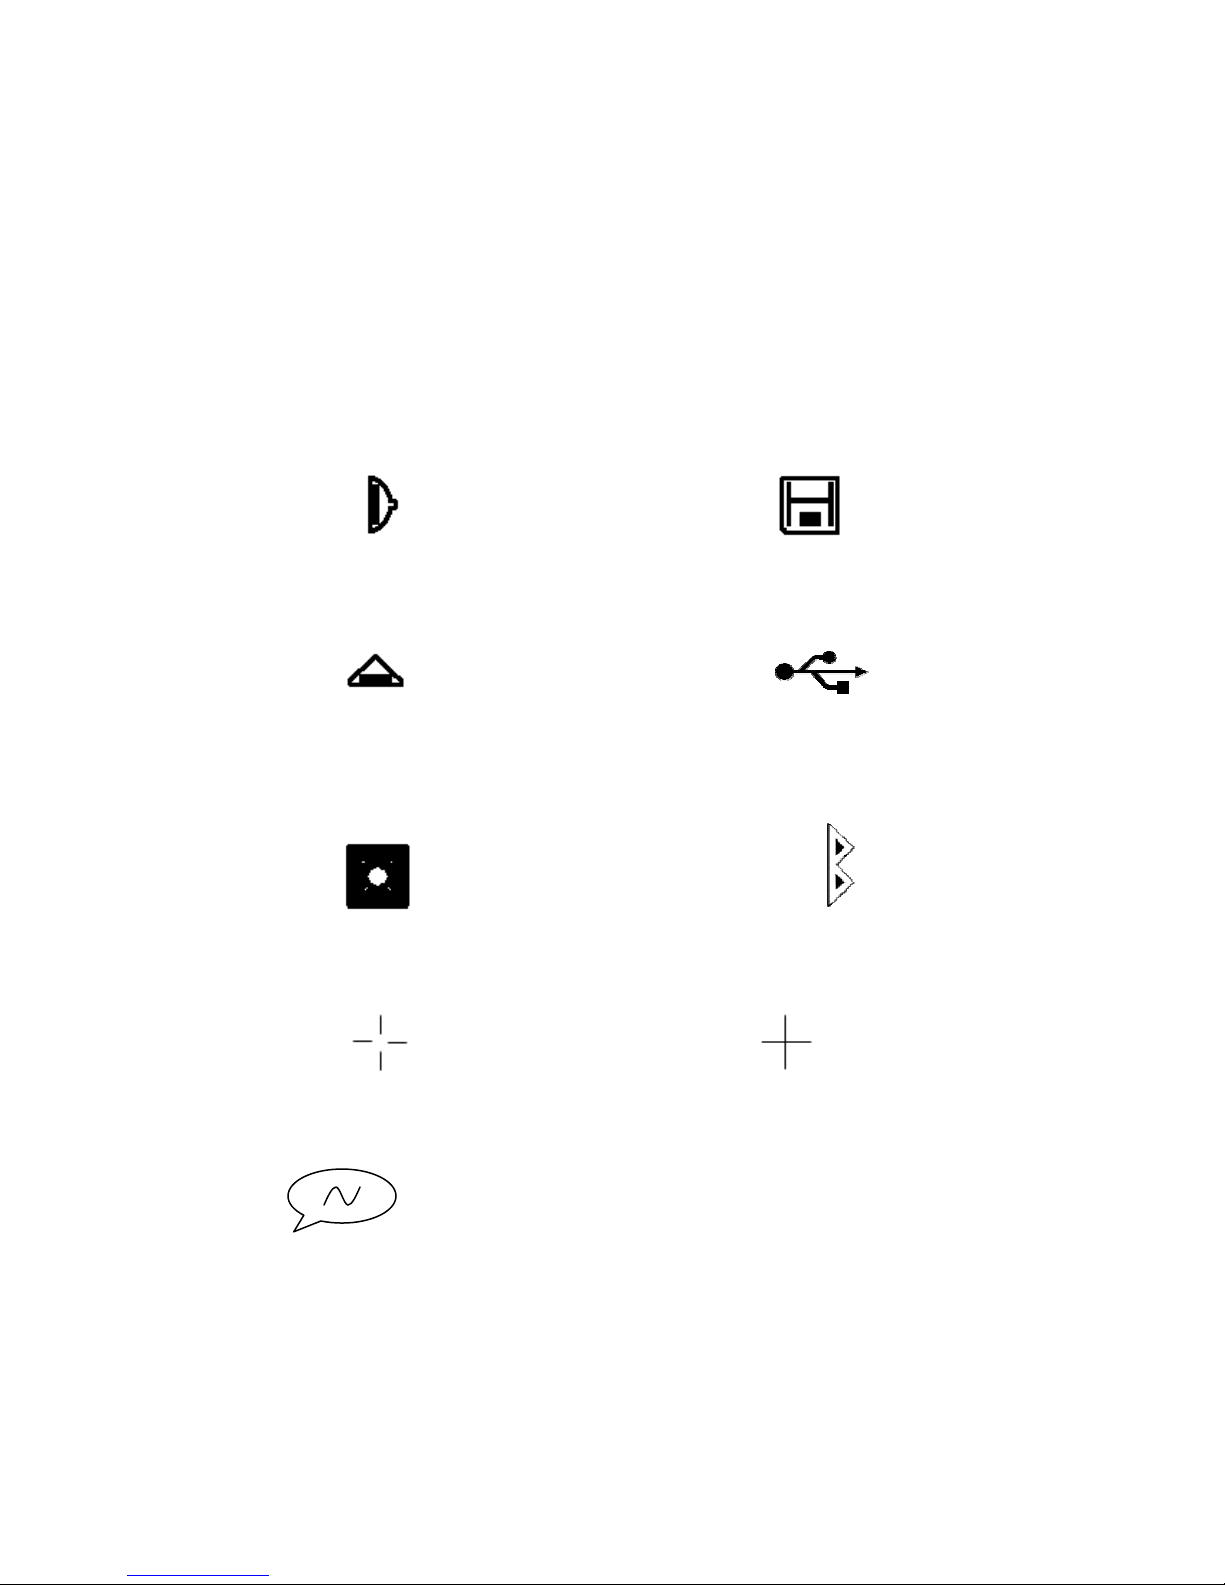
2.6 Notification Icons
There are several icons used on the KT-10 v2, which are displayed in the top bar of the
instrument, known as the notification area. The time and battery indicator are displayed
in this location and are displayed permanently during operation of the instrument. Below
you will find a list of the other icons you will see used on the meter and the meaning for
each of them.
Pin used for measurement Readings have been saved
Button used for measurement USB is connected
Core diameter selected Bluetooth is connected
GPS is connecting GPS is connected
Voice Note
16

Battery Housing
Rubber Protective Cover
Chapter 3
Operating the KT-10 v2
3.1 Battery Installation
Battery Housing Lid
Figure 5: Battery Installation
To install batteries follow this procedure:
1. Bend the rubber protection cover on the rear of the instrument to gain access to
the battery housing lid.
2. Use any flathead screw driver, or suitable coin, to open the lid.
3. Insert two rechargeable AA cell batteries provided. The positive side goes in first.
4. Close the battery housing by screwing the lid back onto it.
5. Attach the rubber protective cover back in position.
Note: If you are going to store your KT-10 v2 for long a period of time, please remove
the batteries from the unit to prevent damage from electrolyte leakage. It is also
recommended that you visually inspect the batteries after any long storage
interval.
17
3.2 Power
3.2.1 Power ON
To power the unit ON, use SBP▲. An introductory screen (seen below in Figure 6)
accompanied by a melody will be presented.
Figure 6: Power On
3.2.2 Power OFF
To power the unit off, use LBP▲ or LBP▼ on the Shutdown option from the main
menu. You will be presented with the following screen…
Figure 7: Power Off
Alternatively
Press SBP▲ and SBP▼ together, to turn the meter off at any time during operation. The
shut down screen will not appear. Instead the unit will immediately turn off
TIP: Place your finger or thumb tip between the two buttons to simplify this task.
18
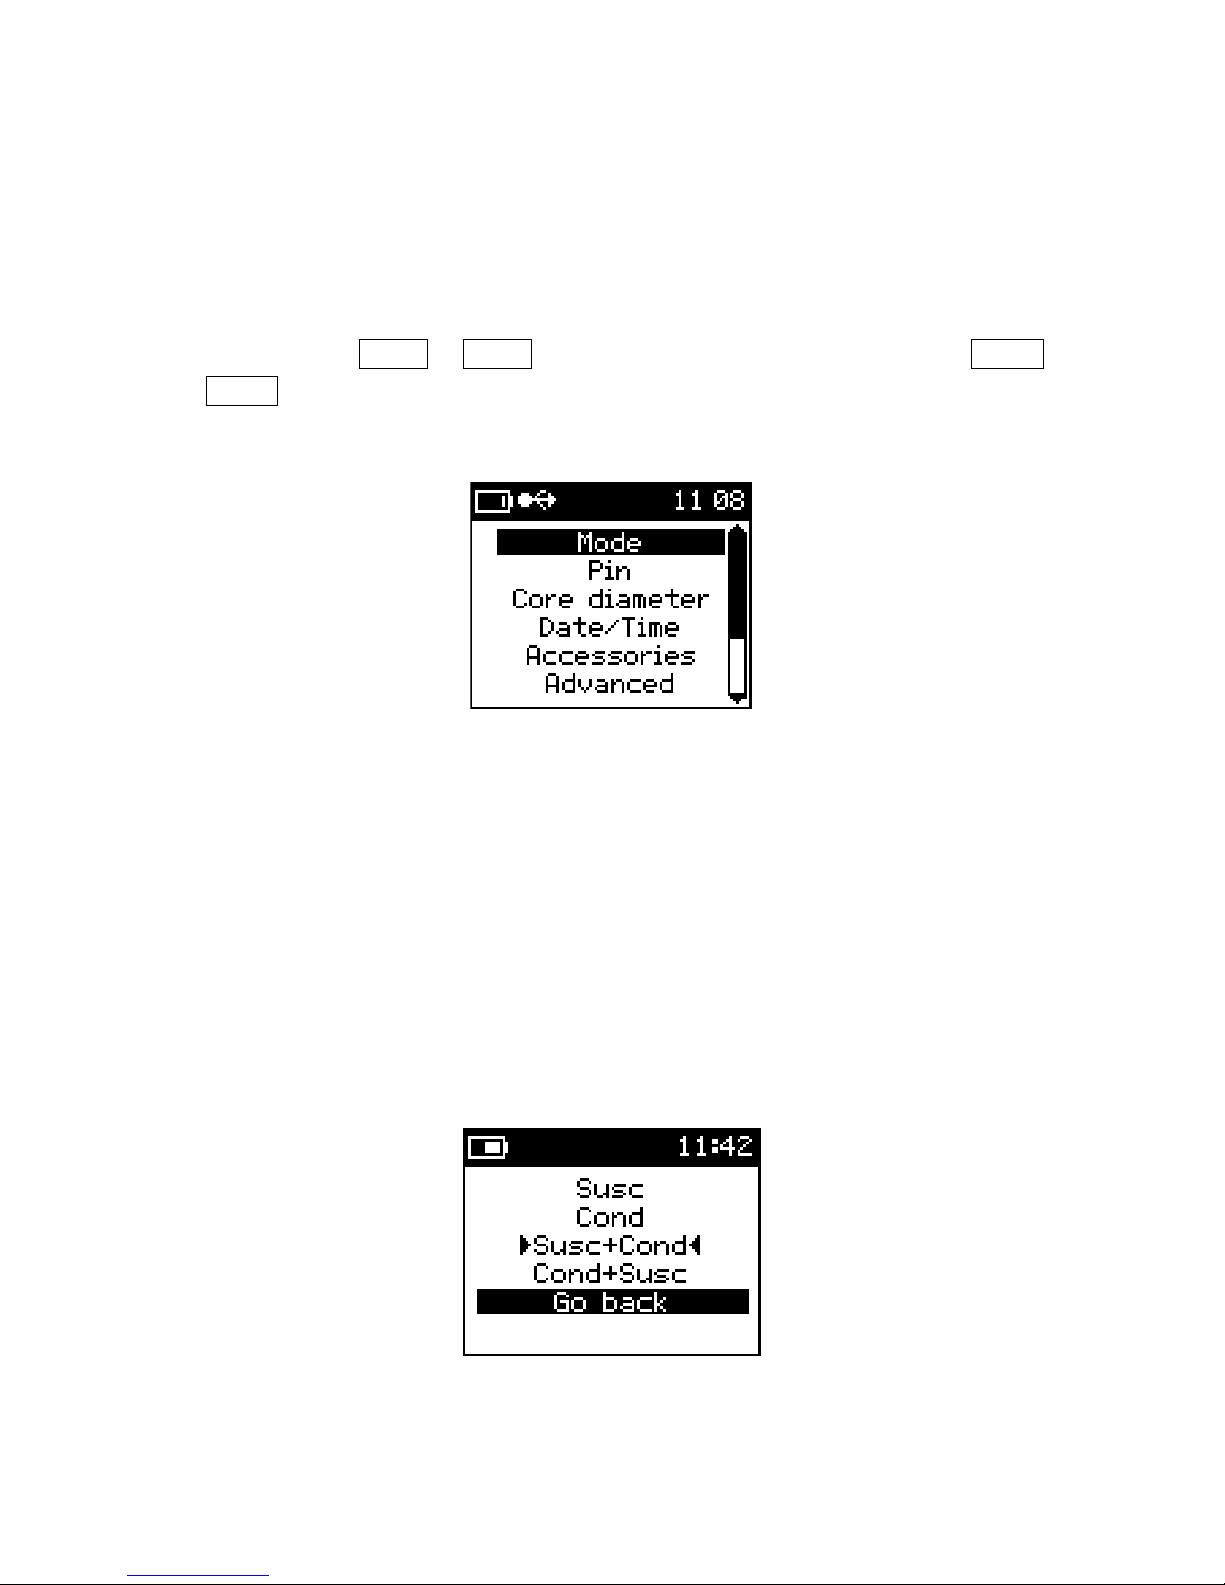
3.3 Setup Menu
The Setup menu contains several different parameters to configure the KT-10 v2’s
operation. The selections in this menu are: Mode, Core Diameter, Measure Units,
Date/Time, Accessories, Advanced, and Main Menu. To navigate to the desired
parameter use the SBP▼ or SBP▲, then when the parameter is highlighted use LBP▼
or LBP▲ to activate it.
Figure 8: Setup Menu
Mode: (Optional for KT-10 v2)
KT-10 v2 can be operated in 3 different configurations: measure Magnetic Susceptibility
and Conductivity simultaneously, measure only Magnetic Susceptibility, or measure
Conductivity only.
For ease of operation, the user can select from 4 modes; Susceptibility, Conductivity,
Susceptibility & Conductivity, or Conductivity & Susceptibility.
Figure 9: Mode menu
19
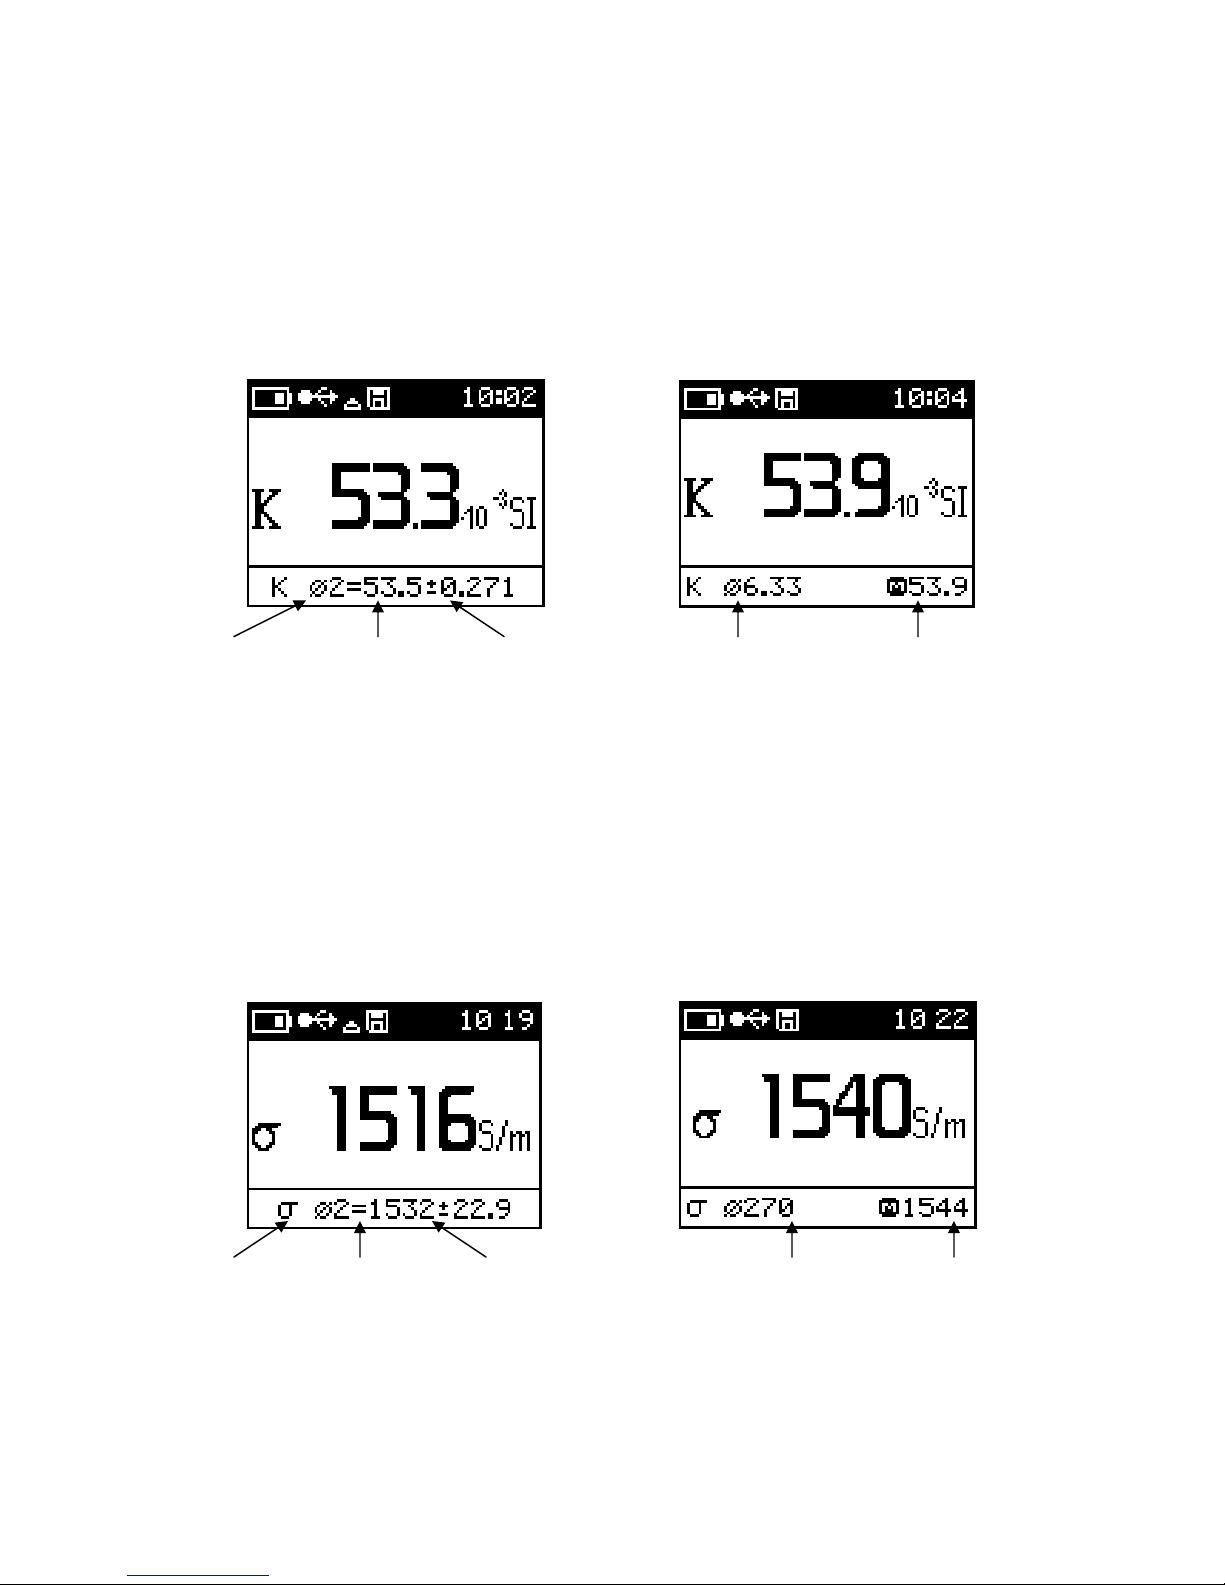
Sucs:
Enables the meter for susceptibility measurements. Along with susceptibility
results, user can obtain data average and standard deviation values in the measure
mode and data average and maximum values in the scanner mode
(Seen in Figure 10).
# of readings Average Std. Deviation Average Scanner Max
Figure 10 : (a) Measure Mode Figure 10 : (b) Scanner Mode
Cond:
Enables the meter for conductivity measurements. Along with conductivity
results, user can obtain data average and standard deviation values in the measure
mode and data average and maximum values in the scanner mode
(seen in Figure 11).
# of readings Average Std. Deviation Average Scanner Max
Figure 11 : (a) Measure Mode Figure 11 : (b) Scanner Mode
20
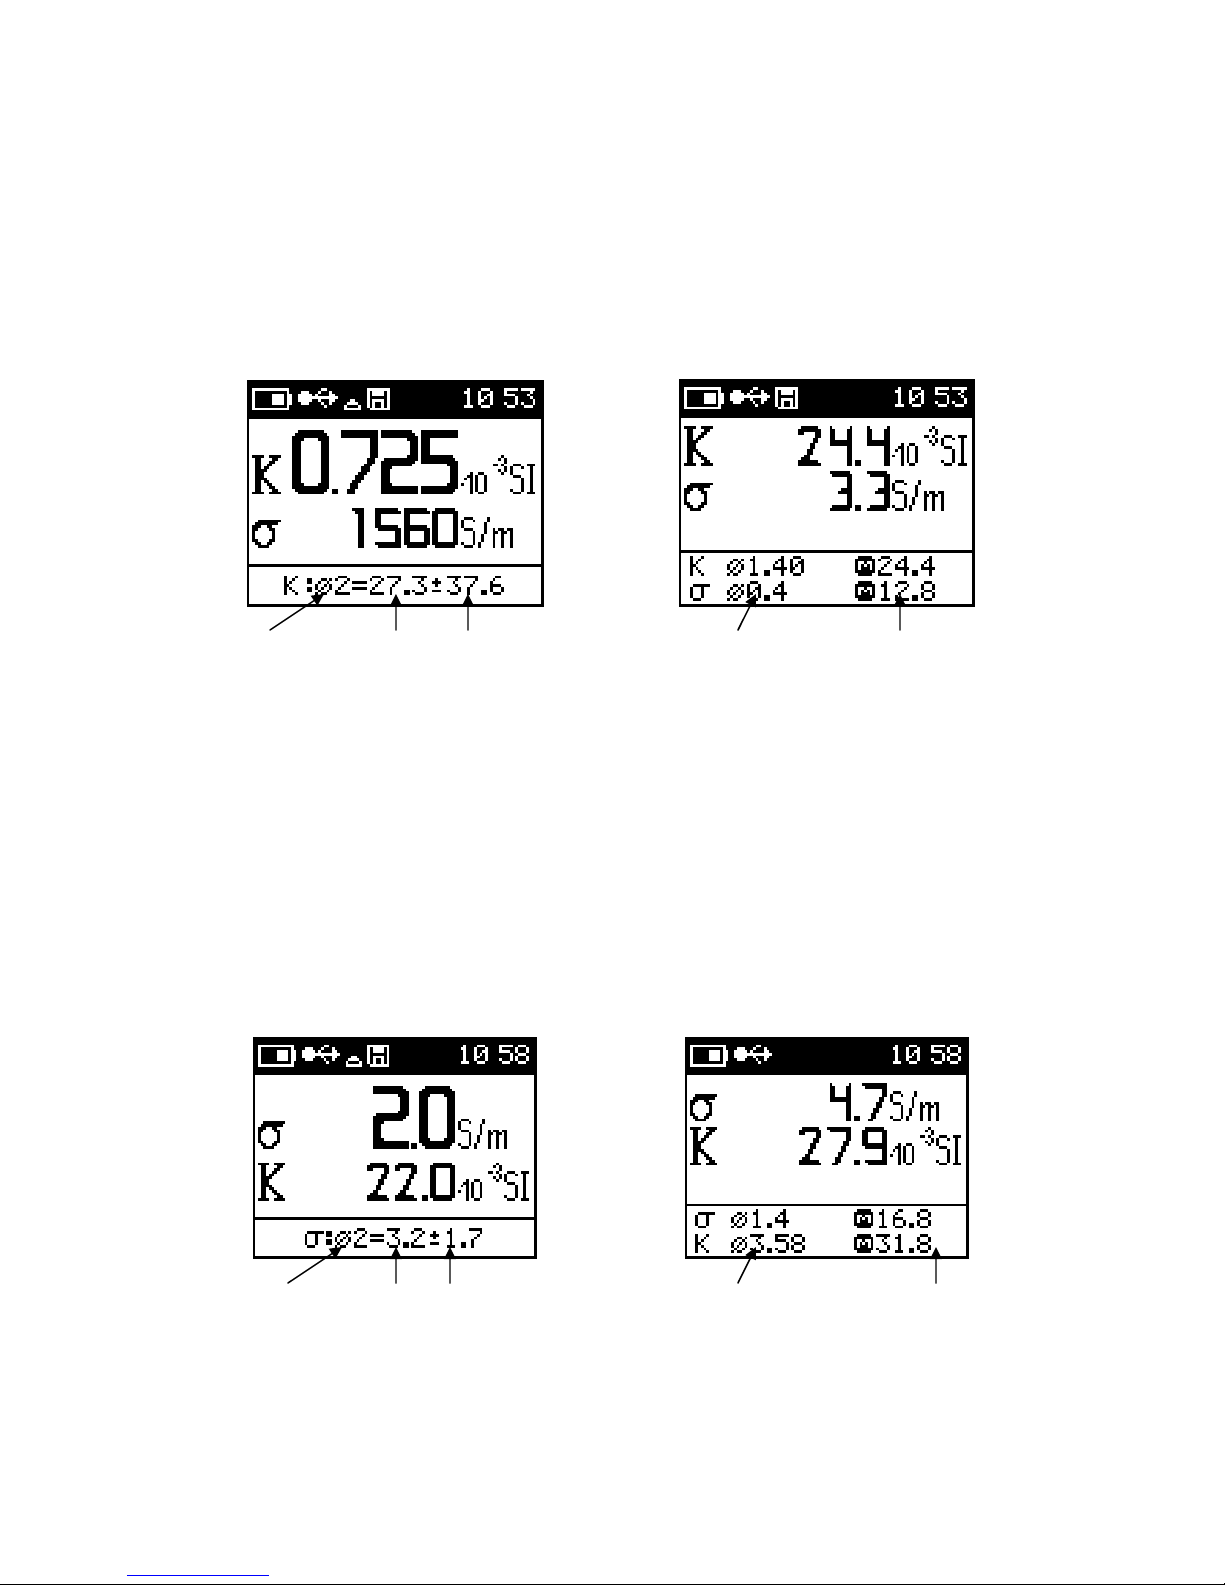
Susc+Cond:
This mode will enable the meter to read both susceptibility and conductivity
simultaneously. In this mode, measurement of magnetic susceptibility is considered
primary reading and the results of the primary readings are displayed in large text. User
can obtain data average and standard deviation values in the measure mode and data
average and maximum values in the scanner mode. (shown in Figure 12).
# of readings Average Std. Deviation Average Scanner Max
Figure 12 (a): Measure Mode Figure 12 (b): Scanner Mode
Cond+Susc:
This mode will enable the meter to read both conductivity and susceptibility
simultaneously. In this mode, measurement of conductivity is considered primary and the
results of the primary are displayed in large text. User can obtain data average and
standard deviation values in the measure mode and data average and maximum values
in the scanner mode. (shown in Figure 13).
# of readings Average Std. Deviation Average Scanner Max
Figure 13 (a) : Measure Mode Figure 13 (b) : Scanner Mode
21
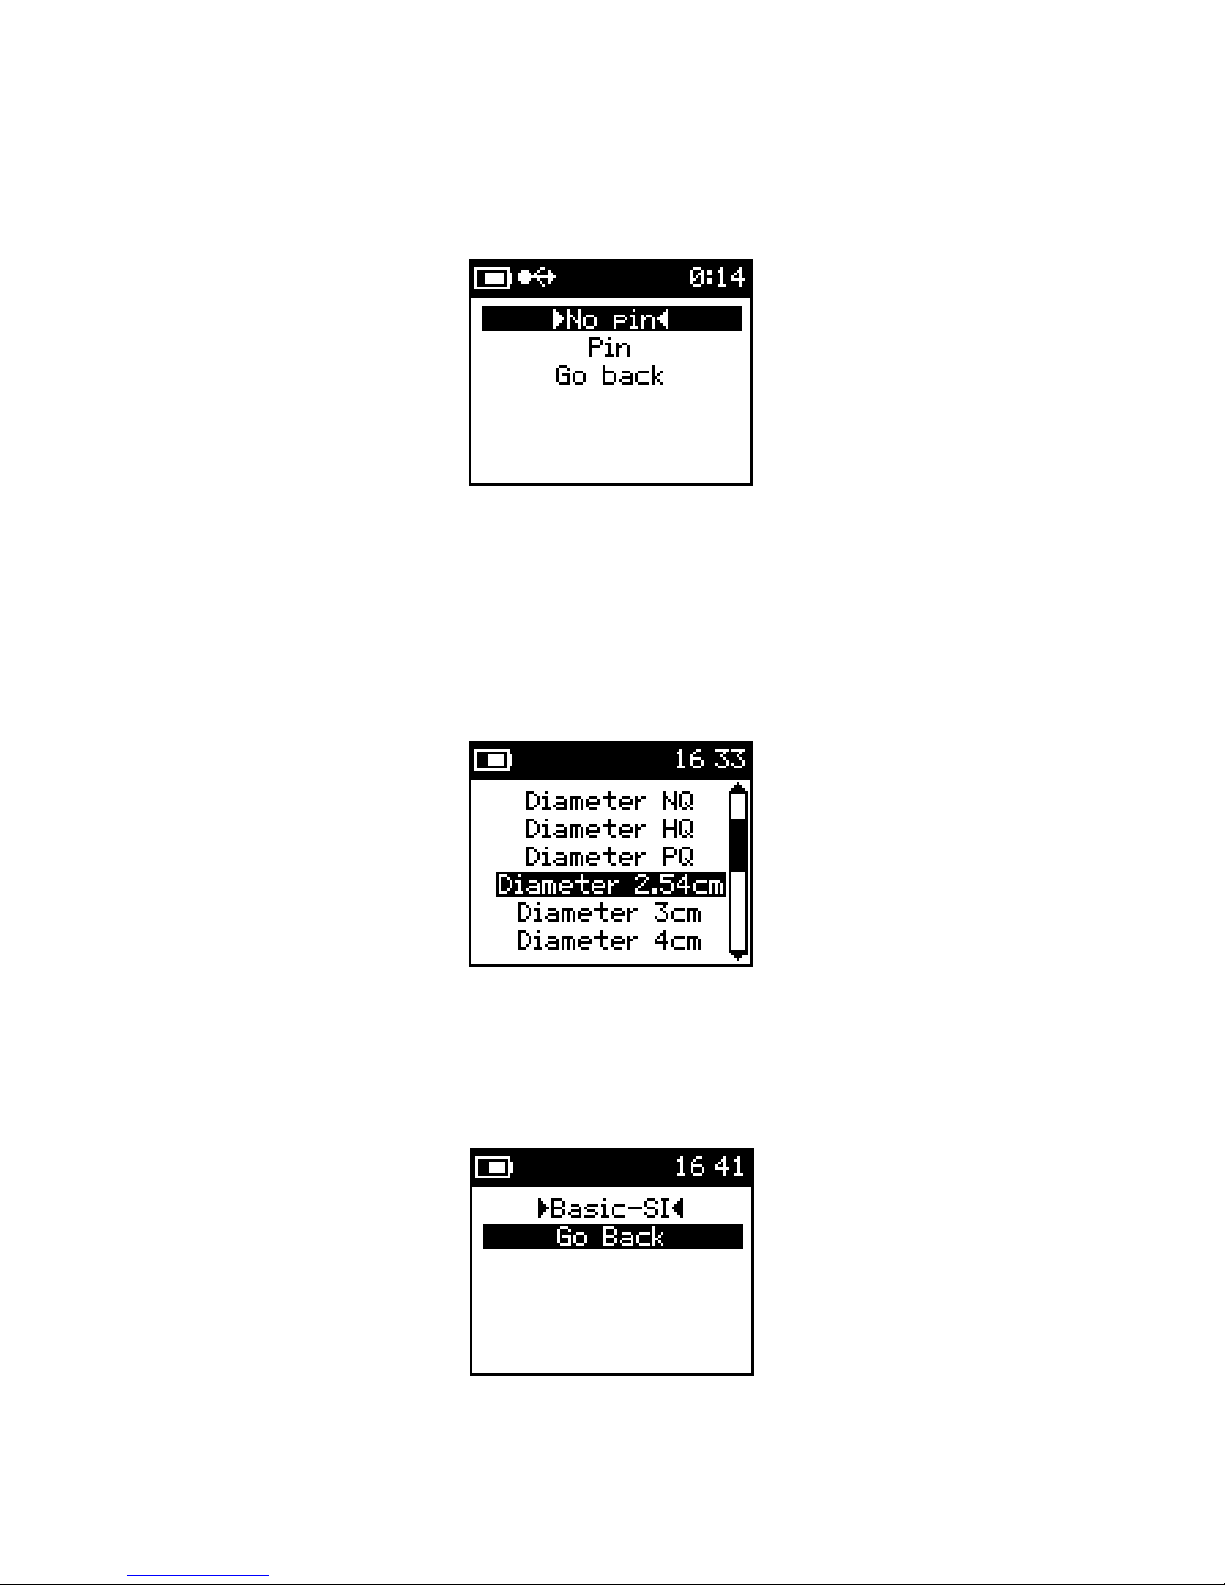
Pin
The KT-10 v2 is equipped with a PIN for rough surface measurements. To enable the
meter in the PIN mode, PIN must be selected.
Figure 14: PIN mode
Core Diameter
Contains a list of the different core diameter sizes that can be selected; both standard
North American and non-standard diameters are available. When a diameter is selected,
for either full cylindrical or split cores, the diameter correction is automatically applied to
magnetic susceptibility and conductivity measurements.
Figure 15: Core diameter
Concentration (Conc.) Tables (for Plus model only * see page 106)
The user can choose to obtain readings in either basic SI or CGS units, or as a grade
estimate in a percentage (%) for any installed calibration table.
22
Figure 16: Measure units
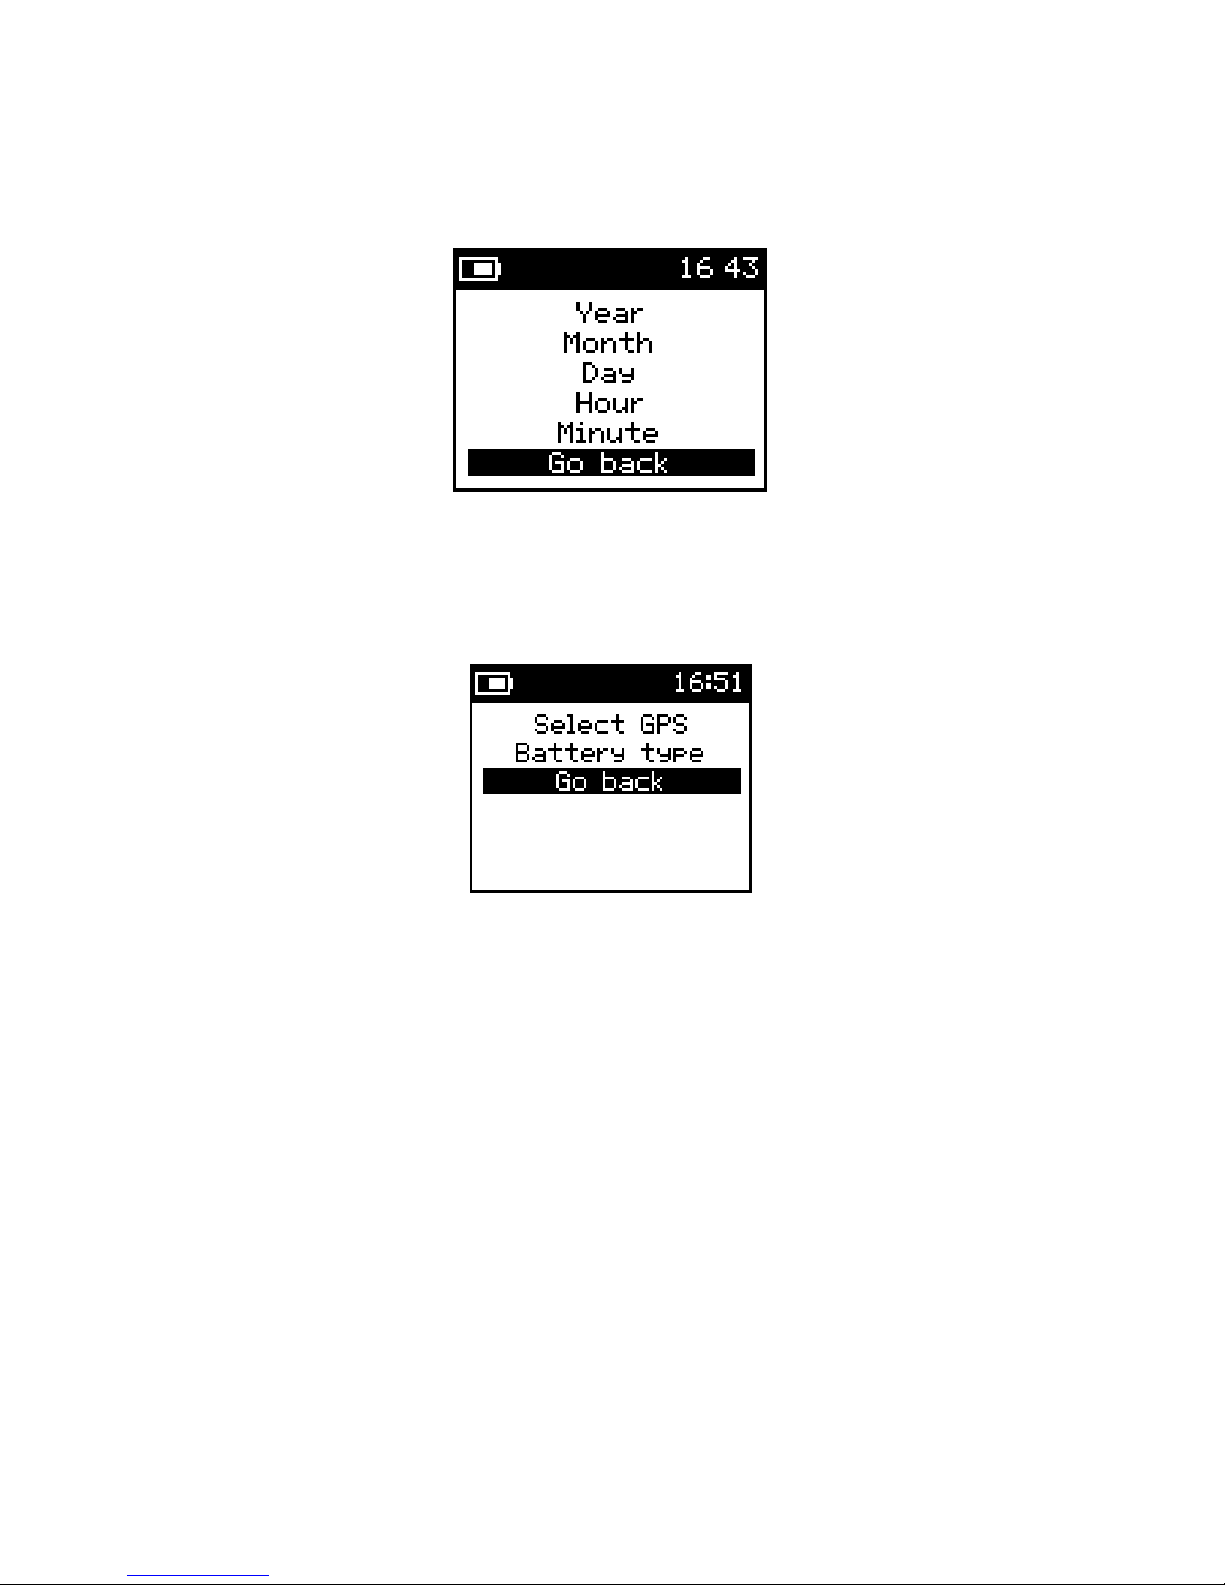
Date/Time:
To set date and time on the KT-10 v2, in a 24 hour format.
Figure 17: Date/Time
Accessories
Allows for configuration of the GPS and Battery type.
Figure 18: Accessories
Select GPS:
Entering this option will start a search for Bluetooth capable GPS units. A search
screen will be presented and when all the Bluetooth enabled devices have been detected, a list of
all named Bluetooth devices will be displayed. Please consult the GPS user’s manual for detailed
information on settings for the Bluetooth GPS and any name it may use for its discovery.
Please note: Some Bluetooth GPS units require a “PIN” for secure pairing. To facilitate this, the
KT-10 v2 allows entry of a “PIN” via GeoView software.
Battery Type: there are t
wo choices for battery type selection, rechargeable and non-
rechargeable.
23
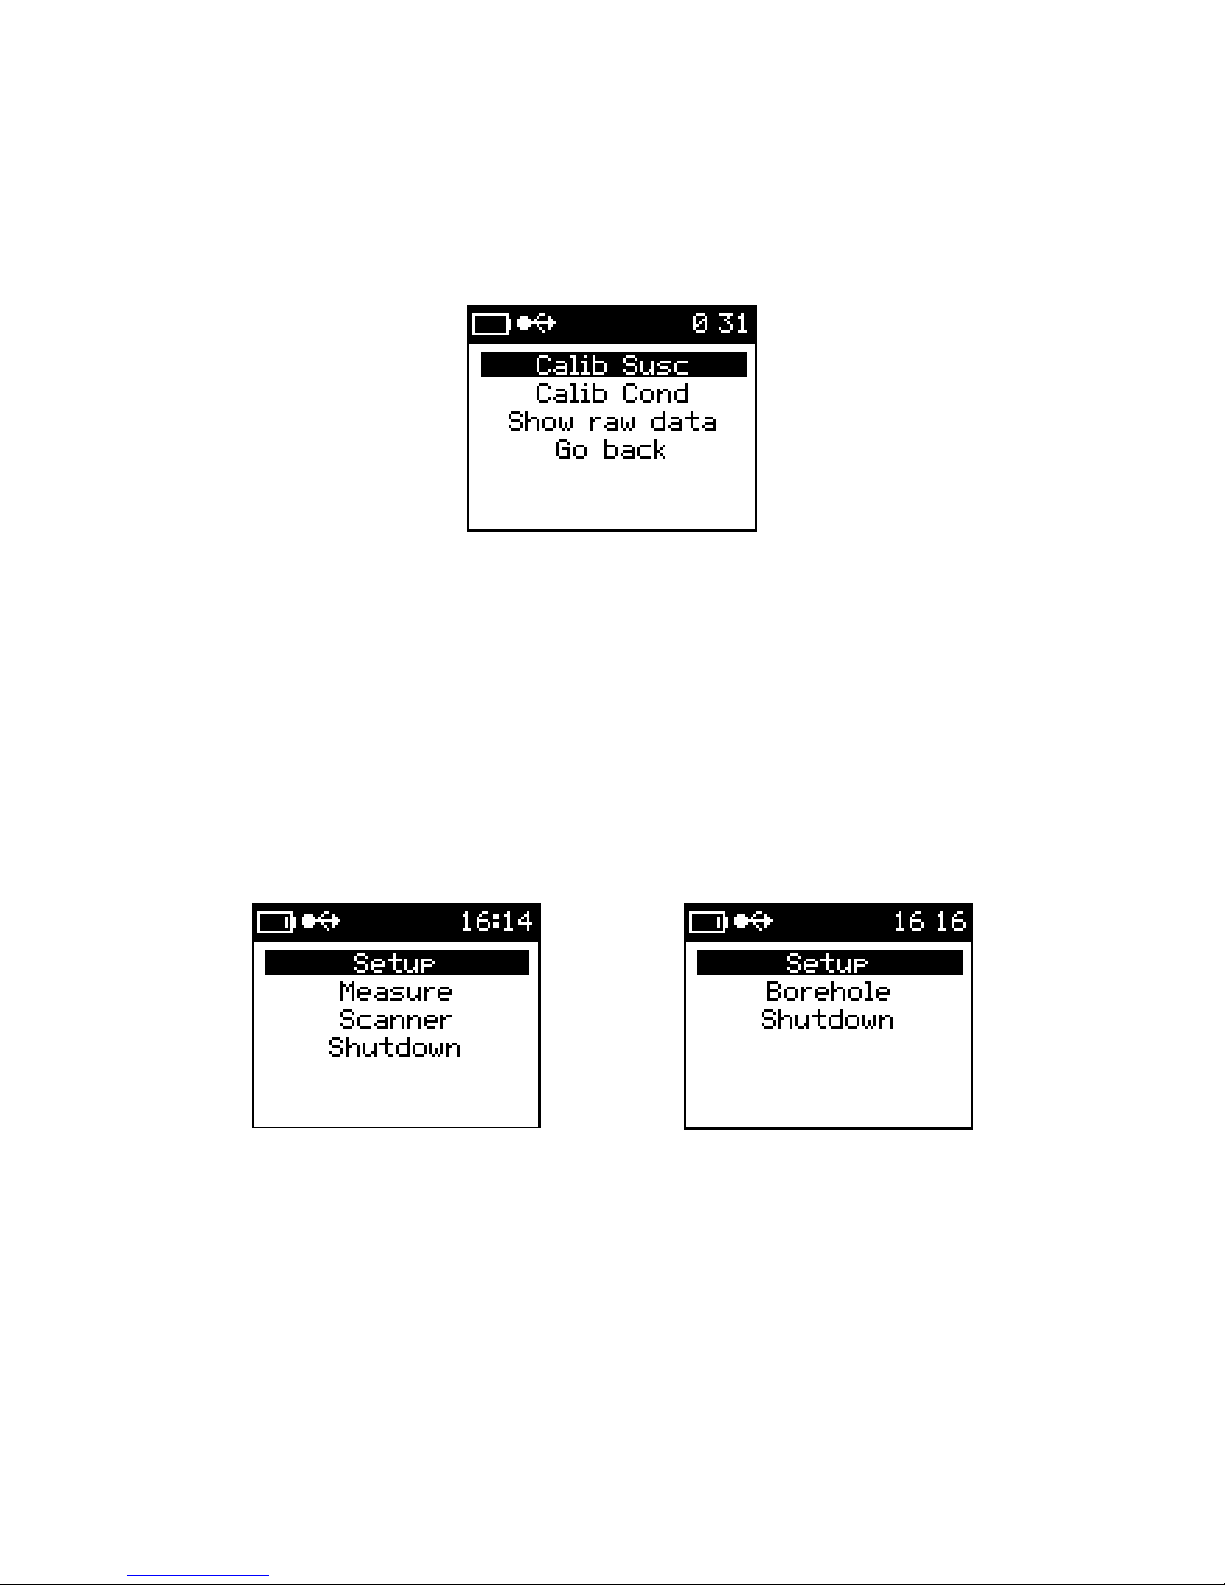
Advanced
Provides access to the meter Calibration and QA parameters.
Figure 19: Advanced
Show raw data: A debug tool that monitors the frequency & amplitude
of the measuring coil; this feature is primarily used at the factory.
Borehole mode
The Borehole mode allows user to integrate depth information to the data being collected
in both the Measure and the Scanner mode. In the Setup menu, the Borehole mode
option can be OFF or ON. When the Borehole mode is ON, the main menu will list
Borehole as a method of measurement.
Borehole Mode OFF Borehole Mode ON
Units
Users can obtain magnetic susceptibility measurements in either SI or CGS
units; while conductivity measurements can be in either S/m or Ω.m units
* When Borehole Mode is enabled, unit of measure for distance can be selected
Main Menu:
This selection will take you back to the Main Menu.
24
Main Menu
3.4 Measure
Selecting Measure from the main menu will initialize the KT-10 v2 for a single
measurement. In this mode, measurements can be obtained with (measurement of a core)
or without geometric corrections to the readings. Measurements without geometric
corrections to the readings are best utilized for quick recognisance of rock samples or
outcrops with no specific geometry.
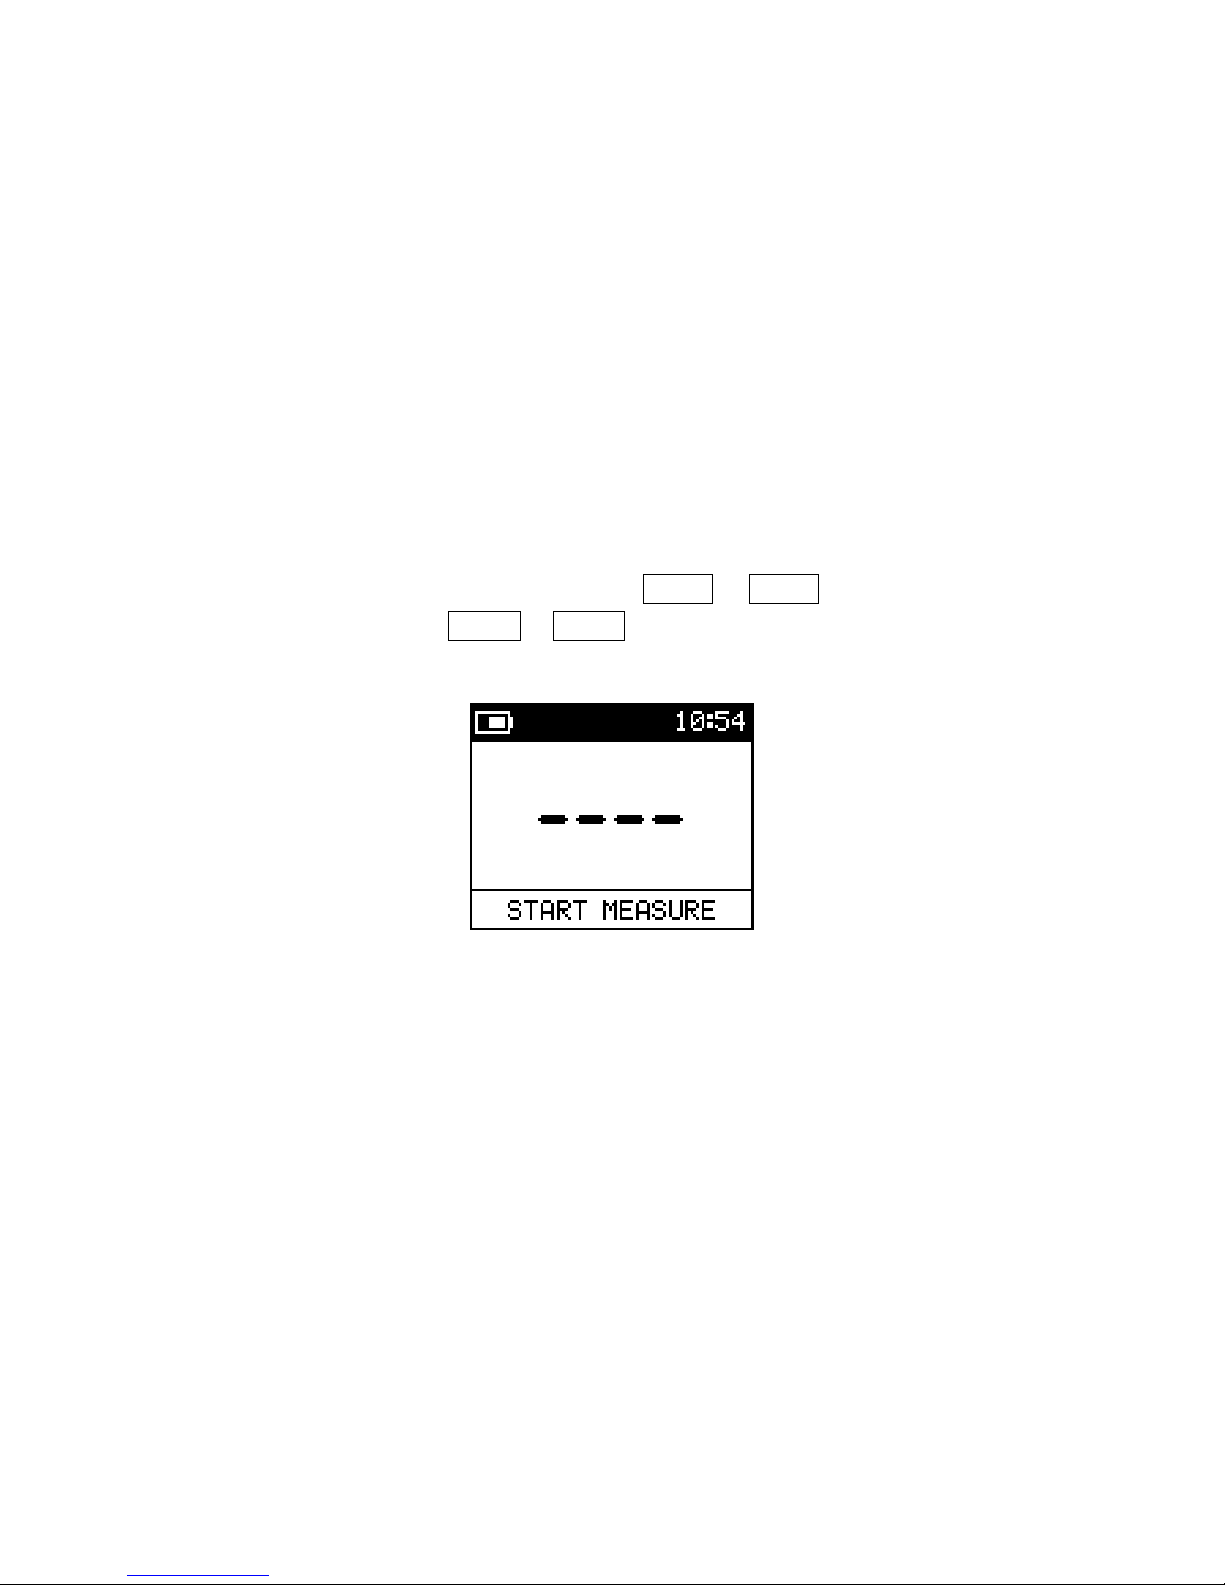
3.4.1 Take a reading
If Measure has not already been selected, use SBP▼ or SBP▲ to highlight this mode
and select it with the use of LBP▼ or LBP▲.
Figure 21: Start Measure
When you enter the measurement mode, the screen above will be displayed and indicate
that the meter is ready to start the measurement process.
There are three steps involved in the measurement sequence: the first step is a free air
measurement; the second is the sample measurement; and the final step is another free air
measurement.
Note: The duration for the measurement sequence is 7 seconds long. Soon after the
measurement is initiated, a new screen with 4 dashes and a progress bar will
appear. It takes 7 seconds for the progress bar to complete. It is important
that you do not wait for the bar to build up in between each of the 3 steps or
else you will be presented with “Error” on the screen.
25

TIP: Figure 26 on page 30 contains a flow chart for the measurement process.
The chart shows all of the functions that are associated with the
measurement routine and how to access them. Figure 26 references
Figure 27 for the measurement sequence as shown on page 31.
To start the measurement process, follow the steps below:
1. Select Measurement Mode & Core Diameter Size
a. From the main menu (Figure 4), enter into the Setup menu.
b. Select Mode and select the preferred mode of measurement.
c. Select Core diameter then choose the core diameter size. Select “None” if you
wish to measure rock samples.
d. Select “Back to menu” to go back to main menu
2. Select Measure
Ensure the meter is on the start measure screen that is displayed in Figure 21. Before proceeding
with the measurements, ensure that the meter is position in a free air space void of all metallic
objects.
Step 1: With the KT-10 v2 in free air, use SBP▲ to start the measurement process.
After about 1 second you will hear a short sound indicating the free air
measurements are complete.
Step 2: Immediately place the KT-10 v2 on the sample’s surface then use SBP▲.
When the reading on the sample is complete you will hear a sound; this sound is
different then the one heard during the free air measurements.
Step 3: Then immediately position the KT-10 v2 in free air once again for the final free
air measurements. Wait for the final sound, which will be the same as the first
tone heard in Step 1. This sound will indicate the final free air measurements are
complete and the reading(s) will be displayed on screen.
Note: A button icon will appear in the notification area confirming a button press.
Tip: To repeat the measurement process without saving the results, position the
unit in free air and go directly to Step 1.
26

With PIN
PIN Installation:
Remove the thread protection screw from head of the KT-10 v2. Install the PIN in the
place of the thread protection screw. Ensure that the PIN is threaded all the way into the
housing. Remember to enable the PIN mode in the Setup menu.
Step 1: With the KT-10 v2 in Free Air, use SBP▲ to start the measurement process.
After about 1 second you will hear a short sound indicating the free air
measurements are complete.
Step 2: Immediately place the KT-10 v2 on the sample’s surface keeping the coil parallel
to the sample then use SBP▲ . When the reading on the sample is complete you
will hear a sound; this sound is different then the one heard during the
free air measurements.
Step 3: Then immediately position the KT-10 v2 in free air once again for the final free
air measurements. Wait for the final sound, which will be the same as the first
tone heard in Step 1. This sound will indicate the final free air measurements are
complete and the reading(s) will be displayed on screen.
3.4.2 Store a reading
To store the reading, there are two different options available; quick save and save
with a voice note.
Quick Save: With the results displayed on screen, you can quickly store the
reading by using LBP▲.
Save with voice note: To store the reading with an optional voice record use LBP▼.
This will invoke the voice recorder and the screen shown in Figure
22 will be displayed. Position the KT-10 v2 about 10 cm from
your mouth and speak at a normal volume. You can end the voice
record by using either SBP▼ or SBP▲ or, by allowing the time
to elapse (45 seconds).
27
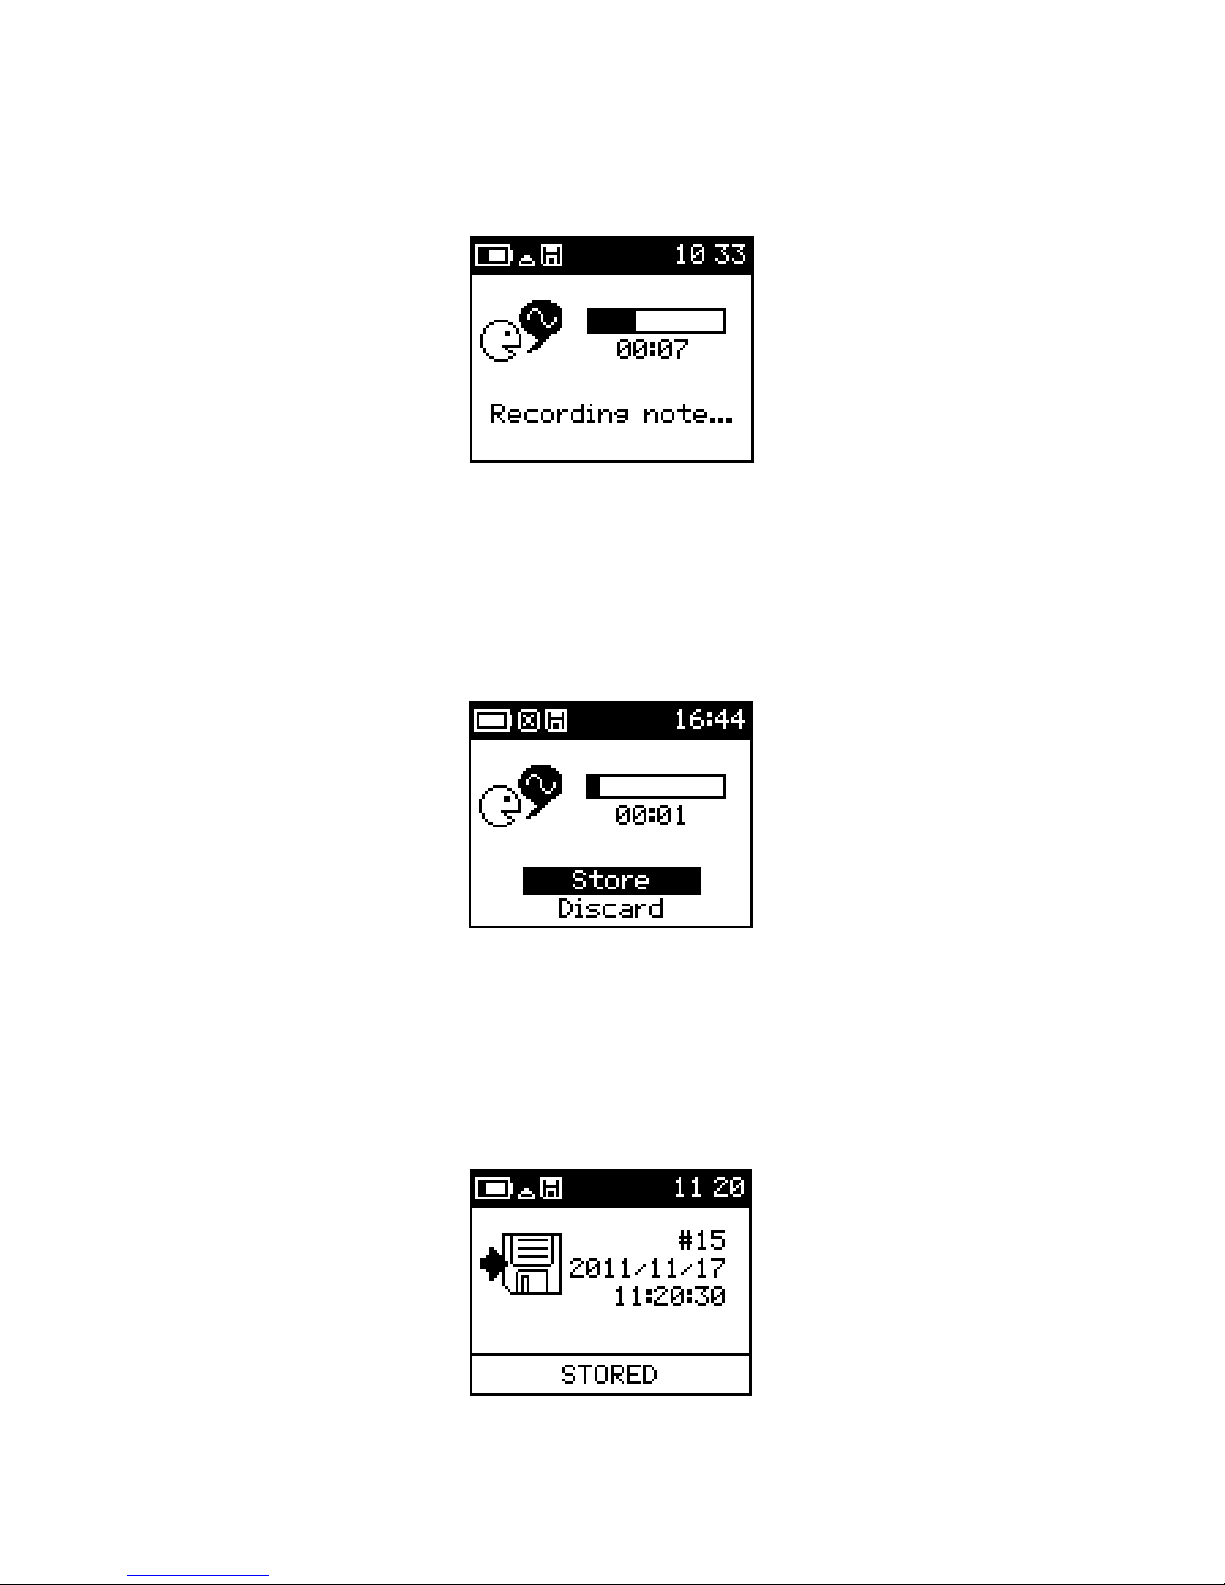
Figure 22: Voice Record
Once the recording has ended, it will be replayed if the KT-10 v2 has been enabled to do
so; this will allow its contents to be confirmed. User can then store or discard the voice
note.
Figure 23: Store voice record
When a reading is stored, by either method, a confirm
ation will be displayed. It will
show the record number, date and time along with any GPS positions available (if the
optional Bluetooth GPS is enabled).
28
Figure 24: Record Saved
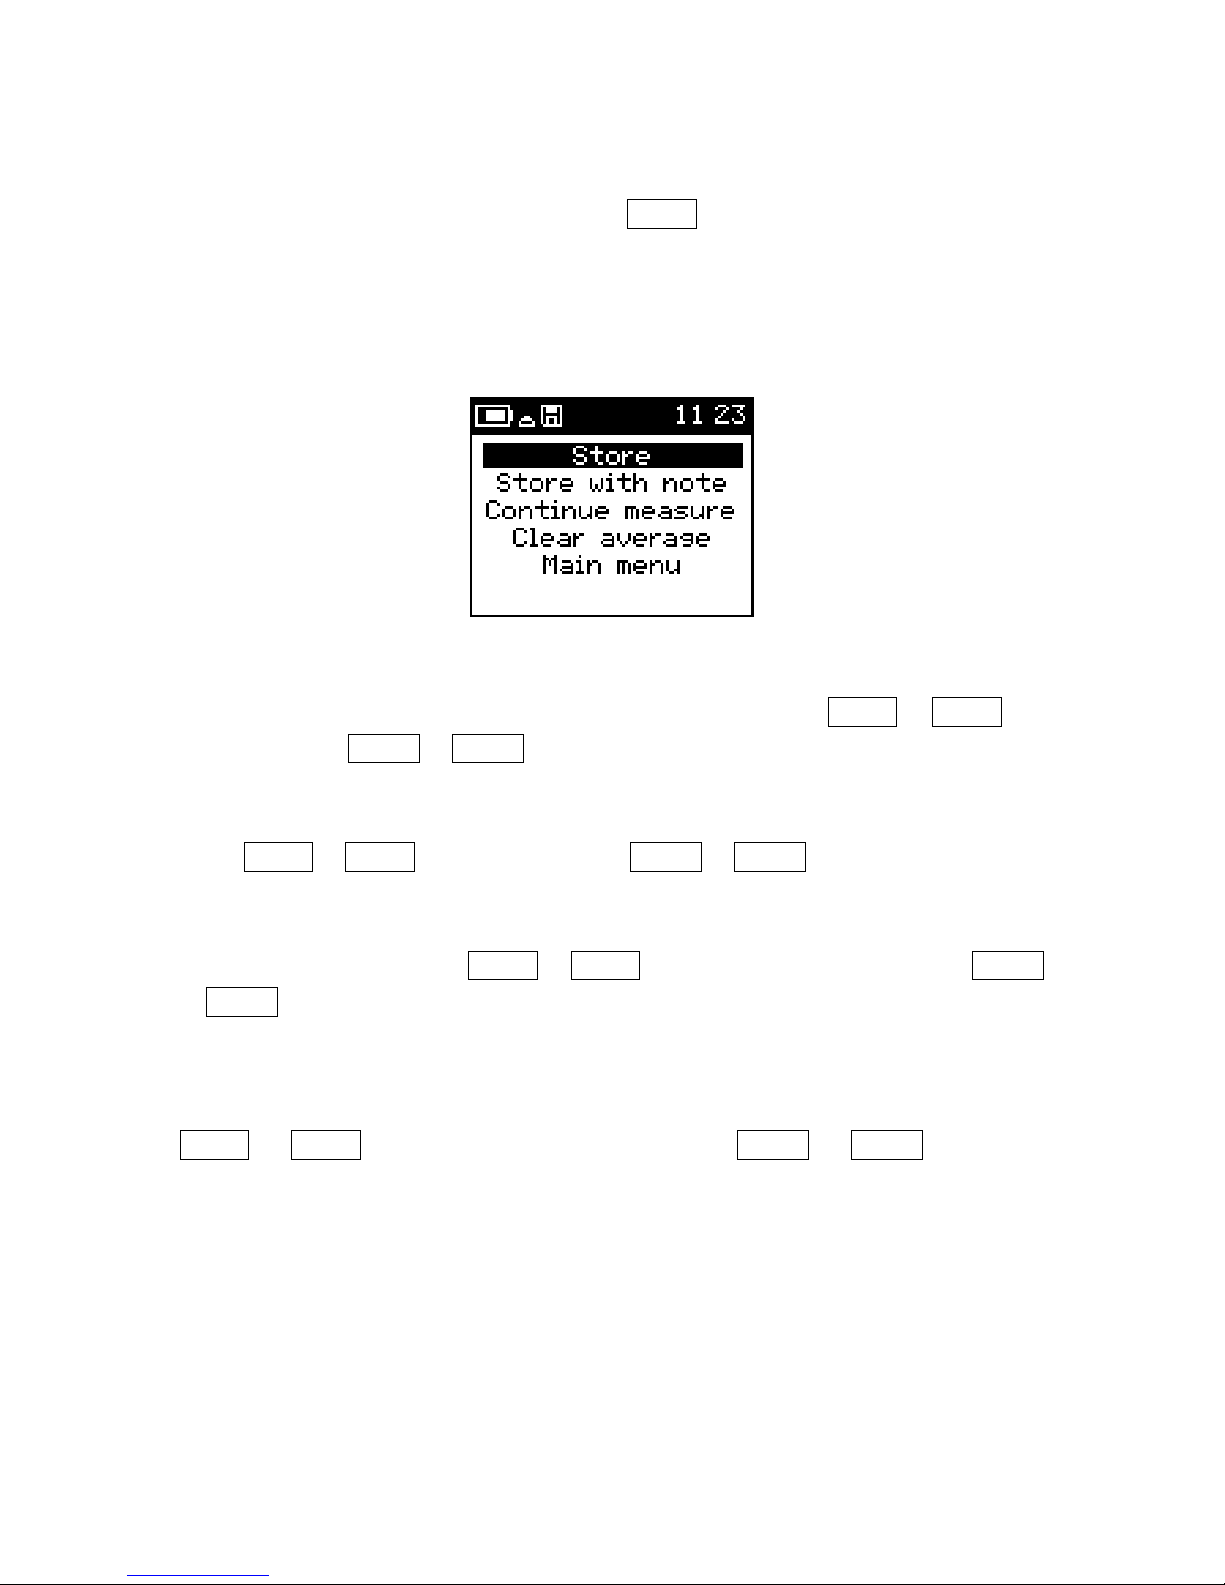
3.4.3 Measurement Sub Menu
The measurement menu can be accessed with SBP▼ only when the results are displayed
on the screen (shown in Figure 25). This menu allows for storing of the reading, storing
of the reading with a voice record, returning to the measure routine, disabling the GPS
positions when GPS is enabled, clearing of the average buffer or returning to the main
menu.
Figure 25: Measure Menu
To store the reading, navigate to the Store option with the use of SBP▼ or SBP▲ and
select it by using LBP▼ or LBP▲ when it is highlighted.
To store the reading with a voice record, navigate to the Store with note option with the
use of SBP▼ or SBP▲ and select it by using LBP▼ or LBP▲ when it is highlighted.
Selecting Continue measure will return the display to the results page. This is
accomplished with the use of SBP▼ or SBP▲ to highlight the selection and use LBP▼
or LBP▲ to select it.
Disable GPS will remove the GPS positions from the data set. However, the meter will
remain paired to the Bluetooth GPS. Highlight this option by moving the cursor with
SBP▼ or SBP▲ and once highlighted select it with LBP▼ or LBP▲. When you
return to the measurement menu after you Disable GPS, the menu will show Enable
GPS. Selecting Enable GPS will enable the GPS positions in the data again.
Clear average is selected to clear the averaging buffer. Each reading that has been saved
is used to calculate the average and standard deviation of the stored readings. The
averaged values and standard deviations are stored along with the readings for later
retrieval. Clearing the average will enable the user to select which set of readings will be
averaged together.
29
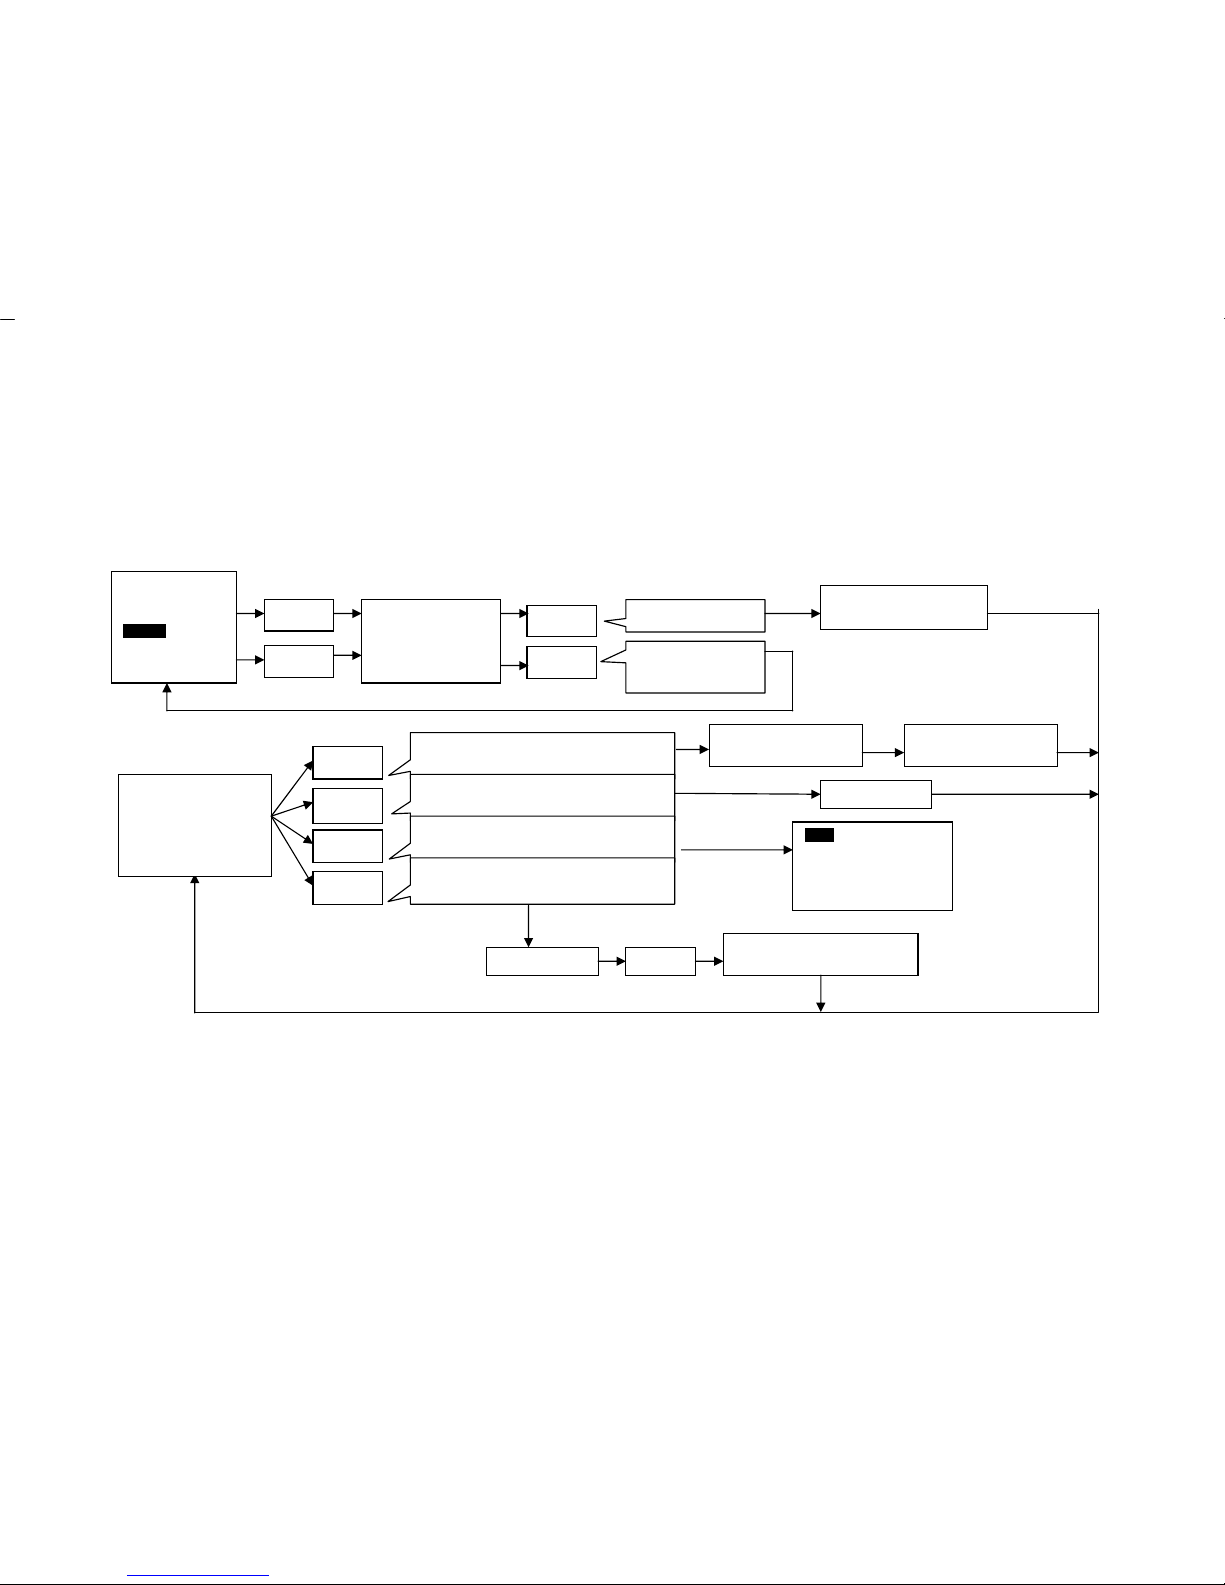
3.4.4 Measure Flow Chart
MAIN MENU
Setup
Measure
Scanner
Shutdown
SBP▲
SBP▼
Start Measurement
Return to Main
Menu
Measure Sequence
(Figure 27)
_ _ _ _ _ _
Start Measure
45.61 10
-3
SI
Ø 1= 56.21 ± 0.04
SBP▼
SBP▲
LBP▲
LBP▼
Start Measurement without Storing Readings
Store Current Values
Measure Menu
Start Voice Recording
Measure Core
Sequence (Figure 20)
Back to Measurement
Screen
Data Stored
Store
Store with Note
Continue Measure
Clear Average
Main Menu
Recording On
SBP▼
RECORDING OFF
AUTO REPLAY
LBP▲
LBP▼
Figure 26:
Measurement Flow
30
 Loading...