

Page 1
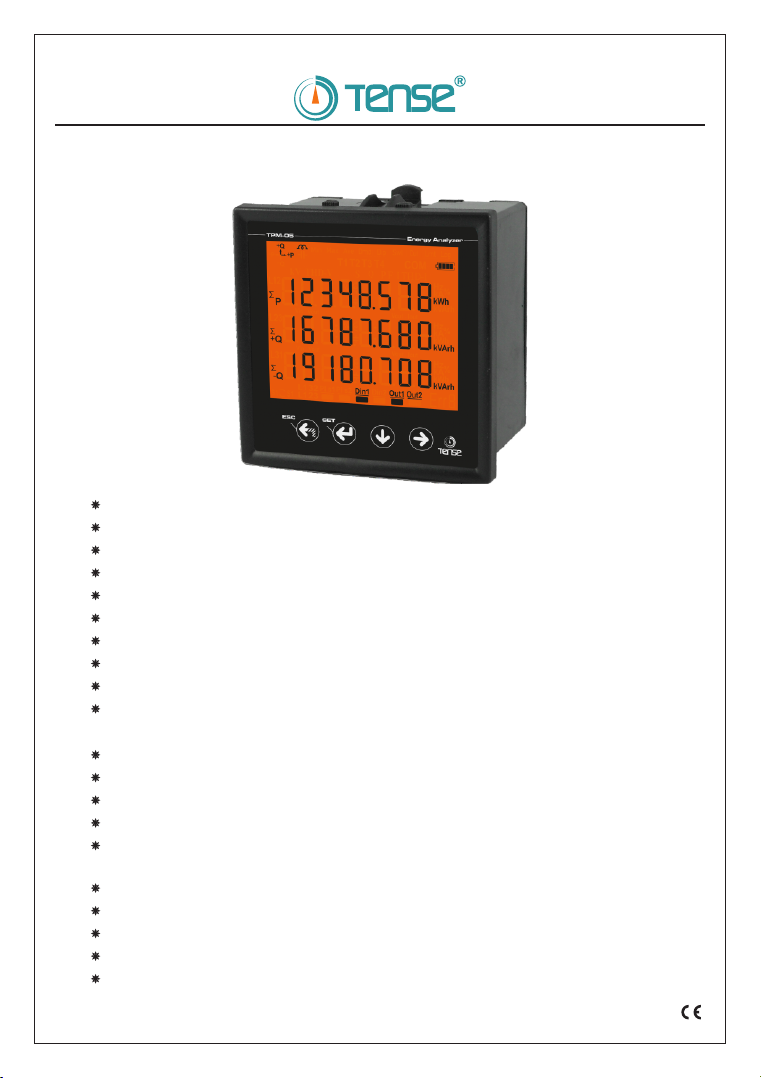
TPM-05
USER MANUAL
Measures up to voltage harmonics 55th (L-N and L-L).
Measures up to current harmonics 55th.
3P3W supports 3P4W connections.
RS485 Modbus RTU.
71.5 x 61.5 Custom Design Glass LCD.
It shows the powers of each phase and total active (P1, P2, P3, PΣ).
It shows the powers of each phase and total reactive (Q1, Q2, Q3, QΣ inductive or capacitive).
It shows the powers of each phase and total apparent (S1, S2, S3, SΣ).
It shows power factors (PF) and cosΣ values of each phases.
It shows the minimum, maximum and average values of the phase-to-phase and
Phase-neutral voltages (V)
It shows the values of each phase and total current (I1, I2, I3, IΣ).
It shows total import and export active (ΣkWh) energy.
It shows total inductive and capacitive reactive (ΣkVArh) energy.
2 relay outputs (adjustable), 1 Digital Input
Event logs (high voltage, low voltage, power interruption, voltage irregularity, high current,
current irregularity, THDV and THDI limits).
The date and time can be set.
Real time clock.
It shows demands.
You can delete energies, demand, and event logs.
The menu is password protected.
Tense Electric Electronics
MADE IN TURKEY
Document Number: DK-070-1
Page 2
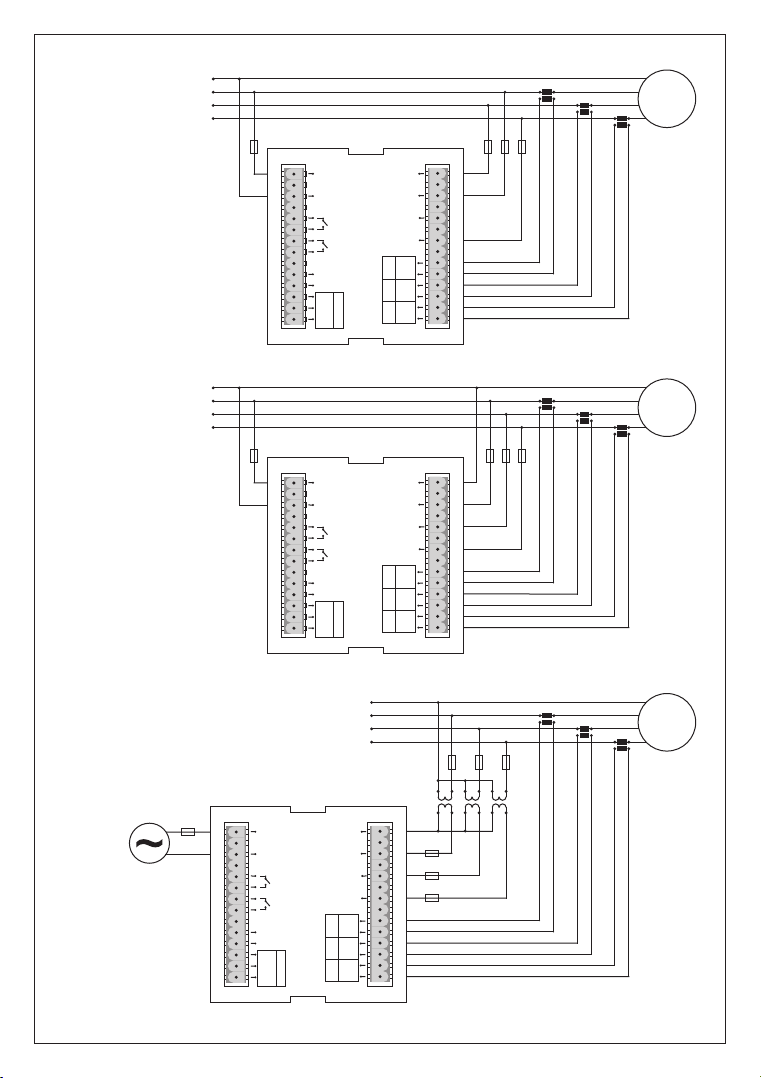
1 - Connection Schemes:
Figure-1: Connection Type
of 3P3W: 3 Phase current and
3 phase voltage. No neutrality.
N
L1
L2
L3
Ct1
P1
P2
Ct2
S1
S2
P1
P2
Load
Ct3
S1
S2
P1
P2
S1
S2
A1
A2
DIN+
DINGND
A
B
Figure-1
Out1
Out2
RS485 RS485
I1I1
I2I2
Max. 5A ACMax. 5A AC
I3I3
N
15
16
17
L1
18
19
L2
20
21
L3
22
k1
23
I1
24
k2
25
I2
26
k3
27
I3
28
2A
1
2
3
4
5
6
7
8
9
10
11
12
13
14
N
L1
L2
L3
2A
1
2
3
4
5
6
Figure-2: Connection Type of
3P4W: 3 Phase current and
3 phase voltage. Neutrality.
Figure-3: 3 Phase current and
3 phase voltage. Neutrality.
It is suitable for medium voltage with voltage transformer.
7
8
9
10
11
12
13
14
A1
A2
DIN+
DINGND
A
B
Figure-2
Out1
Out2
N
L1
L2
L3
Figure-3
2A
1
220V AC
50/60Hz.
A1
2
3
A2
4
5
Out1
6
7
Out2
8
9
10
DIN+
11
DIN-
12
GND
13
14
RS485
A
B
I1
I2
Max. 5A AC
I3
N
15
16
17
L1
18
19
L2
20
21
L3
22
k1
23
I1
24
k2
25
I2
26
k3
27
I3
28
Ct1
P1
P2
Ct2
S1
S2
P1
P2
Load
Ct3
S1
S2
P1
P2
S1
S2
N
15
16
17
L1
18
19
L2
20
21
L3
22
k1
23
I1
24
k2
25
I2
26
k3
27
I3
28
Ct1
P1
P2
Ct2
S1
S2
P1
P2
Load
Ct3
S1
S2
P1
P2
S1
S2
V.T.1
V.T.2
V.T.3
2A
-1-
Page 3

2 - Matters to be considered in current transformer selection and connection
Note that the value of current transformer is higher than the maximum current drawn from the system.
It is advisible that the class of the current transformer (it can be written class, klas, cl, kl)is 0.5 .
To avoid the complexity when connecting the current transformer output terminal use different colour
cables or give cable numbers.
Please spread the cables which are connected to current transformer output terminal from remote
high voltage lines.
Please fix current transformers to bara, cable or rail to avoid rattling .
3 - Warnings:
Please use the device properly according to our directions.
Please protect LCD screen from sun light
Please take 5cm space behind the device after the device installation
Please fix the device front cover panel with the apparatus that comes with it
Please not use device in the damp board
Please add a key or circuit breaker to assembly
Please keep key or circuit breaker close the device or in an easily accessible location by the operator
There should be no electricity in the connection cables when assembling device
There should be used shielded or twisted cord cable at the non-network-connected input and output
lines. These cables should not be passed near the high power lines and the device.
Assembling and electrical connections must be done by technical staff according to instruction manuel.
The feed cables should be suitable for IEC 60227 or IEC 60245 requirements.
4 - Device Maintenance :
Turn off energy of the device and disconnect from connections. Clean the device body by using slightly
moist or dry cloth. Do not use conductor or other chemical as a cleaning agent matter which is harmful to
device. Make connections after the cleaning of device and give energy to device and make sure that device
works properly.
5 - General:
Tpm-05 Energy analyzer measures load or voltage, current, cosφ, active power, reactive power , minimum
and maximum values of the load and also measures demands. It records the events. This analyzer
measures current harmonics and voltage harmonics up to 55. harmonics.
6 - First Operation of the Device:
Please read the warnings before powering the device. Make connections of the device according to the
connection scheme. When the device is first powered up figure-4 displayed on the screen. Firstly enter the
current transformer ratio from the settings menu and if the voltage transformer medium voltage is being
measured), enter the voltage transformer ratios.
-2-
Page 4
7- Introduction of Screen:
+Q
+P
-P
L1
Σ
L2
-Q
THD-V
Q
S
2
P
3
3
2
2
Σ
+Q
2
L3
1
Σ
-Q
Din1
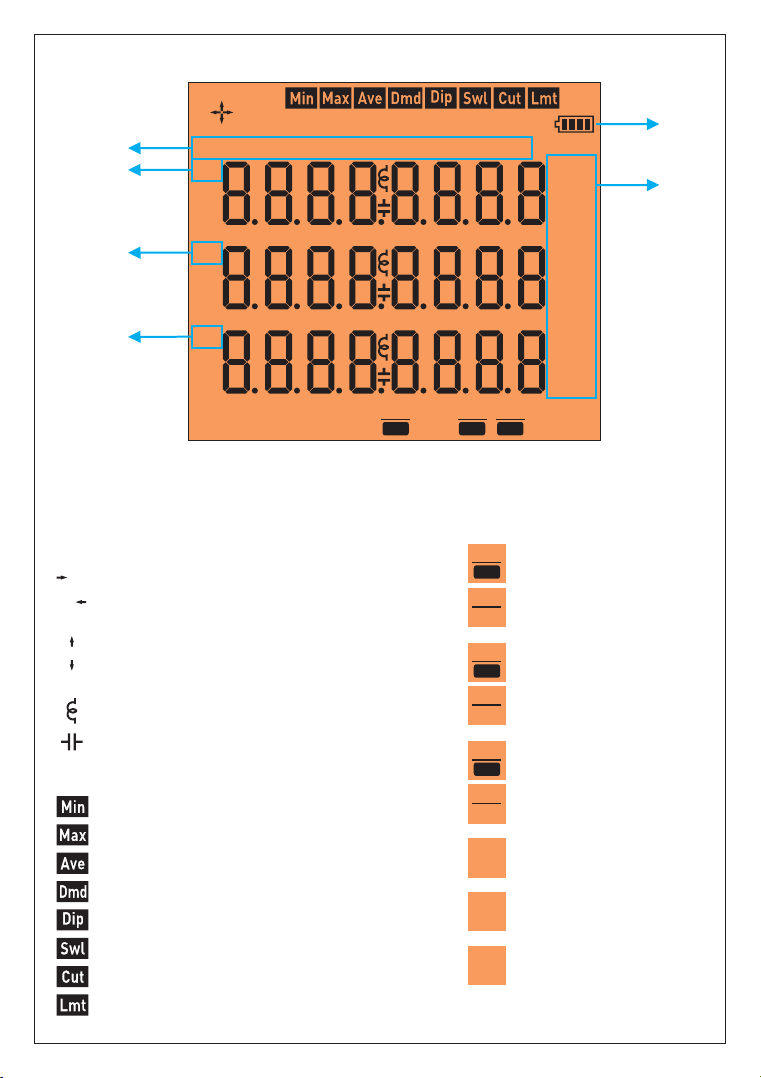
1 - Indicates the unit of the value.
2 - Indicates which phase the value belongs to .
3 - Indicates displayed values. V- voltage, I-current, F-frequency, S-apparent power, P- active power,
PF- power factor, THD-I- total current harmonics, THD-V- total voltage harmonics, Q-reactive power.
4 - Indicates battery level of clock time.
Specified that the indicated active energies are imported.
+P
Specified that the indicated active energies are exported.
-P
+Q
Specified that the indicated reactive energies are inductive.
Specified that the indicated reactive energies are capacitive.
-Q
Specified that the indicated reactive energies are inductive.
Specified that the indicated reactive power are capacitive.
Indicates that communication is done.
COM
Indicates that the values shown are minimum.
Indicates that the values shown are maximum.
Indicates that the values shown are average.
Indicates that the values shown are demand.
Indicates that the values shown are below 10%.
Indicates that the values shown are over 10%.
Indicates that the values shown are below 40%.
Indicates that the values shown are over 80% in current and over 20% in harmonics.
-3-
COM
I
THD-IPF
Out1
Din1
Din1
Out1
Out1
Out2
Out2
Σ
Σ
+Q
Σ
-Q
Hz
%
kA
kW h
VA rk h
Hz
%
kA
kW h
VA rk h
Hz
%
kA
kW h
VAk h
r
Out2
Din1: There is voltage(1)
Din1: There is no voltage(0)
Out1: Relay 1 is pulled
(short circuit)
Out1: Relay 1 is released
(open circuit)
Out2: Relay 2 is pulled
(short circuit)
Out2: Relay 2 is released
(open circuit)
Total active energy
P
Total inductive reactive energy
Total capacitive reactive energy
4
1
Page 5
8- Introduction of Buttons:
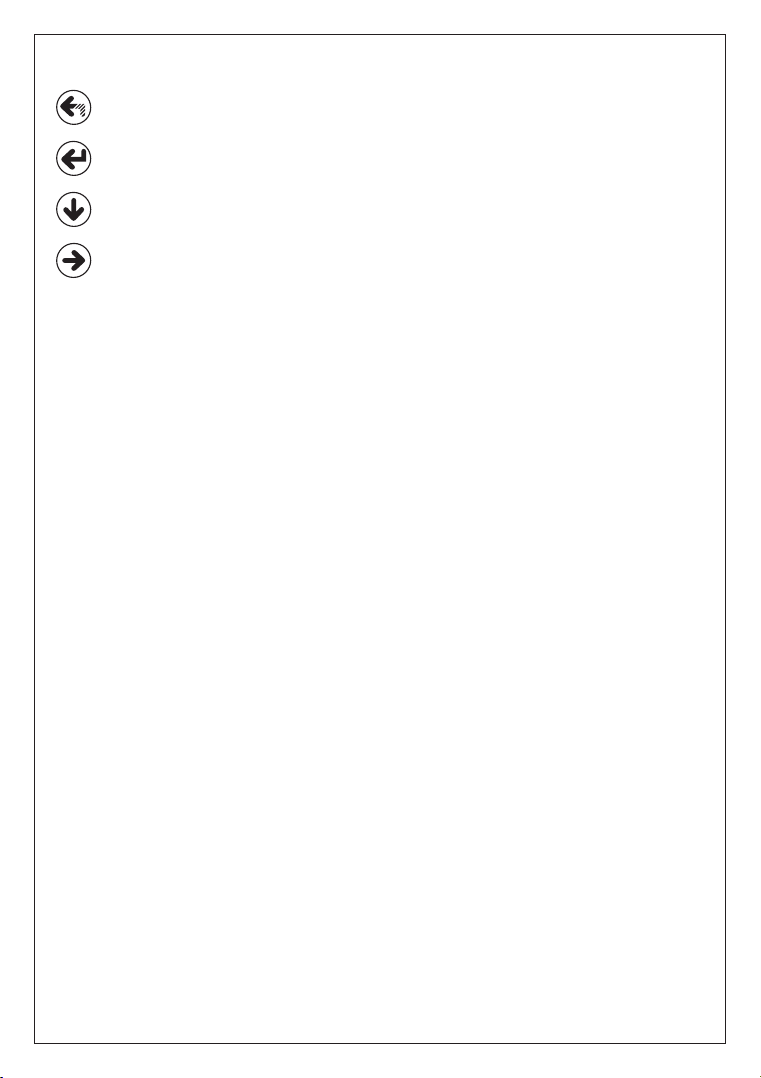
Press this button while in menu to exit the menu without saving the values.
ESC:
When this key is pressed while not in the menu, the screen always shows figure-4.
This button enters menu/parameter. It records the changes of parameters and remove from
SET:
parameter.
This button enables to fast progress between the values that are measured out of menu.
DOWN:
This button allows to progress by displaying the measured values outside the menu together
with the details. It allows navigation between parameters when pressed in menu.
RIGHT:
In the parameter, it allows to transition between steps and parameters.
-4-
Page 6
9 - Progress On Screen Information:
V
L1
L2
L3
Out1
Din1
Figure-4
V
L1
V
L2
V
L3
V
Out2
Out1
Out2
Din1
Figure-5
V
L1
V
L2
V
L3
V
Out1
Out2
Din1
Figure-6
V
L1
V
L2
V
L3
V
Out1
Out2
Din1
Figure-7
V
L1
V
V
V
Out1
Out2
Din1
Figure-8
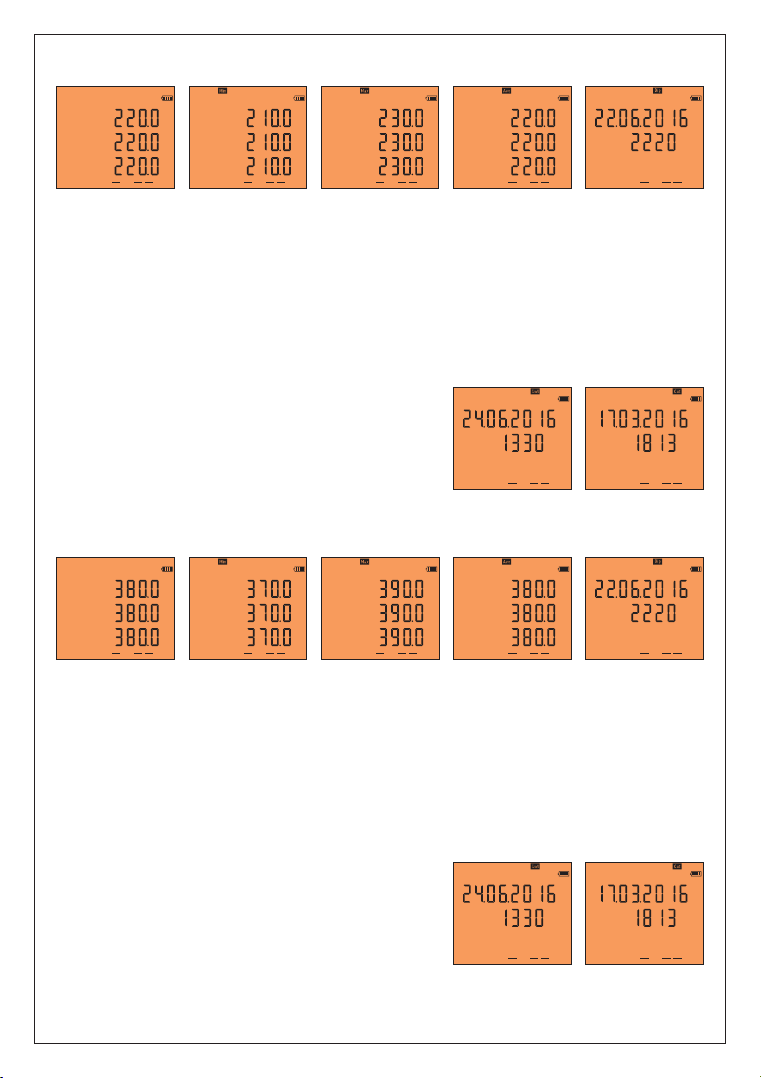
Figure-4: Indicates phase-neutral voltage. When you press right button, the figure-5 appears on the screen.
Figure-5: Indicates minimum(Min) voltage values of phase-neutral voltage. When you press right button,
the figure-6 appears on the screen.
Figure-6: Indicates maximum(Max) voltage values of phase-neutral voltage. When you press right button,
the figure-7 appears on the screen.
Figure-7: Indicates average(Ave) voltage values of phase-neutral voltage. When you press right button,
the figure-7 appears on the screen
Figure-8: Illustrates the date and time, in which phase-neutral voltage goes under 90% (<Vtr x 230 x 0.9)
of the nominal voltage values (lowest). When you press the right button, values belong to L2 and L3 phases
appear on the screen respectively. When you press right button, the figure-9 appears on the screen.
Figure-9: Illustrates the date and time, in which phase-neutral
voltage goes above 110% (<Vtr x 230 x 1.1) of the nominal voltage
values (swl). When you press the right button, values belong to L2
and L3 phases appear on the screen respectively. When you press
right button, the figure-10 appears on the screen.
Figure-10: Illustrates the recorded date and time, in which
phase-neutral voltage goes under 40% (<Vtr x 230 x 0.4) of the
nominal voltage values (cut), and a blackout occurs. When you press
the right button, values belong to L2 and L3 phases appear on the screen respectively.
When you press right button, the figure-11 appears on the screen.
L12
L23
L31
V
Figure-11
Out1
Din1
V
L12
V
L23
V
L31
V
Out2
Out1
Out2
Din1
Figure-12
V
L12
V
L23
V
L31
V
Out1
Out2
Din1
Figure-13
V
L1
Out1
Out2
Din1
Figure-9
V
L12
V
L23
V
L31
V
Out1
Out2
Din1
Figure-14
V
L1
Out1
Out2
Din1
Figure-10
V
L12
V
V
V
Out1
Out2
Din1
Figure-15
Figure-11: Shows the phase-phase voltage values. When you press right button, the figure-12 appears on the screen.
Figure-12: Shows the minimum(Min) values of the phase-phase voltage. When you press right button,
the figure-13 appears on the screen.
Figure-13: Shows the maximum(Max) values of the phase-phase voltage. When you press right button,
the figure-14 appears on the screen.
Figure-14: Shows the average(Ave) values of the phase-phase voltage. When you press right button,
the figure-15 appears on the screen.
Figure-15: Illustrates the date and time, in which phase-phase voltage goes under 90% (<Vtr x 230 x 0.9)
of the nominal voltage values (lowest). When you press the right button, values belong to L23 and L31
phases appear on the screen respectively. When you press right button, the figure-16 appears on the screen.
Figure-16: Illustrates the date and time, in which phase-phase
voltage goes above 110% (<Vtr x 230 x 1.1) of the nominal
V
L12
V
L12
voltage values (swl). When you press the right button, values
belong to L23 and L31 phases appear on the screen respectively.
When you press right button, the figure-17 appears on the screen.
Figure-17: Illustrates the recorded date and time, in which
phase-phase voltage goes under 40% (as a default) (<Vtr x 230 x 0.4)
Din1
Figure-16
Out1
Out2
Out1
Out2
Din1
Figure-17
of the nominal voltage values (cut), and a blackout occurs. When you press the right button, values belong to
L23 and L31 phases appear on the screen respectively. When you press right button, the figure-18 appears
on the screen.
-5-
Page 7
L1
L2
L3
I
L1
A
L2
A
L3
A
Out1
Out2
Din1
I
L1
A
L2
A
L3
A
Out1
Out2
Din1
I
L1
A
L2
A
L3
A
Out1
Out2
Din1
I
L1
A
L2
A
L3
A
Out1
Out2
Din1
I
Out1
Out2
Din1
Figure-18 Figure-19 Figure-20 Figure-21 Figure-22
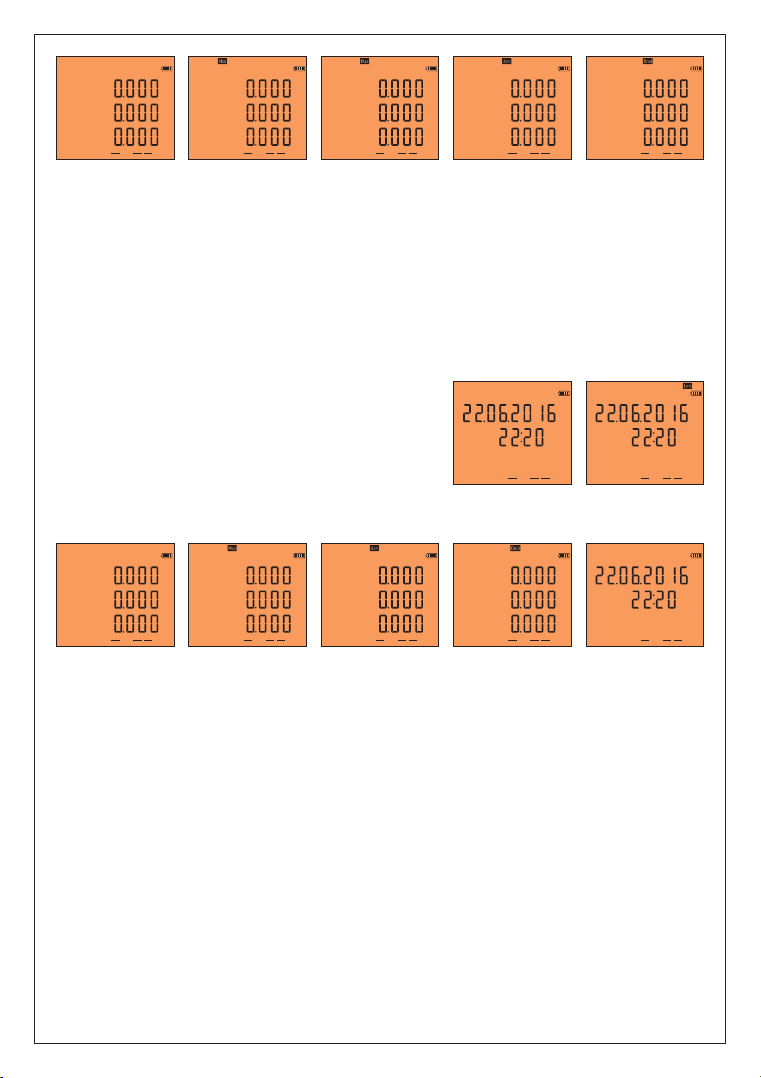
Figure-18: It shows current values of each phase. When you press the right key, figure-19 comes to
the screen.
Figure-19: It shows the minimum (Min) current values of each phase. When you press the right key,
figure-20 comes to the screen.
Figure-20: It shows the maximum (Max) current values of each phase. When you press the right key,
Figure-21 comes to the screen.
Figure-21: It shows the average (Ave) current values of each phase. When you press the right key,
Figure-22 comes to the screen.
Figure-22: It shows current demand (Dmd) values for each fuse. When you press the right key,
Figure-23 comes to the screen.
Figure-23: It shows the time and date of demands which
belongs to each phase. When you press the right key ,values
which belongs to the L2 and L3 comes to the screen
I
L1
L1
I
subsequently. When you press the right key, Figure-24 comes
to the screen.
Figure-24: It shows the time and date which current limit
(>Ctr x 0.80) of each phase is exceeded. When you press the
right key ,values which belongs to the L2 and L3 comes to the screen
Din1
Figure-23
Out1
Out2
Din1
Figure-24
Out1
Out2
subsequently. When you press the right key, Figure-25 comes to the screen.
A
A
A
L1
L2
L3
P
Din1
L1
kW
L2
kW
L3
kW
Out1
Out2
Figure-25 Figure-26 Figure-27 Figure-28
P
Din1
L1
kW
L2
kW
L3
kW
Out1
Out2
P
L1
kW
L2
kW
L3
kW
Out1
Out2
Din1
P
Din1
L1
kW
kW
kW
Out1
Out2
P
Out1
Out2
Din1
Figure-29
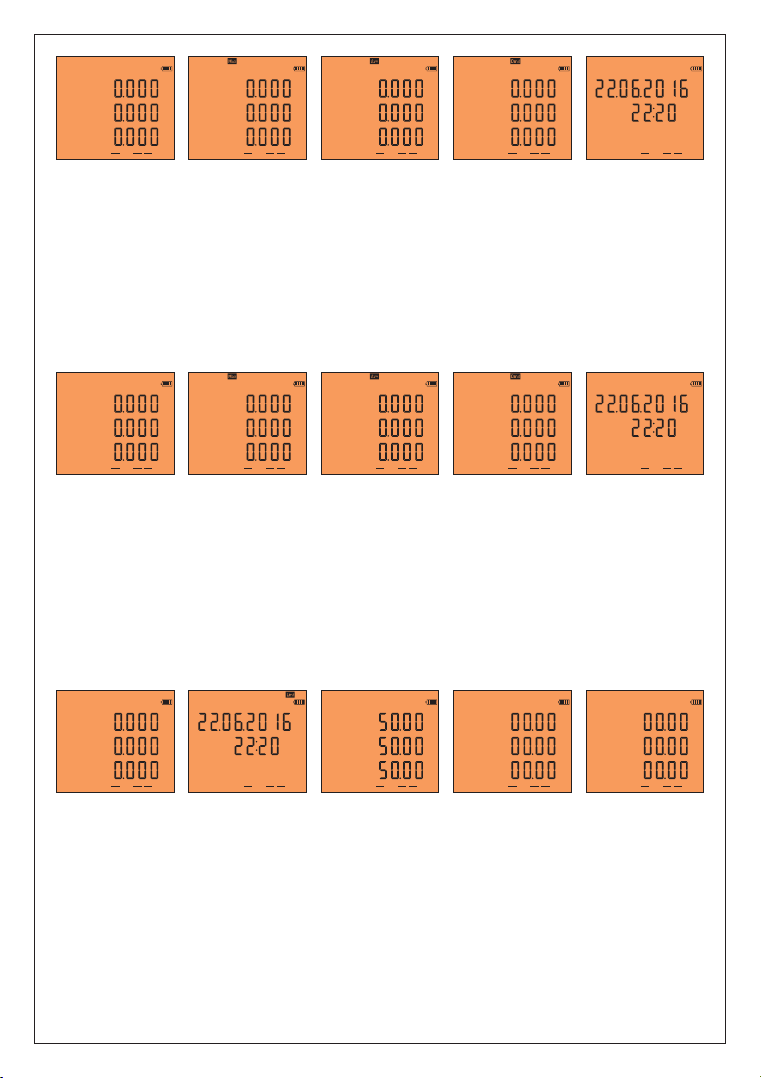
Figure-25: It shows the active power (P) values for each zone. When you press the right button, the screen
will show figure-26.
Figure-26: It shows the maximum active power (P) values for each zone. When you press the right key
figure-27 comes to the screen.
Figure-27: It shows average(Ave) active power(P) value of each phase. When you press the right key,
Figure-28 comes to the screen.
Figure-28: It shows the active power (P) demand (Dmd) values for each zone. When you press the right
key, Figure-29 comes to the screen.
Figure-29: It shows the time and date of active power(P) demands of each phase. When you press the
right key ,values which belongs to the L2 and L3 comes to the screen subsequently. When you press the
right key,Figure-30 comes to the screen.
-6-
Page 8
L1
L2
L3
Q
Din1
L1
kVAr
L2
kVAr
L3
kVAr
Out1
Out2
Q
Din1
L1
kVAr
L2
kVAr
L3
kVAr
Out1
Out2
Q
Din1
L1
kVAr
L2
kVAr
L3
kVAr
Out1
Out2
Q
Din1
L1
kVAr
kVAr
kVAr
Out1
Out2
Q
Out1
Out2
Din1
Figure-30 Figure-31 Figure-32 Figure-33 Figure-34
Figure-30: It shows the reactive power value(Q) which belongs to each phase. When the right button is
pressed; Figure-31 comes to the screen.
Figure-31: It shows the maximum reactive power value(Max)which belongs to each phase. When the right
button is pressed; Figure-32 comes to the screen.
Figure-32: It shows average(Ave) reactive power(Q) which belongs to each phase. When the right button
is pressed; Figure-33 comes to the screen.
Figure-33: It shows the demand(Dmd) of reactive power(Q) which belongs to each phase. When the right
button is pressed; Figure-34 comes to the screen.
Figure-34: It shows the dates and time values of the reactive power(Q)'s demand. When the right botton
is pressed values of L2 and L3 phases comes to the screen subsequently. When the right button is pressed;
Figure-35 comes to the screen.
S S S S S
L1
L2
L3
Din1
L1
Var
L2
Var
L3
Var
Out1
Out2
Din1
L1
Var
L2
Var
L3
Var
Out1
Out2
Din1
L1
Var
L2
Var
L3
Var
Out1
Out2
Din1
Figure-35 Figure-36 Figure-37 Figure-38
L1
Var
Var
Var
Out1
Out2
Out1
Out2
Din1
Figure-39
Figure-35: It shows apparent power (S)which belongs to each phase. When the right button is pressed;
Figure-36 comes to the screen.
Figure-36: It shows maximum(Max) apparent power(S) value which belongs to each phase. When the
right button is pressed; Figure-37 comes to the screen.
Figure-37: shows average(Ave) apparent power(S) which belongs to each phase. When the right button is
pressed; Figure-38 comes to the screen.
Figure-38: It shows the demand(Dmd) of apparent power(S) which belongs to each phase. When the right
button is pressed; Figure-39 comes to the screen.
Figure-39: It shows the dates and time values of the apparent power(S)'s demand. When the right button
is pressed; Figure-40 comes to the screen.
L1
L2
L3
Din1
Figure-40
PF
L1
Out1
Out2
PF
Din1
L1
L2
L3
Out1
Out2
F
Out1
Out2
Din1
THD-V
L1
Hz
L2
Hz
L3
Hz
Din1
L1
%
L2
%
L3
%
Out1
Out2
Figure-41 Figure-42 Figure-43 Figure-44
THD-I
%
%
%
Out1
Out2
Din1
Figure-40: It shows the power factor value(PF)Which belong to each phase. When the right button is
pressed; Figure-41 comes to the screen.
Figure-41: It shows time and dates of each phase when the power factor limit (<0.80) of each phase is
lowered(Lmt). When the right button is pressed values of L2 and L3 phases comes to the screen
subsequently. When the right button is pressed; Figure-42 comes to the screen.
Figure-42: It shows the frequency value of each phase. When the right button is pressed; Figure-43
comes to the screen.
Figure-43: It shows total harmonic distortion value(THD-V) which belongs to voltage of the phase. When
the right button is pressed; Figure-44 comes to the screen.
Figure-44: It shows total harmonic distortion value(THD-I)which belongs to current of the phase. When
the right button is pressed; Figure-45 comes to the screen.
-7-
Page 9
THD-V
L1
Din1
L1
Out1
Out2
THD-I
Out1
Out2
Din1
THD-V
L1
Din1
L1
%
%
%
Out1
Out2
THD-I
%
Σ
P
%
Σ
+Q
%
Σ
-Q
Out1
Out2
Din1
kWh
kVArh
kVArh
Out1
Out2
Din1
Figure-45 Figure-46 Figure-47 Figure-48 Figure-49
Figure-45: It shows the date and time of each phase exceeding (>%20) THD-V limit. When you press the
right button, the values of the L2 and L3 phases are displayed on the screen respectively. When the right
button is pressed; Figure-46 comes to the screen.
Figure-46: It shows the date and time of each phase exceeding (>%20) THD-I limit. When you press the
right button, the values of the L2 and L3 phases are displayed on the screen respectively. When the right
button is pressed; Figure-47 comes to the screen.
Figure-47: Voltage harmonics values of up to 55th harmonics are displayed on each screen, with 3 values
per screen. . When you press the right button, the values of the L2 and L3 phases are displayed on the
screen respectively. When the right button is pressed; Figure-48 comes to the screen.
Figure-48: Current harmonics values of up to 55th harmonics are displayed on each screen, with 3 values
per screen. When you press the right button, the values of the L2 and L3 phases are displayed on the screen
respectively. When the right button is pressed; Figure-49 comes to the screen.
Figure-49: It shows the import active, inductive reactive and capacitive reactive energy values which
belongs to total of the phase. When the right button is pressed; Figure-50 comes to the screen.
+P
L1
L2
L3
kWh
kWh
kWh
Out1
Out2
Din1
-P
L1
L2
L3
kWh
kWh
kWh
Out1
Out2
Din1
+Q
L1
L2
L3
kVArh
kVArh
kVArh
Out1
Out2
Din1
-Q
L1
L2
L3
kVArh
kVArh
kVArh
Out1
Out2
Din1
Figure-50 Figure-51 Figure-52 Figure-53
Figure-50: It shows the value of import active energy which belongs to each phase. When the right button
is pressed; Figure-51 comes to the screen.
Figure-51: It shows the value of export active energy which belongs to each phase. When the right button
is pressed; Figure-52 comes to the screen.
Figure-52: It shows the value of inductive reactive energy which belongs to each phase. When the right
button is pressed; Figure-53 comes to the screen.
Figure-53: It shows the value of capacitive reactive energy which belongs to each phase. When the right
button is pressed; Figure-54 comes to the screen.
V
%
%
%
Out1
Out2
Din1
Figure-54 Figure-55
I
%
%
%
Out1
Out2
Din1
Din1
Figure-56
Out1
Out2
Out1
Out2
Din1
Figure-57
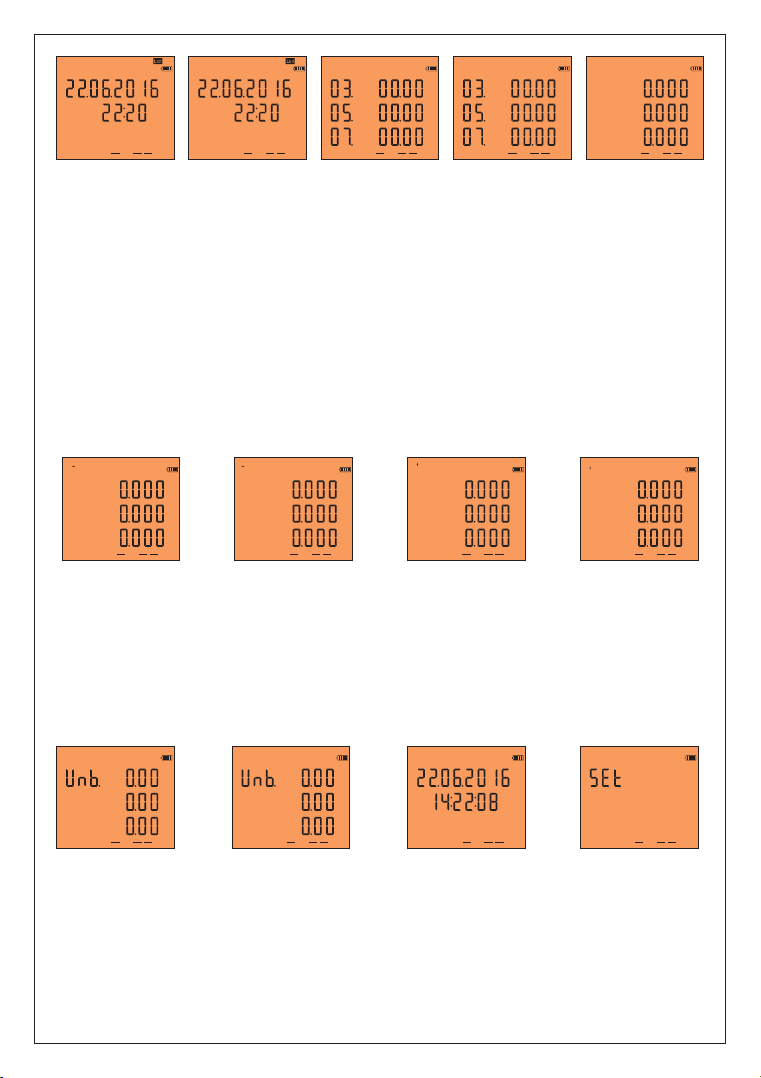
Figure-54: It shows the voltage irregularities of the phases with each other. When the right button is
pressed; Figure-55 comes to the screen.
Figure-55: It shows the current irregularities of the phases with each other. When the right button is
pressed; Figure-56 comes to the screen.
Figure-56: It shows the date and time. When the right button is pressed; Figure-57 comes to the screen.
Figure-57: It is used to make settings related to the device. When you press the right button, Figure-4
comes to the screen.
-8-
Page 10
10 - Fast Forwarding of Screen Information:
V
L1
L2
L3
Figure-4
Figure-57
Figure-56
V
V
V
V
Out1
Out2
Din1
L12
L23
L31
V
V
V
Out1
Out2
Din1
L1
L2
L3
Figure-11
Din1
Figure-18
I
A
A
A
Out1
Out2
L1
L2
L3
P
kW
kW
kW
Out1
Out2
Din1
Figure-25
When the device is energized, Figure-4 comes to the screen.
When you press the down key, Figure-11 comes to the screen.
When you press the down key, Figure-18 comes to the screen.
When you press the down key, Figure-25 comes to the screen.
When you press the down key, Figure-30 comes to the screen.
When you press the down key, Figure-35 comes to the screen.
When you press the down key, Figure-40 comes to the screen.
When you press the down key, Figure-42 comes to the screen.
L1
L2
L3
When you press the down key, Figure-43 comes to the screen.
When you press the down key, Figure-49 comes to the screen.
When you press the down key, Figure-54 comes to the screen.
Din1
When you press the down key, Figure-57 comes to the screen.
When you press the down key, Figure-56 comes to the screen.
Out1
Out2
When you press the down key, Figure-4 comes to the screen again.
L1
Figure-4: It shows the voltage values between phase-neutral.
Figure-11: It shows phase-to-phase voltage values.
L2
L3
Figure-18: It shows current values.
Figure-25: It shows Active power (P) values.
Figure-30: It shows Reactive power (Q) values.
Q
Out1
Din1
Figure-30
S
Out1
Din1
Figure-35
kVAr
kVAr
kVAr
Out2
Var
Var
Var
Out2
Figure-35: It shows Apparent power (S) values.
Figure-40: It shows Power factor (PF) values.
Figure-42: It shows the frequency values.
Out1
Din1
Figure-43: It shows Total voltage harmonic values.
Out2
Figure-49: It shows Total energy (active and reactive) values.
Figure-54: It shows Percentage of voltage imbalance.
Figure-56: It shows the date and time.
L1
L2
L3
Figure-57: It is used to enter the menu.
PF
Out1
Din1
Figure-40
Out2
V
Figure-54
THD-V
%
%
%
Out1
Out2
Din1
Σ
P
Σ
+Q
Σ
-Q
kWh
kVArh
kVArh
Out1
Out2
Din1
Figure-49
L1
L2
L3
Din1
Figure-43
%
%
%
Out1
Out2
L1
L2
L3
Din1
Figure-42
F
Hz
Hz
Hz
Out1
Out2
-9-
Page 11
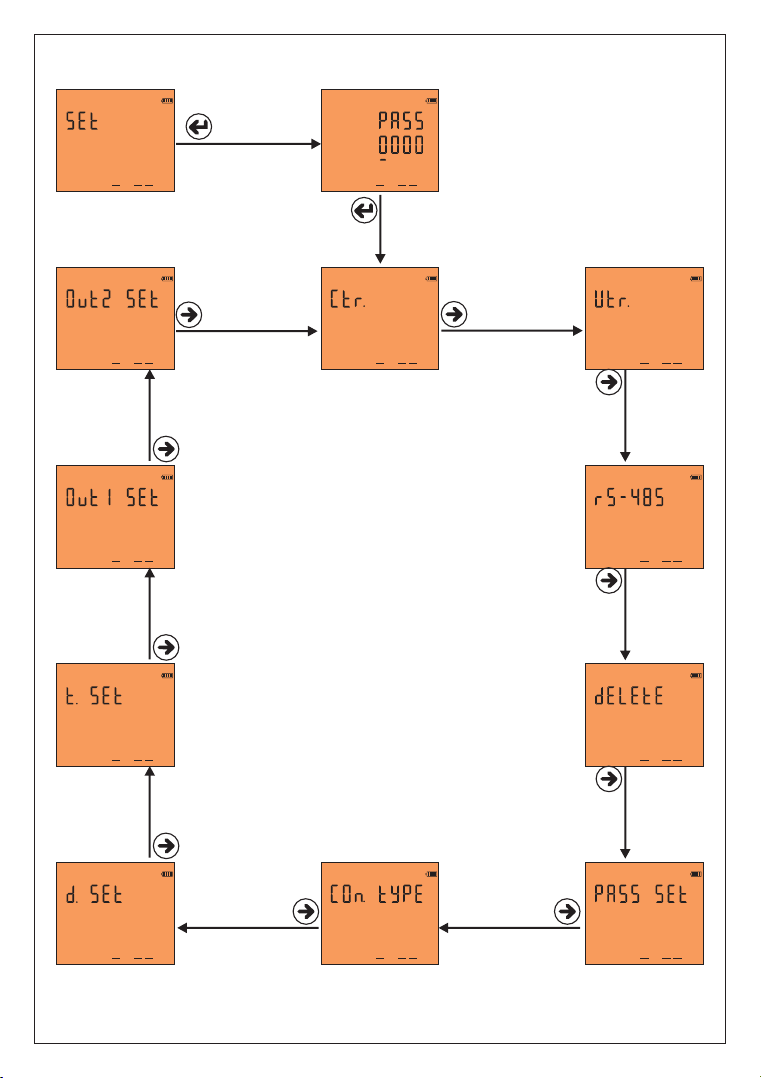
11 - Menu Structure:
Out1
Out2
Din1
Figure-57
Out1
Out2
Din1
Figure-68
Out1
Out2
Din1
Figure-67
Out1
Out2
Din1
Figure-66
Out1
Out2
Figure-58
Din1
Out1
Out2
Din1
Figure-59
When you press the set button while the figure-57 is on
screen, figure-58 password inquiry is displayed on the screen.
If a password has been created, enter the password and press
the set key.
If password is not created, when you press set key while
value is "0000", you can enter menu and Figure-59 comes to
the screen.
By pressing the right button in the menu, you can scroll
through the parameters. Press the set key to set the
parameters. Press the Esc key to exit the menu.
Figure-59: It is used to enter the current transformer ratio.
Figure-60: It is used to enter the voltage transformer ratio.
Figure-61: It is used to make communication settings.
Figure-62: It is used to delete Energy, Demand and Event
records.
Figure-63: It is used to set the password.
Figure-64: It is used to determine the connection type.
Figure-65: It is used to set the date.
Figure-66: It is used to set the time.
Figure-67: It is used to assign Relay 1.
Figure-68: It is used to assign Relay 2.
Out1
Din1
Figure-60
Out1
Din1
Figure-61
Out1
Din1
Figure-62
Out2
Out2
Out2
Din1
Figure-65
Out1
Out1
Out1
Out2
Out2
Din1
Figure-64
Din1
Figure-63
Out2
-10-
Page 12
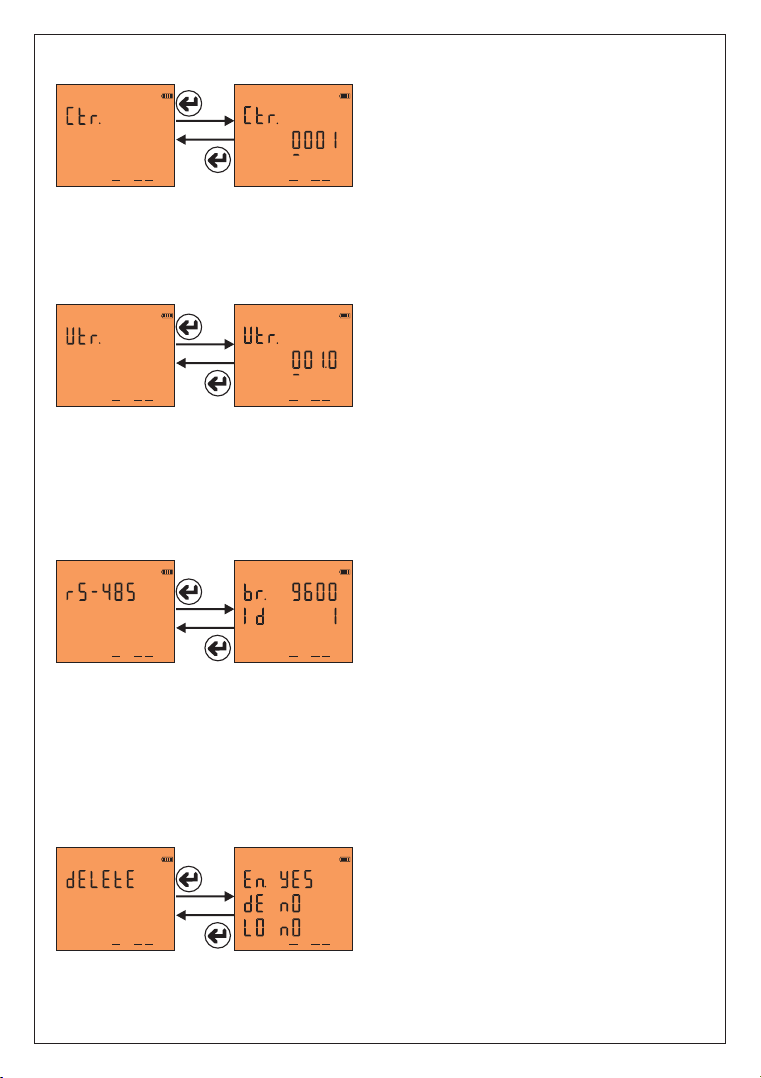
11.1 - Setting the Current Transformer Ratio:
To change the current transformer ratio, press the set
button while the figure-58 is on the screen. Figure-69
comes to the screen. Press right button to move between
digits. Press the down key to change the value of the digit.
You can change the digit value which is the underline.
Out1
Out2
Din1
Din1
Figure-69Figure-59
When you press the set button after entering the ratio,
Out1
Out2
the current transformer ratio is recorded and the screen
shows figure-59. You can scroll through the parameters
in the menu by pressing the right button or you can exit the menu by pressing the Esc key.
Example: 100 / 5A current transformer ratio (multiplier value) is 20. The CTR value needs to be set to 0020.
11.2 - Changing Voltage Transformer Ratio:
To change the voltage transformer ratio, press the set
button while the figure-60 is on the screen. Figure-70
comes to the screen. Press right button to move between
digits. Press the down key to change the value of the digit.
You can change the digit value which is the underline.
Out1
Out2
Din1
Din1
Figure-70Figure-60
When you press the set button after entering the ratio,
Out1
Out2
the voltage transformer ratio is recorded and the screen
shows figure-60. You can scroll through the parameters
in the menu by pressing the right button or you can exit the menu by pressing the Esc key.
Example: Medium voltage (M.V.) = Enter the ratio of the voltage transformer that converts 34.500V to 110V.
The ratio (multiplier) is calculated as 34,500 / 110 = 313,6 voltage transformer ratio. The VTR value must be
set to 313.6.
11.3 - RS485 Remote Communication Settings
To change the RS-485 remote communication settings,
press the set button while figure-61 is on the screen.
Figure-71 comes to the screen. Two parameters can be
set here. Baudrate (br -communication speed) and
Modbus ID (Id - the number that identifies the device on
Din1
Figure-61
Out1
Out2
Din1
Figure-71
the RS 485 line). Press the right button to move the point
Out1
Out2
(.) to the parameter you want to set.
Then change the parameter value by pressing the down key. When you press the Set button, the changes
that you made are saved and Figure-61 comes to the screen. You can scroll through the parameters in the
menu by pressing the right button or you can exit the menu by pressing the Esc key.
Modbus ID (MBID) value; when more than one communication devices connect to a modem, Serial number
or ModBus address must be different. In such cases, enter a different value from other devices.
Baudrate(br): 1200 - 115200 bps, ModBus ID(Id): 1 - 247 Stop bits: 1, Party : none.
11.4 - Deleting Energy, Demand and Event Records:
To delete the records, press the set key while the
screen is shown. Figure-71 comes to the screen. You can
delete 3 records here. Energy (En), Demand (dE) and
Event logs (LE). Press the right key to move the point (.)
to the record which you want to delete. Then press the
Din1
Figure-62
Out1
Out2
Din1
Figure-72
down key to change the value to "yes". The record value
Out1
Out2
which you do not want to delete must remain in "no".
When you press the Set key, only records with the value "yes" will be deleted and the Figure-62 comes to
the screen. You can scroll through the parameters in the menu by pressing the right button or you can exit
the menu by pressing the Esc key.
-11-
Page 13
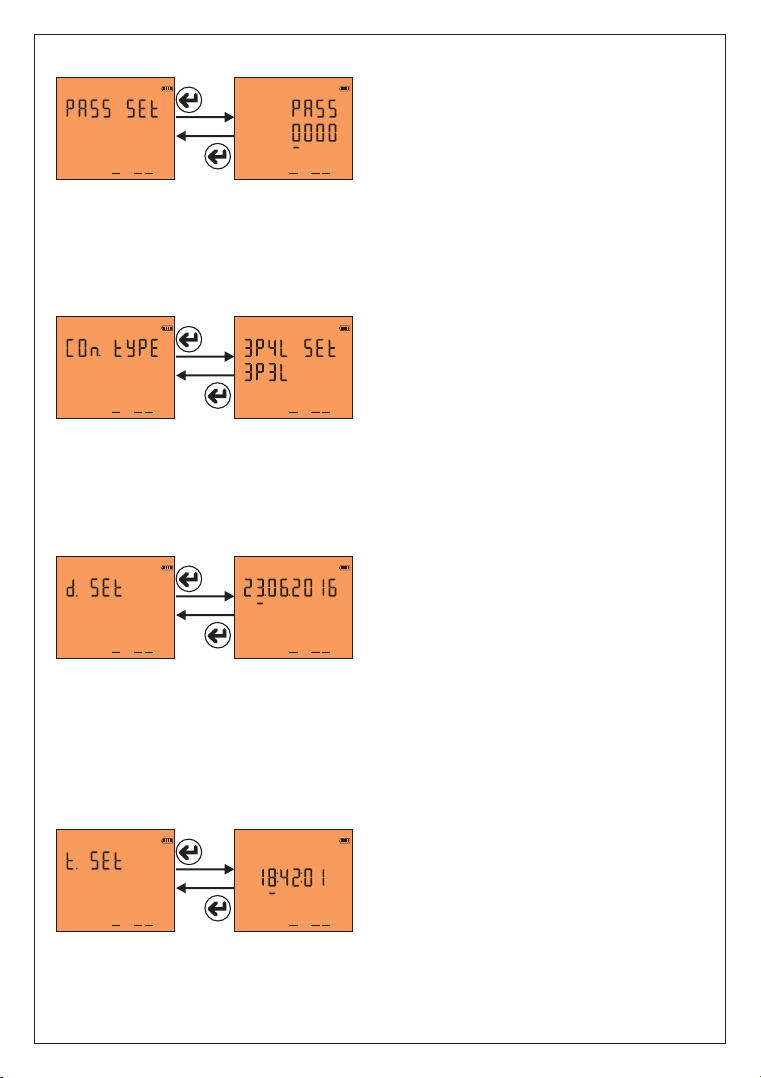
11.5 - Enter Password Value:
In order to change password; press set button while
Figure-63 is on the screen . The Figure-73 comes to the
screen. In order to pass through steps; press the button
on the right. In order to change the value of the step press
the ''down'' button. You can change the step value with
Din1
Figure-63
Out1
Out2
Din1
Figure-73
underline. If you press the set key after entering the
Out1
Out2
password, the password is saved and the screen comes in
figure-63. Pressing the right key ;you can pass through the parameters in the menu or pressing ''Esc'' key;
you can quit the menu.
11.6 - Changing the Connection Type:
In order to change the connection type; press ''Set'' key
while the Figure-64 is on the screen. Figure-74 comes to
the screen. It supports two types of connection like 3P4L
(3 phase current 3 phase voltage neutral)and 3P3L
(3 Phase current 3 phase voltage without neutral).
Din1
Figure-64
Out1
Out2
Din1
Figure-74
The link that says "Set" is acceptable. Press the right key
Out1
Out2
to change the connection type. After the connection type
is selected, When you press the key, it is saved and the screen comes in figure-64. Pressing the right key;
you can pass through the parameters in the menu or pressing ''Esc'' key; you can quit the menu.
11.7 - Setting the Date:
In order to change the date, press the ''Set'' key while
the Figure-65 is on the screen. The screen comes in
figure-75. Underline is on the step which ındicate the day.
In order to change the day press the ''Down'' key. Then if
you press the key on the right ; underline comes down of
Din1
Figure-65
Out1
Out2
Din1
Figure-75
the mouth step. Press the ''Down'' key in order to change
Out1
Out2
the mouth. Then if you press the key on the right; the
underline comes down of the year step. Press the ''Down'' key in order to change the year. After the date is
updated, when you press the ''Set'' key ;it is recorded and Figure-65 comes to the screen. Pressing the right
key; you can pass through the parameters in the menu or pressing ''Esc'' key; you can quit the menu.
Date display is organized as day / month / year.
11.8 - Setting the Time:
In order to change the time; press the Set key while the
figure-66 is on the screen. The Figure-76 comes to the
screen; the underline is on the step which shows the
clock. Press the'' Down'' key in order to change the clock.
Then if you press the key on the right, the underline
Din1
Figure-66
Out1
Out2
Din1
Figure-76
comes down the step of second. Press ''down'' key to
Out1
Out2
change the second. After the clock, minute and second is
updated ,it is recorded when you press the ''Set'' key and figure-66 comes to the screen. Pressing the right
key;you can pass through the parameters in the menu or pressing ''Esc'' key; you can quit the menu.
Time display is organized as 24 hours.
-12-
Page 14
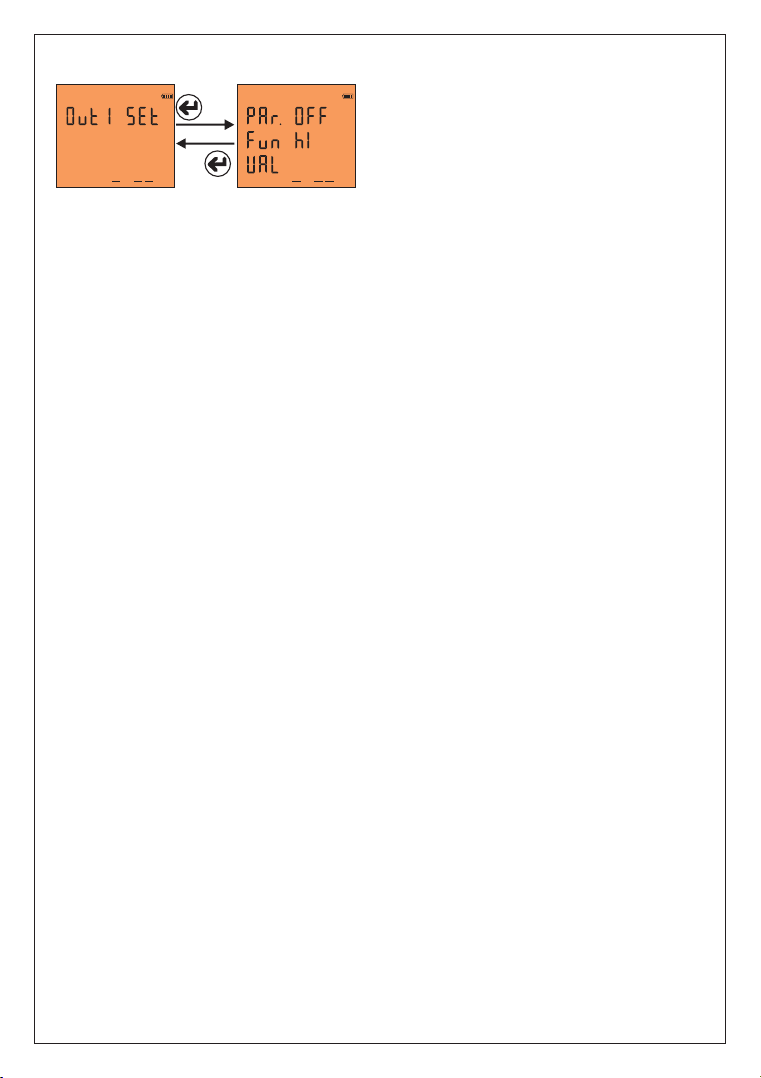
11.9 - Task Assignment to Relay 1 and Relay 2:
To assign the task to relay 1, press the set key, when
figure-77 is on the screen. There are 3 settings; these are
Parameter (PAr), Function (Valued) and Value (VAL).
Press the right key to move the point (.) to the parameter.
Press the down key to bring up the desired parameter.
Din1
Şekil-67
Out1
Out2
Din1
Şekil-77
Out2
function. Press the down key to set the function to low or
high set. Press the right key to move the point (.) value.
Then press the right key to move the point (.) to the
Out1
Press the down key to enter the desired value. Then when you press the set key, the task will be assigned to
relay 1 and Figure-67 comes to screen. You can scroll through the parameters in the menu by pressing the
right button or you can exit the menu by pressing the Esc key.
Parameters (PAr): Voltage ( ULn ), current ( ILn ), total current ( ILt ), total harmonic distortion belong to
Voltage ( thdV ), total harmonic distortion belong to Current ( thdI ), power factor ( PF ), voltage Unbalance
( U Un ), current Unbalance ( I Un ), digital input ( dI n ) and off ( OFF ).
Function (Fun): Functions to be applied for parameters: if greater than value ( hI ) and smaller
than value ( LO ).
Value(Val): The value to be set for the parameters.
Note1: The hysteresis value is fixed at 5%.
Note2: The task assignment of relay 2 is assigned in the same way as relay 1. While in menu for relay 2
assignment ,The enterance should be done from the figure-68.
Note3: To use the digital input parameter, 9V-24DC energy should be applied from the enterance of input
to the device. In these parameters if the relay is wanted to be pulled HI function; or if it is wanted to be
pulled while the energy is not available LO function should be chosen. The change of the voltage at the data
input should be minimum at one second(1Hz)
Example: When the voltage rises above 250V, switch on relay 1. Parameters (PAr)=ULn, function (fun)=hl
and value (VAL)=250V should be set. After the relay 1is set like that; if one of the voltage values rises above
250V;relay 1 pulls out(The contact leads become short-circuited) When the all values od voltage are below
%5 of 250V;the relay is deactivated (contact leads become open circuit)
-13-
Page 15
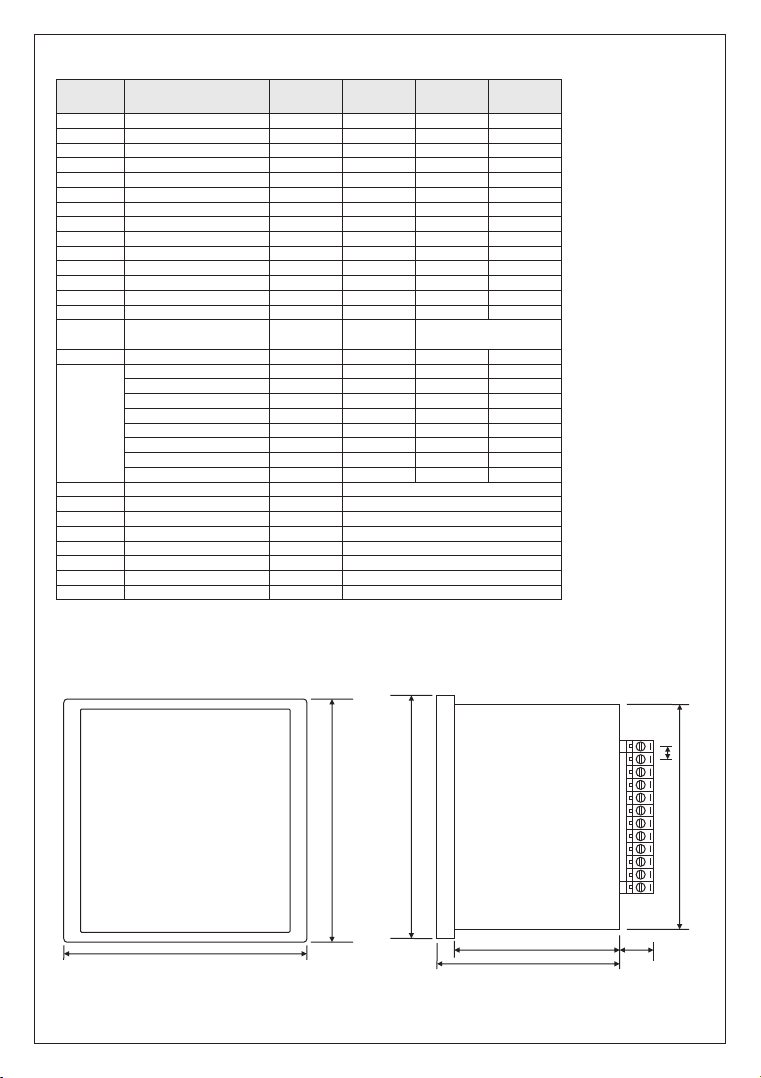
12 - Menu Values Table:
Parameter
Number
Ctr
Vtr
br
-
-
-
Id
En
dE
LO
PASS
Con Type
Date Set
Time Set
Par
Fun
UAL
Dip
Swl
Cut
Lmt I
Lmt Thd-V
Lmt Thd-I
Lmt PF
dI n
Parameter
Current Transformer Ratio
Voltage Transformer Ratio
Baudrate
Stop bits
Data bits
Parity
ModBus ID
Deleting Total Energy
Deleting Demand Values
Deleting Event Records
Password
Connection Type
Date
Hour
Parametre
Function
Uln (voltage)
Iln (Current)
Ilt (Total Current)
thdU (Total Voltage Har.)
thdl (Total Current Har.)
PF (Power Factor)
U Un (Voltage imbalance)
I Un (Current Imbalance)
Low Voltage
High voltage
No Voltage
Current Limit
Thd-V Limit
Thd-I Limit
Power Factor Limit
Data Input Frequency
Unit
-
-
bps
-
-
-
-
-
-
-
-
-
-
-
-
-
Volt
Amper
Amper
(ctrx3x10)/100 (ctrx3x10)/100
%
%
%
%
%
%
%
%
%
%
%
%
Hz.
Factory
Value
vtr x 10 vtr x 10 vtr x 500
(ctrx10)/100
Minimum
1
1.0
9600
1
8
none
1
No
No
No
0
3P4L
-
-
OFF
High
1
1
0.50
1
1
<Vtr x 230 x 0,90 ve <Vtr x 400 x 0,90
>Vtr x 230 x 1,10 ve >Vtr x 400 x 1,10
<Vtr x 230 x 0,40 ve <Vtr x 400 x 0,40
Value
thdI, PF, U Un, I Un, dI n
(ctrx10)/100 (ctrx500)/100
>Ctr x 0.80
Maximum
1
0.1
1200
-
-
1
Yes
Yes
Yes
0
3P4L
2000
-
OFF, Uln, Iln, Ilt, thdU,
High
(ctrx3x500)/100
1
1
0.50
1
1
>1.20
>1.20
<0.80
>1Hz.
115200
Value
5000
999.9
247
No
No
No
9999
3P3L
2100
Low
50
50
0.99
50
50
-
-
-
-
13- Dimensions:
97,5 mm
96,5 mm
-14-
96,5 mm
56,75 mm
65 mm
5,08 mm
89,5 mm
12mm
Page 16
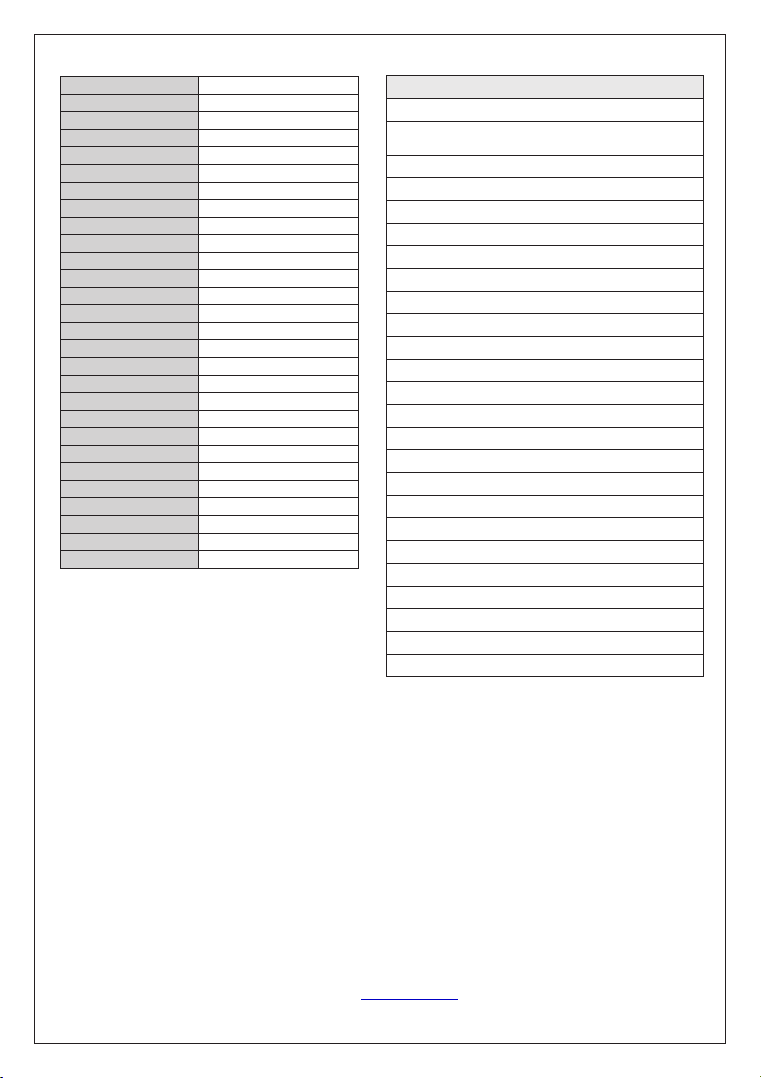
14 - Technical Specifications:
Operating Voltage
Operating Frequency
Operating Power
Operating Temperature
Input Voltage
Voltage Measuring Range
Input Current
Current Measuring Range
Voltage, Current Accuracy
Active Accuracy
Reactive Accuracy
Supported Connection
Current Transformer Ratio
Voltage Transformer Ratio
Harmonic Voltage
Harmonic Current
Real Time Clock
Communication
Display
Contact Output
Dijital Input
Weight
Protection Class
Panel Hole Measurements
Connection Type
Cable Diameter
Assembly
Working Altitude
85V - 300V AC
50 / 60 Hz
<10VA
-20ºC.....55ºC
5V -330V AC
1V - 600kV
1mA - 5,5A
1mA - 50.000A
%±0,2
%±0,5
%±1
3P3W, 3P4W
1....5000
1,0....4000
3 - 55
3 - 55
>5 year
RS485 MODBUS RTU
71.5x61.5mm Glass LCD
2A / 250V AC (Resistive Load)
9V - 24V DC
<300Gr.
IP40(Front Panel), IP00(Body)
91mm x 91mm
Plug-in Terminal Connection
1.5mm²
Assembly to panel front cover
<2000meter
15 - Contents:
1 - Connection Schemas:
2 - Matters to be considered in current transformer
selection and connection:
3 - Warnings:
4 - Device Maintenance:
5 - General:
6 - First Operation of the Device:
7 - Screen Presentation:
8 - Button Presentation:
9 - Progress on Screen Information:
10 - Fast Progress on Screen Infortmation:
11 - Menu Structure:
11.1 - Set up the Current Transformer Ratio :
11.2 - Change the Voltage Transformer Ratio:
11.3 - Remote Communication Settings of RS485:
11.4 - Delete Energy ,Demand and Event Records:
11.5 - Enter Password Value:
11.6 - Change Connection Type:
11.7 - Set Date:
11.8 - Set Clock:
11.9 - Task Relay1 and Relay2:
12 - Menu Values Table:
13 - Dimensions:
14 - Technical Features:
15 - Contents:
16 - Contact Information:
PageSubject:
1
2
2
2
2
2
3
4
5
9
10
11
11
11
11
12
12
12
12
13
14
14
15
15
15
16 - Contact Informations:
Merkez Mah. Akalar Sok. No:39A GAZİOSMANPAŞA / İSTANBUL / TÜRKİYE
Tel: +90212 578 04 38 - 48 Fax: +90212 578 04 36 Web: | Mail: [email protected]www.tense.com.tr
-15-
 Loading...