

Page 1

WL865E4-P GNU Debugger User Guide
1VV0301690 Rev 1 – 2020-11-03
Page 2

WL865E4-P GNU Debugger User Guide
1VV0301690 Rev 1 Page 2 of 27 2020-11-03
Table of Contents
1. Pre-requisites ............................................................................... 3
2. Download and Install Segger ........................................................ 3
3. GNU Debugger Requirements ...................................................... 4
4. Set path to JLink GDB Server ....................................................... 6
5. Hardware Setup to Connect J-Link Debugger ............................... 7
6. Build Project with DEBUG Mode Enabled Binary .......................... 8
7. Program the Module ..................................................................... 9
8. Run the Application ..................................................................... 10
9. Start Debug Session ................................................................... 11
10. Executing GDB Commands ........................................................ 12
Page 3

WL865E4-P GNU Debugger User Guide
1VV0301690 Rev 1 Page 3 of 27 2020-11-03
1. PRE-REQUISITES
• J-Link USB Hardware
• J-Link Segger USB driver software
• WL865E4-P Module
2. DOWNLOAD AND INSTALL SEGGER
J-Link JTAG: J-Link is an USB-based JTAG debugger used by flash and the debug
scripts are provided in the SDK.
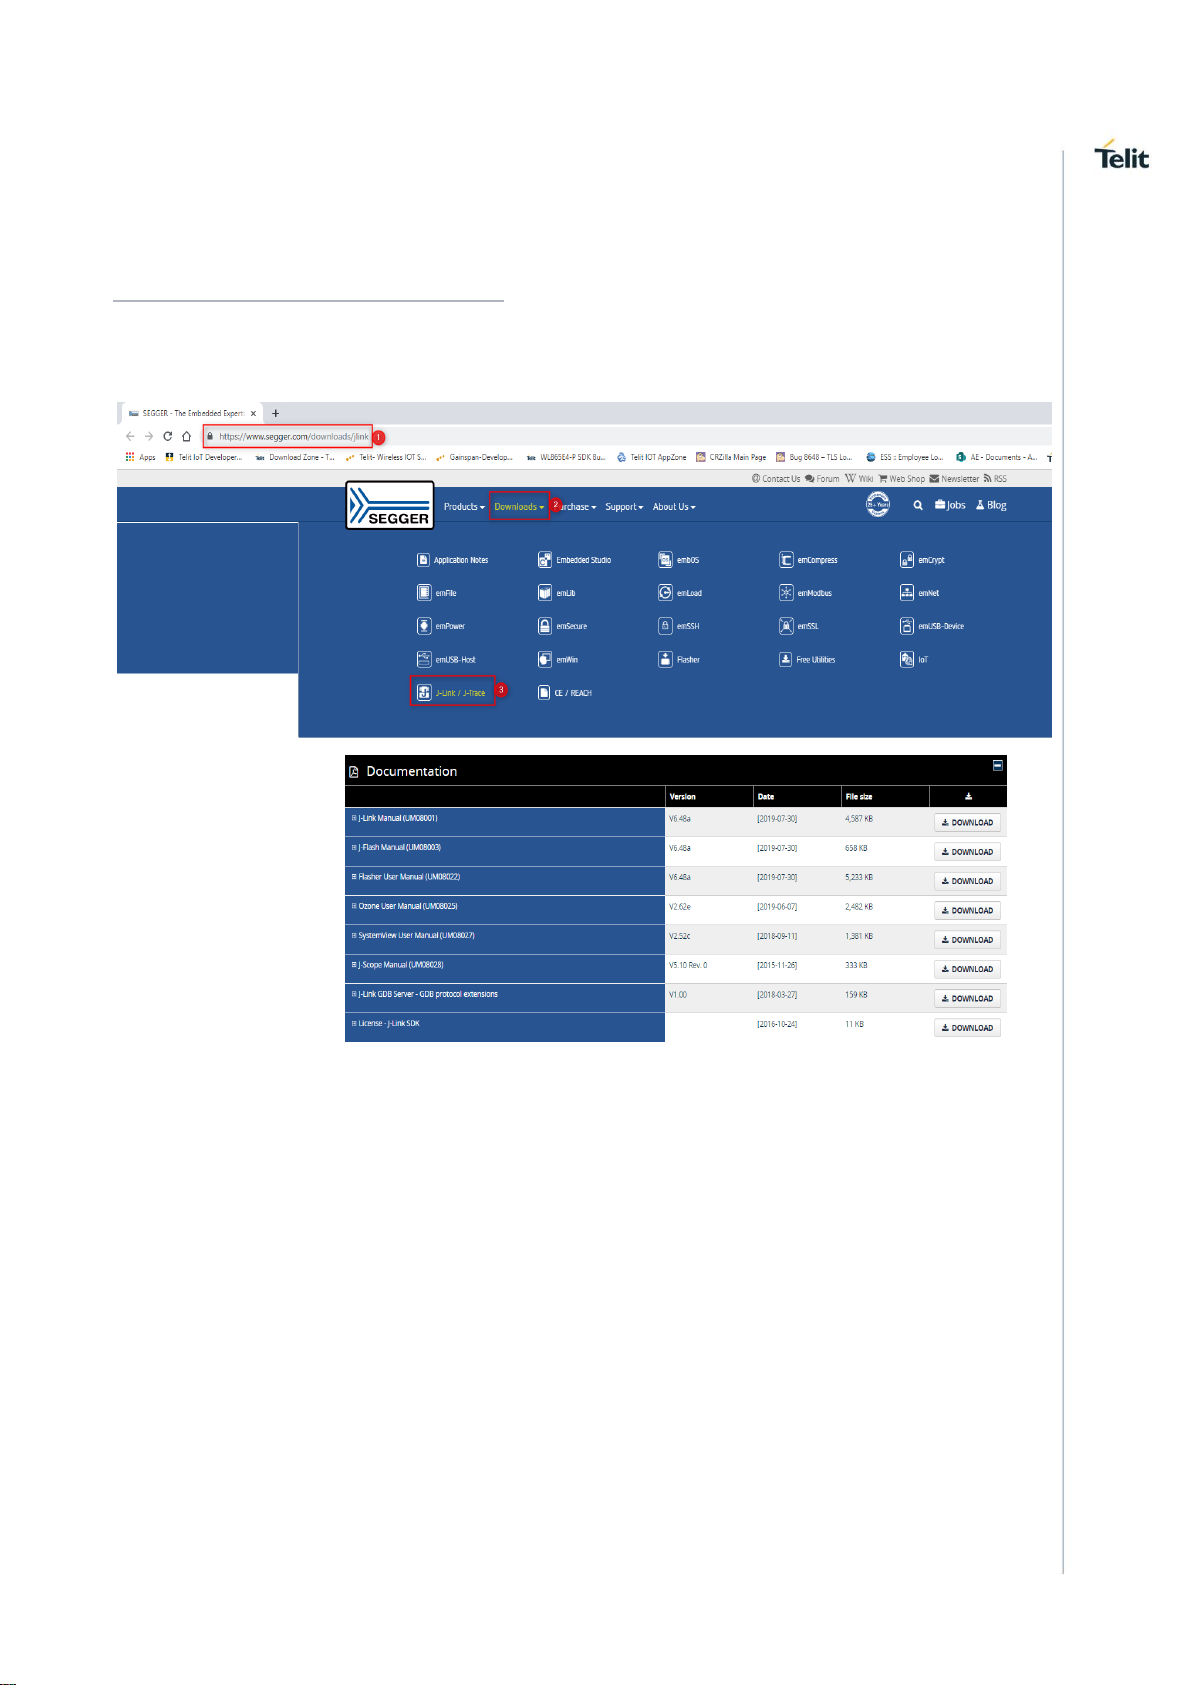
The drivers for J-Link USB interface can be downloaded from:
https://www.segger.com/downloads/jlink
To download Setup_JLink_V502h.exe of version, Goto “Downloads” → “ J-Link/J-Trace”
→ “J-Link Software and Documentation Pack” → “Click for Downloads” → “J-Link
Software and Documentation pack for Window” → from the “version” Tab download
“Setup_JLink_V502h.exe” version software and install.
Page 4
WL865E4-P GNU Debugger User Guide
1VV0301690 Rev 1 Page 4 of 27 2020-11-03
3. GNU DEBUGGER REQUIREMENTS
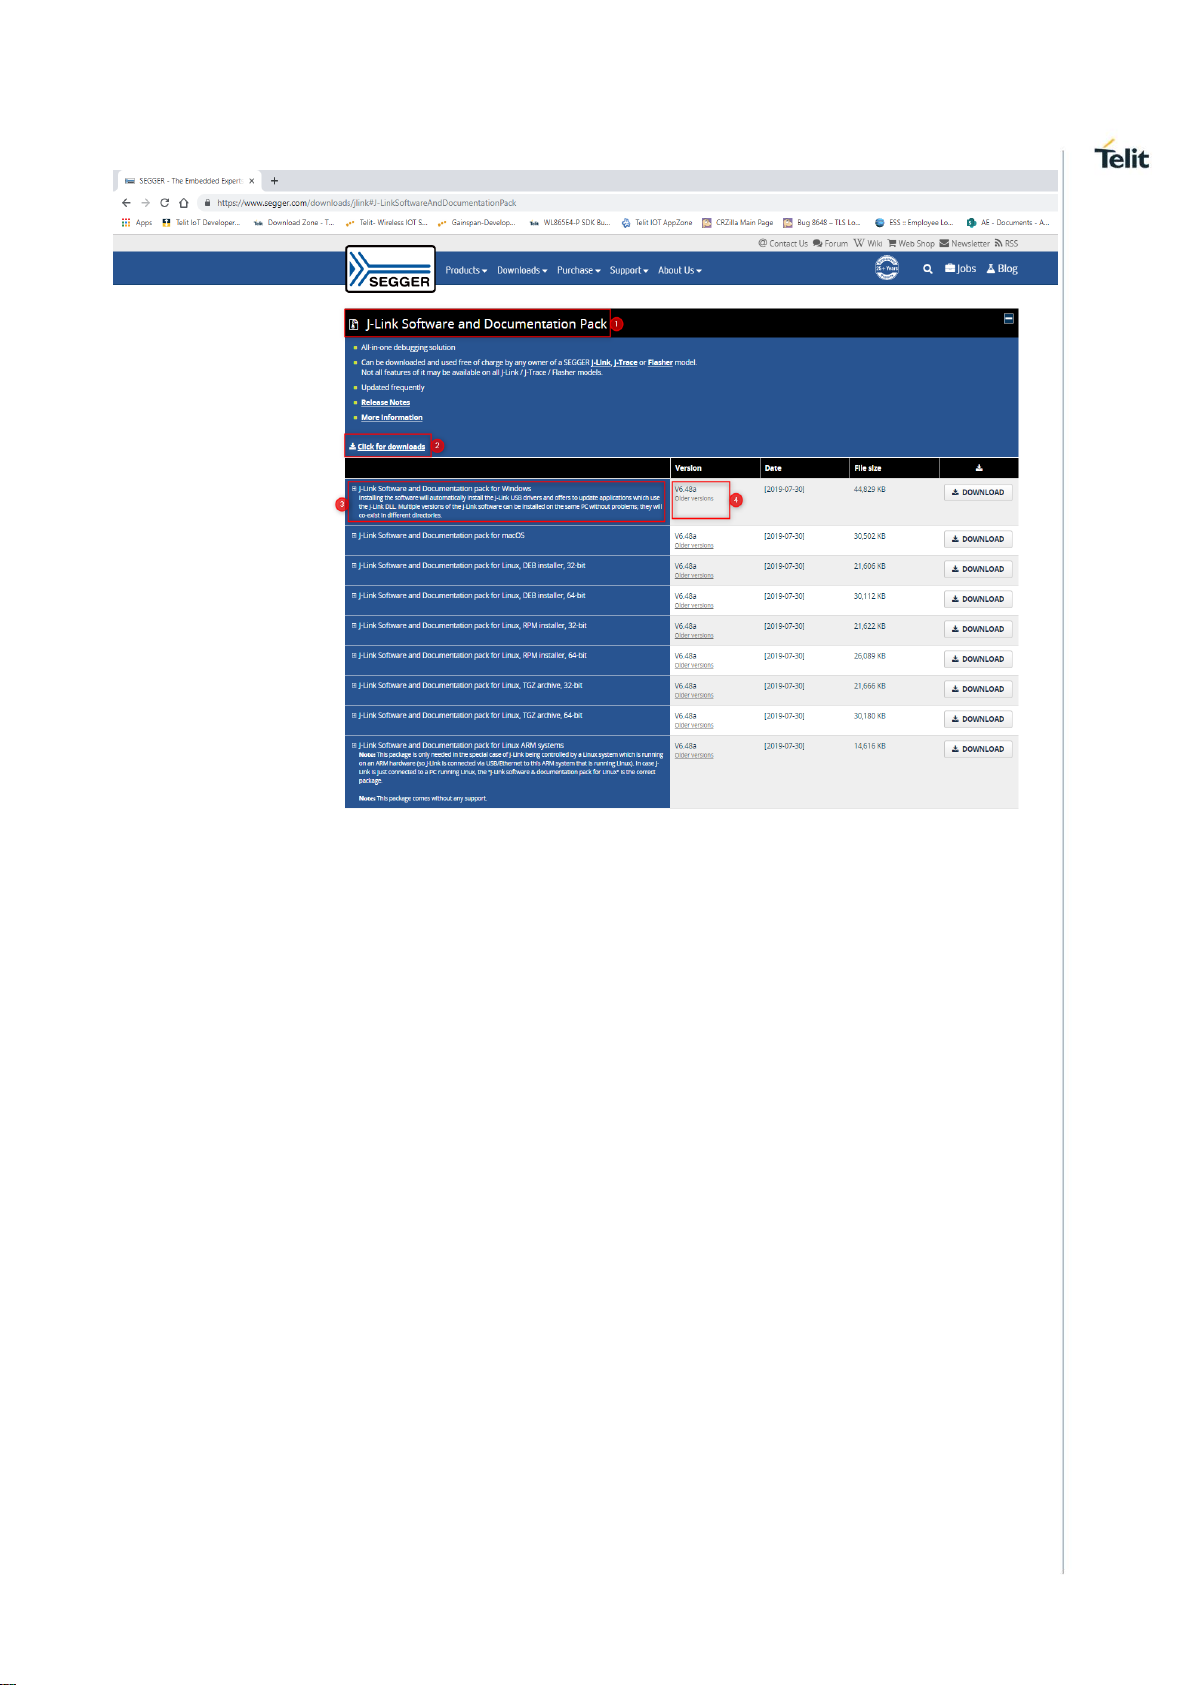
The drivers for J-Link USB interface can be downloaded from:
https://www.segger.com/downloads/jlink as shown below:
Goto Downloads→J-Link/J-Trace→J-Link Software and Documentation Pack→Click for
Downloads→J-Link Software and Documentation pack for Window→from the “version”
Tab download Setup_JLink_V502h.exe version software and install.
Page 5
WL865E4-P GNU Debugger User Guide
1VV0301690 Rev 1 Page 5 of 27 2020-11-03
Page 6
WL865E4-P GNU Debugger User Guide
1VV0301690 Rev 1 Page 6 of 27 2020-11-03
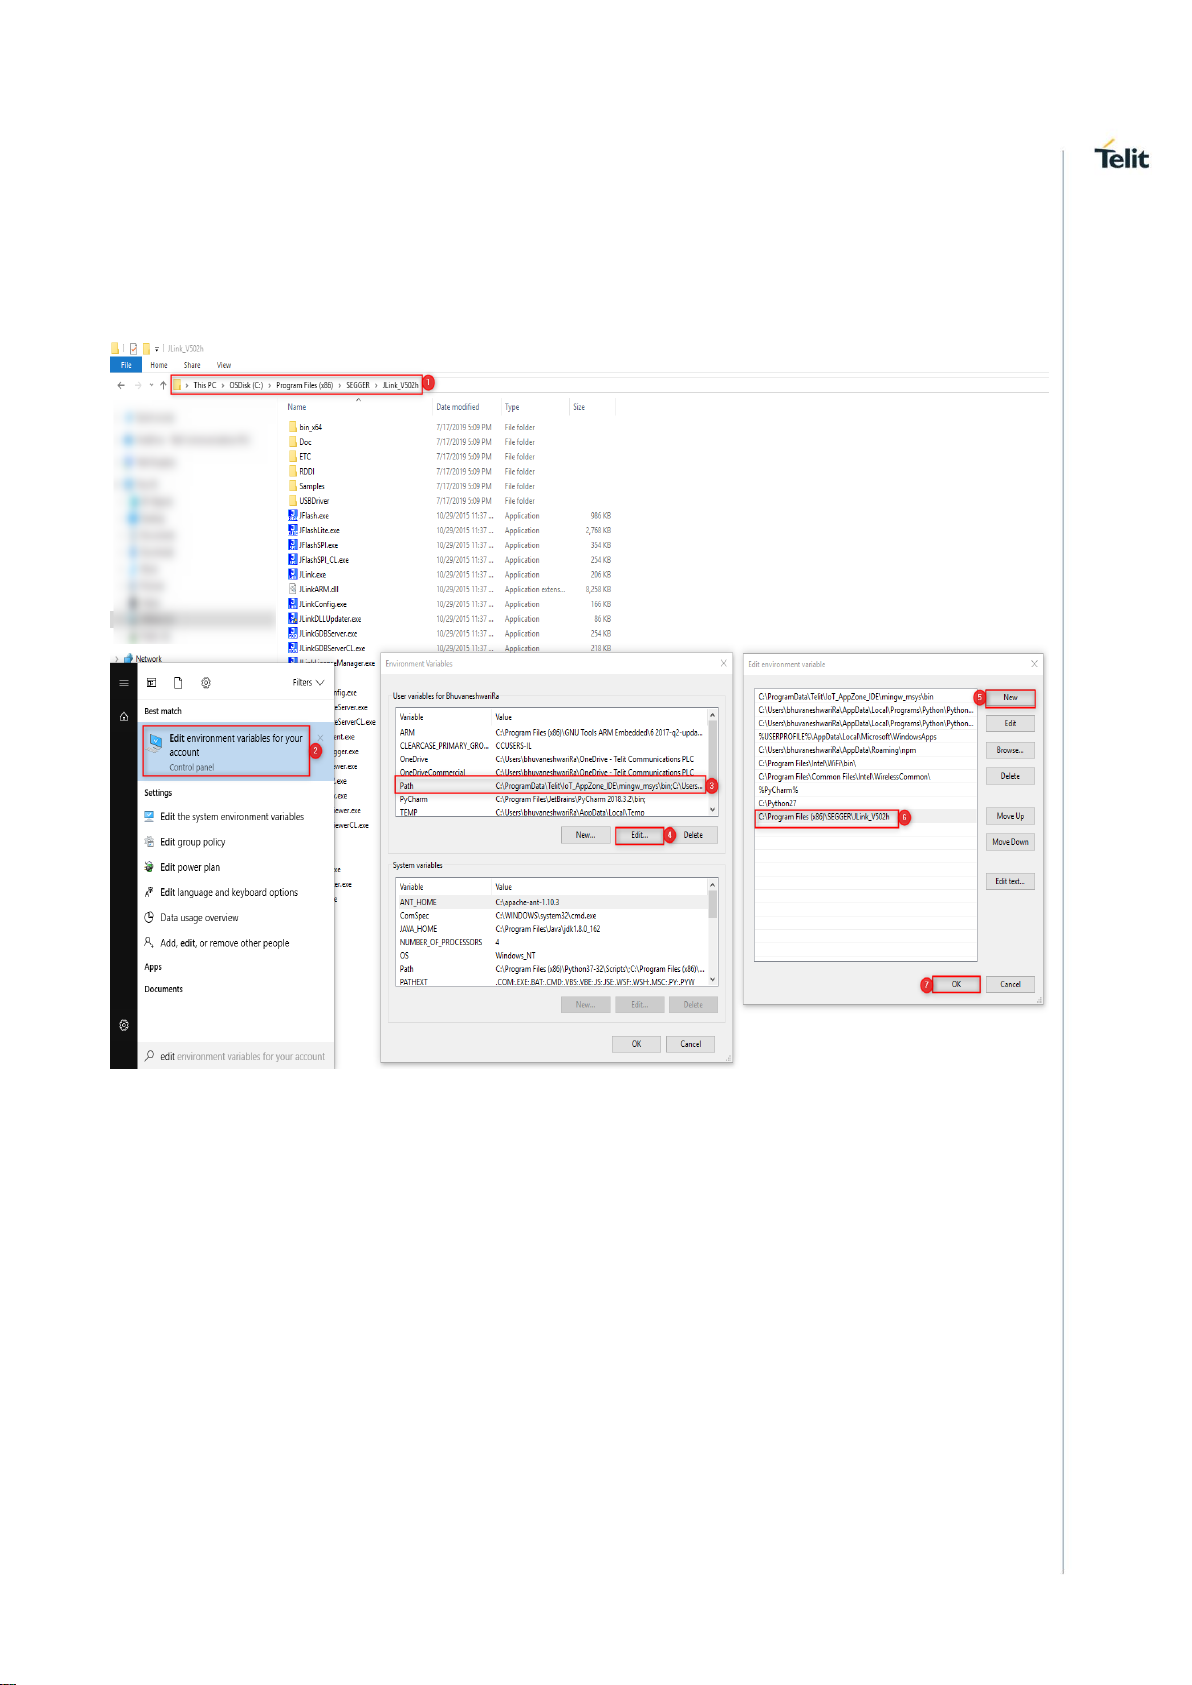
4. SET PATH TO JLINK GDB SERVER
After installation, add the path to JLinkGDBServer. For example if there is
JLinkGDBServer.exe in C:\Program Files (x86)\SEGGER\JLink_V502h folder, then, set
path as follows.
set %PATH%=%PATH%:C:\Program Files (x86)\SEGGER\JLink_V502h
Page 7
WL865E4-P GNU Debugger User Guide
1VV0301690 Rev 1 Page 7 of 27 2020-11-03
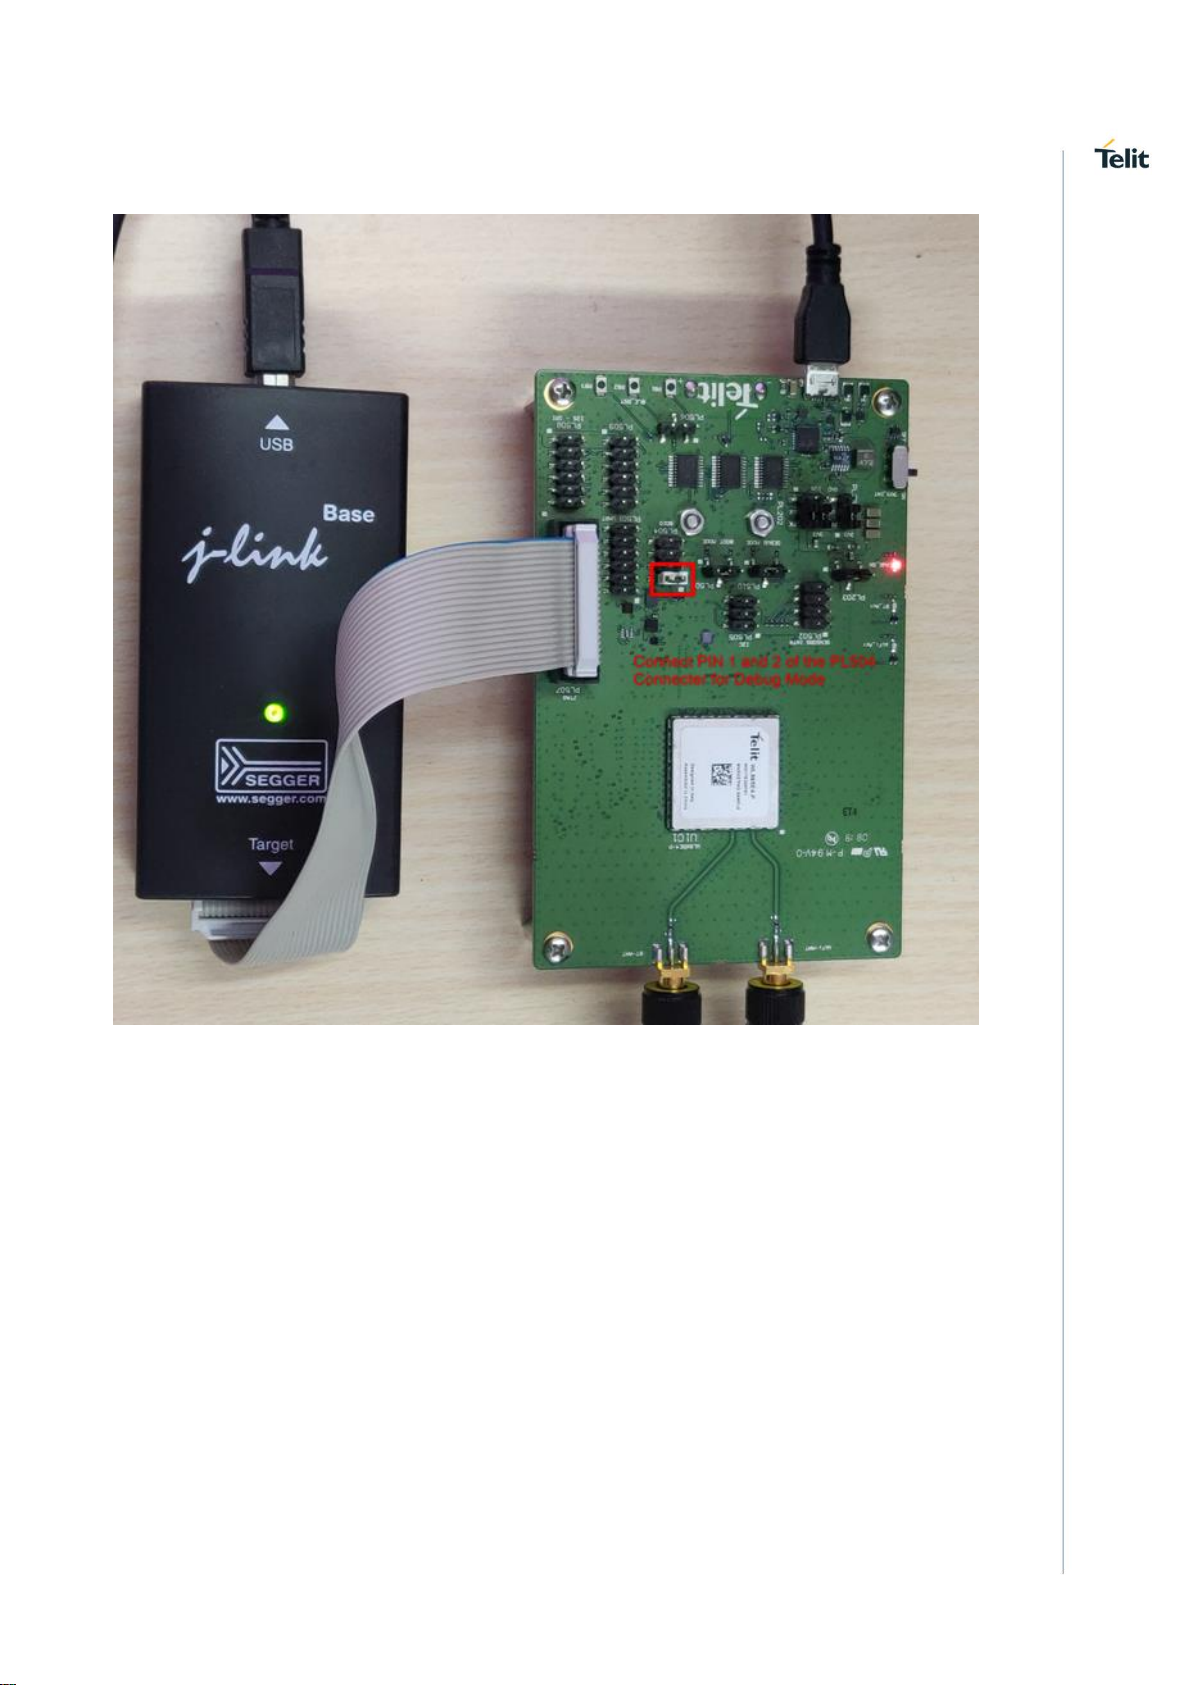
5. HARDWARE SETUP TO CONNECT J-LINK DEBUGGER
Page 8
WL865E4-P GNU Debugger User Guide
1VV0301690 Rev 1 Page 8 of 27 2020-11-03
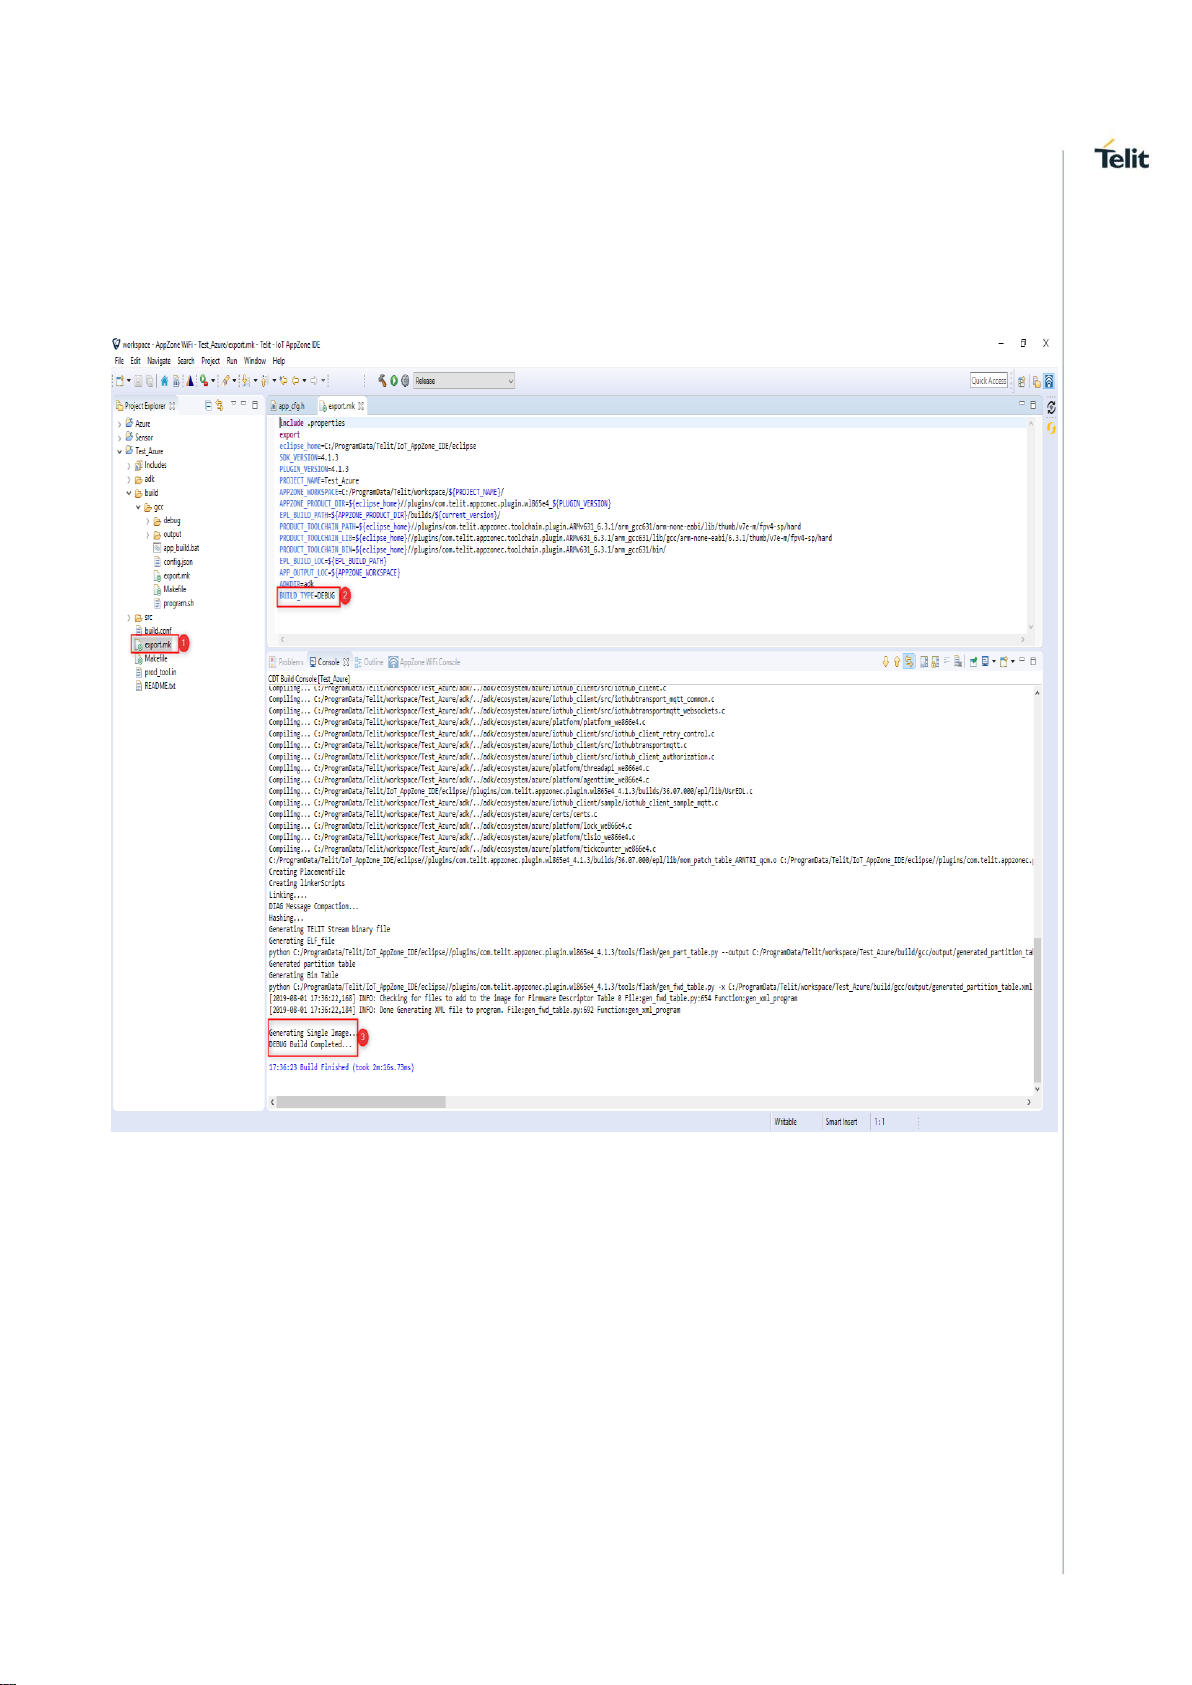
6. BUILD PROJECT WITH DEBUG MODE ENABLED BINARY
Build the application with DEBUG mode by configuring BUILD_TYPE=DEBUG in
export.mk file which is available in the project root directory. Default value will be
RELEASE.
Page 9
WL865E4-P GNU Debugger User Guide
1VV0301690 Rev 1 Page 9 of 27 2020-11-03
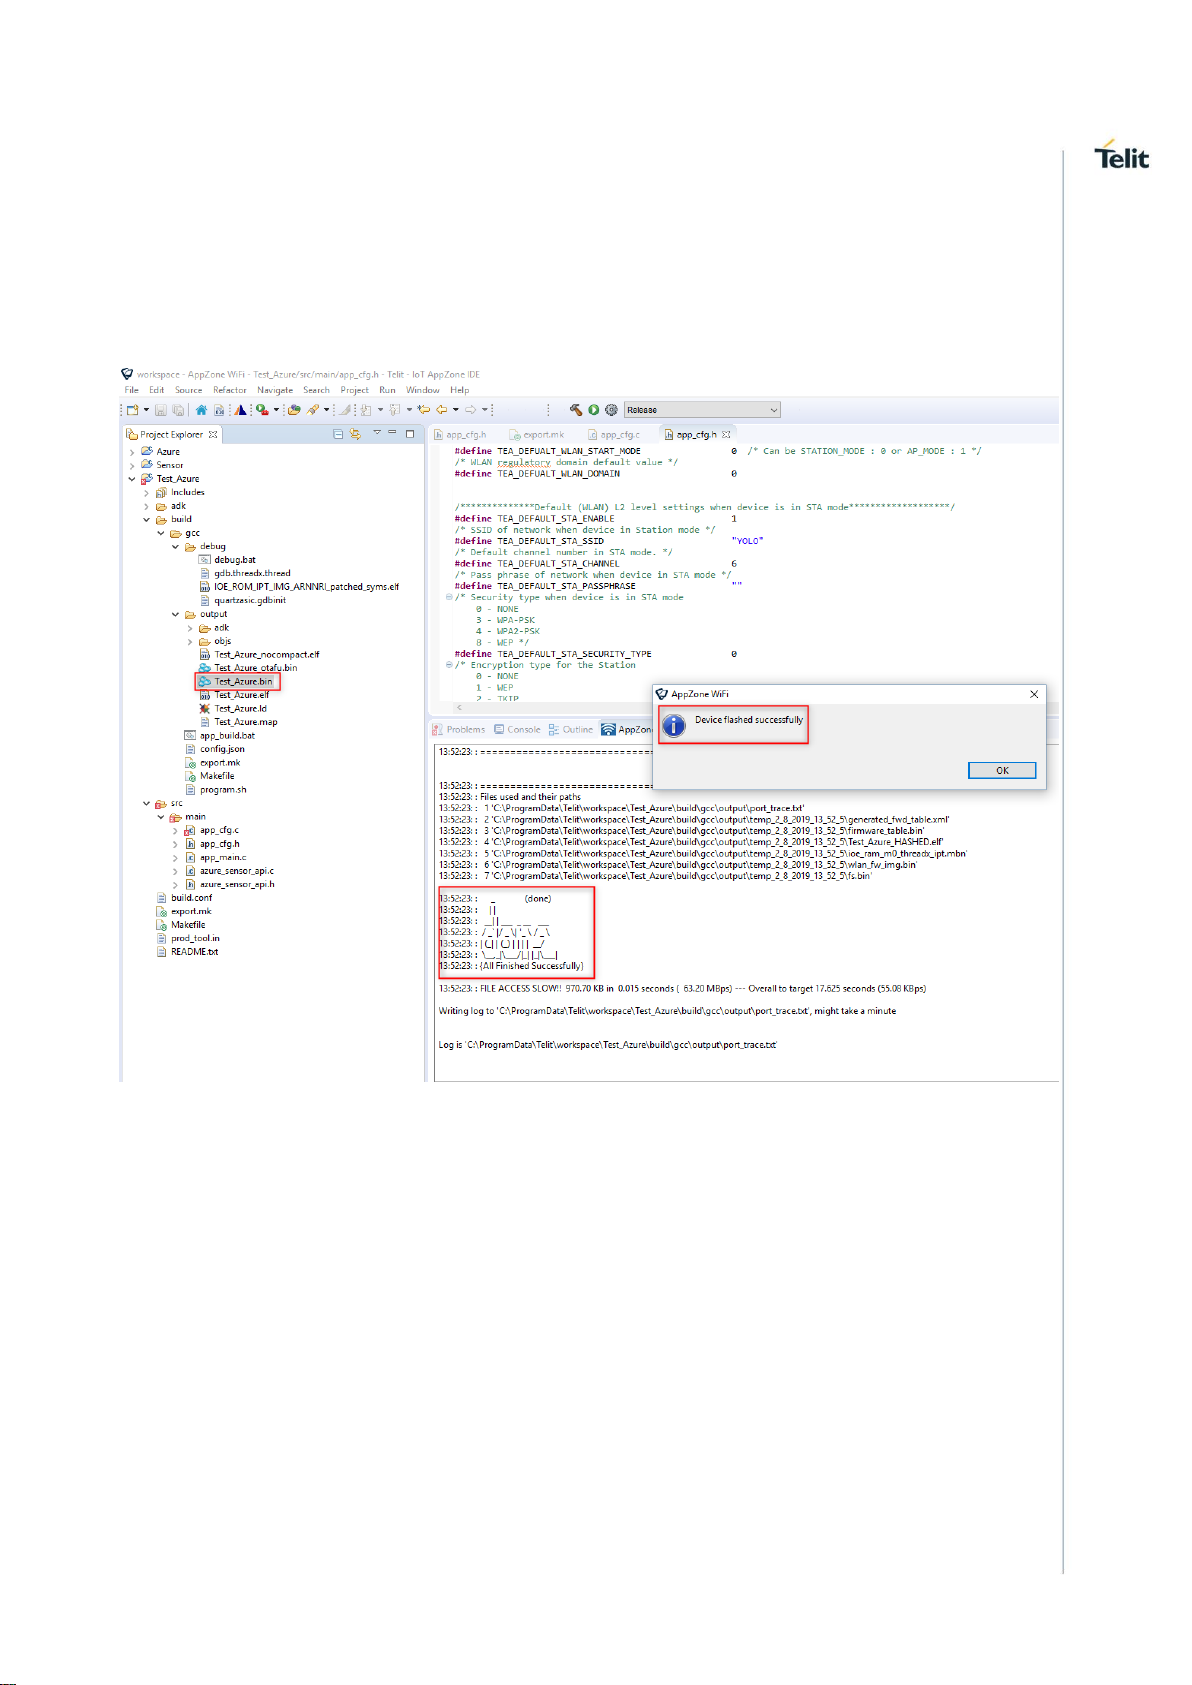
7. PROGRAM THE MODULE
1 Configure the module in Program Mode
2 Check the Programming USB port from the Device Manager
3 Drag and drop the single image “Test_Azure.bin” in this example on to the “AppZone
WiFi Console”
Page 10

WL865E4-P GNU Debugger User Guide
1VV0301690 Rev 1 Page 10 of 27 2020-11-03
8. RUN THE APPLICATION
1 Configure the module in RUN Mode
2 Check the USB port from the Device Manager
3 Configure the UART Settings from the ADE and connect to the module
4 User must select “Flow off” under Flow control, otherwise the node will not respond.
5 Get the application debug prints on the AppZone WiFi Console
Page 11

WL865E4-P GNU Debugger User Guide
1VV0301690 Rev 1 Page 11 of 27 2020-11-03
9. START DEBUG SESSION
Double click on the “debug.bat” of the application from the ADE
1 This instantiates a J-Link GDB server instance.
2 Start the GDB client, load the symbols from the image, and set appropriate
breakpoints.
3 The execution stops at the system software entry point. User can optionally set
breakpoints in the application code.
Page 12

WL865E4-P GNU Debugger User Guide
1VV0301690 Rev 1 Page 12 of 27 2020-11-03
10. EXECUTING GDB COMMANDS
1 Continue(c)
2 Bpat
Page 13

WL865E4-P GNU Debugger User Guide
1VV0301690 Rev 1 Page 13 of 27 2020-11-03
1 By default, the active thread will be marked as * at the end.
thread = 0x10074b18 name = IDLE prio = 31 *
Stopped threads:
thread = 0x10074f18 name = DSR prio = 16
thread = 0x100757e0 name = ATS_TIMER prio = 12
thread = 0x100773f8 name = SIGNAL prio = 16
thread = 0x10078120 name = BULK prio = 16
thread = 0x100787f8 name = PLAT_CAL_ prio = 29
thread = 0x1007a488 name = rfs_serve prio = 10
thread = 0x1007aec8 name = QIPC prio = 20
thread = 0x10080578 name = netmain prio = 18
thread = 0x10080e80 name = nettick prio = 3
thread = 0x10082fd0 name = post_ssl_ prio = 12
Page 14

WL865E4-P GNU Debugger User Guide
1VV0301690 Rev 1 Page 14 of 27 2020-11-03
thread = 0x10083398 name = ssl_task prio = 3
thread = 0x1008a350 name = Serial_Input_Thread prio = 16
thread = 0x10072a70 name = s2w_serialinput prio = 16
thread = 0x10074320 name = s2w_serialinput prio = 16
thread = 0x100744a0 name = s2w_nwk_recv prio = 16
thread = 0x10090330 name = s2w_nwk_send prio = 16
thread = 0x10090520 name = httpc prio = 12
thread = 0x10090f00 name = m2mb_fwup prio = 10
2 If there is stack corruption special string “WARNING: STACK IS CORRUPTED” is
appended at the end of thread information.
3 By default, the following breakpoints are set in:
a) sbl1_main_ctl: Software entry point
b) jettison_core: For Reset scenarios
c) capp_start: Application entry point
4 If user want to connect to a running traget without software reset, they can comment
out the below lines in “quartzasic.gdbinit” file.
#set *(int*)0x50742094=4
#monitor reset 0
5 During coredump, system will stop in jettison_core breakpoint. We can find the
coredump registers by the below command in gdb.
p *coredump: coredump is a global variable to store the exception register
information.
6 Custom gdb commands.
slno
Command
Usage
1
bpat
brief print ALL threads (one line per
thread)
2
vpat
verbose print ALL threads
3
bpot [tcb_addr]
brief print one thread (one line);
default is brief display of CURRENT
thread
4
vpot [tcb_addr]:
verbose print one thread; default is
verbose display of CURRENT
thread
5
switchthread <XXX_addr>:
switch current register context to a
specified thread
6
switchback
return to original thread context after
a switchthread
7
btthread <XXX_addr>:
backtrace for the specified thread
Page 15

WL865E4-P GNU Debugger User Guide
1VV0301690 Rev 1 Page 15 of 27 2020-11-03
8
bt_busfault
prints backtrace when there was a
bus fault (assuming the coredump
contains valid values)
Note: For Details on above command refer gdb.threadx.thread file in the dbg folder.
Page 16

WL865E4-P GNU Debugger User Guide
1VV0301690 Rev 1 Page 16 of 27 2020-11-03
11. DEBUGGING WATCHDOG RESET
The following steps are used to find the functions from where the system has called
watchdog reset.
In Order to induce watchdog, reset, the following code is added in one of the AT
command in S2W application.
While(1)
{
}
The above mechanism is used to test any other resets as well.
Following are the debugging steps:
Start the Debugger
When you start the debugger, the below print is displayed:
"quartz_ram_stubs__i.user_pre_setup" outside of ELF segments
warning: Loadable section "in_utils__i.uslash" outside of ELF segments
warning: Loadable section "ip6mc__i.v6_lookup_mcast" outside of ELF segments
warning: Loadable section "flash_nor__i.vendor_error_check" outside of ELF segments
warning: Loadable section "strrcl_main__i.vote_for_suspend" outside of ELF segments
warning: Loadable section "api_ioctl__i.wait_for_coex_stats" outside of ELF segments
warning: Loadable section "api_ioctl__i.wait_for_get_stats" outside of ELF segments
warning: Loadable section "api_ioctl__i.wait_scan_done" outside of ELF segments
warning: Loadable section "cust_hw_spi__i.wait_spi_done" outside of ELF segments
warning: Loadable section "coex__i.wlan_coex_callback_handler" outside of ELF
segments
warning: Loadable section "cust_stack_iniche__i.wlan_create_device" outside of ELF
segments
warning: Loadable section "cust_stack_iniche__i.wlan_dev0_pkt_send" outside of ELF
segments
warning: Loadable section "cust_stack_iniche__i.wlan_dev1_pkt_send" outside of ELF
segments
warning: Loadable section "cust_stack_iniche__i.wlan_dev_close" outside of ELF
segments
warning: Loadable section "cust_stack_iniche__i.wlan_dev_init" outside of ELF
segments
warning: Loadable section "cust_stack_iniche__i.wlan_dev_stats" outside of ELF
segments
warning: Loadable section "cust_api_stack_txrx__i.wlan_drv_buf_dequeue" outside of
ELF segments
warning: Loadable section "cust_api_stack_txrx__i.wlan_drv_buf_enqueue" outside of
ELF segments
Page 17

WL865E4-P GNU Debugger User Guide
1VV0301690 Rev 1 Page 17 of 27 2020-11-03
warning: Loadable section "cust_api_stack_txrx__i.wlan_drv_buf_purge_queue" outside
of ELF segments
warning: Loadable section "cust_api_stack_txrx__i.wlan_drv_buf_queue_empty" outside
of ELF segments
warning: Loadable section "cust_stack_iniche__i.wlan_pkt_send" outside of ELF
segments
warning: Loadable section "quartz_ram_stubs__i.wlan_set_deviceid" outside of ELF
segments
warning: Loadable section "wmi__i.wmi_bssfilter_cmd" outside of ELF segments
warning: Loadable section "api_init__i.wmi_cmd_process" outside of ELF segments
warning: Loadable section "wmi__i.wmi_cmd_send" outside of ELF segments
warning: Loadable section "wmi__i.wmi_cmd_start" outside of ELF segments
warning: Loadable section "wmi__i.wmi_config_11v_cmd" outside of ELF segments
warning: Loadable section "wmi__i.wmi_control_rx" outside of ELF segments
warning: Loadable section "wmi__i.wmi_control_rx2" outside of ELF segments
warning: Loadable section "wmi__i.wmi_control_rx_p2p" outside of ELF segments
warning: Loadable section "wmi__i.wmi_control_rx_xtnd" outside of ELF segments
warning: Loadable section "wmi__i.wmi_data_hdr_add" outside of ELF segments
warning: Loadable section "wmi__i.wmi_data_hdr_remove" outside of ELF segments
warning: Loadable section "wmi__i.wmi_dix_2_dot3" outside of ELF segments
warning: Loadable section "wmi__i.wmi_dot3_2_dix" outside of ELF segments
warning: Loadable section "wmi__i.wmi_dset_host_cfg_cmd" outside of ELF segments
warning: Loadable section "wmi__i.wmi_get_control_ep" outside of ELF segments
warning: Loadable section "wmi__i.wmi_implicit_create_pstream" outside of ELF
segments
warning: Loadable section "wmi__i.wmi_init" outside of ELF segments
warning: Loadable section "wmi__i.wmi_meta_add" outside of ELF segments
warning: Loadable section "wmi__i.wmi_p2p_set_noa" outside of ELF segments
warning: Loadable section "wmi__i.wmi_p2p_set_oppps" outside of ELF segments
warning: Loadable section "wmi__i.wmi_qos_state_init" outside of ELF segments
warning: Loadable section "wmi__i.wmi_sdpd_send_cmd" outside of ELF segments
warning: Loadable section "wmi__i.wmi_send_socket_cmd" outside of ELF segments
warning: Loadable section "wmi__i.wmi_set_appie_cmd" outside of ELF segments
warning: Loadable section "wmi__i.wmi_set_control_ep" outside of ELF segments
warning: Loadable section "wmi__i.wmi_set_wnm_sleep_period_cmd" outside of ELF
segments
warning: Loadable section "wmi__i.wmi_set_wnm_sleep_response_cmd" outside of ELF
segments
warning: Loadable section "wmi__i.wmi_shutdown" outside of ELF segments
warning: Loadable section "wmi__i.wmi_socket_cmd" outside of ELF segments
Page 18

WL865E4-P GNU Debugger User Guide
1VV0301690 Rev 1 Page 18 of 27 2020-11-03
warning: Loadable section "wmi__i.wmi_storerecall_recall_cmd" outside of ELF
segments
warning: Loadable section "ram_stubs__i.xport_quartz_shutdown" outside of ELF
segments
warning: Loadable section "ram_stubs__i.xport_quartz_start" outside of ELF segments
warning: Loadable section "ROM_FOM_RO_REGION__ro-data" outside of ELF
segments
warning: Loadable section "ROM_STDLIBS_RO_REGION" outside of ELF segments
warning: Loadable section "ROM_LINKER_SYMS__ro-data" outside of ELF segments
warning: Loadable section "ROM_MOM_MISSIONROM_RW_REGION__rw-data"
outside of ELF segments
warning: Loadable section "ROM_SOM_MISSIONROM_RW_REGION__rw-data"
outside of ELF segments
warning: Loadable section "ROM_STDLIBS_RW_REGION" outside of ELF segments
warning: Loadable section "ROM_FOM_MISSIONROM_RW_REGION__rw-data"
outside of ELF segments
Breakpoint 2 at 0x100a09fe: file
C:\workSpace\QCA4020\QCA_Release\3_0\qca4020_bootReg\target\src\core\boot\sbl\/
sbl1_mc.c, line 344.
Breakpoint 3 at 0x10fbc: file /local/mnt/workspace/CRMBuilds/CNSS_W.QZ.1.0.r400013-QZFPGA1_20170509_214818/b/ioesw_proc/core/v2/rom/drivers/debugtools/err/src/apps_proc/ar
m//err_jettison_core_m4.s, line 83.
Ready Threads:
Priority 31 Ready Threads:
thread = 0x10076918 name = IDLE prio = 31 state = 0 stack available = 416 *
Stopped threads:
thread = 0x10076d18 name = DSR prio = 16 state = 7 stack available =
840
thread = 0x100775e0 name = ATS_TIMER prio = 12 state = 7 stack available =
1864
thread = 0x100791f8 name = SIGNAL prio = 16 state = 7 stack available =
840
thread = 0x10079f20 name = BULK prio = 16 state = 7 stack available =
840
thread = 0x1007a5f8 name = PLAT_CAL_ prio = 29 state = 7 stack available =
280
thread = 0x1007c288 name = rfs_serve prio = 10 state = 7 stack available =
1824
thread = 0x1007ccc8 name = QIPC prio = 20 state = 7 stack available =
280
thread = 0x10082378 name = netmain prio = 18 state = 7 stack available =
1832
Page 19

WL865E4-P GNU Debugger User Guide
1VV0301690 Rev 1 Page 19 of 27 2020-11-03
thread = 0x10082c80 name = nettick prio = 3 state = 3 stack available =
1936
thread = 0x10084dd8 name = post_ssl_ prio = 12 state = 5 stack available =
472
thread = 0x100851a0 name = ssl_task prio = 3 state = 5 stack available =
1368
thread = 0x10069a90 name = s2w_appmain prio = 16 state = 7 stack available =
1644
thread = 0x10074ecc name = s2w_serialInput_dbg prio = 16 state = 6 stack
available = 3656
thread = 0x1008d334 name = s2w_serialInput_hs prio = 16 state = 6 stack
available = 3656
thread = 0x100954bc name = s2w_serialInput_sdio prio = 16 state = 6 stack
available = 3368
thread = 0x1006e6ec name = s2w_nwk_send prio = 16 state = 5 stack available
= 1624
Breakpoint 4 at 0x10930ac: file ../../../ref_app/s2w/src/app_startup.c, line 446.
(gdb) c
Continuing.
Set System for Watchdog Reset
Issue the AT commands for the system to start watchdog reset. Once watchdog kicks in
the below print can be seen:
Breakpoint 3, jettison_core () at /local/mnt/workspace/CRMBuilds/CNSS_W.QZ.1.0.r400013-QZFPGA1_20170509_214818/b/ioesw_proc/core/v2/rom/drivers/debugtools/err/src/apps_proc/ar
m//err_jettison_core_m4.s:83
83 /local/mnt/workspace/CRMBuilds/CNSS_W.QZ.1.0.r4-00013-QZFPGA1_20170509_214818/b/ioesw_proc/core/v2/rom/drivers/debugtools/err/src/apps_proc/ar
m//err_jettison_core_m4.s: No such file or directory.
(gdb) bt
#0 jettison_core () at /local/mnt/workspace/CRMBuilds/CNSS_W.QZ.1.0.r4-00013-
QZFPGA1_20170509_214818/b/ioesw_proc/core/v2/rom/drivers/debugtools/err/src/apps_proc/ar
m//err_jettison_core_m4.s:83
#1 0x10006150 in IC_NMI_Handler () at
C:\workSpace\QCA4020\QCA_Release\3_0\qca4020_bootReg\target\src\core\systemdri
vers\interruptcontroller\src\apps_proc\InterruptController_Internal_m4.c:77
#2 <signal handler called>
#3 _tx_thread_schedule () at /local/mnt/workspace/CRMBuilds/CNSS_W.QZ.3.0-00078-
QZHW-
Page 20

WL865E4-P GNU Debugger User Guide
1VV0301690 Rev 1 Page 20 of 27 2020-11-03
1_20181109_142759/b/ioesw_proc/core/rtos/threadx/src/apps_proc//tx_thread_schedule
.s:123
#4 0x1002b056 in qurt_init (arg=<optimized out>) at
C:\workSpace\QCA4020\QCA_Release\3_0\qca4020_bootReg\target\src\core\kernel\qu
rt\threadx\src\apps_proc\v2\/qurt_init.c:68
#5 0x1002afea in platform_main () at
C:\workSpace\QCA4020\QCA_Release\3_0\qca4020_bootReg\target\src\core\platform\
apps_proc\src\/platform_internal.c:407
#6 0x0106dd2e in boot_config_process_table () at
C:\workSpace\QCA4020\QCA_Release\3_0\qca4020_bootReg\target\src\core\boot\sbl\/
boot_config.c:322
Backtrace stopped: Cannot access memory at address 0x100b000c
Check the Current Thread
Issue the following command to check Ready thread:
(gdb) bpat
Ready Threads:
Priority 12 Ready Threads:
thread = 0x100775e0 name = ATS_TIMER prio = 12 state = 0 stack available
= 1864
Priority 16 Ready Threads:
thread = 0x1008d334 name = s2w_serialInput_hs prio = 16 state = 0 stack
available = 3656 *
thread = 0x10076d18 name = DSR prio = 16 state = 0 stack available =
840
Priority 31 Ready Threads:
thread = 0x10076918 name = IDLE prio = 31 state = 0 stack available =
416
Stopped threads:
thread = 0x100791f8 name = SIGNAL prio = 16 state = 7 stack available =
840
thread = 0x10079f20 name = BULK prio = 16 state = 7 stack available =
840
thread = 0x1007a5f8 name = PLAT_CAL_ prio = 29 state = 7 stack available
= 280
thread = 0x1007c288 name = rfs_serve prio = 10 state = 7 stack available =
1824
thread = 0x1007ccc8 name = QIPC prio = 20 state = 7 stack available =
280
thread = 0x10082378 name = netmain prio = 18 state = 7 stack available =
1832
thread = 0x10082c80 name = nettick prio = 3 state = 3 stack available =
1936
Page 21

WL865E4-P GNU Debugger User Guide
1VV0301690 Rev 1 Page 21 of 27 2020-11-03
thread = 0x10084dd8 name = post_ssl_ prio = 12 state = 5 stack available =
472
thread = 0x100851a0 name = ssl_task prio = 3 state = 5 stack available =
1368
thread = 0x10069a90 name = s2w_appmain prio = 16 state = 7 stack available
= 1644
thread = 0x10074ecc name = s2w_serialInput_dbg prio = 16 state = 6 stack
available = 3656
thread = 0x100954bc name = s2w_serialInput_sdio prio = 16 state = 6 stack
available = 3368
thread = 0x1006e6ec name = s2w_nwk_send prio = 16 state = 5 stack available
= 1624
Check the Core Dump
In the core dump the highlighted line is where the exception happened: (gdb) p *coredump
$2 = {
version = 0x0,
arch = {
type = ERR_ARCH_UNKNOWN,
version = 0x0,
regs = {
array = {0x0 <repeats 26 times>, 0x1008d2d0, 0x0, 0x0, 0x5a0, 0x10013870},
name = {
regs = {0x0 <repeats 13 times>},
sp = 0x0,
lr = 0x0,
pc = 0x0,
psp = 0x0,
msp = 0x0,
psr = 0x0,
aspr = 0x0,
ipsr = 0x0,
epsr = 0x0,
primask = 0x0,
faultmask = 0x0,
basepri = 0x0,
control = 0x0,
exception_r0 = 0x1008d2d0,
Page 22

WL865E4-P GNU Debugger User Guide
1VV0301690 Rev 1 Page 22 of 27 2020-11-03
exception_r1 = 0x0,
exception_r2 = 0x0,
exception_r3 = 0x5a0,
exception_r12 = 0x10013870,
exception_lr = 0x1095987,
exception_pc = 0x109fea4, //*This is the place where the exception happened.
exception_xpsr = 0x81000000
}
}
},
os = {
type = ERR_OS_UNKNOWN,
version = 0x0,
tcb_ptr = 0x0
},
err = {
version = 0x0,
linenum = 0x0,
err_handler_start_time = 0x0,
err_handler_end_time = 0x0,
filename = '\000' <repeats 49 times>,
message = '\000' <repeats 79 times>,
param = {0x0, 0x0, 0x0},
err_current_cb = 0x0,
compressed_ptr = 0x0,
err_reentrancy = 0x0
},
image = {
qc_image_version_string = 0x0,
image_variant_string = 0x0
}
}
Find the PC and Decode using Info Line *(address in hex)
(gdb) info line *( 0x109fea4)
Line 179 of "../../../ref_app/s2w/src/cmd_handler/nwk/httpc/m2m_s2w_httpc_init.c" starts
at address 0x109fea4 <m2m_s2w_httpc_init> and ends at 0x109fea6.
(gdb) list m2m_s2w_httpc_init.c:175
Page 23

WL865E4-P GNU Debugger User Guide
1VV0301690 Rev 1 Page 23 of 27 2020-11-03
170 Before issuing HTTP client init, user should have IP configuration, L2 and L3
connection must
171 be up.
172 -------------------------------------------------------------------------------------------------*/
173 M2MB_STATUS_T m2m_s2w_httpc_init( M2M_PARSER_CMD_HANDLE_T*
pHandle,
174 INT32 TYPE,
175 UINT32 TIMEOUT,
176 INT16 MAX_BODY_LEN,
177 INT16 MAX_HEADER_LEN,
178 INT16 RECV_BUF_LEN)
179 {
(gdb) list m2m_s2w_httpc_init.c:178
173 M2MB_STATUS_T m2m_s2w_httpc_init( M2M_PARSER_CMD_HANDLE_T*
pHandle,
174 INT32 TYPE,
175 UINT32 TIMEOUT,
176 INT16 MAX_BODY_LEN,
177 INT16 MAX_HEADER_LEN,
178 INT16 RECV_BUF_LEN)
179 {
180
181 INT8 device_id = -1;
182 M2M_CID_T *pCid = NULL;
(gdb) p *coredump
$3 = {
version = 0x0,
arch = {
type = ERR_ARCH_UNKNOWN,
version = 0x0,
regs = {
array = {0x0 <repeats 26 times>, 0x1008d2d0, 0x0, 0x0, 0x5a0, 0x10013870},
name = {
regs = {0x0 <repeats 13 times>},
sp = 0x0,
lr = 0x0,
pc = 0x0,
psp = 0x0,
Page 24

WL865E4-P GNU Debugger User Guide
1VV0301690 Rev 1 Page 24 of 27 2020-11-03
msp = 0x0,
psr = 0x0,
aspr = 0x0,
ipsr = 0x0,
epsr = 0x0,
primask = 0x0,
faultmask = 0x0,
basepri = 0x0,
control = 0x0,
exception_r0 = 0x1008d2d0,
exception_r1 = 0x0,
exception_r2 = 0x0,
exception_r3 = 0x5a0,
exception_r12 = 0x10013870,
exception_lr = 0x1095987,
exception_pc = 0x109fea4,
exception_xpsr = 0x81000000
}
}
},
os = {
type = ERR_OS_UNKNOWN,
version = 0x0,
tcb_ptr = 0x0
},
err = {
version = 0x0,
linenum = 0x0,
err_handler_start_time = 0x0,
err_handler_end_time = 0x0,
filename = '\000' <repeats 49 times>,
message = '\000' <repeats 79 times>,
param = {0x0, 0x0, 0x0},
err_current_cb = 0x0,
compressed_ptr = 0x0,
err_reentrancy = 0x0
},
Page 25

WL865E4-P GNU Debugger User Guide
1VV0301690 Rev 1 Page 25 of 27 2020-11-03
image = {
qc_image_version_string = 0x0,
image_variant_string = 0x0
}
}
Stack Trace to Check How the Function is Called.
Note: The information may be misleading if the stack is corrupted. But it gives
approximate call flow to understand the sequence of functions called on the current
thread before it went for NMI handler.
$4 = (void *) 0x1008d230 ( Thread id of current thread )
Line 793 of "../../../ref_app/s2w/src/parser/m2m_at_parser.c" starts at address
0x1093b18 <m2m_at_validate_range+64> and ends at 0x1093b24
<m2m_at_validate_range+76>.
No line number information available.
Line 122 of "../../../ref_app/s2w/src/parser/m2m_parser_util.c" starts at address
0x1095850 <m2m_parser_param_decode+84> and ends at 0x1095858
<m2m_parser_param_decode+92>.
Line 172 of "../../../ref_app/s2w/src/parser/m2m_parser_util.c" starts at address
0x1095986 <m2m_parser_process_cmd+186> and ends at 0x1095988
<m2m_parser_process_cmd+188>.
Line 179 of "../../../ref_app/s2w/src/cmd_handler/nwk/httpc/m2m_s2w_httpc_init.c" starts
at address 0x109fea4 <m2m_s2w_httpc_init> and ends at 0x109fea6.
Line 2582 of "../../../ref_app/s2w/src/parser/m2m_at_parser.c" starts at address
0x1094c1e <m2m_parser_at_io_data_process+2238> and ends at 0x1094c26
<m2m_parser_at_io_data_process+2246>.
No line number information available.
Line 91 of "../../../ref_app/s2w/src/parser/m2m_parser.c" starts at address 0x109554e
<m2m_parser_thread_entry+38> and ends at 0x1095554
<m2m_parser_thread_entry+44>.
No line number information available.
No line number information available.
Line 169 of "/local/mnt/workspace/CRMBuilds/CNSS_W.QZ.3.0-00078-QZHW-
1_20181109_142759/b/ioesw_proc/core/rtos/threadx/src/apps_proc/tx_thread_shell_ent
ry.c" starts at address 0x10029b18 <_tx_thread_shell_entry+12> and ends at
0x10029b1e <_tx_thread_shell_entry+18>.
No line number information is available.
Conclusion
Using the debugger, the function which is causing the reset i.e, m2m_s2w_httpc_init can
be found. Now write/update the logic so that busy loops in system which is causing
watchdog reset is avoided.
Page 26

WL865E4-P GNU Debugger User Guide
1VV0301690 Rev 1 Page 26 of 27 2020-11-03
12. DOCUMENT HISTORY
Revision
Date
Changes
0
2019-08-02
First issue
1
2020-11-03
Addition of section Debugging WatchDog Reset.
Page 27

 Loading...