

Page 1
5 Commonwealth Ave
Woburn, MA 01801
Phone 781-665-1400
Toll Free 1-800-517-8431
Visit us at www.TestEquipmentDepot.com
T3DAQ1-16
Data Acquisition System
User Manual
Page 2

T3DAQ1-16 User Manual
General Safety Summary
Read the following precautions carefully to avoid any personal injuries, or damage to the instrument or products connected to it. Use the instrument only as specified.
Use only the power cord supplied for the instrument.
Ground the instrument.
The instrument is grounded through the ground conductor of the power cord. To avoid electric
shock, always connect to grounded outlets. Make sure the instrument is grounded correctly before
connecting its input or output terminals.
Connect the signal wire correctly.
To avoid damage, observe input polarity and maximum voltage/current ratings at all times.
Observe all terminal ratings and signs on the instrument to avoid fire or electric shock.
Before connecting to the instrument, read the manual to understand the input/output ratings.
Do not operate with suspected failures.
If you suspect that the instrument is damaged, contact the Teledyne LeCroy service department
immediately.
Do not operate in wet/damp conditions.
Do not operate in an explosive atmosphere.
Keep the surface of the instrument clean and dry.
Avoid touching exposed circuits or wires.
Do not touch exposed contacts or components when the power is on.
Do not operate without covers.
Do not operate the instrument with covers or panels removed.
Use only the fuse specified for the instrument.
Use proper overvoltage protection.
Use anti-static protection.
Operate in an anti-static protected area. Ground measurement cable conductors before connecting
to the instrument to discharge any static electricity before connecting the cables to the instrument.
Observe ventilation requirements.
Ensure good ventilation. Check the vent and fan regularly to prevent overheating.
i
Page 3
T3DAQ1-16 User Manual
Safety Terms and Symbols
The following terms may appear on the instrument:
DANGER: Direct injury or hazard may occur.
WARNING: Potential injury or hazard may occur.
CAUTION: Potential damage to instrument/property may occur.
CAT I1: IEC Measurement Category I, applicable for making measurements on ‘other’ circuits that
are not directly connected to mains. See p. v.
CAT II: IEC Measurement Category II, applicable for making measurements on circuits connected
directly to utilization points (socket outlets and similar points) of the low voltage mains installation.
See p. v.
1) CAT I as defined in IEC/EN 61010-031:2008.
Note that Measurement Category I was removed in IEC/EN 61010-031:2015 and replaced by ‘O’, indicating ”other cir-
cuits that are not directly connected to mains.”
Saftey Symbols
The following symbols may appear on the instrument:
ii
Page 4

T3DAQ1-16 User Manual
Operating Environment
Temperature: 0 °C to 40 °C
Humidity: 5% to 90% relative humidity (non-condensing) up to +30°C. Upper limit derates to 50%
relative humidity (non-condensing) at +40°C.
Altitude: ≤ 2000 m
Use indoors only.
Pollution Degree 2. Use in an operating environment where normally only dry, non-conductive
pollution occurs. Temporary conductivity caused by condensation should be expected.
AC Power
Input Voltage & Frequency:
100-120 V at 50/60 Hz
200-240 V at 50/60 Hz
Manual AC selection with a slide switch.
Power Consumption: 20 W maximum
Mains Supply Connector: CAT II per IEC/EN 61010-1:2010, instrument intended to be supplied
from the building wiring at utilization points (socket outlets and similar).
Fuse Type
Current Input Terminal: 250 VAC F 10 A, 3 AG
AC Mains: 250 VAC F 300 mA, 5x20 mm
iii
Page 5

T3DAQ1-16 User Manual
Input Terminal Protection Limitation
Protection limitation is defined for the input terminal.
1. Main Input (HI and LO) Terminals
HI and LO terminals are used for Voltage, Resistance, Capacitance, Continuity, Frequency,
Diode and Temperature measurement. Two protection limitations are defined:
• HI-LO protection limitation: 1000 VDC or 750 VAC. This is the maximum measurable
voltage. The limitation can be expressed as 1000 Vpk.
• LO ground protection limitation: LO terminal can “float” 500 Vpk relative to the ground
safely. The maximum protection limitation of HI terminal relative to the ground is 1000
Vpk. Therefore, the sum of the “float” voltage and the measured voltage can’t exceed
1000 Vpk.
2. Sampling (HISense and LOSense) Terminals
HISense and LOSense terminals are used for 4-wire Resistance measurement. Two protection limitations are defined:
• HISense-LOSense protection limitation: 2000 Vpk.
• LOSense-LOSense protection limitation: 2 Vpk.
3. Current Input (I) Terminal
The I terminal is used for current measurement. The maximum current which can go through
the I terminal is limited to 10 A by the fuse on the back panel.
NOTE: Voltage on the current input terminal corresponds to voltage on the LO terminal. To
keep good protection, only use a fuse of the specified type and value to replace this fuse
iv
Page 6

T3DAQ1-16 User Manual
IEC Measurement Category II Overvoltage Protection
To avoid the danger of electric shock, the Data Acquisition Unit provides overvoltage protection for
line-voltage mains connections that meet both of the following conditions:
1. The HI and LO input terminals are connected to the mains under Measurement Category II
conditions described in the warning below.
2. The maximum line voltage of the mains does not exceed: 600 VAC for the instrument.
WARNING:
IEC Measurement Category II includes electrical devices connected to mains at an outlet on a
branch circuit, such as most small appliances, test equipment, and other devices that plug into a
branch outlet or socket.
The DAQ is capable of making measurements with the HI and LO inputs connected to mains in
such devices (≤ 600 VAC) or to the branch outlet itself.
However, the HI and LO terminals of the DAQ can’t be connected to mains in permanently installed
electrical devices such as the main circuit-breaker panels, sub-panel disconnected boxes and permanently wired motors. Such devices and circuits are prone to exceed the protection limits of the
DAQ.
Limits for Measurements on Other Circuits Not Directly Connected to Mains
Max. rated input voltage: 1000V
Transient overvoltage: 4000V
WARNING:
Voltages above 600 VAC can only be measured in circuits that are isolated from mains. However,
there may be transient over voltage in circuits that are isolated from mains. The DAQ is able to
withstand occasional transient overvoltage up to 4000 Vpk. Please don’t use this instrument to
measure circuits where transient overvoltage may exceed this level.
rms
pk
v
Page 7

T3DAQ1-16 User Manual
Daily Maintenance and Cleaning
Maintenance
Protect the liquid crystal display from direct sunlight when storing or using the instrument.
NOTE: To avoid damage to the instrument or test leads, please don’t place them in mist, liquid or
solvent.
Cleaning
Regularly clean the instrument and test leads.
• Wipe the external dust off the instrument and test leads using a soft rag. Be careful not to
scratch the display screen when cleaning. Do not allow any liquid to enter the instrument.
• Use a damp soft rag to clean the instrument after removing the power plug. Use 75% isopropyl alcohol or water solvent to get a more thorough cleaning.
NOTE: To prevent the surface of the instrument or test leads from damage, please don’t use any
corrosive or chemical cleaning reagents. Please make sure the instrument is fully dry before reconnecting the power to avoid short circuits or personal injury.
vi
Page 8

T3DAQ1-16 User Manual
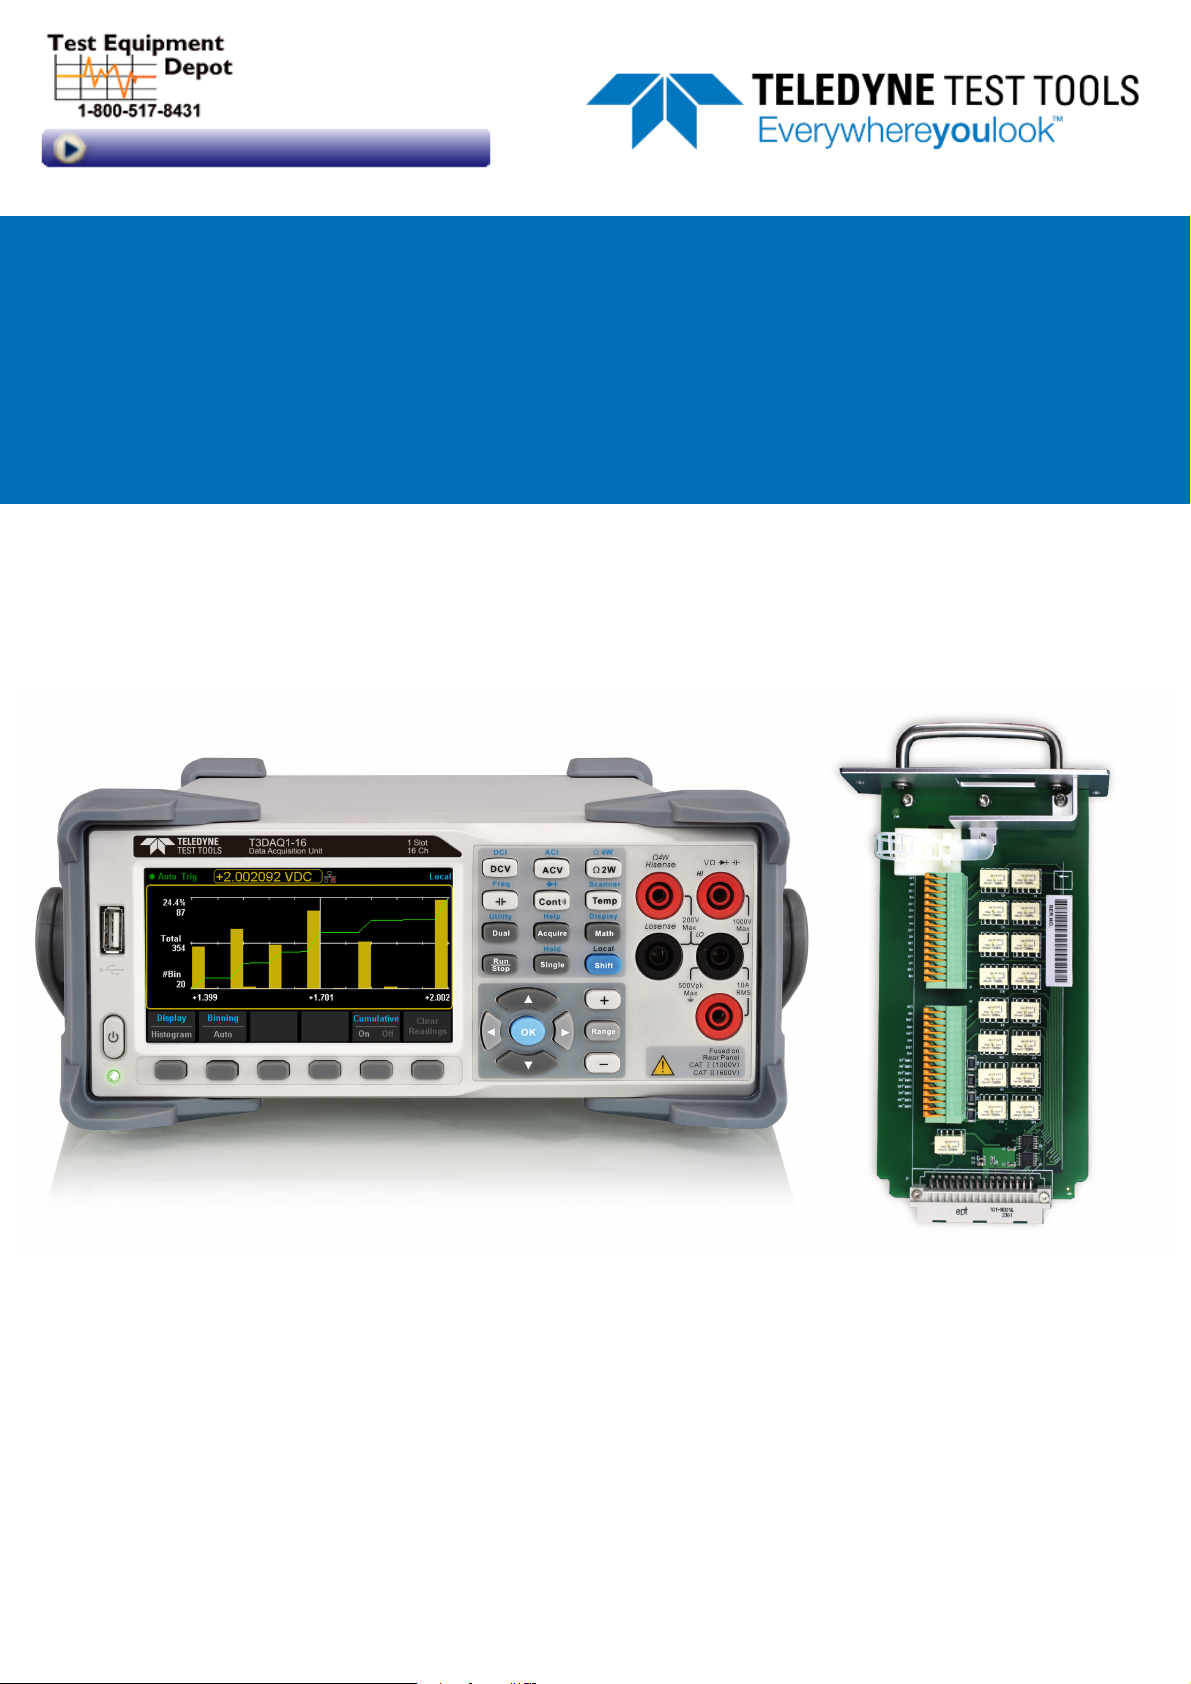
Introdution to T3DAQ1-16
Teledyne Test Tools T3DAQ1-16 is a 16 channel Data Acquisition System incorporating the latest
4.3 inch (10.92 cm) dual-display technology which can be configured to show Data Histograms,
Data fluctuation Trends, Bar Graph, Statistics or the traditional Number mode, all in an easy to use
interface. The T3DAQ features 12 multi-purpose + 4 current channels and supports various measurement functions. It provides a convenient and versatile solution for test applications that require
multiple measurement points or signals and is an ideal tool for R& D burn-in and production testing.
A great feature of the Teledyne Test Tools T3DAQ is its ability to make highly accurate True RMS
AC Voltage and Current measurements, meaning no loss of accuracy even when measuring complex voltage and current waveforms.
The T3DAQ provides various measurement modes to satisfy a wide range of application requirements. 12 Multi-purpose channels can be configured individually for various scan requirements.
The Channel configuration function allows user to configure different parameters such as measurement type, range, scan mode, number of scan cycles, and duration of scan. Similarly, the
scan control menu provides flexibility to schedule, start, and stop the scan. Scanning data can be
viewed live during a scan and can also be saved for future use. An internal 1 GB flash memory is
available for data logging and to save configuration files. The T3DAQ also features a USB Host
interface to use a USB flash drive to collect data without being connected to a PC.
The T3DAQ is equipped with LAN and USBTMC interfaces for remote control of the device. The
device can be controlled remotely using EasyDMM software. The graphical interface of the software makes it easy to configure measurements, setup and execute scans or troubleshoot the
design. Live measurement data can be viewed in numeric digits or graphically by trend chart, bar
graph and histogram. The data can be manually or automatically exported as CSV files for further
analysis.
Main features:
• 4.3” TFT-LCD Display
• Dual display, Chinese and English Menu
• Built-in front panel accessible help system
• File management (support for U-disc and local storage)
• Real 6-5 digit (2,200,000 count) readings resolution
• True-RMS AC Voltage and AC Current measuring
• 1 GB flash memory for mass storage configuration files and data files
• Built-in cold terminal compensation for thermocouple
• Standard interface: USB Device, USB Host, LAN
• USB & LAN remote interfaces support common SCPI command set
vii
Page 9

Contents
General Safety Summary . . . . . . . . . . . . . . . . . . . . . . . . . . . . . . . . . . . . i
Daily Maintenance and Cleaning . . . . . . . . . . . . . . . . . . . . . . . . . . . . . . . . vi
Introdution to T3DAQ1-16 . . . . . . . . . . . . . . . . . . . . . . . . . . . . . . . . . . . . vii
1 Quick Start 1
General Inspection . . . . . . . . . . . . . . . . . . . . . . . . . . . . . . . . . . . . . . . . 1
Dimensions . . . . . . . . . . . . . . . . . . . . . . . . . . . . . . . . . . . . . . . . . . . . 2
Handle Adjustment . . . . . . . . . . . . . . . . . . . . . . . . . . . . . . . . . . . . . . . . 3
Front Panel . . . . . . . . . . . . . . . . . . . . . . . . . . . . . . . . . . . . . . . . . . . . 4
Rear Panel . . . . . . . . . . . . . . . . . . . . . . . . . . . . . . . . . . . . . . . . . . . . 7
Starting the DAQ . . . . . . . . . . . . . . . . . . . . . . . . . . . . . . . . . . . . . . . . . 9
Operating Instructions . . . . . . . . . . . . . . . . . . . . . . . . . . . . . . . . . . . . . . 10
User Interface . . . . . . . . . . . . . . . . . . . . . . . . . . . . . . . . . . . . . . . . . . 16
Measurement Connections . . . . . . . . . . . . . . . . . . . . . . . . . . . . . . . . . . . 17
Connecting to USB and LAN Ports . . . . . . . . . . . . . . . . . . . . . . . . . . . . . . . 20
Using the Built-in Help System . . . . . . . . . . . . . . . . . . . . . . . . . . . . . . . . . 21
2 Function and Operation 22
Measurement Configuration . . . . . . . . . . . . . . . . . . . . . . . . . . . . . . . . . . . 22
Basic Measurement Functions . . . . . . . . . . . . . . . . . . . . . . . . . . . . . . . . . 31
Dual-display Function . . . . . . . . . . . . . . . . . . . . . . . . . . . . . . . . . . . . . . 53
Utility Function . . . . . . . . . . . . . . . . . . . . . . . . . . . . . . . . . . . . . . . . . . 55
Acquire . . . . . . . . . . . . . . . . . . . . . . . . . . . . . . . . . . . . . . . . . . . . . . 69
Help System . . . . . . . . . . . . . . . . . . . . . . . . . . . . . . . . . . . . . . . . . . . 73
Math Function . . . . . . . . . . . . . . . . . . . . . . . . . . . . . . . . . . . . . . . . . . 75
Display Mode . . . . . . . . . . . . . . . . . . . . . . . . . . . . . . . . . . . . . . . . . . . 82
Trigger . . . . . . . . . . . . . . . . . . . . . . . . . . . . . . . . . . . . . . . . . . . . . . . 88
Hold Measurement Function . . . . . . . . . . . . . . . . . . . . . . . . . . . . . . . . . . 89
3 Measurement Tutorial 90
Display Mode . . . . . . . . . . . . . . . . . . . . . . . . . . . . . . . . . . . . . . . . . . . 90
Crest Factor Errors (non-sinusoidal inputs) . . . . . . . . . . . . . . . . . . . . . . . . . . 91
Loading Errors (AC Voltage) . . . . . . . . . . . . . . . . . . . . . . . . . . . . . . . . . . 92
viii
Page 10

T3DAQ1-16 User Manual
4 General Troubleshooting 93
5 Appendix 95
Certifications . . . . . . . . . . . . . . . . . . . . . . . . . . . . . . . . . . . . . . . . . . . 97
© 2021 Teledyne LeCroy, Inc. All rights reserved.
Teledyne Test Tools is a brand and trademark of Teledyne LeCroy, Inc. Other product or brand
names are trademarks or requested trademarks of their respective holders. Specifications, prices,
availability and delivery subject to change without notice.
ix
Page 11

Chapter 1
Quick Start
General Inspection
Please check the instrument according to the following steps.
1. Inspect the shipping container.
Keep the shipping container and packaging material until the contents of the shipment have
been completely checked and the instrument has passed both electrical and mechanical
tests. It is always good practice to save the shipping container and packaging for use when
returning the power supply to Teledyne LeCroy for service or calibration.
The consigner or carrier will be responsible for damage to the instrument resulting from shipping. Teledyne LeCroy will not provide free maintenance or replacement in this instance.
2. Inspect the instrument.
If the instrument is found to be damaged, defective or fails in electrical or mechanical tests,
please contact the Teledyne LeCroy service department immediately.
3. Check the accessories.
Please check that you have received the accessories on the packing list:
1 DAQ
1 Test Lead Set
1 USB Cable
If the accessories are incomplete or damaged, please contact Teledyne LeCroy immediately.
1
Page 12
T3DAQ1-16 User Manual
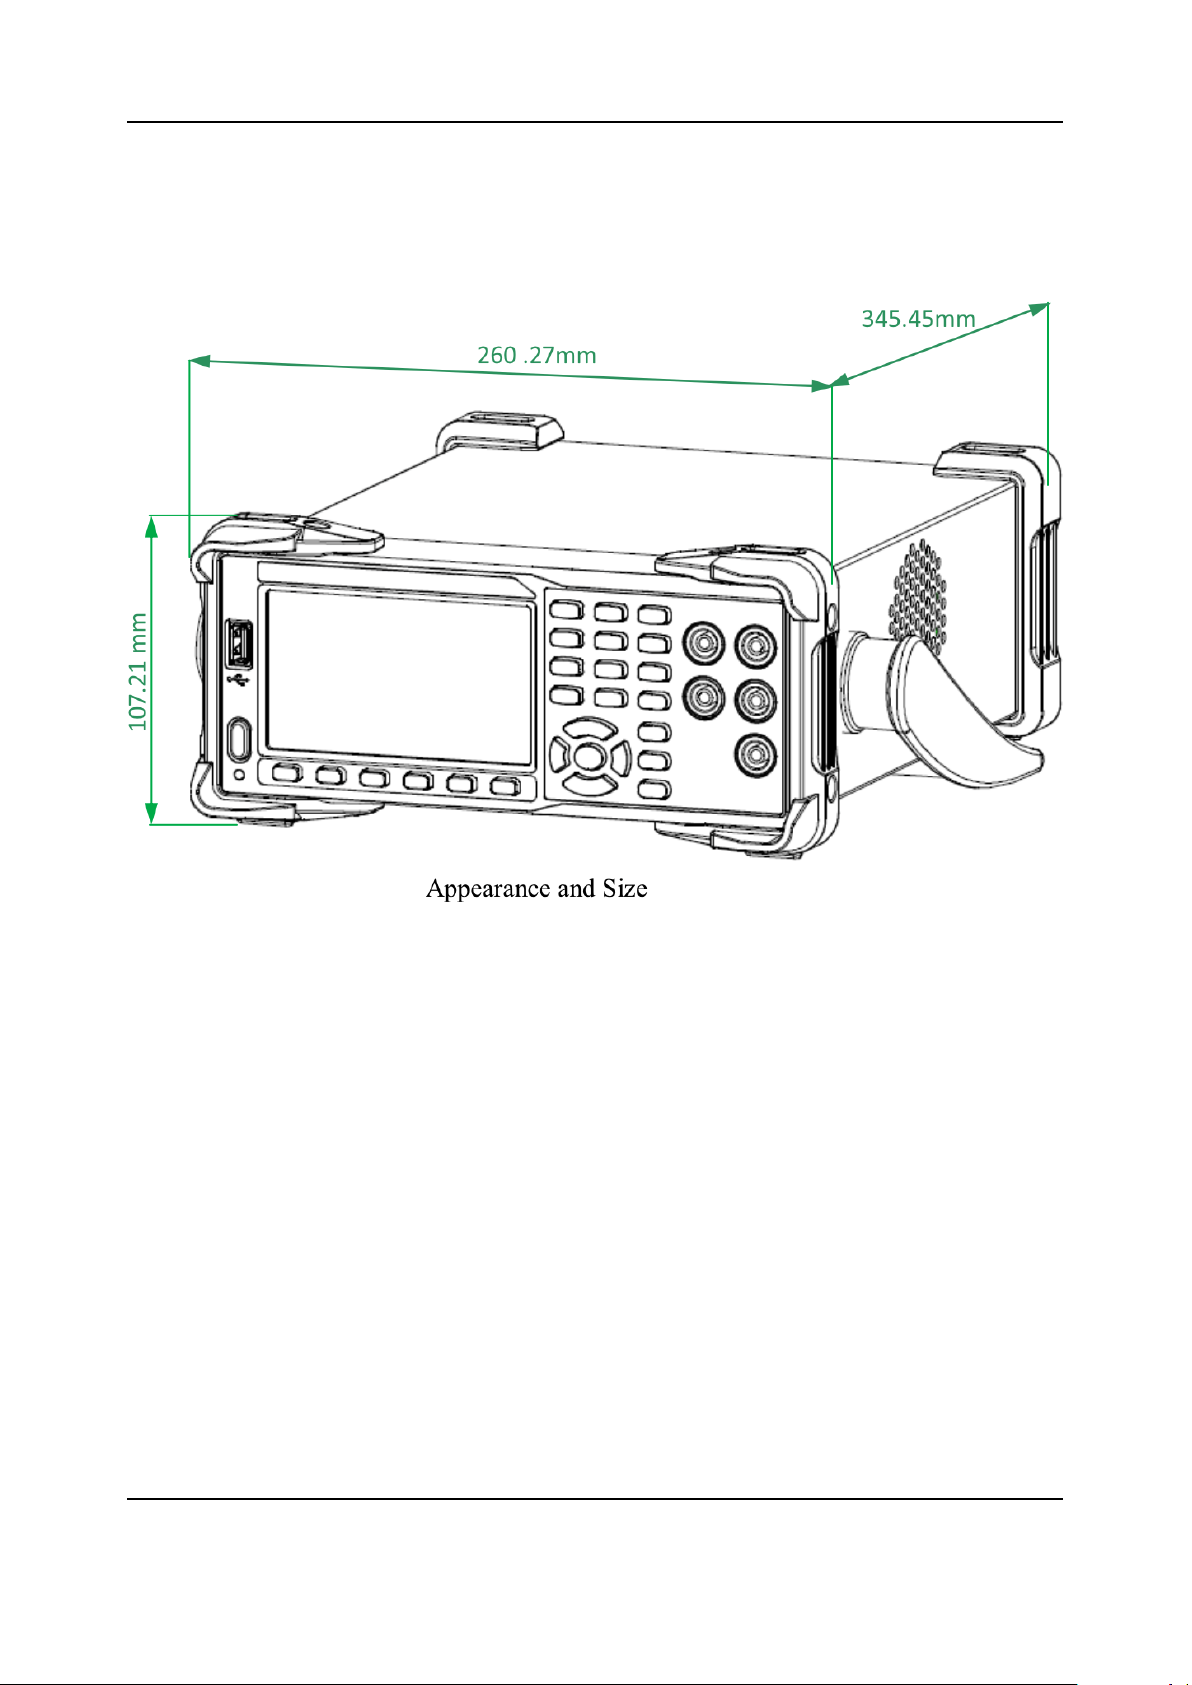
Dimensions
2
Page 13
T3DAQ1-16 User Manual
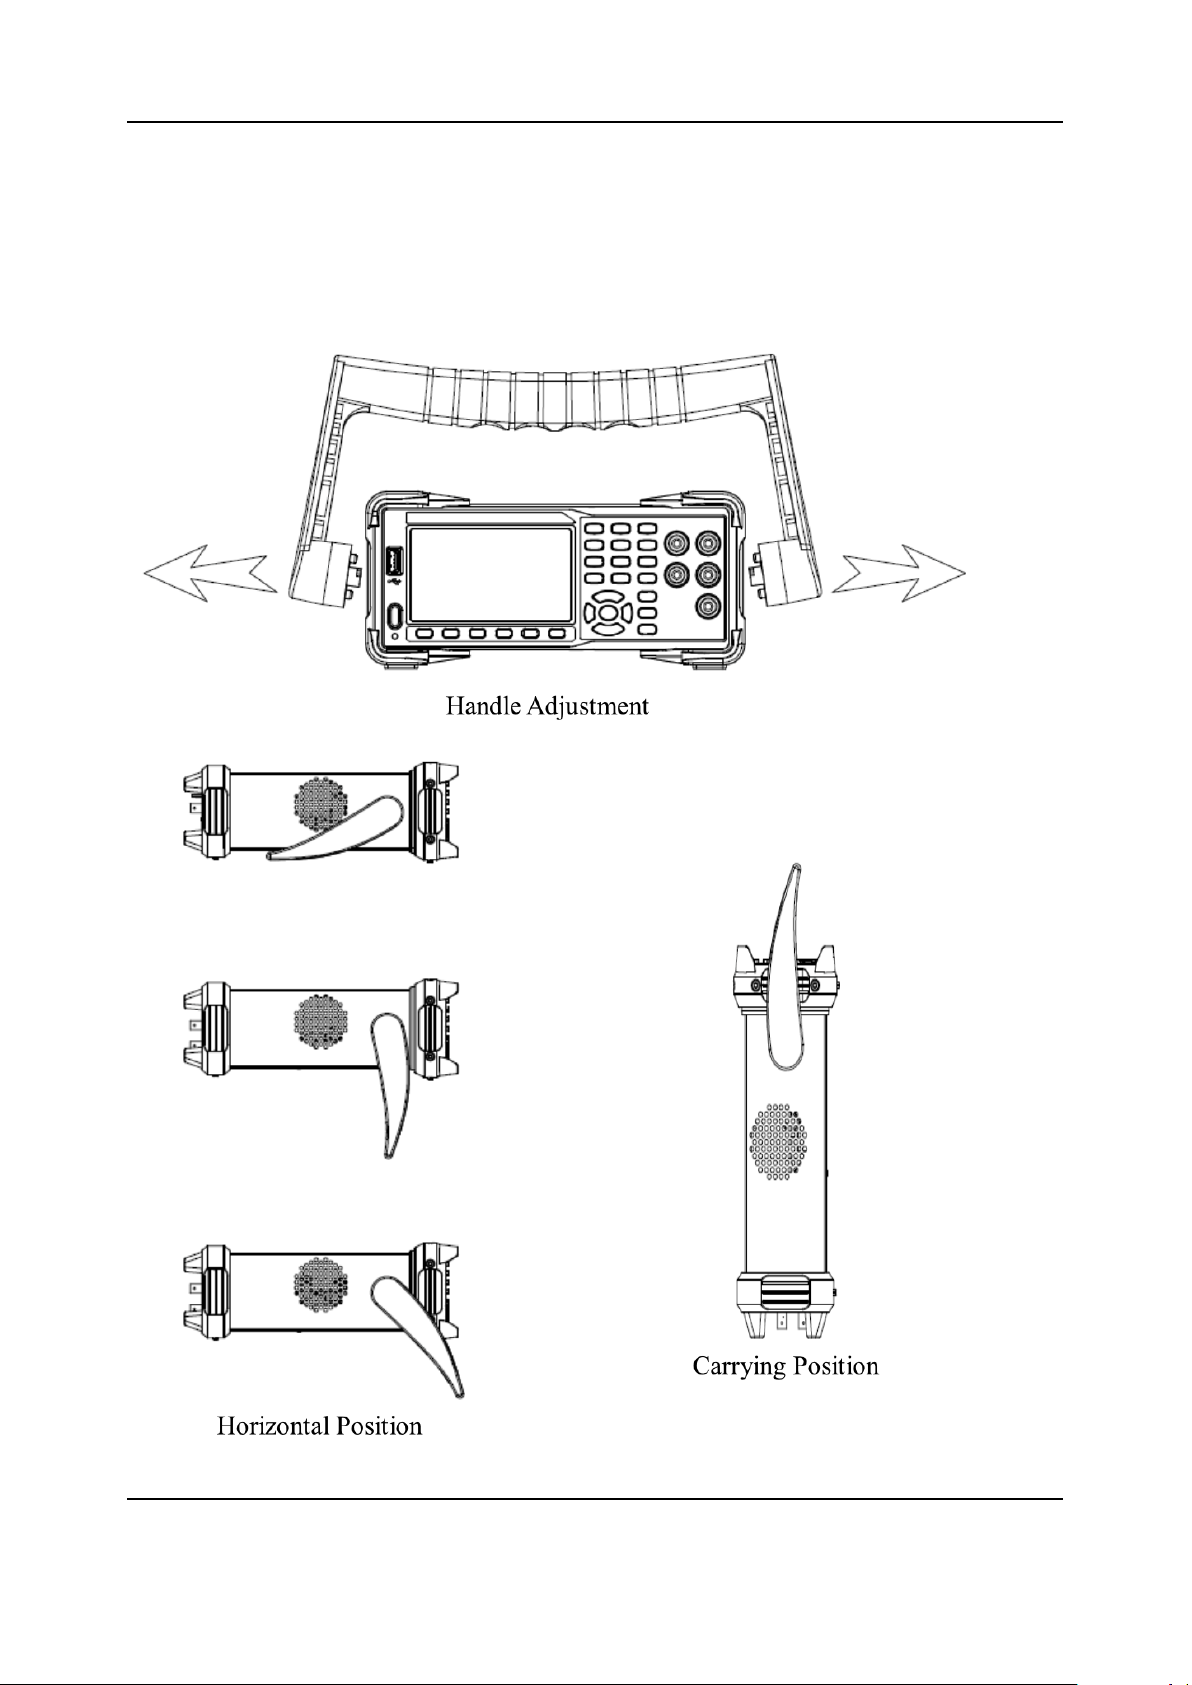
Handle Adjustment
To adjust the handle position of the DAQ, grip the handle by the two sides and pull outward. Then,
rotate the handle to the appropriate position.
3
Page 14
T3DAQ1-16 User Manual
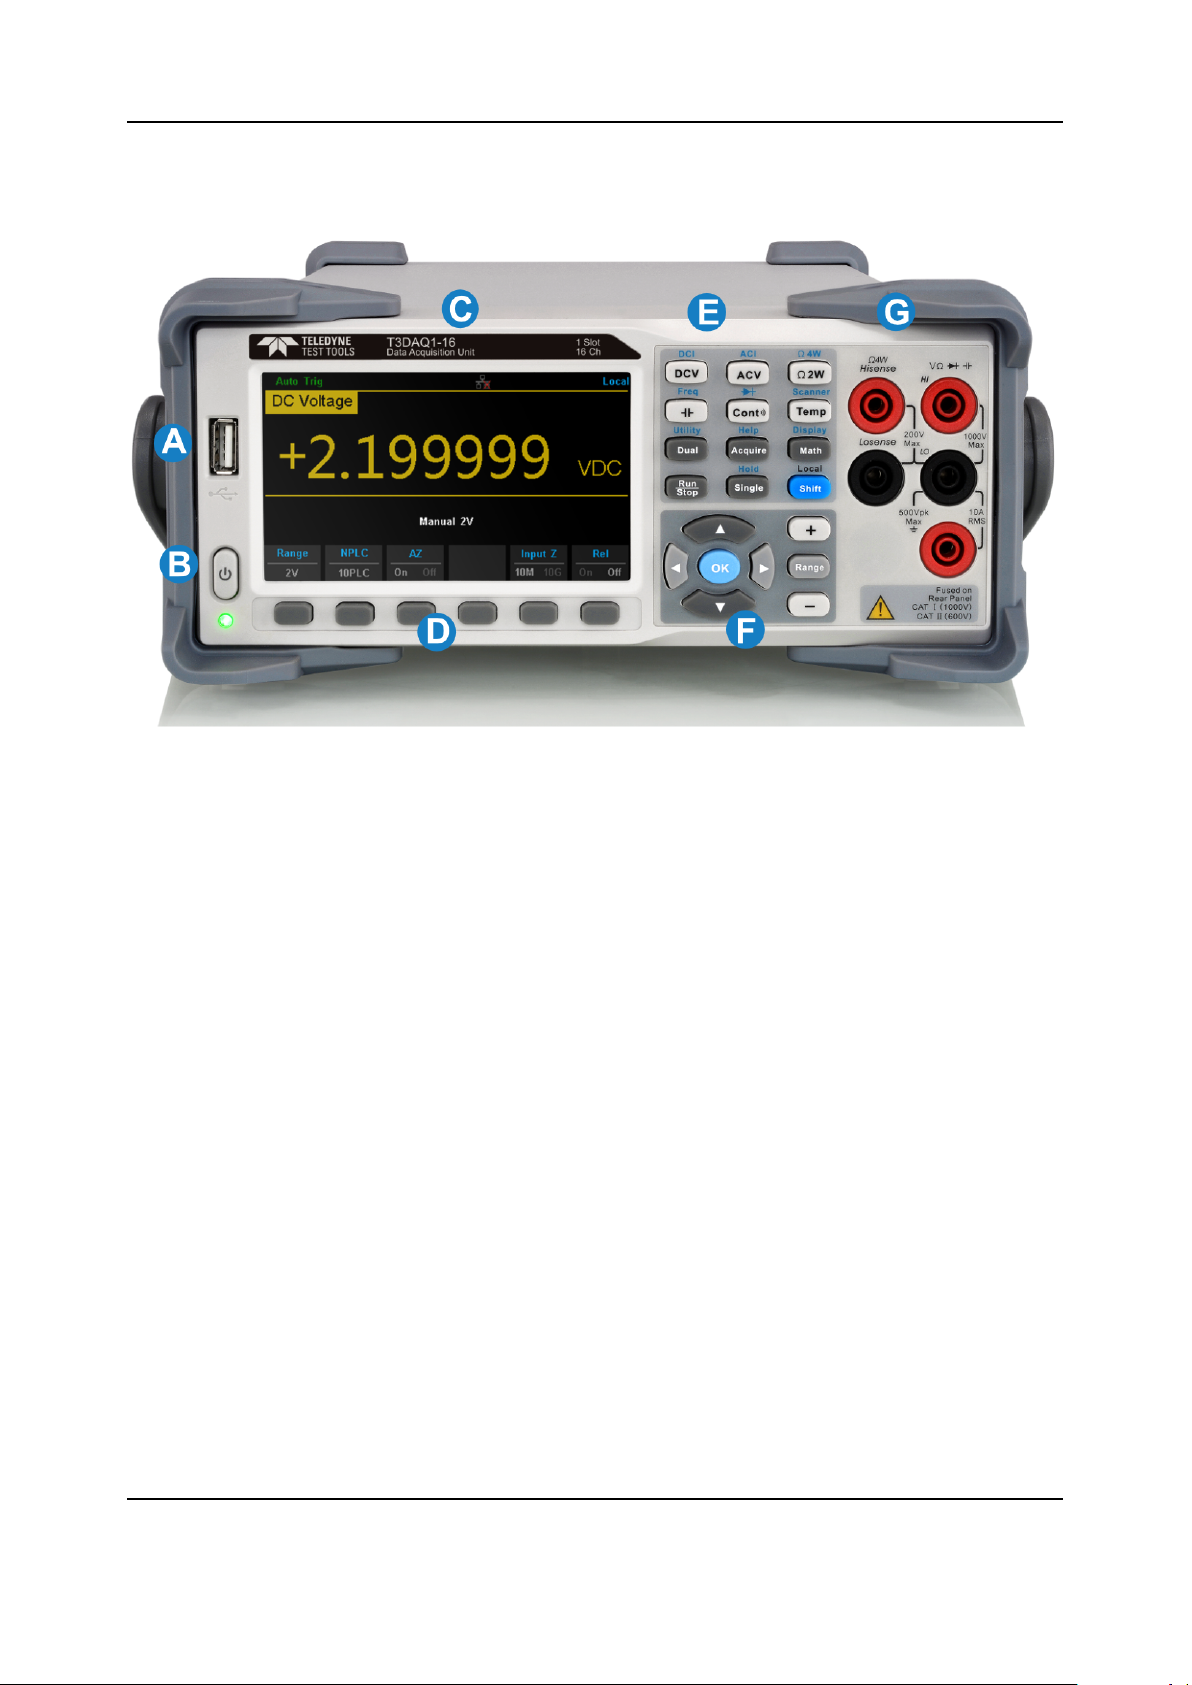
Front Panel
A USB Host
Users can store the current state or measurement data into a USB storage device. Users
can also read the state files or updated firmware from a USB storage device.
B Power Key
Turn the instrument on or off.
C LCD Display
The instrument provides a 4.3 inch high resolution color TFT-LCD display screen with 480*272
pixels that displays the function menus, measurement parameter settings, system status, and
prompt messages.
D Menu Operation Keys
Press any softkey to activate the corresponding menu.
4
Page 15
T3DAQ1-16 User Manual
E Measurement and Assistant Function Keys
5
Page 16
T3DAQ1-16 User Manual
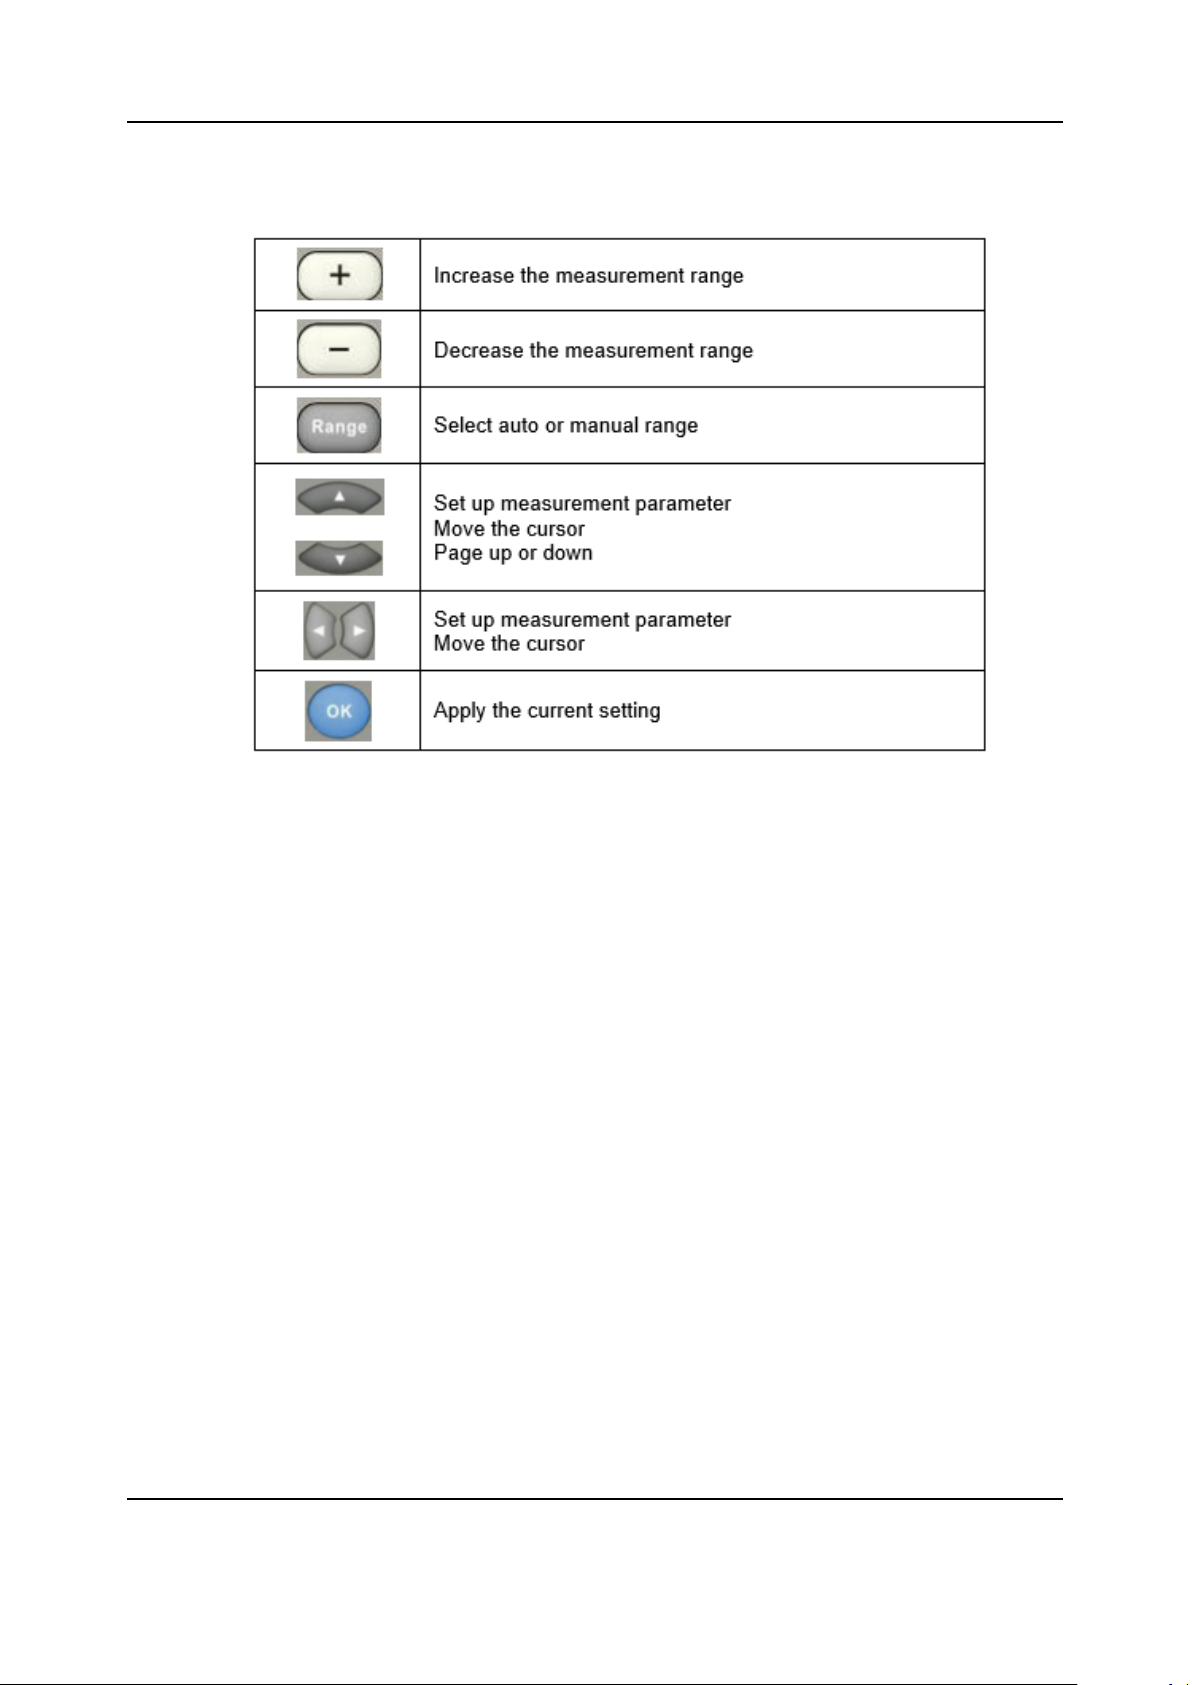
F Range and Direction Keys
G Signal Input Terminals
The measured signal (device) will be connected into the DAQ through these terminals. Different measurement objects have different connection methods.
For details, please refer to “Measurement Connections”.
6
Page 17
T3DAQ1-16 User Manual
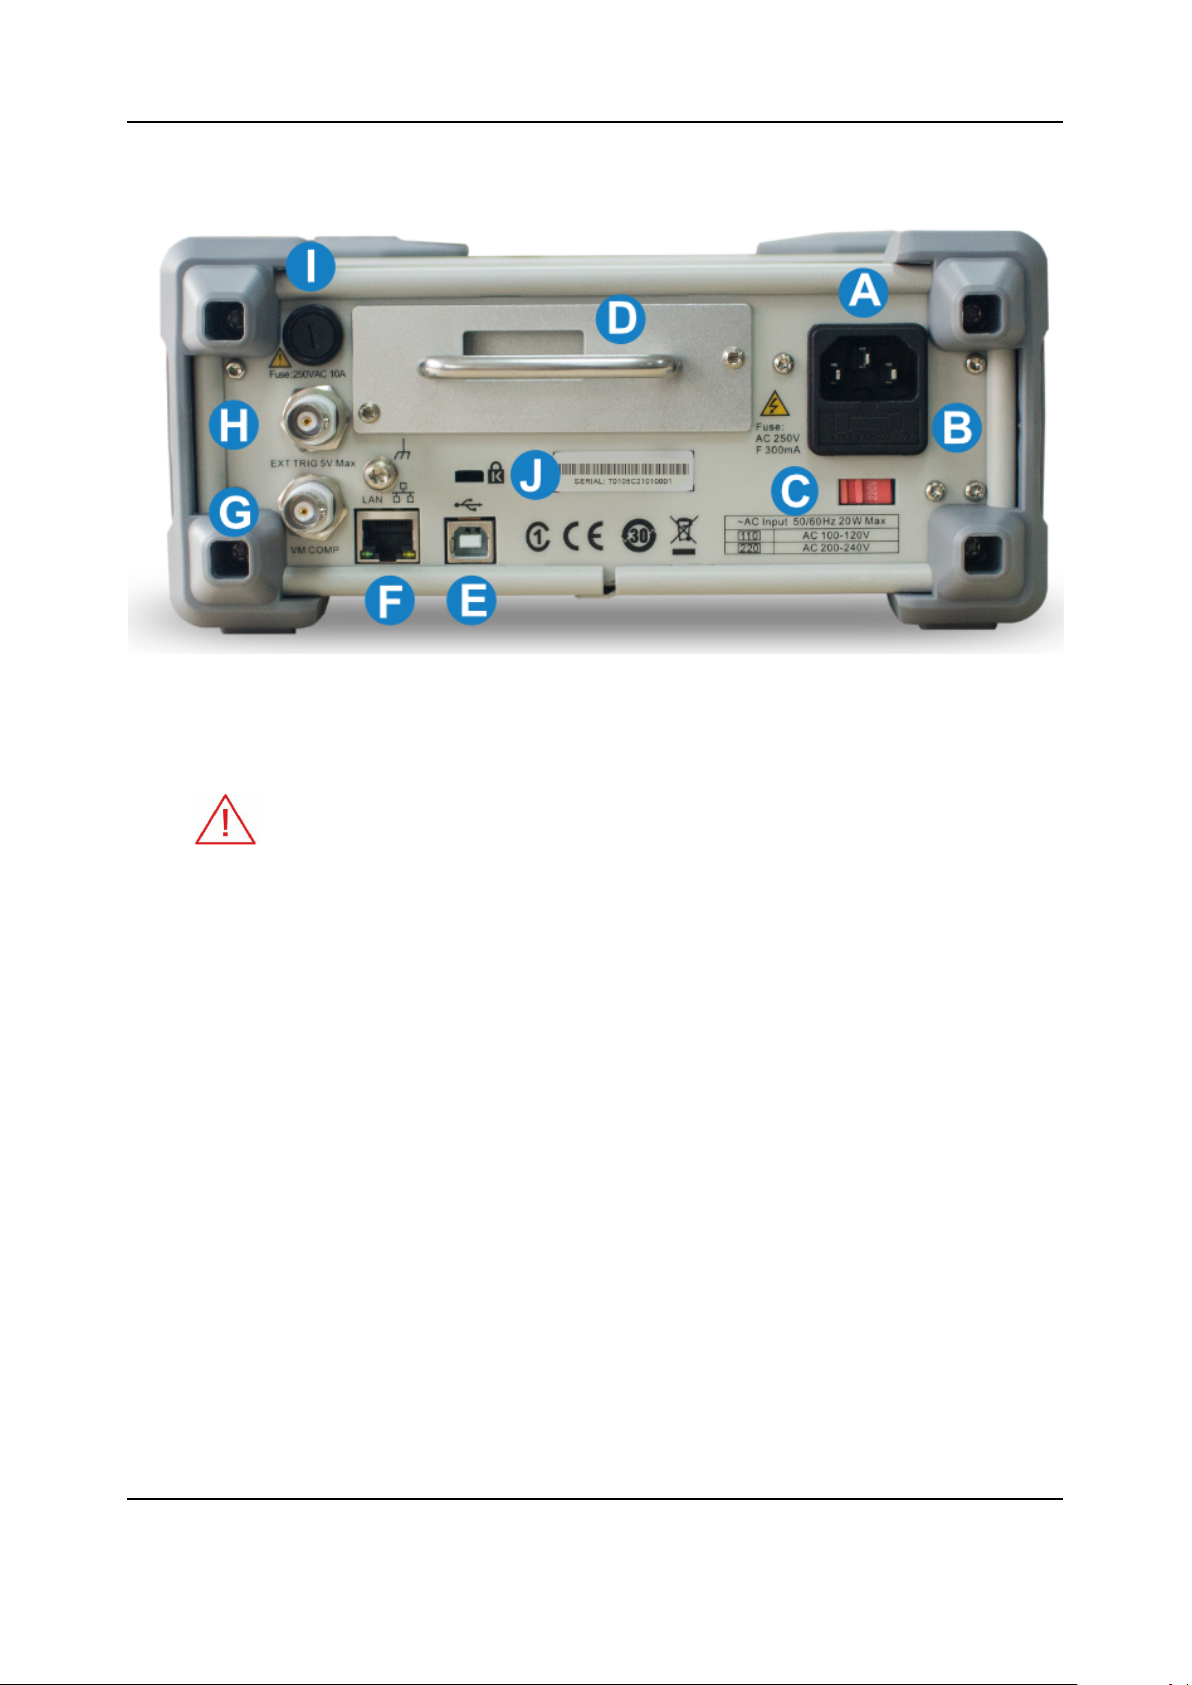
Rear Panel
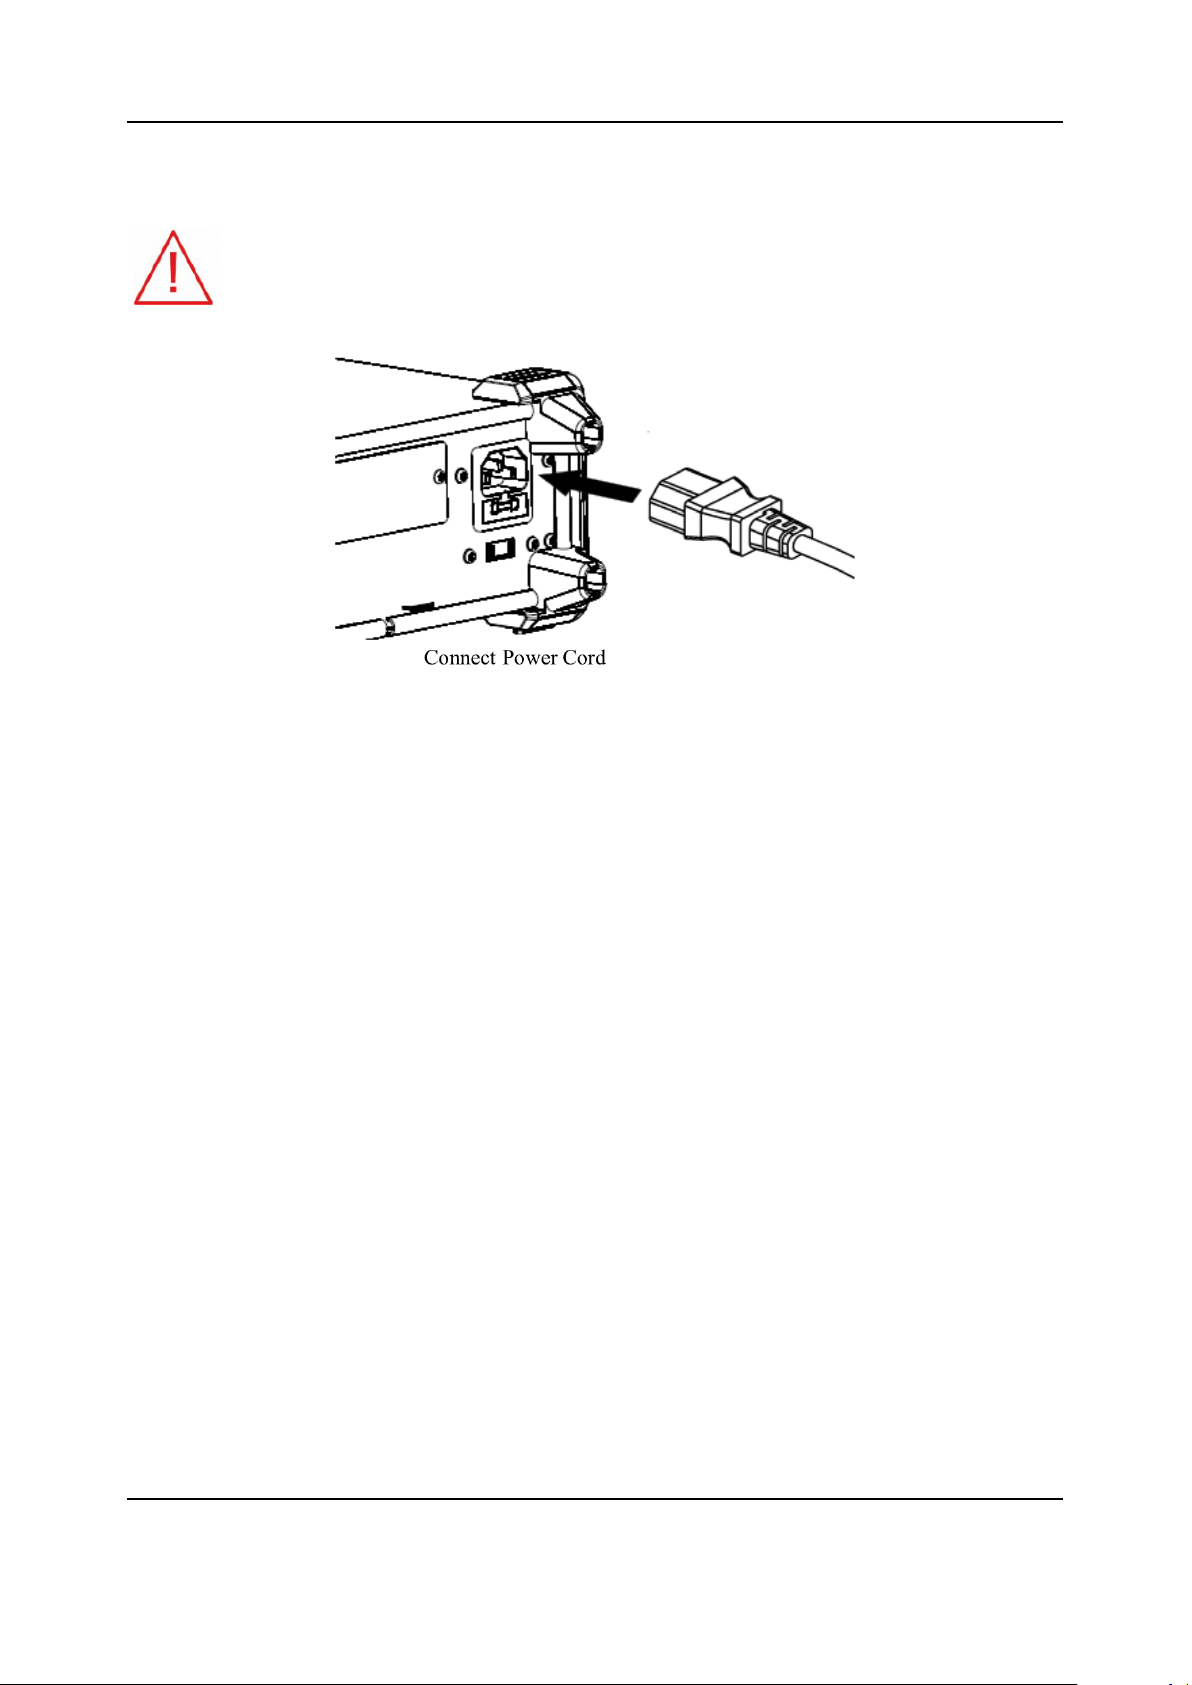
A Power Socket
The DAQ accepts two types of AC supplies. Please use the power cord provided
in the accessories to connect the DAQ to the AC power through this socket.
Note: The correct voltage scale must be first selected (through the Voltage Selector) before power connection.
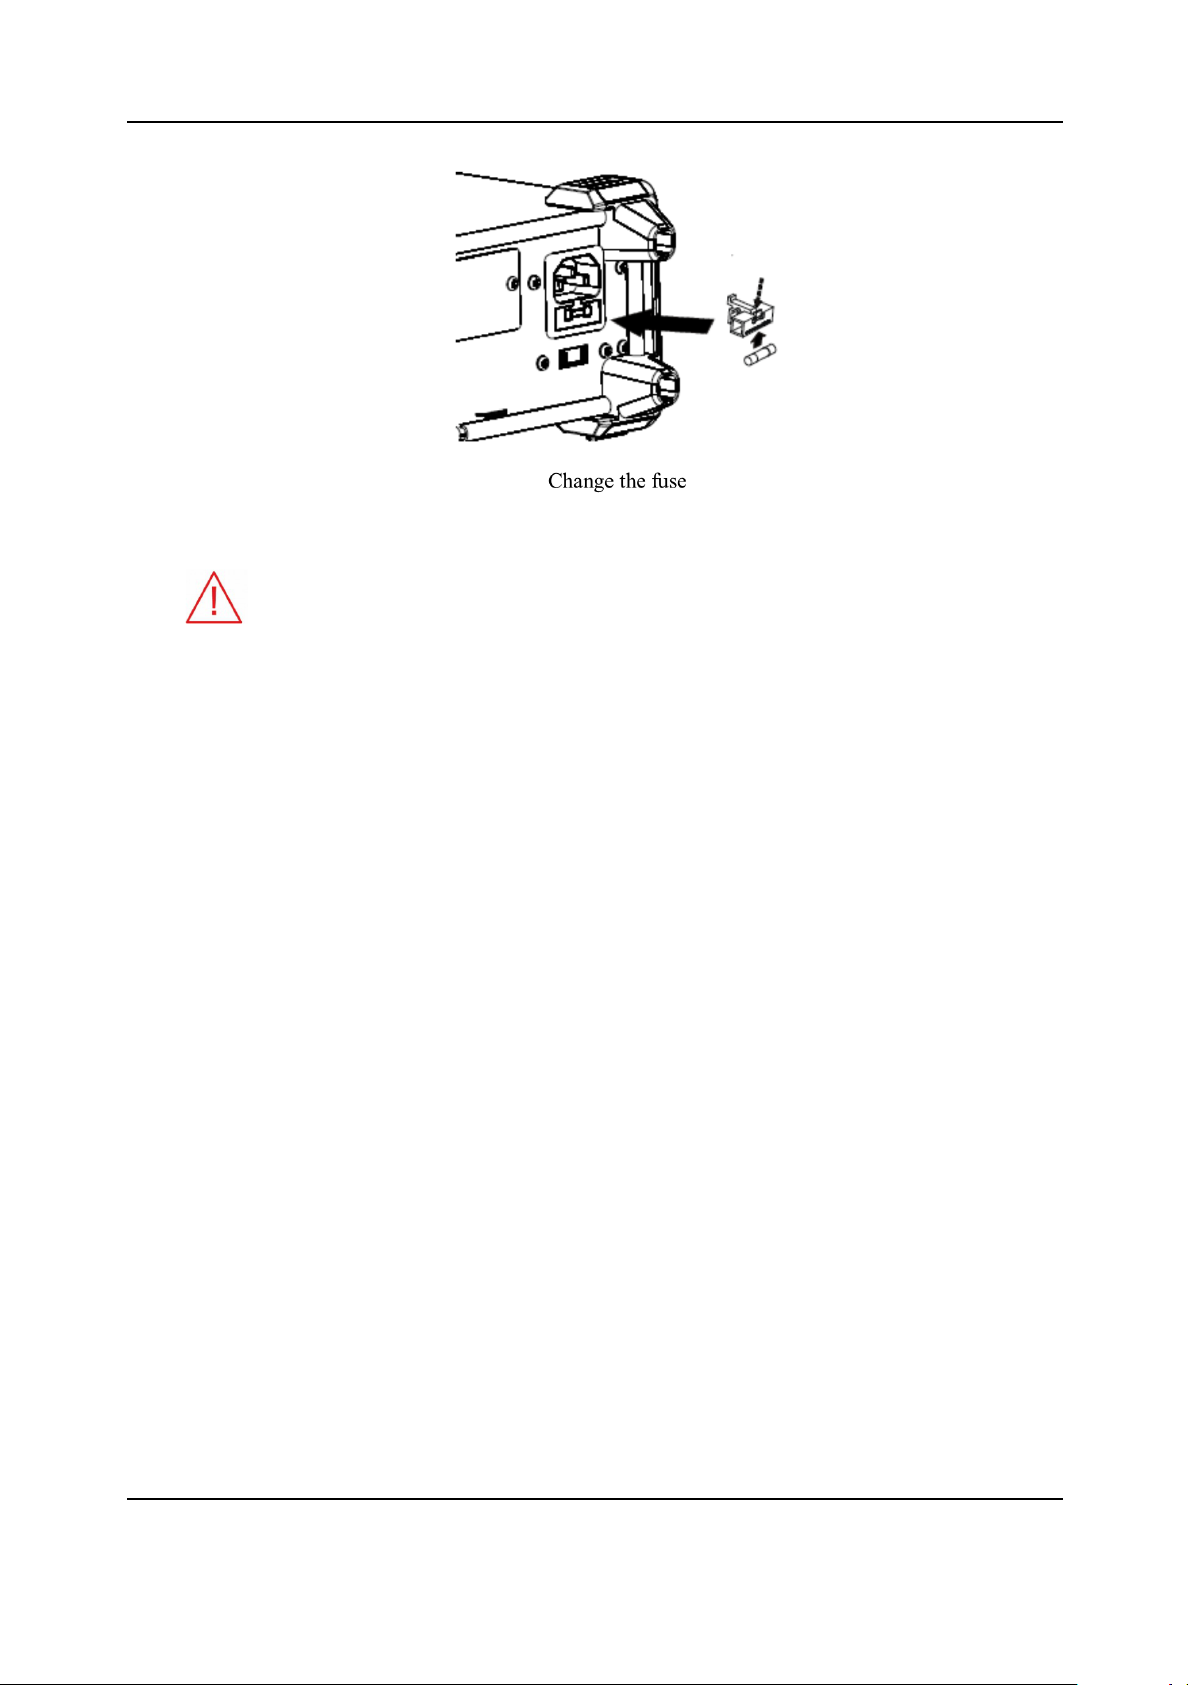
B Power Fuse
The DAQ is already installed with a power fuse before leaving factory. To change the fuse
please:
• Turn off the DAQ and remove the power cord.
• Press down the block tongue using a straight screwdriver (in the direction of the dotted
arrow in the figure below) and pull out of the fuse seat.
• Select a proper voltage scale.
• Replace a specified fuse.
• Reinstall the fuse seat into the slot.
7
Page 18
T3DAQ1-16 User Manual
C AC Voltage Selector
Select the correct voltage scale (110 V or 220 V) for the AC supply used.
D 16-channel Data Acquisition Module
E USB Device
Connect the PC through this interface. SCPI commands or PC software can be used to
control the DAQ remotely.
F LAN
Through this interface, the DAQ can be connected to the network for remote control.
G VMC Output
The DAQ outputs a low-true pulse from the [VM Comp] connector after every measurement.
H Ext Trigger
Trigger the DAQ by connecting a trigger pulse through the [Ext Trig] connector. Note the
external trigger source must be selected.
I Current Input Fuse
The DAQ is already installed with a current Input fuse to provide 10 A maximum input protection before leaving factory. To replace a new one, please:
(a) Turn off the DAQ and remove the power cord.
(b) Turn the fuse seat counterclockwise as shown in the figure using a straight screw driver
and then pull out the fuse seat
(c) Place a new 10 A specified fuse.
(d) Reinstall the fuse seat into the slot.
J Instrument Kensington Lock Point
A Kensington lock (not supplied) can be used to lock the DAQ to a fixed place if necessary.
8
Page 19
T3DAQ1-16 User Manual
Starting the DAQ
Before connecting the instrument to a power source please adjust the AC voltage
selector on the rear panel of your DAQ according to your local power supply voltage.
Then connect the power cord as shown in the following figure.
Press the Power key on the front panel to turn on the DAQ. If the DAQ does not start normally,
then try the following:
1. Make sure the power cord is in good connection and connected to the DAQ and the wall
socket.
2. Ensure that the wall socket has power and is turned on.
3. Try to restart the DAQ, if it fails, check the power fuse and replace with a new one if necessary.
4. If the problem still remains, please contact the Teledyne LeCroy service department for help.
9
Page 20
T3DAQ1-16 User Manual
Operating Instructions
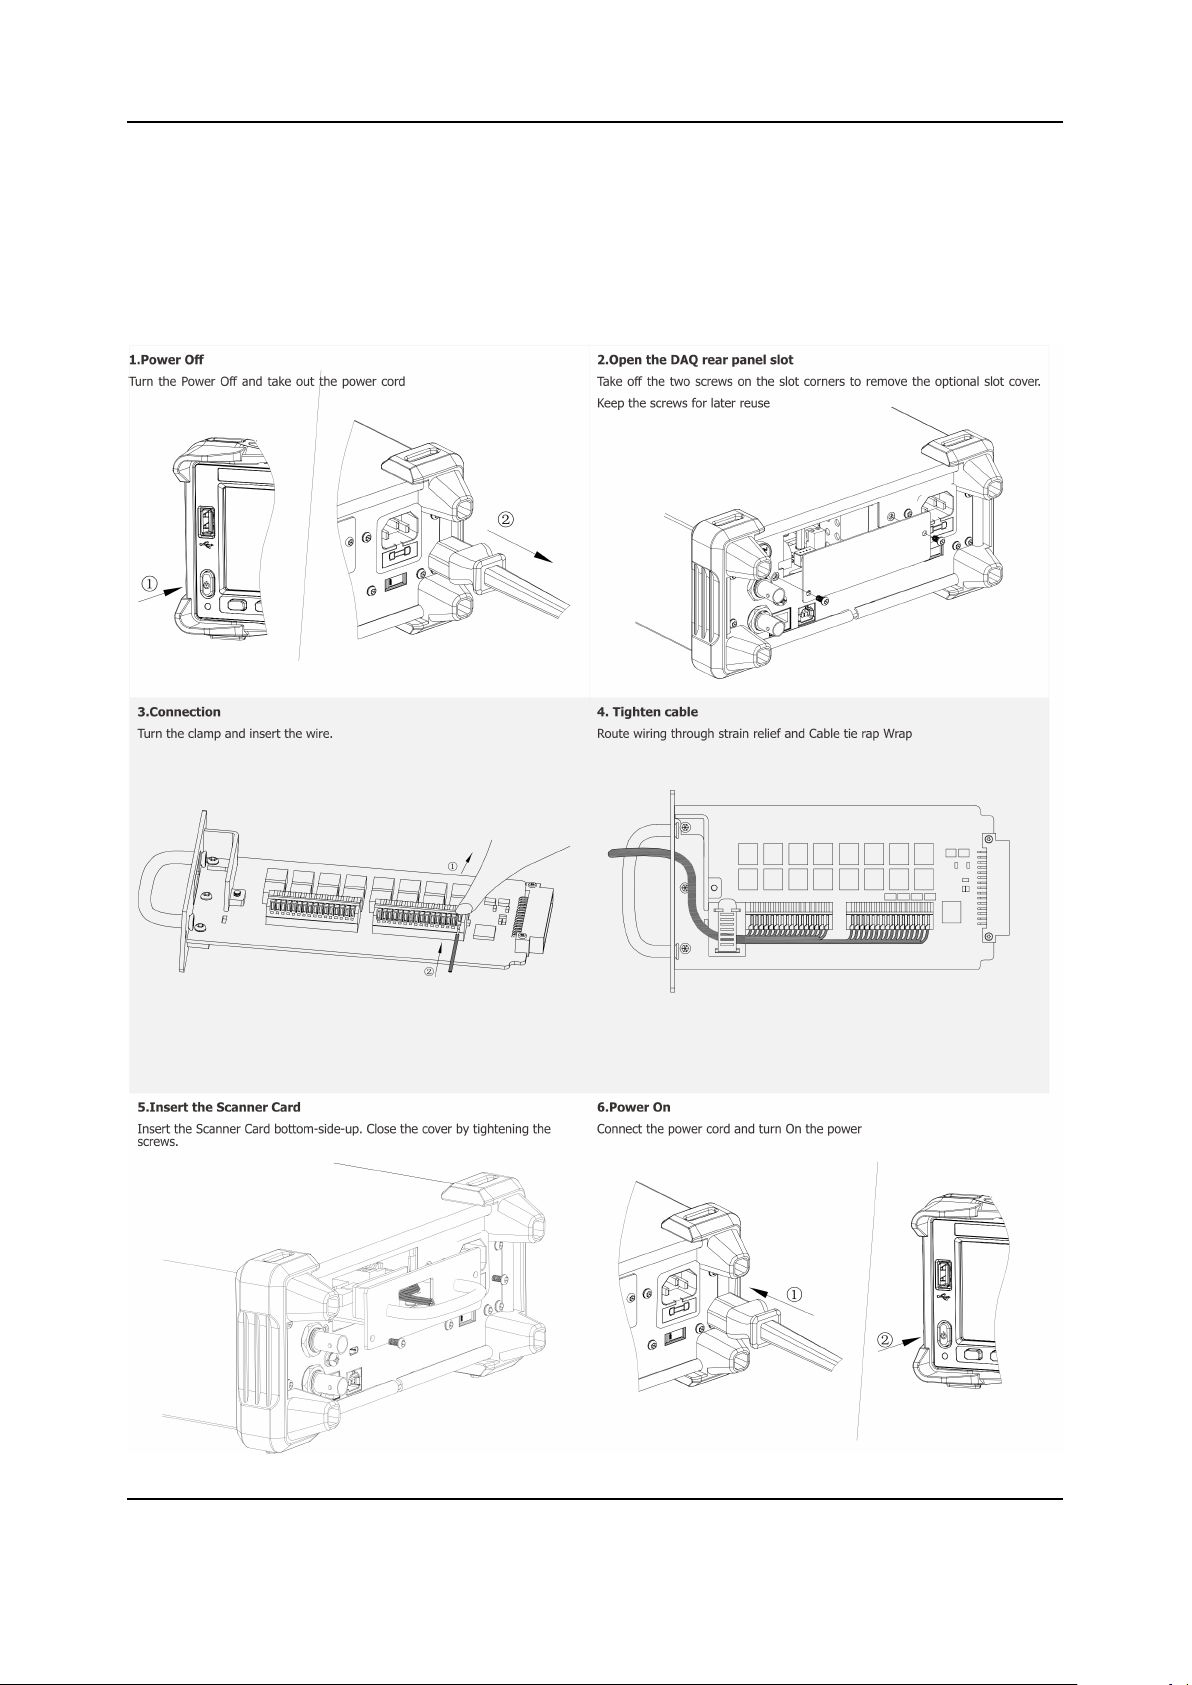
NOTE: The Scanner Card is not designed to be ”Hot Swappable”.
Please make sure the instrument is turned off before installation or removal of the Scanner Card.
Hot swapping the card could cause damage to the instrument and is not covered under warranty.
10
Page 21
T3DAQ1-16 User Manual
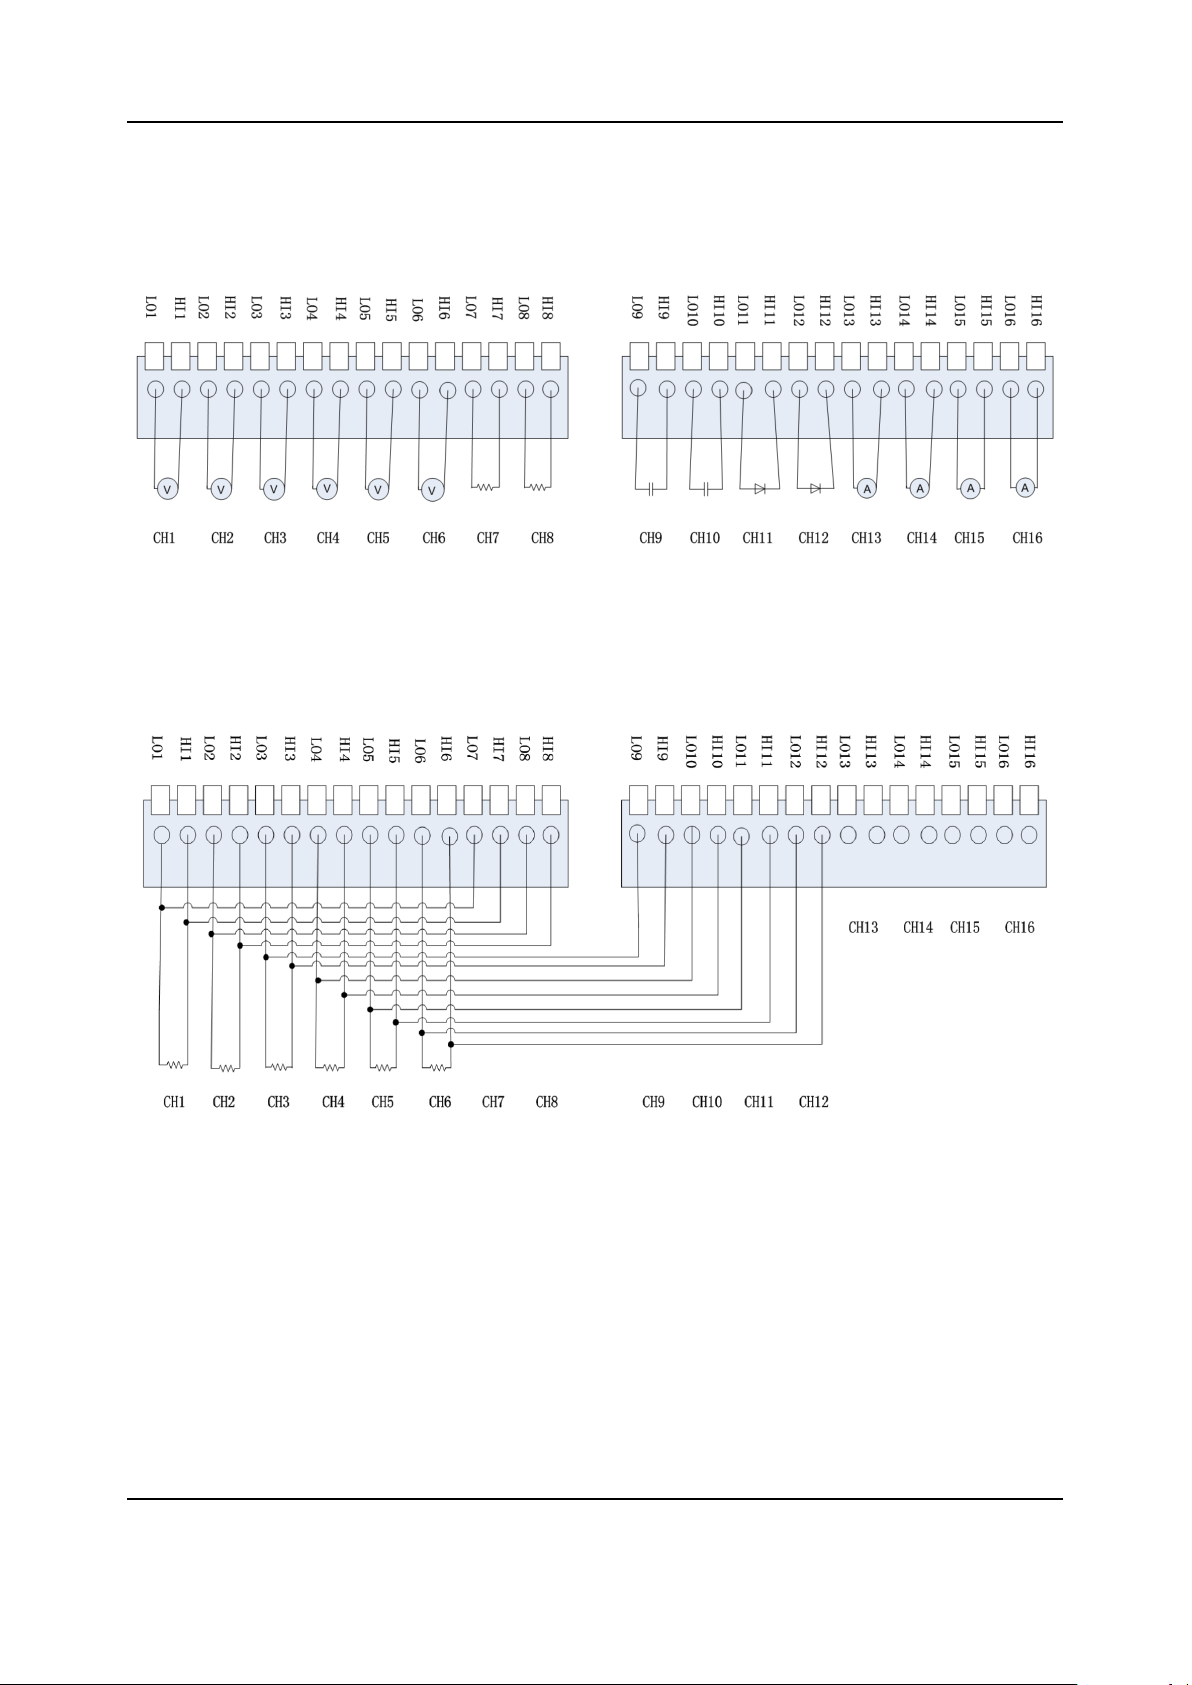
Scanner Card Connections
An example of 2-wired connection application is shown below.
First 12 channels can be used to measure DCV/DCI ACV/ACI/CAP/FREQ/DIODE/CONT/TEMP
and the last 4 channels are dedicated to current measurement.
4-Wire Resistance measurement example is shown below.
CH1 to CH6 can be used for measurements and CH7 to CH12 can be used as sense channels. To
minimize voltage errors, the remote sense connections (CH7,CH8 etc..) should be made as close
to the device-under-test (DUT) as possible.
11
Page 22

T3DAQ1-16 User Manual
Front Panel Operations
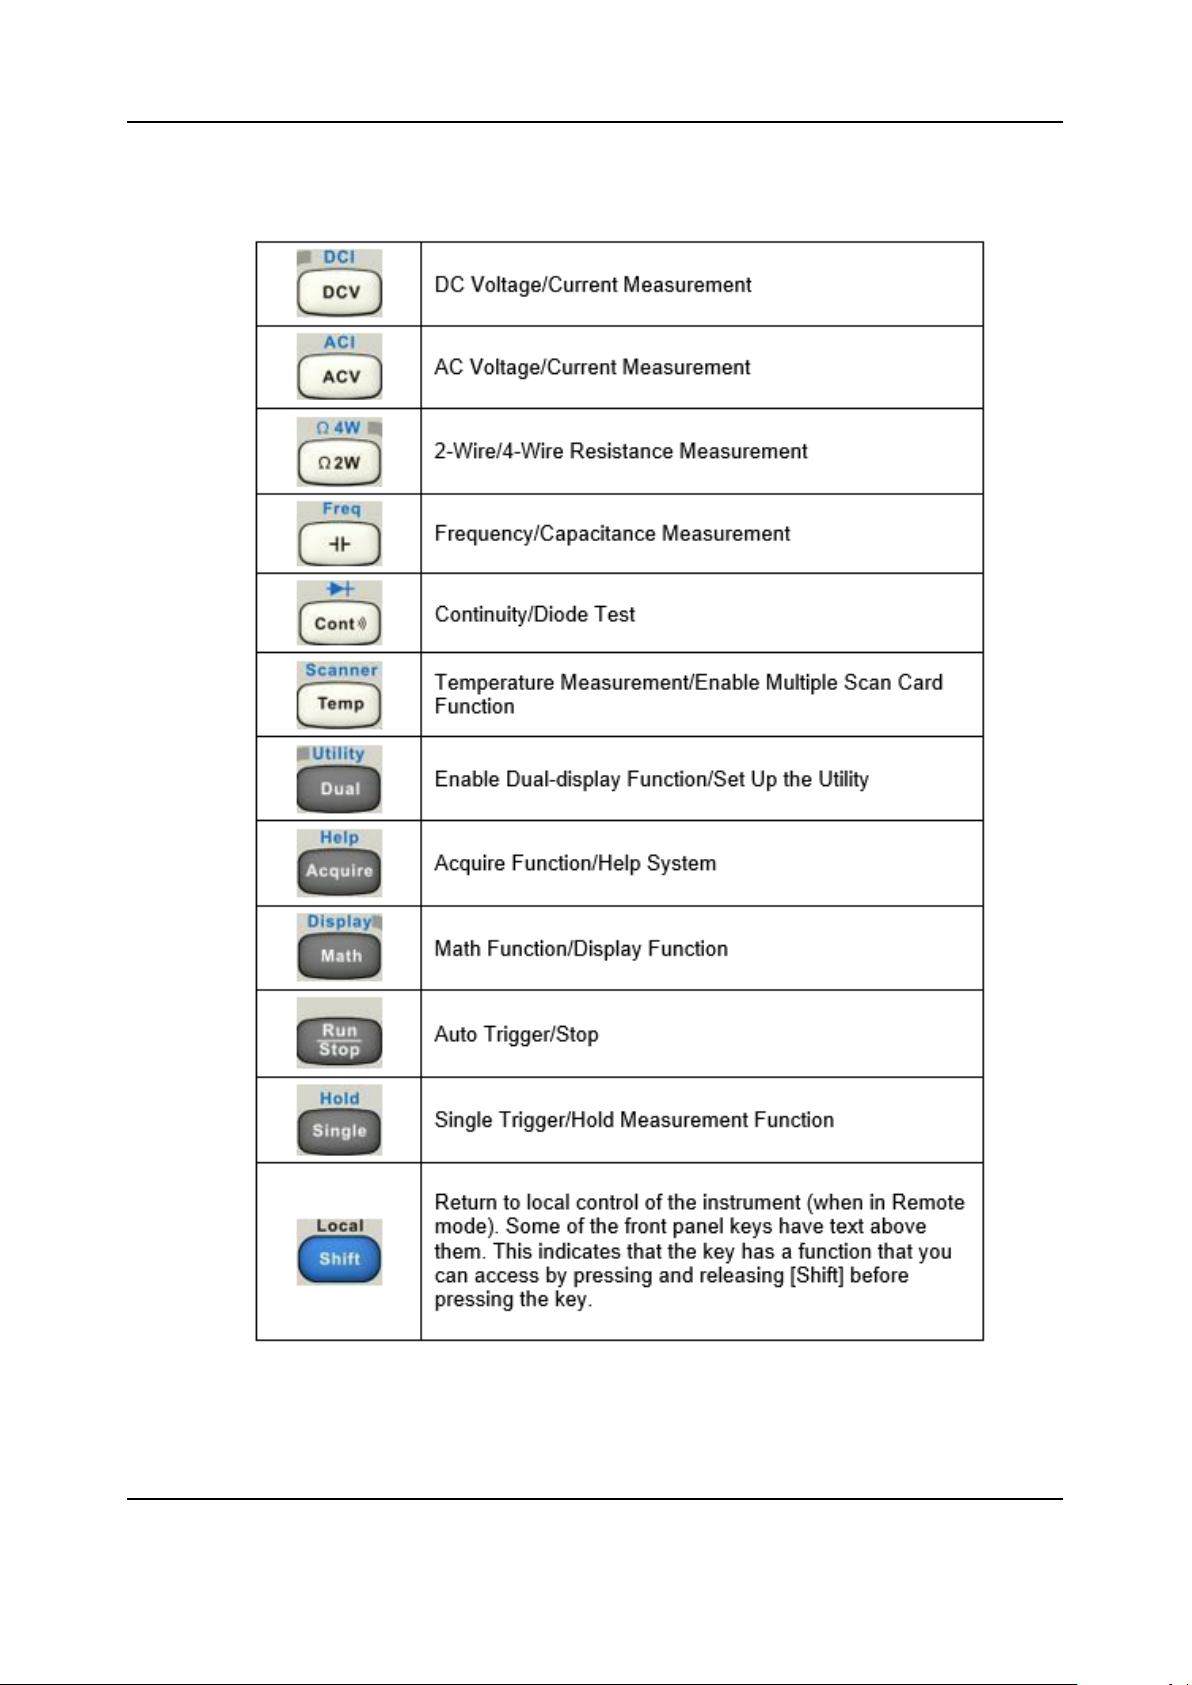
Scanner mode functions can be accessed by pressing ”Shift” and ”Temp” buttons.
The following table gives a short description about different functions available.
Function
Menu Settings Description
Mode Scan/Step Set the operation mode
Sets the duration between
each scan loop (Scan mode)
0ms-
Time
Cycles Auto/Man
Channel
Setup
Start On/Off Start or stop scan operation
Exit Exit the scanner function
1. Operation mode setup
•Scan: Measures all specified channel ranges (Channel MIN-MAX) for each trigger event. Time
settings are applied between each scan for the whole channel range.
•Step: Measures a single channel in the specified range (Channel MIN-MAX) at each trigger event.
Time settings are applied for each channel.
2. Time setup
Use the direction keys to set the duration between each scan loop (Scan mode) or between each
scanned channel (Step mode)
999.999s
or between each scanned
channel (Step mode)
Sets the number of scan operations
Sets the scanned channel
range, measurement function, and measurement parameters
3. Cycles
•Auto: The instrument will scan specified channel circularly after the scan operation start and you
should stop the operation manually.
12
Page 23
T3DAQ1-16 User Manual
•Manual: Sets the number of scan operations by direction keys. The range of the setting is from 1
to 999. After starting the scan operation the instrument will not stop scanning until reaches cycle
number.
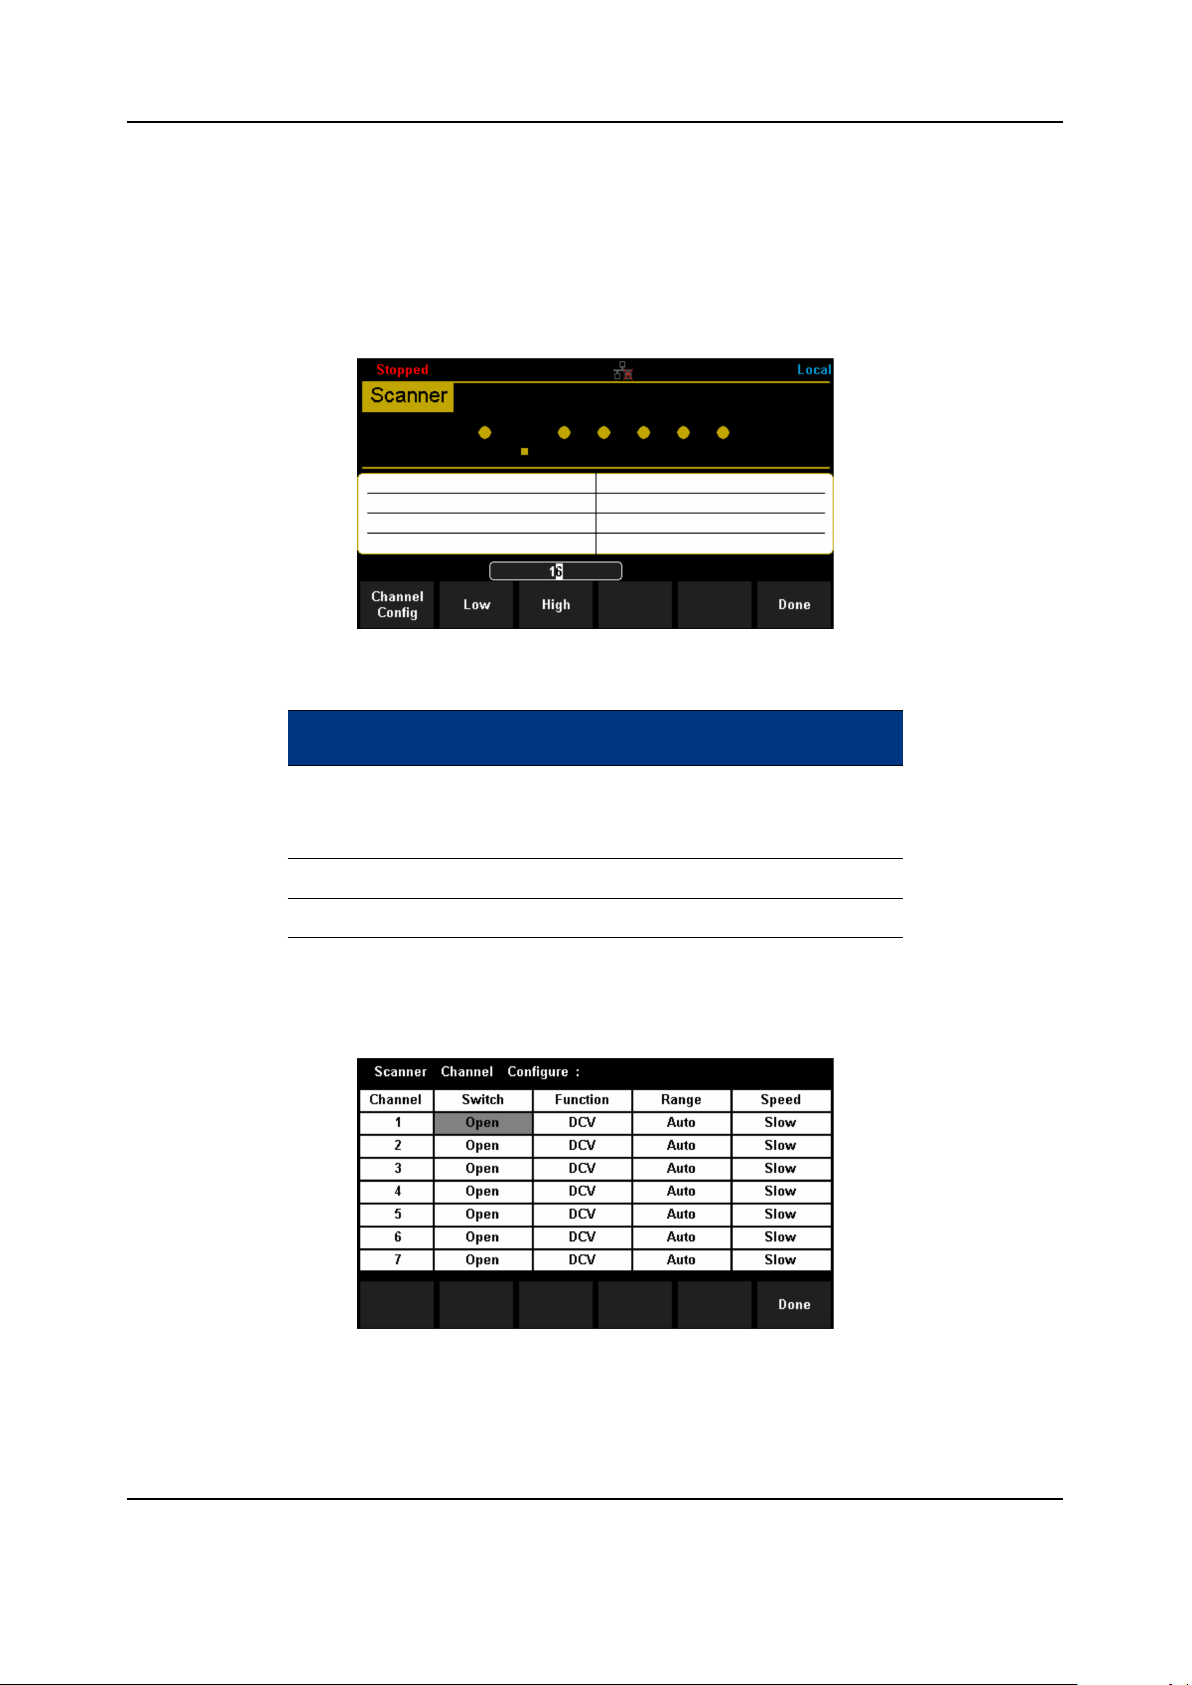
4. Channel setup
Press the [Channel Setup] to enter the setup interface.
The table below gives a brief description of Function menu.
Function
Menu Description
Open/close the channel and set the meaChannel Config
surement function, measurement parame-
ters of specified channel.
Low Set the low value of scanned channel range.
High Set the high value of scanned channel range.
Press the [Channel Setup] to enter the channel configuration interface and set the channel switch, function,
range and speed.
The range setting is applicable for the following functions: DC/AC Voltage (DCV/ACV), 2/4 Wire Resistance
(2W/4W), Capacitance (CAP), Frequency (FRQ).
Ranges available for various functions is given below.
13
Page 24
T3DAQ1-16 User Manual
Function
Menu Description
DCV/ACV/
FRQ Auto, 200mV, 2V, 20V, 200V
DCI/ACI 2A (fixed)
Auto, 200Ω, 2kΩ, 20kΩ, 200kΩ, 2MΩ, 10MΩ,
2W/4W
The scanner function provides two measurement speeds: Fast (50 reading/s) and Slow (5 reading/s). (Fast:
1PLC, Slow: 10 PLC)
The speed setting is applicable for the following functions: DC/AC Voltage (DCV/ACV), 2/4 Wire Resistance
(2W/4W)
100MΩ
Operating instructions:
• Move the cursor to choose the wanted parameter by direction keys and the background color of
cursor’s position turns to gray.
• Select the current item by pressing “OK” key and the background color of the selected item turns
to green.
• Set the parameter by up and down direction keys.
• Press “OK” key again to store the setting of the selected item of which the background turns back
to gray. Move the cursor and repeat the prior steps to set the next parameter.
• Press [Done] to save the current settings and return to the higher level menu.
5. Channel range setting
Select [High] or [Low] and then input numerical value by direction keys. Note: The upper limit value
should be always bigger than the lower limit value.
6. Start scan operation
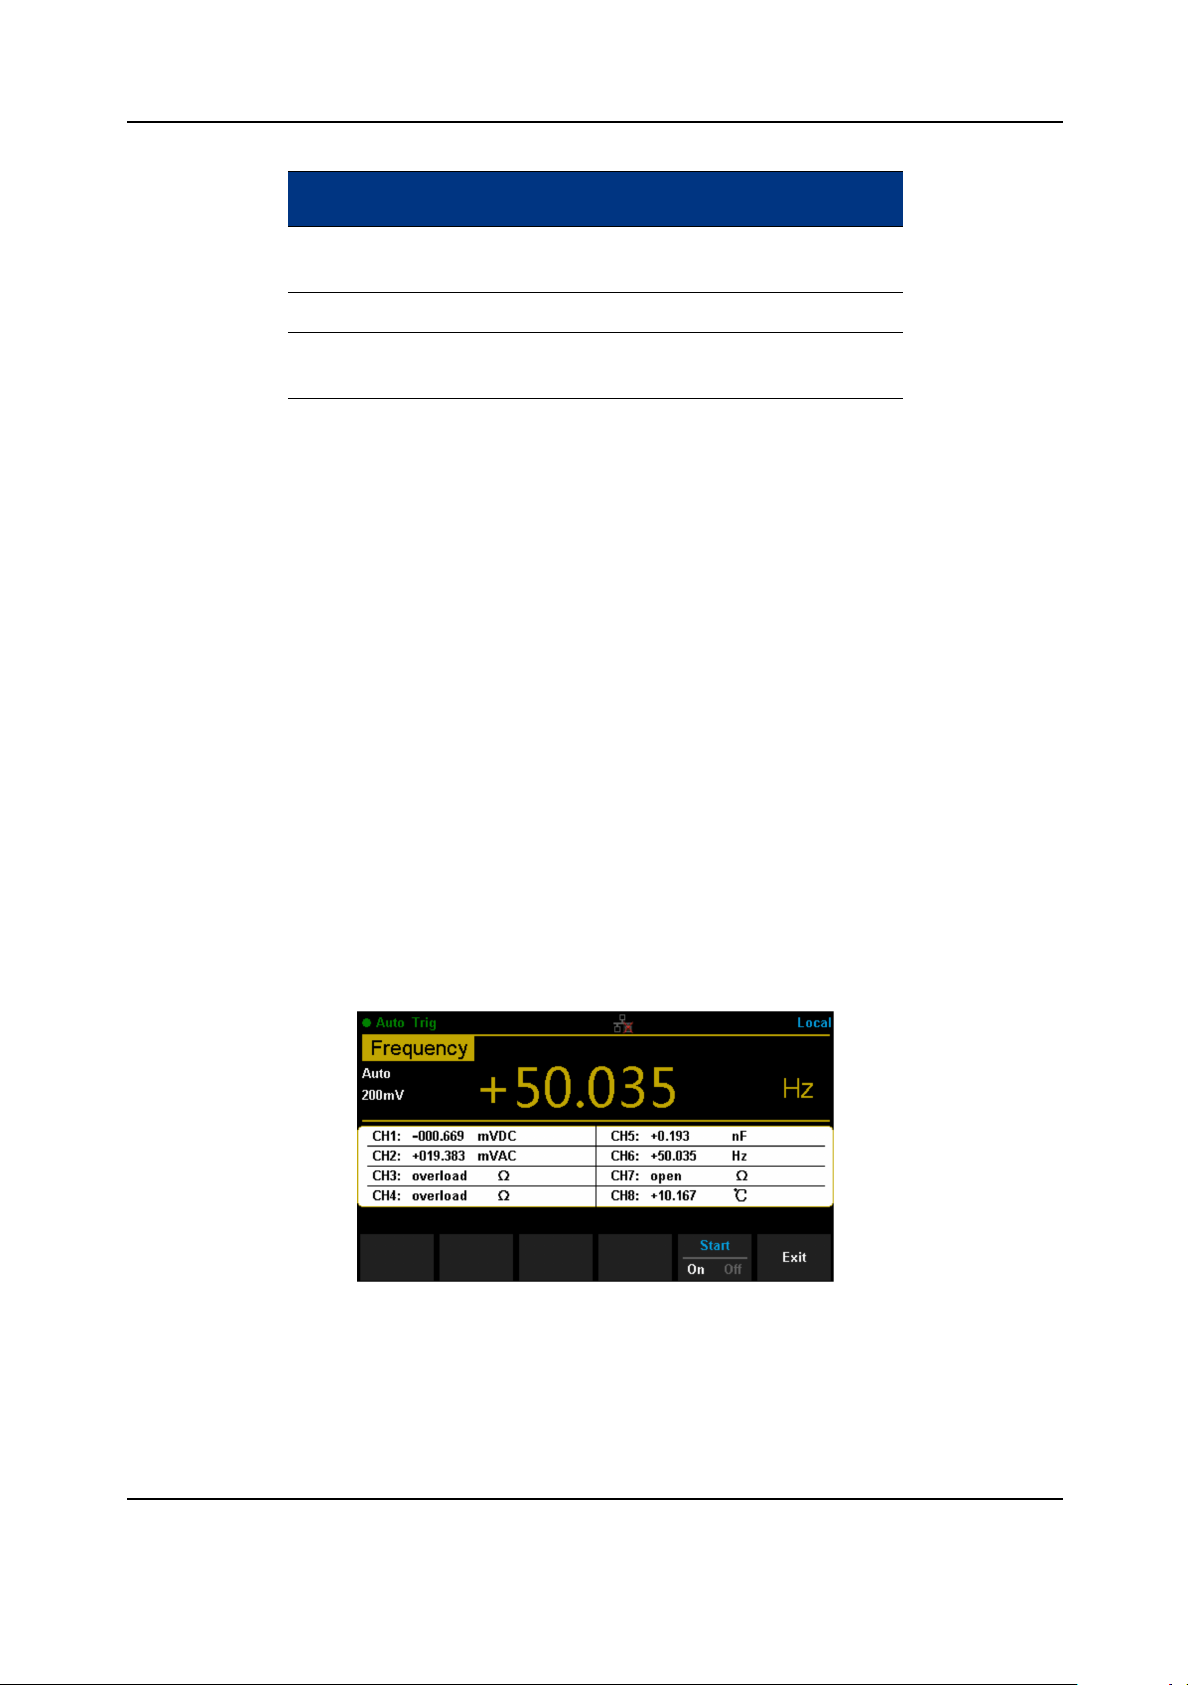
Set the [Start] to on to start the scan operation
The upper part of the interface displays the function, range, and result of the current channel. The
table below records the measurement result of each channel.
7. Enter trend chart and statistics mode (optional operation)
Press ”Shift” and ”Math” to open trend chart and statistics function.
14
Page 25
T3DAQ1-16 User Manual
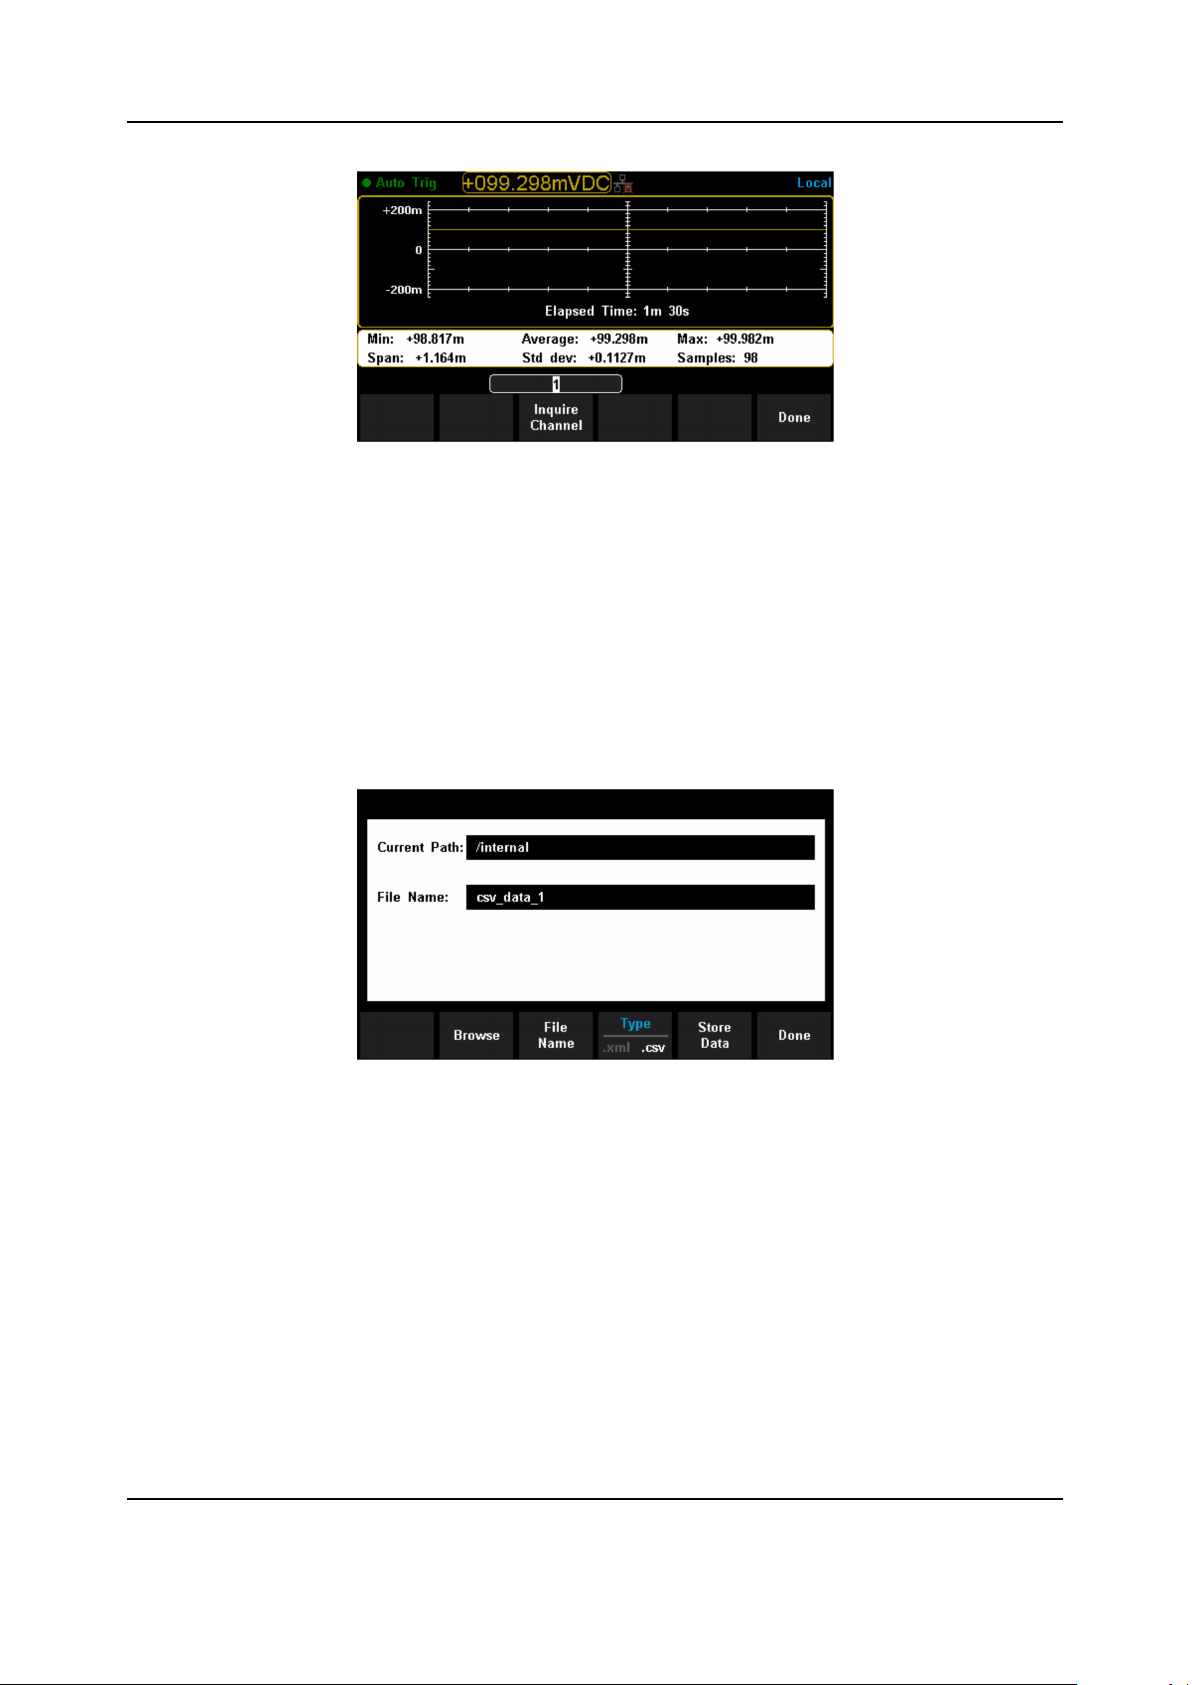
Set the [Inquire Channel] by direction keys and the interface displays the minimum, average, maximum, span, standard deviation, samples and trend chart of measurement results of the setting
channel during the scan operation. Press [Done] to return to higher level menu.
8. Stop scan operation
Set the [Start] to off to stop the scan operation. If the [Cycles] is set to manual, then the instrument
will stop scan when it reaches the cycle number
9. Store measurement data (optional operation)
Press ”Shift” and ”Dual”, then Select [Store/Recall] → [Store Settings] to enter the storage function
interface.
15
Page 26
T3DAQ1-16 User Manual
User Interface
16
Page 27
T3DAQ1-16 User Manual
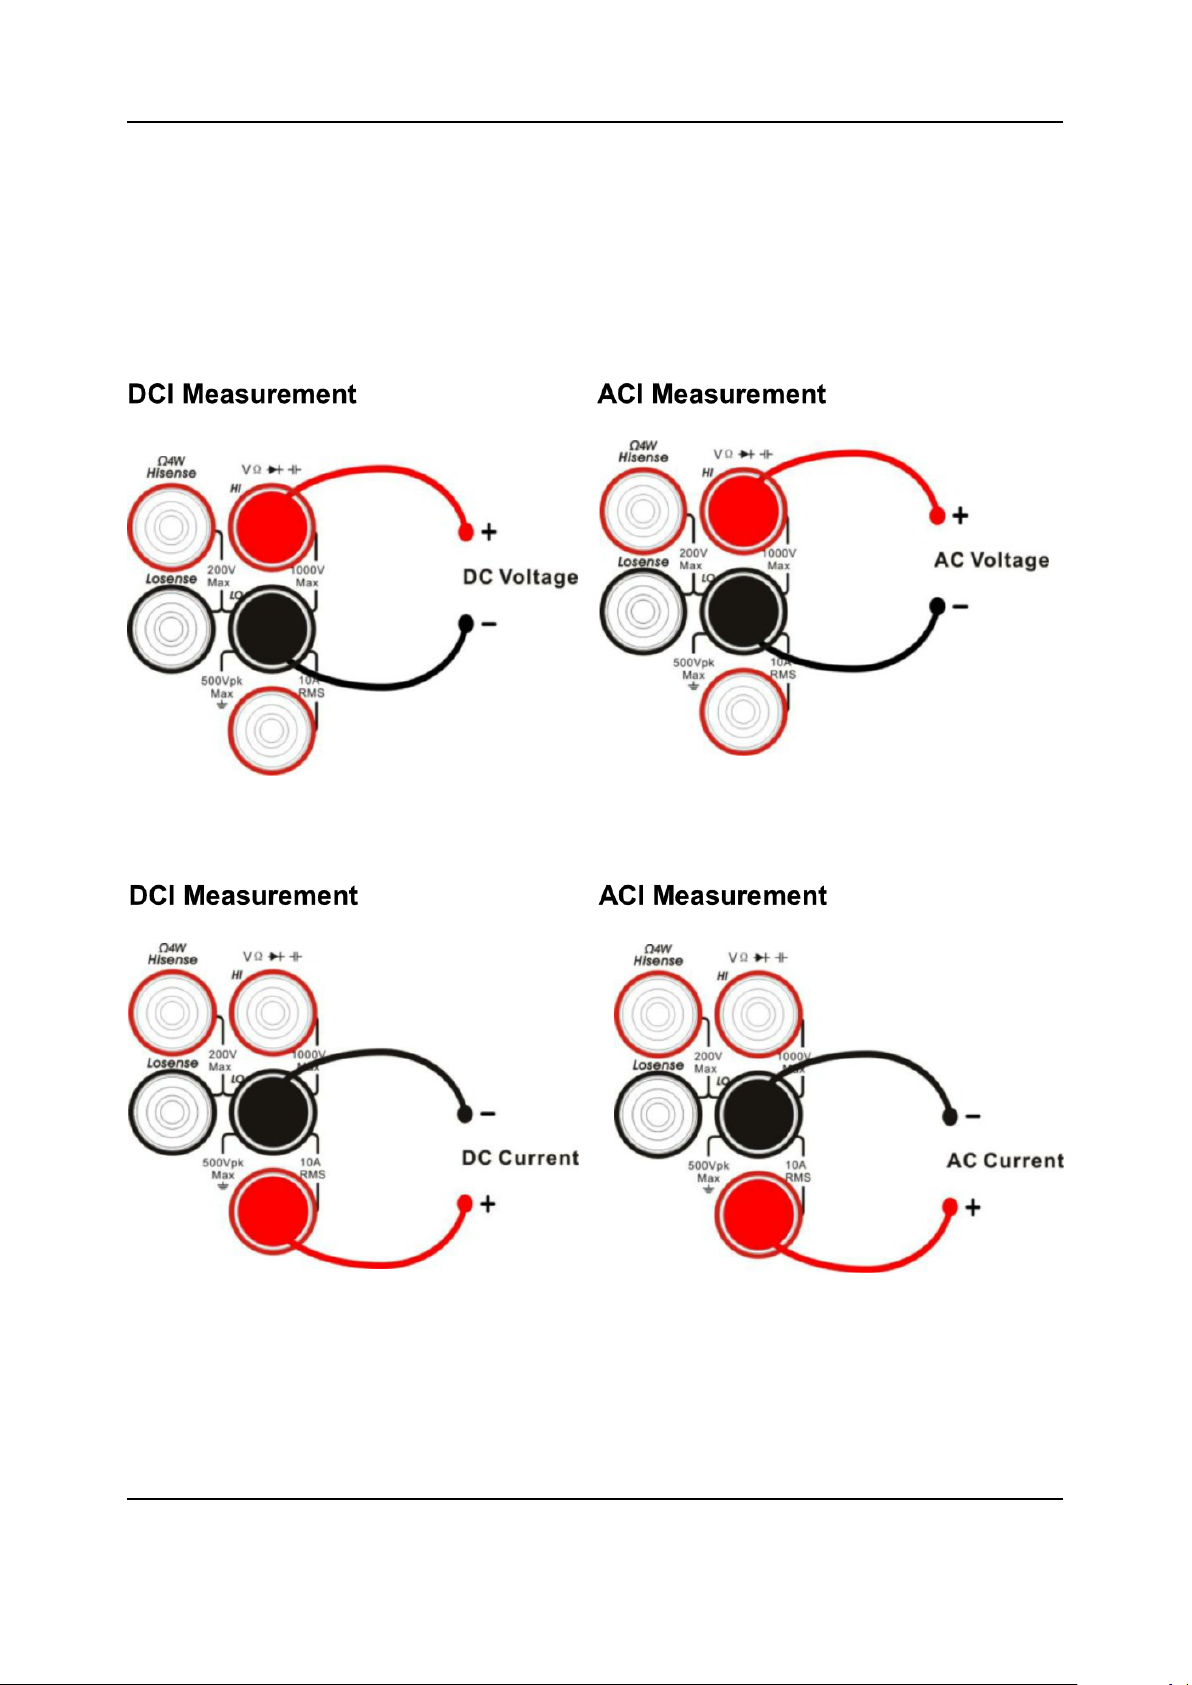
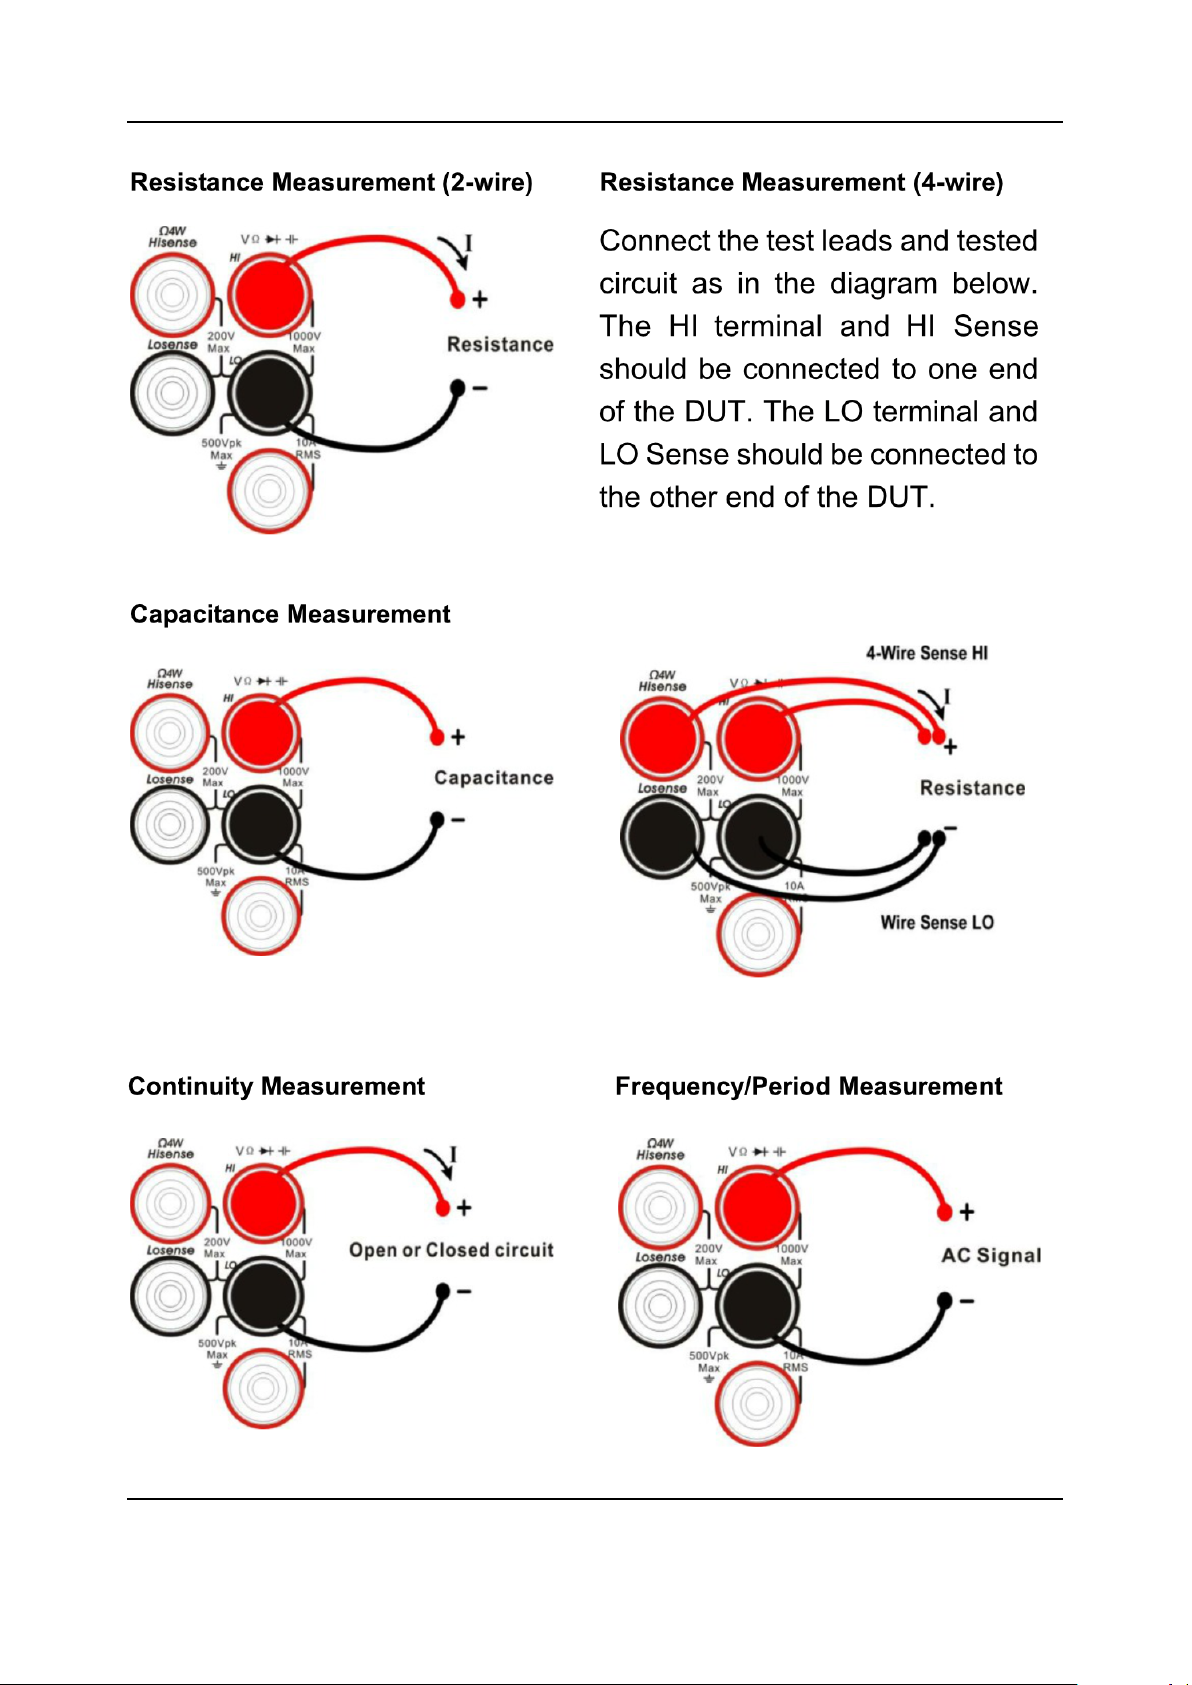
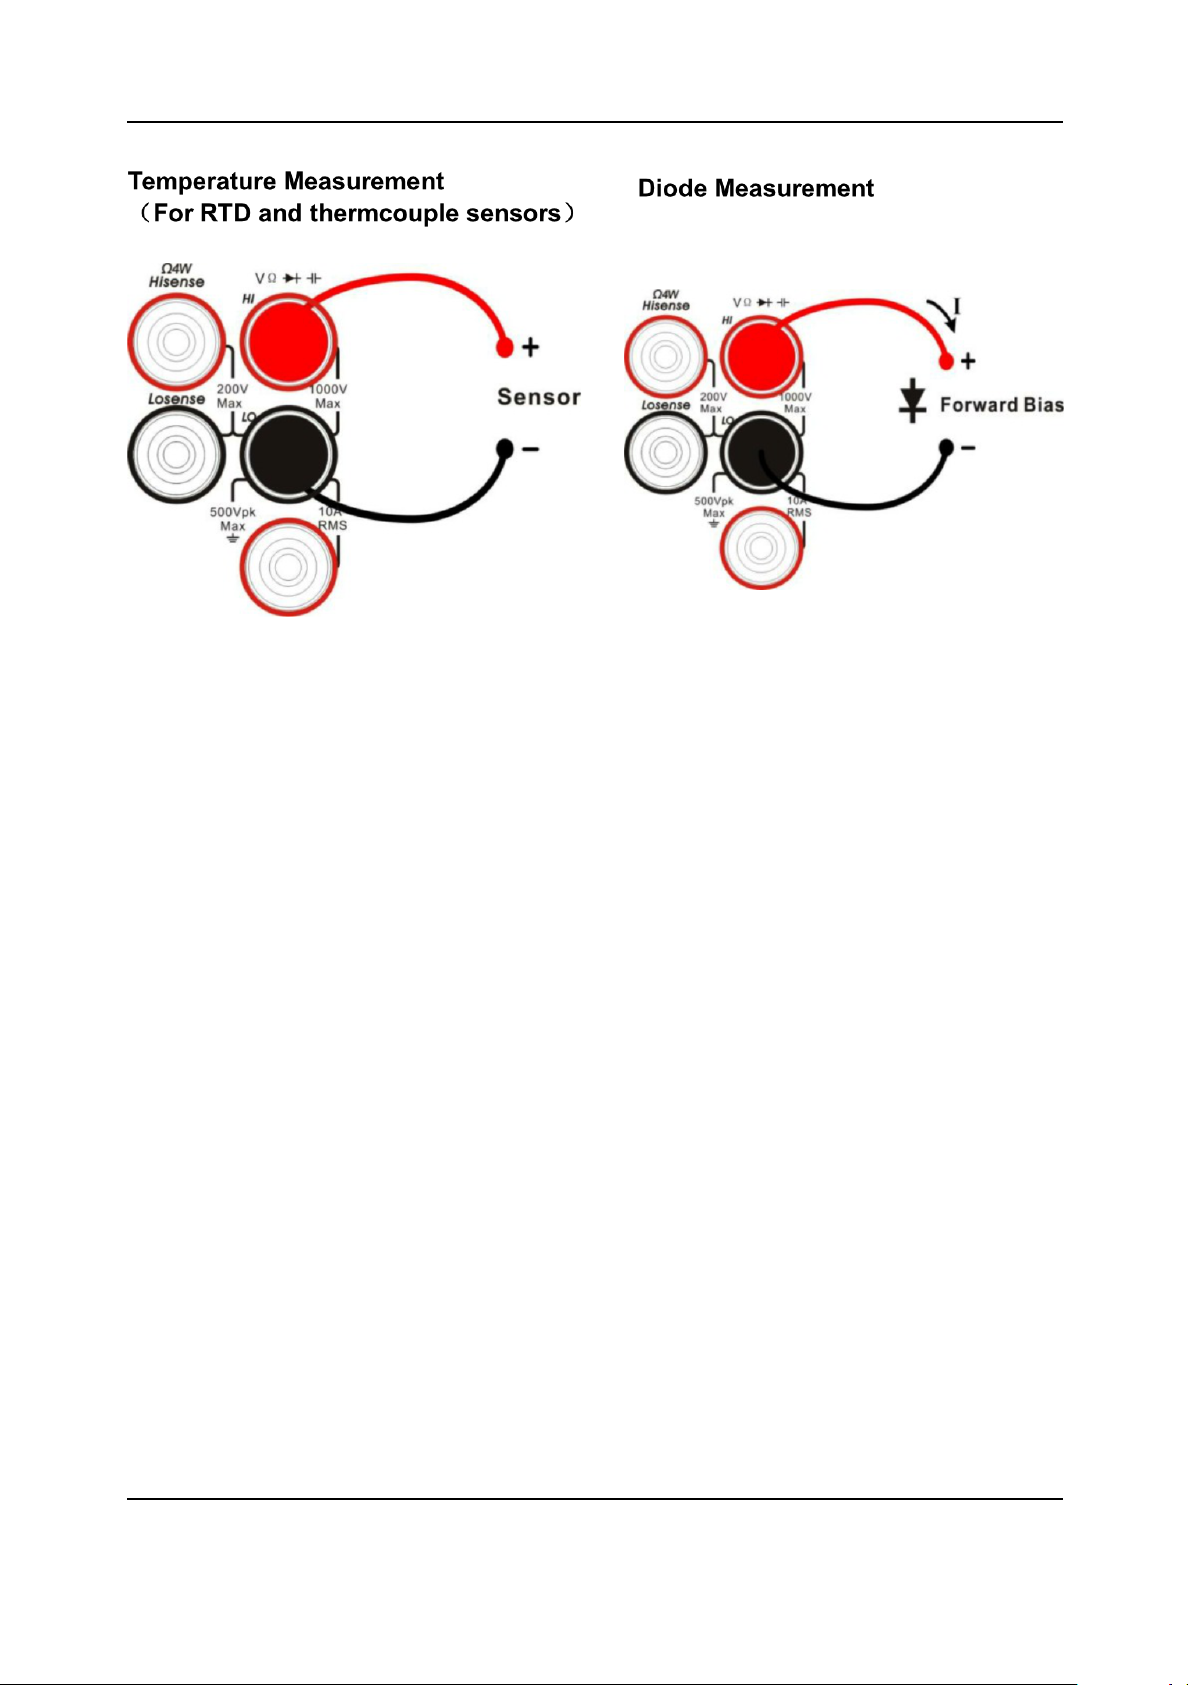
Measurement Connections
The DAQ is designed with many measurement functions. After selecting the desired measurement function, please connect the signal (device) under test to the DAQ according to the method
below. Do not switch the measurement function when measuring as it may cause damage to the
DAQ. For example, when the test leads are connected to the related current terminals, AC voltage
measurement should not be used.
17
Page 28
T3DAQ1-16 User Manual
18
Page 29
T3DAQ1-16 User Manual
19
Page 30
T3DAQ1-16 User Manual
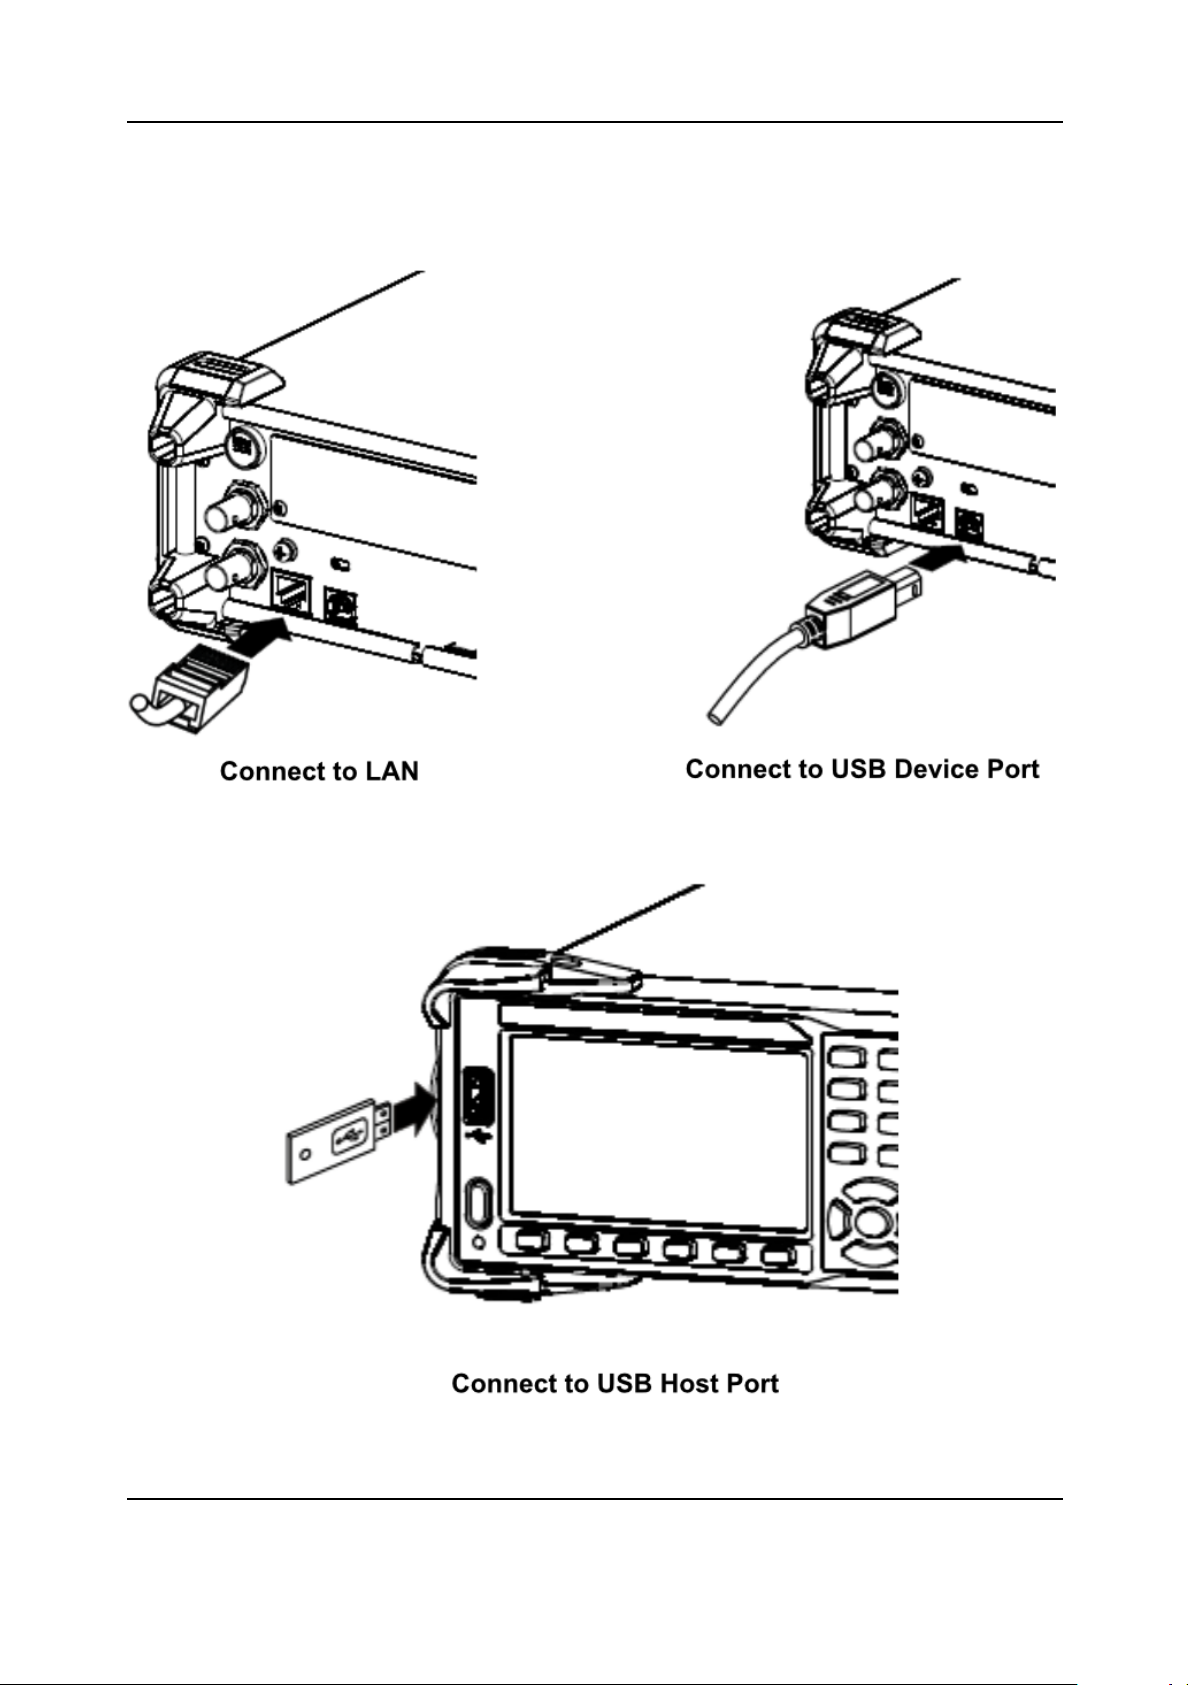
Connecting to USB and LAN Ports
The DAQ has LAN and USB I/O ports. Connect to the ports as in the diagrams below:
20
Page 31

T3DAQ1-16 User Manual
Using the Built-in Help System
To access the built-in help system, press [Shift] + [Acquire], then use the direction keys to choose
the help item you want. Finally, press [ OK ] to obtain help. The help listings are as follows:
1. Basic Measurements
2. Measuring Temperature
3. Measuring Capacitance
4. Math Function
5. Dual-display Function
6. Saving and Recalling Information
7. Optional Multiple Scan Card
8. The convention and Tips for Softkey
21
Page 32

Chapter 2
Function and Operation
Measurement Configuration
Most measurement parameters are user-defined. Changing a measurement parameter will change
the measurement precision and speed, as well as the input impedance. An appropriate measurement parameter based on the actual application will ensure faster measurement or higher measurement precision.
The default measurement configurations of the DAQ can ensure the accuracy of the measurement
results in most cases. Users can directly use these defaults for any measurement or modify the
parameters of the measurement function as required.
The parameters for different measurement functions differ, see the table below
Functions Parameters
DCV Range, Integration Time, DC impedance, Auto zero
DCV Range, AC filter
ACV Range, Integration Time, Auto zero
DCI Range, Integration Time, DC impedance, Auto zero
ACI Range, AC filter
OHM (2WR, 4WR) Range, Integration Time, Auto zero
CAP Range
CONT Short-circuit resistance
DIODE Breakover voltage
FREQ/PERIOD Gate time
TEMP N/A
22
Page 33

T3DAQ1-16 User Manual
Range
T3DAQ provides auto and manual range selecting modes. In auto mode, the DAQ selects a proper
range automatically according to the input signal. In manual mode, you can use the front panel
key or menu key to set the range. The auto mode can bring a lot of convenience for users while
the manual mode provides higher reading precision.
Method 1: use the front panel key to set the range.
Method 2: Use the menu key to select the range.
Enter the specific measurement function and select [Range] in the menu to show the range setting
options, as shown in the figure below, then press the menu operation key to activate the corresponding configuration.
Note:
1. “overload” will be displayed when the input signal exceeds the currently set range.
2. By default, the range is set to Auto at power-on or after a reset.
3. Auto mode is recommended if you are not sure about the measurement range in order to protect
the instrument and obtain accurate data.
4. The range of CONT measurement is fixed at 2kΩ.
23
Page 34

T3DAQ1-16 User Manual
Integration Time and Resolution
Integration time is the period during which the DAQ’s analog-to-digital (A/D) converter samples
the input signal for a measurement. The longer the integration time, the slower the measurement
speed will be and the higher the resolution will be. The shorter the integration time, the faster the
measurement will be and the lower the resolution will be. The integration time applies to DCV,
DCI, 2WR and 4WR measurements.
T3DAQ1-16 expresses the integration time by the number of power line cycles, the unit is PLC. The
DAQ automatically detects the input power line frequency at power-on. If the frequency is 50Hz,
the integration time can be set to 0.005PLC, 0.05PLC, 0.5PLC, 1PLC, 10PLC, 100PLC and the
default is 10PLC. If the frequency is 60Hz, the Integration time can be set to 0.006PLC, 0.06PLC,
0.6PLC, 1PLC, 10PLC, 100PLC and the default is 10PLC.
T3DAQ1-16 can make measurements with reading resolutions of 4½, 5½ and 6½ digits. It automatically selects a reading resolution according to the measurement settings.
1. In DCV, DCI and OHM measurements, press [Aperture] to set the integration time, as shown in
the diagram below (take DCV measurement for instance). The integration time affects the resolution.
The table below shows the relationship between reading resolution and integration time.
Resolution Integration time
4½ 0.005PLC/0.006PLC
0.05PLC/0.06PLC
5½ 0.5PLC/0.6PLC
6½ 1PLC
10PLC
100PLC
24
Page 35

T3DAQ1-16 User Manual
2. In ACV, ACI ,FREQ/PERIOD measurements, the resolution is fixed at 6½ digits.
3. In CAP measurements, the resolution is fixed at 4½.
4. The instrument always displays 2 digits after the decimal point in CONT measurement.
5. In DIODE measurements, the resolution is fixed at 5½.
6. In TEMP measurements, the resolution is fixed at 5½.
25
Page 36

T3DAQ1-16 User Manual
DC Impedance
DC impedance applies to DCV measurements. The default is “10MΩ”. In the range of 200mV, 2V
or 20V, you can choose “>10GΩ” to reduce the loading error on the measured object, caused by
the multimeter load.
In the range of 200 mV, 2 V or 20 V under DCV measurement, press [Input Z] in the menu to
perform the setting, as shown in the diagram below.
• 10MΩ: set the input impedance in all ranges to 10MΩ.
• 10GΩ: set the input impedances in ranges of 200mV, 2V and 20V to 10GΩ, while in ranges
200V and 1000V, the impedance is still 10MΩ.
26
Page 37

T3DAQ1-16 User Manual
Auto Zero
Auto zero (Auto Zero) applies to DCV, DCI, 2WR and 4WR measurements. Enter the specific
measurement function and press [Auto Zero] in the menu to perform the setting, as shown in
diagram below (take DCV measurement for instance).
• ON: the DAQ internally disconnects the input signal and measured circuit after each measurement and takes a zero reading. It then subtracts the zero reading from the preceding
reading (displaying the difference between the measurement value and zero value during the
measurement), in order to reduce the impact of offset voltage from input circuit on measurement result.
• OFF: disable the auto zero function.
27
Page 38

T3DAQ1-16 User Manual
AC Filter
AC filter applies to ACV and ACI measurements. It can optimize the low frequency accuracy
and minimize the AC settling time. T3DAQ1-16 provides three types of AC filters (>3Hz, >20Hz,
>200Hz).
The AC filter to be used is determined by the input signal frequency. You should generally select
the highest frequency filter whose frequency is less than that of the signal you are measuring, because the higher frequency filters result in faster measurements. For example, when measuring
a signal between 20Hz and 200Hz, use the 20Hz filter. If measurement speed is not an issue,
choosing a lower frequency filter may result in quieter measurements, depending on the signal
that you are measuring.
Press [Filter] in the menu of ACV or ACI measurement to show the setting options, as shown in
diagram below (take ACV measurement for instance).
Then press the menu operation key to activate the corresponding configuration.
28
Page 39

T3DAQ1-16 User Manual
Short-circuit Resistance
This function only applies to a continuity test. When the measured circuit has a resistance lower
than the short-circuit resistance, the circuit is considered as connected and the beeper sounds (if
sound is on). The default short-circuit resistance is 50Ω and the setting is stored in non-volatile
memory.
When continuity test is enabled, set the [Threshold] (equal to short-circuit resistance) using the
direction keys. The range is from 1Ω to 2000Ω .
29
Page 40

T3DAQ1-16 User Manual
Gate Time
Gate time (also called Aperture Time) applies to the FREQ / PERIOD function. It decides the resolution of a low-frequency measurement. The longer the gate time, the higher the resolution of the
low-frequency measurement and the slower the measurement, and vice versa.
In FREQ / PERIOD measurement, press [Gate Time] to show the setting options, as shown in
diagram below (take FREQ measurement for instance).
The gate time can be set to 1ms, 10ms, 100ms or 1s and the default is 100 ms. You can select a
desired gate time by pressing the corresponding softkey.
30
Page 41

T3DAQ1-16 User Manual
Basic Measurement Functions
To Measure DC Voltage
Range: 200mV, 2V, 20V, 200V, 1000V
Max Resolution: 100nV (in the range of 200mV)
Input Protection: 1000 V protection is available on all ranges and a 10% over-range for all
ranges except 1000 V range. If the reading exceeds the range, “overload” will be displayed.
Operating Steps:
1. Enable the DCV measurement
Press [DCV] on the front panel to enter the DC Voltage measurement interface, as shown in
Diagram below.
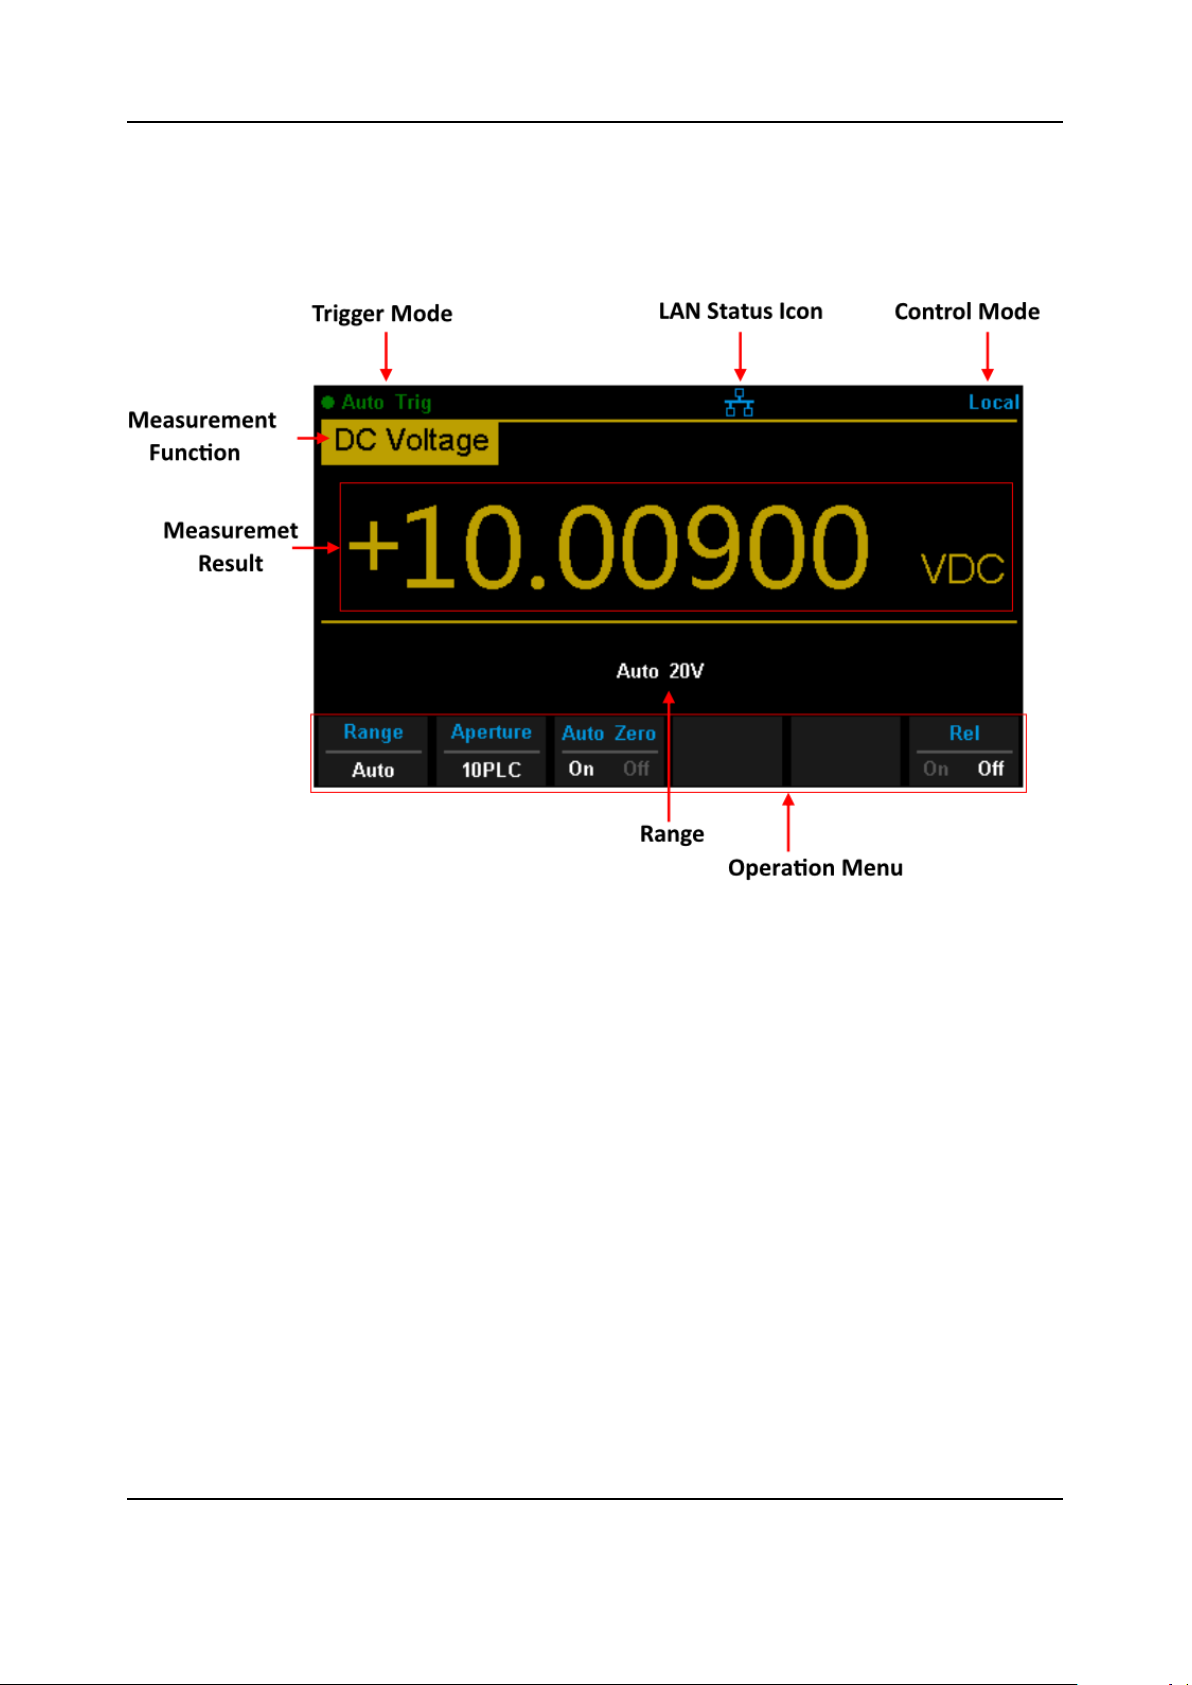
DC Voltage Measurement Interface
2. Make the connection
Connect the test leads with the measured signal by referring to “Measurement Connec-
tions”.
3. Set the range
Press [Range] to select a range for the measurement. You can also use the [+], [-], and
[Range] keys on the front panel to select the range. Auto (autorange) automatically selects
the range for the measurement based on the input. Autoranging is convenient, but it results
in slower measurements than using a manual range. Autoranging goes up a range of 110%
of the present range, and changes down a range when the measurement is below 10% of
the present range.
31
Page 42

T3DAQ1-16 User Manual
4. Set the Integration
Press [Aperture] and choose the number of power-line cycles (PLCs) to use for the measurement. Selecting 100PLC provides the best noise rejection and resolution, but the slowest
measurements.
5. Autozero setting
Press [Auto Zero] to enable or disable this function. Autozero provides the most accurate
measurements, but requires additional time to perform the zero measurement. With autozero enabled (On), the DAQ internally measures the offset following each measurement. It
then subtracts that measurement from the preceding reading. This prevents offset voltages
present on the DAQ’s input circuitry from affecting the measurement accuracy.
6. Specify the DC input impedance (Only for Manual 200mV, 2V and 20V ranges)
Press [Input Z] to set the DC resistance as “10M” (default value) or 10G”. Users can execute
the DC voltage measurement directly without modifying this parameter if they wish.
7. Set the relative value (Optional operation)
Press [Rel] to start or stop the Relative math function. When it is started, the reading displayed is a value which comes from the result of actual measurement value minus the relative
value that has been set. The default relative value is the measurement value when the function is started. (For details, please refer to “Math Functions” in Chapter 2).
8. Read the measurement value
The DAQ measures the input signal according to the current measurement settings and displays the measurement result on the screen.
9. Perform math operations (advanced)
You can perform math operations (Statistics, Limit, dBm, dB and REL) on every DCV measurement reading. For details, please refer to “Math Operations”.
10. Display the graph (advanced)
You can analyze the measurement data by using the “Bar Meter”, “Trend Chart” or “Histogram
display”. For details, please refer to “Display Mode”.
32
Page 43

T3DAQ1-16 User Manual
To Measure DC Current
Range: 200µA, 2mA, 20mA, 200mA, 2A, 10A
Max Resolution: 0.1nA (in the range of 200µA)
Input Protection: a 10A protection fuse is available in all ranges and a 10% over-range for
all ranges except 10A range. If the reading exceeds the range, “overload” will be displayed.
Operating Steps:
1. Enable the DCI measurement
Press [Shift] and [DCV] on the front panel to enter the DC Current measurement interface,
as shown in the diagram below.
2. Make the connection
Connect the test leads with the measured signal by referring to “Measurement Connec-
tions”.
3. Set the range
Press [Range] to select a range for the measurement. You can also use the [+], [-], and
[Range] keys on the front panel to select the range. Auto (autorange) automatically selects
the range for the measurement based on the input. Autoranging is convenient, but it results in
slower measurements than using a manual range. Autoranging goes up to 110% of a range
and changes up a range at 110% of the present range, and changes down a range when
below 10% of the present range.
4. Set the Integration Time
Press [Aperture] and choose the number of power-line cycles (PLCs) to use for the measurement. Selecting 100PLC provides the best noise rejection and resolution, but the slowest
measurements.
33
Page 44

T3DAQ1-16 User Manual
5. Autozero setting
Press [Auto Zero] to enable or disable this function. Autozero provides the most accurate
measurements but requires additional time to perform the zero measurement. With autozero enabled (On), the DAQ internally measures the offset following each measurement. It
then subtracts that measurement from the preceding reading. This prevents offset voltages
present on the DAQ’s input circuitry from affecting the measurement accuracy.
6. Set the relative value (Optional operation)
Press [Rel] to start or stop the Relative math function. When it is started, the reading displayed is a value which comes from the result of actual measurement value minus the relative
value that has been set. The default relative value is the measurement value when the function is started. (For details, please refer to “Math Functions” in Chapter 2.)
7. Read the measurement value
The DAQ measures the input signal according to the current measurement settings and displays the measurement result on the screen.
8. Perform math operations (advanced)
You can perform math operations (Statistics, Limit and REL) on every DCI measurement
reading. For details, please refer to ”Math Functions”.
9. Display the graph (advanced)
You can analyze the measurement data by using the “Bar Meter”, “Trend Chart” or “Histogram
display”. For details, please refer to “Display Mode”.
34
Page 45

T3DAQ1-16 User Manual
To Measure AC Voltage
Range: 200mV, 2V, 20V, 200V, 750V
Max Resolution: 100nV (in the range of 200mV)
Input Protection: 750V protection is available in all ranges and a 10% overrange for all
ranges except 750V range. If the reading exceeds the range, “overload” will be displayed.
Operating Steps:
1. Enable the ACV measurement
Press [ACV] on the front panel to enter the AC Voltage measurement interface, as shown in
the diagram below.
2. Make the connection
Connect the test leads with the measured signal by referring to “Measurement Connec-
tions”.
3. Set the range
Press [Range] to select a range for the measurement. You can also use the [+], [-], and
[Range] keys on the front panel to select the range. Auto (autorange) automatically selects
the range for the measurement based on the input. Autoranging is convenient, but it results
in slower measurements than using a manual range. Autoranging goes up a range at 110%
of the present range, and down a range when below 10% of the present range.
4. Set the filter
Press [Filter] and choose the filter for the measurement. The instrument provides three different AC filters, “>3Hz”, “>20Hz” and “>200Hz”. You should generally select the highest
frequency filter whose frequency is less than that of the signal you are measuring.
35
Page 46

T3DAQ1-16 User Manual
5. Set the relative value (Optional operation)
Press [Rel] to start or stop the Relative math function. When it is started, the reading displayed is a value which comes from the result of actual measurement value minus the relative
value that has been set. The default relative value is the measurement value when the function is started. (For details, please refer to “Math Functions” in Chapter 2.)
6. Read the measurement value
The DAQ measures the input signal according to the current measurement settings and displays the measurement result on the screen.
7. Perform the math operation (advanced)
You can perform math operations (Statistics, Limit, dBm, dB and REL) on every ACV measurement reading. For details, please refer to “Math Operations”.
8. Display the graph (advanced)
You can analyze the measurement data by using the “Bar Meter”, “Trend Chart” or “Histogram
display”. For details, please refer to “Display Mode”.
36
Page 47

T3DAQ1-16 User Manual
To Measure AC Current
Range: 200µA, 2 mA, 20 mA, 200 mA, 2A, 10A
Max Resolution: 0.1nA (in the range of 200µA)
Input Protection: 10A protection is available in all ranges and a 10% over-range for all
ranges except the 10A range. If the reading exceeds the range, “overload” will be displayed.
Operating Steps:
1. Enable the ACI measurement
Press [Shift] and [ACV] on the front panel to enter the AC current measurement interface, as
shown in the diagram below.
2. Make the connection
Connect the test leads with the measured signal by referring to “Measurement Connec-
tions”.
3. Set the range
Press [Range] to select a range for the measurement. You can also use the [+], [-], and
[Range] keys on the front panel to select the range. Auto (autorange) automatically selects
the range for the measurement based on the input. Autoranging is convenient, but it results
in slower measurements than using a manual range. Autoranging goes up a range at 110%
of the present range, and down a range when below 10% of the present range.
4. Set the filter
Press [Filter] and choose the filter for the measurement. The instrument provides three different AC filters, “>3Hz”, “>20Hz” and “>200Hz”. You should generally select the highest
frequency filter whose frequency is less than that of the signal you are measuring.
37
Page 48

T3DAQ1-16 User Manual
5. Set the relative value (Optional operation)
Press [Rel] to start or stop the Relative math function. When it is started, the reading displayed is a value which comes from the result of actual measurement value minus the relative
value that has been set. The default relative value is the measurement value when the function is started. (For details, please refer to “Math Functions” in Chapter 2.)
6. Read the measurement value
The DAQ measures the input signal according to the current measurement settings and displays the measurement result on the screen.
7. Perform the math operation (advanced)
You can perform the math operations (Statistics, Limit and REL) on every ACI measurement
reading. For details, please refer to “Math Functions” in Chapter 2.
8. Display the graph (advanced)
You can analyze the measurement data by using the “Bar Meter”, “Trend Chart” or “Histogram
display”. For details, please refer to “Display Mode”.
38
Page 49

T3DAQ1-16 User Manual
To Measure Resistance
Range: 200Ω, 2kΩ, 20kΩ, 200kΩ, 1MΩ, 10MΩ, 100MΩ
Max Resolution: 100µΩ (in the 200Ω range)
Input Protection: 1000 V protection is available in all ranges and a 10% over-range for all
ranges. If the reading exceeds the range, “overload” will be displayed.
T3DAQ1-16 provides 2-wire and 4-wire resistance measurements. When the measured resistance
is lower than 100kΩ, the 4-wire resistance measurement is recommended to reduce the measurement error caused by the test lead resistance and contact resistance between the probe and the
testing point. These two resistances should not be ignored when compared to the measured resistance.
Operating Steps:
1. Enable 2-wire/4-wire resistance measurement
Press [Ω2W] on the front panel to enter the 2-wire resistance measurement interface, as
shown in the below diagram.
39
Page 50

T3DAQ1-16 User Manual
Press [Shift] and [Ω2W] on the front panel to enter the 4-wire resistance measurement interface, as shown in the diagram below.
2. Make the connection
Connect the test leads with the measured signal by referring to “Measurement Connec-
tions”.
3. Set the range
Press [Range] to select a range for the measurement. You can also use the [+], [-], [Range]
and keys on the front panel to select the range. Auto (autorange) automatically selects the
range for the measurement based on the input. Autoranging is convenient, but it results in
slower measurements than using a manual range. Autoranging goes up a range at 110% of
the present range, and down a range when below 10% of the present range.
4. Set the Integration
Press [Aperture] and choose the number of power-line cycles (PLCs) to use for the measurement. Selecting 100PLC provides the best noise rejection and resolution, but the slowest
measurements.
5. Autozero setting
Press [Auto Zero] to enable or disable this function. Autozero provides the most accurate
measurements, but requires additional time to perform the zero measurement. With autozero enabled (On), the DAQ internally measures the offset following each measurement. It
then subtracts that measurement from the preceding reading. This prevents offset voltages
present on the DAQ’s input circuitry from affecting the measurement accuracy.
6. Set the relative value (Optional operation)
Press [Rel] to start or stop the Relative math function. When it is started, the reading displayed is a value which comes from the result of actual measurement value minus the relative
value that has been set. The default relative value is the measurement value when the function is started. (For details, please refer to “Math Functions” in Chapter 2.)
40
Page 51

T3DAQ1-16 User Manual
7. Read the measurement value
The DAQ measures the input signal according to the current measurement settings and displays the measurement result on the screen.
8. Perform the math operation (advanced)
You can perform the math operations (Statistics, Limit and REL) on every resistance measurement reading. For details, please refer to “Math Operations” in Chapter 2.
9. Display the graph (advanced)
You can analyze the measurement data by using the “Bar Meter”, “Trend Chart” or “Histogram
display”. For details, please refer to “Display Mode”.
41
Page 52

T3DAQ1-16 User Manual
To Measure Capacitance
Range: 2nF, 20nF, 200nF, 2µF, 20µF, 200µF, 2mF, 20mF, 100mF
Max Resolution: 1pF (in the range of 2nF)
Input Protection: 1000V protection is available in all ranges. If the reading exceeds the
range, “overload” will be displayed.
Operating Steps:
1. Enable the Capacitance measurement
Press [ ] on the front panel to enter the Capacitance measurement interface, as shown
in the diagram below.
2. Make the connection
Connect the test leads with the measured signal by referring to “Measurement Connec-
tions”.
3. Set the range
Press [Range] to select a range for the measurement. You can also use the [+], [-], [Range]
and keys on the front panel to select the range. Auto (autorange) automatically selects the
range for the measurement based on the input. Autoranging is convenient, but it results in
slower measurements than using a manual range. Autoranging goes up a range at 110% of
the present range, and down a range when below 10% of the present range.
4. Set the relative value (Optional operation)
Press [Rel] to start or stop the Relative math function. When it is started, the reading displayed is a value which comes from the result of actual measurement value minus the relative
value that has been set. The default relative value is the measurement value when the function is started. (For details, please refer to “Math Functions” in Chapter 2.)
42
Page 53

T3DAQ1-16 User Manual
5. Read the measurement value
The DAQ measures the input signal according to the current measurement settings and displays the measurement result on the screen.
6. Perform the math operation (advanced)
You can perform the math operations (Statistics, Limit and REL) on every capacitance measurement reading. For details, please refer to “Math Functions”.
7. Display the graph (advanced)
You can analyze the measurement data by using the “Bar Meter”, “Trend Chart” or “Histogram
display”. For details, please refer to “Display Mode”.
Remember to disconnect power to the DUT and short the legs or connections of the electrolytic capacitors before measuring the electrolytic capacitors.
43
Page 54

T3DAQ1-16 User Manual
To Measure Frequency or Period
Frequency (Period) Range: From 3Hz to 1MHz (from 0.33s to 1µs).
Input Signal Range: 200mV, 2V, 20V, 200V, 750V.
Input Protection: 750V protection is available in all ranges.
Operating Steps:
1. Enable the Freq/Period measurement
Press [Shift] and [ ] on the front panel, then select [Freq] to enter the frequency measurement interface, as shown in the diagram below.
Select [Period] to enter the period measurement interface, as shown in the diagram below.
2. Make the connection
Connect the test leads with the measured signal by referring to “Measurement Connec-
tions”.
44
Page 55

T3DAQ1-16 User Manual
3. Set the range
Press [Range] to select a range for the measurement. You can also use the [+], [-], [Range]
and keys on the front panel to select the range. Auto (autorange) automatically selects the
range for the measurement based on the input. Autoranging is convenient, but it results in
slower measurements than using a manual range. Autoranging goes up a range at 110% of
the present range, and down a range when below 10% of the present range.
4. Set the gate time
Press [Gate Time] and choose the measurement aperture of 1ms, 10ms, 100ms (default), or
1s.
5. Set the relative value (Optional operation)
Press [Rel] to start or stop the Relative math function. When it is started, the reading displayed is a value which comes from the result of actual measurement value minus the relative
value that has been set. The default relative value is the measurement value when the function is started. (For details, please refer to “Math Functions” in Chapter 2.)
6. Read the measurement value
The DAQ measures the input signal according to the current measurement settings and displays the measurement result on the screen.
7. Perform the math operation (advanced)
You can perform math operations (Statistics, Limit and REL) on every measurement reading.
For details, please refer to “Math Functions”.
8. Display the graph (advanced)
You can analyze the measurement data by using the “Bar Meter”, “Trend Chart” or “Histogram
display”. For details, please refer to “Display Mode”.
45
Page 56

T3DAQ1-16 User Manual
To Test Continuity
Test Current Source: 1mA
Max Resolution: 0.01Ω
Input Protection: 1000V Input Protection
Open-circuit Voltage:
Beep Threshold (short-circuit resistance): from 0Ω to 2000Ω
This function measures the resistance of the circuit with about 1mA current source. When the
measured resistance is lower than the short-circuit resistance (Threshold), the beeper sounds (if
the Beeper is on). Otherwise, “open” is displayed on the screen.
Operating Steps:
1. Enable the Cont measurement
Press [Cont] on the front panel to enter the Continuity test interface, as shown in the diagram
below.
<8V
2. Make the connection
Connect the test leads with the measured signal by referring to “Measurement Connec-
tions”.
3. Set the short-circuit resistance (Threshold)
Enter a desired value using the direction keys. The range is from 0Ω to 2000Ω and the default
is 50Ω.
4. Read the measurement value
The DAQ measures the input signal according to the current measurement settings and displays the measurement result on the screen.
46
Page 57

T3DAQ1-16 User Manual
5. Perform the math operation (advanced)
You can perform math the operation (Statistics, Limit) on every measurement reading. For
details, please refer to “Math Functions”.
6. Display the graph (advanced)
You can analyze the measurement data by using the “Bar Meter”, “Trend Chart” or “Histogram
display”. For details, please refer to “Display Mode”.
Before testing continuity remember to disconnect the DUT power and discharge all of the
DUT capacitors, to avoid damage to the DAQ.
47
Page 58

T3DAQ1-16 User Manual
To Test Diode
Test Current Source: 1mA
Voltage Measurement Range: 0V 4V
Max Resolution: 10µV
Input Protection: 1000V Input Protection
Open-circuit Voltage: <8V
This function measures the forward voltage drop on the diode. When the voltage is lower than the
Threshold, the beeper sounds (if the beeper is on).
Operating Steps:
1. Enable the Diode measurement
Press [Shift] and [Cont] on the front panel to enter the Diode test interface, as shown in the
diagram below.
2. Make the connection
Connect the test leads with the measured signal by referring to “Measurement Connec-
tions”.
3. Set the Threshold
Enter a desired value using the direction keys. The range is from 0V to 4V and the default is
2V.
4. Read the measurement value
The DAQ measures the input signal according to the current measurement settings and displays the measurement result on the screen. If the reading exceeds the threshold, “open”
will be displayed.
48
Page 59

T3DAQ1-16 User Manual
5. Evaluate the results of a measurement
Reverse the probes and measure the forward voltage drop on the diode again. Evaluate the
diode according to the following rules:
• If the DAQ displays “open” when in the reverse bias model, it indicates that the diode is
normal.
• If the DAQ shows voltage about 0V and the instrument beeps persistently when in forward and reverse bias model, it indicates that the diode is short
• If the DAQ shows “open” when in the forward and reverse model, it indicates that the
diode is open.
6. Perform the math operation (advanced)
You can perform the math operation (Statistics, Limit) on every measurement reading. For
details, please refer to “Math Functions”.
7. Display the graph (advanced)
You can analyze the measurement data by using the “Bar Meter”, “Trend Chart” or “Histogram
display”. For details, please refer to “Display Mode”.
Before testing continuity remember to disconnect the DUT power and discharge all of the
DUT capacitors, to avoid damage to the DAQ.
49
Page 60

T3DAQ1-16 User Manual
To Measure Temperature
T3DAQ1-16 can directly measure the temperature using TC (Thermocouple) and THERM (Thermistor) sensors.
Operating Steps:
1. Enable the Diode measurement
Press on the front panel to enter the Temperature measurement interface, as shown in the
diagram below.
2. Make the connection
Connect the test leads with the measured signal by referring to “Measurement Connections”.
3. Set the type of sensor
Press [Load] and use the direction keys to choose a desired temperature sensor. Press [Define] to view the configurations. Then press [Read] to apply the current temperature sensor
configurations.
50
Page 61

T3DAQ1-16 User Manual
4. Set the display mode
Press [Display] to choose the display mode. The DAQ supports three display modes: Temperature Value, Measured Value and All (Temperature Value and Measured Value will be
shown on the display together).
5. Set the unit of temperature
Press [Units] to choose the unit of temperature. The DAQ supports three units: °C ,°F , °K.
6. Set the relative value (Optional operation)
Press [Rel] to start or stop the Relative math function. When it is started, the reading displayed is a value which comes from the result of actual measurement value minus the relative
value that has been set. The default relative value is the measurement value when the function is started. (For details, please refer to “Math Functions” in Chapter 2.)
7. Read the measurement value
The DAQ measures the input signal according to the current measurement settings and displays the measurement result on the screen.
51
Page 62

T3DAQ1-16 User Manual
8. Perform the math operation (advanced)
You can perform the math operation (Statistics, Limit and REL) on every measurement reading. For details, please refer to “Math Functions”.
9. Display the graph (advanced)
You can analyze the measurement data by using the “Bar Meter”, “Trend Chart” or “Histogram
display”. For details, please refer to “Display Mode”.
52
Page 63

T3DAQ1-16 User Manual
Dual-display Function
Dual-display function is used to improve the test and measurement functions. Press [Dual] to open
the Dual-display function and the upper right corner will show “Dual”. Now press a function key if
this function can be used as the second display, it will be displayed in the second Display area.
The Main Display will display the function that is selected before the Dual-display function is turned
on. All the available combinations are listed in the table below (shade is available).
For example, press [DCV]→ [Dual]→ [ACV] to enter the following interface.
Instruction:
1. If the same measurement function is used in both Main and second Display.
• The readings in both displays will update at the same time.
• If math function (dBm, dB) is used in Main Display, when opening the second Display,
the math operation will be stopped automatically. The second Display will show the
same measurement result as Main Display.
• If math function (Statistics, Limits, Relative) is used in Main Display, when starting the
second Display, the result will still be shown in the Main Display, and the second Display
will show the same measurement result as the Main Display.
2. If different measurement functions are used in both Main and the second Display.
53
Page 64

T3DAQ1-16 User Manual
• The readings in both displays will update alternately.
• If math function (dBm, dB) is used in Main Display, when opening the second Display,
the math operation will be stopped automatically. The second Display will show the
second selected function normally.
• If math function (Statistics, Limits, Relative) is used in Main Display, when opening the
second Display, the result will still be shown in the Main Display and the second Display
will show the second selected function normally.
3. If Temperature function is used in Main Display, set the display mode ( [Temp]→[Display]→[All]).
Then the result will be shown in the Main Display and the current measurement value is shown
in the second Display.
4. Auto Range is adopted by the second Display. If the same measurement function is used in
both displays, so does the range.
5. Measured data in the second Display cannot be saved into “History”.
54
Page 65

T3DAQ1-16 User Manual
Utility Function
The Utility function enables users to set up system parameters and interface parameters of the
DAQ.
Press [Shift] and [Dual] to enter the operating menu of Utility function, as the following diagram
shows.
Function Menu Description
Store/Recall Store or recall state files.
Manage File Create a new file, copy, rename or delete a file.
I/O Config Configure LAN.
Test/Admin Provide board test function.
System Setup Configure instrument’s user settings.
55
Page 66

T3DAQ1-16 User Manual
Store and Recall
The Store/Recall function enables users to store and recall the instrument state and data files in
the local storage as well as in the USB storage. After entering the function menu of Utility, press
[Store/Recall] to enter the interface as shown in the diagram below.
Function Menu Description
Store Settings Store state or data files.
Recall settings Recall state files.
Power On Select the state that is loaded at power-up.
Delete all the files stored in local storage and restore the
Security Erase
Set to Defaults Restore the instrument to factory default state.
Done Return to the higher level menu.
instrument to factory default state.
56
Page 67

T3DAQ1-16 User Manual
Store Settings
Store settings allows you to save the system configuration (as .xml) or measurement data (as .csv)
into the internal memory or an external USB storage device. After entering into the function menu
of Store/Recall, press [Store Settings] to enter the following interface.
Table below shows the different functions available.
Function Menu Settings Description
Browse Choose the location that file will be saved.
File Name Input the file name.
Type .xml/.csv Choose the type of file that will be saved.
Store Data Store the specified file.
Done Return to the higher level menu.
57
Page 68

T3DAQ1-16 User Manual
Operating Steps:
1. Set the storage directory
Press [Browse] to enter the following interface, then use the direction keys or menu operation
keys to choose the storage directory. Press [Select] to set the current directory as storage
location and Return to the higher level menu.
2. Set the file name
Press [File Name] to enter the following interface and input the name of the stored file.
The method of inputting a file name:
• Press direction keys to select a desired character in the input area.
• Press “OK” key on the front panel to input selected char in the input area.
• Press [Clear All] to clear all input chars.
• Press [Delete Char] to delete the letter on which the cursor is currently placed.
• Press [Previous Char] to move the cursor in the file name area to the previous char.
• Press [Next Char] to move the cursor in the file name area to the next char.
• Press [Done] to save the current file and return to the higher level menu.
58
Page 69

T3DAQ1-16 User Manual
• Press [Cancel] to cancel the current operation and return to the higher level menu.
3. Set the type of stored file
Press [Type] to set the type of stored file.
• .xml: save the current system configuration as an “.xml” file.
• .csv: save the current measurement result as a “.csv” file.
4. Save the file
Press [Store Data] to store the specified file.
5. Exit
Press [Done] to return to the higher level menu.
59
Page 70

T3DAQ1-16 User Manual
Recall Settings
Recall settings allows you to read the system configuration from the internal memory or an external
USB storage device. After entering the function menu of Store/Recall, press [Recall Settings] to
enter the following interface.
Use direction keys or menu operation keys to choose the state file with the suffix “.xml”.
• Press [Select] to read the file and restore the instrument to a specified state.
• Press [Cancel] to return to higher level menu.
Power On
Select a system configuration to be used at power-on from “Default” and “Last” (configuration at
last power-off). The setting will be available at the next power-on.
Security Erase
Press [Security Erase], the instrument will display a prompt message “Are you sure you want to
delete all stored files?”. Press [Yes] to confirm. The instrument will delete all the files stored in
local storage and restore the instrument to the factory default state.
Set to Defaults
Press [Set to Defaults] and the instrument will be restored to factory default state.
60
Page 71

T3DAQ1-16 User Manual
Manage File
The Manage Files function allows you to create, copy, delete, and rename files and folders in the
instrument’s internal flash memory or on a USB drive attached to the front panel. It also allows you
to capture the current screen to a bitmap (*.bmp) file. After entering the function menu of Utility,
press [Manage File] to enter the interface as shown in the diagram below.
Press [Action] and select [Folder], [Capture Display], [Copy], [Rename] or [Delete] to do the corresponding operation.
• Folder – To create a folder, Browse to the internal or external location for the folder, press
File Name, enter a folder name and press Done. Press Create Folder > Done.
• Capture Display – To save a screen capture, Browse to the internal or external location for
the screen capture. Press File Name, enter a name and press Done. Press Save Screen >
Done.
• Copy – To copy a file or folder, press Copy. Browse to the folder or file to be copied and press
Select. Press Copy Path and select an internal or external path for copying. Press Perform
Copy > Done.
• Rename – To rename a file or folder, press Rename. Browse to the folder or file to be renamed
and press Select. Press New Name, enter a new name and press Done. Press Perform
Rename > Done.
• Delete – To delete a file or folder, press Delete and Browse to the folder or file to delete.
Press Select > Perform Delete > Done.
61
Page 72

T3DAQ1-16 User Manual
I/O Configuration
Press [I/O Config] to enter the following interface and set up the parameters.
LAN Settings
The DAQ enables users to operate the instrument remotely by LAN interface and store or recall
internet settings. You can look over current LAN settings and set up an IP address and subnet
mask. After entering into the function menu of Utility, press [I/O Config]. Select [On ]→[LAN Settings]→[Modify Settings] to enter the following interface.
Function Menu Description
IP Address Set up IP address.
Subnet Mask Set up subnet mask.
Gateway Set up gateway.
Cancel current operation and return to the higher level
Cancel
Done Save all changes and return to the higher level menu.
menu.
62
Page 73

T3DAQ1-16 User Manual
Board Test
T3DAQ1-16 provides self-test functions, including Key Test, LCDTest, Beeper Test and Chip Test.
Operating Steps:
1. Press [Shift] and [Dual], then choose [Test/Admin]→[Board Test] to enter the following interface.
Function Menu Description
Keyboard Test the instrument’s keys.
LCD Test the instrument’s LCD screen.
Beeper Test the instrument’s beeper.
Chip Test the instrument’s chips.
Done Return to the higher level menu.
63
Page 74

T3DAQ1-16 User Manual
2. Test the keys (select Keyboard).
Select [Key] to enter the key test interface, as displayed in the diagram below. The onscreen rectangle shapes represent the keys on the front panel. Test all keys and knobs and
you should also verify that all the back lit buttons illuminate correctly.
Before testing the keys the key shapes on the screen will be displayed in a blue color.
The on screen keys and knobs will change to a green color when tested. Press [Done]
to exit the test.
3. Test the LCD screen.
Select [LCD] to enter the screen test interface, the screen shows the message: “Press
‘Change’ to change. Press ‘Done’ to exit”. Press [Change] to start the test and observe
if the screen has changed color or other display errors as shown in the diagram below.
NOTE:
• Press [Change] to change the color of the screen. There are three colors: red,
blue and green.
• Press [Done] to exit the test.
64
Page 75

T3DAQ1-16 User Manual
4. Test the beeper.
Press [Beeper] to test the beeper. Under regular circumstances, press [Beeper] one time
and the instrument will beep one time.
5. Test the chips.
Press [Chip]→[Start] to enter chip test interface, as shown in the diagram below.
NOTE:
• If the test is passed, the corresponding result shows “pass”.
• If the test is failed, the corresponding result shows “fail”.
6. Press [Done] to exit the board test.
65
Page 76

T3DAQ1-16 User Manual
Firmware Update
The software of the DAQ can be updated directly via a USB flash drive, updating the current software version to the desired software version.
Operating Steps:
1. Copy the update file to the USB flash drive.
2. Insert the USB flash drive to the USB host interface on the front panel of the DAQ.
3. Press [Shift]→ [Dual]→ [System Setup]→ [Firmware Update], then press [Browse] and select
the update file. Next, press [Update]→ [Yes] to start updating the system software.
4. On completion of the update, the screen will show the message: “Firmware Update Done!”
Then you can remove the USB flash drive away.
5. Restart the DAQ and check the version information. Press [Shift]→ [Dual]→ [System Setup]→
[System Info] to check if the software and hardware version has updated. If not, and the update has failed, you will need to update once more following the above operating steps.
6. After checking, press [Done] to exit the system information interface.
NOTE:
Do not disconnect the power or turn off the instrument while the instrument is updating.
66
Page 77

T3DAQ1-16 User Manual
System Setup
Press [Shift] and [Dual], then select [System Setup] to enter the following interface.
Function Menu Description
Language Select the display interface language.
Firmware Update Update software version.
Screen Setup the screen protection function.
System Info View system information.
Done Return to the higher level menu.
1. Select language.
The DAQ supports two languages, English and Chinese. Press [Language] to select the
Language of the menu.
2. Set up the screen protection timer.
Press [Screen] to set screen protection as 1 Min, 5 Mins, 15 Mins, 30 Mins,1 Hour, 2 Hours
or 5 Hours according to different demands. Activate the screen saver program and screen
saver will be on if no action is taken within the time that you have selected. Press any button
to resume.
3. View system information.
Press [System Info] to view system information, including start-up times, software version,
hardware version, production ID and serial number, as shown in the following diagram.
67
Page 78

T3DAQ1-16 User Manual
68
Page 79

T3DAQ1-16 User Manual
Acquire
Sampling is a process of acquiring and digitizing a signal. The optional Trigger methods of the DAQ
include Auto Trigger, Single Trigger and External Trigger. Press [Acquire] to enter the interface
shown as the following diagram:
Function Menu Description
Trg Src Set the source of trigger.
Slope Set the slope polarity of external trigger.
Delay Set the delay.
Samples/Trigger Set the number of samples per trigger.
Set the polarity output pulse signal when the sampling signal
VMC Out
is finished.
69
Page 80

T3DAQ1-16 User Manual
Auto Trigger
Auto Trigger parameters that need to be set up include delay, samples/trigger and VMC out.
Operating Steps:
1. Press [Acquire], then select [Trg Src]→[Auto] or press [Run/Stop] on the front panel directly
to enable Auto Trigger.
2. Set the delay.
Delay is the waiting time after the trigger signal is sent out and before the acquiring starts.
Press [Delay] to select Auto or Manual mode. When choosing Manual mode, the Left and
Right keys are used to select the numerical digit to adjust. The Up and Down keys are used
to change the selected digit value.
3. Set the number of samples per trigger.
Press [Samples/Trigger] to set the sample count. Left and Right keys are used to switch the
number of a numerical value, Up and Down keys are used to change the selected value.
Sample Count
• Sample Count indicates the number of samples taken when the DAQ receives a
Single Trigger event (samples per trigger).
• The range of sampling points should be between 1 and 599999999.
• The default value of the Sample Count is 1.
4. Set the VMC Out.
The DAQ outputs a pulse signal through the VM COMP interface on the rear panel after the
sampling signal is finished. Press [VMC Out] to choose Positive or Negative polarity.
70
Page 81

T3DAQ1-16 User Manual
Single Trigger
Single Trigger parameters that need to be set up include delay, samples/trigger and VMC out.
Operating Steps:
1. Press [Acquire], then select [Trg Src]→ [Single] or press [Single] on the front panel directly
to enable Single Trigger.
2. Set the delay.
Press [Delay] to select Auto or Manual mode.
3. Set the number of samples or trigger.
Press [Samples/Trigger] to set sample count.
4. Set the VMC Out.
The DAQ outputs a pulse signal through the VM COMP interface on the rear panel after the
sampling signal is finished.
Press [VMC Out] to choose Positive or Negative polarity.
71
Page 82

T3DAQ1-16 User Manual
External Trigger
The external trigger signal will be input via EXT TRIG interface on the rear panel. External trigger
parameters that need to be set up include delay, samples/trigger, slope and VMC out.
Operating Steps:
1. Press [Acquire], then select [Trg Src]→ [Ext] to enable the External Trigger.
2. Set the polarity of slope.
Press [Slope] to choose Positive or Negative polarity.
3. Set the delay.
Press [Delay] to choose Auto or Manual mode.
4. Set the number of samples or trigger.
Press [Samples/Trigger] to set sample count.
5. Set the VMC Out.
In External Trigger mode, the DAQ could output a pulse signal through the VM COMP interface on the rear panel after the sampling signal is finished.
72
Page 83

T3DAQ1-16 User Manual
Help System
T3DAQ1-16 provides a powerful built-in help system. You can recall help information at any time
while using the instrument. You also can get a functionality help for every button on the front panel
or menu soft key by using the built-in help system. You may also get help about familiar operations
with the help list.
Press [Shift] and [Acquire] to enter the help list, as the following diagram shows.
Function Menu Description
Up Move up the cursor and select the help menu.
Down Move down the cursor and select the help menu.
Select Select the help information you want to read.
Done Return to the higher menu.
1. Basic Measure.
Get basic measurement types and methods to connect the leads for different measurements.
2. Measuring Temperature.
Get the method to measure temperature.
3. Measuring Capacitance.
Get the method to measure capacitance.
4. Math Function.
Introduction of how to use the math function while making measurements.
5. Dual-display Function.
Learn the method to use the dual-display function while you are measuring.
6. Saving and Recalling Information.
Introduction of how to store and recall the data/parameter/sensor files.
7. The convention and Tips of Soft Key usage.
Get help and tips about using the soft keys.
73
Page 84

T3DAQ1-16 User Manual
8. Technical Support.
How to obtain technical support.
Explanation:
• In the help menu interface, you can move the cursor and select the corresponding
menu by the up and down direction keys and press “OK” to read the help information.
• While reading the help information, you can also look up and down the information by
selecting the up and down direction keys.
74
Page 85

T3DAQ1-16 User Manual
Math Functions
The DAQ provides five math functions: Statistics, Limits, dBm, dB and Relative. Choose different math functions to meet different measurement needs. Math functions can only be used in DC
Voltage, AC Voltage, DC Current, AC Current, Resistance, Frequency, Period and Temperature
measurement. Among these functions, dBm and dB are only used in DC Voltage and AC Voltage
measurement.
Press [Math] to show the operating menu of math functions on the screen, as shown in the following diagram.
Function Menu Settings Description
Reading statistic functions, including max, min, aver-
Statistics
Limits
dBm
db
Rel Value Value/Off
Explanation:
• Math functions are only applicable to the main display.
• If a measurement function is changed, all math functions will be stopped except Statistics.
age, span, std dev and samples.
The Limits function performs Pass/Fail testing according to the specified upper and lower limits.
The dBm is based on a calculation of power delivered
to a reference resistance, 0dBm = 1mW
The dB measurement is the difference between the
input signal and a stored relative value.
Turn on the relative value function and set up the
value. Or turn off the function.
75
Page 86

T3DAQ1-16 User Manual
Statistics
There are many kinds of reading statistic functions, including: Max, Min, Average and Standard
deviation.
Press [Math]→ [Statistics]→ [Show] to enter the interface shown in the following diagram.
Function Menu Settings Description
Min Show the minimum statistics value of current measurement.
Average Show the average statistics value of current measurement.
Show the maximum statistics value of current measure-
Max
Span Show the span of current measurement.
Std dev Show the std dev statistics value of current measurement.
Samples Show the number of samples of current measurement.
Statistics Show/Hide Show or hide the statistics function interface.
Clear Readings Clear all current readings and restart statistics.
Done Return to the higher level menu.
Statistics Function:
• In statistic function, the first reading is usually set to the maximum or minimum
value. When acquiring more readings the current displayed value is always the maximum/minimum reading among all the measured values.
ment.
• The maximum, minimum, average and reading quantities are stored in volatile memory.
76
Page 87

T3DAQ1-16 User Manual
Limits
Limits function is available to indicate signals beyond ranges according to the upper and lower parameters. The following are some measurement functions which are able to do a limit operation:
DC Voltage, AC Voltage, DC Current, AC Current, Resistance, Frequency, Period, Capacitance
and Temperature.
Press [Math]→ [Limits]→ [On] to enter the interface shown in the following diagram.
The table shows the description of Limits Measurement function menu.
Function Menu Settings Description
Limits On/Off Turn on or turn off the Limits function.
Low Set the desired lower limit.
Center Set the desired center value.
High Set the desired upper limit.
Status Show the status of limit test.
Low Failures Show the times that reading is lower than the limit.
High Failures Show the times that reading is higher than the limit.
Span Set the desired span.
When the beeper is on, if the reading is lower or higher than
Beeper On/Off
Clear Condition Clear all current readings and restart to test.
Done Save all changes and return to the higher level menu.
limits, the instrument will beep once.
77
Page 88

T3DAQ1-16 User Manual
1. How to Set Limits
Select [High], [Low], [Center] or [Span] and then switch to the needed digit using the Left or
Right Direction keys and input the numerical value by selecting the Up and Down Direction
keys.
2. Unit
The unit of Limits is decided by the current measurement function.
3. Notes
• When the reading is lower than the set lower limit, the color of the main display will
switch from blue to red.
• When the reading is higher than the set higher limit, the color of the main display will
switch from blue to red.
• When the reading is lower or higher than the set limits, the Beeper will beep once. (The
beeper is turned on.)
The range of Limits function:
• The Limits range is -120% to +120% of the current measurement range.
• The upper limit value should be always bigger than the lower limit value.
• The upper and lower values are stored in volatile memory. They will be set to default
values when the power is initially turned on.
78
Page 89

T3DAQ1-16 User Manual
dBm
The dBm function is logarithmic and based on a calculation of power delivered to a reference
resistance, relative to 1 milliwatts. This function only applies to an AC voltage and DC voltage
measurements.
Press [Math]→ [dB/dBm]→ [On] and select [Function dBm] to enter the interface shown in the following diagram.
Function Menu Settings Description
dB/dBm On/Off Turn on or turn off dB or dBm function.
Open the dBm function and the lower right corner of
Function
the main display will show ”dBm”.
Ref R Set the parameter via direction keys: 50Ω - 8000Ω
Done Save all changes and return to the higher level menu.
The computation method for dBm:
When the dBm function is turned on, the measured value of voltage is transformed into dBm according to the below formula.
dBm = 10 ∗ log10[(Reading2/R
)/0.001W ]
REF
79
Page 90

T3DAQ1-16 User Manual
dB
Each dB measurement is different between the input signal and a stored relative value, with both
values converted to dBm. The dB function applies to AC voltage and DC voltage measurements
only.
Press [Math]→ [dB/dBm On] and select [Function dB] to enter the interface shown in the following
diagram.
Function Menu Settings Description
dB/dBm On/Off Turn on or turn off dB or dBm function.
Open dB function and the lower right corner of the
Function dB
main display show “dB”.
Ref R Set the parameter via direction keys: 50Ω - 8000Ω
dB Ref Value Set the referred value of dB.
Measure Ref
Value Set the referred value of measurement.
Done Save all changes and return to the higher level menu.
The computation method of the dB:
R
dB = 10 ∗ log10[(Reading2/R
expressed measuring the resistance value in the actual electric circuit. Range of the dB
REF
)/0.001W ] − (dB setting value)
REF
setting value: -200 dBm to +200 dBm. The default is 0 dBm.
dB value:
• Input a value in dB setting interface using the direction buttons, and then store it as dB
setting value.
• Settings of dB value are stored in volatile memory.
80
Page 91

T3DAQ1-16 User Manual
Relative Value
Relative value is used for relative measurements. Actual measurement reading is the difference
between measurement value and preset value.
The DAQ Relative Value is available for the following measurement parameters: DC Voltage, AC
Voltage, DC Current, AC Current, Resistance, Frequency, Period, Capacitance and Temperature.
Press [Math]→ [Rel Value] to enter the interface shown in the following diagram.
Function Menu Description
Select the current measurement value as the preset
Value
Off Turn off the relative operation function.
When Rel Value function is turned on, the result of relative measurement will display on the screen.
Main display = Measurement value – Preset value
value.
81
Page 92

T3DAQ1-16 User Manual
Display Mode
The DAQ supports four types of views for measured data: “Number”, “Bar Meter”, ”Trend Chart”
and “Histogram”.
Number
Press [Shift] and [Math] to open the menu of display mode and press [Display] to enter the following
interface. “Number” is always the selected mode when the DAQ is turned on.
82
Page 93

T3DAQ1-16 User Manual
Bar Meter
Operating Steps:
1. Press [Bar Meter] to enter Bar Meter display mode.
2. Press [Horizontal Scale] to set the vertical scale as Default Manual mode.
Table below shows the functions menu and the description.
Function Menu Description
Low Set the low value of horizontal scale.
High Set the high value of horizontal scale.
Center Set the center value of horizontal scale.
Span Set the span of horizontal scale.
Done Save all changes and return to the higher level menu.
83
Page 94

T3DAQ1-16 User Manual
Trend Chart
Operating Steps:
1. Press [Trend Chart] to enter the Trend Chart display mode.
Table below describes the Trend Chart Display Mode.
Function Menu Description
Display Trend The current select display mode is Trend Chart.
Recent All Show recent or all readings.
Horizontal Scale Choose the mode of Horizontal Scale.
Autoscale Once Automatically set the horizontal scale once.
Clear Readings Clear all current readings and restart statistics.
84
Page 95

T3DAQ1-16 User Manual
2. Press [Horizontal Scale] to choose the way to set the horizontal scale as Default, Auto or
Manual mode.
Press [Auto] and the DAQ will set the vertical scale automatically.
Press [Manual] and you can set the vertical scale manually, as displayed in the diagram below.
85
Page 96

T3DAQ1-16 User Manual
Histogram
Operating Steps:
1. Press [Histogram] to enter the Histogram display mode.
Table below describes the Histogram Display Mode.
Function Menu Settings Description
Display
Histogram Currently selected display mode is Histogram.
Binning Set Binning as Auto or Manual mode.
Bin Set Set the Bin parameters.
Cumulative On/Off Turn on or off the Cumulative function.
Clear Readings Clear all current readings and restart statistics.
2. Press [Binning] to set Binning as the Auto or Manual mode. When in Manual mode, press
[Bin Settings] to enter the following interface.
86
Page 97

T3DAQ1-16 User Manual
Function Menu Settings Description
Set the number of Bins, 10, 20, 40, 100, 200 or 400
Num.Bins
selected.
Low Set the low value of the horizontal scale.
High Set the high value of the horizontal scale.
Center Set the center value of the horizontal scale.
Span Set the span of the horizontal scale.
Outer Bins On/Off Set the bins beyond the set range or not.
Done Save all changes and return to the higher level menu.
87
Page 98

T3DAQ1-16 User Manual
Trigger
The DAQ supports the Trigger function. Press [Run/Stop] or [Single] on the front panel to trigger
the DAQ by Auto or Single mode. Auto trigger is considered as a default when the power is initially
turned on.
Auto Trigger
Press [Run/Stop] on the front panel one time and the Auto Trigger will be started to capture continuous readings automatically. The screen will show “Auto Trigger”. Press [Run/Stop] again and
the trigger is stopped.
Single Trigger
Press [Single] on the front panel, the Single Trigger will be started one time and generate a single
reading. The screen will show “Single Trig”.
Explanation
In the Remote Mode, the screen will show
mode and the DAQ will choose Auto Trigger automatically.
“Imme Trig”
. Press [Shift] to switch back to the local
88
Page 99

T3DAQ1-16 User Manual
Hold Measurement Function
Hold Measurement function provides users with a stable reading on the screen of the front panel.
When the test leads are disconnected, the reading is still held on the screen, which enables users
to view the measured history data.
Press [Shift] and [Single] to open Hold measurement function interface, the black field just above
the screen will show “Probe Hold”, as shown in the following diagram.
Function Menu Settings Description
Probe Hold On/Off Turn on or off the Probe Hold function.
Beeper On/Off Turn on or off the Beeper.
Clear List Clear all current readings and restart the statistics.
89
Page 100

Chapter 3
Measurement Tutorial
True RMS AC Measurement
The AC measurement of the DAQ has a true RMS response. The power dissipated in a resistor within a time is proportional to the square of the measured true RMS voltage, independent of
waveform shape. The instrument can accurately measure true RMS voltage or current, as long as
the waveform shape contains negligible energy above the effective bandwidth.
The AC voltage and AC current functions measure the “AC coupled” true RMS value, which is to
measure the RMS value of the AC component (DC component is rejected) of the input signal. For
sine waves, triangle waves, and square waves, the AC and AC+DC values are equal since these
waveforms do not contain a DC offset. See the table below.
An AC coupled true RMS measurement is desirable in situations where you are measuring small
AC signals in the presence of DC offsets. For instance, measuring an AC ripple present on DC
power supplies. There are situations, however, where you might want to know the AC+DC true
RMS value. You can determine this value by combining results from DC and AC measurements
as the following shows. You should perform the DC measurement using 6.5 digit mode for best
AC rejection.
RM S
(AC+D C)
=√AC2+ DC
90
2
 Loading...