

Page 1

HDO9000
Oscilloscopes
Getting Started Guide
Page 2

II
700 Chestnut Ridge Road
Chestnut Ridge, NY 10977
1.800.5.LECROY • teledynelecroy.com
HDO9000 Oscilloscopes
Getting Started Guide
© 2019 Teledyne LeCroy, Inc. All rights reserved.
Unauthorized duplication of Teledyne LeCroy documentation materials is strictly prohibited. Customers are permitted to
duplicate and distribute Teledyne LeCroy documentation for internal educational purposes.
Teledyne LeCroy is a trademark of Teledyne LeCroy, Inc. Other product or brand names are trademarks or requested
trademarks of their respective holders. Information in this publication supersedes all earlier versions. Specifications are
subject to change without notice.
930536-00 Rev A,
January, 2019
930536-00 Rev A
Page 3

Welcome
Thank you for buying a Teledyne LeCroy product. We’re certain you’ll be pleased with the detailed features unique to our instruments. This guide is
intended to help you set up an HDO9000 oscilloscope and learn some basic operating procedures, so you're quickly working with waveforms.
• See the MAUI Oscilloscopes Remote Control and Automation Manual for comprehensive information on remote control of HDO9000.
• See the HDO9000 Oscilloscopes Operator’s Manual for detailed information on the operational features of the HDO9000.
Both manuals can be downloaded from the Oscilloscope Manuals page on our website at: teledynelecroy.com/support/techlib
Introduction
Introducing HDO9000 Oscillosocopes 2
Safety 2
Overview
Front of Oscilloscope 4
Powering On/Off 5
Side of Oscilloscope 6
Connecting to External Devices/Systems 7
Back of Oscilloscope 8
Front Panel 9
Touch Screen Display 10
Basics
Changing the Display 12
Working with Traces 14
MAUI with OneTouch 15
Vertical (Channel) 20
Digital 22
Horizontal (Timebase) 24
Zoom 27
Triggers 28
Cursors 30
Measurements & Statistics 31
Math 32
Memories (Reference Waveforms) 33
Decode 34
WaveScan 35
Spectrum Analyzer 36
History Mode 37
Saving and Sharing Data 38
Maintenance
Software Options 39
Cleaning 40
Language Selection 40
Calibration 40
Firmware Updates 41
Switching Windows Users 41
Service 42
Support 43
Reference
Windows License Agreement 43
Warranty 43
Certifications 44
HDO9000 Getting Started Guide
1
Page 4
INTRODUCTION
Introducing HDO9000
HDO9000 high definition oscilloscopes leverage HD1024 technology to
deliver 10 bits of resolution on up to 4 GHz of bandwidth. The large, bright,
15.4” capacitive touch screen combined with the MAUI with OneTouch
user interface results in an unsurpassed user experience. Equipped with
a 40 GS/s sample rate and an extensive toolbox, the HDO9000 ensures
uncompromised performance when debugging in high definition.
HD1024
HD1024 high definition technology enables dynamic reconfiguration
of the ADC to achieve 10 bits of vertical resolution. By automatically
determining the best ADC configuration for each measuring condition,
the HDO9000 always provides the optimal resolution. HD1024 plus a low
noise system architecture delivers superior signal fidelity up to 4 GHz,
resulting in ENOB in excess of 7 bits.
MAUI with OneTouch
MAUI with OneTouch introduces a new paradigm for oscilloscope user
experience. Dramatically reduce set up time with revolutionary drag-anddrop actions, and use familiar touch screen gestures like pinch, swipe and
flick to intuitively interact with the instrument.
Mixed Signal Option
The 16 integrated digital channels and tools designed to view, measure
and analyze both analog and digital signals enable fast debugging of
mixed signal designs.
Comprehensive Analysis Tools
HDO9000 has the most comprehensive trigger, decode, math, measure
and application toolsets available in its class. Apply statistical and
frequency analysis tools to enhance understanding of complex behaviors.
WaveScan® lets you to search acquisitions using more than 20 criteria,
while LabNotebook concisely documents and stores your results.
Key Specifications
Detailed specifications are on the product datasheet at teledynelecroy.com.
Bandwidth 1 GHz to 4 GHz
Analog Channels 4
Memory per Channel 64 Mpts/ch 4-channel operation
Sample Rate 10 GS/s 4-channel operation
Vertical Resolution 10-bit
Digital Channels (optional) 16
Digital Sample Rate 1.25 GS/s
Min. Detectable Pulse Width 2 ns
Max. Input Frequency 250 MHz
128 Mpts/ch 2-channel operation
20 GS/s 2-channel operation
Safety
Observe generally accepted safety practices in addition to the precautions
specified here.
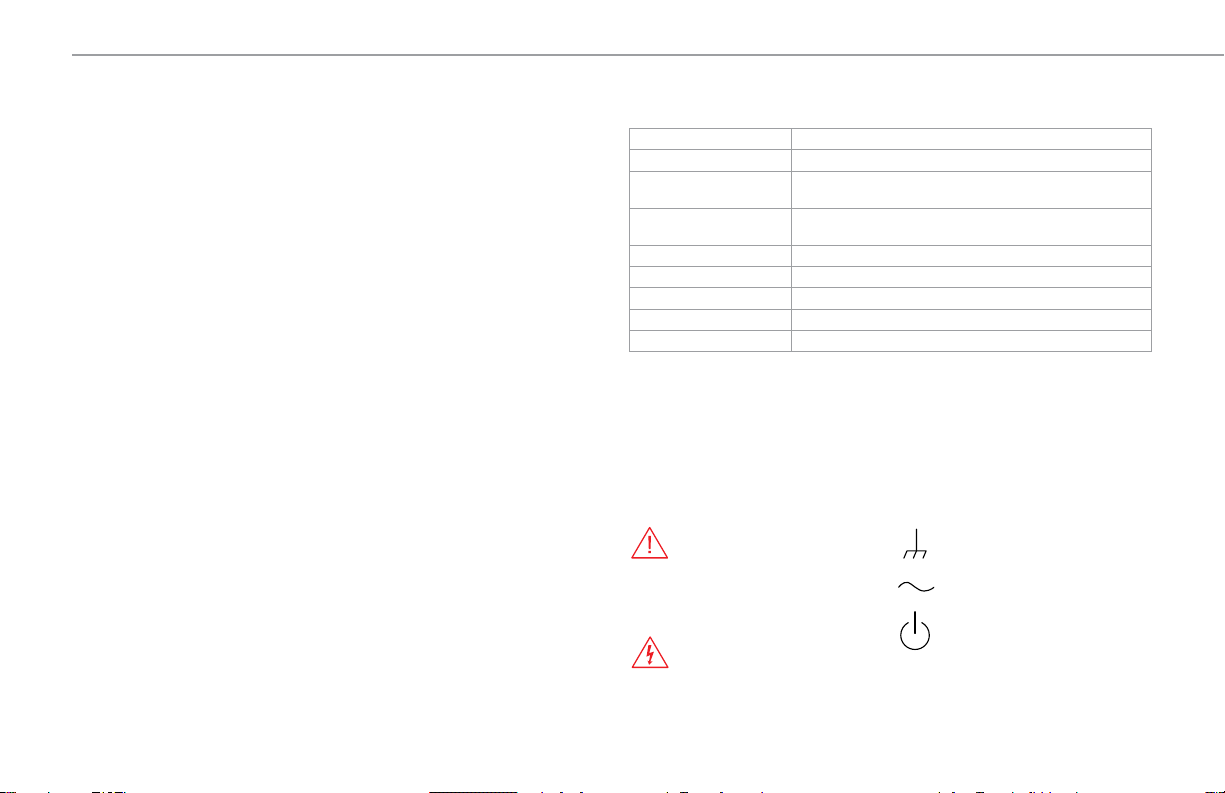
Symbols
CAUTION of potential damage
to equipment, or WARNING of
potential bodily injury. Refer to
manual. Do not proceed until the
information is fully understood
and conditions are met.
WARNING. Risk of electric shock
or burn.
Frame or chassis terminal
Alternating current
Power On/Standby
2
930536-00 Rev A
Page 5
SAFETY
Operating Environment
Temperature 5 °C to 40 °C
Humidity Maximum RH 90% (non-condensing) up to 31 °C
Altitude Up to 10,000 ft (3,048 m) at or below 30 °C
decreasing linearly to RH 50% at 40 °C
Power
AC Power 100-240 VAC (±10%) at 50/60 Hz (±10%) or
Consumption
Nominal 415 W / 415 VA
Maximum* 500 W / 500 VA
Standby 15 W
* All PC peripherals and active probes connected to four channels.
100-120 VAC (±10%) at 400 Hz (±5%)
Automatic AC Voltage Selection
Measuring Terminal Ratings
Ratings apply to inputs C1-C4 and Ext In.
Maximum Input Voltage 50 Ω coupling ≤ 5 Vrms
Measuring terminals have no rated measurement category (CAT) per IEC/EN 61010-1:2010.
Measuring terminals are not intended to be connected directly to supply mains.
1 MΩ coupling ≤ 400 Vpk max. (Peak AC ≤ 10 kHz + DC)
derating at 14 dB/decade from 10 kHz to 2 MHz,
10 Vpk max. above 2 MHz
Precautions
Use proper power cord. Use only the power cord shipped with this
instrument and certified for the country of use.
Maintain ground.
instrument. Connect line cords only to outlets with safety ground contacts.
WARNING. Interrupting the protective conductor inside or outside
the oscilloscope, or disconnecting the safety ground terminal,
creates a hazardous situation. Intentional interruption is prohibited.
Connect and disconnect properly. Do not connect/disconnect probes or
test leads while they are connected to a live voltage source.
Observe all terminal ratings. Do not apply a voltage to any input that
exceeds the maximum rating of that input. Refer to the markings next to
the BNC terminals for maximum allowed values.
Use only within operational environment listed. Do not use in wet or
explosive environments.
Use indoors only.
Keep product surfaces clean and dry.
Do not block the cooling vents. Leave a minimum six-inch (15 cm) gap
between the instrument and the nearest object. Keep the underside clear
of papers and other objects.
Exercise care when lifting and carrying. Unplug and use the built-in
carrying handle to move the instrument.
Do not remove the covers or inside parts. Refer all maintenance to
qualified service personnel.
Do not operate with suspected failures. Check body and cables regularly.
If any part is damaged, cease operation immediately and sequester the
instrument from inadvertent use.
The AC inlet ground is connected to the frame of the
HDO9000 Getting Started Guide
3
Page 6
OVERVIEW
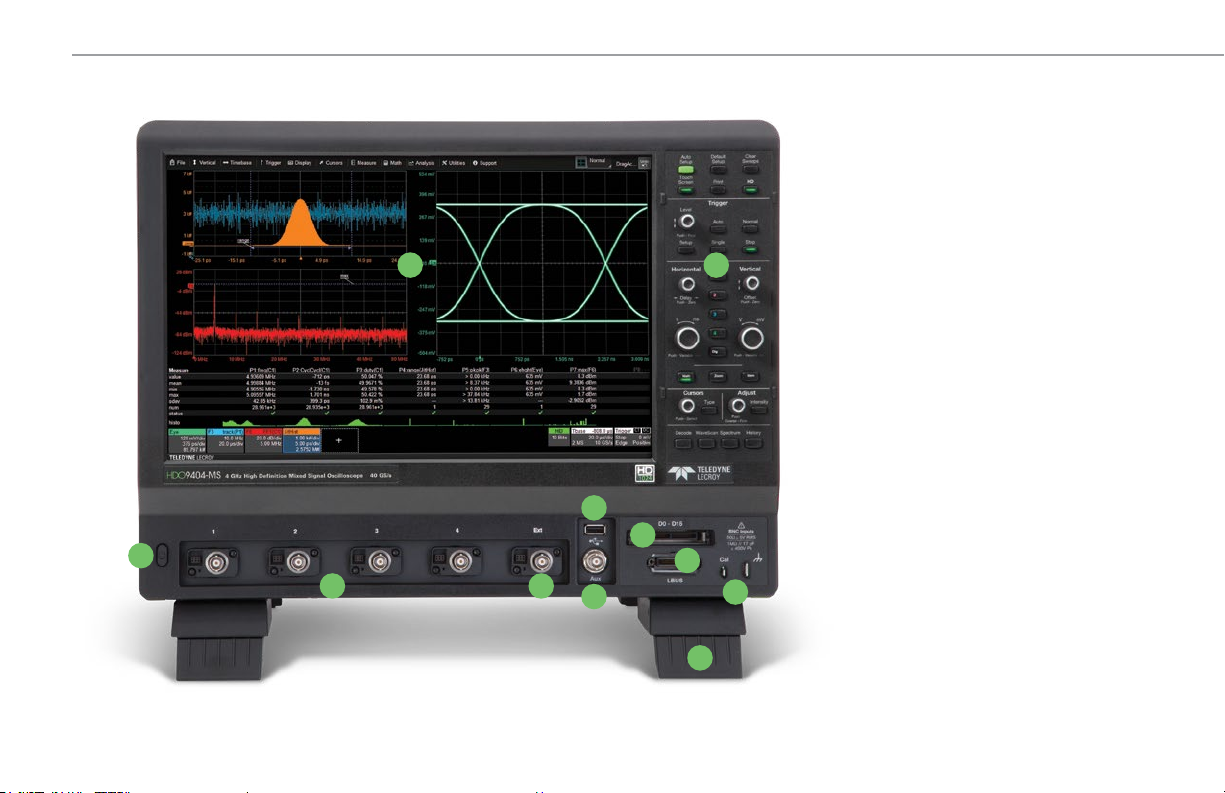
Front of Oscilloscope
A. Capacitive Touch Screen Display
B. Front Panel
4
930536-00 Rev A
A
B
C. Power On/Standby Button
D. Input Channels 1-4
E. EXT In
F. AUX Out
G. USB 2.0 Port
H. Mixed Signal Interface
I. LBUS Port
G
C
D
E
F
I
J
H
J. Cal Out and Ground Terminals
K. Tilting Feet
K
Page 7
OVERVIEW
The touch screen display is the principal viewing and control center of
the oscilloscope. See p.10 for an overview of its components.
The front panel houses hard controls for different acquisition settings.
Operate the instrument using front panel controls, touch screen controls,
or a mix that is convenient for you. See "Front Panel" on p.9.
Channels 1–4 are used to input analog signal. EXT can be used to input
an external trigger signal.
AUX out can be configured to send a pulse to another device upon a
trigger event or Pass/Fail outcome.
The LBUS port may be used with the optional 8-Channel Sync to provide
precise synchonization with other instruments, or the HDA125-xx-LBUS
for high-speed digital analysis and triggering.
Cal out emits a signal that can be used to compensate passive probes.
HDO9000 oscilloscopes are compatible with the included passive probes
and all ProBus active probes that are rated for the oscilloscope’s bandwidth.
Probe specifications and documentation are at teledynelecroy.com/probes.
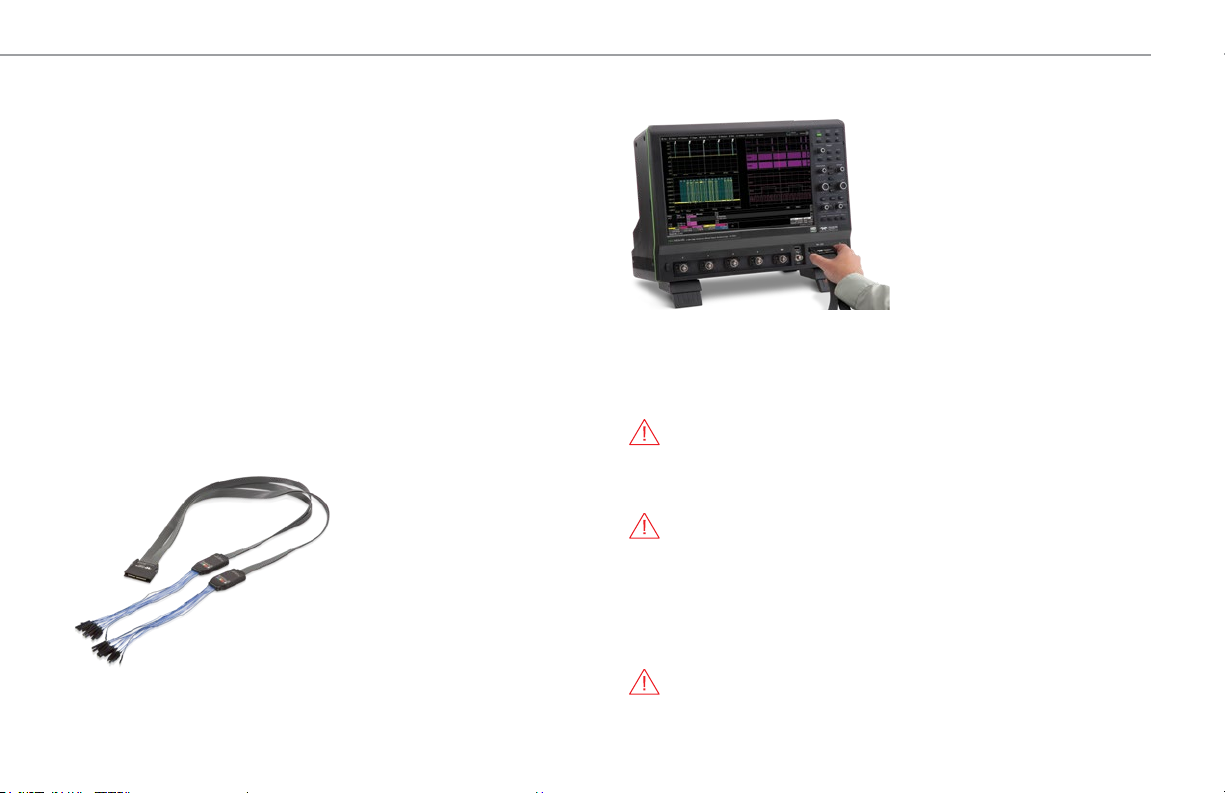
Supplied with the Mixed Signal
models, the digital leadset connects
to the Mixed Signal interface to
input up-to-16 lines of digital data.
Two digital banks with separate
threshold and hysteresis controls
make it possible to simultaneously
view data from different logic
families. Each flying lead has a
signal and a ground connection. A
variety of ground extenders and
flying ground leads are available for
your probing needs.
To achieve optimal signal integrity, connect the ground at the tip of the flying
lead for each channel used in measurements. Use either the provided ground
extenders or flying ground leads to
make the ground connection.
To connect the leadset to the
oscilloscope, push the connector
into the mixed signal interface until
you hear a click.
To remove the leadset, press in and
hold the buttons on each side of the
connector, then pull out to release it.
Powering On/Off
Plug the line cord only into a grounded AC power outlet. See Power in
“Safety” for ratings. Press the Power button to turn on the oscilloscope. The
button will light to show the oscilloscope is operational.
CAUTION. Do not power on or calibrate with a signal attached.
Press the Power button again or use or the File > Shutdown menu option
to execute a proper shut down process and preserve settings.
CAUTION. Do not press and hold the Power button. This will
execute a hard shutdown, but may not preserve setups and data.
The Power button does not disconnect the oscilloscope from the AC
power supply, but puts it into "Standby" mode. Some “housekeeping”
circuitry continues to draw power. The only way to fully power down the
instrument is unplug the AC line cord from the outlet. We recommend
unplugging the instrument if it will remain unused for a long period of time
CAUTION. Do not change the Windows® Power setting to System
Standby or System Hibernate. Doing so may cause failure.
HDO9000 Getting Started Guide
5
Page 8
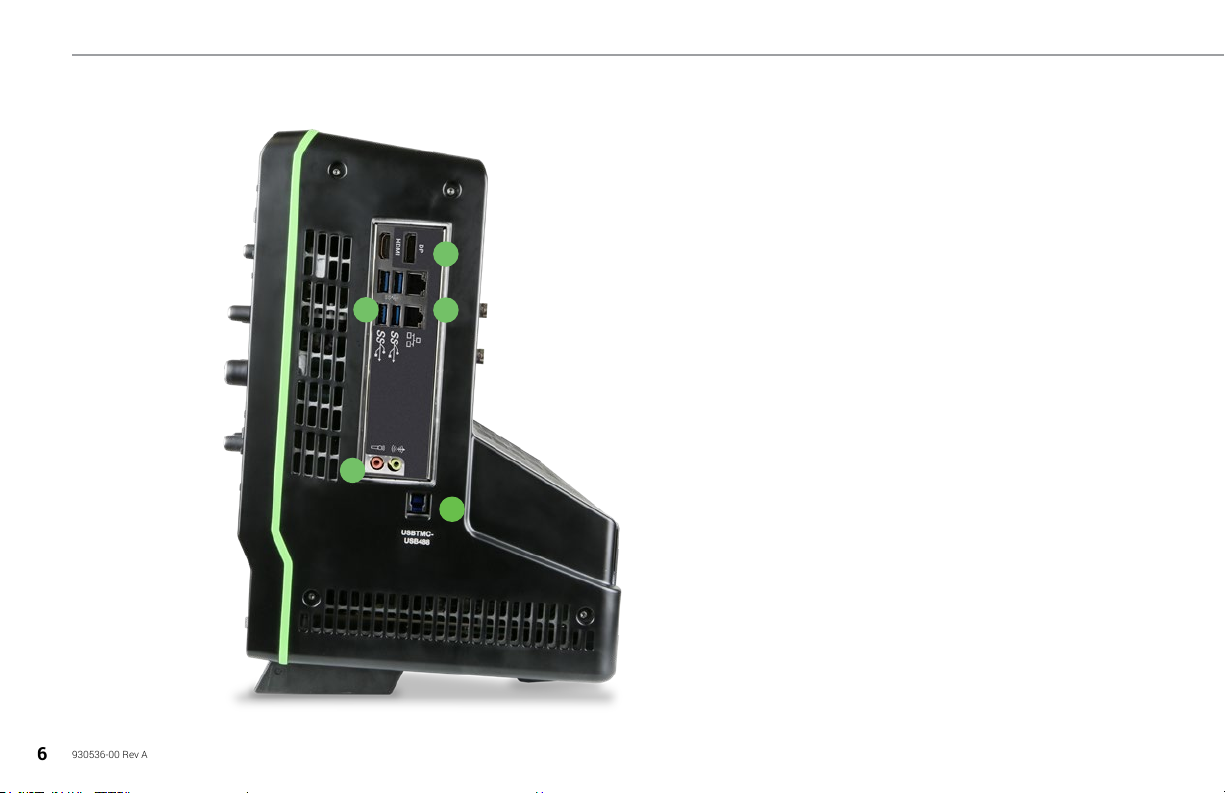
OVERVIEW
Side of Oscilloscope
B C
D
A.
HDMI 1.4 and DisplayPort 2.0 Ports
B.
USB 3.1 Gen 1 Ports (4)
A
C.
Ethernet Ports (2)
D.
Audio Mic and Speaker
E.
USBTMC Port (1) for remote control
E
6
930536-00 Rev A
Page 9

OVERVIEW
Connecting to External Devices/Systems
See the HDO9000 Oscilloscopes Operator’s Manual for more instructions on
connecting to external devices.
Audio/USB Peripherals
Connect the device to the appropriate port. These connections are “plugand-play” and do not require further configuration. Use the Windows
control panel to make adjustments. Choose File > Minimize to go to the
Windows desktop.
External Monitor
The HDMI and DisplayPort interfaces support Ultra HD monitors. Connect
the monitor to a video output on the side of the instrument. You can
use an adapter if it does not have an HDMI or DP cable. Go to Display >
Display Setup > Open Monitor Control Panel to configure display settings
using the Windows control panel. Be sure to select the oscilloscope as the
primary display.
To use the Extend Grids feature, configure the second monitor to extend,
not duplicate, the oscilloscope display. If the external monitor is touch
screen enabled, the MAUI user interface can be controlled through touch
on the external monitor.
Note: The oscilloscope touch screen uses Fujitsu drivers. Because of
potential conflicts, external monitors with Fujitsu drivers cannot be used
as touch screens, only as displays.
LAN
The HDO9000 is preset to accept a DHCP network address over a TCP/IP
connection. Connect an ENET cable from either port to a network access
device. Go to Utilities > Utilities Setup > Remote to find the IP address.
To assign the oscilloscope a static IP address, open Net Connections
from the Remote dialog and use the Windows networking dialogs to
configure the device address. Go to File > File Sharing to configure email.
Remote Control
You can control the instrument over a LAN using VICP (TCP/IP) or
VXI-11 (LXI). Use a standard ENET cable to connect to a network access
point, and be sure the instrument is on the same subnet as the controller.
You can also connect directly using TCP/IP, but depending on the
controller, you may need to use a cross-over cable.
Note: To use LXI on Windows 10 oscilloscopes, switch to the
Administrative User LCRYADMIN (p.41).
USBTMC and GPIB (with the optional USB-GPIB adapter) can also be used
to make a remote connection. To change the remote control setting from
the default VICP (TCP/IP), go to Utilities > Utilities Setup > Remote.
Printer
HDO9000 supports USB printers that are compatible with the Windows
OS installed on the oscilloscope. Connect the printer to any host USB
port, then go to File > Print Setup > Print and select Printer to configure
settings. Choose Properties to open the Windows print dialog.
Aux Out and Cal Out
The oscilloscope can output a pulse upon a trigger event or Pass/Fail
outcome. Connect a BNC cable from Aux Out on the front of the instrument
to the other device. Go to Utilities > Utilities Setup > Aux Output to
configure the output.
The Cal Out hook on the front can be set to output a direct current or
square wave of custom amplitude and frequency. Use the Aux Output
dialog to configure Cal Out.
Reference Clock
To input or output a reference clock, connect a BNC cable from Ref In
or Ref Out on the back of the instrument to the other instrument. Go to
Timebase > Horizontal Setup > Clock Source to configure the clock.
HDO9000 Getting Started Guide
7
Page 10
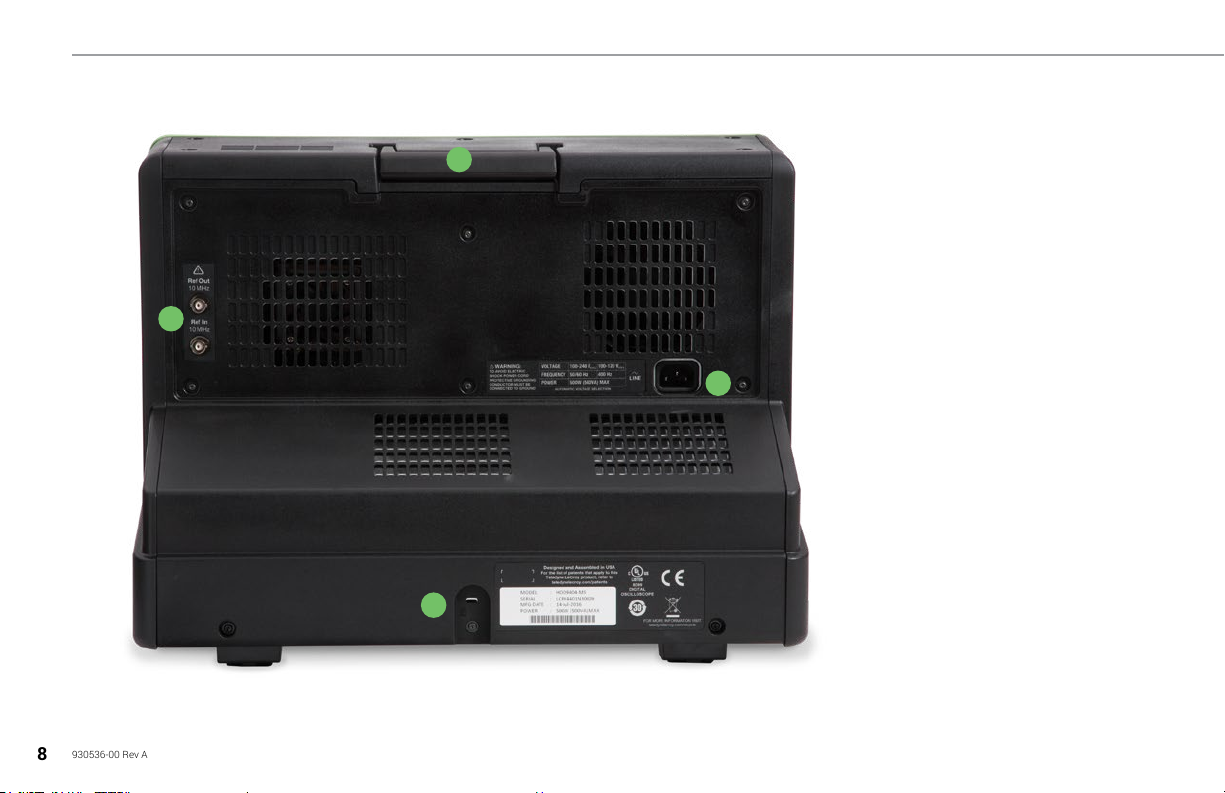
OVERVIEW
A
A.
Built-in Carrying Handle
B.
Ref In and Ref Out to input/
output external Reference Clock
8
930536-00 Rev A
B
C.
AC Power Inlet
D.
Kensington Lock
C
D
Page 11
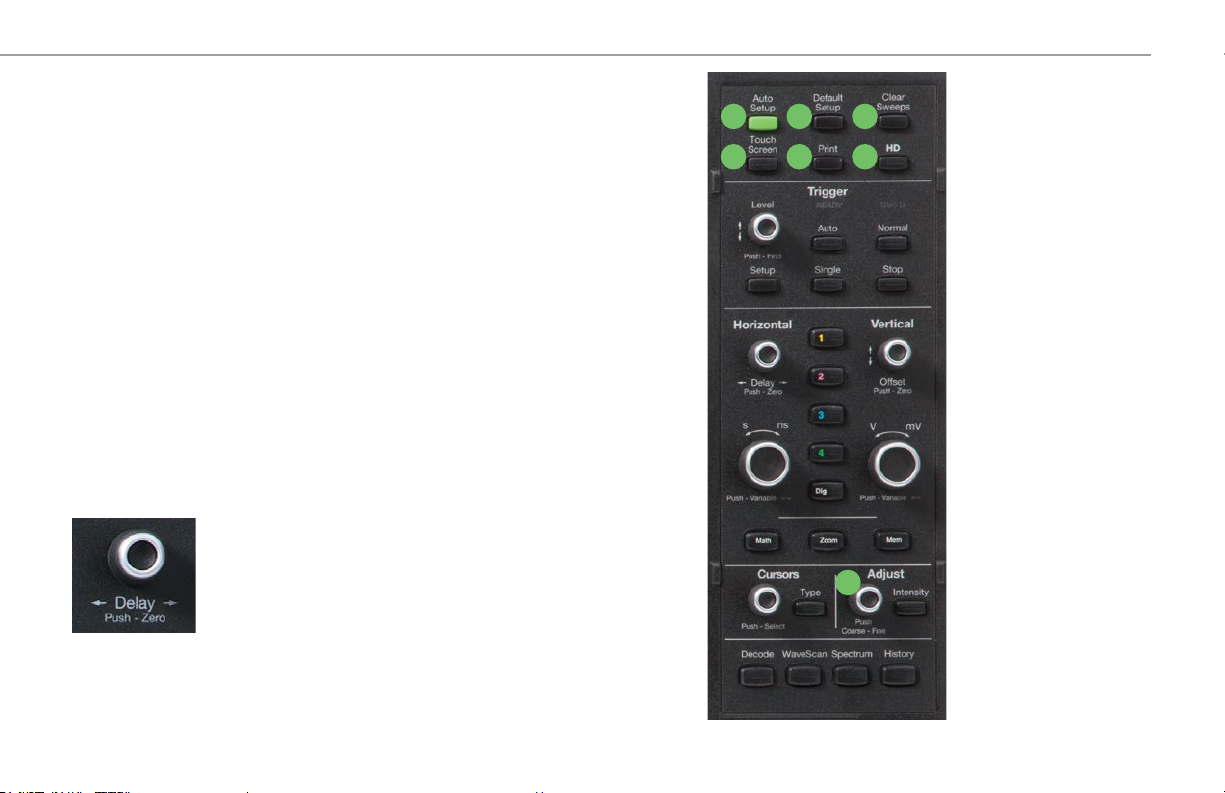
Front Panel
Most of the front panel controls duplicate functionality available through the
touch screen display. They are covered in more detail in the Basics section
and in the HDO9000 Oscilloscopes Operator’s Manual. Below are some special
front panel controls.
A.
Auto Setup turns on and configures all channels with a signal attached.
The edge trigger level is set to the signal mean.
B.
Default Setup returns all channels to the factory default settings.
C.
The Print button captures the screen and handles it according to your
Print setting (print to file on USB drive, create LabNotebook entry, etc.). It
can be set to capture only the grid rather than the full screen.
D.
The Touch Screen button enables or disables touch screen functionality.
E.
Clear Sweeps resets math and measurement counters.
F.
The HD button enables/disables HD1024 operation.
G.
The front panel Adjust knob changes the value in the highlighted data
entry field when turned. Pushing the Adjust knob toggles between coarse
(stepped) or fine adjustments when the knob is turned.
All the knobs on the front panel function one way if
turned and another if pushed like a button. The first
label describes the knob’s principal “turn” action, while
the second describes its “push” action.
Many front panel buttons light to indicate the function
is active.
OVERVIEW
A B C
D E F
G
HDO9000 Getting Started Guide
9
Page 12
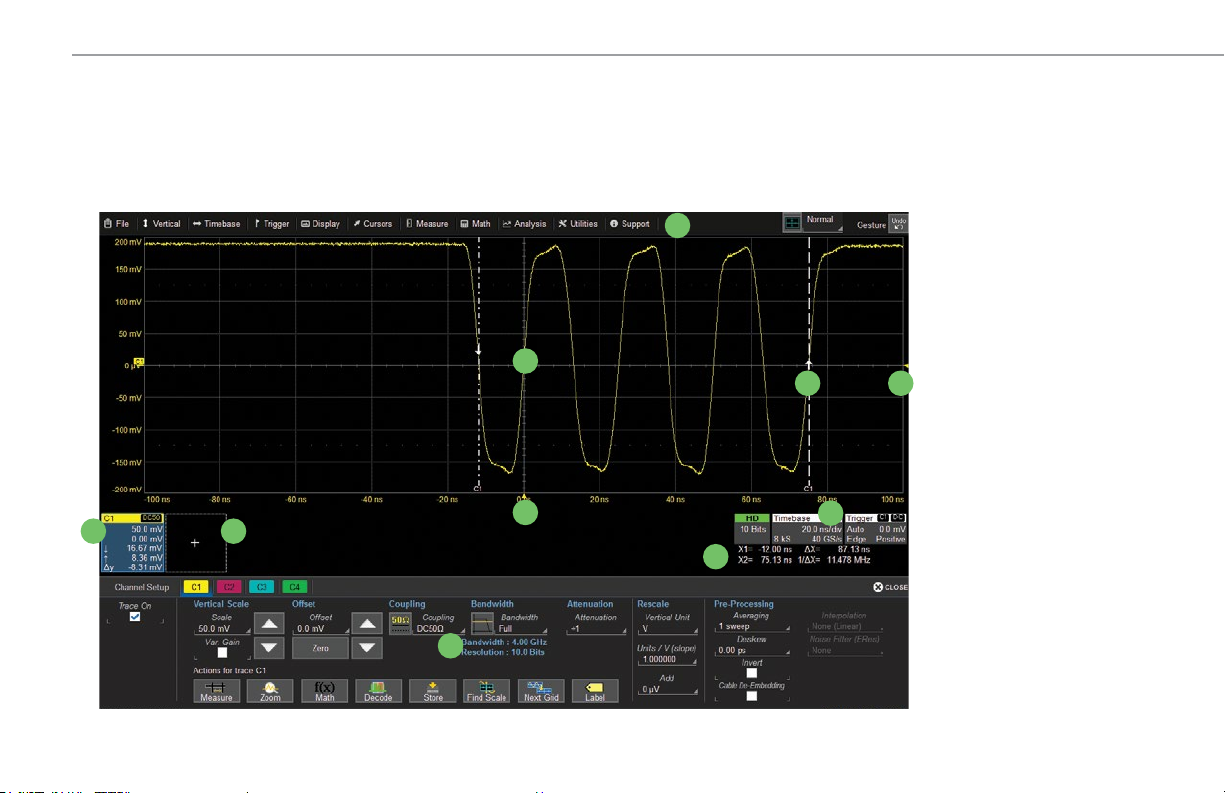
OVERVIEW
Touch Screen Display
The entire display is active. Use your finger to touch, drag-and-drop, swipe, pinch and flick. Many controls that display information also work as “buttons”
to access other functions. If you have a mouse installed, you can click anywhere you can touch to activate a control; in fact, you can alternate between
clicking and touching, whichever is convenient for you.
10
F G
930536-00 Rev A
A
B
C D
E
H
I
A. Menu Bar
B. Grid
C. Cursor
D. Trigger Level Indicator
E. Trigger Time Indicator
F. Trace Descriptor Box
G. Add New Box
H. Timebase and Trigger
Descriptor Boxes
I. Horizontal Cursor
Readout
J. Setup Dialogs
J
Page 13
OVERVIEW
A drop-down menu bar lets you access set up dialogs and other
functions. All functionality can be accessed through either the menu bar
or other touch screen shortcuts.
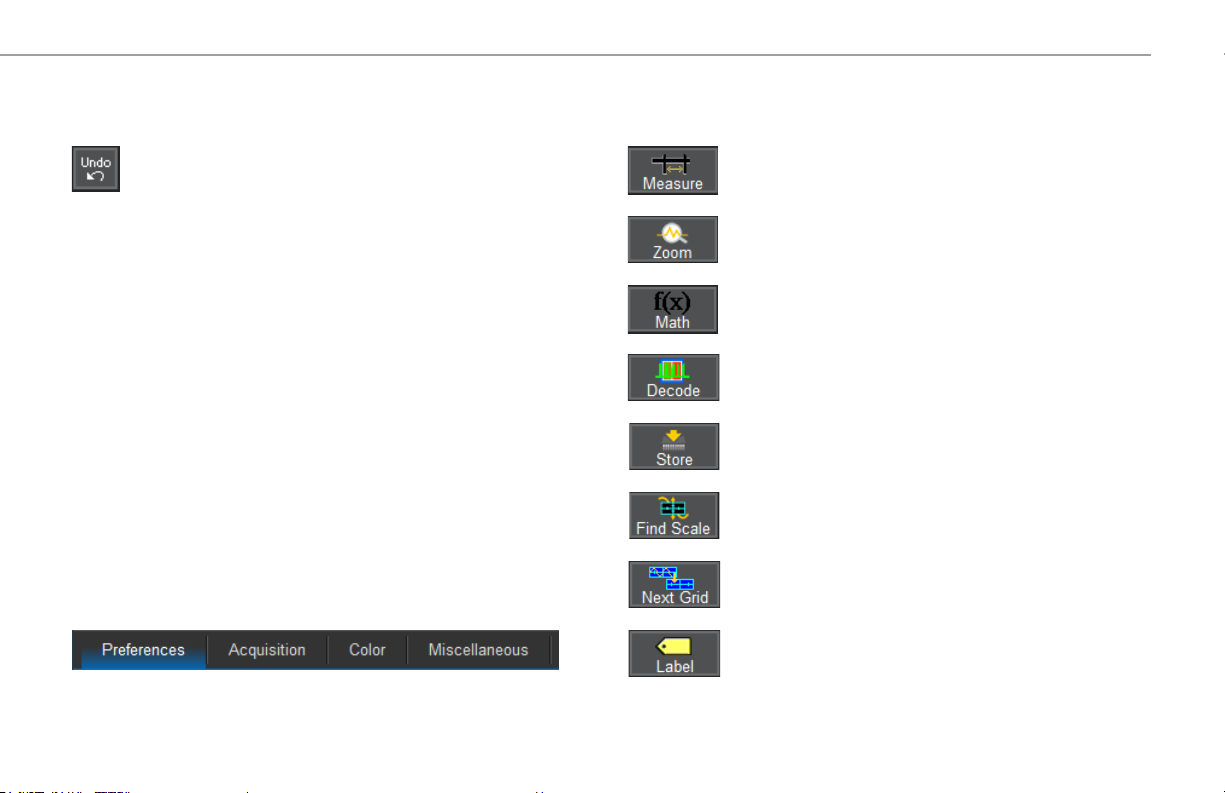
If an action can be “undone” (such as recalling a setup), a small
Undo button appears at the far right of the menu bar. Click this
to return to the previous oscilloscope display.
The grid displays the waveform traces. It can be configured to show
different grid modes.
Cursors show where measurement points have been set. Touch-and-drag
cursor indicators to quickly reposition the measurement point. Horizontal
cursor readouts appear below the Timebase and Trigger descriptors.
Trigger Level and Trigger Time indicators appear at the edge of the grid
when a trigger is set, color-coded to match the trigger channel.
Trace Descriptor boxes appear along the bottom of the grid, one for each
open trace. They adjust in size and detail as more are opened.
The Add New box sits next to the trace descriptor boxes. Use it to turn on
new traces or the Measure table. See "MAUI with OneTouch" on p.15.
Timebase and Trigger descriptor boxes appear at the right of the display.
Timebase and Trigger settings only apply to channel traces. Touch the
descriptor box to open the corresponding set up dialog.
Dialogs appear at the bottom of the display for entering set up data. The
top dialog will be the main entry point for the selected function. Related
dialogs appear as a series of tabs behind the main dialog.
A toolbar along the bottom of the main Channel, Math, Memory and
Digital dialogs initiates frequent actions without closing the underlying
dialog. The actions always apply to the active (highlighted) trace.
Apply measurement parameters.
Display a zoom of the trace.
Apply a math function to the trace.
Open the Serial Decode dialog
(if decoder options installed; else disabled).
Copy the active trace to the corresponding
internal memory (e.g., C2 to M2).
Scale the waveform to fit the grid.
Move the active trace to the next grid.
Apply a custom label to the trace.
HDO9000 Getting Started Guide
11
Page 14
BASICS
Changing the Display
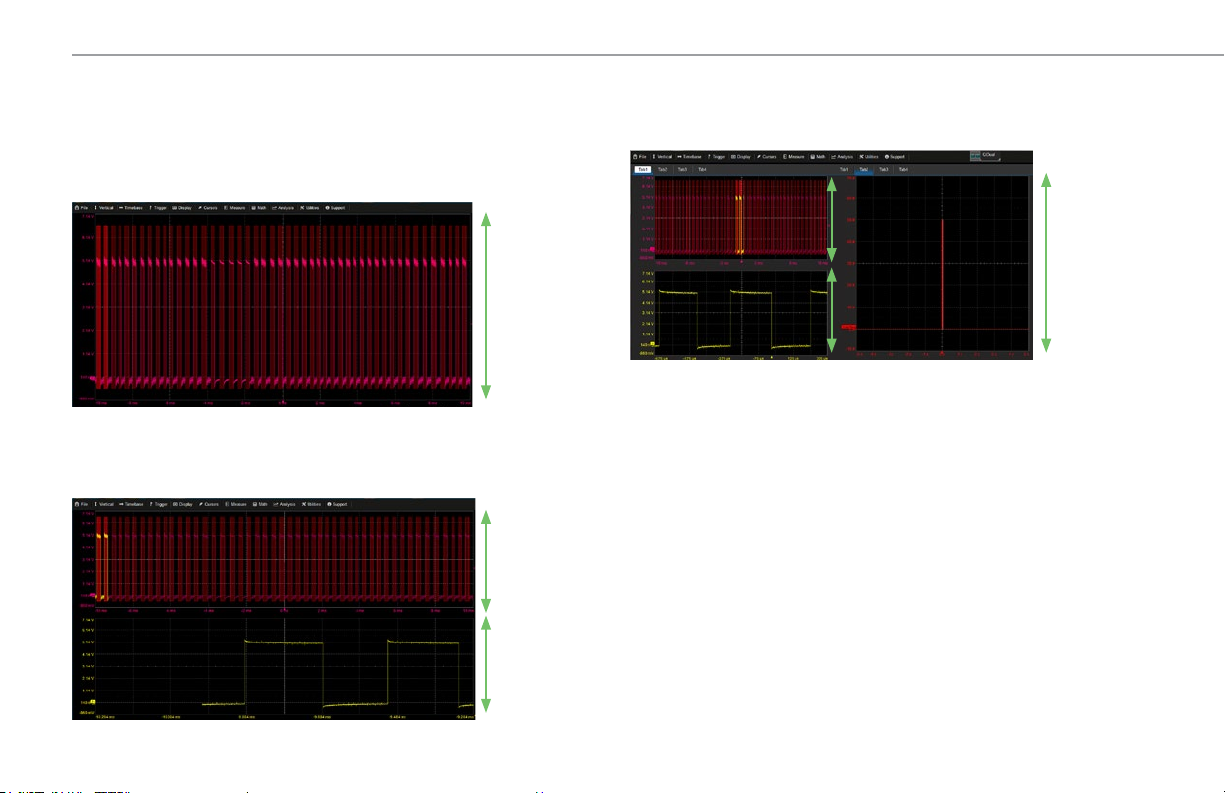
The grid is 8 Vertical divisions representing the full number of Vertical
levels (at current resolution) and 10 Horizontal time divisions. The value
represented by each division depends on the scale settings of the traces
that appear on it.
8 Vertical
Divisions
Full
Vertical
Levels
Multi-Grid Display
The grid can be divided into multiple grids each representing the full
number of Vertical levels. A variety of multi-grid modes are available.
Full
Vertical
Levels
Full
Vertical
Levels
Q-Scape Multi-Tab Display
If you have installed the Q-Scape option, the grid area can be divided into
multiple tabs. Each tab can show a single grid or a multi-grid mode.
8 Vertical
Divisions
Full
Vertical
Levels
Display Mode vs. Grid Mode
The Display Mode determines whether the touch screen has a single display
or tabs each representing a separate display. The Grid Mode allows selection
of a particular grid style in each display.
By default, the oscilloscope is in Normal Display Mode (a single display with
no tabs) with the Auto Grid Mode enabled. Auto adds a grid for each new
trace, up to 16 grids, until no more grids are available. Other grid modes
create a fixed number and orientation of grids; the icon shows the result.
The various Q-Scape Display Modes divide the screen into tabbed displays.
Many of the same grid functions you can perform in Normal mode, such as
moving traces to other grids, you can also perform in the Q-Scape modes.
To modify the touch screen display, choose Display > Display Setup from the
menu bar and make your selections from the Display dialog.
12
930536-00 Rev A
Page 15

BASICS
Extended Display
If you have a second monitor connected, you can extend the display of
traces across both the oscilloscope screen and the external monitor. Select
Extend Grids on 2nd Monitor from the Display dialog, then choose a grid
mode from the Extended Display pop-up menu. Both screens will share this
grid mode. Drag-and-drop descriptor boxes to move traces between displays.
Note: When a Q-Scape Display Mode is extended, only Tab 1 is moved to
the second display.
Oscilloscope with an extended display.
Line and Intensity
The trace style can be set to a series of separate
sample Points or a continuous vector Line.
Grid Intensity makes the grid lines dimmer or
brighter relative to the trace.
When more data is available than can actually be
displayed, Trace Intensity helps to visualize significant events by applying
an algorithm that dims less frequently occurring samples. The front panel
Intensity button sets the Adjust knob to control the trace intensity setting.
Trace with Intensity 100%
Trace with Intensity 40%.
HDO9000 Getting Started Guide
13
Page 16

BASICS
Working With Traces
Trace Descriptor Boxes
Channel (C1-C4), Zoom (Z1-Z12), Math (F1-F12), Memory (M1-M12) and
Digital (Digital1-Digital4) descriptor boxes appear along the bottom of
the grid area when a trace is turned on. Descriptor boxes summarize,
activate, arrange and configure the traces they represent.
Trace Context Menu
The trace context menu is a quick way to apply math, measurements or
labels to traces. To open the context menu, right-click with your mouse or
touch-and-hold on the trace descriptor box until a white circle appears,
then release.
Active vs. Inactive Trace
Although several traces may be open and appear on the display, only one at
a time is active. This is true for all traces, regardless of the type. All actions
apply to the active trace until another is selected.
Touch a trace or its descriptor box to activate it and bring it to the foreground.
When the descriptor box appears highlighted in blue, front panel controls and
touch screen gestures apply to that trace.
Inactive. Controls will not
work for this trace.
Active. Controls will work
for this trace.
Adjusting Setups
On setup dialogs, many entries can be made by selecting from the pop-up
menu that appears when you touch a control.
On some pop-up menus, you can choose to display
options as a list or as icons.
When an entry field appears highlighted in blue after
touching, it is active and the value can be modified by
turning the front panel knobs. Fields that don’t have
a dedicated knob (as do Vertical Offset or Horizontal
Delay) can be modified using the Adjust knob.
If you have a keyboard installed, you can type
entries in an active (highlighted) data entry
field. Or, you can touch again, then “type” the
entry by touching keys on the virtual keypad
or keyboard.
To use the virtual keypad, touch the soft keys
exactly as you would a calculator. When you
touch OK, the calculated value is entered in
the field.
14
930536-00 Rev A
Page 17

BASICS
MAUI with OneTouch
Touch, drag, swipe, pinch and flick can be used to create and change setups with one touch. Just as you change the display by using the setup dialogs,
you can change the setups by moving different display objects. Use the setup dialogs to refine OneTouch gestures to precise values.
As you drag & drop, valid targets are outlined with a white box. When you’re moving over invalid targets, you’ll see the “Null” symbol ( Ø ) under your
finger tip or cursor.
Turn On
To turn on a new channel, math, memory, or zoom trace, drag any
descriptor box of the same type to the Add New (“+”) box. The next trace
in the series will be added to the display at the default settings. It is now
the active trace.
If there is no descriptor box of the desired type on the screen to drag,
touch the Add New box and choose the trace type from the pop-up menu.
To turn on the Measure table when it is closed, touch the Add New box
and choose Measurement.
HDO9000 Getting Started Guide
15
Page 18

BASICS
Copy Setups
To copy the setup of one trace to another of the same type (e.g., channel to
channel, math to math), drag-and-drop the source descriptor box onto the
target descriptor box.
To copy the setup of a measurement (Pn), drag-and-drop the source
column onto the target column of the Measure table. You can do the same
for a query (Qn) on the Pass/Fail readout table.
Change Source
To change the source of a trace, drag-and-drop the descriptor box of the
desired source onto the target descriptor box. You can also drop it on the
Source field of the target setup dialog.
To change the source of a measurement, drag-and-drop the descriptor box of
the desired source onto the parameter (Pn) column of the Measure table. You
can do the same to a query (Qn) on the Pass/Fail readout table.
16
930536-00 Rev A
Page 19

BASICS
Position Cursors
To change cursor measurement time/level, drag cursor markers to new
positions on the grid. The cursor readout will update immediately.
To place horizontal cursors on zooms or other calculated traces where the
Horizontal Scale has forced cursors off the grid, drag the cursor readout
from below the Timebase descriptor to the grid where you wish to place the
cursors. The cursors are set at either the 5 (center) or 2.5 and 7.5 divisions of
the grid. Cursors on the source traces adjust position accordingly.
Change Trigger
To change the trigger level, drag the Trigger Level indicator to a new position
on the Y axis. The Trigger descriptor box will show the new voltage Level.
To change the trigger source channel, drag-and-drop the desired channel (Cn)
descriptor box onto the Trigger descriptor box. The trigger will revert to the
last trigger set on that channel.
HDO9000 Getting Started Guide
17
Page 20

BASICS
Store to Memory
To store a trace to internal memory, drag-and-drop its trace descriptor box
onto the target memory (Mn) descriptor box.
Move Trace
To move a trace to a different grid, drag-and-drop the trace descriptor box
onto the target grid.
Scroll
To scroll long lists of values or readout tables, swipe the selection dialog or
table in an up or down direction.
Pan
To pan a trace, activate it to bring it to the forefront, then drag the waveform
trace right/left or up/down. If it is the source of any other trace, that trace will
move, as well.
To pan at an accelerated rate, swipe the trace right/left or up/down.
18
930536-00 Rev A
Page 21

BASICS
Zoom
To create a new zoom trace, touch then drag
diagonally to draw a selection box around the
portion of the trace you want to zoom. Touch
the Zn descriptor box to open the zoom factor
controls and adjust the zoom exactly.
To "zoom in" on any trace,
unpinch two fingers over the
trace horizontally.
To "zoom out" on any trace,
pinch two fingers over the
trace horizontally.
Turn Off
To turn off a trace, flick the trace descriptor box toward the bottom of
the screen.
HDO9000 Getting Started Guide
19
Page 22

BASICS
Vertical (Channel)
Vertical controls adjust traces along the Y axis. Traces represent eight Vertical divisions of the source signal at the selected number of units per division. The
zero level is at the center grid line unless you add positive or negative Offset. The front panel Volts knob also controls the Vertical Scale of zoom, math and
memory traces.
Channel Descriptor BoxFrom the Front Panel
Pre-Processing Summary List
Turn on/activate
channel trace
and open set up
dialog.
Raise/lower
Offset from zero.
Push to return to
zero Offset.
Coupling
Gain Setting
Offset Setting
# Sweeps Averaged / Segment #
20
930536-00 Rev A
Raise/lower
Volts/div.
Push to toggle
between coarse
and fine scale
adjustments.
Vertical Cursor Positions
Page 23

From the Touch Screen
Drop a channel descriptor on the Add New box, or touch the Add New box
and choose Channel. Touch new Cn descriptor to open the Cn setup dialog.
BASICS
Enter Attenuation for passive
and other vendors' probes.
Enter Volts/div and Offset. Rescale channel
Enter Coupling
for cables/probes.
Apply optional
Bandwidth Filters.
trace, or change
Vertical Unit of grid.
Make any other
Pre-Processing settings.
HDO9000 Getting Started Guide
21
Page 24

BASICS
Digital
On Mixed Signal models, digital selections are added to the Vertical menu, and the front panel Vertical knobs control active Digital line and bus traces.
From the Front Panel
Turn on/activate
digital traces.
930536-00 Rev A
22
Turn Offset to
raise/lower group
Vertical Position,
the top of lowest bit
relative to center.
Turn Volts to raise/
lower Group Height,
the total Vertical
divisions occupied
by group.
Digital Descriptor Box
# Digital Lines in Group
Digital Sample Rate
Digital Memory
Digital Displays
Line trace shows high, low and transition points for each line.
Bus trace collapses lines into hex values.
Activity indicators show when line is high, low, or transitioning.
Page 25

BASICS
From the Touch Screen
From the menu bar, choose
Vertical>Digital n Setup. Touch
Digitaln descriptor to open the
Digitaln setup dialog.
Choose Display
Mode of individual
lines, bus trace,
or both.
Optionally, choose
a new Label for
the lines. Select
Custom to enter
unique names.
Display buttons
switch lead banks
as you select lines.
Line Activity
indicators show
the state of each
line: high, low, or
transitioning.
On the Logic Setup tab, choose a
standard Logic Family, or enter a
custom Threshold and Hysteresis.
Separate controls allow you to set
different values for each lead bank.
Use checkboxes
to select lines in
the group.
Optionally, enter
a custom line
name in the field
beneath.
Enter digital trace
Vertical Position
and Group Height
in divisions.
HDO9000 Getting Started Guide
23
Page 26

BASICS
BASICS
Horizontal (Timebase)
Horizontal controls adjust traces along the X axis. Analog traces usually represent one acquisition of the source signal for 10 divisions of the selected Time
per division. The trigger event is shown at the center of the grid, unless you add positive or negative Delay time. The front panel Time knob also controls the
Horizontal Scale of zoom, math and memory traces, allowing you to "zoom in" to see more detail or "zoom out" to see the bigger picture.
From the Front Panel
Raise/lower trigger Delay.
Push to remove Delay.
Raise/lower Time/div.
Push to toggle between
coarse and fine scale
adjustments.
Timebase Descriptor Box
Sampling Mode
(blank in real-time)
# Samples
Trigger Delay
(Position)
Time/div
Sample Rate
24
930536-00 Rev A
Page 27

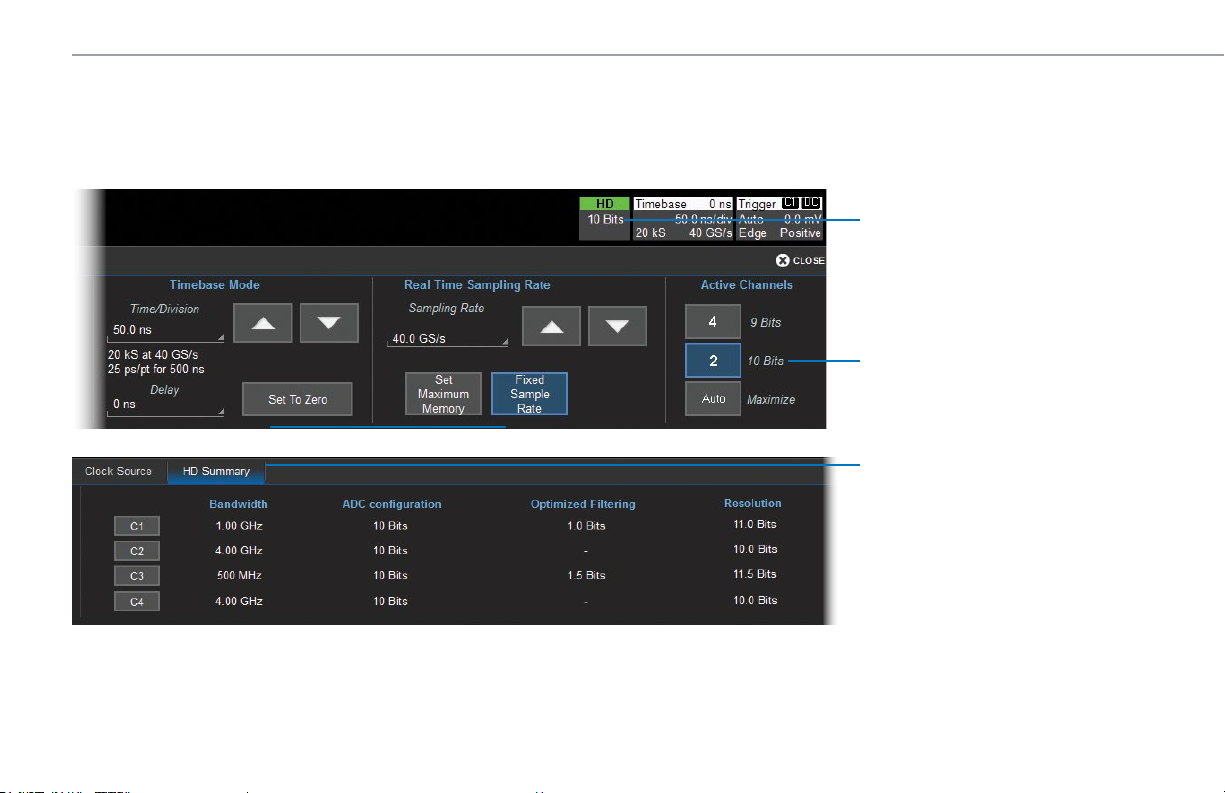
From the Touch Screen
Touch the Timebase
descriptor to open
Timebase setup dialog.
Turn on/off
HD Mode.
BASICS
Enter Time/div.
Select
Sampling
Mode.
Optionally, enter Delay,
(negative) time before trigger
or (positive) time after trigger
event to show.
Set To Zero
removes Delay.
Enter fixed Sampling
Rate or Maximum Points
of memory to use in
acquisition.
Lower number of
Active Channels to
increase sample rate
and memory.
HDO9000 Getting Started Guide
25
Page 28
BASICS
HD Mode
The HDO9000 with HD1024 high definition technology offers more quantitization levels and greater precision when digitizing waveforms. HD1024 allows for
dynamic ADC configuration based on the number of active channels and applies bandwidth filtering when the sample rate is reduced below 10 GS/s to prevent
aliasing and increase resolution. When HD1024 is off, the oscilloscope operates in continuous 8-bit resolution.
HD descriptor box shows bits of
resolution due to the ADC configuration.
It is hidden when HD Mode is Off.
When HD Mode is On, Active Channels
shows the ADC configuration options:
9-bit, 10-bit, or Maximize based on actual
active channels. (When HD Mode is Off,
it shows maximum sample rate per
channel.)
HD Summary dialog shows per channel:
Bandwidth due to combined manual
•
bandwidth filters, anti-aliasing filters,
and coupling setting
Bits resolution for which the ADC
•
Configuration is optimized due to the
Active Channels selection
Bits resolution gained due to all the
•
Optimized Filtering of bandwidth
Total Resolution (the sum of ADC
•
Configuration and Optimized Filtering)
26
930536-00 Rev A
Page 29

BASICS
Zoom
Zoom traces (Zn) display a magnified portion of another trace. Any trace can be zoomed, although Zoom is most useful for channel traces, as it allows you to
see the source at the original Timebase at the same time as the Zoom "close up."
From the Front Panel
When you use the front panel Zoom button, a new Zoom trace is created for
When Zoom button is lit, use
Horizontal Scale knob to
change zoom magnification.
Press to create Zooms of all
open traces.
From the Touch Screen
Draw a Zoom box over a
portion of the source trace.
Repeat on another section to
reposition the Zoom trace.
every open trace, showing a 10x magnification of the source trace.
The zoomed portion of the source trace is highlighted, so that the area
corresponding to the zoom is more visible.
The Zoom descriptor box
shows the Zoom Source
and Horizontal Scale, which
differs from the Timebase.
HDO9000 Getting Started Guide
27
Page 30

BASICS
Trigger
Triggers tell the oscilloscope when to perform an acquisition. The acquisition starts as soon as the trigger is armed and all trigger conditions are
met, unless postponed by a Holdoff count of time or number of trigger events. Trigger types and modes are described at more length in the HDO9000
Oscilloscopes Operator’s Manual.
From the Front Panel
Turn to
Raise/lower
trigger Volt/
Amp Level.
Push to
Find Level.
Open Trigger
setup dialog.
930536-00 Rev A
28
Trigger
armed.
Select Trigger Mode:
Auto – trigger after preset period if no valid trigger.
Normal – trigger repeatedly when all conditions met.
Single – trigger once when all conditions met.
Stop – stop acquisition.
Trigger
fired.
Trigger Descriptor Box
Trigger Source
Trigger Coupling
Trigger Mode
Trigger Type Trigger Slope
Trigger Level
Trigger Indicators
Level
Position
Pre/Post-Trigger – appears at corner of grid
when trigger point is no-longer visible.
Page 31

From the Touch Screen
Touch Trigger
descriptor to open
Trigger setup dialog.
Choose
trigger Type.
BASICS
Choose trigger
Source channel.
Set other conditions,
such as Coupling and
Slope (vary by
trigger type).
Set trigger Level,
or Find Level based
on the input signal.
Icon summarizes the
trigger selections.
HDO9000 Getting Started Guide
29
Page 32

BASICS
Cursors
Cursors set measurement points on the Vertical or Horizontal axis of a trace (or both). The five preset cursor types are described in more detail in the
HDO9000 Oscilloscopes Operator’s Manual. All show the absolute value where the cursor intersects the waveform and the delta of the two lines.
From the Front Panel
From the Touch Screen
Vertical Cursor
readout on
descriptor boxes.
Choose
Cursor Type.
930536-00 Rev A
30
Adjust cursor position.
Push to select different lines.
Apply cursor. Continue pressing
to cycle through cursor types.
Cursors > Cursor Setup
opens the Cursor dialog.
Touch-and-drag cursor to
reposition measurement
point.
Horizontal Cursor readout
below Timebase. Drag onto
zooms to reset cursors on
the rescaled traces.
Set exact Cursor Position
using dialog. Track moves
both lines together.
Page 33

BASICS
Measurements and Statistics
Measurements are waveform parameters that can be expressed as numerical values, such as amplitude or frequency. You can measure up-to-twelve
parameters on one or more traces and view the active readout in a table below the grid. Statistics can be added to the readout, along with histicons, a
miniature histogram of the statistical distribution. You can also gate measurements to limit them to a specific portion of the trace, or plot a histogram,
trend or track of the measurement over time.
Measure > Measure
Setup opens the
Measure dialog.
Touch Measure column
to re-open Measure
dialog if closed.
Measure dialog to
add/remove Satistics
and Histicons,
turn on Standard
Measurements, or
Clear Sweeps.
Pn dialogs to
configure user-defined
measurement set.
Action buttons quickly
plot Histogram, Trend or
Track of measurement.
Turn on Help Markers
to show what is being
measured on waveform.
Enter Gates (in div) to constrain
span of measurement, or just drag
gate markers from edge of grid.
Touch Pn cell to
re-open Pn setup.
HDO9000 Getting Started Guide
31
Page 34

BASICS
Math
Math creates a new trace that displays the result of applying a mathematical function (e.g., Sum, Product, FFT) to one or more source traces. Operations
can be chained by using one math function as a source for the other. The math trace always opens in a separate grid from the source and can be viewed
along side it. One important distinction between math functions and measurement parameters is that the result of math is always another waveform,
whereas the result of measurement is a number.
Math > Math
Setup or front
panel Math
button opens
Math dialog.
Units and scale
on Fn descriptor.
Math tab to
turn on/off functions.
Fn tab to set up/
change function.
Make other
settings on
the function
subdialog
(varies by
operation).
32
930536-00 Rev A
Choose Source trace(s)
to operate on and math Operator.
Use Zoom controls to
rescale math trace.
Page 35

BASICS
Memories (Reference Waveforms)
Memories are traces stored for reference that can be recalled to the display for comparison with other traces. A memory can be zoomed or measured for
better analysis of historical data. You can store up-to-twelve internal memories (M1-M12). After that, new memories will overwrite previously stored data.
To store a new memory:
Touch the Add New box and
choose Memory to turn on the
next memory trace.
Then, drag the descriptor box of
the trace you want stored onto
the new Mn descriptor box.
OR
Choose Math > Memory Setup. On the Mn tab, select the trace you want
stored in Copy From Waveform, then touch Copy Now.
Optionally, add Notes or Labels to the stored memory.
To recall a stored memory:
Press the front panel Mem(ory) button to open the Memories dialog, then
check On next to M1-M12.
Internal memories persist only until the oscilloscope is rebooted. To store
memories indefinitely, save them to a trace (.trc) file by choosing
File > Save Waveform.
The trace file can later be recalled into one of the internal memories for
viewing by choosing File > Recall Waveform. Only files saved with the .trc
extension can be recalled.
HDO9000 Getting Started Guide
33
Page 36

BASICS
Decode
The Decode front panel button opens the dialogs for conguring serial trigger and decode options. Decoders apply software algorithms to extract encoded
information from physical layer waveforms measured on your oscilloscope. Waveforms are annotated to provide fast, intuitive understanding of the
relationship between protocol and signal. Serial triggers fire upon finding complex, user-defined patterns and events in the data stream.
View decoding
on the colored
overlays.
When multiple
decoders are
running, touch the
Index cell to dropin the detailed
decoding. Touch
any cell other than
Index and Protocol
to zoom.
Generate eye
diagrams with
TDME options.
Touch data cells to
zoom that single
record of data. The
zoomed record is
highlighted in the
table and on the
decode trace.
When there is more
data than fits in
a table cell, touch
the white triangle
to pop-up the full
decoding.
34
930536-00 Rev A
Touch drop-down arrow
in header to filter column.
Select Source trace and Protocol.
Make required settings on the subdialogs.
Page 37

BASICS
WaveScan
Press the WaveScan front panel button to open the WaveScan dialogs. WaveScan Search and Find enables you to search for unusual events in a single
capture, or to scan for a particular event in many acquisitions over a long period of time. A predefined set of scan modes (similar to trigger setups) enable
a quick search for events of interest. The results are time stamped, tabulated, and can be selected for individual viewing.
Result table lists
found events.
Touch an event
to zoom it.
Choose scan
Mode (event to
find) and Source
trace to scan.
Select different views of the scan: event table
with/without time stamps, overlay or zoom.
Take action when an event is found,
such as sounding a beep.
Color overlays
mark events on the
source trace.
Zoom of selected
event.
HDO9000 Getting Started Guide
35
Page 38

BASICS
BASICS
Spectrum Analyzer
Use the Spectrum front panel button to launch Spectrum Analyzer, which lets you quickly and easily use the Fast Fourier Transform (FFT) for frequency
analysis. The controls are the same as you would find on an RF spectrum analyzer. You set the inputs and desired frequency span, and the oscilloscope
automatically generates output in units relevant to the frequency domain. A spectrogram generator displays 2D or 3D renderings of historical data.
Tabular readout
of marker
measurements.
FFT trace with
marked peaks and
frequencies.
2D or 3D
spectrogram
shows history of
spectra.
Use Peaks/
Markers dialog
to mark and
tabulate peaks, or
set measurement
markers on
frequencies.
36
930536-00 Rev A
Choose type and
source of input.
Specify frequency span
of interest.
Page 39
BASICS
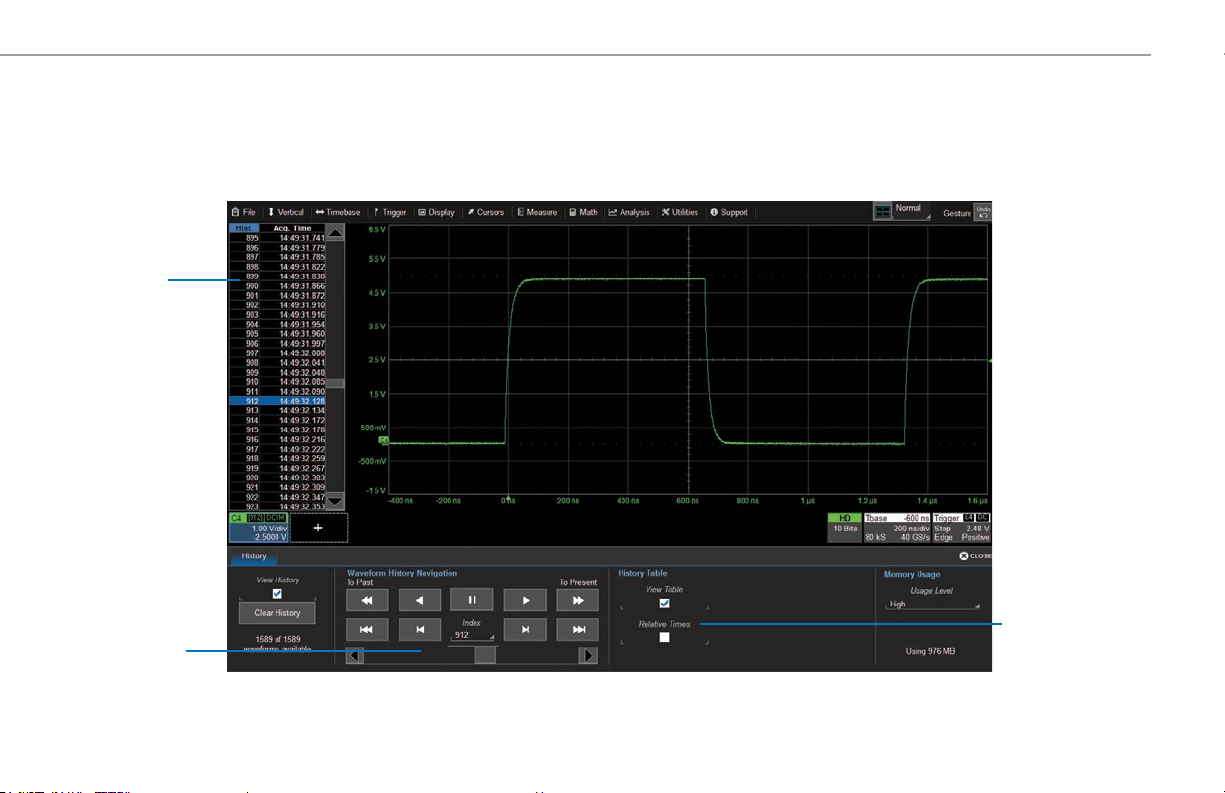
History Mode
The History front panel button puts the instrument into History Mode, allowing you to review any acquisition in the oscilloscope’s history buffer, which
automatically stores all acquisitions until full. Each record is indexed and time-stamped with either the absolute time since beginning of history or the time
relative to where you are in the history. Not only can individual acquisitions be restored to the grid, you can "replay" history at varying speeds to capture
detailed changes in the waveforms over time.
Select row of
History table
to view that
acquisition.
Auto Play buttons
and slider bar
“replay” history
to find events of
interest.
View History table
using absolute time
or relative time.
HDO9000 Getting Started Guide
37
Page 40

BASICS
Saving and Sharing Data
Use the oscilloscope File menu options to save and recall data. See the
HDO9000 Oscilloscopes Operator’s Manual for more information on using
these features.
LabNotebooks
LabNotebooks are composite files (.LNB) containing setups, waveform
data and screen image as they were at the moment of capture. Creating a
LabNotebook can be as simple as pressing the Print button as you work.
Flashback LabNotebooks to restore the oscilloscope to the exact state it
was in when the file was saved. Waveforms and tables are displayed as
they were for new analyses to be performed.
LabNotebook files can be edited, annotated and exported into a
preformatted HTML, .RTF or .PDF report. They can also be extracted into
their component setup, waveform and screen image files.
Setup, Waveform and Table Data
The current oscilloscope configuration can be saved to internal setup
panels or setup (.LSS) files and later recalled.
Waveform data can be stored to trace (.TRC) files and later recalled into
memories to restore the waveform display to the screen.
Table data can be saved to either ASCII (.TXT) or Excel (.CSV) files.
When multiple waveforms or tables are displayed, one command saves
All Displayed to separate, autonamed files.
Screen Captures
The front panel Print button captures an image of the screen, which will
then be handled according to your chosen Print method (sent to a printer,
saved to an image file, etc.). Before printing or saving the capture, use the
drawing tools to annotate the image, same as with LabNotebooks.
You can also use the touch screen File > Save Screen Image.
File Sharing
If the oscilloscope is networked, LabNotebooks, reports and other
user data files can be emailed directly from the instrument or saved to
accessible network devices.
Files can also be transferred to a USB drive through any of the host USB
ports. Stored user data files are located on the D: drive.
38
930536-00 Rev A
Page 41

Software Options
Many software options are available to extend the capabilities of a
HDO9000. To purchase an option, contact your Teledyne LeCroy sales
representative. You will receive a license key via email that activates the
optional features on the oscilloscope. To install the key on the oscilloscope:
1. From the menu bar, choose Utilities > Utilities Setup > Options.
2. Touch Add Key.
3. Enter the new license key and click OK.
4. Reboot the instrument.
Q-Scape Multi-Tabbed Display (HDO9K-QSCAPE) architecture speeds your
understanding of your design with 4x the display area. Configure each tab with
the grid style you want. Quickly drag traces to new tabs.
Advanced Customization Package (HDO9K-XDEV) supports user-defined
measurement parameters and math functions. Algorithms can be created in
your favorite programming language, such as MATLAB.
Cable De-embedding Option (HDO9K-CBL-DE-EMBED) gives you the ability to
quickly and easily remove the effect of cables by entering an attenuation table or
attenuation constants that are typically provided by the cable manufacturer.
Digital Filter Package (HDO9K-DFP2) implements a set of linear-phase
Finite Impulse Response (FIR) and IIR filters to remove undesired spectral
components such as noise.
Electromagnetic Compliance Package (HDO9K-EMC) offers specialized
measurements to test a design’s susceptibility to EM discharge.
Electric-Telecom Pulse Mask Test (HDO9K-ETPMT) performs automated
compliance mask tests on a wide range of electrical telecom standards.
MAINTENANCE
JITKIT (HDO9K-JITKIT) makes it easy to understand the basic system
jitter performance of clock signals and clock-data activities through a
wide variety of common jitter measurements.
Eye Doctor II (HDO9K-EYEDRII) provides the channel emulation and
de-embedding tools for the next generation of serial data standards. It
seamlessly integrates into Teledyne LeCroy’s SDA II and SDA III software
for eye diagram and jitter analysis. SDA II (HDO9K-SDAII) delivers
integrated jitter and timing analysis for clock and data signals to help you
characterize your design, prove compliance, and determine why a device
or host fails compliance.
DDR Debug Toolkit (HDO9K-DDR*-TOOLKIT) provides test, debug and
analysis tools for the entire DDR design cycle. The unique DDR analysis
capabilities provide automatic Read and Write burst separation, bursted
data jitter analysis, and DDR-specific measurement parameters. Available
for DDR2, DDR3, and DDR4 signal analysis.
Spectrum Analyzer (HDO9K-SPECTRUM) creates an RF Spectrum Analyzer-like
environment for analyzing frequency-dependent effects. Use the FFT on the
oscilloscope with little or no concern about the details of setting up an FFT.
Power Analysis Software (HDO9K-PWR) provides exceptional ability to
measure and analyze the operating characteristics of power conversion
devices and circuits, such as device power switching, control loop
modulation, and line power harmonics.
Serial Data Mask Package (HDO9K-SDM) adds eye pattern mask testing
capability to the instrument.
Many Serial TDME Options provide added insight when debugging serial data.
For the latest list, go to teledynelecroy.com/serialdata.
HDO9000 Getting Started Guide
39
Page 42

MAINTENANCE
Cleaning
Clean the outside of the oscilloscope using a soft cloth moistened
with water or isopropyl alcohol solution. Do not use harsh or abrasive
cleansers. Dry thoroughly before using. Do not submerge the instrument
or allow moisture to penetrate it.
CAUTION. Do not attempt to clean internal parts.
Language Selection
To change the language that appears on the oscilloscope touch screen, from
the menu bar, choose Utilities > Preference Setup > Preferences and make
your Language selection.
You can also select at power on by touching the Language icon
when it appears at the upper-right of the touch screen.
Reboot the oscilloscope after changing language.
Calibration
The oscilloscope is calibrated at the factory prior to shipment. Schedule
an annual factory calibration as part of your routine maintenance.
HDO9000 incorporates automatic calibration routines to maintain
accuracy in between factory calibrations. Go to Utilities > Preference
Setup > Calibration to select the method used:
Stored Calibration uses cached calibration files to recalibrate the
instrument at start-up. As long as the oscilloscope is used at or near
sea level within a temperature range of 19-30 °C, this calibration routine
should be sufficient to maintain specified performance. The instrument
will dynamically recalibrate if the temperature goes outside of the
stored calibration range. If you know you will be operating outside this
temperature range, do a Calibrate All to minimize recalibration.
Dynamic Calibration recalibrates the oscilloscope at start-up and every
time there is a change to any of the acquisition settings that directly
affect the performance of the ADCs. When one setup is calibrated at a
particular ambient temperature, the calibration is entered in a calibration
table and reused for the duration of the session. These calibration entries
persist only for a single session; Dynamic Calibration restarts when the
instrument is restarted or you change the principal acquisition settings.
Two manual calibration routines can be used to recalibrate immediately
before sensitive measurements or when there is a significant change of
environmental characteristics that could affect the performance of the
ADCs:
Calibrate Current State calibrates at the current vertical and horizontal
settings. This calibration takes 5 seconds but is valid for only this setup
at the current temperature ±2.5 °C.
Calibrate All calibrates all possible combinations of vertical and
horizontal settings. This calibration is valid for the current temperature
and takes about four to five hours. Perform it when the ambient
temperature is stable from the time of calibration to the time of
operation. We recommend that you run Calibrate All when:
• The instrument is operating outside the 19-30 °C range and the
operating temperature changes while outside that range. Calibrate
All is only valid for ± 2.5 °C of the last calibration temperature when
operating outside of the 19-30 °C range.
• The instrument is moved to a new operating environment.
• It has been six months since the previous manual calibration.
CAUTION. Remove all inputs from the oscilloscope prior to manual
calibration.
40
930536-00 Rev A
Page 43

MAINTENANCE
Firmware Updates
Free firmware updates are available periodically from the Teledyne LeCroy
website at teledynelecroy.com/support/softwaredownload. Registered
users will receive email notification when a new update is released.
CAUTION. Do not install any XStreamDSO software version prior to
8.6.1.x on Windows 10 oscilloscopes. Doing so will disrupt the normal
behavior of the software, unless you run the recovery procedure.To
download and install the update:
1. From the oscilloscope desktop (File > Exit) or a remote PC, launch the
browser and visit the software download page at the URL above.
2. Click the link to Oscilloscope Downloads > Firmware Upgrades.
3. Enter the required model information and account login. If you don’t
yet have an account, create one now.
4. Follow the instructions to save the installer to a location on the
oscilloscope D: drive or a USB storage device.
5. On the oscilloscope, use Windows Explorer to browse to the installer
file (xstreamdsoinstaller_x.x.x.x.exe) and double-click it to launch the
XStream Setup wizard.
6. If prompted, enter the password SCOPEADMIN, all uppercase.
7. Follow the wizard prompts.
8. When installation is complete, power cycle the instrument.
CAUTION. The installation may take several minutes, depending on
the length of time since your last update. Do not power down the
oscilloscope at any point during the installation process.
Switching Users
Windows 10 oscilloscopes only.
Windows 10 oscilloscopes are by default set to operate from the LeCroyUser
account, but you must run the oscilloscope from the Administrative User,
LCRYADMIN, in order to change Windows settings, run certain compliance
packages or use LXI remote control.
Note: To install software or change Windows settings, it is sufficient to
supply the administrative user password, SCOPEADMIN.
To switch to the LCRYADMIN account:
1. Exit the XStreamDSO application by choosing File > Exit.
2. Open the Windows Start menu
3. Hover over the Teledyne LeCroy logo and select user LCRYADMIN.
4. Enter the administrative password SCOPEADMIN (all uppercase).
5. Double-click the StartDSO icon on the oscilloscope desktop.
To return to the default user, repeat this procedure selecting LeCroyUser and
entering the password lecroyservice (all lowercase).
You may create as many new users on the oscilloscope as you wish provided
you are logged in as LCRYADMIN when doing so. Use the standard Windows
tools to add users.
Note: As long as there are any Standard (non-administrative) users, the
oscilloscope will reboot into the last active Standard user, regardless of
whether you've switched to an administrative user. The only way to change
this is to give LeCroyUser and all other users Administrator privileges.
Contact Customer Support for instructions on changing user privileges and
creating new users on the oscilloscope.
.
HDO9000 Getting Started Guide
41
Page 44

MAINTENANCE
Service
If the HDO9000 cannot be serviced on location, contact your
service center for a Return Material Authorization (RMA) code and
instructions where to ship the product. All products returned to the factory
must have an RMA.
Return shipments must be prepaid. Teledyne LeCroy cannot accept
COD or Collect shipments. We recommend air freighting. Insure the item
you’re returning for at least the replacement cost. Follow these steps for a
smooth product return.
1. Remove all accessories from the device.
2. Pack the product in its case, surrounded by the original packing
material (or equivalent). Do not include the manual.
3. Label the case with a tag containing:
• The RMA
• Name and address of the owner
• Product model and serial number
• Description of failure or requisite service.
4. Pack the product case in a cardboard shipping box with adequate
padding to avoid damage in transit.
5. Mark the outside of the box with the shipping address. Add:
• ATTN: <RMA code assigned by Teledyne LeCroy>
• FRAGILE
6. If returning a product to a different country:
• Mark the shipment “Return of US manufactured goods for warranty
repair/recalibration.“
• List any cost of service in the Value column and the original purchase
price “For insurance purposes only”.
• Be very specific about the reason for shipment. Duties may have to be
paid on the value of the service.
930536-00 Rev A
42
Service Plans
Extended warranty, calibration, and upgrade plans are available for purchase. Contact your Teledyne LeCroy sales representative or
customersupport@teledynelecroy.com to purchase a service plan.
Service Centers
For a complete list of Teledyne LeCroy offices by country, including our
sales and distribution partners, visit: teledynelecroy.com/support/contact
Teledyne LeCroy
700 Chestnut Ridge Road
Chestnut Ridge, NY, 10977, USA
teledynelecroy.com
Sales and Service:
Ph: 800-553-2769 / 845-425-2000
FAX: 845-578-5985
contact.corp@teledynelecroy.com
Support:
Ph: 800-553-2769
customersupport@teledynelecroy.com
Page 45

REFERENCE
Support
Online Documentation
Online Help is available by selecting Support > Dynamic Help from the
oscilloscope display menu bar. You can also select Support > OneTouch
Help for a demonstration of MAUI with OneTouch.
Teledyne LeCroy publishes a free Technical Library on its website at
teledynelecroy.com/support/techlib. Manuals, tutorials, application
notes, white papers, and videos are available to help you get the most out
of your Teledyne LeCroy products.
The HDO9000 Oscilloscopes Operator’s Manual can be downloaded from
teledynelecroy.com/web/hdo8000-manual. This PDF document contains
more extensive operating procedures than are found here.
The Datasheet published on the product page contains the detailed
product specifications.
Technical Support
Registered users can contact their local Teledyne LeCroy service center
to make Technical Support requests by phone or email. For a complete
list of offices, visit teledynelecroy.com/support/contact.
You can also submit Technical Support requests via the website at
teledynelecroy.com/support/techhelp.
Windows License Agreement
The XStreamDSO oscilloscope application runs on the Microsoft Windows
operating system. Teledyne LeCroy’s agreement with Microsoft prohibits
users from installing third-party software on HDO9000 oscilloscopes that
is not relevant to measuring, analyzing or documenting waveforms.
Warranty
NOTE: THE WARRANTY BELOW REPLACES ALL OTHER WARRANTIES, EXPRESSED
OR IMPLIED, INCLUDING BUT NOT LIMITED TO ANY IMPLIED WARRANTY OF
MERCHANTABILITY, FITNESS, OR ADEQUACY FOR ANY PARTICULAR PURPOSE OR
USE. TELEDYNE LECROY SHALL NOT BE LIABLE FOR ANY SPECIAL, INCIDENTAL,
OR CONSEQUENTIAL DAMAGES, WHETHER IN CONTRACT OR OTHERWISE. THE
CUSTOMER IS RESPONSIBLE FOR THE TRANSPORTATION AND INSURANCE
CHARGES FOR THE RETURN OF PRODUCTS TO THE SERVICE FACILITY.
TELEDYNE LECROY WILL RETURN ALL PRODUCTS UNDER WARRANTY WITH
TRANSPORT PREPAID.
The product is warranted for normal use and operation, within
specifications, for a period of three years from shipment. Teledyne LeCroy
will either repair or, at our option, replace any product returned to one of
our authorized service centers within this period. However, in order to do
this we must first examine the product and find that it is defective due to
workmanship or materials and not due to misuse, neglect, accident, or
abnormal conditions or operation.
Teledyne LeCroy shall not be responsible for any defect, damage,
or failure caused by any of the following: a) attempted repairs or
installations by personnel other than Teledyne LeCroy representatives; b)
improper connection to incompatible equipment; or c) for any damage
or malfunction caused by the use of non-Teledyne LeCroy supplies.
Furthermore, Teledyne LeCroy shall not be obligated to service a product
that has been modified or integrated where the modification or integration
increases the task duration or difficulty of servicing the instrument. Spare
and replacement parts, and repairs, all have a 90-day warranty.
The instrument's firmware has been thoroughly tested and is presumed
to be functional. Nevertheless, it is supplied without warranty of any kind
covering detailed performance. Products not made by Teledyne LeCroy
are covered solely by the original manufacturer's warranty.
HDO9000 Getting Started Guide
43
Page 46

REFERENCE
Certications
Teledyne LeCroy certifies compliance to the following standards as of
the time of publication. Please see the EC Declaration of Conformity
document shipped with your product for current certifications.
EMC Compliance
EC DECLARATION OF CONFORMITY - EMC
The instrument meets intent of EC Directive 2014/30/EU for Electromagnetic
Compatibility. Compliance was demonstrated to the following specifications
listed in the Official Journal of the European Communities:
EN 61326-1:2013, EN 61326-2-1:2013 EMC requirements for electrical
equipment for measurement, control, and laboratory use.
Electromagnetic Emissions:
EN 55011:2010, Radiated and Conducted Emissions Group 1, Class A
EN 61000-3-2/A2:2009 Harmonic Current Emissions, Class A
EN 61000-3-3:2008 Voltage Fluctuations and Flickers, Pst = 1
Electromagnetic Immunity:
EN 61000-4-2:2009 Electrostatic Discharge, 4 kV contact, 8 kV air, 4 kV
vertical/horizontal coupling planes
4
EN 61000-4-3/A2:2010 RF Radiated Electromagnetic Field, 3 V/m,
80-1000 MHz; 3 V/m, 1400 MHz - 2 GHz; 1 V/m, 2 GHz - 2.7 GHz
EN 61000-4-4/A1:2010 Electrical Fast Transient/Burst, 1 kV on power
supply lines, 0.5 kV on I/O signal data and control lines
EN 61000-4-5:2006 Power Line Surge, 1 kV AC Mains, L-N, L-PE, N-PE
EN 61000-4-6:2009 RF Conducted Electromagnetic Field, 3 Vrms,
0.15 MHz - 80 MHz
EN 61000-4-11:2004 Mains Dips and Interruptions, 0%/1 cycle,
70%/25 cycles, 0%/250 cycles
4 5
1
2 3
4
4
1
To ensure compliance with all applicable EMC standards, use high-quality shielded interface cables.
2
Emissions which exceed the levels required by this standard may occur when the instrument is
connected to a test object.
3
This product is intended for use in nonresidential areas only. Use in residential areas may cause
electromagnetic interference.
4
Meets Performance Criteria “B” limits of the respective standard: during the disturbance, product
undergoes a temporary degradation or loss of function or performance which is self-recoverable.
5
Performance Criteria “C” applied for 70%/25 cycle voltage dips and for 0%/250 cycle voltage
interruption test levels per EN61000-4-11.
European Contact:*
Teledyne LeCroy Europe GmbH
Im Breitspiel 11c
D-69126 Heidelberg
Germany
Tel: + 49 6221 82700
AUSTRALIA & NEW ZEALAND DECLARATION OF CONFORMITY – EMC
The instrument complies with the EMC provision of the Radio Communications
Act per the following standards, in accordance with requirements imposed by
Australian Communication and Media Authority (ACMA):
AS/NZS CISPR 11:2011 Radiated and Conducted Emissions, Group 1, Class A.
Australia / New Zealand Contacts:*
RS Components Pty Ltd. RS Components Ltd.
Suite 326 The Parade West Units 30 & 31 Warehouse World
Kent Town, South Australia 5067 761 Great South Road
Penrose, Auckland, New Zealand
* Visit teledynelecroy.com/support/contact for the latest contact information.
44
930536-00 Rev A
Page 47

REFERENCE
Safety Compliance
EC DECLARATION OF CONFORMITY – LOW VOLTAGE
The oscilloscope meets intent of EC Directive 2014/35/EU for Product
Safety. Compliance was demonstrated to the following specifications as
listed in the Official Journal of the European Communities:
EN 61010-1:2010 Safety requirements for electrical equipment for
measurement, control, and laboratory use – Part 1: General requirements
EN 61010-2:030:2010 Safety requirements for electrical equipment
for measurement, control, and laboratory use – Part 2-030: Particular
requirements for testing and measuring circuits
The design of the instrument has been verified to conform to the
following limits put forth by these standards:
Mains Supply Connector: Overvoltage Category II, instrument intended
•
to be supplied from the building wiring at utilization points (socket
outlets and similar).
Measuring Circuit Terminals: No rated measurement category.
•
Terminals not intended to be connected directly to the mains supply.
Unit: Pollution Degree 2, operating environment where normally only
•
dry, non-conductive pollution occurs. Temporary conductivity caused
by condensation should be expected.
U.S. NATIONALLY RECOGNIZED AGENCY CERTIFICATION
The oscilloscope has been certified by Underwriters Laboratories (UL) to
conform to the following safety standard and bears the UL Listing Mark:
UL 61010-1 Third Edition – Safety standard for electrical measuring and
test equipment.
CANADIAN CERTIFICATION
The oscilloscope has been certified by Underwriters Laboratories (UL) to
conform to the following safety standard and bears the cUL Listing Mark:
CAN/CSA-C22.2 No. 61010-1-12. Safety requirements for electrical
equipment for measurement, control and laboratory use.
Environmental Compliance
END-OF-LIFE HANDLING
The instrument is marked with this symbol to indicate that it
complies with the applicable European Union requirements to
Directives 2012/19/EU and 2013/56/EU on Waste Electrical and
Electronic Equipment (WEEE) and Batteries.
The instrument is subject to disposal and recycling regulations that vary
by country and region. Many countries prohibit the disposal of waste
electronic equipment in standard waste receptacles. For more information
about proper disposal and recycling of your Teledyne LeCroy product,
please visit teledynelecroy.com/recycle.
RESTRICTION OF HAZARDOUS SUBSTANCES (RoHS)
HDO9000 and its accessories conform to the 2011/65/EU RoHS2 Directive.
ISO Certification
Manufactured under an ISO 9000 Registered Quality Management System.
Intellectual Property
All patents pertaining to the HDO9000 can be found on our website at:
teledynelecroy.com/patents/
HDO9000 Getting Started Guide
45
Page 48

930536-00 Rev A
January, 2019
© 2019 Teledyne LeCroy, Inc. All rights reserved.
 Loading...