

Page 1

Toll-free Phone:
+1 800-324-5190
Phone:
+1 858-657-9800
Fax:
+1 858-657-9816
Email:
api-sales@teledyne.com
Website:
http://www.teledyne-api.com/
User Manual
Model T100
UV Fluorescence SO2 Analyzer
with NumaView™ software
© TELEDYNE API (TAPI)
9970 CARROLL CANYON ROAD
SAN DIEGO, CALIFORNIA 92131-1106
USA
Copyright 2019 083730100 DCN8060
Teledyne API 25 March 2019
Page 2

Page 3

NOTICE OF COPYRIGHT
© 2019 Teledyne API (TAPI). All rights reserved.
TRADEMARKS
All trademarks, registered trademarks, brand names or product names appearing in
this document are the property of their respective owners and are used herein for
identification purposes only.
083730100 DCN8060 Teledyne API T100 SO2 Analyzer with NumaView™ Software i
Page 4
SAFETY MESSAGES
Do Not Touch: Touching some parts of the instrument without
Important safety messages are provided throughout this manual for the purpose of
avoiding personal injury or instrument damage. Please read these messages
carefully. Each safety message is associated with a safety alert symbol and is placed
throughout this manual; the safety symbols are also located inside the instrument. It
is imperative that you pay close attention to these messages, the descriptions of
which are as follows:
WARNING: Electrical Shock Hazard
HAZARD: Strong oxidizer
GENERAL WARNING/CAUTION: Read the accompanying message
for specific information.
CAUTION: Hot Surface Warning
protection or proper tools could result in damage to the part(s)
and/or the instrument.
Technician Symbol: All operations marked with this symbol are to be
performed by qualified maintenance personnel only.
Electrical Ground: This symbol inside the instrument marks the
central safety grounding point for the instrument.
CAUTION
This instrument should only be used for the purpose and in the
manner described in this manual. If you use this instrument in a
manner other than that for which it was intended, unpredictable
behavior could ensue with possible hazardous consequences.
NEVER use any gas analyzer to sample combustible gas(es)!
For Technical Assistance regarding the use and maintenance of this instrument or
any other Teledyne API product, contact Teledyne API’s Technical Support
Department:
Telephone: 800-324-5190
Email: api-techsupport@teledyne.com
or access any of the service options on our website at http://www.teledyne-api.com/
ii Teledyne API T100 Analyzer with NumaView™ Software 083730100 DCN8060
Page 5
CONSIGNES DE SÉCURITÉ
AVERTISSEMENT GÉNÉRAL / MISE EN GARDE : Lire la
Ne pas toucher : Toucher à certaines parties de l’instrument
Pictogramme « technicien » : Toutes les opérations portant ce
Mise à la terre : Ce symbole à l’intérieur de l’instrument
Des consignes de sécurité importantes sont fournies tout au long du présent manuel
dans le but d’éviter des blessures corporelles ou d’endommager les instruments.
Veuillez lire attentivement ces consignes. Chaque consigne de sécurité est
représentée par un pictogramme d’alerte de sécurité; ces pictogrammes se retrouvent
dans ce manuel et à l’intérieur des instruments. Les symboles correspondent aux
consignes suivantes :
AVERTISSEMENT : Risque de choc électrique
DANGER : Oxydant puissant
consigne complémentaire pour des renseignements
spécifiques
MISE EN GARDE : Surface chaude
sans protection ou sans les outils appropriés pourrait entraîner
des dommages aux pièces ou à l’instrument.
symbole doivent être effectuées uniquement par du personnel
de maintenance qualifié.
détermine le point central de la mise à la terre sécuritaire de
l’instrument.
MISE EN GARDE
Cet instrument doit être utilisé aux fins décrites et de la
manière décrite dans ce manuel. Si vous utilisez cet instrument
d’une autre manière que celle pour laquelle il a été prévu,
l’instrument pourrait se comporter de façon imprévisible et
entraîner des conséquences dangereuses.
NE JAMAIS utiliser un analyseur de gaz pour échantillonner
083730100 DCN8060 Teledyne API T100 SO2 Analyzer with NumaView™ Software iii
des gaz combustibles!
Page 6
WARRANTY
Failure to comply with proper anti
handling and packing instructions and Return Merchandise
Authorization (RMA) procedures when returning parts for repair or
calibration may void your warranty. For anti
packi
ESD, PN 04786, in its
API’s Customer Service”
from our website at
can also be found on our website
WARRANTY POLICY (02024J)
Teledyne API (TAPI), a business unit of Teledyne Instruments, Inc., provides that:
Prior to shipment, TAPI equipment is thoroughly inspected and tested. Should
equipment failure occur, TAPI assures its customers that prompt service and support
will be available. (For the instrument-specific warranty period, please refer to the
“Limited Warranty” section in the Terms and Conditions of Sale on our website at
the following link: http://www.teledyne-api.com/terms_and_conditions.asp).
COVERAGE
After the warranty period and throughout the equipment lifetime, TAPI stands ready
to provide on-site or in-plant service at reasonable rates similar to those of other
manufacturers in the industry. All maintenance and the first level of field
troubleshooting are to be performed by the customer.
NON-TAPI MANUFACTURED EQUIPMENT
Equipment provided but not manufactured by TAPI is warranted and will be
repaired to the extent and according to the current terms and conditions of the
respective equipment manufacturer’s warranty.
PRODUCT RETURN
All units or components returned to Teledyne API should be properly packed for
handling and returned freight prepaid to the nearest designated Service Center. After
the repair, the equipment will be returned, freight prepaid.
The complete Terms and Conditions of Sale can be reviewed at
http://www.teledyne-api.com/terms_and_conditions.asp
CAUTION – Avoid Warranty Invalidation
iv Teledyne API T100 Analyzer with NumaView™ Software 083730100 DCN8060
ng instructions please refer to the manual, Fundamentals of
http://www.teledyne-api.com. RMA procedures
-Electro-Static Discharge (ESD)
-ESD handling and
“Packing Components for Return to Teledyne
section. The manual can be downloaded
.
Page 7

ABOUT THIS MANUAL
Support manuals, such as Fundamentals of Electro-Static Discharge (ESD), PN
04786, and NumaView™ Remote, PN 04892, are available on the TAPI website
http://www.teledyne-api.com. The NumaView™ Software Addendum to T-Series
Analyzer Manuals also may be helpful.
Note
CONVENTIONS USED
In addition to the safety symbols as presented in the Safety Messages page, this
manual provides special notices related to the careful and effective use of the
instrument and related, pertinent information.
ATTENTION
Important
Note
We recommend that all users read this manual in its entirety
before operating the instrument.
COULD DAMAGE INSTRUMENT AND VOID WARRANTY
This special notice provides information to avoid damage
to your instrument and possibly invalidate the warranty.
IMPACT ON READINGS OR DATA
Provides information about that which could either affect
accuracy of instrument readings or cause loss of data.
Provides information pertinent to the proper care,
operation or maintenance of the instrument or its parts.
083730100 DCN8060 Teledyne API T100 SO2 Analyzer with NumaView™ Software v
Page 8

TABLE OF CONTENTS
Safety Messages ...................................................................................................................................... ii
Warranty .................................................................................................................................................. iv
Table of Contents .................................................................................................................................... vi
List of Figures ........................................................................................................................................... x
List of Tables ........................................................................................................................................... xii
1. INTRODUCTION, SPECIFICATIONS, APPROVALS, & COMPLIANCE ............................................... 14
Specifications .................................................................................................................................. 15
EPA Designation ............................................................................................................................. 16
Safety .............................................................................................................................................. 17
EMC ................................................................................................................................................ 17
Other Certifications ......................................................................................................................... 17
2. GETTING STARTED .............................................................................................................................. 18
Unpacking ....................................................................................................................................... 18
Ventilation Clearance ........................................................................................................... 19
Instrument Layout ........................................................................................................................... 20
Front Panel ........................................................................................................................... 20
Rear Panel ........................................................................................................................... 21
Internal Chassis ................................................................................................................... 23
Connections and Startup ................................................................................................................. 24
Electrical Connections ......................................................................................................... 24
Connecting Power ................................................................................................. 24
Connecting Analog Inputs (Option) ....................................................................... 25
Connecting Analog Outputs ................................................................................... 26
Current Loop Analog Outputs (Option 41) Setup .................................................. 27
Connecting the Status Outputs (Digital Outputs) .................................................. 28
Connecting the Control Inputs (Digital Inputs) ....................................................... 29
Concentration Alarm Relay (Option 61) ................................................................ 30
Connecting Communications Interfaces ................................................................ 30
Pneumatic Connections ....................................................................................................... 36
Critical Tubing, Pressure, Venting and Exhaust Requirements ............................ 37
Basic Connections from Calibrator ........................................................................ 38
Connections w/Ambient Zero/Ambient Span (Z/S) Valves (OPT 50A) ................. 39
Connections w/Ambient Zero/Pressurized Span Valves (OPT 50E)..................... 41
Zero Scrubber and Internal Span Source (IZS) (OPT 50G) .................................. 43
Pneumatic Flow Diagrams ................................................................................................... 46
Pneumatic Flow for Basic Configuration ............................................................... 46
Pneumatic Flow for Zero/Span Valves Option ...................................................... 47
Pneumatic Flow for Ambient Zero/Pressurized Span Option ................................ 48
Pneumatic Flow for Internal Zero/Span (IZS) Gas Generator Option ................... 49
Pneumatic Flow with O2 Sensor Option ................................................................ 50
Startup, Functional Checks and Calibration ........................................................................ 50
Startup ................................................................................................................... 51
Alerts: Warnings and Other Messages .................................................................. 52
Functional Checks ................................................................................................. 53
Calibration.............................................................................................................. 53
Menu Overview ............................................................................................................................... 54
Home Page .......................................................................................................................... 55
Dashboard ............................................................................................................................ 57
Alerts .................................................................................................................................... 58
Calibration ............................................................................................................................ 59
Utilities .................................................................................................................................. 60
vi Teledyne API T100 Analyzer with NumaView™ Software 083730100 DCN8060
Page 9
Setup .................................................................................................................................... 60
Setup Menu: Features/Functions Configuration ............................................................................ 61
Setup>Data Logging (Data Acquisition System, DAS) ........................................................ 61
Configuring Trigger Types: Periodic ...................................................................... 63
Configuring Trigger Types: Conditional ................................................................ 64
Downloading DAS (Data Acquisition System) Data .............................................. 64
Setup>Events ....................................................................................................................... 65
Editing or Deleting Events ..................................................................................... 66
Using Events as Triggers for Data Logging ........................................................... 67
Setup>Dashboard ................................................................................................................ 67
Setup>AutoCal (with Valve Option) ..................................................................................... 68
Setup>Vars .......................................................................................................................... 68
Setup>Homescreen ............................................................................................................. 69
Setup>Digital Outputs .......................................................................................................... 70
Setup>Analog Outputs ......................................................................................................... 71
Manual Calibration of Voltage Range Analog Outputs .......................................... 73
Manual Adjustment of Current Range Analog Outputs ......................................... 74
Setup>Instrument ................................................................................................................. 75
Setup>Comm (Communications) ....................................................................................... 76
COM1/COM2 ....................................................................................................... 76
TCP Port1 ............................................................................................................ 77
TCP Port2 ............................................................................................................ 77
TCP Port3 ............................................................................................................ 77
Network Settings ................................................................................................. 77
Transferring Configuration to Other Instruments ............................................................................ 78
3. COMMUNICATIONS AND REMOTE OPERATION ............................................................................... 80
Data Terminal/Communication Equipment (DTE DCE) .................................................................. 80
Modes, Baud Rate and Serial Communication ............................................................................... 80
Serial Communication: RS-232 ............................................................................................ 81
Serial Communication: RS-485 (Option) ............................................................................. 81
Ethernet ........................................................................................................................................... 81
Communications Protocols ............................................................................................................. 82
MODBUS ............................................................................................................................. 82
MODBUS Com Port Configuration ........................................................................ 82
Hessen ................................................................................................................................. 84
Hessen Com Port Configuration ............................................................................ 84
Hessen Settings Configuration .............................................................................. 85
Hessen Gas List Configuration .............................................................................. 87
4. CALIBRATION ........................................................................................................................................ 88
Important Precalibration Information ............................................................................................. 88
Calibration Requirements .................................................................................................... 88
Zero Air ................................................................................................................................ 89
Calibration (Span) Gas ........................................................................................................ 89
Span Gas for Multipoint Calibration ..................................................................................... 90
Physical Range Measurements ........................................................................................... 90
Interferents ........................................................................................................................... 91
Permeation Tube Options .................................................................................................... 91
Data Recording Devices ...................................................................................................... 91
Calibration Procedures .................................................................................................................... 92
Calibration and Check Procedures for Basic Configuration ................................................ 92
Zero Calibration Check and Actual Calibration ..................................................... 94
Span Calibration Check and Actual Calibration .................................................... 94
Calibration and Check Procedures with Valve Options Installed ......................................... 95
Use of Zero/Span Valve with Remote Contact Closure ........................................ 96
083730100 DCN8060 Teledyne API T100 SO2 Analyzer with NumaView™ Software vii
Page 10
Automatic Zero/Span Cal/Check (Auto Cal) ................................................................................... 97
Calibration Quality Analysis ............................................................................................................ 99
EPA Protocol Calibration ............................................................................................................... 100
5. MAINTENANCE AND SERVICE .......................................................................................................... 101
Maintenance Schedule .................................................................................................................. 101
Predictive Diagnostics ................................................................................................................... 103
Operational Health Checks ........................................................................................................... 104
Software/Firmware Updates .......................................................................................................... 104
Remote Updates ................................................................................................................ 105
Manual Reload/Update Procedures ................................................................................... 105
Touchscreen Display Calibration (for earlier instruments) ................................................. 106
Time Zone Changes ...................................................................................................................... 107
Hardware Maintenance Procedures ............................................................................................. 108
Replacing the Sample Particulate Filter ............................................................................. 108
Changing/Removing the IZS Permeation Tube ................................................................. 109
Changing the External Zero Air Scrubber .......................................................................... 110
Servicing Critical Flow Orifices .......................................................................................... 111
Checking for Light Leaks ................................................................................................... 113
Checking for Pneumatic Leaks .......................................................................................... 114
Simple Vacuum Leak and Pump Check .............................................................. 114
Detailed Pressure Leak Check ............................................................................ 114
Performing Flow Checks/Calibrations ................................................................. 115
Checking the Hydrocarbon Scrubber (Kicker) ................................................................... 116
Checking the Scrubber for Leaks ........................................................................ 116
Service and Troubleshooting ........................................................................................................ 118
Fault Diagnosis with Alerts ................................................................................................. 119
Fault Diagnosis With Dashboard Functions ....................................................................... 122
Using the Diagnostic Signal I/O Functions ........................................................................ 124
Using the Internal Electronic Status LEDs ......................................................................... 124
CPU Status Indicator ........................................................................................... 124
Relay PCA Watchdog and Status LEDs .............................................................. 125
Flow Problems ................................................................................................................... 126
Sample Flow is Zero or Low ................................................................................ 127
High Flow ............................................................................................................. 128
Sample Flow is Zero or Low but Analyzer Reports Correct Flow ........................ 128
Calibration Problems .......................................................................................................... 129
Negative Concentrations ..................................................................................... 129
No Response ....................................................................................................... 129
Unstable Zero and Span ...................................................................................... 130
Inability to Span - Deactivated SPAN Button ...................................................... 130
Inability to Zero - Deactivated ZERO Button ....................................................... 130
Non-Linear Response .......................................................................................... 131
Discrepancy Between Analog Output and Display .............................................. 131
Other Performance Problems ............................................................................................ 131
Excessive Noise .................................................................................................. 132
Slow Response .................................................................................................... 132
Subsystem Check for Troubleshooting .............................................................................. 132
AC Main Power .................................................................................................... 133
DC Power Supply ................................................................................................ 134
I2C Bus ................................................................................................................. 135
LCD/Display Module ............................................................................................ 135
Relay PCA ........................................................................................................... 135
Motherboard ........................................................................................................ 136
Pneumatic Pressure / Flow Sensor Assembly .................................................... 137
viii Teledyne API T100 Analyzer with NumaView™ Software 083730100 DCN8060
Page 11
CPU ..................................................................................................................... 138
RS-232 Communications ..................................................................................... 138
Photomultiplier Tube (PMT) Sensor Module ..................................................... 140
PMT Temperature Control PCA ........................................................................ 141
Internal Span Gas (IZS) Generator and Valve Options ..................................... 142
Temperature Sensors ........................................................................................ 143
Service Procedures ............................................................................................................ 144
Disk-On-Module Replacement Procedure ........................................................... 144
Sensor Module Repair and Cleaning .................................................................. 145
PMT Sensor Hardware Calibration (“Factory Cal”) ............................................ 158
Removing / Replacing the Relay PCA from the Instrument ................................ 160
Frequently Asked Questions ......................................................................................................... 161
Technical Assistance .................................................................................................................... 162
6. PRINCIPLES OF OPERATION ............................................................................................................ 163
Sulfur Dioxide (SO2) Sensor Principles of operation ..................................................................... 163
SO2 Ultraviolet Fluorescence Measurement Principle ....................................................... 163
The UV Light Path .............................................................................................................. 166
UV Source Lamp ................................................................................................................ 167
The Reference Detector ..................................................................................................... 168
The PMT ............................................................................................................................ 168
UV Lamp Shutter & PMT Offset ......................................................................................... 168
Optical Filters ..................................................................................................................... 169
UV Source Optical Filter ...................................................................................... 169
PMT Optical Filter ................................................................................................ 170
Optical Lenses ................................................................................................................... 171
Measurement Interferences ............................................................................................... 172
Direct Interference ............................................................................................... 172
UV Absorption by Ozone ..................................................................................... 172
Dilution ................................................................................................................. 172
Third Body Quenching ......................................................................................... 172
Light Pollution ...................................................................................................... 173
Oxygen (O2) Sensor Principles of Operation ................................................................................ 173
Paramagnetic Measurement of O2 ..................................................................................... 173
O2 Sensor Operation within the T100 Analyzer ................................................................. 174
Carbon Dioxide (CO2) Sensor Principles of Operation ................................................................. 175
NDIR Measurement of CO2................................................................................................ 175
CO2 Operation within the T100 Analyzer ........................................................................... 176
Electronic Operation of the CO2 Sensor ............................................................................ 176
Pneumatic Operation .................................................................................................................... 177
Sample Gas Flow ............................................................................................................... 177
Flow Rate Control .............................................................................................................. 178
Critical Flow Orifice .............................................................................................. 178
Sample Particulate Filter ..................................................................................... 179
Hydrocarbon Scrubber (Kicker) ......................................................................................... 179
Pneumatic Sensors ............................................................................................................ 180
Sample Pressure Sensor ..................................................................................... 180
Sample Flow Sensor ........................................................................................... 180
Electronic Operation ...................................................................................................................... 181
Overview ............................................................................................................................ 181
CPU .................................................................................................................................... 183
Sensor Module ................................................................................................................... 183
Sample Chamber ................................................................................................. 184
Sample Chamber Heating Circuit ........................................................................ 185
Photo Multiplier Tube (PMT) .............................................................................................. 185
083730100 DCN8060 Teledyne API T100 SO2 Analyzer with NumaView™ Software ix
Page 12
PMT Cooling System ......................................................................................................... 187
Thermoelectric Cooler (TEC) ............................................................................... 187
TEC Control Board .............................................................................................. 188
PMT Preamplifier ............................................................................................................... 188
Pneumatic Sensor Board ................................................................................................... 190
Relay Board ....................................................................................................................... 190
Heater Control ..................................................................................................... 192
Heaters for IZS Option (JP6) and AC Configuration ........................................... 193
Valve Control ....................................................................................................... 194
Status LEDs and Watchdog Circuitry ................................................................. 194
Motherboard ..................................................................................................................... 194
A to D Conversion ............................................................................................. 194
Sensor Inputs .................................................................................................... 195
Thermistor Interface .......................................................................................... 195
Analog Outputs ................................................................................................................ 196
External Digital I/O ........................................................................................................... 196
I2C Data Bus .................................................................................................................... 196
Power Up Circuit .............................................................................................................. 196
Power Supply/Circuit Breaker .......................................................................................... 196
Front Panel Touchscreen/Display Interface ..................................................................... 198
LVDS Transmitter Board ................................................................................... 199
Front Panel Touchscreen/Display Interface PCA .............................................. 199
Software Operation ....................................................................................................................... 199
Adaptive Filter .................................................................................................................... 200
Calibration - Slope and Offset ............................................................................................ 200
Temperature/Pressure Compensation (TPC) .................................................................... 201
Internal Data Acquisition System (DAS) ............................................................................ 201
Glossary ............................................................................................................................................... 202
LIST OF FIGURES
Figure 2-1. Front Panel Layout ................................................................................................................... 20
Figure 2-2. Rear Panel Layout, Base Unit (options include additional pneumatic ports) ........................... 21
Figure 2-3. Internal Chassis Layout, Basic (no valve or second gas option) .............................................. 23
Figure 2-4. Analog In Connector ................................................................................................................. 25
Figure 2-5. Analog Output Connector ......................................................................................................... 26
Figure 2-6. Current Loop Option Installed on the Motherboard .................................................................. 27
Figure 2-7. Status Output Connector for Digital Outputs ............................................................................ 28
Figure 2-8. Energizing the Control Inputs ................................................................................................... 29
Figure 2-9. Concentration Alarm Relay ....................................................................................................... 30
Figure 2-10. Rear Panel Connector Pin-Outs for RS-232 Mode ................................................................ 31
Figure 2-11. Default Pin Assignments for CPU COM Port Connector (RS-232) ........................................ 32
Figure 2-12. Jumper and Cables for Multidrop Mode ................................................................................. 34
Figure 2-13. RS-232 Multidrop PCA Option Host/Analyzer Interconnect Diagram .................................... 35
Figure 2-14. Gas Line Connections from Gas Dilution Calibrator – Basic Configuration ........................... 38
Figure 2-15. Gas Line Connections from Bottled Span Gas – Basic Configuration ................................... 38
Figure 2-16. Rear Panel Layout with Z/S Valve Options (OPT 50A) .......................................................... 39
Figure 2-17. Gas Line Connections with Z/S Valves Option (OPT 50A) .................................................... 40
Figure 2-18. Rear Panel Layout with Ambient Zero/Pressurized Span Valves (OPT 50E) ........................ 41
Figure 2-19. Gas Line Connection w/Ambient Zero/Pressurized Span Valves Option (OPT 50E) ............ 42
Figure 2-20. Rear Panel Layout with Internal Span Source (IZS) OPT 50G .............................................. 43
Figure 2-21. Gas Line Connection w/Zero Scrubber and Internal Span Source (IZS) Option (OPT 50G) . 44
Figure 2-22. Pneumatic Connections for Precision Calibration when IZS Generator Present ................... 44
Figure 2-23. Pneumatics, Basic Configuration............................................................................................ 46
x Teledyne API T100 Analyzer with NumaView™ Software 083730100 DCN8060
Page 13

Figure 2-24. Pneumatics with Zero/Span Valves Option ............................................................................ 47
Figure 2-25. Pneumatics with Ambient Zero/Pressurized Span Valves Option .......................................... 48
Figure 2-26. Pneumatics with IZS Option ................................................................................................... 49
Figure 2-27. Pneumatics with O2 Sensor .................................................................................................... 50
Figure 2-28. Status Screens at Startup ....................................................................................................... 51
Figure 2-29. Home Page Example .............................................................................................................. 51
Figure 2-30. Viewing Active Alerts Page ..................................................................................................... 52
Figure 2-31. Sample Dashboard Page ....................................................................................................... 53
Figure 2-32. User Interface Orientation ...................................................................................................... 55
Figure 2-33. Concentration and Stability Graph (top) and Meter Graph (bottom) ...................................... 56
Figure 2-34. Dashboard Page ..................................................................................................................... 57
Figure 2-35. Navigating to the Active Alerts Page ...................................................................................... 58
Figure 2-36. Active Alerts Cleared .............................................................................................................. 59
Figure 2-37. Utilities>Alerts Log of Active and Past Alerts and Events ...................................................... 59
Figure 2-38. Datalog Configuration, New Log Page ................................................................................... 61
Figure 2-39. Datalog Configuration, Existing Log ....................................................................................... 61
Figure 2-40. Creating a New Data Log ....................................................................................................... 62
Figure 2-41. Datalog Periodic Trigger Configuration .................................................................................. 63
Figure 2-42. Datalog - Conditional Trigger Configuration ........................................................................... 64
Figure 2-43. DAS Download Page .............................................................................................................. 64
Figure 2-44. Events List .............................................................................................................................. 65
Figure 2-45. Event Configuration ................................................................................................................ 65
Figure 2-46. Configured Event Sample ....................................................................................................... 66
Figure 2-47. Edit or Delete an Event ........................................................................................................... 66
Figure 2-48. Dashboard Display and Configuration .................................................................................... 67
Figure 2-49. Homescreen Configuration ..................................................................................................... 69
Figure 2-50. Digital Outputs Setup .............................................................................................................. 70
Figure 2-51. Analog Output Configuration Example ................................................................................... 71
Figure 2-52. Analog Outputs Group Calibration Screen ............................................................................. 72
Figure 2-53. Analog Outputs Manual Calibration Screen (AOUT2 Example) ............................................. 72
Figure 2-54. Setup for Checking / Calibrating DCV Analog Output Signal Levels ..................................... 73
Figure 2-55. Setup for Checking / Calibration Current Output Signal Levels ............................................. 74
Figure 2-56. Alternative Setup Using 250Ω Resistor for Checking Current Output Signal Levels ............. 75
Figure 2-57. Communications Configuration, Network Settings ................................................................. 77
Figure 2-58. Configuration Transfer ............................................................................................................ 78
Figure 3-1. MODBUS via Ethernet .............................................................................................................. 82
Figure 3-2. MODBUS via Serial Communication (example) ....................................................................... 83
Figure 3-3. Serial Communication, Setting Hessen Protocol ...................................................................... 84
Figure 3-4. Hessen Gas List Configuration ................................................................................................. 87
Figure 4-1. Setup for Manual Calibration without Z/S Valve or IZS Option ................................................ 93
Figure 4-2. Multi-Point Calibration Page ..................................................................................................... 94
Figure 4-3. Setup for Manual Calibration Check with Z/S Valve or IZS Option .......................................... 95
Figure 4-4. Zero and Span Calibration Screens ......................................................................................... 96
Figure 4-5. Auto Cal Page........................................................................................................................... 97
Figure 5-1. Report Generation Page ......................................................................................................... 104
Figure 5-2. Remote Update Page ............................................................................................................. 105
Figure 5-3. Manual Update Page (and other utilities) ............................................................................... 105
Figure 5-4. Touchscreen Calibration Page ............................................................................................... 106
Figure 5-5. Time Zone Change Requirements ......................................................................................... 107
Figure 5-6. Replacing the Particulate Filter............................................................................................... 108
Figure 5-7. Critical Flow Orifice Assembly ................................................................................................ 111
Figure 5-8. Critical Flow Orifice Assembly ................................................................................................ 112
Figure 5-9. Flow Calibration Menu ............................................................................................................ 116
Figure 5-10. Simple Leak Check Fixture ................................................................................................... 117
Figure 5-11. Hydrocarbon Scrubber Leak Check Setup ........................................................................... 117
083730100 DCN8060 Teledyne API T100 SO2 Analyzer with NumaView™ Software xi
Page 14

Figure 5-12. CPU Status Indicator ............................................................................................................ 124
Figure 5-13. Relay PCA Status LED Locations ........................................................................................ 125
Figure 5-14. Location of Relay Board Power Configuration Jumper ........................................................ 134
Figure 5-15. Typical Set Up of Status Output Test ................................................................................... 136
Figure 5-16. Sensor Module Wiring and Pneumatic Fittings .................................................................... 146
Figure 5-17. Sensor Module Mounting Screws ......................................................................................... 147
Figure 5-18. Hex Screw Between Lens Housing and Sample Chamber .................................................. 148
Figure 5-19. UV Lens Housing / Filter Housing ........................................................................................ 148
Figure 5-20. PMT UV Filter Housing Disassembled ................................................................................. 149
Figure 5-21. Disassembling the Shutter Assembly ................................................................................... 150
Figure 5-22. Shutter Assembly ................................................................................................................. 152
Figure 5-23. UV Lamp Adjustment ............................................................................................................ 153
Figure 5-24. Location of UV Reference Detector Potentiometer .............................................................. 154
Figure 5-25. Sensor Assembly .................................................................................................................. 156
Figure 5-26. Pre-Amplifier Board Layout .................................................................................................. 159
Figure 5-27. Relay PCA with AC Relay Retainer In Place ........................................................................ 160
Figure 5-28. Relay PCA Mounting Screw Locations ................................................................................. 161
Figure 6-1. UV Absorption ......................................................................................................................... 164
Figure 6-2. UV Light Path .......................................................................................................................... 167
Figure 6-3. Source UV Lamp Construction ............................................................................................... 167
Figure 6-4. Excitation Lamp UV Spectrum Before/After Filtration ............................................................ 169
Figure 6-5. PMT Optical Filter Bandwidth ................................................................................................. 170
Figure 6-6. Effects of Focusing Source UV in Sample Chamber.............................................................. 171
Figure 6-7. Oxygen Sensor - Principles of Operation ............................................................................... 174
Figure 6-8. CO2 Sensor Principles of Operation ....................................................................................... 175
Figure 6-9. CO2 Sensor Option PCA Layout and Electronic Connections................................................ 176
Figure 6-10. Gas Flow and Location of Critical Flow Orifice ..................................................................... 177
Figure 6-11. Flow Control Assembly & Critical Flow Orifice ..................................................................... 178
Figure 6-12. T100 Hydrocarbon Scrubber (Kicker) ................................................................................... 179
Figure 6-13. Electronic Block Diagram ..................................................................................................... 181
Figure 6-14. CPU Board ............................................................................................................................ 183
Figure 6-15. T100 Sensor Module ............................................................................................................ 184
Figure 6-16. T100 Sample Chamber ........................................................................................................ 184
Figure 6-17. PMT Housing Assembly ....................................................................................................... 185
Figure 6-18. Basic PMT Design ................................................................................................................ 186
Figure 6-19. PMT Cooling System ............................................................................................................ 187
Figure 6-20. PMT Preamp Block Diagram ................................................................................................ 189
Figure 6-21. Relay PCA Layout (P/N 045230100) .................................................................................... 191
Figure 6-22. Relay PCA P/N 045230100 with AC Relay Retainer in Place .............................................. 192
Figure 6-23. Typical Jumper Set (JP2) Set Up of Heaters ...................................................................... 193
Figure 6-24. Power Distribution Block Diagram ........................................................................................ 197
Figure 6-25. Front Panel and Display Interface Block Diagram ................................................................ 198
Figure 6-26. Basic Software Operation ..................................................................................................... 199
LIST OF TABLES
Table 1-1. Specifications ............................................................................................................................. 15
Table 1-2. O2 Sensor Option Specifications ............................................................................................... 16
Table 1-3. CO2 Sensor Option Specifications ............................................................................................. 16
Table 2-1. Ventilation Clearance ................................................................................................................. 19
Table 2-2. Rear Panel Description .............................................................................................................. 22
Table 2-3. Analog Input Pin Assignments ................................................................................................... 25
Table 2-4. Analog Output Pin Assignments ................................................................................................ 26
Table 2-5. Status Output Pin Assignments ................................................................................................. 29
xii Teledyne API T100 Analyzer with NumaView™ Software 083730100 DCN8060
Page 15

Table 2-6. Control Input Pin Assignments .................................................................................................. 30
Table 2-7. Zero/Span and Sample/Cal Valve Operating States ................................................................. 47
Table 2-8. Valve Operating States for Ambient Zero/Pressurized Span Option ......................................... 48
Table 2-9. IZS Valve Option Operating States............................................................................................ 49
Table 2-10. Menu Overview ........................................................................................................................ 54
Table 2-11. Utilities Submenu Descriptions ................................................................................................ 60
Table 2-12. Typical Variables with Descriptions ......................................................................................... 68
Table 2-13. Analog Output Voltage/Current Range .................................................................................... 72
Table 2-14. Voltage Tolerances .................................................................................................................. 73
Table 2-15. Current Loop Output Check ..................................................................................................... 75
Table 2-16. Setup>Instrument Menu .......................................................................................................... 75
Table 2-17. COM1/COM2 Configuration ..................................................................................................... 76
Table 2-18. LAN/Ethernet Configuration Properties ................................................................................... 78
Table 3-1. Ethernet Status Indicators ......................................................................................................... 81
Table 3-2. Teledyne API's Hessen Protocol Response Modes .................................................................. 85
Table 3-3. Hessen Status Flags and Default Bit Assignments ................................................................... 86
Table 3-4. Hessen Gas List Definitions ....................................................................................................... 87
Table 4-1. Auto Cal States .......................................................................................................................... 98
Table 4-2. Auto Cal Setup Combinations .................................................................................................... 98
Table 4-3. Auto Cal Programming Sequence Execution ............................................................................ 99
Table 4-4. Calibration Data Quality Evaluation ........................................................................................... 99
Table 5-1. Maintenance Schedule ............................................................................................................ 102
Table 5-2. Predictive Uses for Dashboard Functions ............................................................................... 103
Table 5-3. Warning Alerts, Fault Conditions and Possible Causes .......................................................... 119
Table 5-4. Dashboard Functions - Possible Causes for Out-of-Range Values ........................................ 123
Table 5-5. Relay PCA Watchdog and Status LED Failure Indications ..................................................... 126
Table 5-6. DC Power Test Point and Wiring Color Code .......................................................................... 134
Table 5-7. DC Power Supply Acceptable Levels ...................................................................................... 135
Table 5-8. Relay PCA Control Devices ..................................................................................................... 136
Table 5-9. UV Lamp Signal Troubleshooting ............................................................................................ 153
Table 6-1. Power Configuration for Optional Heaters (JP6) ..................................................................... 193
Appendix A – MODBUS Registers
Appendix B – Interconnect Wiring Diagram
083730100 DCN8060 Teledyne API T100 SO2 Analyzer with NumaView™ Software xiii
Page 16

1. INTRODUCTION, SPECIFICATIONS, APPROVALS, & COMPLIANCE
Teledyne API’s Model T100 (also referred to as T100) UV Fluorescence SO2 Analyzer is
a microprocessor controlled analyzer that determines the concentration of sulfur dioxide
), in a sample gas drawn through the instrument’s sample chamber where it is exposed
(SO
2
to ultraviolet light, which causes any SO
the amount of fluorescence to determine the amount of SO
The T100’s exceptional stability is achieved with the use of an optical shutter to
compensate for sensor drift and a reference detector to correct for changes in UV lamp
intensity. Additionally, an advanced optical design combined with a special scrubber,
called a "kicker" that removes hydrocarbons (which fluoresce similarly to SO
inaccuracies caused by interferents.
present to fluoresce. The instrument measures
2
present in the sample gas.
2
), to prevent
2
Calibration is performed in software that stores SO
when specific, known concentrations of SO
concentration measurements made
2
are supplied to the analyzer. The
2
microprocessor uses these calibration values along with other performance parameters such
as the sensor offset, UV lamp intensity, amount of stray light present, and sample gas
temperature and pressure measurements to compute the final SO
concentration.
2
Proprietary software allows configurable data acquisition capability that can be triggered
conditionally or periodically, enabling operators to perform predictive diagnostics and
enhanced data analysis by tracking parameter trends. Reports can be downloaded onto a
USB flash drive or via the I/O ports. Operators can also view real-time graphing with one
touch of the interface screen.
14 Teledyne API T100 Analyzer with NumaView™ Software 083730100 DCN8060
Page 17

SPECIFICATIONS
PARAMETER
SPECIFICATION
Min/Max Range
AC Power
Rating
220-240 V~, 50/60 Hz, 3.0 A
Typical Power Consumption
140 W
Analog Output Ranges
10V, 5V, 1V, 0.1V (selectable)
Recorder Offset
Standard I/O
1 Ethernet: 10/100Base-T
4 analog outputs
Optional I/O
1 USB com port
3 4-20mA current outputs
Dimensions H x W x D
7" x 17" x 23.5" (178mm x 432 mm x 597 mm)
Environmental Conditions
Installation Category (Over voltage Category) II Pollution Degree 2
Intended for Indoor Use Only at Altitudes ≤ 2000m
Table 1-1. Specifications
(Physical Analog Output)
Max: 0-20,000 ppb Full Scale (selectable, dual range supported)
Measurement Units ppb, ppm, µg/m3, mg/m3 (selectable)
Min: 0-50 ppb Full Scale
Zero Noise1 < 0.2 ppb (RMS)
Span Noise1 < 0.5% of reading (RMS) above 50 ppb
Lower Detectable Limit 2 < 0.4 ppb
Zero Drift < 0.5 ppb (at constant temperature and voltage) /24 hours
Span Drift < 0.5% of Full Scale (at constant temperature and voltage) /24 hours
Lag Time
1
20 seconds
Rise/Fall Time1 < 100 seconds to 95%
Linearity 1% of full scale / 24 hours
Precision 0.5% of reading above 50 ppb
Sample Flow Rate 650 cc/min ± 10%
110-120 V~ , 60 Hz, 3.0 A
165 W
± 10%
2 RS-232 (300 – 115,200 baud)
2 USB device ports
8 opto-isolated digital status outputs (7 defined, 1 spare)
6 opto-isolated digital control inputs (4 defined, 2 spar)
1 RS485
8 analog inputs (0-10V, 12-bit)
4 digital alarm outputs
Multidrop RS232
Weight
Operating Temperature Range
5 - 40 °C (with US EPA equivalency)
Humidity Range 0-95% RH non-condensing
1
As defined by the US EPA.
2
Defined as twice the zero noise level by the US EPA.
All specifications are based on constant conditions.
083730100 DCN8060 Teledyne API T100 SO2 Analyzer with NumaView™ Software 15
Page 18

Table 1-2. O2 Sensor Option Specifications
PARAMETER
DESCRIPTION
Zero Noise
<0.02% O2
<± 0.05% O2
Note: zero drift is typically <± 0.1% O
2
during the first 24 hrs of operation
PARAMETER
DESCRIPTION
Accuracy
<± (0.02% CO2 + 2% of reading)
Rise and Fall Time
<60 seconds to 95%
1
As defined by the USEPA
Ranges 0-1% to 0-100% user selectable. Dual ranges and auto-ranging supported.
1
Lower Detectable Limit2 <0.04% O2
Zero Drift (24 hours) 3 <± 0.02% O2
Zero Drift (7 days) <±- 0.05% O2
Span Noise
1
Span Drift (7 days) <± 0.1% O2
Accuracy (intrinsic error) <± 0.1% O2
Linearity <± 0.1 % O2
Temp Coefficient <± 0.05% O2 /°C,
Rise and Fall Time <60 seconds to 95%
1
As defined by the USEPA
2
Defined as twice the zero noise level by the USEPA
3
Table 1-3. CO2 Sensor Option Specifications
Ranges 0-1% to 0-20% user selectable. Dual ranges and auto-ranging supported.
Zero Noise
1
<0.02% CO
2
Zero Drift (24 hours) <± 0.02% CO2
Zero Drift (7 days) <± 0.05% CO2
Span Noise
1
<± 0.1% CO2
Span Drift (7 days) <± 0.1% CO2
Lower Detectable Limit2 <0.04% CO2
Linearity <± 0.1% CO2
Temperature Coefficient <± 0.01% CO2 /°C
2
Defined as twice the zero noise level by the USEPA
EPA DESIGNATION
Teledyne API’s Model T100 Fluorescence SO2 Analyzer is officially designated as US
EPA Federal Equivalent Method Number EQSA-0495-100 for sulfur dioxide
measurement. The official List of Designated Reference and Equivalent Methods is
published in the U.S. Federal Register: http://www3.epa.gov/ttn/amtic/criteria.html
specifies the instrument’s settings and configurations.
, and
16 Teledyne API T100 Analyzer with NumaView™ Software 083730100 DCN8060
Page 19

Toll-free Phone:
Email:
SAFETY
IEC/EN 61010-1:2010 (3rd Edition), Safety requirements for electrical equipment for
measurement, control, and laboratory use.
CE: 2006/95/EC, Low-Voltage Directive
EMC
IEC/EN 61326-1, Class A Emissions/Industrial Immunity
FCC 47 CFR Part 15B, Class A Emissions
CE: 2004/108/EC, Electromagnetic Compatibility Directive
OTHER CERTIFICATIONS
MCERTS: Sira MC 050067/07
EN 15267 – Air Quality – Ambient Air Automated Measuring Systems
EN 14212 – Ambient Air Measurement for SO2
For additional certifications, please contact Technical Support:
+1 800-324-5190
Phone:
+1 858-657-9800
Fax:
+1 858-657-9816
api-techsupport@teledyne.com
083730100 DCN8060 Teledyne API T100 SO2 Analyzer with NumaView™ Software 17
Page 20
2. GETTING STARTED
To avoid personal injury, always use two persons to lift and
COULD DAMAGE INSTRUMENT AND VOID WARRANTY
COULD DAMAGE INSTRUMENT AND VOID WARRANTY
Note
materials for future use if/when the instrument should be
Warranty statement in this manual and Return Merchandise
api.com.
This section addresses unpacking, connecting, and initializing the instrument, getting an
overview of the menu system, and setting up/configuring the functions.
UNPACKING
carry the analyzer.
ATTENTION
Printed Circuit Assemblies (PCAs) are sensitive to electro-static
discharges too small to be felt by the human nervous system. Failure
to use Electro-Static Discharge (ESD) protection when working with
electronic assemblies will void the instrument warranty. Refer to the
manual, Fundamentals of ESD, PN 04786, which can be downloaded
from our website at http://www.teledyne-api.com
CAUTION - GENERAL SAFETY HAZARD
.
ATTENTION
Do not operate this instrument without first removing dust plugs from
SAMPLE and EXHAUST ports on the rear panel.
Teledyne API recommends that you store shipping containers
and
returned to the factory for repair and/or calibration service. See
Authorization (RMA) on our Website at http://www.teledyne-
Verify that there is no apparent external shipping damage. If damage has occurred, please
advise the shipper first, then Teledyne API.
Included with your instrument is a printed record of the final performance characterization
performed on your instrument at the factory. This record, titled Final Test and Validation
Data Sheet, is an important quality assurance and calibration record and should be placed
in the quality records file for this instrument.
18 Teledyne API T100 Analyzer with NumaView™ Software 083730100 DCN8060
Page 21
AREA
MINIMUM REQUIRED CLEARANCE
With no power to the unit, carefully remove the top cover of the instrument and check for
internal shipping damage by carrying out the following steps:
1. Carefully remove the top cover and check for internal shipping damage.
a. Remove the side-panel screws that hold the cover in place.
b. Slide the cover backward until it clears the instrument’s front bezel.
c. Lift the cover straight up.
2. Inspect the interior of the instrument to ensure all circuit boards and other
components are intact and securely seated.
3. Check the connectors of the various internal wiring harnesses and
pneumatic hoses to ensure they are firmly and securely seated.
4. Verify that all of the optional hardware ordered with the unit has been
installed. These are listed on the paperwork accompanying the instrument.
WARNING – ELECTRICAL SHOCK HAZARD
Never disconnect PCAs, wiring harnesses or electronic
subassemblies while the instrument is under power.
VENTILATION CLEARANCE
Whether the instrument is set up on a bench or installed in a rack, be sure to leave sufficient
ventilation clearance.
Table 2-1. Ventilation Clearance
Back of the instrument 10 cm / 4 in
Sides of the instrument 2.5 cm / 1 in
Above and below the instrument 2.5 cm / 1 in
083730100 DCN8060 Teledyne API T100 SO2 Analyzer with NumaView™ Software 19
Page 22
INSTRUMENT LAYOUT
This section illustrates the front and rear panels and the internal chassis layout.
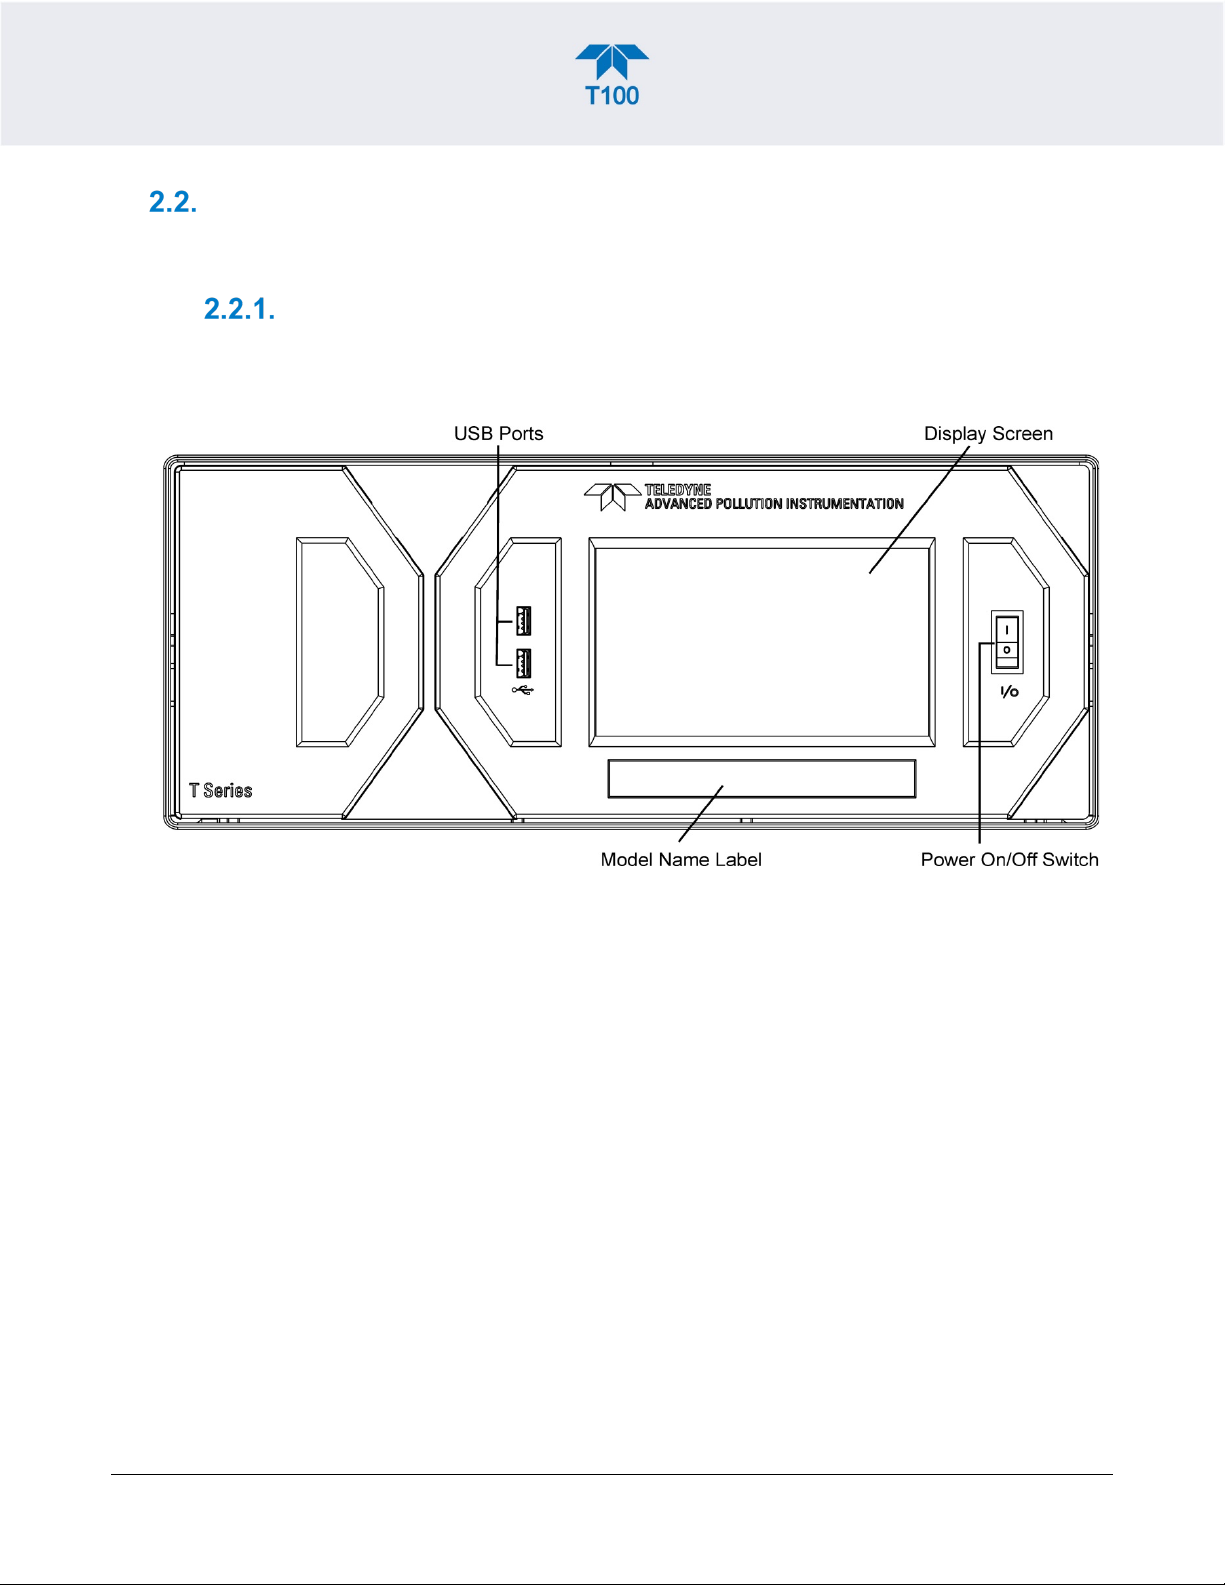
FRONT PANEL
The front panel (Figure 2-1) includes two USB ports for peripheral device connections,
which can be used with mouse and keyboard as alternatives to the touchscreen interface,
or with flash drive for uploads/downloads (devices not included).
Figure 2-1. Front Panel Layout
20 Teledyne API T100 Analyzer with NumaView™ Software 083730100 DCN8060
Page 23
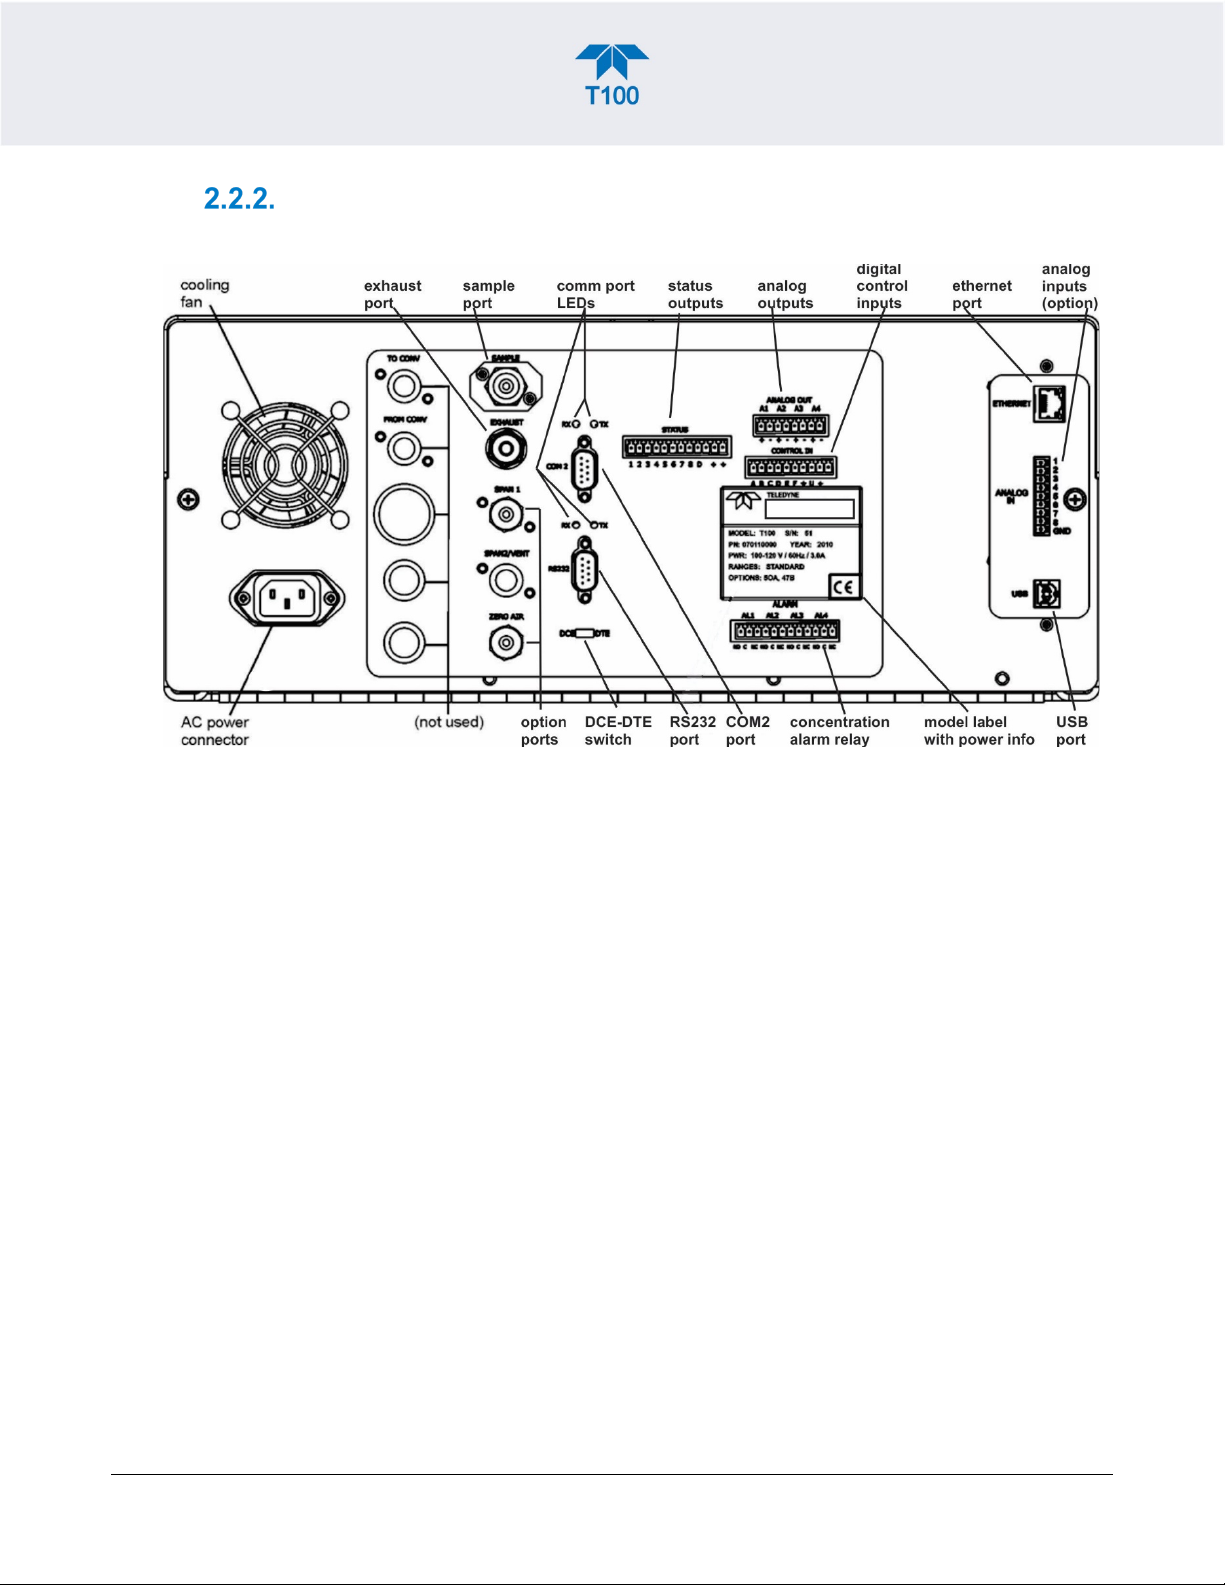
REAR PANEL
Figure 2-2 shows the layout of the rear panel.
Figure 2-2. Rear Panel Layout, Base Unit (options include additional pneumatic ports)
083730100 DCN8060 Teledyne API T100 SO2 Analyzer with NumaView™ Software 21
Page 24

Table 2-2. Rear Panel Description
COMPONENT FUNCTION
cooling fan
AC power
connector
Model/specs label
TO CONV
FROM CONV
SAMPLE
EXHAUST
SPAN 1
SPAN2/VENT
ZERO AIR
RX TX
COM 2
RS-232
DCE DTE
STATUS
ANALOG OUT
CONTROL IN
ALARM
ETHERNET
ANALOG IN
USB
Label
Pulls ambient air into chassis through side vents and exhausts through rear.
Connector for three-prong cord to apply AC power to the analyzer.
CAUTION! The cord’s power specifications (specs) MUST comply with the power
specs on the analyzer’s rear panel Model number label
Identifies the analyzer model number and provides power specs
(not used in this model)
(not used in this model)
Connect a gas line from the source of sample gas here.
Calibration gases can also enter here on units without zero/span/shutoff valve options
installed.
Connect an exhaust gas line of not more than 10 meters long here that leads outside the
shelter or immediate area surrounding the instrument. The line must be ¼” tubing or
greater.
On units with zero/span/shutoff valves option installed, connect a gas line to the source of
calibrated span gas here.
Used as a second cal gas input line when instrument is configured with zero/span valves
and a dual gas option, or as a cal gas vent line when instrument is configured with a
pressurized span option
Internal Zero Air: On units with zero/span/shutoff valves option installed but no internal zero
air scrubber attach a gas line to the source of zero air here.
LEDs indicate receive (RX) and transmit (TX) activity when blinking.
Serial communications port for RS-232 or RS-485.
Serial communications port for RS-232 only.
Switch to select either data terminal equipment or data communication equipment during
RS-232 communication.
For outputs to devices such as Programmable Logic Controllers (PLCs).
For voltage or current loop outputs to a strip chart recorder and/or a data logger.
For remotely activating the zero and span calibration modes.
Option for concentration alarms and system warnings.
Connector for network or Internet remote communication, using Ethernet cable.
Option for external voltage signals from other instrumentation and for logging these signals.
Connector for direct connection to laptop computer, using USB cable.
Includes voltage and frequency specifications.
(Call factory for details).
22 Teledyne API T100 Analyzer with NumaView™ Software 083730100 DCN8060
Page 25
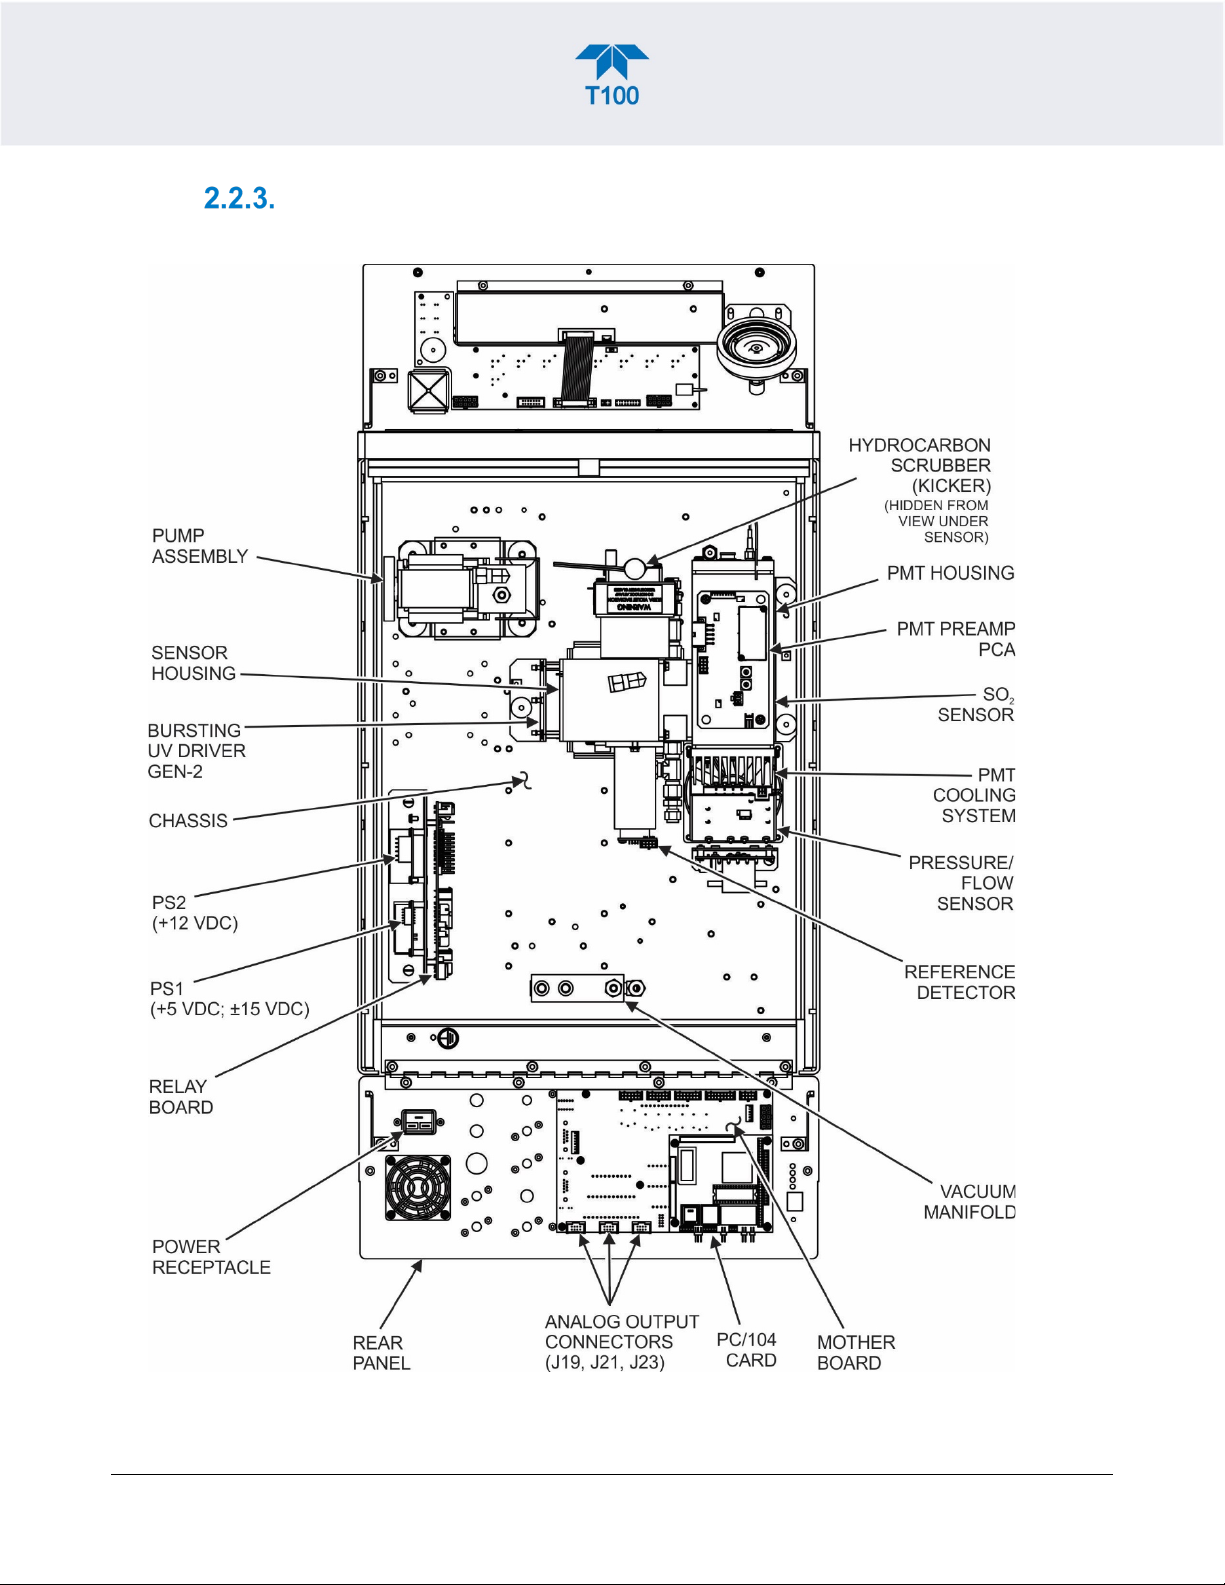
INTERNAL CHASSIS
Figure 2-3 shows internal chassis configurations without options.
Figure 2-3. Internal Chassis Layout, Basic (no valve or second gas option)
083730100 DCN8060 Teledyne API T100 SO2 Analyzer with NumaView™ Software 23
Page 26
CONNECTIONS AND STARTUP
Note
To maintain compliance with EMC standards, cable length
Do not operate with cover off.
This section presents the electrical (Section 2.3.1) and pneumatic (Section 2.3.2)
connections for setting up and preparing the instrument for operation (Section 2.3.3).
ELECTRICAL CONNECTIONS
must be go greater than 3 meters for all I/O connections.
Teledyne API recommends that you store shipping containers
and materials for future use if/when the instrument should be
returned to the factory for repair and/or calibration service.
WARNING – Electrical Shock Hazard
• High Voltages are present inside the instrument’s case.
• Power connection must have functioning ground connection.
• Do not defeat the ground wire on power plug.
• Turn off instrument power before disconnecting or connecting
electrical subassemblies.
•
CAUTION – Avoid Damage to the Instrument
Ensure that the AC power voltage matches the voltage indicated on
the instrument’s model/specs label before plugging it into line
power.
CONNECTING POWER
Attach the power cord between the instrument’s AC power connector and a power outlet
capable of carrying at least the rated current at your AC voltage range. It is important to
adhere to all safety and cautionary messages, and ensure that the outlet is equipped with a
functioning earth ground.
24 Teledyne API T100 Analyzer with NumaView™ Software 083730100 DCN8060
Page 27
CONNECTING ANALOG INPUTS (OPTION)
PARAMETER1
1
Analog input # 1
Channel 1
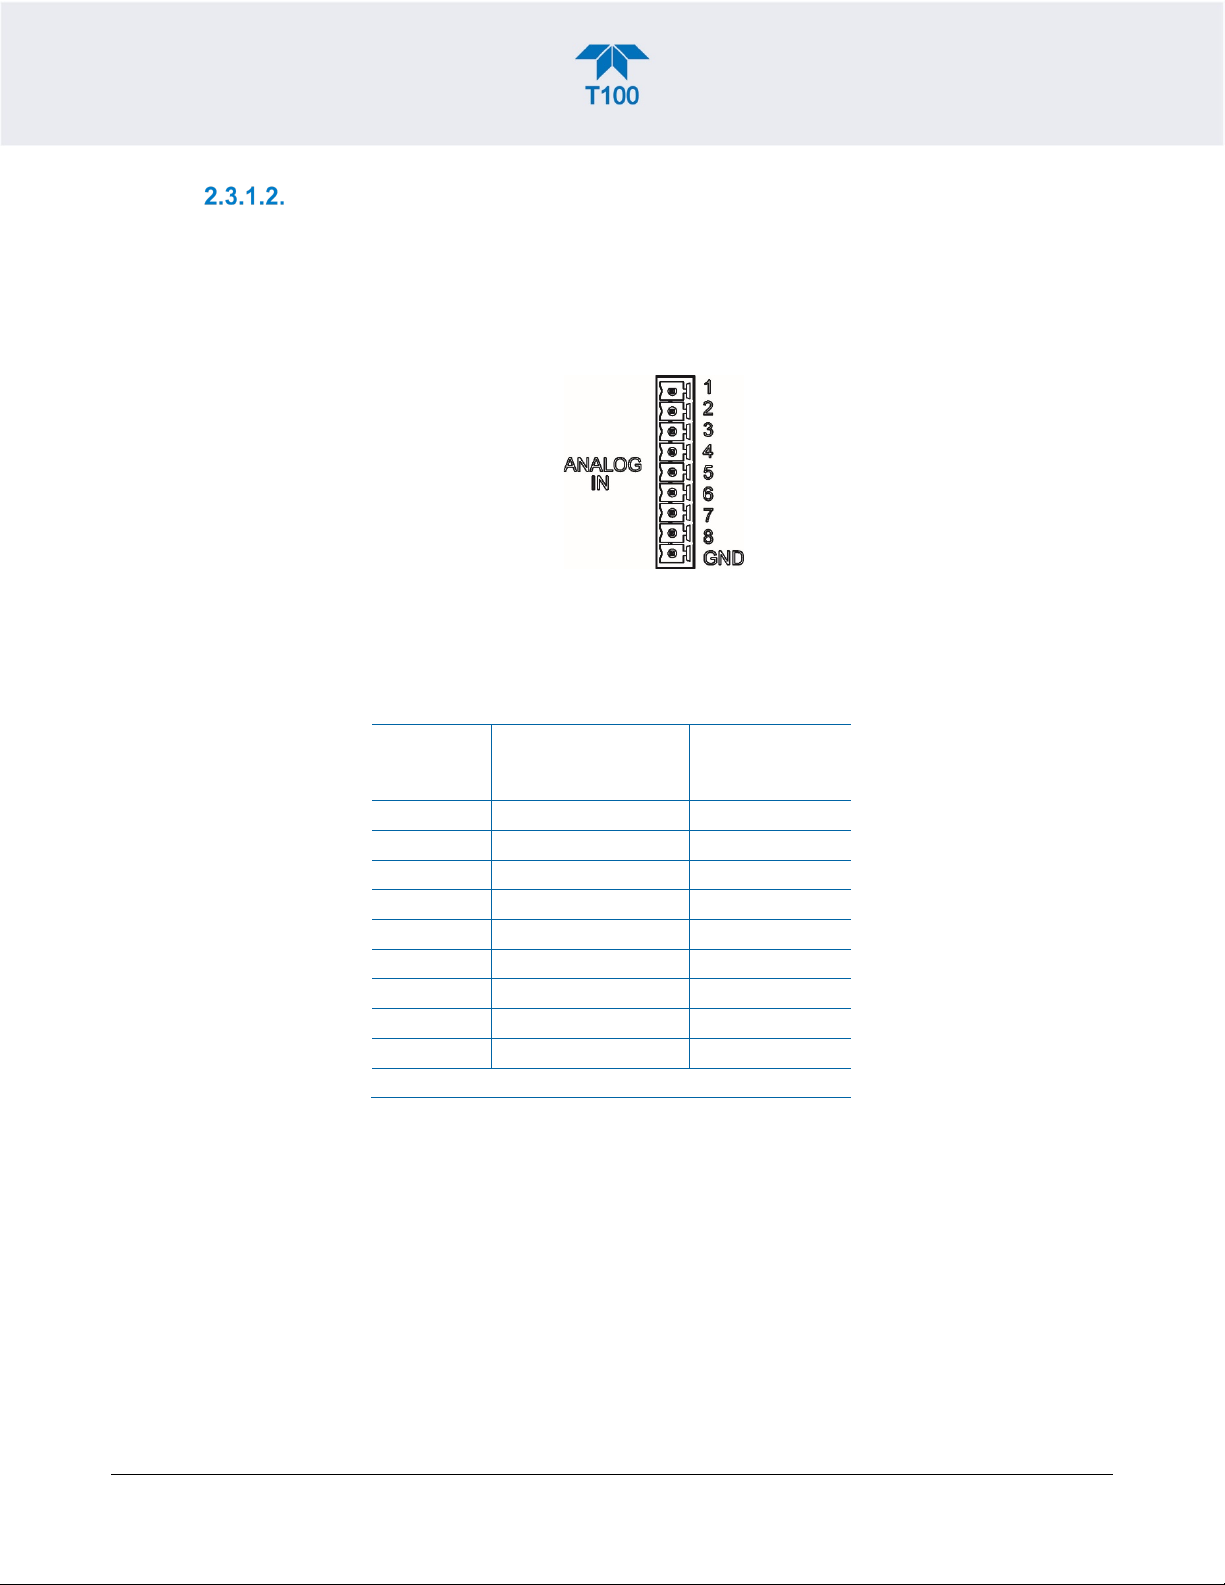
The Analog In connector option is used for measuring external voltage signals from other
instrumentation (such as meteorological instruments) and for logging these signals in the
analyzer’s internal data acquisition system, the Data Logger (Section 2.5.1). The input
voltage range for each analog input is 0-10 VDC and input impedance is nominally 20kΩ
in parallel with 0.1µF.
Figure 2-4. Analog In Connector
Assignments for the Analog In connector pins 1 through 8 (Table 2-3) are configurable
through the Setup>Ext Analog Inputs menu (visible with installed option).
Table 2-3. Analog Input Pin Assignments
DAS/DATA
PIN DESCRIPTION
2 Analog input # 2 Channel 2
3 Analog input # 3 Channel 3
4 Analog input # 4 Channel 4
5 Analog input # 5 Channel 5
6 Analog input # 6 Channel 6
7 Analog input # 7 Channel 7
8 Analog input # 8 Channel 8
GND Analog input Ground N/A
1
See Section 2.5.1 to set up the Data Logger.
LOGGER
083730100 DCN8060 Teledyne API T100 SO2 Analyzer with NumaView™ Software 25
Page 28
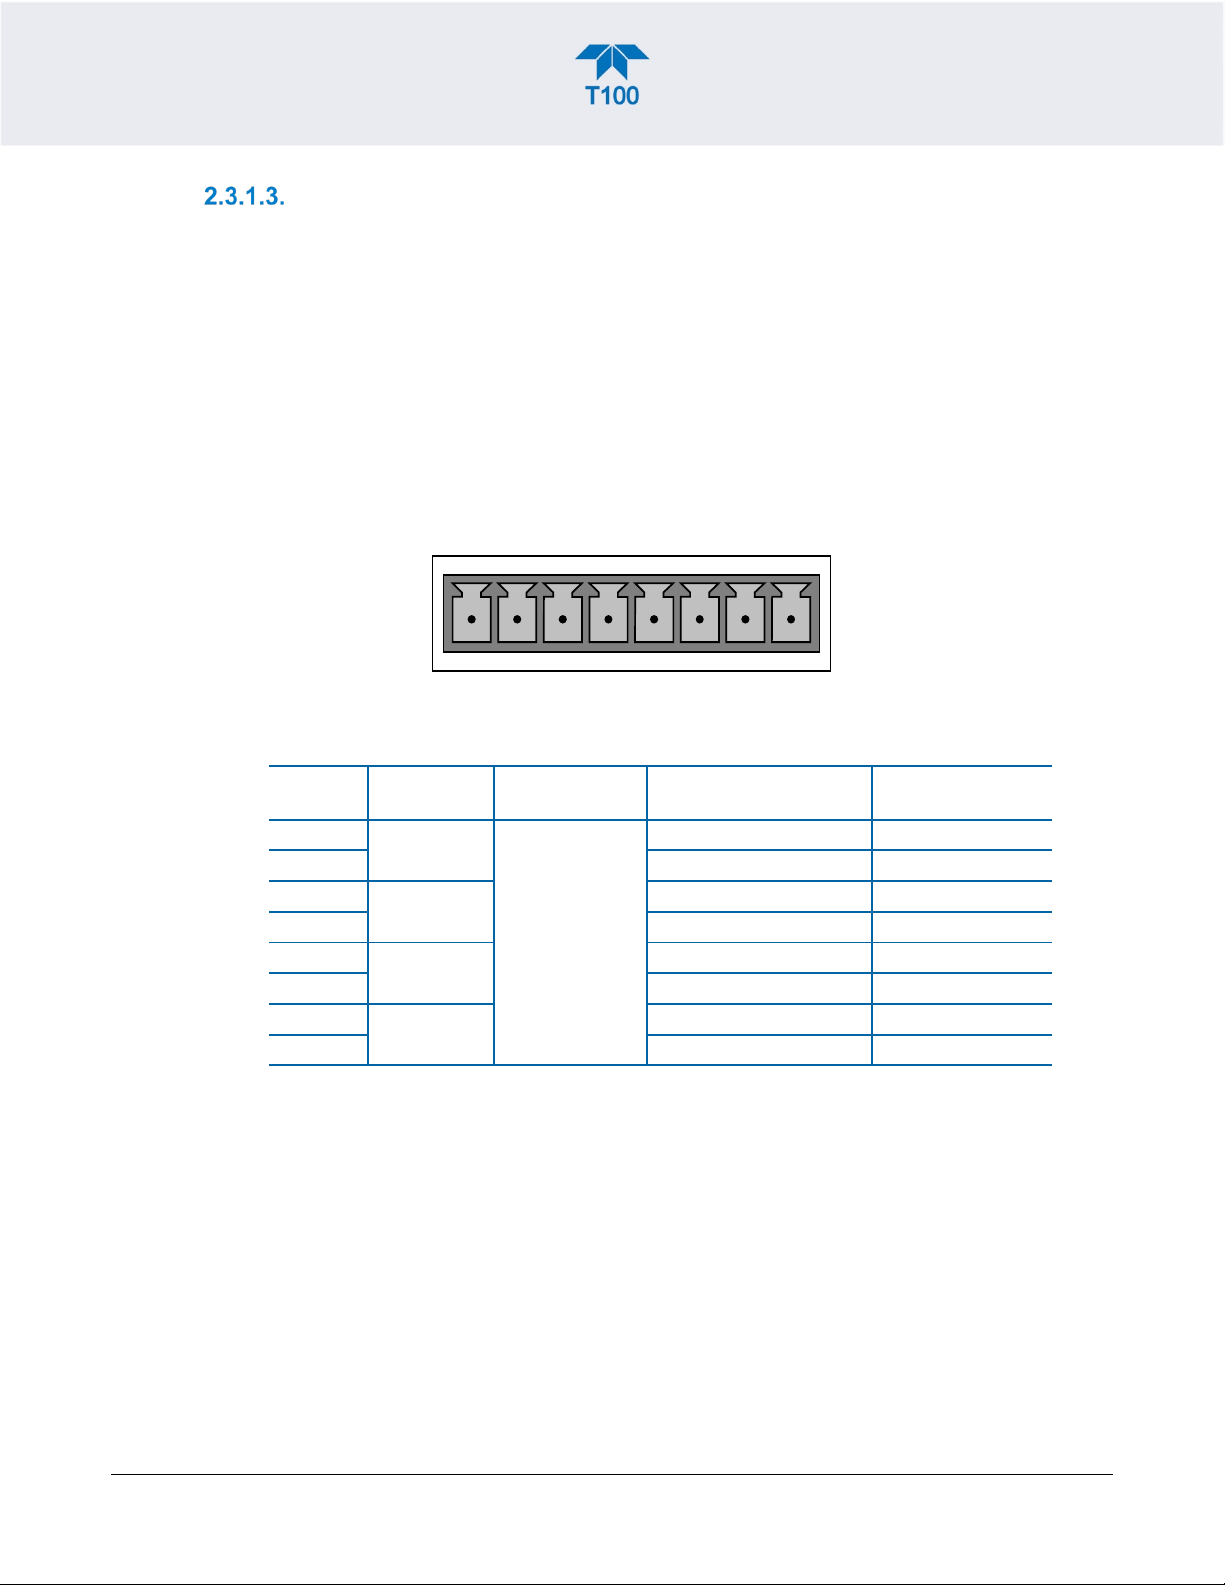
CONNECTING ANALOG OUTPUTS
ANALOG OUT
A1 A2 A3 A4
+ - + - + - + -
OUTPUT
VOLTAGE OUTPUT
LOOP OPTION
3
A2
V +
I Out +
4
Ground
I Out -
4
Ground
I Out -
7
V +
Not Available
The rear panel Analog Output channels A1through A4 can be mapped to reflect various
operating values in the analyzer, including concentration values, temperatures, pressures,
etc. These mappings are not configured by default and must be set by the user.
An optional Current Loop output (Section 2.3.1.4) is available for A1, A2 and A3 only.
To access these signals attach a strip chart recorder and/or data-logger to the appropriate
analog output connections on the rear panel of the analyzer.
Configure through the Setup>Analog Outputs menu (Section 2.5.8)
Figure 2-5. Analog Output Connector
Table 2-4. Analog Output Pin Assignments
PIN
1
2 Ground I Out -
3
8 Ground Not Available
ANALOG
A1
A3
A4
SIGNAL OUT
User-selected
through the
Setup>Analog
Outputs menu.
STANDARD
V + I Out +
V + I Out +
CURRENT
26 Teledyne API T100 Analyzer with NumaView™ Software 083730100 DCN8060
Page 29
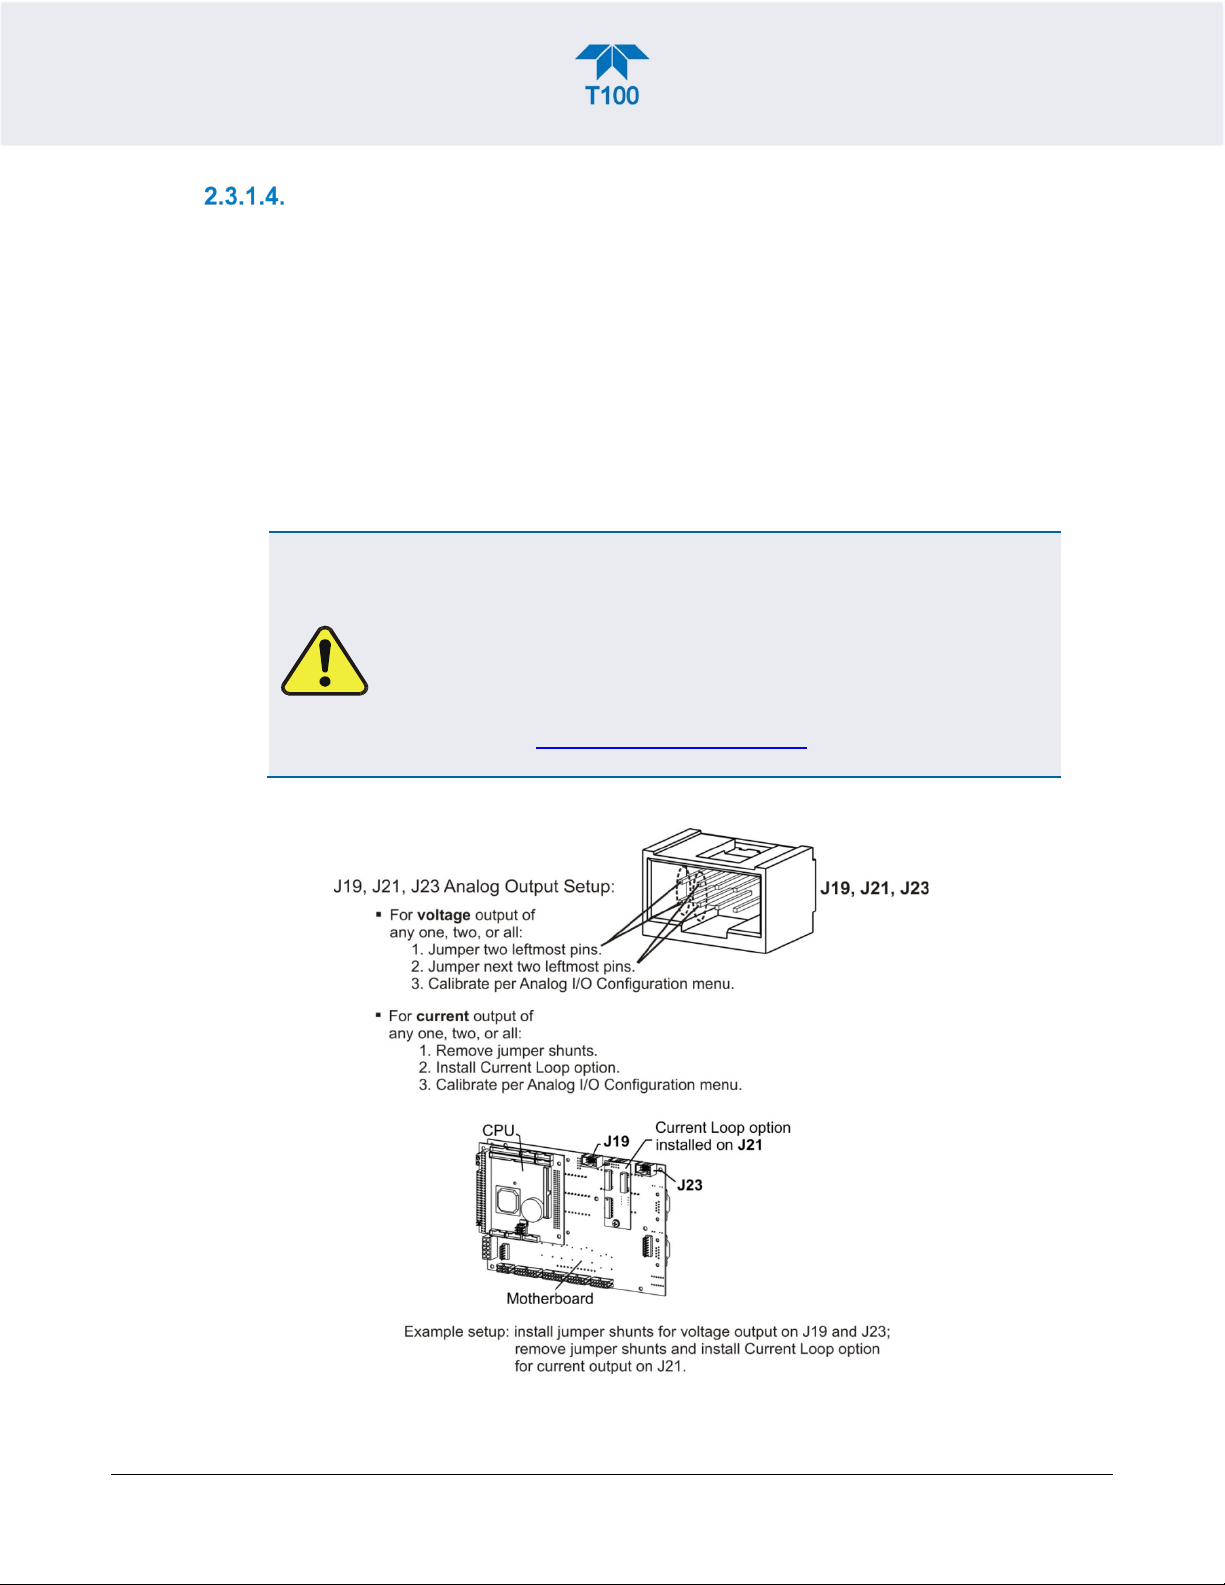
CURRENT LOOP ANALOG OUTPUTS (OPTION 41) SETUP
If your analyzer had this option installed at the factory, there are no further connections to
be made. Otherwise, it can be installed as a retrofit for each of the analog outputs. This
option converts the DC voltage analog output to a current signal with 0-20 mA output
current, which can be scaled to any set of limits within that 0-20 mA range. However, most
current loop applications call for either 2-20 mA or 4-20 mA range. All current loop outputs
have a +5% over-range. Ranges with the lower limit set to more than 1 mA (e.g., 2-20 or
4-20 mA) also have a -5% under-range.
Figure 2-6 provides installation instructions and illustrates a sample configuration of one
current output combined with two voltage outputs. Next are instructions for converting
current loop analog outputs to standard 0-to-5 VDC outputs. To calibrate or adjust these
outputs use the Setup>Analog Outputs menu (Section 2.5.8).
CAUTION – Avoid Invalidating Warranty
Servicing or handling of circuit components requires electrostatic
discharge protection, i.e. ESD grounding straps, mats and
containers. Failure to use ESD protection when working with
electronic assemblies will void the instrument warranty. For
information on preventing ESD damage, refer to the manual,
Fundamentals of ESD, PN 04786, which can be downloaded from
our website at http://www.teledyne-api.com under Help Center >
Product Manuals in the Special Manuals section..
Figure 2-6. Current Loop Option Installed on the Motherboard
083730100 DCN8060 Teledyne API T100 SO2 Analyzer with NumaView™ Software 27
Page 30
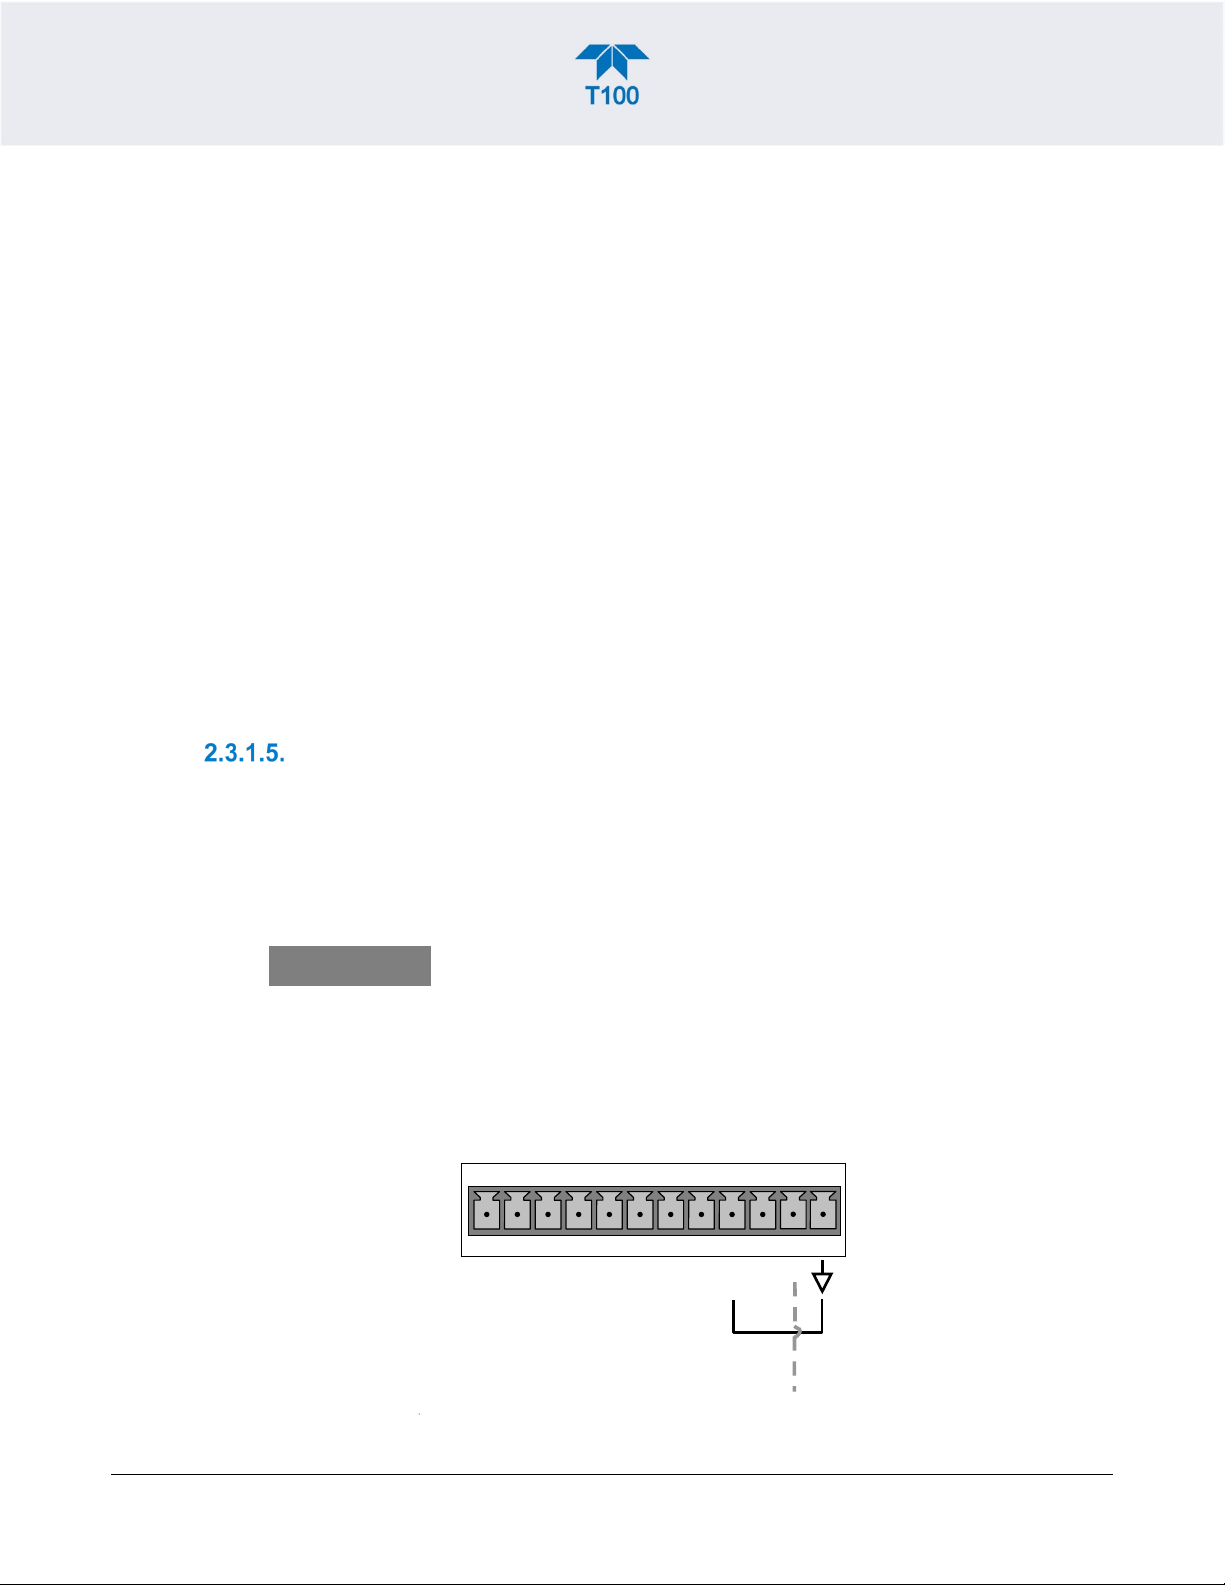
CONVERTING CURRENT LOOP ANALOG OUTPUTS TO STANDARD VOLTAGE OUTPUTS
STATUS
1 2 3 4 5 6 7 8 D +
+5V to external device
Map the digital outputs
1 thru 8 through the
Setup>Digital Outputs
menu.
To convert an output configured for current loop operation to the standard 0 to 5 VDC
output operation:
1. Turn off power to the analyzer.
2. If a recording device is connected to the output being modified, disconnect it.
3. Remove the top cover.
• Remove the set screw located in the top, center of the rear panel.
• Remove the screws fastening the top cover to the unit (one per side).
• Slide the cover back and lift the cover straight up.
4. Remove the screw holding the current loop option to the motherboard.
5. Disconnect the current loop option PCA from the appropriate connector on
the motherboard (see Figure 2-6).
6. Each connector, J19 and J23, requires two shunts. Place one shunt on the
two left most pins and the second shunt on the two adjacent pins (see
Figure 2-6).
7. Return the top cover to the analyzer and secure.
The analyzer can now have a voltage-sensing recording device attached to that output.
CONNECTING THE STATUS OUTPUTS (DIGITAL OUTPUTS)
The 12-pin STATUS connector allows the digital status outputs to report analyzer
conditions (configured through the Setup>Digital Outputs menu) via optically isolated
NPN transistors that sink up to 50 mA of DC current. These outputs can be used to interface
with devices that accept logic-level digital inputs, such as Programmable Logic Controllers
(PLCs). Each status bit is an open collector output that can withstand up to 40 VDC. All of
the emitters of these transistors are tied together and available at pin D (see Figure 2-7).
ATTENTION
COULD DAMAGE INSTRUMENT AND VOID WARRANTY
Most PLC’s have internal provisions for limiting the current that
the input will draw from an external device. When connecting to a
unit that does not have this feature, an external dropping resistor
must be used to limit the current through the transistor output to
less than 50 mA. At 50 mA, the transistor will drop approximately
1.2V from its collector to emitter.
28 Teledyne API T100 Analyzer with NumaView™ Software 083730100 DCN8060
Figure 2-7. Status Output Connector for Digital Outputs
Page 31

Table 2-5. Status Output Pin Assignments
DEFINITION
CONTROL IN
A B C D E F U +
SPAN
ZERO
CONTROL IN
A B C D E F U +
SPAN
ZERO
-
+
5 VDC Power
Supply
Local Power Connections
External Power Connections
PIN
STATUS
CONDITION
Configurable
1-8
through the
Setup>Digital
Collector side of individual status output opto-isolators.
Outputs menu
D Emitter BUS
Blank NO CONNECTION
+ DC Power + 5 VDC, 300 mA source maximum
Digital Ground
The emitters of the transistors on pins 1 to 8 are
bussed together.
The ground level from the analyzer’s internal DC power
supplies. This connection should be used as the
ground return when +5VDC power is used.
CONNECTING THE CONTROL INPUTS (DIGITAL INPUTS)
With zero and span valves option installed, two digital control inputs in the rear panel
CONTROL IN connector, can be used to remotely activate the zero and span calibration
modes (see Section 4.2.2.1).
Energize the Control Inputs either by the internal +5V available from the pin labeled “+”
(more convenient), or by a separate external 5 VDC power supply (ensures that these inputs
are truly isolated). Refer to Figure 2-8.
083730100 DCN8060 Teledyne API T100 SO2 Analyzer with NumaView™ Software 29
Figure 2-8. Energizing the Control Inputs
Page 32

Table 2-6. Control Input Pin Assignments
DEFINITION
INPUT #
A
B
C, D, E
& F
U External Power input Input pin for +5 VDC is required to activate pins A – F.
+
STATUS
Remote Zero Cal
Remote Span Cal
Spare
Digital Ground
5 VDC output
The analyzer is placed in Zero Calibration mode.
The analyzer is placed in Span Calibration mode.
The ground level from the analyzer’s internal DC Power
Supplies (same as chassis ground).
Internally generated 5V DC power. To activate inputs A –
F, place a jumper between this pin and the “U” pin. The
maximum amperage through this port is 300 mA
(combined with the analog output supply, if used).
ON CONDITION
CONCENTRATION ALARM RELAY (OPTION 61)
The concentration relay option provides four (4) “dry contact” relays on the rear panel
(Figure 2-9), each with 3 pins: Common (C), Normally Open (NO), and Normally Closed
(NC). The Relays can be mapped to reflect various internal instrument conditions and
states. Configure these outputs through the Setup>Digital Outputs menu (Section 2.5.7)
under MB Relay [1 thru 4].
Figure 2-9. Concentration Alarm Relay
CONNECTING COMMUNICATIONS INTERFACES
ETHERNET CONNECTION
For network or Internet communication with the analyzer, connect an Ethernet cable from
the analyzer’s rear panel Ethernet interface connector to an Ethernet port. Although the
analyzer is shipped with DHCP enabled by default, it should be manually configured with
a static IP address.
Configuration: Section 2.5.10.5
30 Teledyne API T100 Analyzer with NumaView™ Software 083730100 DCN8060
Page 33

USB (OPTION) CONNECTION
Important
IMPACT ON READINGS OR DATA
Cables that appear to be compatible because of matching
internal wiring that makes the link
inoperable. Check cables acquired from sources other than
Teledyne API for pin assignments (Figure 2-10) before using.
The rear panel USB option is for direct communication between the analyzer and a PC.
Connect a USB cable between the analyzer and a computer USB port. Computer and
instrument baud rates must match.
Note
If this option is installed, the rear panel RS232 (COM2) port cannot
be used for anything other than RS-232 Multidrop communication.
RS-232 CONNECTION
For RS-232 communications with data terminal equipment (DTE) or with data
communication equipment (DCE) connect either a DB9-female-to-DB9-female cable
(Teledyne API part number WR000077) or a DB9-female-to-DB25-male cable (Option
60A), as applicable, from the analyzer’s RS-232 port (see Figure 2-10 for connector pin
assignments) to the device. Adjust the rear panel DCE-DTE switch to select DTE or DCE
as appropriate (Section 3.1).
Configuration: Section 3.2.1 and Section 3.4.2 (for Hessen protocol)
connectors may incorporate
Figure 2-10. Rear Panel Connector Pin-Outs for RS-232 Mode
The signals from these two connectors are routed from the motherboard via a wiring
harness to two 10-pin connectors on the CPU card, J11 and J12 (Figure 2-11).
083730100 DCN8060 Teledyne API T100 SO2 Analyzer with NumaView™ Software 31
Page 34

Cables that appear to be compatible because of matching
Check cables acquired from sources other than
Figure 2-11. Default Pin Assignments for CPU COM Port Connector (RS-232)
Teledyne API offers two mating cables, one of which should be applicable for your use.
• P/N WR000077, a DB-9 female to DB-9 female cable, 6 feet long. Allows connection
of the serial ports of most personal computers.
• P/N WR000024, a DB-9 female to DB-25 male cable. Allows connection to the most
common styles of modems (e.g. Hayes-compatible) and code activated switches.
Both cables are configured with straight-through wiring and should require no additional
adapters.
Note
connectors may incorporate internal wiring that makes the link
inoperable.
Teledyne API for pin assignments before using.
To assist in properly connecting the serial ports to either a computer or a modem, there are
activity indicators just above the RS-232 port. Once a cable is connected between the
analyzer and a computer or modem, both the red and green LEDs should be on.
• If the lights are not lit, locate the small switch on the rear panel to switch it between
DTE and DCE modes.
• If both LEDs are still not illuminated, ensure that the cable properly constructed.
Received from the factory, the analyzer is set up to emulate an RS-232 DCE device. (View
these parameters in the Setup>Comm>COM1[COM2] menu).
32 Teledyne API T100 Analyzer with NumaView™ Software 083730100 DCN8060
Page 35

RS-232 (COM1): RS-232 (fixed) DB-9 male connector
separate RS-232 or RS-485 operation.
Failure to use ESD protection when working with electronic
under Help Center > Product
• Baud rate: 115200 bits per second (baud)
• Data Bits: 8 data bits with 1 stop bit
• Parity: None
COM2: RS-232 (configurable to RS 485), DB-9 female connector
• Baud rate:19200 bits per second (baud)
• Data Bits: 8 data bits with 1 stop bit
• Parity: None
RS-232 MULTIDROP (OPTION 62) CONNECTION
When the RS-232 Multidrop option is installed, connection adjustments and configuration
through the menu system are required. This section provides instructions for the internal
connection adjustments, then for external connections, and ends with instructions for
menu-driven configuration.
Note
Because the RS-232 Multidrop option uses both the RS232 and
COM2 DB9 connectors on the analyzer’s rear panel to connect
the chain of instruments, COM2 port is no longer available for
ATTENTION
COULD DAMAGE INSTRUMENT AND VOID WARRANTY
Printed Circuit Assemblies (PCAs) are sensitive to electro-static
discharges too small to be felt by the human nervous system.
assemblies will void the instrument warranty. For information on
preventing ESD damage, refer to the manual, Fundamentals of
ESD, PN 04786, which can be downloaded from our website at
http://www.teledyne-api.com
Manuals in the Special Manuals section.
In each instrument with the Multidrop option there is a shunt jumpering two pins on the
serial Multidrop and LVDS printed circuit assembly (PCA), as shown in Figure 2-12. This
shunt must be removed from all instruments except that designated as last in the multidrop
chain, which must remain terminated. This requires powering off and opening each
instrument and making the following adjustments:
1. With NO power to the instrument, remove its top cover and lay the rear
panel open for access to the Multidrop/LVDS PCA, which is seated on the
CPU.
2. On the Multidrop/LVDS PCA’s JP2 connector, remove the shunt that
jumpers Pins
21 ↔ 22 as indicated in. (Do this for all but the last instrument in the chain
where the shunt should remain at Pins 21 ↔ 22).
083730100 DCN8060 Teledyne API T100 SO2 Analyzer with NumaView™ Software 33
Page 36

3. Check that the following cable connections are made in all instruments
(again refer to Figure 2-12):
• J3 on the Multidrop/LVDS PCA to the CPU’s COM1 connector
(Be aware that the CPU’s COM2 connector is not used in Multidrop)
• J4 on the Multidrop/LVDS PCA to J12 on the motherboard
• J1 on the Multidrop/LVDS PCS to the front panel LCD
Figure 2-12. Jumper and Cables for Multidrop Mode
Note
4. Close the instrument.
5. Referring to Figure 2-13 use straight-through DB9 male DB9 female
cables to interconnect the host RS232 port to the first analyzer’s RS232
port; then from the first analyzer’s COM2 port to the second analyzer’s
RS232 port; from the second analyzer’s COM2 port to the third analyzer’s
RS232 port, etc., connecting in this fashion up to eight analyzers, subject to
the distance limitations of the RS-232 standard.
34 Teledyne API T100 Analyzer with NumaView™ Software 083730100 DCN8060
If you are adding an instrument to the end of a previously
configured chain, remove the shunt between Pins 21
on the Multidrop/LVDS PCA in the instrument that was
previously the last instrument in the chain.
22 of JP2
Page 37

6. On the rear panel of each analyzer, adjust the DCE DTE switch so that the
Analyzer
Analyzer
Analyzer
Last Analyzer
Female DB9
Male DB9
RS-232
COM2
RS-232
COM2
RS-232
COM2
RS-232
COM2
Host
RS
-232 port
Ensure jumper is
installed between
JP2 pins 21 ↔ 22 in
last instrument of
multidrop
chain.
Teledyne API recommends setting up the first link, between the
green and the red LEDs (RX and TX) of the COM1 connector (labeled
RS232) are both lit. (Ensure you are using the correct RS-232 cables
internally wired specifically for RS-232 communication; see Figure 2-11).
Figure 2-13. RS-232 Multidrop PCA Option Host/Analyzer Interconnect Diagram
7. BEFORE communicating from the host, power on the instruments and
check that the user-selectable Instrument ID is unique for each: in the
Setup>Vars menu, check Instrument ID in the list of variables. To change,
highlight the variable and press the Edit button; once changed, press the
Enter button.
8. Next, in the Setup>Comm>COM1 menu (do not use the COM2 menu for
multidrop), use the Edit button to set COM1 Quiet Mode and COM1
Multidrop to ENABLED; then press the Accept button.
9. Also check the COM1 Baud Rate to ensure it reads the same for all
instruments (edit if needed and press the Accept button).
Note
The (communication) Host instrument can address only one
instrument at a time, each by its unique ID (see step 7 above).
Note
Host and the first analyzer, and testing it before setting up the
rest of the chain.
083730100 DCN8060 Teledyne API T100 SO2 Analyzer with NumaView™ Software 35
Page 38

PNEUMATIC CONNECTIONS
(SDS) for this material, and rigorously follow the safety
with brass or stainless steel fittings prior to the reaction cell.
allows gas to build up to levels that will contaminate the
operation and store in sealed container (use the original
for instructions on how to remove the
permeation tube when the unit is not in operation).
This section provides pneumatic connection and setup instructions for basic and optional
configurations. Pneumatic flow diagrams are shown in Section 2.3.3. Calibration
instructions are provided in Section 4.
Before making the pneumatic connections, carefully note the following cautionary and
special messages:
CAUTION – General Safety Hazard
Sulfur Dioxide (SO2) is a toxic gas. Obtain a Safety Data Sheet
guidelines described there.
Vent the exhaust from the analyzer’s internal pump to outside
the immediate area or shelter surrounding the instrument.
Do not vent calibration gas or sample gas into enclosed areas.
Sample and calibration gases should only come into contact
with PTFE (Teflon) or glass tubes and fixtures.
Do not allow sample and calibration gases to come into contact
CAUTION – General Safety Hazard
In units with a permeation tube option installed, vacuum pump
must be connected and powered on to maintain constant gas
flow though the analyzer at all times. Insufficient gas flow
instrument or present a safety hazard to personnel.
Remove the permeation tube when taking the analyzer out of
shipping packaging).
(See Section 5.6.2
36 Teledyne API T100 Analyzer with NumaView™ Software 083730100 DCN8060
Page 39

When any gas (span, zero air, sample) is received from a
pressurized manifold, always provide a vent to equalize the
pressure with the ambient atmosphere before it enters the
not exceed the
Remove dust plugs from rear panel exhaust and supply line
have been made; check all pneumatic fittings for leaks per
leaking is suspected).
ATTENTION
Important
COULD DAMAGE INSTRUMENT AND VOID WARRANTY
Vent Pressurized Gas:
instrument to ensure that the gases input do
instrument’s maximum inlet pressure, as well as to prevent back
diffusion and pressure effects
Remove Dust Plugs:
fittings before powering on the instrument.
Keep dust plugs for reuse in future storage or shipping to prevent
debris from entering the pneumatics.
IMPACT ON READINGS OR DATA
Sample and calibration gases should only come into contact with
PTFE tubing.
Run a leak check once the appropriate pneumatic connections
Section 5.4.12.1 (or Section 5.4.12.2 for detailed check if any
CRITICAL TUBING, PRESSURE, VENTING AND EXHAUST REQUIREMENTS
The requirements presented in this section apply to all pneumatic connection instructions.
All other connection instructions are provided with their respective instrument
configurations in Sections 2.3.2.2 through 2.3.2.5.
Tubing:
• PTFE material
• Outer diameter (OD) minimum ¼” .
• Min/max length 2 meters to 10 meters.
Pressure:
• All Sample gas pressure must be at ambient atmospheric pressure, no greater than
1.0 psig.
Venting (to prevent back diffusion and pressure effects):
• Run tubing outside the enclosure or at least away from immediate area surrounding
the instrument.
Exhaust Outlet:
• Run tubing outside the enclosure.
083730100 DCN8060 Teledyne API T100 SO2 Analyzer with NumaView™ Software 37
Page 40

BASIC CONNECTIONS FROM CALIBRATOR
Source of
SAMPLE GAS
(Remove during
calibration)
VENT
MODEL T701
Zero Gas
Generator
Calibrated
SO2 Gas
at ≥ span gas
concentration
VENT
here if input
is pressurized
Model T700 Gas
Dilution
Calibrator
SAMPLE
EXHAUST
Chassis
Source of
SAMPLE GAS
(Remove during
calibration)
VENT
MODEL T701
Zero Gas
Generator
Calibrated
SO
2
Gas
at
span gas
concentration
VENT
here if input
is pressurized
SAMPLE
EXHAUST
Chassis
Figure 2-14 and Figure 2-15 illustrate pneumatic connections for two of the possible basic
configurations.
Figure 2-14. Gas Line Connections from Gas Dilution Calibrator – Basic Configuration
Figure 2-15. Gas Line Connections from Bottled Span Gas – Basic Configuration
38 Teledyne API T100 Analyzer with NumaView™ Software 083730100 DCN8060
Page 41

For the analyzer’s basic configuration, in addition to tubing, pressure, venting, and exhaust
requirements set out in Section 2.3.2.1, make the following pneumatic connections:
SAMPLE INLET
Connect ¼” gas line not more than 2 m long, from sample gas source to this inlet.
When no zero/span/shutoff valve options, also connect line from calibration gas source to
this inlet, but only when a calibration operation is actually being performed.
EXHAUST OUTLET
Connect exhaust line made of PTEF tubing; minimum O.D ¼”, to this fitting. The exhaust
line should be no longer than 10 meters, and should lead outside the shelter or immediate
area surrounding the instrument.
CALIBRATOR VENTING
Vent the output of the calibrator if calibrator not already vented.
CONNECTIONS W/AMBIENT ZERO/AMBIENT SPAN (Z/S) VALVES (OPT 50A)
This valve package includes:
• two solenoid valves located inside the analyzer that allow the user to switch either
zero, span or sample gas to the instrument’s sensor
• two additional gas inlet ports (ZERO AIR and SPAN1)
Figure 2-16. Rear Panel Layout with Z/S Valve Options (OPT 50A)
083730100 DCN8060 Teledyne API T100 SO2 Analyzer with NumaView™ Software 39
Page 42

VENT
here if input
is pres su rized
So urce of
SAMPL E Gas
PUMP
SAMP LE
EXHA US T
SPA N1
ZE RO A IR
Calibrated NO x
at HIGH Sp an
Co nc ent ratio n
MODEL 700
Ga s Dilut ion
Calibrator
MODEL 701
Zero Gas
Generator
Enclosure Wall
VENT
VENT if Calibrator not already vented.
Figure 2-17. Gas Line Connections with Z/S Valves Option (OPT 50A)
In addition to tubing, pressure, venting, and exhaust requirements set out in Section 2.3.2.1,
attach the following pneumatic lines:
SAMPLE GAS SOURCE
Attach a sample inlet line to the SAMPLE inlet fitting.
• In applications where the sample gas is received from a pressurized manifold, vent
the sample gas line.
CALIBRATION GAS SOURCES
SPAN GAS Attach a gas line from the source of calibration gas (e.g. a Teledyne API's T700
Dynamic Dilution Calibrator) to the SPAN1 inlet.
ZERO AIR Zero air is supplied by the zero air generator such as a Teledyne API's M701.
Attach a gas line from the source of zero air to the ZERO AIR inlet.
VENTING
Vent both the span gas and zero air supply lines.
40 Teledyne API T100 Analyzer with NumaView™ Software 083730100 DCN8060
Page 43

CONNECTIONS W/AMBIENT ZERO/PRESSURIZED SPAN VALVES (OPT 50E)
This calibration valve package is appropriate for applications where span gas is being
supplied from a pressurized source such as bottled NIST SRM gases. This option includes:
• a critical flow orifice and vent to maintain the span gas supply at 1 ATM
• a shutoff valve to preserve the span gas source when it is not in use
• two solenoid valves for the user to switch either zero, span or sample gas to the
instrument’s sensor
• three additional gas inlet ports (ZERO AIR, SPAN and VENT)
Figure 2-18. Rear Panel Layout with Ambient Zero/Pressurized Span Valves (OPT 50E)
083730100 DCN8060 Teledyne API T100 SO2 Analyzer with NumaView™ Software 41
Page 44

VENT
here if input
is pres su rized
SAMPL E Ga s
So urce
PUMP
Chassis
SAMP LE
EXHA US T
SPA N1
Enclosure Wall
SPA N2/VEN T
Calibrated NO
X
at HIGH Span
Co nc entrat io n
ZE RO A IR
Zero Air Scrubber
Figure 2-19. Gas Line Connection w/Ambient Zero/Pressurized Span Valves Option (OPT 50E)
In addition to tubing, pressure, venting, and exhaust requirements set out in Section 2.3.2.1,
attach the following pneumatic lines:
SAMPLE GAS SOURCE
Attach a sample inlet line to the SAMPLE inlet fitting.
• In applications where the sample gas is received from a pressurized manifold, vent
the sample gas line.
CALIBRATION GAS SOURCES
SPAN GAS Attach a gas line from the pressurized source of calibration gas (e.g. a bottle of
ZERO AIR (the dual-stage zero Air Scrubber makes zero air)
VENTING
Vent the SPAN2/VENT outlet.
NISTSRM gas) to the SPAN1 inlet. Use PTFE tubing, minimum O.D ¼”.
42 Teledyne API T100 Analyzer with NumaView™ Software 083730100 DCN8060
Page 45

ZERO SCRUBBER AND INTERNAL SPAN SOURCE (IZS) (OPT 50G)
The internal span gas generator and calibration valve option is intended for applications
where there is a need for frequent automated calibration checks without access to an
external source of span gas. (See the end of this subsection for important information about
“Internal Span Gas Generation”).
This valve package includes:
• an external scrubber filled with activated charcoal that removes SO2 in order to
produce zero air
• a heated enclosure for a permeation tube (This option package DOES NOT
contain an actual permeation tube. Contact Sales for assistance in specifying the
correct permeation tube for each application).
• one additional gas inlet port (ZERO AIR)
• one additional gas outlet port (FROM DRYER)
• two internal valves for switching between the sample gas inlet and the output of
the zero/span subsystem
Figure 2-20. Rear Panel Layout with Internal Span Source (IZS) OPT 50G
083730100 DCN8060 Teledyne API T100 SO2 Analyzer with NumaView™ Software 43
Page 46

VENT
here if input
is pressuri zed
Source of
SAMPLE GAS
PUMP
Enclosure Wall
External Zero
Air Scrubbe
r
Filter
Chassis
SAMPLE
EXHA US T
ZERO AIR
FROM DRYER
PUMP
MODEL 700E
Ga s Dilut ion
Calibrator
Vent here if output of calibrator
is not already vented.
MODEL 701
Zero Gas
Generator
Enclosure Wall
Calibrated NO x
at HI GH Sp an
Co nc ent ratio n
External Zero
Air Scrubbe
r
Filter
Chassis
SAMPLE
EXH A US T
ZERO AIR
FROM D RYER
Figure 2-21. Gas Line Connection w/Zero Scrubber and Internal Span Source (IZS) Option (OPT 50G)
The internal span gas generator utilizes an SO2 permeation tube as a span gas source (see
the “Internal Span Gas Generation” at the end of this section). The accuracy of these
devices is only about ±5%. Whereas this may be sufficient for frequent automated
calibration checks (Figure 2-21), we recommend using certified gases for precise
calibration (Figure 2-22).
44 Teledyne API T100 Analyzer with NumaView™ Software 083730100 DCN8060
Figure 2-22. Pneumatic Connections for Precision Calibration when IZS Generator Present
Page 47

In addition to tubing, pressure, venting, and exhaust requirements set out in Section 2.3.2.1,
attach the following pneumatic lines:
SAMPLE GAS SOURCE
Connect a sample gas line to the SAMPLE inlet, and:
• In applications where the sample gas is received from a pressurized manifold and the
analyzer is not equipped with one of the pressurized span options, a vent must be
placed on the sample gas line.
CALIBRATION GAS SOURCES
• Internal: Uses the IZS generator.
• External (for precision calibration): CAL GAS & ZERO AIR SOURCES: The source
of calibration gas is attached to the SAMPLE inlet.
VENTING
Vent the Sample line if input is pressurized.
INTERNAL SPAN GAS GENERATION
The primary component of the internal span option is a permeation tube containing liquid
As zero air is passed over a permeable membrane on the end of the tube, molecules of
SO
2.
slowly pass through the membrane mixing with the zero air. The speed at which the
SO
2
permeates the membrane is called the effusion rate.
SO
2
The resulting concentration of the span gas is determined by three factors:
• size of the membrane (the larger the area of the membrane, the more permeation
occurs)
• temperature of the SO
the pressure inside the tube, thereby increasing the effusion).
• flow rate of the zero air (if the previous two variables are constant, the permeation
rate of air into the zero air stream will be constant; therefore, a lower flow rate of zero
air produces higher concentrations of SO
(increasing the temperature of the permeation tube increases
2
).
2
The permeation tube enclosure is heated to a constant 50° C (10° above the maximum
operating temperature of the instrument) in order to keep the permeation rate constant. The
IZS heater is controlled by a precise PID (Proportional/Integral/Derivative) temperature
control loop. A thermistor measures the actual temperature and reports it to the CPU for
control feedback.
The flow rate of zero air across the permeation tube is maintained at 50 ± 10 cc/min by a
critical flow orifice located in the analyzer’s exhaust manifold.
Although the factors that influence the resulting span gas concentration can be kept at a
constant, they also can be manipulated, thereby impacting the concentration.
083730100 DCN8060 Teledyne API T100 SO2 Analyzer with NumaView™ Software 45
Page 48

PNEUMATIC FLOW DIAGRAMS
SAMPLE
PRESSURE
SENSOR
FLOW PRESSURE
SENSOR PCA
Chassis
EXHAUST
gas outlet
SAMPLE
gas inlet
UV
LAMP
PMT
REACTION
CELL
PUMP
Particulate
Filter
HYDROCARBON
SCRUBBER
(Kicker)
VACUUM MANIFOLD
FLOW
SENSOR
This section shows the basic pneumatic flow diagram followed by flow diagrams with
options. Tables showing the valve operating states follow each of the flow diagrams with
valve options.
PNEUMATIC FLOW FOR BASIC CONFIGURATION
Figure 2-23. Pneumatics, Basic Configuration
46 Teledyne API T100 Analyzer with NumaView™ Software 083730100 DCN8060
Page 49

PNEUMATIC FLOW FOR ZERO/SPAN VALVES OPTION
FLOW
SENSOR
FLOW / PRESSURE
SENSOR PCA
SAMPLE
PRESSURE
SENSOR
VACUUM MANIFOLD
FLOW
CONTROL
ASSY
EXHAUST TO OUTER
LAYER OF KICKER
SAMPLE/CAL
VALVE
SAMPLE GAS
INLET
ZERO AIR INLET
SPAN 1 INLET
ZERO/SPAN
VALVE
SAMPLE FILTER
Chassis
EXHAUST GAS
OUTLET
KICKER EXHAUST
TO PUMP
HYDROCARBON
SCRUBBER
(KICKER)
UV
LAMP
PMT
SAMPLE
CHAMBER
PUMP
NC
NO
COM
NC NO
COM
STATUS
Figure 2-24. Pneumatics with Zero/Span Valves Option
Table 2-7. Zero/Span and Sample/Cal Valve Operating States
MODE VALVE STATE
SAMPLE
ZERO CAL
SPAN CAL
Sample/Cal Open to SAMPLE inlet NO COM
Zero/Span Open to ZERO AIR inlet NO COM
Sample/Cal Open to ZERO/SPAN valve NC COM
Zero/Span Open to ZERO AIR inlet NO COM
Sample/Cal Open to ZERO/SPAN valve NC COM
Zero/Span Open to SPAN GAS inlet NC COM
VALVE PORT
083730100 DCN8060 Teledyne API T100 SO2 Analyzer with NumaView™ Software 47
Page 50

PNEUMATIC FLOW FOR AMBIENT ZERO/PRESSURIZED SPAN OPTION
STATUS
Sample/Cal
Open to SAMPLE inlet
NO COM
Zero/Span
Open to ZERO AIR inlet
NO COM
Span Shutoff
Closed
Zero Air Shutoff
Closed
NO COM
Span Shutoff
OPEN
NC COM
Span Shutoff
Closed
Zero Air Shutoff
OPEN
Figure 2-25. Pneumatics with Ambient Zero/Pressurized Span Valves Option
Table 2-8. Valve Operating States for Ambient Zero/Pressurized Span Option
MODE
SAMPLE
ZERO CAL
SPAN CAL
Sample/Cal Open to ZERO/SPAN valve
Zero/Span Open to ZERO AIR inlet
Sample/Cal Open to ZERO/SPAN valve
Zero/Span Open to SPAN inlet
VALVE STATE
Zero Air Shutoff1
Closed
VALVE PORT
NC COM
NC COM
48 Teledyne API T100 Analyzer with NumaView™ Software 083730100 DCN8060
Page 51

PNEUMATIC FLOW FOR INTERNAL ZERO/SPAN (IZS) GAS GENERATOR OPTION
EXHAUST TO OUTER LAYER
OF KICKER
VACUUM MANIFOLD
CRITICAL
FLOW
ORIFICE
CRITICAL
FLOW
ORIFICE
ZERO AIR
SCRUBBER
SAMPLE/CAL
VALVE
Chassis
EXHAUST GAS
OUTLET
SAMPLE GAS
INLET
KICKER EXHAUST
TO PUMP
HYDROCARBON
SCRUBBER
(KICKER)
ZERO AIR INLET
UV
LAMP
PMT
SAMPLE
CHAMBER
FLOW
SENSOR
FLOW / PRESSURE
SENSOR PCA
SAMPLE
PRESSURE
SENSOR
PUMP
IZS
Permeation
Tube
SO2 Source
ZERO/SPAN
VALVE
SAMPLE FILTER
NC
NO
COM
NC
NO
COM
STATUS
Sample/Cal
Open to SAMPLE inlet
NO COM
Figure 2-26. Pneumatics with IZS Option
Table 2-9. IZS Valve Option Operating States
MODE VALVE STATE
SAMPLE
ZERO CAL
SPAN CAL
Zero/Span Open to ZERO AIR inlet NO COM
Sample/Cal Open to ZERO/SPAN valve NC COM
Zero/Span Open to ZERO AIR inlet NO COM
Sample/Cal Open to ZERO/SPAN valve NC COM
Zero/Span Open to SPAN GAS inlet NC COM
Note
The permeation tube is not included in the IZS Option and must
VALVE PORT
be ordered separately.
083730100 DCN8060 Teledyne API T100 SO2 Analyzer with NumaView™ Software 49
Page 52

PNEUMATIC FLOW WITH O2 SENSOR OPTION
FLOW PRESSURE
SENSOR PCA
Chassis
with O
2
Sensor Option
EXHAUST
GAS OUTLET
UV
LAMP
PMT
REACTION
CELL
Particulate
Filter
HYDROCARBON
SCRUBBER
(Kicker)
VACUUM MANIFOLD
O
2
Sensor
Flow Control
O2
Sensor
SAMPLE
GAS INLET
PUMP
SAMPLE
PRESSURE
SENSOR
FLOW
SENSOR
shows the internal, pneumatic connections for the analyzer with the oxygen (O2) sensor
option installed. Pneumatically, the O
the normal sample flow rate. It is separately controlled with its own critical flow orifice.
sensor draws a flow of 80 cm³/min in addition to
2
Figure 2-27. Pneumatics with O2 Sensor
STARTUP, FUNCTIONAL CHECKS AND CALIBRATION
We recommend reading Section 6 to become familiar with the principles of operation.
50 Teledyne API T100 Analyzer with NumaView™ Software 083730100 DCN8060
When the instrument is first started (Section 2.3.4.1), check its functionality (Section
2.3.4.3) and run an initial calibration (Section 2.3.4.4). Section 2.4 introduces the menu
system, and Section 2.5 provides setup/customization instructions.
Page 53

STARTUP
Upon initial startup, a sequence of status screens (Figure 2-28) appear prior to the Home
page (Figure 2-29).
Figure 2-28. Status Screens at Startup
Upon any startup, this instrument should warm up for approximately one hour before
reliable measurements can be taken.
Figure 2-29. Home Page Example
083730100 DCN8060 Teledyne API T100 SO2 Analyzer with NumaView™ Software 51
Page 54

ALERTS: WARNINGS AND OTHER MESSAGES
Because internal temperatures and other conditions may be outside the specified limits
during the warm-up period, the software will suppress most Alerts for 30 minutes after
power up. The Alerts page (Figure 2-30) shows the status of any active warning conditions
or user-configured Events. (Section 2.4.3 provides more detailed information about Alerts,
and Section 2.5.2 addresses Events).
Alerts can be viewed and cleared via either the Alerts menu or the Alerts shortcut (Caution
symbol, bottom right corner of the screen). Although these alerts can be cleared from the
Active Alerts page, a history of all alerts remains in the Utilities>Alerts Log page.
Figure 2-30. Viewing Active Alerts Page
If alerts of warning conditions persist after the warm up period or after being cleared,
investigate their cause using the troubleshooting guidelines in Section 5.7.
52 Teledyne API T100 Analyzer with NumaView™ Software 083730100 DCN8060
Page 55

FUNCTIONAL CHECKS
After warm-up, verify that the software properly supports any hardware options that are
installed (Setup>Instrument menu), and that the instrument is functioning within allowable
operating parameters. Check the Dashboard page against the instrument’s Final Test and
Validation Data sheet, which lists these values as they appeared before the instrument left
the factory.
through the Setup>Dashboard menu to add them; see Section 2.4.2).
These functions are also useful tools for diagnosing problems (information provided in
Section 5.7.2).
(If any functional parameters are not displayed, configure the Dashboard
Figure 2-31. Sample Dashboard Page
CALIBRATION
Before operation begins, the analyzer requires zero and span calibrations, and possibly
HVPS adjustment. Also, any time an analyzer is moved or its configuration changed, it
must be calibrated. The method for performing a calibration differs slightly depending on
whether or not any of the available internal zero air or valve options are installed. Follow
the appropriate calibration instructions presented in Section 4.
083730100 DCN8060 Teledyne API T100 SO2 Analyzer with NumaView™ Software 53
Page 56

MENU OVERVIEW
MENU
DESCRIPTION
LOCATION
)
he Utilities>USB Utilities
customized triggers for data logging functions.
can
Events are predefined and are not editable.
parameters.
specific operational parameters.
(Figure 2-32).
conditions or custom Events.
chart recorder and/or the data logger.
*Time Zone change requires special procedures (Section 5.5).
Table 2-10 describes the main menus and provides cross-references to the respective
sections with configuration details.
Table 2-10. Menu Overview
Home
Dashboard
Alerts
Calibration
Utilities
Setup
View and plot concentration readings and other selectable parameter
values (Figure 2-33).
View user-selected parameters and their values, some of which can be
displayed in a live-plot graph (Figure 2-34).
View and clear active Alerts that were triggered by factory-defined Events
as well as user-defined Events. (Active and past Alerts are recorded in
the Utilities>Alerts Log).
Run calibrations or calibration checks on the SO
gas sensor if installed).
View logs, download data and firmware updates, copy configurations
between instruments, and run diagnostics.
Configure a variety of features and functions through these submenus for
customized operation.
Track and record concentration and calibration data and
selectable diagnostic parameters, the reports for which can
be viewed in the Utilities>Datalog View menu (Section 2.4.5
Datalogging
Events
and downloaded to a flash drive via t
menu (Section 2.4.5).
Also, select configured Events (Section 2.5.2
Select parameters and define the conditions by which they
are to be flagged and recorded in the Alerts log (Section
) when they are triggered. Once configured, Events
2.4.3
be used to trigger Datalogs. (Section 2.5.1). Note that some
channel (and second
2
) and create
Section 2.4.1
Section 2.4.2
Section 2.4.3
Sections 2.4.4
and 4
Section 2.4.5
Section 2.5
Section 2.5.1
Section 2.5.2
Dashboard
Auto Cal
(with valve options)
Vars
Homescreen
Digital
Outputs
Analog
Outputs
Instrument
Comm View and configure network and serial communications. Section 2.5.10
54 Teledyne API T100 Analyzer with NumaView™ Software 083730100 DCN8060
Monitor instrument functionality (Figure 2-31
When zero/span valve options installed, configure
sequences for automatic calibration functions.
Manually adjust several software variables that define
Select up to three parameters to be displayed in the meters
Map the rear-panel digital outputs to a variety of signals
present in the instrument to monitor the status of operating
Send user-selected parameter readings in the form of userdefined voltage or current loop signals as outputs to a strip
View product and system information, including list of
options, if any; view network settings; view/adjust Date and
Time settings*; and check for firmware updates when
connected to a network that is connected to the Internet.
) via selectable
Section 2.5.3
Section 4.3
Section 2.5.5
Section 2.5.6
Section 2.5.7
Section 2.5.8
Section 2.5.9
Page 57

HOME PAGE
Figure 2-32 presents an orientation to the main display screen; Figure 2-33 shows that
pressing the gas name or its concentration value or a meter below displays a live plot of
their respective readings. Section 2.5.6 provides configuration instructions.
Figure 2-32. User Interface Orientation
083730100 DCN8060 Teledyne API T100 SO2 Analyzer with NumaView™ Software 55
Page 58

Figure 2-33. Concentration and Stability Graph (top) and Meter Graph (bottom)
56 Teledyne API T100 Analyzer with NumaView™ Software 083730100 DCN8060
Page 59

DASHBOARD
The Dashboard displays an array of user-selectable parameters and their values (Section
2.5.3 provides configuration instructions). If there is a graphing icon in the upper right
corner of a parameter, pressing that parameter displays a live plot of its readings as in
Figure 2-34.
Figure 2-34. Dashboard Page
083730100 DCN8060 Teledyne API T100 SO2 Analyzer with NumaView™ Software 57
Page 60

ALERTS
Alerts are notifications triggered by specific criteria having been met by either factorydefined conditions (standard and not editable) or user-defined Events (Section 2.5.2). The
Active Alerts page shows the status of any active warning conditions or Events that have
been triggered.
When Alerts are triggered, a caution symbol appears in both the Alerts menu tab and in the
bottom right corner of the software interface, which serves as a shortcut to the Alerts page
from any other page. View a list of currently active Alerts by pressing either the Alerts
menu on the Home screen or by pressing the Alerts shortcut (Figure 2-35).
While Alerts can be cleared from the Active Alerts page, they remain recorded in the
Utilities>Alerts Log menu.
Figure 2-35. Navigating to the Active Alerts Page
Alerts can be configured as either latching (appears in Active Alerts screen when Event is
triggered and must be cleared by the user) or non-latching (Active Alerts screen
continuously updates based on the Event criteria, clearing on its own). See Section 2.5.2.
To clear Alerts from the Active Alerts page, either check individual boxes to choose
specific Alerts, or check the Select All box to choose all Alerts, then press the Clear
Selected button.
58 Teledyne API T100 Analyzer with NumaView™ Software 083730100 DCN8060
Page 61

When all Alerts are cleared, the Alerts menu tab no longer shows the caution symbol, and
a green LED replaces the caution symbol in the bottom right corner of the interface (Figure
2-36). However, Alerts can reappear if the conditions causing them are not resolved. For
troubleshooting guidance, refer to Section 5.7.
Figure 2-36. Active Alerts Cleared
Alerts and Events remain recorded in the Utilities>Alerts Log (Figure 2-37).
Figure 2-37. Utilities>Alerts Log of Active and Past Alerts and Events
CALIBRATION
The Calibration menu is used for multipoint calibrations and for external calibration with
valve options installed. Calibration procedures are presented in Section 4.
083730100 DCN8060 Teledyne API T100 SO2 Analyzer with NumaView™ Software 59
Page 62

UTILITIES
MENU
Alerts Log
USB Utilities
• download a basic operation functionality report (Section 5.3).
Diagnostics
(DAS), by configuring the Data Logger in the
calibration can be activated remotely when an external source is
configured in the
The Utilities menu has a variety of functions as described next in Table 2-11.
Table 2-11. Utilities Submenu Descriptions
UTILITIES
Datalog View
DESCRIPTION
Displays the data logs that were configured via the Setup>Data Logging menu. From this list
a log can be selected and filters applied to view the desired data. (For details on setting up and
running the Data Logger, see Section 2.5.1).
Displays a history of alerts that are triggered by factory-defined and user-defined Events, such
as warnings and alarms (See Section 2.5.2 for Events configuration).
Serves multiple purposes using a flash drive connected to the instrument’s front panel USB
port:
• download data from the instrument’s Data Acquisition System (DAS), the Data Logger, to
a flash drive (Section 2.5.1.3)
• update firmware (Section 5.3)
• transfer instrument configuration from/to other same-model instruments (Section 2.6)
Provides access to various pages that facilitate troubleshooting.
Analog Inputs Measure voltage signals of several analog input parameters, including
those from other instrumentation when the External Analog Inputs Option
(Section 2.3.1.2
acquisition system
Setup>Data Logging menu (Section 2.5.1).
Analog Outputs Show the voltage signals for the functions selected and configured in the
Setup>Analog Outputs menu (Section 2.5.8). Rear panel connections
were presented in Section 2.3.1.3.
Digital Inputs Show whether specific available features are turned ON or OFF; for
example, whether or not Maintenance Mode input or Language selection
can be controlled through the front panel, or whether a zero or span
) is installed. These can be logged in the internal data
connected to the rear panel Control In connector (Section 2.3.1.6).
Digital Outputs Show the function of user-specified parameters
Setup>Digital Outputs menu (Section 2.5.7).
Flow Cal Used to calibrate the sample gas flow reading with actual flow measured
by an external device. (See Section 5.6.6.3).
OE Test Used to run either an electrical test (ETest) or an optics test (OTest)
(Section 5.7.8.10).
SETUP
The Setup menu is used to configure the instrument’s software features, gather information
on the instrument’s performance, and configure and access data from the Datalogger, the
instrument’s internal data acquisition system (DAS). Section 2.5 provides details for the
menus under Setup.
60 Teledyne API T100 Analyzer with NumaView™ Software 083730100 DCN8060
Page 63

SETUP MENU: FEATURES/FUNCTIONS CONFIGURATION
Use the Setup menu to configure the instrument’s software features, to gather information
on the instrument’s performance, and to configure and access data from the Datalogger,
the instrument’s internal data acquisition system (DAS). Once the setups are complete, the
saved configurations can be downloaded to a USB drive through the Utilities>USB
Utilities menu and uploaded to other instruments of the same model (Section 2.6).
SETUP>DATA LOGGING (DATA ACQUISITION SYSTEM, DAS)
The Datalogger can be configured to capture and store user-defined data, which then can
be viewed in the Alerts page, if elected, as well as downloaded from the instrument to a
USB flash drive for examination and analysis.
Figure 2-38 shows a new log; Figure 2-39 shows a sample existing log, which can be edited
or deleted, and Figure 2-40 provides illustrated instructions for setting up a new log, with
Sections 2.5.1.1 and 2.5.1.2 providing additional details.
To transfer captured instrument data to a flash drive see Section 2.5.1.3.
Figure 2-38. Datalog Configuration, New Log Page
Figure 2-39. Datalog Configuration, Existing Log
083730100 DCN8060 Teledyne API T100 SO2 Analyzer with NumaView™ Software 61
Page 64

Figure 2-40. Creating a New Data Log
The parameters available in the list of Log Tags include the names of Events configured in
the Events page (Section 2.5.2).
62 Teledyne API T100 Analyzer with NumaView™ Software 083730100 DCN8060
Page 65

CONFIGURING TRIGGER TYPES: PERIODIC
The Periodic trigger is a timer-based trigger that is used to log data at a specific time
interval. Periodic Trigger requires an interval that is set to number of minutes and a start
time that is set to date and clock time.
Figure 2-41. Datalog Periodic Trigger Configuration
083730100 DCN8060 Teledyne API T100 SO2 Analyzer with NumaView™ Software 63
Page 66

CONFIGURING TRIGGER TYPES: CONDITIONAL
Conditional Trigger tracks/records data for user-selected parameters that meet specified
conditions.
Figure 2-42. Datalog - Conditional Trigger Configuration
DOWNLOADING DAS (DATA ACQUISITION SYSTEM) DATA
To download DAS data collected by the Datalogger from the instrument to a flash drive,
navigate to the Utilities>USB Utilities>DAS Download menu.
1. Insert a flash drive into a front panel USB port and wait for the Status field to indicate
that the drive has been detected; available buttons will be enabled.
Figure 2-43. DAS Download Page
2. Select all or define a period from which to download the collected data.
3. Press the Download button, and when complete, as indicated in the Status
field, press the Done button (changed from “Cancel”) and remove the flash
drive.
64 Teledyne API T100 Analyzer with NumaView™ Software 083730100 DCN8060
Page 67

SETUP>EVENTS
Events are occurrences that relate to any operating function, and are used to define the
conditions that can be set to trigger Alerts (Section 2.4.3). Events can provide diagnostic
information about the instrument, typically referred to as “Warnings”, or they can provide
other information on instrument functionality, such as concentration alarms. Some Events
are standard and not editable while others are user-configurable, described here. Existing
Events are listed in the Events page (Figure 2-44) under the Setup menu.
Figure 2-44. Events List
Access the Events Configuration page either from the Active Alerts page (Alerts Menu) by
pressing the configuration button, or through the Home>Setup>Events menu (Figure 2-44).
Press ADD to create a new Event (refer to Figure 2-45 for details), or select an existing
Event to either Edit or Delete it (Figure 2-47).
Figure 2-45. Event Configuration
083730100 DCN8060 Teledyne API T100 SO2 Analyzer with NumaView™ Software 65
Page 68

• allows the choice of whether to track and record the Event (uncheck this
box to “turn off” or deactivate the Event without deleting it). An Event must be enabled
in order to use the Visible and the Latching options.
• allows the choice of whether or not to display the Event in the Alerts
page when it is triggered (it will still be recorded and can be viewed in the
Utilities>Alerts Log).To use this option, the Event must be enabled.
• allows the choice of whether or not to keep an Event visible even if the
conditions that triggered it were to correct themselves. (Latching requires that the
user interact with the Active Alerts screen to manually clear the Alert and internal
Event state. Non-latching allows the entry in the Active Alerts screen and the internal
Event state to continuously update based on the Event criteria, requiring no user
interaction to clear the Alert or Event state).
Figure 2-46. Configured Event Sample
EDITING OR DELETING EVENTS
Select an Event from the list (Figure 2-44) and press the Edit button to view or edit the
details (Figure 2-46), or press the Delete button to delete the Event.
Figure 2-47. Edit or Delete an Event
66 Teledyne API T100 Analyzer with NumaView™ Software 083730100 DCN8060
Page 69

USING EVENTS AS TRIGGERS FOR DATA LOGGING
Events can also be used to create customized triggers for data logging functions. The name
entered in the Name field of the Events Configuration page will appear in the list of Log
Tags of the Datalog Configuration page. The Data Logger is presented in Section 2.5.1.
SETUP>DASHBOARD
Figure 2-48. Dashboard Display and Configuration
083730100 DCN8060 Teledyne API T100 SO2 Analyzer with NumaView™ Software 67
Page 70

SETUP>AUTOCAL (WITH VALVE OPTION)
VARIABLE
DESCRIPTION
of these variables appear in your instrument’s Vars menu.
Report Upload
frequency (in hours) set in the Report Upload Interval var.
Daylight Savings Enable
Setup>Instrument>Date/Time Settings)
compensate for diluted sample gas, such as in
on the instrument’s front panel display and
appropriately lower actual concentration.
Dynamic Zero Enable
when performing a zero point calibration during an AutoCal (Section 4.3).
response when performing a span point calibration during an AutoCal
(Section 4.3).
and reset instrument commands. This feature is of particular use for
instruments connected to Multidrop (2.3.1.8) or Hessen protocol networks.
when applying MODBUS or Hessen protocols (see Setup>Comm).
Range
Preamp physical ranges. (Section 4.1.5 provides more information).
Auto Cal is available with installed valve options (see Section 4.3).
SETUP>VARS
Vars are software variables that define operational parameters automatically set by the
instrument’s firmware, and are user-adjustable through this menu. Access the menu to see
the list of variables (Vars); select a Var to view its description; touch the Edit button to
change its setting(s). Table 2-12 describes some of the Vars.
Table 2-12. Typical Variables with Descriptions
NOTE: This list includes several of the most common Vars; selecting any Var in the NumaView™ software interface
will display its description in the information field to its right. Depending on configuration, some, all, or more
Background Periodic
Dilution Factor Option
Dynamic Span Enable
Allow a periodic report to be automatically uploaded to cloud service at a
Enable or disable Daylight Savings Time (also see
Sets the instrument to
continuous emission monitoring (CEM) where the quality of gas in a smoke
stack is being tested and the sampling method used to remove the gas from
the stack dilutes the gas. Once the degree of dilution is known, this feature
allows the user to add an appropriate scaling factor to the analyzer’s SO
concentration calculations so that the undiluted values for measurement range
and concentration are shown
reported via the instrument’s various outputs.
1. Set the appropriate units of measure (Setup>Vars>User Units).
2. Select the reporting range mode (Setup>Vars>Range Mode) and set the
reporting range upper limit (Setup>Analog Output). Ensure that the
upper span limit entered for the reporting range is the maximum
expected concentration of the undiluted gas.
3. Set the dilution factor as a gain, e.g., a value of 20 means 20 parts
diluent and 1 part sample gas (Setup>Vars>Dilution Factor).
4. Calibrate the analyzer; ensure that the calibration span gas is either
supplied through the same dilution system as the sample gas or has an
Dynamic zero automatically adjusts offset and slope of the SO2 response
Dynamic span automatically adjusts the offsets and slopes of the SO2
2
Enable Software
Maintenance Mode
Instrument ID
Max Concentration
68 Teledyne API T100 Analyzer with NumaView™ Software 083730100 DCN8060
Set instrument to continue sampling, while ignoring calibration, diagnostic,
Set unique identifier number for the instrument when it is connected with
other instruments in multidrop configuration or on the same Ethernet LAN, or
Set the highest concentration expected, as this is used by the CPU to adjust
Page 71

VARIABLE
DESCRIPTION
PRIGAS Precision
Sets the number of significant digits to the right of the decimal point display
secondary gas)
ensure that Max Concentration Range has been set).
System Hours
Total system runtime hours
feature (For information on TPC, see Section 6.6.3).
User Conc Units
Change the concentration units of measure.
of primary gas concentration and stability values. (SECGAS Precision for
Range Mode
TPC Enable
To select a parameter (“tag”) for display in each of the three meters at the bottom of the
Home page, navigate to the Homescreen configuration page through either the
Setup>Homescreen menu or from Home page using the configuration icon (Figure 2-49).
Controls range mode, single (SNGL) or dual (DUAL). (When set to DUAL,
Enables or disables the Temperature and Pressure Compensation (TPC)
SETUP>HOMESCREEN
Figure 2-49. Homescreen Configuration
An orientation to the Homescreen was presented in Section 2.4.1, including Figure 2-32
and Figure 2-33.
083730100 DCN8060 Teledyne API T100 SO2 Analyzer with NumaView™ Software 69
Page 72

SETUP>DIGITAL OUTPUTS
Specify the function of each digital output (connected through the rear panel STATUS
connector) by mapping the output to a selection of “Signals” present in the instrument.
Create custom “Signals” in the Setup>Events menu (Section 2.5.2). (If the Motherboard
Relay Option was installed, the four additional relays can also be mapped).
To map Digital Outputs to Signals, select a pin in the Outputs list, then make a selection
from the Signals list and press the Map button; if/as needed, change the polarity by pressing
the Polarity button. Save any changes by pressing the Apply button, or discard the changes
by pressing the Home or the back button (a pop-up provides a warning that the changes
will be lost, and will prompt for confirmation to apply changes or not).
Go to the Utilities>Diagnostics>Digital Outputs menu to change the state (ON/OFF) of
individual digital outputs.
Figure 2-50. Digital Outputs Setup
70 Teledyne API T100 Analyzer with NumaView™ Software 083730100 DCN8060
Page 73

SETUP>ANALOG OUTPUTS
Map the four user-configurable Analog Outputs to any of a wide variety of “Signals”
present in the instrument and customize their respective configurations.
Figure 2-51. Analog Output Configuration Example
Refer to Figure 2-51 for the following:
• Signal Out: select a Signal for the output.
• Min/Max: edit minimum and maximum values associated with the selected Signal.
• Calibration Type:
• AUTO for group calibration (Figure 2-52) of the analog outputs (cannot be
selected when Current is selected for the Range)
• MANUAL for individual calibration (Figure 2-53) of analog outputs where manual
adjustments can be made (the only calibration type allowed when Current is
selected for the Range). See Sections 2.5.8.1 and 2.5.8.2 .
• Range: assign a voltage or select Current (refer to Table 2-13).
• Recorder Offset: add a zero offset for recording slightly negative readings from noise
around the zero point.
• Allow Overrange: check to allow a ± 5% over-range; uncheck to disable over-range if
the recording device is sensitive to excess voltage or current.
083730100 DCN8060 Teledyne API T100 SO2 Analyzer with NumaView™ Software 71
Page 74

RANGE1
RANGE SPAN
MINIMUM OUTPUT
MAXIMUM OUTPUT
100mV
1V
Figure 2-52. Analog Outputs Group Calibration Screen
Figure 2-53. Analog Outputs Manual Calibration Screen (AOUT2 Example)
Table 2-13. Analog Output Voltage/Current Range
0-100 mVDC -5 mVDC 105 mVDC
0-1 VDC -0.05 VDC 1.05 VDC
5V
10V
Current2
1
Each range is usable from -5% to +5% of the rated span.
2
While these are the physical limits of the current loop modules, typical applications use 2-20 mA or 4-20
mA for the lower and upper limits.
0-5 VDC -0.25 VDC 5.25 VDC
0-10 VDC -0.5 VDC 10.5 VDC
0-20 mA 0 mA 20 mA
For manual calibration adjustments, see Section 2.5.8.1 for voltage and Section 2.5.8.2 for
current.
72 Teledyne API T100 Analyzer with NumaView™ Software 083730100 DCN8060
Page 75

MANUAL CALIBRATION OF VOLTAGE RANGE ANALOG OUTPUTS
V
+DC Gnd
Recording
Device
V IN +
V IN -
ANALYZER
V OUT +
V OUT -
Volt
Meter
MINIMUM
It is possible to manually calibrate the voltages by using a voltmeter connected across the
output terminals (Figure 2-54) and changing the output signal level in the Manual Adjust
field of the Analog Outputs Calibration screen (Figure 2-53). Refer to Table 2-14 for
voltage tolerances.
Figure 2-54. Setup for Checking / Calibrating DCV Analog Output Signal Levels
Table 2-14. Voltage Tolerances
FULL SCALE
0.1 VDC ±0.0005V 90 mV ±0.001V 0.02 mV
1 VDC ±0.001V 900 mV ±0.001V 0.24 mV
5 VDC ±0.002V 4500 mV ±0.003V 1.22 mV
10 VDC ±0.004V 4500 mV ±0.006V 2.44 mV
ZERO
TOLERANCE
SPAN VOLTAGE
SPAN
TOLERANCE
ADJUSTMENT
(1 count)
083730100 DCN8060 Teledyne API T100 SO2 Analyzer with NumaView™ Software 73
Page 76

MANUAL ADJUSTMENT OF CURRENT RANGE ANALOG OUTPUTS
mADC
IN OUT
Recording
Device
I IN +
I IN -
ANALYZER
I OUT +
I OUT -
Current
Meter
Do not exceed 60 V peak voltage between current loop
outputs and instrument ground.
These instructions assume that the Current Loop Option is installed (Section 2.3.1.4).
This
option places circuitry in series with the output of the D-to-A converter on the
motherboard that changes the normal DC voltage output to a 0-20 milliamp signal.
Adjusting the signal zero and span levels of the current loop output is done by raising or
lowering the voltage output of the D-to-A converter circuitry on the analyzer’s
motherboard. This raises or lowers the signal level produced by the current loop option
circuitry.
The software allows this adjustment to be made in 100, 10 or 1 count increments. Since
the exact amount by which the current signal is changed per D-to-A count varies from
output-to-output and instrument–to–instrument, you will need to measure the change in the
signal levels with a separate, current meter placed in series with the output circuit. See
Figure 2-5 for pin assignments and diagram of the analog output connector.
CAUTION!
Figure 2-55. Setup for Checking / Calibration Current Output Signal Levels
An alternate method for measuring the output of the Current Loop converter is to connect
a 250 ohm ±1% resistor across the current loop output in lieu of the current meter (see
Figure 2-5 for pin assignments and diagram of the analog output connector). This allows
the use of a voltmeter connected across the resistor to measure converter output as VDC or
mVDC.
74 Teledyne API T100 Analyzer with NumaView™ Software 083730100 DCN8060
Page 77

V
+DC Gnd
Recording
Device
V IN
+
V IN
-
ANALYZER
V OUT +
V OUT
-
250
Ω
Volt
Meter
MENU
DESCRIPTION
Figure 2-56. Alternative Setup Using 250Ω Resistor for Checking Current Output Signal Levels
In this case, follow the procedure above but adjust the output for the following values:
Table 2-15. Current Loop Output Check
% FS Voltage across Resistor for 2-20 mA Voltage across Resistor for 4-20 mA
0 500 mVDC 1000 mVDC
100 5000 mVDC 5000 mVDC
SETUP>INSTRUMENT
As presented in Table 2-16, view product and system information and network settings,
edit network settings, and perform certain maintenance tasks.
Table 2-16. Setup>Instrument Menu
Product Info View Model, Part, and Serial Numbers and Package and Driver
Versions, and options information.
System Info View Windows and RAM information.
Network Settings View the network settings (configurable through the
Setup>Comm>Network Settings menu).
Date/Time Settings Adjust date, hour, and minutes, select a time zone*, and set the system
clock to automatically adjust for Daylight Savings Time or not. (Also see
Setup>Vars>Daylight Savings Enable). *Time Zone change requires a
special procedure; see Maintenance Section 5.5.
NTP Time Settings Configure Network Time Protocol settings for clock synchronization.
Language Select an available language.
Remote Update When an instrument is connected to a network that is connected to the
Internet, follow the instructions on this Remote Update page to check for
and activate software/firmware updates. (Also refer to Section 5.3).
083730100 DCN8060 Teledyne API T100 SO2 Analyzer with NumaView™ Software 75
Page 78

SETUP>COMM (COMMUNICATIONS)
MODE
DESCRIPTION
Modem Connection
Modem Init String
This menu is for specifying the various communications configurations.
COM1/COM2
Configure the instrument’s COM1 or COM2 ports to operate in modes listed in Table 2-17.
Table 2-17. COM1/COM2 Configuration
Baud Rate
Command Prompt
Display
Data Bits
Echo and Line
Editing
Handshaking Mode
Hardware Error
Checking
Hardware FIFO
Multidrop
Parity
Protocol
Quiet Mode
RS-485
Security
Stop bits
Set the baud rate for the COM1 or COM2 port being configured.
Enable/disable a command prompt to be displayed when in terminal mode.
Set the data bits to 7 or 8 (typically set in conjunction with Parity and Stop bits).
Enable/disable character echoing and line editing.
Choose SOFTWARE handshaking for data flow control (do NOT use
SOFTWARE handshaking mode when using MODBUS RTU for Protocol mode;
select only HARDWARE or OFF for MODBUS RTU),
or HARDWARE for CTS/RTS style hardwired transmission handshaking. (This
style of data transmission handshaking is commonly used with modems or
terminal emulation protocols).
Or choose to turn OFF handshaking.
Enable/disable hardware error checking.
Enable/disable the hardware First In – First Out (FIFO) for improving data transfer
rate for that COM port.
Select either a modem connection or a direct cable connection.
Input an initialization string to enable the modem to communicate.
Enable/disable multidrop mode for multi-instrument configuration on a single
communications channel. Multidrop requires a unique ID for each instrument in
the chain (Setup>Vars>Instrument ID).
Select odd, or even, or no parity (typically set in conjunction with Data Bits and
Stop Bits).
Select among the communications protocols: TAPI, Hessen, MODBUS RTU, or
MODBUS ASCII (MODBUS: Section 3.4.1; Hessen: Section 3.4.2).
Enable/disable Quiet mode, which suppresses any feedback from the analyzer
(such as Alerts) to the remote device and is typically used when the port is
communicating with a computer program where such intermittent messages might
cause communication problems.
Such feedback is still available, but a command must be issued to receive them.
Enable/disable the rear panel COM2 Port for RS-485 communication. RS-485
mode has precedence over Multidrop mode if both are enabled. Also, RS-485
configuration disables the rear panel USB port.
Enable/disable the requirement for a password for this serial port to respond. The
only command that is active is the request-for-help command (? CR).
Select either 0 or 1 stop bit (typically set in conjunction with Parity and Data bits).
76 Teledyne API T100 Analyzer with NumaView™ Software 083730100 DCN8060
Page 79

TCP PORT1
TCP Port1 allows choosing whether or not to display the command prompt, editing the
Port 1 number for defining the terminal control port by which terminal emulation software
addresses the instrument, such as Internet or NumaView™ Remote software, and enabling
or disabling security on this port.
TCP PORT2
TCP Port2 is configured with the port number for MODBUS.
TCP PORT3
TCP Port3 is configured with the port number for Hessen.
NETWORK SETTINGS
The Setup>Comm>Network Settings menu is for Ethernet configuration. The address
settings default to automatic configuration by Dynamic Host Configuration Protocol
(DHCP). Most users will want to configure the instrument with a static IP address: click
the Static radio button to manually assign a static IP address (consult your network
administrator, and see Table 2-18 for information).
Figure 2-57. Communications Configuration, Network Settings
083730100 DCN8060 Teledyne API T100 SO2 Analyzer with NumaView™ Software 77
Page 80

Table 2-18. LAN/Ethernet Configuration Properties
PROPERTY
DESCRIPTION
IP address
Subnet Mask
Default
Gateway
A string of four packets of 1 to 3 numbers each (e.g. 192.168.76.55.) is the
internet protocol address of the instrument itself.
A string of four packets of 1 to 3 numbers each (e.g. 255.255.252.0) number
that masks an IP address, and divides the IP address into network address and
host address and identifies the LAN to which the device is connected. All
addressable devices and computers on a LAN must have the same subnet
mask. Any transmissions sent to devices with different subnets are assumed to
be outside of the LAN and are routed through the gateway computer onto the
Internet.
A string of numbers very similar to the Instrument IP address (e.g.
192.168.76.1.) that is the address of the computer used by your LAN and serves
as a router to access the Internet or another network.
TRANSFERRING CONFIGURATION TO OTHER
INSTRUMENTS
Once an instrument is configured, the same configuration can be copied to other
instruments of the same Model. This encompasses essentially anything the user can
configure and does not apply to instrument-specific settings such as those that are
configured at the factory for calibration.
Figure 2-58. Configuration Transfer
1. In the source instrument, go to the Home>Utilities>USB Utilities>General
page.
2. Insert a flash drive into either of the two front panel USB ports.
3. When the Status field indicates that the USB drive has been detected, press
the “Download Configuration from Instrument” Start button.
78 Teledyne API T100 Analyzer with NumaView™ Software 083730100 DCN8060
Page 81

4. When the Status field indicates that the download is complete, remove the
flash drive.
5. In the target instrument, go to the Home>Utilities>USB Utilities>General page.
6. Insert a flash drive into either of the two front panel USB ports.
7. When the Status field indicates that the USB drive has been detected, press
the “Upload Configuration to Instrument” Start button.
8. When the Status field indicates that the upload is complete, remove the flash
drive.
083730100 DCN8060 Teledyne API T100 SO2 Analyzer with NumaView™ Software 79
Page 82

3. COMMUNICATIONS AND REMOTE OPERATION
This instrument’s rear panel connections include an Ethernet port, a USB port (option) and
two serial communications ports labeled RS232, which is the COM1 port in the software
menu, and COM2 (refer to Figure 2-2). These ports allow the ability to communicate with,
issue commands to, and receive data from the analyzer through an external computer
system or terminal. Connection instructions were provided in Section 2.3.1.8.
Configuration information was provided in Section 2.5.10.
This section provides pertinent information regarding communication equipment, the
communications ports, and communications protocol. Data acquisition is set up through
the Datalogger (Section 2.5.1).
DATA TERMINAL/COMMUNICATION EQUIPMENT (DTE DCE)
RS-232 was developed for allowing communications between data terminal equipment
(DTE) and data communication equipment (DCE). Basic terminals always fall into the
DTE category whereas modems are always considered DCE devices. The difference
between the two is the pin assignment of the Data Receive and Data Transmit functions.
• DTE devices receive data on pin 2 and transmit data on pin 3.
• DCE devices receive data on pin 3 and transmit data on pin 2.
To allow the analyzer to be used with terminals (DTE), modems (DCE) and computers
(which can be either), a switch mounted below the serial ports on the rear panel, labeled
DCE DTE (Figure 2-2), allows the user to set the RS-232 configuration for one of these
two data devices. This switch exchanges the Receive and Transmit lines on RS-232
emulating a cross-over or null-modem cable. The switch has no effect on COM2.
MODES, BAUD RATE AND SERIAL COMMUNICATION
Referring to Table 2-17, use the SETUP>COMM menu to configure COM1 (labeled
RS232 on instrument rear panel) and/or COM2 (labeled COM2 on instrument rear panel)
for communication modes, baud rate and serial communications. If using a USB option
communication connection, setup requires that the instrument’s baud rate and personal
computer baud rate match.
80 Teledyne API T100 Analyzer with NumaView™ Software 083730100 DCN8060
Page 83

SERIAL COMMUNICATION: RS-232
be used except for multidrop).
LED
FUNCTION
The RS232 and COM2 communications ports operate on the RS-232 protocol (default
configuration). Configurations possible for these two ports are:
• RS232 port can also be configured to operate in single or RS-232 Multidrop mode
(Option 62); refer to Section 2.3.1.8.
• COM2 port can be left in its default configuration for standard RS-232 operation
including multidrop, or it can be reconfigured for half-duplex RS-485 operation (please
contact the factory for this configuration).
Note
A code-activated switch (CAS), can also be used on either port to connect typically
between 2 and 16 send/receive instruments (host computer(s) printers, data loggers,
analyzers, monitors, calibrators, etc.) into one communications hub. Contact Teledyne API
Sales (front cover, this manual) for more information on CAS systems.
SERIAL COMMUNICATION: RS-485 (OPTION)
The COM2 port of the instrument’s rear panel is set up for RS-232 communication but can
be reconfigured for RS-485 communication. Contact Technical Support for reconfiguration
unless this option was elected at the time of purchase, then the rear panel was preconfigured
at the factory.
ETHERNET
When using the Ethernet interface, the analyzer can be connected to any standard 10BaseT
or 100BaseT Ethernet network via low-cost network hubs, switches or routers. The
interface operates as a standard TCP/IP device on port 3000. This allows a remote computer
to connect through the network to the analyzer using NumaView™ Remote, terminal
emulators or other programs.
When the rear panel COM2 port is in use, except for multidrop
communication, the rear panel USB port cannot be used.
(Alternatively, when the USB port is enabled, COM2 port cannot
The Ethernet connector has two LEDs that are on the connector itself, indicating its current
operating status.
The analyzer is shipped with DHCP enabled by default. This allows the instrument to be
connected to a network or router with a DHCP server; however, it should be configured
with a Static IP address as soon as practical. See Section 2.5.10.5 for configuration details.
083730100 DCN8060 Teledyne API T100 SO2 Analyzer with NumaView™ Software 81
Table 3-1. Ethernet Status Indicators
amber (link) On when connection to the LAN is valid.
green (activity Flickers during any activity on the LAN.
Page 84

COMMUNICATIONS PROTOCOLS
MODBUS (Section 3.4.1) and Hessen (Section 3.4.2) are available with the analyzer.
MODBUS registers are provided in Appendix A.
MODBUS
These instructions assume that the user is familiar with MODBUS communications, and
provide minimal information to get started. Please refer to the Teledyne API MODBUS
manual, PN 06276, and to www.modbus.org for MODBUS communication protocols.
Minimum Requirements:
• Instrument firmware with MODBUS capabilities installed
• MODBUS-compatible software (TAPI uses MODBUS Poll for testing; see
www.modbustools.com)
• Personal computer with communications cable (Ethernet or USB or RS232), and
possibly a null modem adapter or cable
MODBUS COM PORT CONFIGURATION
MODBUS communications can be configured for transmission over Ethernet or serial
COM port through the Setup>Comm menu. Make the appropriate cable connections
(Ethernet or COM port) between the instrument and a PC.
Check the instrument’s Modbus Units selection in the Setup>Vars menu and edit if needed.
Ethernet: MODBUS is available on TCP port 502. By default, port 502 is assigned to
the instrument’s TCP Port 2. (Setup>Comm> TCP Port2, Figure 3-1).
Figure 3-1. MODBUS via Ethernet
82 Teledyne API T100 Analyzer with NumaView™ Software 083730100 DCN8060
Page 85

Serial COM: Both COM1 (labeled “RS232” on the instrument’s rear panel) and COM2
When more than one analyzer is connected to the network,
are configurable for RS-232 or RS-485 communication with either
MODBUS RTU or MODBUS ASCII transmission modes. In the
Setup>Comm COM1[COM2] menu, edit the Protocol parameter to select a
MODBUS transmission mode; edit Baud Rate, Parity, Data Bits, etc., if
necessary (see descriptions in Table 2-17).
Important
When using MODBUS RTU, ensure that the COM1[COM2]
Handshaking Mode is set to either Hardware or OFF. Do NOT
set it to Software.
Press the Accept button to apply the settings. (Figure 3-2 shows an example
for MODBUS RTU).
Figure 3-2. MODBUS via Serial Communication (example)
Important
create a unique identification number for each in the
Setup>Vars>Instrument ID menu.
Next, for the settings to take effect, power off the analyzer, wait 5 seconds, and power it
on again.
083730100 DCN8060 Teledyne API T100 SO2 Analyzer with NumaView™ Software 83
Page 86

HESSEN
Hessen is a multidrop protocol, in which several remote instruments (slaves) are connected
via a common communications channel to a host computer. Slaves respond only to
commands sent by the host using their unique identification.
Important
Create a unique identification number for each instrument in
the multidrop chain via the Setup>Vars>Instrument ID menu.
The Hessen protocol is not strictly defined; therefore, while Teledyne API’s application is
completely compatible with the protocol itself, it may be different from implementations
by other companies.
HESSEN COM PORT CONFIGURATION
Configure the COM1/COM2 port for Hessen protocol through the
Setup>Comm>COM1[COM2] menu: select COM1[COM2] Protocol and press Edit to
select HESSEN, then press Accept.
Ensure that the communication parameters of the host computer are also properly set.
Figure 3-3. Serial Communication, Setting Hessen Protocol
Note
84 Teledyne API T100 Analyzer with NumaView™ Software 083730100 DCN8060
The instrument software has a 200 ms latency period before it
responds to commands issued by the host computer. This latency
should present no problems, but be mindful of issuing commands
to the instrument too frequently.
Page 87

HESSEN SETTINGS CONFIGURATION
MODE ID
MODE DESCRIPTION
CMD
TEXT
Hessen configuration includes settings for alarms, version, response mode, status flags and
gas list. Locate the alarms in the Hessen Settings list (Setup>Comm>Hessen>Hessen
Settings) and edit as desired.
HESSEN VARIATION
For the Hessen Variation setting, there are two versions.
• TYPE 1 is the original implementation.
• TYPE 2 has more flexibility when operating with instruments that can measure more
than one type of gas. For more specific information about the difference between the
two versions, download the Manual Addendum for Hessen Protocol from the
Teledyne API's web site: http://www.teledyne-api.com/manuals/
.
HESSEN PROTOCOL RESPONSE MODE
Set the response mode under Hessen Response Mode, referring to Table 3-2 for
descriptions.
Table 3-2. Teledyne API's Hessen Protocol Response Modes
BCC
HESSEN STATUS FLAGS
Locate the various status flags in the Hessen Settings list and edit as needed. They are listed
by status flag name with their default bit assignments. (Those with unassigned flags are
listed as “0x0000”).
• The status bits are included in the instrument’s responses to inform the host computer
of its condition. Each bit can be assigned to one operational and warning message
flag.
• It is possible to assign more than one flag to the same Hessen status bit. This allows
the grouping of similar flags, such as all temperature warnings, under the same status
bit.
• Assigning conflicting flags to the same bit will cause each status bit to be triggered if
any of the assigned flags is active.
This is the default setting. Reponses from the instrument are encoded as the
traditional command format. Style and format of responses depend on exact
coding of the initiating command.
Responses from the instrument are always delimited with <STX> (at the
beginning of the response, <ETX> (at the end of the response followed by a 2
digit Block Check Code (checksum), regardless of the command encoding.
Responses from the instrument are always delimited with <CR> at the beginning
and the end of the string, regardless of the command encoding.
083730100 DCN8060 Teledyne API T100 SO2 Analyzer with NumaView™ Software 85
Page 88

WARNING FLAGS
OPERATIONAL FLAGS
UNITS OF MEASURE FLAGS
Spare/Unused Bits
UNASSIGNED FLAGS
Table 3-3. Hessen Status Flags and Default Bit Assignments
STATUS FLAG NAME
SAMPLE FLOW WARNING 0001
PMT DET WARNING 0002
UV LAMP WARNING 0002
HVPS WARNING 0004
DARK CAL WARNING 0008
RCELL TEMP WARNING 0010
IZS TEMP WARNING1 0020
PMT TEMP WARNING 0040
INVALID CONC 0080
In Manual Calibration Mode 0200
In Zero Calibration Mode 0400
In Span Calibration Mode 0800
DEFAULT BIT ASSIGNMENT
(user editable; also see Note 2)
UGM 0000
MGM 2000
PPB 4000
PPM 6000
100. 8000
Box Temp Warning MP Calibration
Sample Press Warning Analog Cal Warning
System Reset Cannot Dyn Zero
Rear Board Not Detected Cannot Dyn Span
Relay Board Warning Instrument Off
1
Only applicable if the optional internal span gas generator is installed.
2
It is possible to assign more than one flag to the same Hessen status bit. This allows the grouping of
similar flags, such as all temperature warnings, under the same status bit.
Be careful not to assign conflicting flags to the same bit as each status bit will be triggered if any of the
assigned flags is active.
86 Teledyne API T100 Analyzer with NumaView™ Software 083730100 DCN8060
Page 89

HESSEN GAS LIST CONFIGURATION
PARAMETER
DEFINITION
Gas
type of gas to be reported
Range
concentration range to be reported (when Reported box is checked)
2
only when range 2 or high range is active
Id
specific gas identification
110
SO2
Configure the Hessen Gas List in the Setup>Comm>Hessen>Hessen Gas List page.
Choose the Gas, the concentration Range, and enter the gas ID. Refer to and to the table
below.
Figure 3-4. Hessen Gas List Configuration
Table 3-4. Hessen Gas List Definitions
0 currently active range
1 only when range 1 or low range is active
3 Not Applicable
Reported choice of whether to report when polled by the Hessen network
083730100 DCN8060 Teledyne API T100 SO2 Analyzer with NumaView™ Software 87
Page 90

4. CALIBRATION
A start-up period of 4-5 hours is recommended prior to calibrating
This section is organized into subsections as follows:
SECTION 4.1 – Important Precalibration Information
: contains important information you should know before calibrating the instrument.
SECTION 4.2 – Calibration Procedures: describes the procedure for manually checking
calibration and performing actual calibration of the instrument.
SECTION 4.3 – Automatic Zero/Span Cal/Check (Auto Cal): describes the procedure
for using the AutoCal feature to check calibration or to calibrate the instrument. (The
AutoCal feature requires that either the zero/span valve option or the internal span gas
generator option be installed and operating).
SECTION 4.4 – Calibration Quality Analysis: describes how to evaluate quality of each
calibration.
SECTION 4.5 – EPA Protocol Calibration: provides links to the US EPA website for
references regarding calibration with EPA protocols.
IMPORTANT PRECALIBRATION INFORMATION
Note
the analyzer.
CALIBRATION REQUIREMENTS
The following equipment, supplies, and expendables are required for calibration:
• Zero-air source
• Span gas source
• Gas lines - all gas line materials should be Teflon-type or glass.
• Traceability Standards
Optional equipment: A recording device such as a strip-chart recorder and/or data logger
should be used to record data from the T100’s serial or analog outputs. If analog readings
are used, the response of the recording system should be checked against a NIST traceable
voltage source or meter. Data recording device should be capable of bi-polar operation so
that negative readings can be recorded. For electronic documentation, the internal data
acquisition system (DAS) can be used by configuring the Datalogger through the
Setup>Data Logging menu; Section 2.5.1).
88 Teledyne API T100 Analyzer with NumaView™ Software 083730100 DCN8060
Page 91

The method for performing an initial calibration for the analyzer differs between the
Zero air and span gases must be supplied at 1.5 to 2 times the
standard instrument and those with options.
• See Section 4.2.1 for instructions for initial calibration of the analyzer in its base
configuration.
• See Section 4.2.2 for information regarding setup and calibration of the analyzer with
Z/S Valve options.
Note
instrument’s specified gas flow rate. Therefore, the zero and span
gases should be supplied to their respective inlets in excess of
1000 cc/min.
ZERO AIR
Zero air is similar in chemical composition to the Earth’s atmosphere but scrubbed of all
components that might affect the analyzer’s readings. For SO
should be similar in composition to the sample gas but devoid of SO
hydrocarbons, nitrogen oxide (NO) and with a water vapor dew point ≤ -15°
measuring devices, zero air
2
and large amounts of
2
C.
Devices such as the API Model 701 zero air generator that condition ambient air by drying
and removal of pollutants are available. We recommend this type of device for generating
zero air.
CALIBRATION (SPAN) GAS
Span gas is specifically mixed to match the chemical composition of the gas being
measured at about 80% of the desired full measurement range. For example, if the
measurement range is 500 ppb, the span gas should have an SO
400 ppb.
Span gases should be certified to a specific accuracy to ensure accurate calibration of the
analyzer. Typical gas accuracy for SO
gases is 1 or 2 %.
2
concentration of about
2
• If using a secondary dilution source with zero air through a calibrator, then use a
bottle of SO
• If calibrator and zero air source are not available, then use a bottle of SO
air.
balanced nitrogen.
2
Teledyne API offers an IZS option operating with permeation devices. The accuracy of
these devices is about ±5%. Whereas this may be sufficient for quick, daily calibration
checks, we strongly recommend using certified SO
083730100 DCN8060 Teledyne API T100 SO2 Analyzer with NumaView™ Software 89
balanced
2
span gases for accurate calibration.
2
Page 92

SPAN GAS FOR MULTIPOINT CALIBRATION
Some applications, such as EPA monitoring, require a multipoint calibration procedure
where span gases of different concentrations are needed. We recommend using a bottle of
calibrated SO
such as a Teledyne API Model T700. This type of calibrator precisely mixes a high
concentration gas with zero air (both supplied externally) to accurately produce span gas
of the correct concentration. Linearity profiles can be automated with this model and run
unattended over night.
If a dynamic dilution system is used to dilute high concentration gas standards to low,
ambient concentrations, ensure that the SO
dilution range of the calibrator.
gas of higher concentration in conjunction with a gas dilution calibrator
2
concentration of the reference gas matches the
2
Choose the SO
gas concentration so that the dynamic dilution system operates in its mid-
2
range and not at the extremes of its dilution capabilities.
EXAMPLE:
• A dilution calibrator with 10-10000 dilution ratio will not be able to accurately dilute a
5000 ppm SO
very extreme dilution setting.
• A 100 ppm SO
(dilution ratio of 222, in the mid-range of the system’s capabilities).
gas to a final concentration of 500 ppb, as this would operate at the
2
gas in nitrogen is much more suitable to calibrate the T100 analyzer
2
PHYSICAL RANGE MEASUREMENTS
The entire measurement range of the T100 is 0 – 20,000 ppb, but many applications use
only a small part of the analyzer’s full measurement range, which then becomes a data
resolution challenge where the reported measurement may be barely perceptible. The
software rectifies this challenge when the user defines the portion of the physical range
relevant to the specific application, which the software then uses to scale the reporting
range and accurately display the concentration(s).
To define the physical range for applications requiring greater resolution and sensitivity,
navigate to the Setup>Vars menu and select Max Concentration Range; press the edit
button and input the maximum value expected for the SO
concentrations.
2
90 Teledyne API T100 Analyzer with NumaView™ Software 083730100 DCN8060
Page 93

INTERFERENTS
The fluorescence method for detecting SO2 is subject to interference from a number of
sources including hydrocarbons, which fluoresce similarly to SO
has been designed to reject most of these interferences.
. However, the analyzer
2
Nitrogen oxide (NO) also fluoresces in a spectral range near to SO
. For critical
2
applications where high levels of NO are expected, an optional optical filter is available
that improves the rejection of NO (contact Technical Support for more information).
PERMEATION TUBE OPTIONS
Teledyne API offers an optional internal span gas generator that utilizes a permeation tube
as a span gas source (see Section 2.3.2.5). The accuracy of these devices is only about ±5%.
Whereas this may be sufficient for quick, daily calibration checks, we recommend using
certified SO
span gases for accurate calibration.
2
CAUTION!
Insufficient gas flow allows gas to build up to levels that will
contaminate the instrument or present a safety hazard to
personnel.
In units with a permeation tube installed, either the tube must
be removed and stored in a sealed container (use original
container that tube was shipped in) during periods of nonoperation, or a vacuum pump must be connected and
powered on to maintain constant gas flow though the
analyzer at all times.
DATA RECORDING DEVICES
A strip chart recorder, data acquisition system or digital data acquisition system should be
used to record data from either the Ethernet, serial or analog outputs.
• If analog readings are used, the response of the recording system should be checked
against a NIST traceable voltage source or meter.
• Data recording devices should be capable of bi-polar operation so that negative
readings can be recorded.
For electronic data recording, the analyzers provide an internal data logger, which is
configured through the Setup>Data Logger menu (Section 2.5.1).
NumaView™ Remote is a remote control program, which is also available as a convenient
and powerful tool for data handling, download, storage, quick check and plotting.
083730100 DCN8060 Teledyne API T100 SO2 Analyzer with NumaView™ Software 91
Page 94

CALIBRATION PROCEDURES
This section presents the steps for calibration and calibration checks for the following:
• basic configuration (Section 4.2.1)
• with valve options (Section 4.2.2)
• with IZS option (Section 4.3)
• for dual or auto reporting range modes (Section )
• and for optional sensors (Section ).
First verify/change (if needed) the settings in the Setu>Vars menu as follows:
• User Units (unit of Measure): PPB
• Max Concentration Range (highest concentration expected to measure)
• Range Mode: SNGL
CALIBRATION AND CHECK PROCEDURES FOR BASIC
CONFIGURATION
Although this section uses the Calibration menu for both check and actual calibration, a
check does not require the Calibration menu. Instead, while in Home page, simply flow the
zero air or the span gas through the Sample port, and check the reading after the Stability
falls below 1.0 PPB (either in the gas graph or in the Dashboard). Otherwise, follow the
steps presented in Sections 4.2.1.1 and 4.2.1.2. after connecting the sources of zero air and
span gas in either of the following two ways:
92 Teledyne API T100 Analyzer with NumaView™ Software 083730100 DCN8060
Page 95

OR
SAMPLE
EXHAUST
MODEL 701
Zero Air
Generator
VENT
Calibrated
SO2 GAS
(At high
concentration)
MODEL 700
Gas Dilution
Calibrator
(with Ozone
Bench Option)
Source of
SAMPLE Gas
(Remove
during
calibration)
SAMPLE
EXHAUST
VENT
Calibrated
SO2 GAS
(At high
concentration)
MODEL 701
Zero Air
Generator
Source of
SAMPLE Gas
(Remove
during
calibration)
3-way
Valve
Needle valve
to contro
l
flow
Chassis
Chassis
Figure 4-1. Setup for Manual Calibration without Z/S Valve or IZS Option
083730100 DCN8060 Teledyne API T100 SO2 Analyzer with NumaView™ Software 93
Page 96

ZERO CALIBRATION CHECK AND ACTUAL CALIBRATION
CHECK ONLY:
ACTUAL CALIBRATION:
a. Wait for reading to stabilize.
reading.
a. Press the Zero button.
CHECK ONLY:
ACTUAL CALIBRATION:
a. Wait to reach stability,
a. Press the Set Span Target button and
d. In the Cal Result window, press OK.
Go to the Calibration>M-P menu.
Input Zero air through the Sample port and press the Start button.
Either check or calibrate as follows:
b. Press Stop and check the
Figure 4-2. Multi-Point Calibration Page
b. Press Stop and check the reading.
SPAN CALIBRATION CHECK AND ACTUAL CALIBRATION
1. While still in the Calibration>M-P menu, input Span gas through the Sample
2. Either check or calibrate as follows:
3. Press the Stop button and return to Home screen.
4. In the Dashboard, check and record the Slope(s) and the Offset(s). (See
94 Teledyne API T100 Analyzer with NumaView™ Software 083730100 DCN8060
port and press the Start button.
then press Stop.
b. Record the reading(s).
Table 4-4 in Section 4.4, Calibration Quality Analysis, for
expected/acceptable values).
enter the gas concentration.
b. Verify the concentration reading is the
same as the concentration being
supplied.
c. If correct, wait to reach stability, then
press the Span button.
Page 97

CALIBRATION AND CHECK PROCEDURES WITH VALVE
SAMPLE
ZERO AIR
EXHAUST
Source of
SAMPLE Gas
VENT if input is pressurized
Internal Zero/Span Option (IZS) – Option 51A
Ambient
Air
External Zero
Air Scrubber
Filter
MODEL 701
Zero Air
Generator
Source of
SAMPLE Gas
VENT if input is pressurized
MODEL 700
Gas Dilution Calibrator
(with O3 generator option)
VENT
SAMPLE
ZERO AIR
EXHAUST
SPAN 1
Calibrated
SO2 gas
(At high
concentration)
VENT
Needle valve
to control flow
Chassis
Chassis
OPTIONS INSTALLED
On units with an IZS option installed, zero air and span gas are supplied to the analyzer
through the zero gas inlet and from ambient air.
On units with a zero/span valve option installed, zero air and span gas are supplied to the
analyzer through the zero gas and span gas inlets from two different sources.
Figure 4-3. Setup for Manual Calibration Check with Z/S Valve or IZS Option
Navigate to the Calibration>Zero menu for Zero cal and to the Calibration>Span menu for
Span cal (see Figure 4-4) and follow the instructions in Sections 4.2.1.1 and 4.2.1.2
083730100 DCN8060 Teledyne API T100 SO2 Analyzer with NumaView™ Software 95
Page 98

Figure 4-4. Zero and Span Calibration Screens
USE OF ZERO/SPAN VALVE WITH REMOTE CONTACT CLOSURE
Contact closures for controlling calibration and calibration checks are located on the rear
panel CONTROL IN connector. Instructions for setup and use of these contacts are in
Section 2.3.1.6.
When the contacts are closed for at least 5 seconds, the instrument switches into zero, low
span or high span mode and the internal zero/span valves will be automatically switched
to the appropriate configuration.
• The remote calibration contact closures may be activated in any order.
• It is recommended that contact closures remain closed for at least 10 minutes to
establish a reliable reading.
• The instrument will stay in the selected mode for as long as the contacts remain
closed.
96 Teledyne API T100 Analyzer with NumaView™ Software 083730100 DCN8060
Page 99

If contact closures are being used in conjunction with the analyzer’s AutoCal (see Section
4.3) feature and the AutoCal attribute “Calibrate” is enabled (selection box is checked), the
analyzer will not recalibrate the analyzer UNTIL the contact is opened. At this point, the
new calibration values will be recorded before the instrument returns to SAMPLE mode.
If the AutoCal attribute “Calibrate” is disabled (selection box is unchecked), the instrument
will return to SAMPLE mode, leaving the instrument’s internal calibration variables
unchanged.
AUTOMATIC ZERO/SPAN CAL/CHECK (AUTO CAL)
The Auto Cal feature allows unattended periodic operation of the ZERO/SPAN valve
options by using the instrument’s internal time of day clock. Auto Cal operates by
executing preprogrammed calibrations or calibration checks set up by the user to initiate
the various calibration states of the analyzer and to open and close valves appropriately. It
is possible to set up and run up to three separate preprogrammed calibrations or calibration
checks (labeled # 1, 2 and 3). Each calibration or check can operate in one of three modes
(Zero, Low or High), or be disabled.
Table 4-1 and Table 4-2 show how to set up the operating states of each calibration or
check, and Table 4-3 shows how to program the execution of each.
Figure 4-5. Auto Cal Page
083730100 DCN8060 Teledyne API T100 SO2 Analyzer with NumaView™ Software 97
Page 100

Table 4-1. Auto Cal States
MODE NAME
ACTION
STATE
Enabled
Calibrate
Zero
Low
High
enables the sequence;
disables the sequence.
enables an actual calibration when the Enabled box is also .
allows a calibration check when the Enabled box is also .
causes the sequence to perform a Zero calibration when both the
Calibrate and Enabled boxes are also .
causes a Zero check when the Enabled box is also and the
Calibrate box is unchecked ( ).
disables Zero calibration and check
causes the sequence to perform a Low Span calibration when both
the Calibrate and Enabled boxes are also .
causes a Low Span check when the Enabled box is also and
the Calibrate box is unchecked ( ).
disables Low Span calibration and check
causes the sequence to perform a High Span concentration
calibration when both the Calibrate and Enabled boxes are also
.
causes a High Span check when the Enabled box is also and
the Calibrate box is unchecked ( ).
disables the High Span calibration and check.
Table 4-2 shows how the selection boxes would be enabled/disabled for calibration checks
and calibrations.
Table 4-2. Auto Cal Setup Combinations
MODE ACTION
Enabled Calibrate Zero Low High
Zero
Low
High
Zero Low High
Check
Calibrate
Check
Calibrate
Check
Calibrate
Check
Calibrate
For each sequence, there are four parameters that control operational details: Date, Time
(both in the Start field), Interval, and Duration, as presented in Table 4-3.
98 Teledyne API T100 Analyzer with NumaView™ Software 083730100 DCN8060
 Loading...