

Page 1
QPHY-UWB
UWB Serial Data
Operator’s Manual
Revision C – October, 2008
Relating to the Following Release Versions:
• Software Option Rev. 5.7
• UWB Script Rev. 1.4
• Style Sheet Rev. 1.2
Page 2
LeCroy Corporation
700 Chestnut Ridge Road
Chestnut Ridge, NY 10977–6499
Tel: (845) 578 6020, Fax: (845) 578 5985
Internet: www.lecroy.com
© 2008 by LeCroy Corporation. All rights reserved.
LeCroy, ActiveDSO, WaveLink, JitterTrack, WavePro, WaveMaster, WaveSurfer, WaveExpert, WaveRunner and
WaveJet are registered trademarks of LeCroy Corporation. Other product or brand names are trademarks or
requested trademarks of their respective holders. Information in this publication supersedes all earlier versions.
Specifications subject to change without notice.
This electronic product is subject to
disposal and recycling regulations
that vary by country and region.
Manufactured under an ISO 9000
Registered Quality Management System
Visit www.lecroy.com to view the
certificate.
Many countries prohibit the
disposal of waste electronic
equipment in standard waste
receptacles.
For more information about proper
disposal and recycling of your
LeCroy product, please visit
www.lecroy.com/recycle.
Document Number: 915837 Rev C
2
QPHY-UWB-OM-E Rev C
Page 3

TABLE OF CONTENTS
QPHY-UWB Software Option
OVERVIEW ................................................................................................................................ 5
INSTALLATION ......................................................................................................................... 6
Oscilloscope Option Key Installation .......................................................................................................................... 6
Oscilloscope Firmware Version: ................................................................................................................................. 6
BASIC SETUP FOR CAPTURING UWB PACKET OVER CABLE ........................................... 7
Sample Rate and Bandwidth Setup ........................................................................................................................... 7
Vertical Setup ............................................................................................................................................................. 7
Trigger and Timebase Setup ...................................................................................................................................... 7
CAPTURING A WIRELESS USB DATA PACKET ................................................................... 8
Antenna, Amplifier, and Filter ..................................................................................................................................... 8
Adding a Special Trigger Path .................................................................................................................................... 8
OVERVIEW OF UWB ANALYSIS MODE .................................................................................. 9
Turning the UWB Analysis Mode On and Off ........................................................................................................... 10
Selecting the Source for the UWB Waveform to be analyzed ................................................................................. 11
Specifying the MB-OFDM parameters for the packet to be analyzed ...................................................................... 11
Setting the Time Frequency Code (TFC) ......................................................................................................... 11
Setting the Band Group .................................................................................................................................... 12
Setting the Data Rate ....................................................................................................................................... 12
Interpreting the Packet Information Box ................................................................................................................... 13
Selecting the Analysis View and Associated Menus ................................................................................................ 13
SPECTROGRAM ANALYSIS .................................................................................................. 14
Setting the Center Frequency and Frequency Span ........................................................................................ 14
Dynamic Range ................................................................................................................................................ 15
POWER SPECTRAL DENSITY (PSD) ANALYSIS ................................................................. 16
Modifying the Symbol Timing Window ..................................................................................................................... 17
Mask Pass/Fail View ................................................................................................................................................ 18
Adjacent Channel Power Ratio (ACPR) View .......................................................................................................... 19
BAND POWER ANALYSIS ..................................................................................................... 20
ERROR VECTOR MAGNITUDE (EVM) & CONSTELLATION ANALYSIS ............................. 21
Real and Imaginary Waveforms (I and Q components) ........................................................................................... 22
Error Vector Magnitude (EVM) Measurement Parameter ........................................................................................ 22
Frequency Error Measurement Parameter .............................................................................................................. 23
EVM/Constellation Controls ..................................................................................................................................... 23
Include in Constellation and EVM ..................................................................................................................... 23
Selected Packets and Selected Symbol ........................................................................................................... 24
MAGNITUDE AND PHASE ANALYSIS .................................................................................. 25
Selecting a Specific Packet and Symbol to Display ................................................................................................. 25
Selecting Subcarrier Types to Display ..................................................................................................................... 26
Setting the Trace Style ............................................................................................................................................. 27
COMMON PHASE ERROR (CPE) VERSUS TIME ANALYSIS .............................................. 28
AUTOMATING UWB MEASUREMENT TAKING WITH QUALIPHY ...................................... 29
General Setup Dialog ............................................................................................................................................... 29
Standard Selection Dialog ........................................................................................................................................ 29
QPHY-UWB-OM-E Rev C
3
Page 4

Configuration Dialog ................................................................................................................................................. 29
Edit/View Configuration Dialog ................................................................................................................................. 29
Generating a Report ................................................................................................................................................. 30
4
QPHY-UWB-OM-E Rev C
Page 5

QPHY-UWB Software Option
OVERVIEW
The LeCroy QPHY-UWB option software enables LeCroy Digital Oscilloscopes to perform WiMedia ultra
wideband (UWB) physical layer (PHY) transmitter compliance measurements as well as provide analyses and
displays for troubleshooting UWB transmitters. This option software performs the analyses and tests in
accordance with the following documents available from the WiMedia Alliance (WiMedia.org):
• MultiBand OFDM(Orthogonal Frequency Division Modulation) Physical Layer Specification, version 1.0
• WiMedia PHY Test Specification, version 1.0
Some additions have also been made to accommodate PHY specification version 1.2 such as the addition of
band group 6 and the addition of the 2-band time frequency interleave modes (TFI2), Time Frequency Codes
(TFC) 8-10.
The WiMedia UWB PHY specification provides for broadcasting over 14 bands, each 528 MHz wide covering the
frequency range from 3.1 GHz to 10.6 GHz. The 14 bands form 6 band groups detailed in the table below. The
table indicates which oscilloscopes will provide adequate bandwidth depending on which band groups you are
working in.
Band
Group
Band
IDs
Number
Bands
Lower
Freq
(MHz)
1 1 – 3 3 3168 4960 4752 1584
2 4 – 6 3 4752 5544 6336 1584
3 7 – 9 3 6336 7128 7920 1584
4 10 – 12 2 7920 8712 9504 1584
5 13 – 14 3 9504 10032 10560 1056
6 9 – 11 3 7392 8184 8976 1584
Center
Freq
(MHz)
Upper
Freq
(MHz)
Bandwidth
(MHz)
LeCroy
Oscilloscope
SDA760Zi/DDA760Zi/WP760Zi/
SDA6000/9000/11000/13000
SDA9000/11000/13000
SDA9000/11000/13000
SDA11000/13000
SDA11000/13000
SDA11000/13000
This software expects the transmitter under test to be utilizing both the Time-frequency Codes and the OFDM
modulation scheme as required by the MB-OFDM specification. The software expects to receive an entire
digitized RF MB-OFDM packet. The software will down convert from RF to baseband and then further demodulate
the OFDM symbols for analysis.
The basic QPHY-UWB option is well integrated into the oscilloscope software. Control of the measurement
software is accomplished via a set of UWB menus that are entered from the top level menu Analysis UWB
(WiMedia). These menus allow you to set up the parameters of the transmitter (Band Group, TFC, Data Rate) as
well as the type of analysis and details of the analysis.
The QPHY-UWB option supports the following types of analysis:
• Power Measurements
o Spectrogram
o Power Spectral Density plots with masks and ACPR
o Band power and total power
• Modulation Measurements
o Error Vector Magnitude (EVM) and constellation plot
o Phase and Magnitude versus subcarrier plots
o Common Phase Error versus time (symbol)
The QPHY-UWB option supports automation of WiMedia PHY compliance testing via our QualiPHY software. A
QualiPHY script is provided with the QPHY-UWB software to perform most oscilloscope operation, results
storage, and report generation for the compliance testing automatically. The software will pause and prompt the
user when a change in the transmitter parameters is required. It then asks the user to trigger the oscilloscope and
make sure that a packet was properly captured, after that, the script handles the analysis and results
automatically. The use of the QualiPHY and the UWB QualiPHY script is discussed in the Automating UWB
measurement taking with Qualiphy section on page 29.
QPHY-UWB-OM-E Rev C
5
Page 6

INSTALLATION
The QPHY-UWB option is enabled through installation of an option key. If the option was purchased with the
oscilloscope, then the key will already have been installed and nothing further is required to gain access and
control of the option. If the option was purchased independently of the oscilloscope and needs installation, then
please follow the instructions in the next section.
Oscilloscope Option Key Installation
If an option key has not yet been purchased to enable the QPHY-UWB option, call LeCroy Customer Support to
place an order and receive the code.
Enter the key and enable the option as follows:
1. From the oscilloscope menu select Utilities Utilities Setup...
2. Select the Options tab and click the Add Key button.
3. Enter the Key Code using the on-screen keyboard.
4. Restart the oscilloscope to activate the option after installation.
Oscilloscope Firmware Version:
In order to enable the features described in this documentation version 5.2.0 or later firmware should be installed.
If your oscilloscope has an earlier version of the firmware, please download the latest version from the LeCroy
website (www.lecroy.com) and install on oscilloscope. Note that you do not need to re-install the option keys when
you update the firmware.
6
QPHY-UWB-OM-E Rev C
Page 7

QPHY-UWB Software Option
Band
BASIC SETUP FOR CAPTURING UWB PACKET OVER CABLE
Configure the UWB transmitter to be tested to the desired Band group, TFC, and data rate. It will make setup of
the trigger easiest if your transmitter can be put in a mode to continuously send out packets. The trigger can still
be setup even if you can only send out a finite burst of packets or even only 1 packet at a time, but it is a little
more difficult. Cable the antenna output of the transmitter to the input channel of the oscilloscope. Note for
40GS/s sampling rate only channel 2 or 3 can be used. If the UWB radio needs to be transmitting over the air
simultaneously with the capture of the signal, then use an appropriate power splitter to split the signal between
the antenna and the oscilloscope.
Sample Rate and Bandwidth Setup
Set up the oscilloscope sample rate and bandwidth according to the table below. Except for use with band group
1, the oscilloscope should be set to DBI mode on. This is accessible under the Timebase menu. Make sure that
the Timebase mode is set to Fixed sample rate. You do not want this changing while you are making a
measurement.
Group
1 SDA760Zi/DDA760Zi/
2 - 3 SDA9000
4 - 6 SDA11000
Oscilloscopes Bandwidth Sample Rate DBI Mode on? Channel
WP760Zi/SDA6000
SDA9000
SDA11000
SDA13000
SDA11000
SDA13000
SDA13000
6 GHz 20 GS/sec No Any
9 GHz
11 GHz
13 GHz
11 GHz
13 GHz
40 GS/sec Yes 2 or 3
40 GS/sec Yes 2 or 3
Vertical Setup
Start with a vertical sensitivity of 50 mV/div. After you capture the first few packets, set the vertical sensitivity
control to variable and adjust the V/div so the packet amplitude takes up at least 6 vertical divisions, but doesn’t
go off-screen.
Trigger and Timebase Setup
Set trigger to edge trigger with a trigger level of about ½ division (25 mV). Using the trigger delay control, place
the trigger position at about 2 divisions from the left of the screen. The trigger will not trigger precisely at the same
time each sweep, so you need to leave some room on the left of the screen. You also need to insure that there is
at least 200 nsec of inter-packet gap captured before the packet starts in order for the software to recognize the
packet as a complete packet for analysis. Set the time per division to a long enough time to capture the number of
packets you wish to analyze at a single time. Adjust trigger level to give most stable trigger. This may take some
back and forth if your transmitter is not transmitting a continuous stream of packets.
Note:
According to the MultiBand OFDM Physical Layer Specification 1.1 (©2005 MultiBand OFDM Alliance and WiMedia
Alliance), EVM is only computed on data symbols. With a Standard preamble, the first data (PSDU, payload) symbol is symbol
43.
Although our software does not require it, you should acquire full packets. The WiMedia PHY Compliance and Interoperability
Test Specification (v1.0, September 1, 2006) says “EVM shall be computed over at least 3 packets with a payload of at least
96 symbols each. If the measured EVM is within 2 dB of the specified EVM maximum in absolute value, abs (measuredEVM specEVM) < 2 dB, then the EVM should be re-measured over an average of 10 packets to ensure accuracy of the
measurement”.
Please see the WiMedia PHY Compliance and Interoperability Test Specification for more details.
When you have at least one full packet on the screen, then you can proceed to analyze the packet which is
described starting on page 9.
QPHY-UWB-OM-E Rev C
7
Page 8
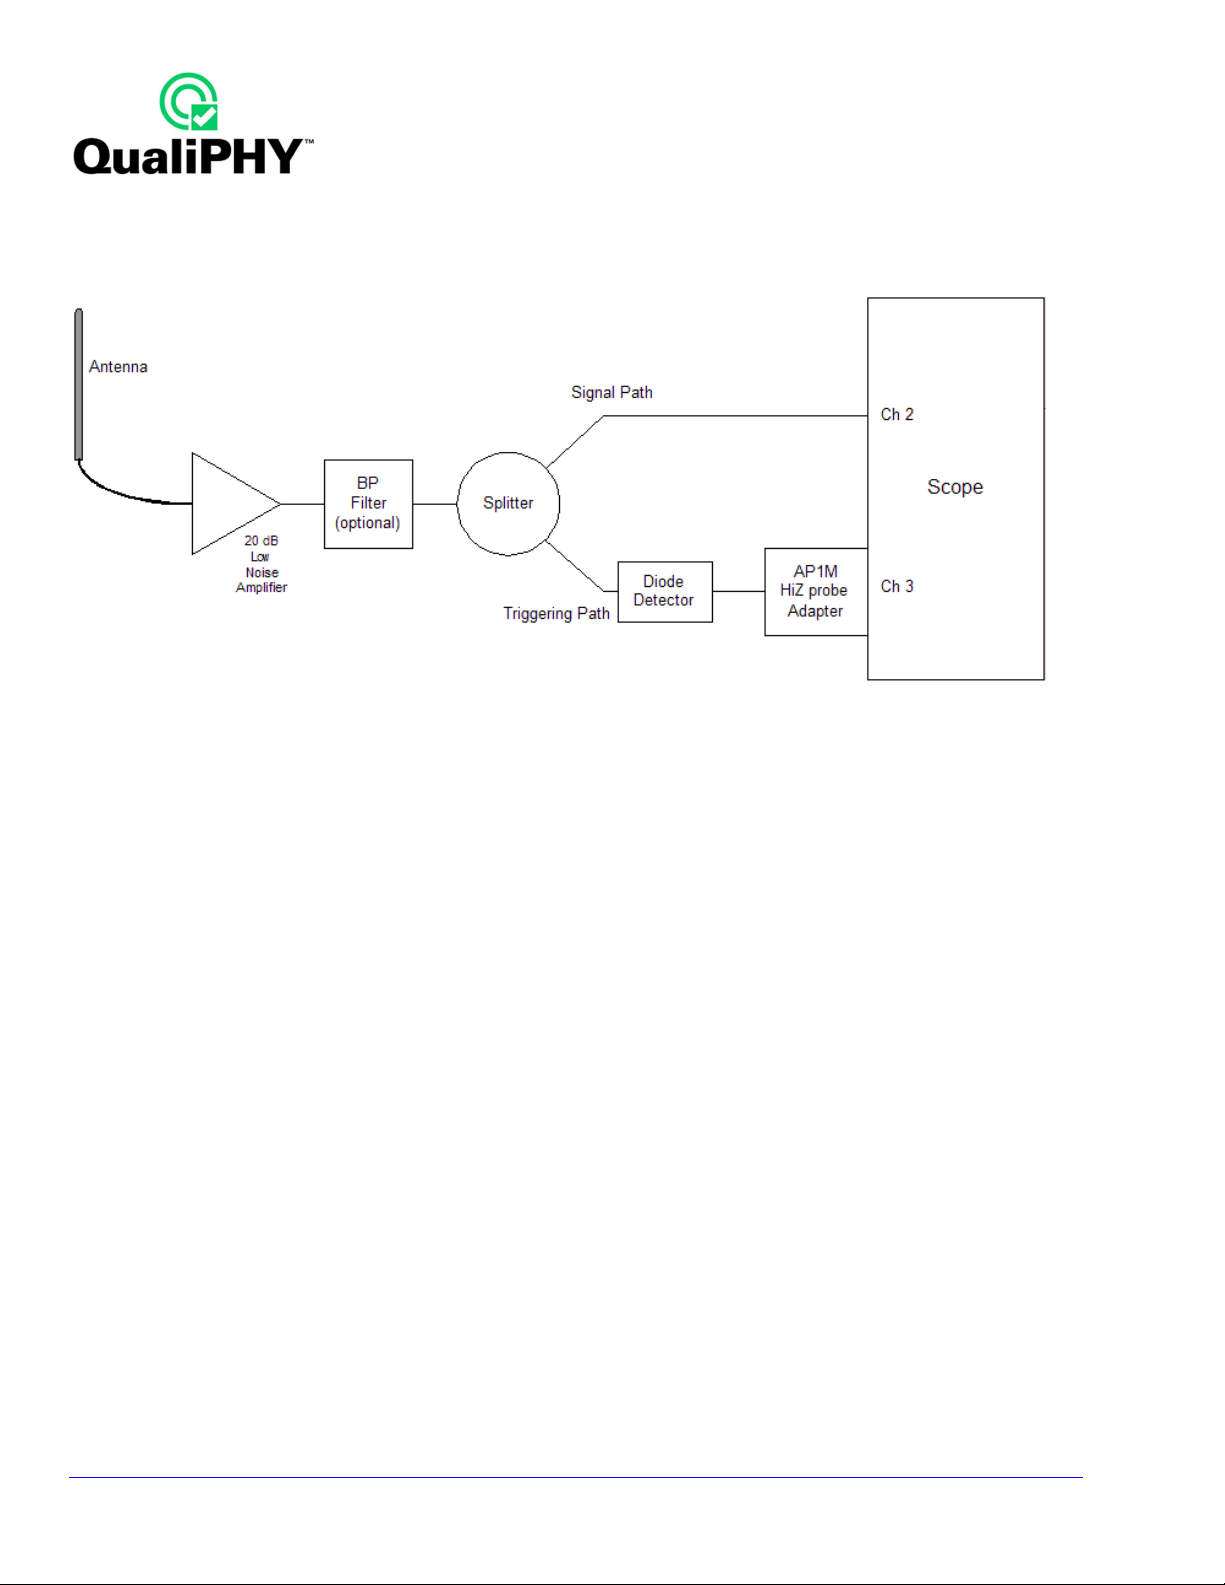
CAPTURING A WIRELESS USB DATA PACKET
The block diagram below shows a setup that is useful for capturing a UWB packet within the context of a Certified
Wireless USB (WUSB) system.
Antenna, Amplifier, and Filter
The amplifier is needed in order to be able to move the capture antenna out of the near field of the transmit
antenna. Our experience indicates that the capture antenna will still need to be relatively close to the transmitter
antenna, < 15 centimeters in order to obtain adequate signal to noise ratio. An appropriate band pass filter should
be used in environments where there are larger amounts of ambient cell phone or other wireless transmissions.
These out-of-band transmissions will not at low levels significantly affect the UWB analysis, but if they get too
high, they can use up too much of the oscilloscope dynamic range and decrease the SNR of the UWB
measurement. They also can make it more difficult to trigger on the UWB packet.
Adding a Special Trigger Path
In the above setup, the signal is split into 2 paths so that we can improve the triggering. In a Wireless USB
system, most of the UWB packets are very short “beacon” packets which we do not want to trigger on. We only
want to capture the much longer packets carrying the data payload. In order to accomplish this, we need to use
the Width Trigger mode in the oscilloscope to trigger on only the long packets. The Width Trigger mode has a
much lower bandwidth than the edge trigger, approximately 750 MHz. So we need to create a triggering path
where we use a shottky diode detector (e.g., Anritsu 70KA50) driving a high impedance input to create a rectified
and filtered version of the signal. The signal “envelope” seen by Channel 3 will be pulled slowly low as the packet
starts and will stay low for the duration of the packet and then slowly return to 0V. With this circuit, we can now
use the Width Trigger to trigger only on negative going pulses with width greater than the width of the undesired
short packets. See the oscilloscope Operator’s Manual for help using the Width Trigger. This detector based
triggering circuit can also be used to help trigger on packets in higher frequency band groups where the edge
trigger bandwidth of the oscilloscope is being exceeded or pushed to limited sensitivity.
8
QPHY-UWB-OM-E Rev C
Page 9
QPHY-UWB Software Option
OVERVIEW OF UWB ANALYSIS MODE
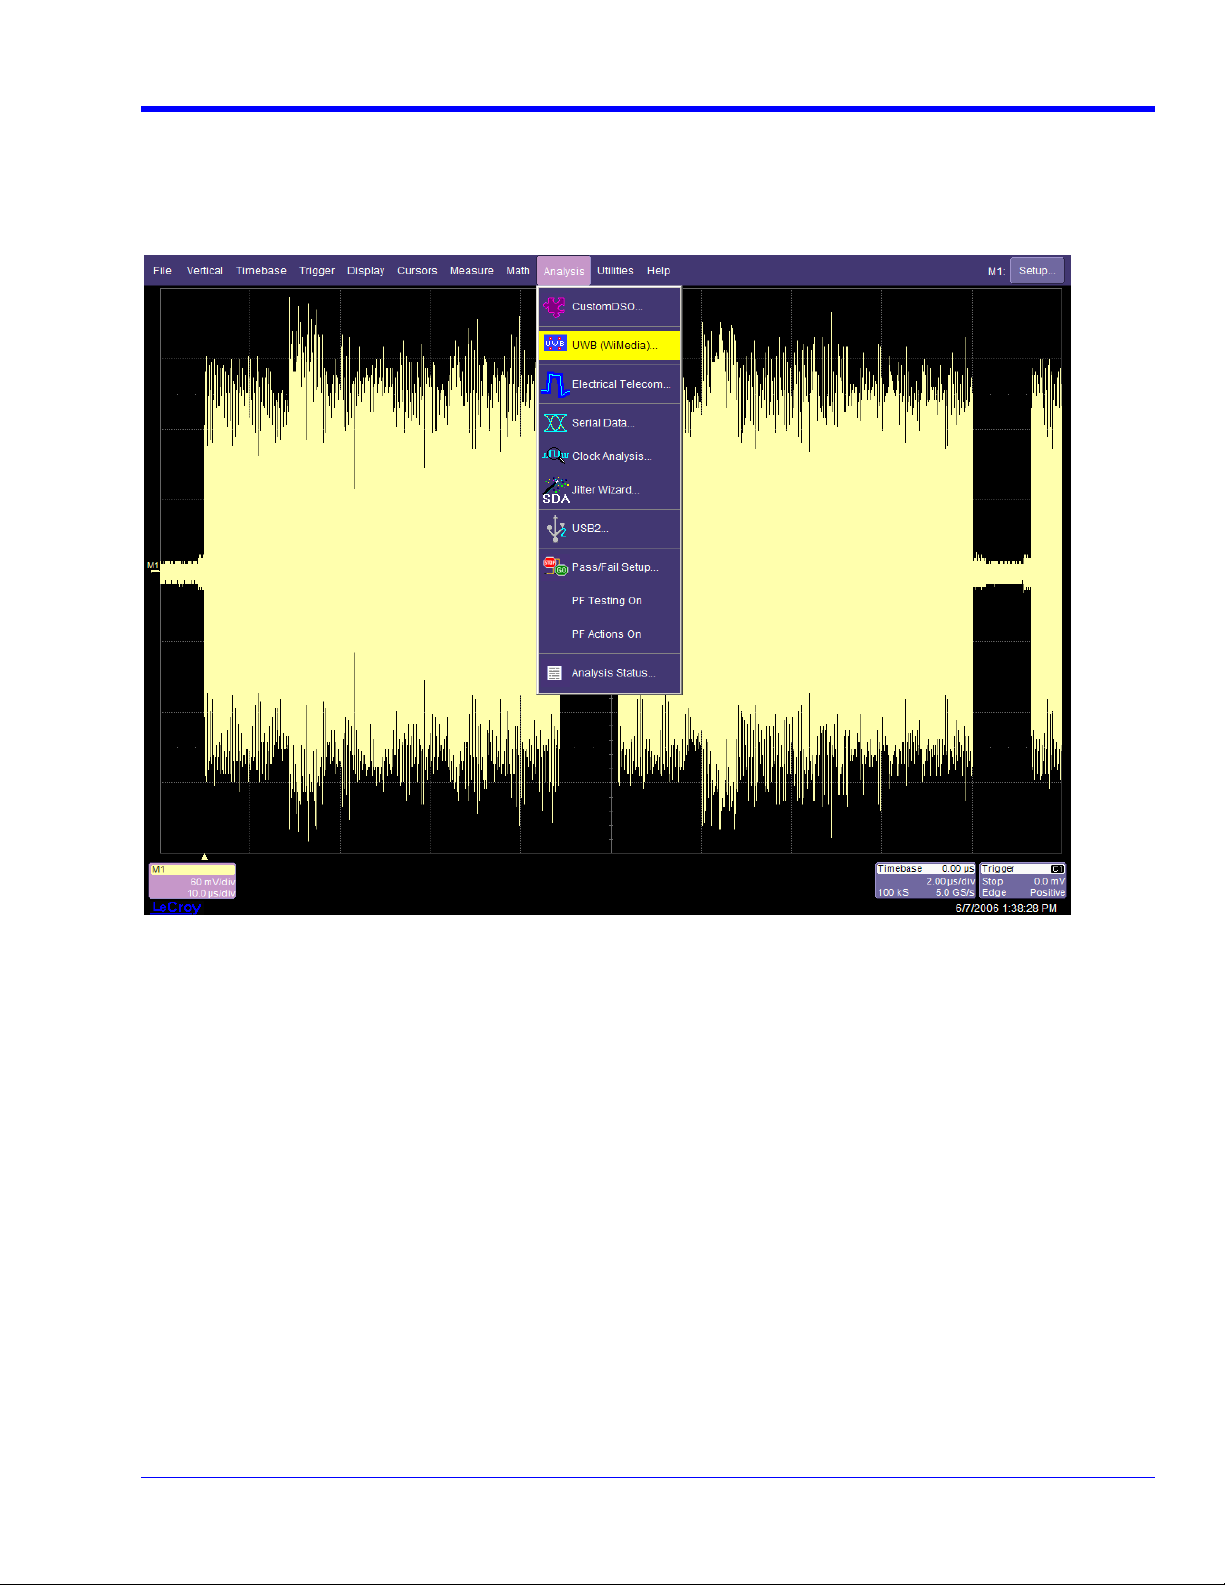
Once installed, the UWB (WiMedia) selection will appear in the Analysis menu. This is the main entry point into
the UWB analysis mode. Notice that the packet to be analyzed displayed on the screen below is in Memory 1,
M1. Click UWB (WiMedia) to enter the UWB analysis mode.
QPHY-UWB-OM-E Rev C
9
Page 10

Upon entering the UWB analysis mode, the UWB Analysis main menu will appear on the bottom third of the
screen.
The UWB Analysis main menu contains 5 main sections corresponding to the following sections of this manual.
Turning the UWB Analysis Mode On and Off
Click on the “On” box to turn the UWB Analysis Mode On. Click again to turn it off.
10
QPHY-UWB-OM-E Rev C
Page 11

QPHY-UWB Software Option
Selecting the Source for the UWB Waveform to be analyzed
Selecting Input source control brings up a list of possible sources for waveform analysis. Select the one
containing the packet for analysis. Any of the 4 input channels, 4 memories, or 8 math functions can be used as a
source.
Specifying the MB-OFDM parameters for the packet to be analyzed
The section labeled Signal Setup, as follows, is used to specify the MB-OFDM parameters used by the radio
when it transmitted the packet. You will need to enter the TFC (Time-Frequency Code), Band Group, and the
Data Rate in order for the oscilloscope to know how to analyze the packet. If they are selected incorrectly, it may
not be possible for the UWB analysis package to perform most of the analysis described below. The
Spectrogram analysis doesn’t require any of this information, so it can be used to view the spectrogram of the
packet. The spectrogram information can be used to determine the TFC and Band group, if these are unknown.
Setting the Time Frequency Code (TFC)
Select the TFC control to set the TFC value for the packet to be analyzed. Some reference information about TFC
values:
• TFC values range from 1 to 10. (PHY 1.1 specification defines 1-7; upcoming PHY 1.2 specification defines 8,
9, 10)
• TFC 1: symbol 1 = Lowest band, symbol 2= mid band, symbol 3 = high band and repeats 1,2,31,2,3
• TFC 2: 1, 3, 2.1, 3, 2.
• TFC 3: 11, 22, 33 11, 22, 33.
• TFC 4: 11, 33, 22.
• TFC 5, 6, 7: FFI mode (Fixed Frequency Interleave)
• TFC 8, 9, 10: two band time frequency interleaved: 1,2; 2,3; and 1,3
Note: When working in TFC 5, 6, or 7 there is only going to be 1 PSD mask. In fact there should be no energy in
the other bands.
QPHY-UWB-OM-E Rev C
11
Page 12

Setting the Band Group
Select the Band Group control to set the Band Group for the packet to be analyzed.
• Each Band Group is composed of 3 bands, except for Band Group 5, which has 2 bands
• Each Band Group has 10 possible TFC choices except Band Group 5, which has 3
• Each combination of Band Group and TFC is called a Channel
Setting the Data Rate
Selecting the Data Rate allows you to select the data rate for the payload portion of the packet to be analyzed.
Note: In the MB-OFDM signal, the data is modulated with a QPSK scheme for data rates up to 200 Mb/s. For
user signals with higher data rates, the DCM modulation scheme is used (18 stars in the constellation display, 16
for data plus 2 for pilot tones).
12
QPSK constellation display (4 stars)
DCM constellation display
(16 stars data + 2 stars for pilot tone)
QPHY-UWB-OM-E Rev C
Page 13

QPHY-UWB Software Option
Interpreting the Packet Information Box
This box located to the right of the UWB Analysis main menu outputs useful information on the signal being
analyzed:
• Number of packets displayed
• Preamble information
• Inter-packet gap time
• Number of symbols contained in each packet displayed
Selecting the Analysis View and Associated Menus
Select one of the analysis buttons to bring up the view and controls for that type of analysis.
There are 6 possible analysis types:
• PSD - Power Spectral Density
• EVM/Constellation - Error Vector Magnitude (EVM) with Constellation display
• Mag/Phase - Magnitude and Phase plots
• Spectrogram – Spectrogram plot
• CPE vs. time - Common Phase Error (CPE) versus time
• Power – Total power in packet and the power in each band
When one of the analysis views is selected, an additional menu is created and brought forward which contains the
controls for that particular analysis view. We can hop back and forth between this particular analysis view menu
and the main UWB control menu by selecting the appropriate tab at the top left of the menu area. For example,
when the Spectrogram analysis is active, the 2 menu selection tabs are called Spectrogram and UWB Analysis
(See picture on next page). The UWB Analysis tab is always available to allow you to jump back to the main
UWB menu.
QPHY-UWB-OM-E Rev C
13
Page 14

SPECTROGRAM ANALYSIS
This view displays a spectrogram of the input waveform. Forming a spectrogram does not require UWB
processing, so you can zoom in on the source (as shown below) to any part of a packet. A spectrogram is a 3
dimensional plot in which the power is plotted on the z-axis, as a color-graded intensity, as a function of both
frequency on the vertical axis and time along the horizontal axis. The time scale for the spectrogram is identical as
that for the source waveform. As you zoom in and out on the source waveform, the spectrogram’s horizontal axis
will automatically rescale to track. The following screen-shot shows the spectrogram of a segment of the input
UWB packet on M1. We can immediately see that the band hopping has a sequence of 1,2,3,1,2,3 which we
immediately recognize as TFC 1. On the spectrogram menu we can control the vertical frequency scale that is
looked at as well as the z-axis dynamic range. These controls are described below.
Setting the Center Frequency and Frequency Span
These values automatically default to the Center Frequency and appropriate Span for the band group that is set
on the main UWB menu. This menu allows them to be changed from the default values.
14
QPHY-UWB-OM-E Rev C
Page 15

QPHY-UWB Software Option
Dynamic Range
Dynamic range controls the vertical dynamic range of the signal displayed in the spectrogram. This sets the
number of dB down that the black bins are from the peak power bins of the waveform (plotted in red). Values
range from 32 to 48. More noise becomes visible in the spectrogram as the dynamic range is raised but subtle
low level signal effects can be hidden as the dynamic range is lowered. The default value of 40 offers a good
tradeoff between sensitivity and noise.
Note: The spectrogram display appearance is affected by the Display Persistence, Saturation setting. If
Saturation is set to 100%, there will be very little red, and the color scale is linearly distributed over the dynamic
range. If the Saturation is set to 50% (the default), then anything in the top half of the dynamic range is red and
the color scale is linearly distributed over the lower 50%. The UWB software does not change the Saturation
setting. Also, the type of persistence display that the spectrogram uses can be modified via the Display
Persistence menu. A 3 dimensional surface plot can be used in place of the color-graded 2 dimensional plot if
desired.
QPHY-UWB-OM-E Rev C
15
Page 16

POWER SPECTRAL DENSITY (PSD) ANALYSIS
The power spectral density analysis does the following:
1. Performs a packet detect to identify and isolate the individual packets
2. For each packet:
o Performs a correlation on the sync preamble of the packet with the expected preamble symbols to
determine a first order timing reference and frequency offset.
o Use timing information to determine exact locations of symbols.
o For each symbol in each band perform an FFT and smooth FFT results to a resolution Bandwidth of
5 MHz.
3. For each band, sum the FFT spectra from all the symbols in that band to get the spectrum averaged over all
the symbols.
4. For each band in the band group, plot the spectrum (power spectral density). The spectrum is normalized by
setting the highest value to 0 dB.
Two tests are available on the calculated power spectra. The first is the mask test, which looks for violations of the
power spectral density with respect to masks that are defined in the “WiMedia PHY Compliance and
Interoperability Test Specification” (C&I specification). The mask test roughly tests that any out-of-band frequency
bin in the band group must be at least 20 dB below the highest active in-band bin. Things are a bit more
complicated in the transition zones. As said before, the details are found in the WiMedia C&I specification. The
second test is the Adjacent Channel Power Ratio (ACPR) test which calculates the ratio of the total in-band power
to the total out-of-band power for each of the 2 inactive bands in the band group. This yields 2 numbers for each
active band. So for a TFI (Time Frequency Interleave) mode like TFC 1 there will be 6 ACPR results, and for an
FFI (Fixed Frequency Interleave) mode like TFC 5, there will only be 2 ACPR results. The ACPR lower limits are
20 dB.
16
QPHY-UWB-OM-E Rev C
Page 17

QPHY-UWB Software Option
Modifying the Symbol Timing Window
In some radios the switching of the carrier may happen a little late causing excessive carrier leakage into the next
symbol out-of-band spectrum. The WiMedia C&I specification allows the FFT gate timing to be offset in order to
minimize such prior symbol carrier leakage. The Start offset adjustment is provided for this purpose. The
Duration adjustment is provided to allow some freedom in troubleshooting possible problems by allowing full
adjustment of the FFT gating.
These controls are disabled when the Use Defaults checkbox is checked. Access the 2 numeric selections by unchecking the Use Defaults checkbox.
Start Offset
This numerical control lets you modify the point in the gap (between symbols) when the analysis expects the RF
radio transmitter to have switched bands. The default value is 0 ns, which corresponds to the 5th sample before
the nominal symbol start at the base sample rate (528 MS/s). The WiMedia PHY Compliance and Interoperability
Test Specification (hereafter referred to as the C&I specification) allows the start value to be varied to find a time
that minimizes local oscillator leakage or other issues, in order to pass the PSD mask and adjacent channel
power ratio (ACPR) tests. The same start position must be used for both tests.
Duration
This is the time interval between each symbol. Default value is 303 ns.
The duration of each symbol plus the gap (between the symbols) is nominally 312.5 ns. The nominal duration of
the symbol without the gap is 242.42 ns (303 ns are 160 baseband sample times).
The C&I specification does not allow the duration to be changed, for C&I testing the duration must be the default
value, 303 ns.
Use Defaults Checkbox
Checking this box forces the Start offset and Duration controls to default values, and makes them read only.
Select this checkbox to force settings to be appropriate for WiMedia compliance testing. Deselect this checkbox to
gain control of the Symbol section (Start offset and Duration dialogs).
Selecting the PSD Test Type
The control labeled Show allows the user to switch the display between the Mask pass/fail test view and the
ACPR values test view.
QPHY-UWB-OM-E Rev C
17
Page 18

Mask Pass/Fail View
This view displays the power spectral density of the active bands in the selected band group and tests the limits
against the specified masks. Test result passes if the signals do not violate the corresponding masks. Red circles
highlight the areas of mask violation. If there are no violations and the test passes full, then “(Q1 &Q2 &Q3) =
True”.
Here is an example of the PSD Mask pass/fail testing view:
18
QPHY-UWB-OM-E Rev C
Page 19

QPHY-UWB Software Option
Adjacent Channel Power Ratio (ACPR) View
Click on the ACPR values button to switch from the Mask pass/fail view to the ACPR values view.
This view shows the pass/fail limit testing on the Adjacent Channel Power Ratio parameters. Each of the six
displayed ACPR parameters measures the power ratio between the transmitting band and the two adjacent
bands. Test limit is the same for all six channels and equal to 20 dB.
The test passes if the power in the band being used is greater than the power in the other bands in the band
group by at least 20 dB. Note that the green check marks indicate a valid value for the parameters and not that
they pass the test. The value of the Q1 through Q6 shows the individual test results and the value of “(Q1 & Q2 &
Q3 & Q4 & Q5 & Q6 )“ displays the overall results of the test.
Here is an example of the ACPR values view:
QPHY-UWB-OM-E Rev C
19
Page 20

BAND POWER ANALYSIS
This analysis shows the power of the symbols in each active band, in dBm, in P1, P2 and P3; and the power of all
the symbols in P5. In TFC 5, 6 and 7 only one band is active so only one of P1, P2 and P3 will be shown, and the
value in P5 will be the same as that value because all the symbols were in one band. Similarly for TFC 8, 9 and
10 two of P1, P2 and P3 will be shown.
The parameters are labeled dBm1, dBm2 and dBm3 for the power from symbols in the low, middle and upper
band in the band group; and dBm for the power from all the symbols.
The signal being measured is shown on the grid, above the parameters. The following screen-shot shows power
being measured on a TFC 1 signal.
20
QPHY-UWB-OM-E Rev C
Page 21

QPHY-UWB Software Option
ERROR VECTOR MAGNITUDE (EVM) & CONSTELLATION ANALYSIS
This view offers a simultaneous display of:
• A time-based display of the complex FFT I and Q samples from each symbol plotted in subcarrier order for
each symbol with successive symbols in time order. The I and Q subcarrier samples within a sample are
plotted spread over a time equal to the symbol duration.
• Constellation display in X-Y grid
• Error Vector Magnitude Measurement (P1)
• Frequency Error Measurement (P2)
• Sync Correlation Measurement of preamble symbols (P4)
• Relative Power of Channel Estimation symbols (P5)
• Relative Power of Header symbols (P6)
• Relative Power of Payload symbols (P7)
QPHY-UWB-OM-E Rev C
21
Page 22

Real and Imaginary Waveforms (I and Q components)
These two waveforms are the result of the discrete Fourier transform (DFT) processing, and display the Real and
Imaginary components of all the tones contained in each symbol. The points in these traces are the same as the
points in the constellation. These traces have horizontal axis units of time, but 112 points from each symbol are
from the same symbol (the same time); i.e., the time scale is # symbols * symbol duration. This is sufficient to
deduce which packet, or approximately which symbol within a PSDU, caused a visible disturbance; but this time
scale does not match the acquisition’s time scale, which of course includes inter-packet gaps, inter-symbol gaps,
and preamble and header symbols that do not contribute to the constellation.
Error Vector Magnitude (EVM) Measurement Parameter
Error Vector Magnitude is the distance between the point where each tone, as magnitude and phase, actually fell
and where it should have fallen. Ideally each tone should fall exactly on the constellation point but, in reality, each
tone falls in the proximity of the ideal constellation points, creating a “cloud” around the ideal points of the
constellation.
One Error Vector Magnitude (EVM) value is calculated for each packet (all the symbols contribute) by the root
mean square calculation. From section 8.7 of the MultiBand OFDM Physical Layer Specification, EVM is
calculated for each packet as follows, which is the square root of the mean squared distance from expected
constellation points of all the data and all the pilot tones in each of the symbols after the packet header to the end
of the packet:
The EVM value is then calculated by averaging the values from each packet:
EVM is displayed with statistics on. The “value” is a number calculated for the most recently processed packet.
The value, min, and max are EVM values from one packet. Num is the number of packets contributing to the
mean. The EVM result you should look at is the mean value, which is the result of averaging the values from
each packet, as required.
22
QPHY-UWB-OM-E Rev C
Page 23

QPHY-UWB Software Option
The sdev value, because it is shown in the same units as all the values, requires a word of explanation. But first,
please note that this measurement has not much value in considering sdev as it’s not required by the test. Linear
units must be averaged to find the mean and the sdev. Then both are converted to dB. Sdev reflects the
distribution of EVM values from different packets. It is expected to be much smaller than EVM, as shown. If sdev
is larger, all else being unchanged, min and max will be farther apart.
Frequency Error Measurement Parameter
This parameter measures the drift in the timing error that is due to a mismatch between the signal timing and what
it should be, based on our timebase. The timing error is derived from Common Phase Error measurement. The
drift between the first PSDU symbol and the end of the packet divided by the time gives a frequency mismatch
between the signal and the ideal frequency. This is the frequency error, and it is represented in parts per million.
EVM/Constellation Controls
Include in Constellation and EVM
The default settings for this menu are as shown in the following figure:
In this mode, the Constellation display includes data from both Data and Pilot Tones for all the PSDU symbols of
every packet included in the waveform under analysis. These default settings can be quickly set by checking the
Use Defaults checkbox. Uncheck the Use Defaults checkbox to use the controls on this menu.
The WiMedia PHY Compliance and Interoperability Test Specification specifies in section 3.5 that “The EVM Rx
shall compute and correct for common phase error (CPE) after a CPE filter has been applied as described in
Section 3.5.1”. The intent of the filter is to cause relatively rapid and/or large fluctuations in the carrier frequency
(that is, phase noise) to degrade EVM. The filter -3 dB bandwidth is approximately 266 kHz. When Filter CPE is
checked, the required filter is applied. When Filter CPE is not checked, we completely correct for CPE on a
symbol-by-symbol basis; that means phase noise will not degrade EVM up to a much higher frequency. The
difference observed reflects how much EVM is degraded by fluctuation of the carrier frequency, that is, phase
noise. C&I Testing requires Filter CPE to be checked.
QPHY-UWB-OM-E Rev C
23
Page 24

When EVM is computed, the frequency of the signal has been matched; that is, the overall slope of CPE from
start to end of each PSDU has been eliminated. Therefore it is only variation of CPE from symbol to symbol that is
filtered and causes degradation of EVM values.
The inclusion choices are:
For compliance testing the appropriate choice is Data and Pilot Tones.
Selected Tone
In each symbol, there are (-61 to + 61) tones. Tones +/- 5, 15, 25, 35, 45, 55 are pilot tones.
If any pilot tone is selected, the constellation display will show only two points in the constellation.
If any data tone is selected points will be displayed in all of the points of the constellation, four points (QPSK) or
16 points (DCM). Data tones are distributed across the possible points of the constellation.
In this mode of operation, you can select a specific tone among the available tones (12 pilot tones and 100 data
tones) in each symbol.
Include Header
The Include Header checkbox makes the EVM calculation begin with Header symbols, before the PSDU. This is
not used in compliance testing. It can be used to diagnose a discontinuity of phase or power between the header
and the PSDU.
Selected Packets and Selected Symbol
The two control boxes below allow you to select packets and a specific symbol within the selected packet.
Selected symbol only can be checked at the same time as Selected Tone is chosen, in which case the EVM
value and the constellation are from only the selected tone in the selected symbol.
24
QPHY-UWB-OM-E Rev C
Page 25

QPHY-UWB Software Option
MAGNITUDE AND PHASE ANALYSIS
This view displays the Real and Imaginary components (Magnitude and Phase) that result from the DFT
processing of the UWB signal after down-converting it to baseband:
Selecting a Specific Packet and Symbol to Display
You can select a specific packet and the symbol of interest within one specific packet. The default value is packet
1, symbol 43 (beginning of User data) within the packet.
PLEASE NOTE THE FOLLOWING REGARDING SYMBOLS WITHIN A PACKET:
• Preamble: Synchronization: 24 symbols (1 to 24) plus 6 Channel Estimation symbols (25 to 30). CE symbols
are used for channel equalization.
• Header: 12 symbols transmitted at low data rates
• User Data: from symbol 43 to end of packet. These are the only symbols transmitted at the Data Rate.
• The Mag/Phase view can display symbols 25 and above. Symbols 25 through 30, the CE symbols, are
displayed without equalization applied. This is valuable.
QPHY-UWB-OM-E Rev C
25
Page 26

Selecting Subcarrier Types to Display
Pilots Only (Magnitude and Phase Traces)
There are 12 pilot tones in each symbol (located at ± 5, 15, 25, 35, 45, 55 of the DC center point). When Pilots
only is selected, each one of the traces (Magnitude and Phase) displays one data point at each pilot tone. This is
a particularly useful view for high data rate signals which use Dual Carrier Modulation.
Since the pilot tones are the reference for decoding, Magnitude and Phase are set values: magnitude is set at 1
and the phase of each tone varies between +/-45° and +/-135° (exact usage depends on data rate).
26
QPHY-UWB-OM-E Rev C
Page 27

QPHY-UWB Software Option
Setting the Trace Style
This control sets the style of the Real and Imaginary plots as either Points only (default) or Line (straight line
interpolation between points).
QPHY-UWB-OM-E Rev C
27
Page 28

COMMON PHASE ERROR (CPE) VERSUS TIME ANALYSIS
This view shows how the Common Phase Error of the carrier frequency of each band in the band group which is
used for the selected TFC varies over time, over the Header and the PSDU. This view does require UWB
processing to be done, so an entire packet (starting from the beginning, including at least 200ns of the inter
packet gap) must be seen. The vertical scale of each track is automatically set to use most of the height of the
grid, so it is important to look at the vertical scale-per-division in the trace descriptors, below the grids. In the
figure below two of the tracks are at 2 degrees/div and the third is at 5 degrees/div. These variations are small.
Although it may not be clearly visible, the track is flat from start to end of each symbol time over which CPE was
measured. A slanted line just connects measured values.
CPE of the first symbol of the PSDU is zero by definition. Because matching frequency eliminates the slope of
CPE across the PSDU, the CPE track will also end at zero; only the variations from symbol to symbol are shown.
28
QPHY-UWB-OM-E Rev C
Page 29

QPHY-UWB Software Option
AUTOMATING UWB MEASUREMENT TAKING WITH QUALIPHY
Download the QualiPHY program from the LeCroy website in order to automate test measurements and produce
test results reports. As long as the option key that enables the QPHY-UWB package is installed in the
oscilloscope, QualiPHY will work. Refer to the QualiPHY Compliance Test Software Operator’s Manual for
instructions on how to install the software and operate it. The examples in the manual are typically for the
Ethernet or USB compliance tests, but the way it operates for UWB is very similar. Details that are specific to the
UWB operation are discussed below.
The main QualiPHY control window is shown below:
The Gray-filled rectangle buttons when selected bring up further control dialogs. Here is a brief description of the
control dialogs.
General Setup Dialog
Allows control of the oscilloscope setup, whether QualiPHY runs on the oscilloscope or a remote computer,
default settings, and other overall program configuration. Also allows access to Advanced mode.
Standard Selection Dialog
This box should always show UWB.
Configuration Dialog
Selects which configuration of the test is to be used. QualiPHY for UWB comes with 2 standard configurations of
the test: (1) Run Every Test on Live signal, and (2) Run Every Test on recalled waveforms.
Edit/View Configuration Dialog
This dialog allows new configurations to be created from existing ones via copying and editing. The original 2
configurations cannot be modified, they are locked, so you will need to copy them into new configurations before
being allowed to edit them. Begin editing the Configuration by selecting Start Edit. Once you start editing, you
can selectively disable tests to, for instance, limit the number of bit rate cases that will be tested, by un-checking
QPHY-UWB-OM-E Rev C
29
Page 30

boxes under the Test Selector tab. Note that in order to control which TFC values you want in the test sequence
you need to edit the variable called TFC accessed under the Variable Setup tab.
Generating a Report
At the end of the test a dialog will ask what type of output report you want. A readable report can be produced in
either HTML or PDF format. An XML output can be used if you want to transfer the data into a database program
such as Microsoft Access.
Data from all past test runs are saved in a database by QualiPHY. Currently these are only accessible through the
Advanced tab found in the General Setup Dialog. Under this tab select the Switch to Expert Mode button,
which will bring up what is known as the X-Replay program. In the lower left window on the screen are listed all
the tests you have run. When you click on one, you will see summary information about that run in the lower right
window. When you find the run you want to get output on, select it, and then select Create Report from the
Report menu off the main menu bar.
§ § §
30
QPHY-UWB-OM-E Rev C
 Loading...