

Page 1

USB3.0 Serial Data
Operator’s Manual
917719 Revision A – December, 2009
Relating to the Following Release
Versions:
Software Option Rev. 6.0
USB3 Script Rev. 1.0
Style Sheet Rev. 1.2
Page 2

LeCroy Corporation
700 Chestnut Ridge Road
Chestnut Ridge, NY, 10977-6499
Tel: (845) 578-6020, Fax: (845) 578 5985
Internet: www.lecroy.com
© 2009 by LeCroy Corporation. All rights reserved.
LeCroy and other product or brand names are trademarks or requested trademarks of their respective holders.
Information in this publication supersedes all earlier versions. Specifications are subject to change without notice.
917719 Rev A
Page 3

QPHY-USB3-Tx-Rx Software Option
TABLE OF CONTENTS
INTRODUCTION ...................................................................................................................................... 6
Compatibility................................................................................................................................................... 6
Additional Options Equipment Available from LeCroy ........................................................................................6
QualiPHY Compliance Test Platform ................................................................................................................7
Oscilloscope Option Key Installation ................................................................................................................9
Typical (Recommended) Configuration.............................................................................................................9
Remote (Network) Configuration ......................................................................................................................9
Oscilloscope Selection ................................ ................................................................ ....................................9
Accessing the QPHY-USB3-Tx-Rx Software using QualiPHY ..........................................................................10
Customizing QualiPHY................................................................................................................................ ..12
Creating Custom Configurations ....................................................................................................................13
QPHY-USB3-Tx -Rx Operation .......................................................................................................................15
GUIDE TO OPERATION ...................................................................................................................... 16
Transmitter Testing .......................................................................................................................................16
Receiver Testing ...........................................................................................................................................16
Transmitter and Receiver Testing ...................................................................................................................16
Using QPHY-USB3-Tx-Rx .............................................................................................................................16
Oscilloscope Only ................................................................................................ ..................................16
Oscilloscope and PeRT3 ................................................................................................ .........................17
Oscilloscope and PeRT3 with RF Switch ................................ ................................................................ ..17
OPERATING THE PERT3 MANUALLY ............................................................................................. 17
LFPS Ping using the PeRT3...........................................................................................................................18
Loopback Mode using the PeRT3 ................................................................................................ ...................18
Receiver Test Calibration using the PeRT3......................................................................................................18
QPHY-USB3-TX-RX TEST CONFIGURATIONS ............................................................................. 20
Empty Template ............................................................................................................................................20
Pre-Test (Scope PeRT3) ...............................................................................................................................20
Demo of Device Transmitter Tests................................................................................................ ..................20
Device Scope Only (Host TX Tests)................................................................................................ ................20
Device Scope PeRT3 (Host RX Tests)............................................................................................................20
Device Scope PeRT3 (Host TX and RX Tests) ................................................................................................21
Device Scope PeRT3 (Host TX Tests) ............................................................................................................21
Device Scope PeRT3 RF Switch (Host RX Tests)............................................................................................ 21
Device Scope PeRT3 RF Switch (Host TX and RX Tests) ................................................................................22
Device Scope PeRT3 RF Switch (Host TX Tests) ................................................................ ............................22
Host Scope Only (Host TX Tests) ...................................................................................................................22
Host Scope PeRT3 (Host RX Tests) ...............................................................................................................23
Host Scope PeRT3 (Host TX and RX Tests) ...................................................................................................23
Host Scope PeRT3 (Host TX Tests) ...............................................................................................................23
Host Scope PeRT3 RF Switch (Host RX Tests) ...............................................................................................24
Host Scope PeRT3 RF Switch (Host TX and RX Tests) ...................................................................................24
Host Scope PeRT3 RF Switch (Host TX Tests) ...............................................................................................24
QPHY-USB3-TX-RX TEST DESCRIPTIONS ................................................................................... 26
Pre-Test .......................................................................................................................................................26
Test 1.1 Low Frequency Periodic Signaling (LFPS) ................................................................ .........................26
Test 1.2 Spread Spectrum Tests ................................................................ ..................................................... 27
Test 1.3 Jitter & Eye Diagram Test .................................................................................................................28
Test for Ping.LFPS Support ............................................................................................................................................................ 26
Test 1.3.1 Jitter ......................................................................................................................................28
Test 1.3.2 Phase Jitter Slew Rate ...........................................................................................................29
Test 1.3.3 SigTest Jitter................................................................ .......................................................... 30
Test 1.3.4 Eye Diagram ................................................................................................ ..........................31
Test 1.3.5 SigTest Eye Diagram..............................................................................................................32
917719 Rev A 3
Page 4

Test 1.4 AC and DC Common Mode Voltage Tests ..........................................................................................34
Test 1.5 Differential Voltage & De-emphasis Test ............................................................................................34
Receiver Test Calibration................................................................ ............................................................... 36
Test 2.1 Jitter Tolerance Test .........................................................................................................................37
QPHY-USB3-TX-RX VARIABLES...................................................................................................... 38
Always Reconnect PUT ..........................................................................................................................38
Cable S-Parameters File ........................................................................................................................38
De-embed Cables ..................................................................................................................................38
Demo Mode................................................................ ................................................................ ...........38
RF Switch GPIB Address........................................................................................................................ 38
Maximum PeRT3 retries ................................ ................................................................ .........................38
Disable Connection Diagrams .................................................................................................................38
Product Type ................................................................................................................................ .........38
Saved Waveform Path............................................................................................................................38
Save Individual Runs..............................................................................................................................38
S-Parameter Files Path ..........................................................................................................................39
SSC ................................ ................................................................ ......................................................39
Stop On Test to review results ................................................................................................................ 39
Test Mode ................................................................ ................................................................ .............39
Use PeRT3................................................................................................................................ ............39
Use RF Switch .......................................................................................................................................39
PeRT3 Setup................................................................................................ ................................................39
PeRT3 Hostname or IP Address ................................ ................................................................ .............39
PeRT3 SSC Enabled..............................................................................................................................39
Transmitter Tests ..........................................................................................................................................39
Deskew measure mode ..........................................................................................................................39
Deskew value in picoseconds ................................................................................................ .................40
PeRT3 Amplitude...................................................................................................................................40
PeRT TX Init Mode................................................................................................ .................................40
Jitter & Eye Diagram Tests ..................................................................................................................... 40
Common Mode Voltage Tests ................................................................................................ .................40
Differential Voltage & De-emphasis Test................................ ................................................................ ..40
Receiver Tests ..............................................................................................................................................40
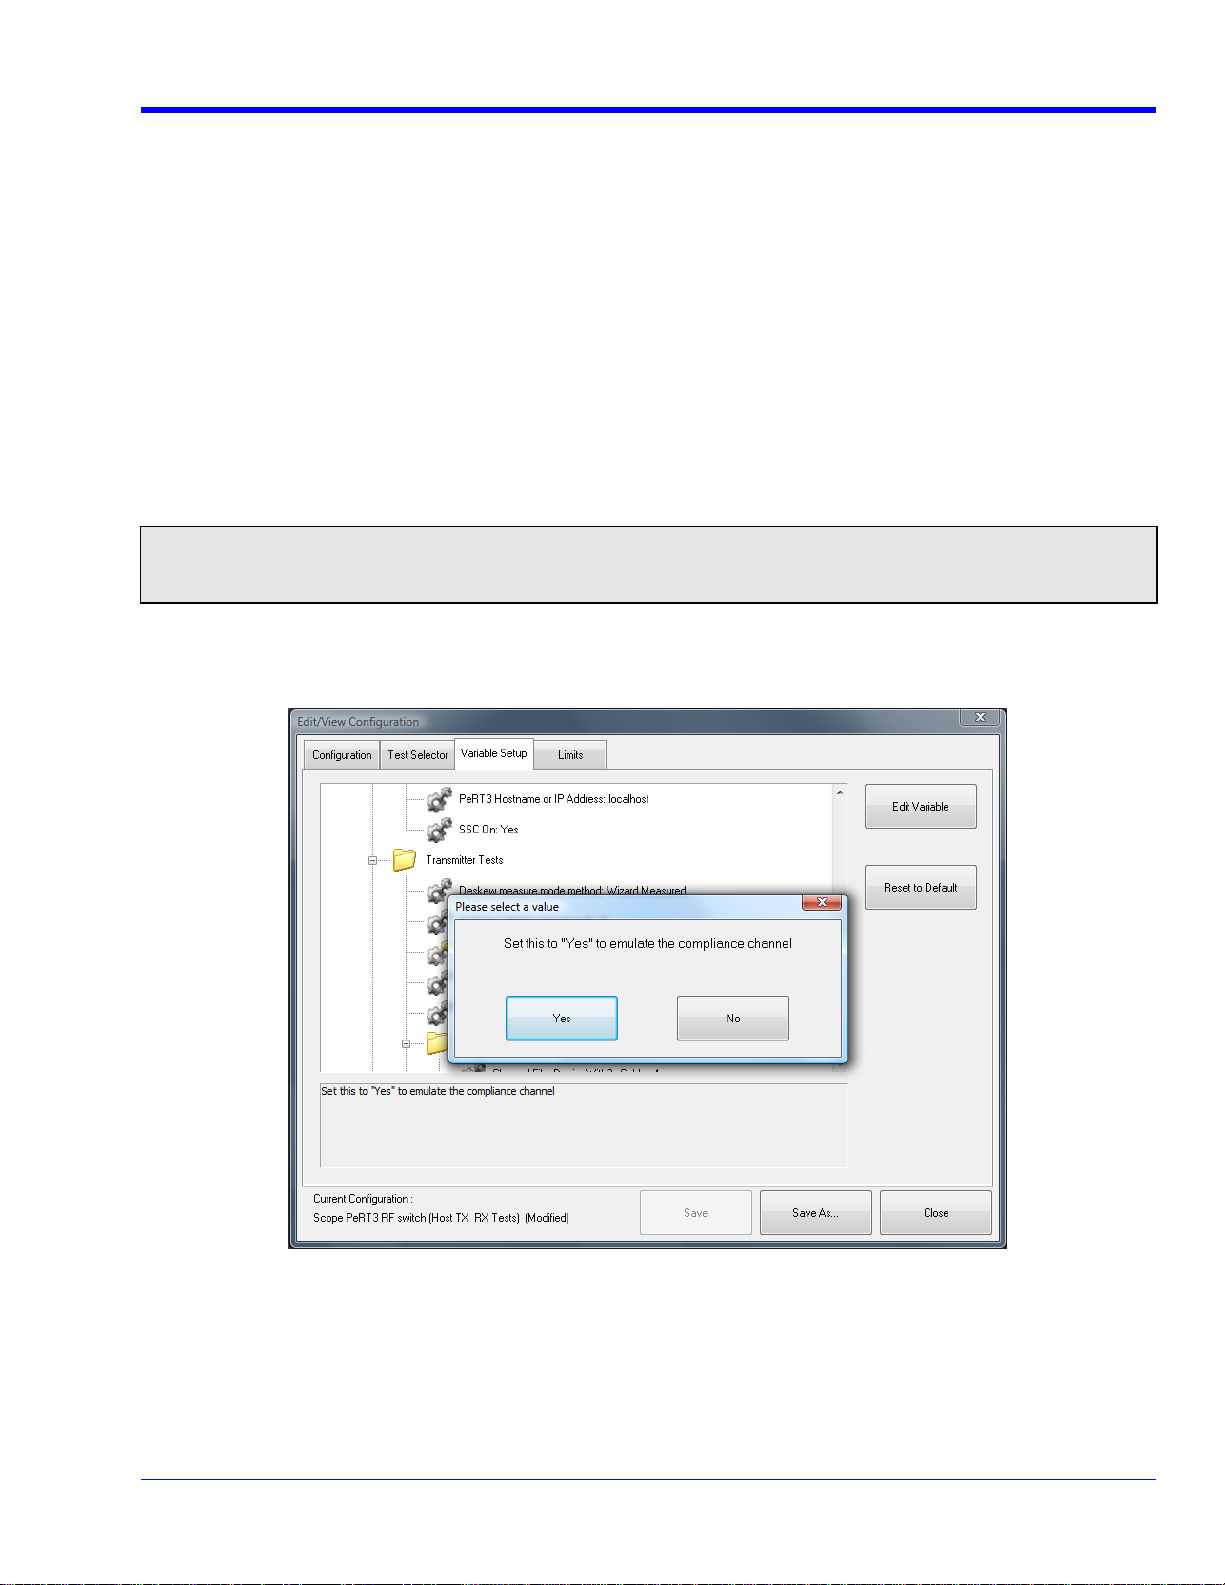
Use Compliance Chanel ......................................................................................................................... 40
Jitter Tolerance Test ..............................................................................................................................40
QPHY-USB3-TX-RX LIMITS................................................................................................................ 41
MANUAL CALIBRATION PROCEDURES ....................................................................................... 43
Cable Deskewing using the Fast Edge Output (WavePro 7 Zi and WaveMaster 8Zi only) ..................................43
Cable Deskewing without using the Fast Edge Output.....................................................................................46
4 917719 Rev A
Page 5

QPHY-USB3-Tx-Rx Software Option
FIGURES
Figure 1 - TF-USB3 Fixture Se t .....................................................................................................................6
Figure 2. Report me nu in QualiPHY General Setup.......................................................................................7
Figure 3. The Test Report include s a summary table with links to the detailed test results ..........................8
Figure 4. QualiPHY main me nu and complian ce test Standard selection menu..........................................10
Figure 5. QualiPHY configuration selection menu ...................................................................................... 11
Figure 6. QualiPHY test item selection menu ..............................................................................................12
Figure 7. Variable Setup and Limits Manager window s...............................................................................14
Figure 8. Start button ..................................................................................................................................15
Figure 9. Example of pop-up connection diagram and dialog box..............................................................15
Figure 10 - Oscilloscope Configuration a fter LFPS Test .............................................................................26
Figure 11 - Test Report from LFPS Te sts .....................................................................................................27
Figure 12 - Oscilloscope Configuration a fter SSC Tests .............................................................................27
Figure 13 - Test Report from SSC Tests ......................................................................................................28
Figure 14 - Oscilloscope Configuration a fter CP1 Ji tter Test ......................................................................28
Figure 15 - Oscilloscope Configuration a fter CP0 Ji tter Test ......................................................................29
Figure 16 - Test Report from Jitter Tests .....................................................................................................29
Figure 17 - Oscilloscope Configuration a fter Phase Jitter Slew Rate Test ..................................................30
Figure 18 - Test Report from Phase Jitter Slew Rate Test ...........................................................................30
Figure 19 - Oscilloscope Configuration a fter SigTest CP1 Jitter Test .........................................................31
Figure 20 - Test Report from SigTest Jitter Te st ..........................................................................................31
Figure 21 - Oscilloscope Configuration a fter Eye Diagram Te st..................................................................32
Figure 22 - Test Report from Eye Diagram Test ...........................................................................................32
Figure 23 - Oscilloscope Configuration a fter SigTest Eye Diagram Test .....................................................33
Figure 24 - Test Report from SigTest Eye Test ............................................................................................33
Figure 25 - Oscilloscope Configuration a fter AC and DC Common Mode Test ...........................................34
Figure 26 - Test Report from AC and DC Common Mode Test ....................................................................34
Figure 27 - Oscilloscope Configuration a fter Differential Voltage & De-emphasi s Te st on CP7 ..................35
Figure 28 - Oscilloscope Configuration a fter Differential Vol tage & De-emphasi s Te st on CP8 ..................36
Figure 29 - Test Report from Differential Voltage & De-emphasi s Test........................................................36
Figure 30 - Test Report from Jitter Tolerance Test ......................................................................................37
Figure 31 - QualiPHY Limits Manager .........................................................................................................41
Figure 32 - Timebase Setting s for Deskew with the Fast Edge Output .......................................................43
Figure 33 - Channel Pre -Processing Settings for Deskew with the Fast Edge Output ................................43
Figure 34 - Trigger Settings for Deskew with the Fast Edge Output ...........................................................44
Figure 35 - Measurement Settings for De skew with the Fast Edge Output .................................................44
Figure 36 - Adjusted Timebase Se ttings for De skew ...................................................................................44
Figure 37 - Save Waveform Settings for Deskew w ith the Fast Edge Output ..............................................45
Figure 38 - Final Screen with Channel 2 and 3 Deskewed...........................................................................45
Figure 39 - The Skew pa rameter right side dialog, Skew clock 2 tab, showing default setup .....................47
917719 Rev A 5
Page 6
INTRODUCTION
QPHY-USB3-Tx -Rx is a software package designed to capture, analyze, and report measurements in
conformance with SuperSpeed USB electrical specification standard. A copy of the specification can be found at
www.usb.org.
Compatibility
QPHY-USB3-Tx -Rx is a software option compatible with the following LeCroy X-Stream oscilloscopes:
WM813Zi, SDA813Zi, DDA813Zi (4x40 GS/s, 2x80GS/s) and higher bandwidth equivalents.
SDA II and Eye Doctor II software is required.
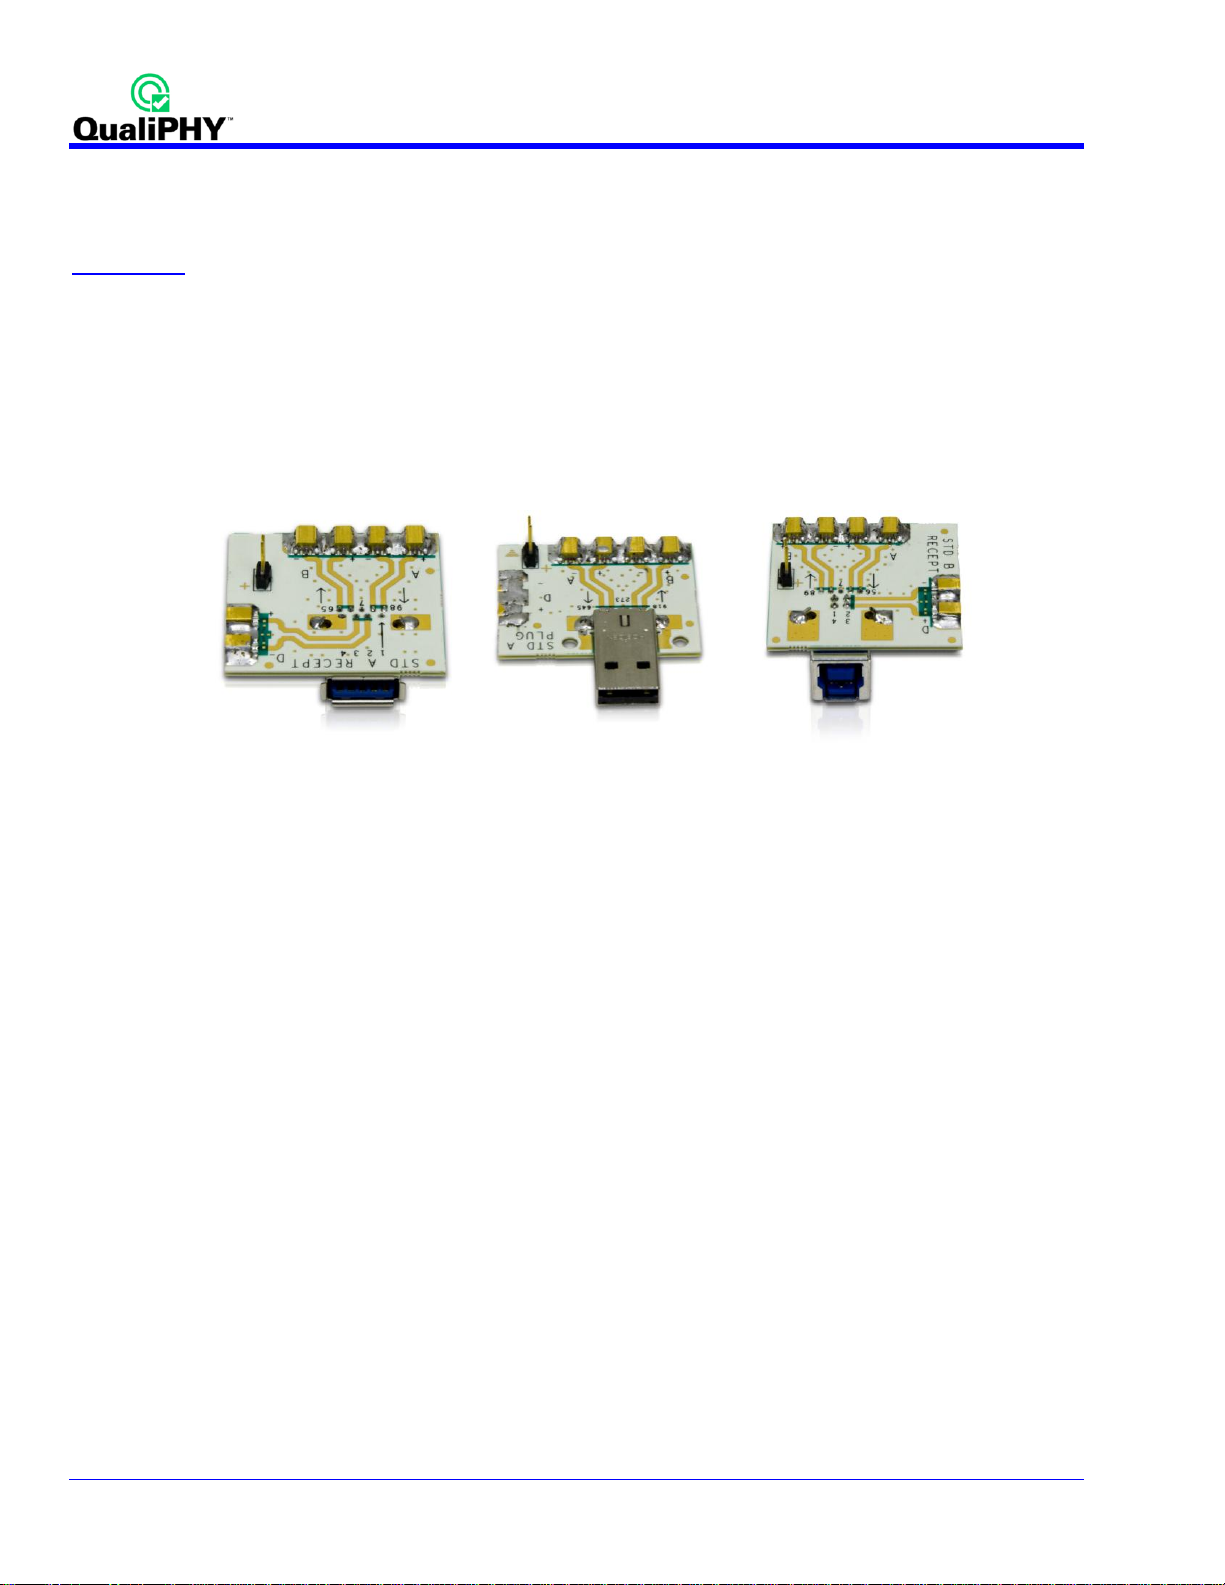
The TF-USB3 test fixture set is required for QPHY-USB3-Tx-Rx. This fixture set includes an A-Plug, A-Receptacle
and B-Receptacle fixtures. The Tx+, Tx-, Rx+ and Rx- signals are routed via low loss traces to SSMP connectors.
Eight 2 inch SSMP to SMA cables are provided with the TF-USB3 kit.
Figure 1 - TF-USB3 Fixture Set
Additional Options Equipment Available from LeCroy
Eagle PeRT3 System (1 channel) – PER-R006-S01-X
o Eagle Receiver Tolerance Test Suite – PER-R006-008-A
o Eagle USB 3.0 Receiver Test Suite – USB-R006-001-A
Keithley S46 RF-Microwave Switch System with 8 SPDT Relays – RF-Switch-8-SPDT
Pair of +/- 1ps phase matched cables (8 inches) – Matched-SMA-Cables-8inch-Pair
Pair of +/- 1ps phase matched cables (12 inches) – Matched-SMA-Cables-12inch-Pair
Pair of +/- 1ps phase matched cables (18 inches) – Matched-SMA-Cables-18inch-Pair
Pair of +/- 1ps phase matched cables (24 inches) – Matched-SMA-Cables-24inch-Pair
GPIB Host Option for LeCroy Oscilloscope – GPIB-HOST
6 917719 Rev A
Page 7

QPHY-USB3-Tx-Rx Software Option
QualiPHY Compliance Test Platform
QualiPHY is LeCroy’s unique compliance test framework which leads the user through the compliance tests.
QualiPHY displays connection diagrams to ensure tests run properly, automates the oscilloscope setup, and
generates full compliance reports.
QualiPHY makes USB 3.0 compliance testing easy and fast.
The QualiPHY software application automates the test and report generation.
Figure 2. Report menu in QualiPHY General Setup
917719 Rev A 7
Page 8
See the QualiPHY Operator’s Manual for more information on how to use the QualiPHY framework.
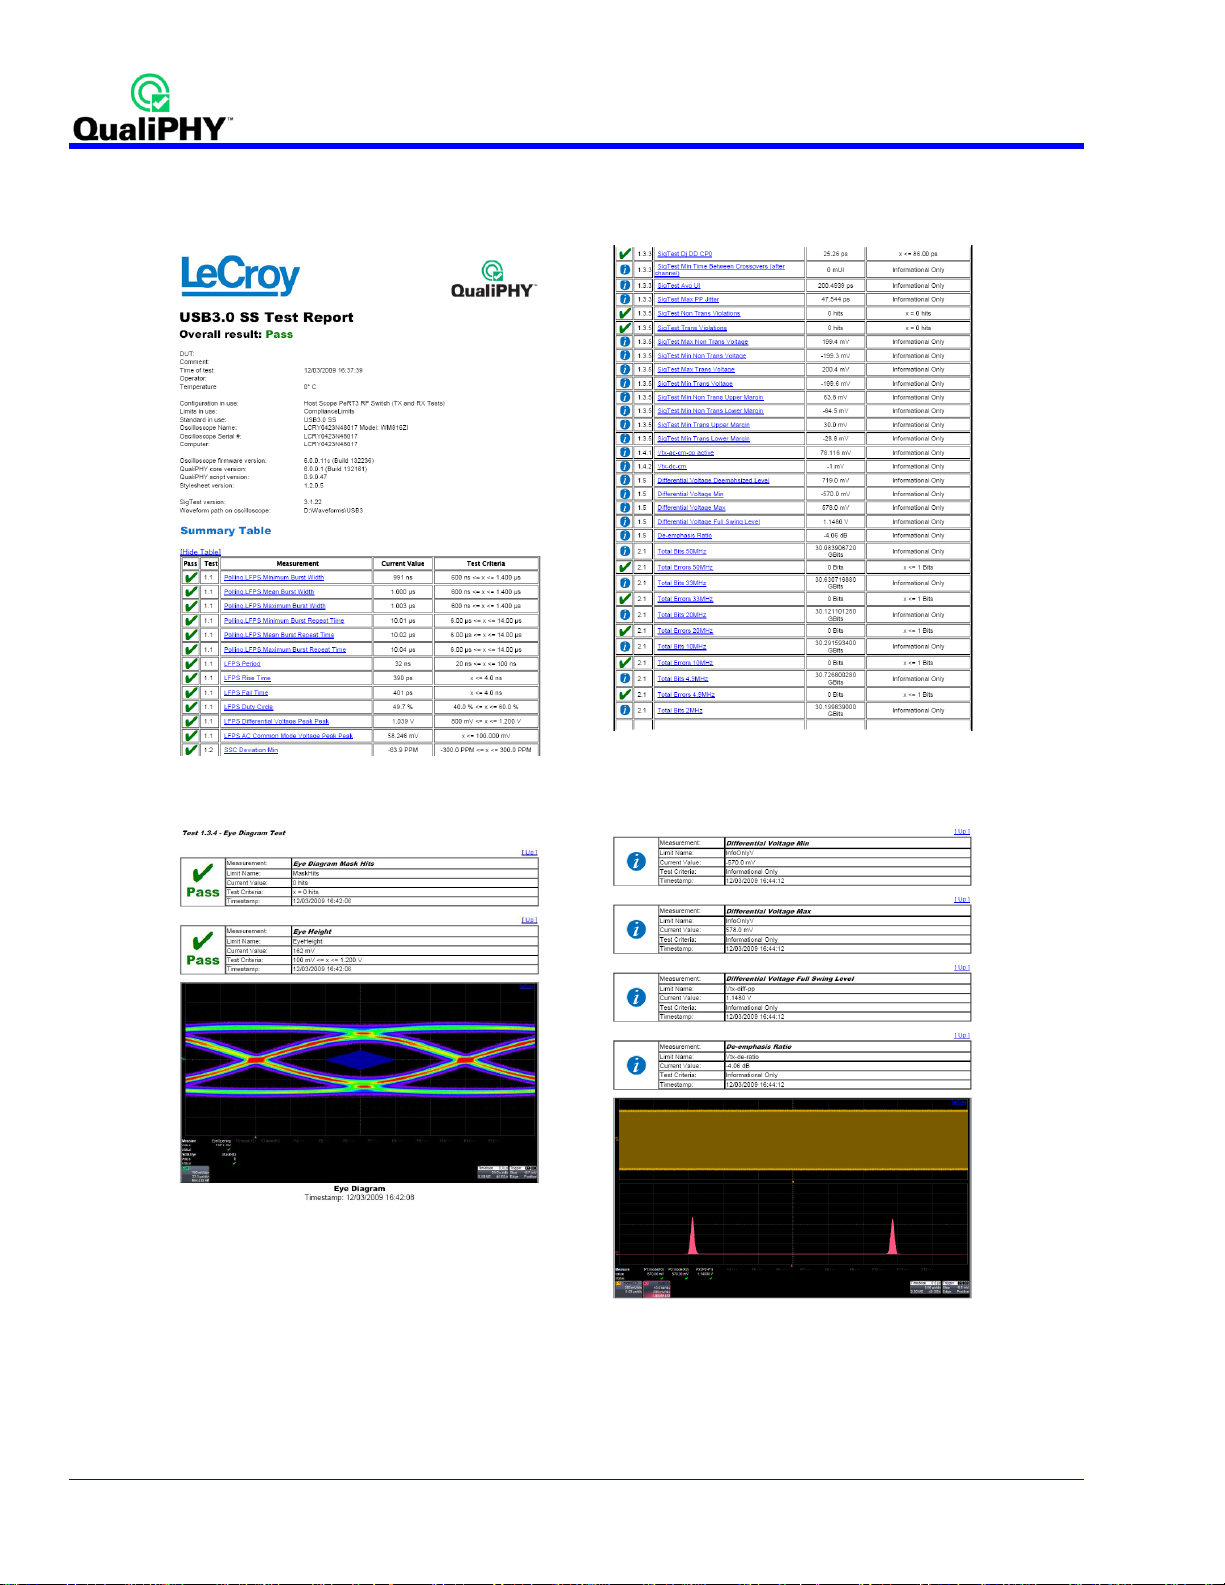
Figure 3. The Test Report includes a summary table with links to the detailed test results
8 917719 Rev A
Page 9

QPHY-USB3-Tx-Rx Software Option
Oscilloscope Option Key Installation
An option key must be purchased to enable the QPHY-USB3 option. Call LeCroy Customer Support to place an
order and receive the code.
Enter the key and enable the purchased option as follows:
1. From the oscilloscope menu select Utilities Utilities Setup...
2. Select the Options tab and click the Add Key button.
3. Enter the Key Code using the on-screen keyboard.
4. Restart the oscilloscope to activate the option after installation.
Typical (Recommended) Configuration
QualiPHY software can be executed from the oscilloscope or a host computer. The first step is to install QualiPHY.
Please refer to the QualiPHY O perator’s Manual for installation instructions.
LeCroy recommends running QualiPHY on an oscilloscope equipped with Dual Monitor Display capability (Option
DMD-1 for oscilloscopes where this is not standard). This allows the waveform and measurements to be shown
on the oscilloscope LCD display while the QualiPHY application and test results are displayed on a second
monitor.
By default, the oscilloscope appears as a local host when QualiPHY is executed in the oscilloscope. Follow the
steps under Oscilloscope Selection (as follows) and check that the IP address is 127.0.0.1.
Remote (Network) Configuration
It is also possible to install and run QualiPHY on a host computer, controlling the oscilloscope with a Network/LAN
Connection.
The oscilloscope must already be configured, and an IP address (fixed or network-assigned) must already be
established.
Oscilloscope Selection
Set up the oscilloscope using QualiPHY over a LAN (Local Area Network) by doing the following:
1. Make sure the host computer is connected to the same LAN as the oscilloscope. If unsure, contact
your system administrator.
2. From the oscilloscope menu, select Utilities Utilities Setup…
3. Select the Remote tab.
4. Verify the oscilloscope has an IP address and the control is set to TCP/IP.
5. Run QualiPHY in the host computer and click the General Setup button.
6. Select the Connection tab.
7. Enter the IP address from step 4 (previous).
8. Click the Close button.
QualiPHY is now ready to control the oscilloscope.
917719 Rev A 9
Page 10
QualiPHY tests the oscilloscope connection after clicking the Start button. The system prompts you if there is a
connection problem. QualiPHY’s Scope Selector function can also be used to verify the connection. Please refer
to the QualiPHY Operator’s Manual for explanations on how to use Scope Selector and other QualiPHY
functions.
Accessing the QPHY-USB3-Tx-Rx Software using QualiPHY
This topic provides a basic overvi ew of QualiP HY’s capabilities. Please refer to the QualiPHY Operator’s Manual
for detailed information.
Access the QPHY-USB3-Tx-Rx software using the following steps:
1. Wait for the oscilloscope to start and have its main application running.
2. Launch QualiPHY from the Analysis menu if installed on the oscilloscope or from the desktop icon if
installed on a host computer.
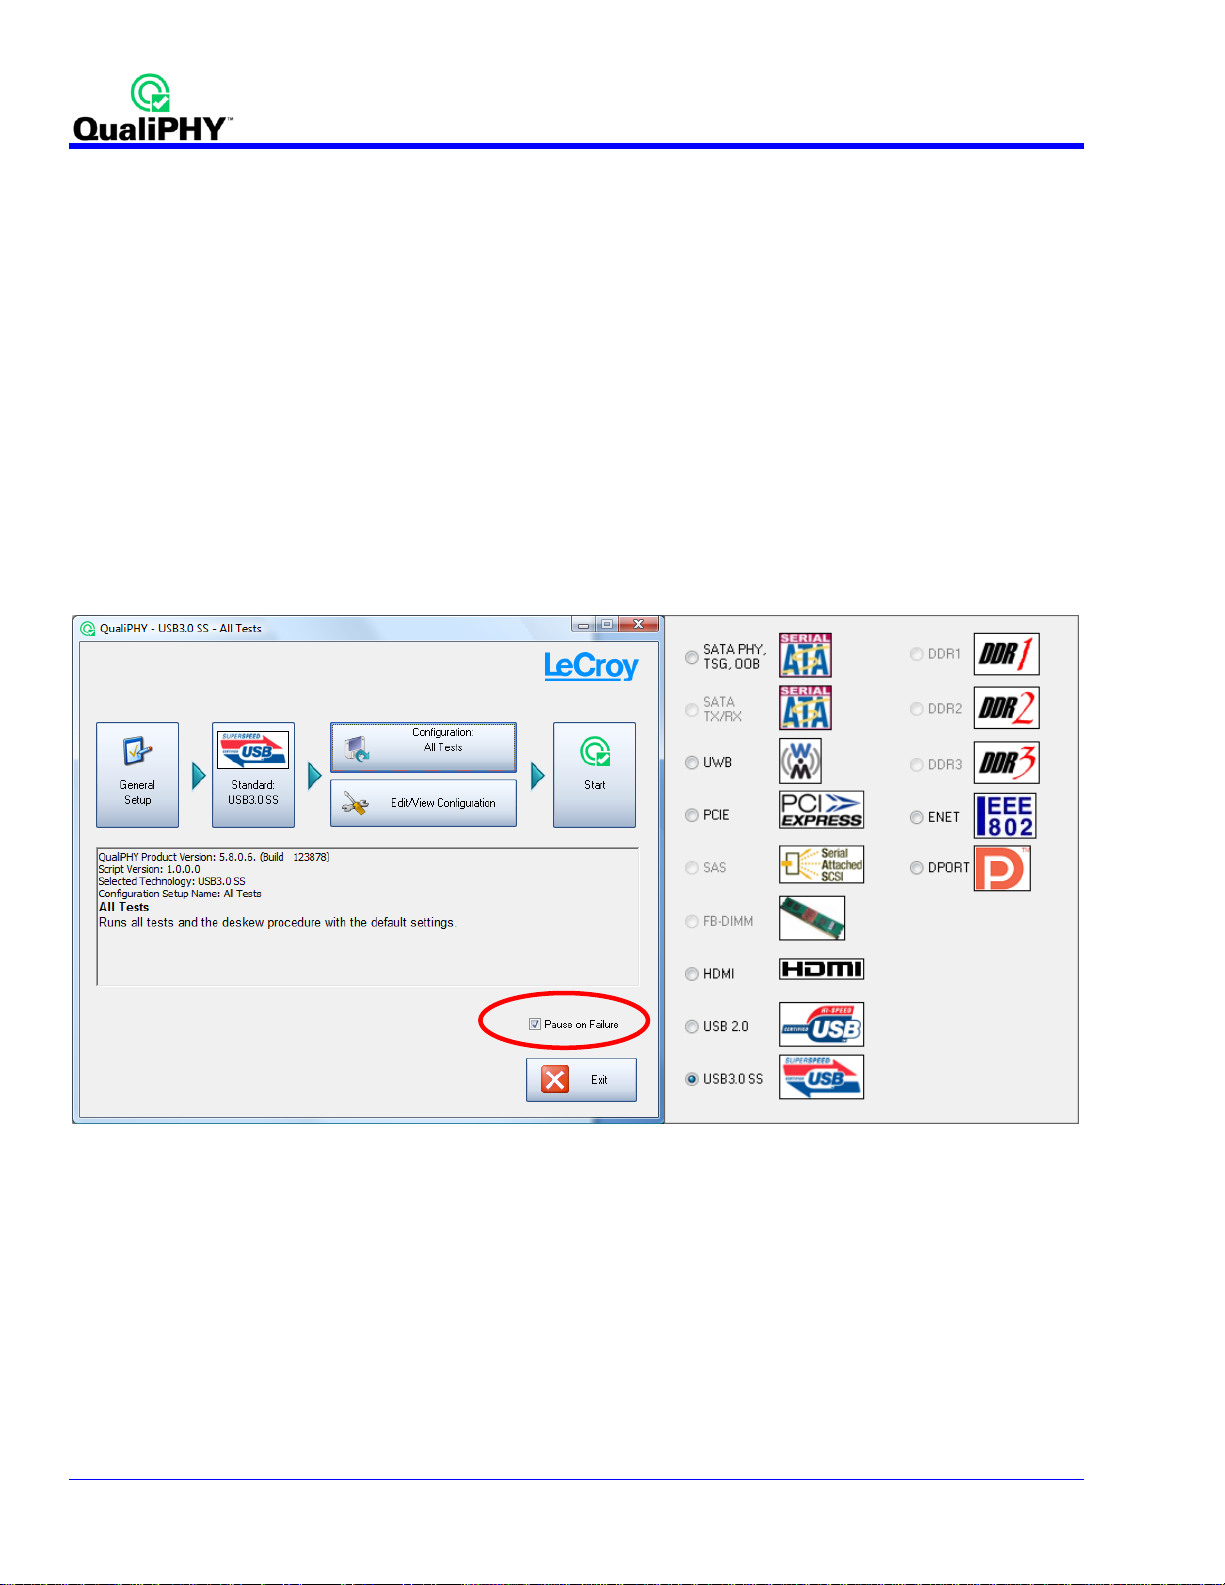
3. From the QualiPHY main window (as follows), select Standard, then USB3.0 SS from the pop-up menu
(if not already selected). If you check the Pause on Failure box (circled) QualiPHY prompts to retry the
measure whenever a test fails.
Figure 4. QualiPHY main menu and compliance test Standard selection menu
10 917719 Rev A
Page 11

QPHY-USB3-Tx-Rx Software Option
4. Click the Configuration button in the QualiPHY main menu.
5. Select a configuration from the pop-up menu. For addition information, please refer to the
QPHY-USB3-Tx -Rx Test Configurations section of this manual.
Figure 5. QualiPHY configuration selection menu
6. Click Start.
7. Follow the pop-up window prompts.
917719 Rev A 11
Page 12
Customizing QualiPHY
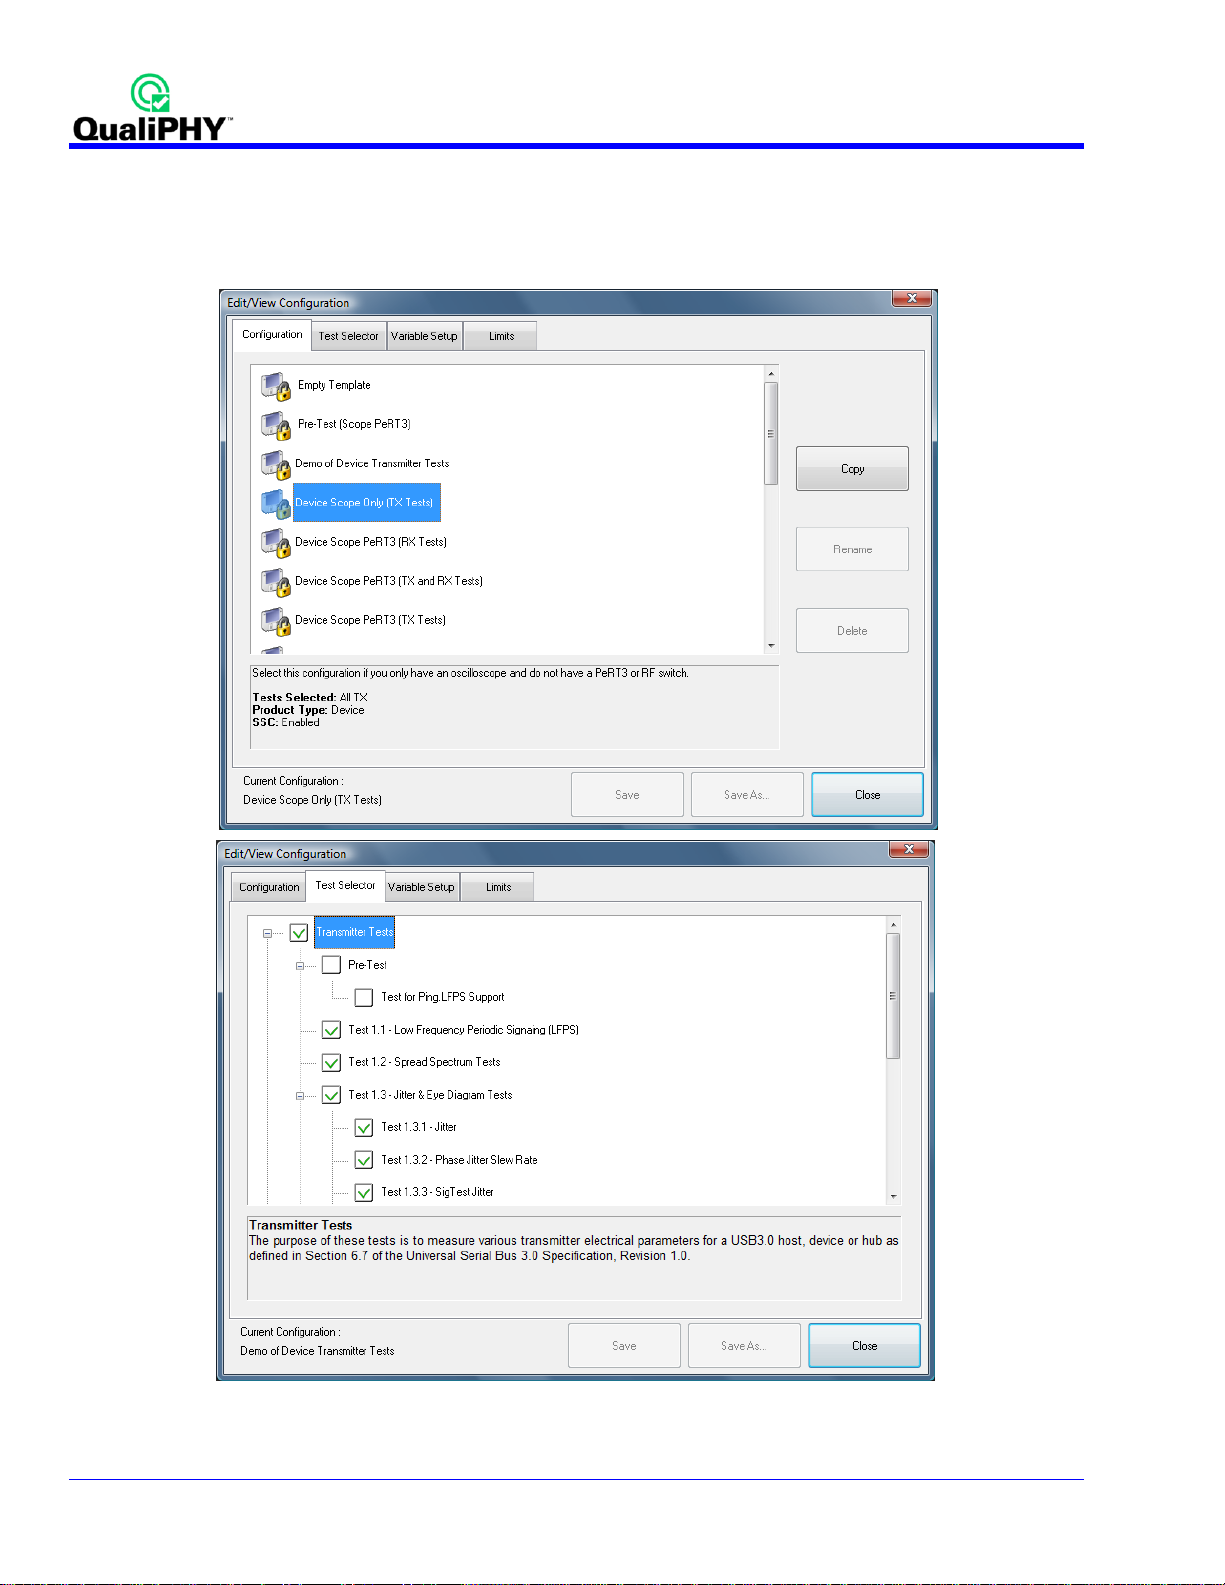
The predefined configurations in the Configuration screen can be modified but can only be saved as a new
configuration. You can also create your own test configurations by copying one of the standard test configurations
and making modifications. A description of the test is also shown in the description field when selected.
Figure 6. QualiPHY test item selection menu
12 917719 Rev A
Page 13
QPHY-USB3-Tx-Rx Software Option
Creating Custom Configurations
Beginning with any of the pre-loaded configurations,
1. Click on the Test Selector tab to change what tests you would like to be included in your new
configuration.
2. Click on the Variable Setup tab to change the variables for your new configuration.
For additional information, refer to the QPHY-USB3-Tx-Rx Variables section of this manual.
3. Click on the Limits tab to change which limit set should be used for your new configuration
For additional information, refer to the QPHY-USB3-Tx-Rx Limits section of this manual.
4. Once a change has been made to any of these sections, the Save As button is enabled at the bottom of
the dialog.
5. Clicking the Save As button prompts you for a new configuration name and description.
Note: If a Custom Configuration was used for the procedure, the Save button is also enabled on the bottom of the dialog. Clicking this button
updates the current configuration with new changes. Additionally, if the user does not wish to save their changes, they can chose to run
QualiPHY with the variables set as the want without saving. However, when the user attempts to switch to another configuration, the system
prompts to save or abandon the current configuration.
6. Once a custom configuration is defined, script variables and the test limits can be changed by using the
Variable Setup and Limits Manager from the Edit/View Configuration window.
917719 Rev A 13
Page 14
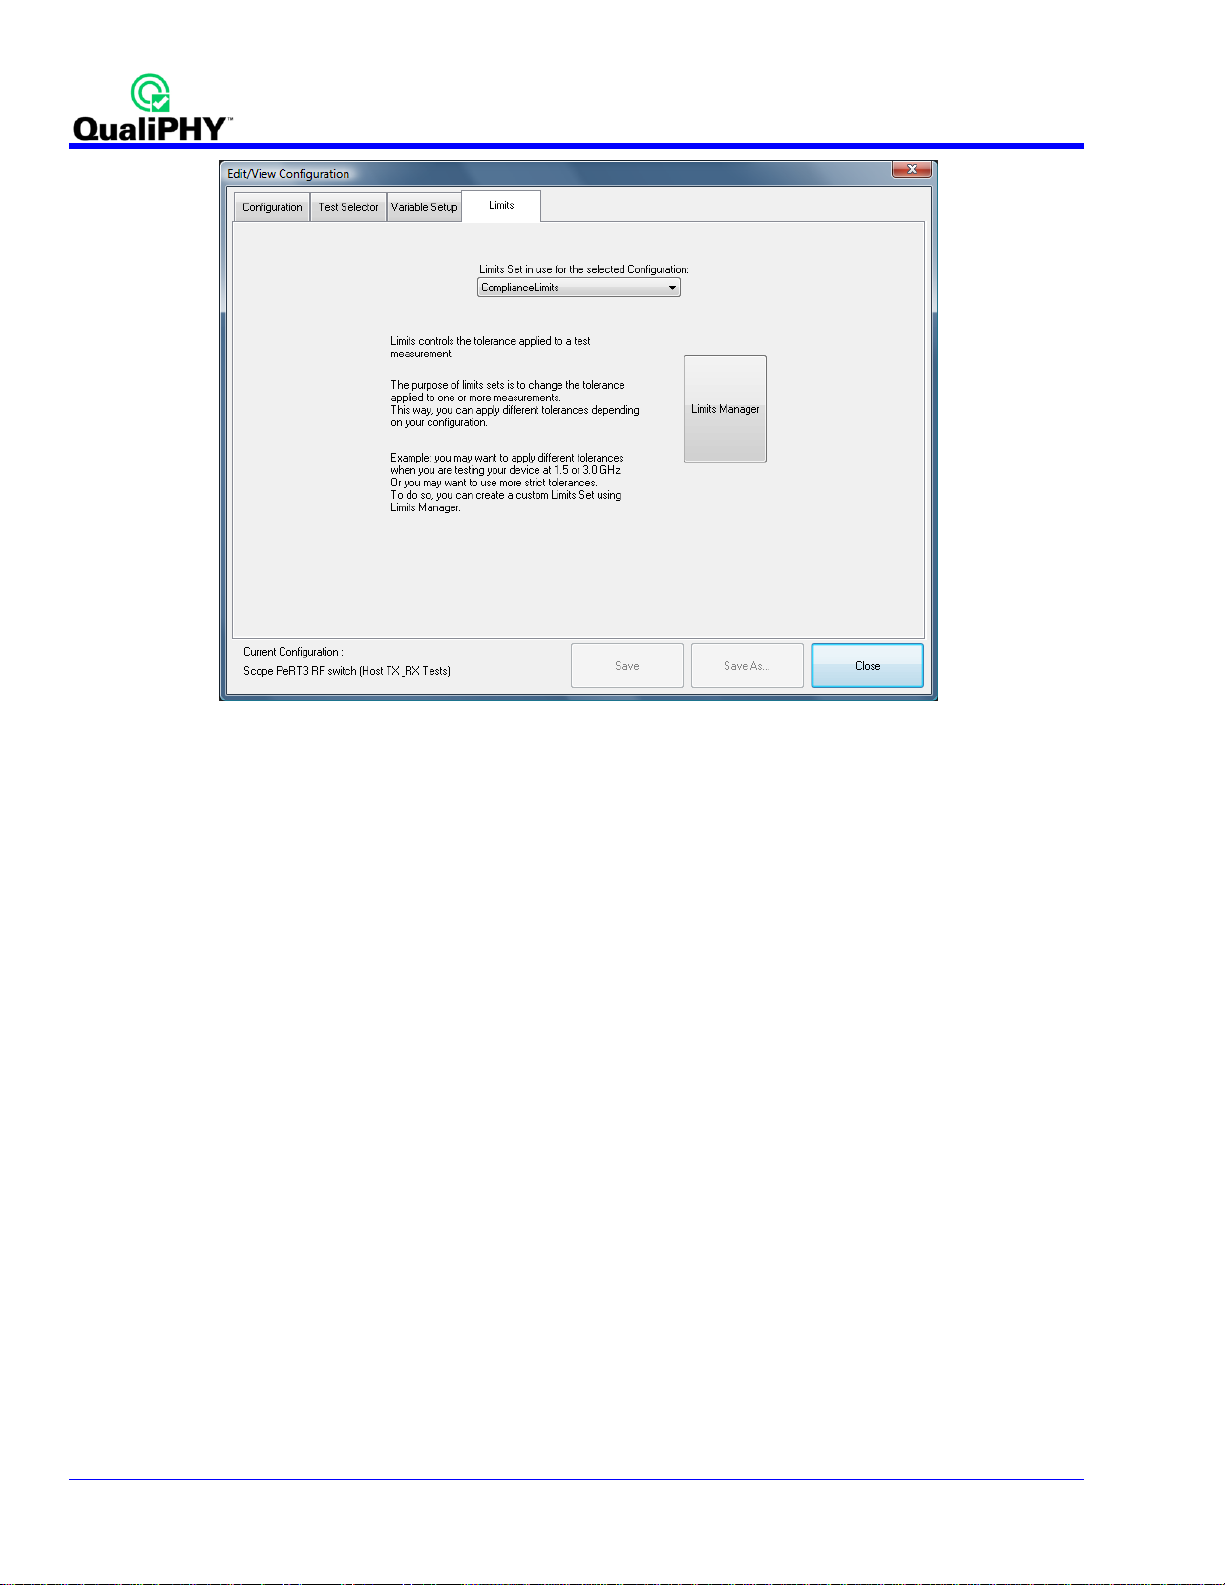
Figure 7. Variable Setup and Limits Manager windows
14 917719 Rev A
Page 15
QPHY-USB3-Tx-Rx Software Option
QPHY-USB3-Tx-Rx Operation
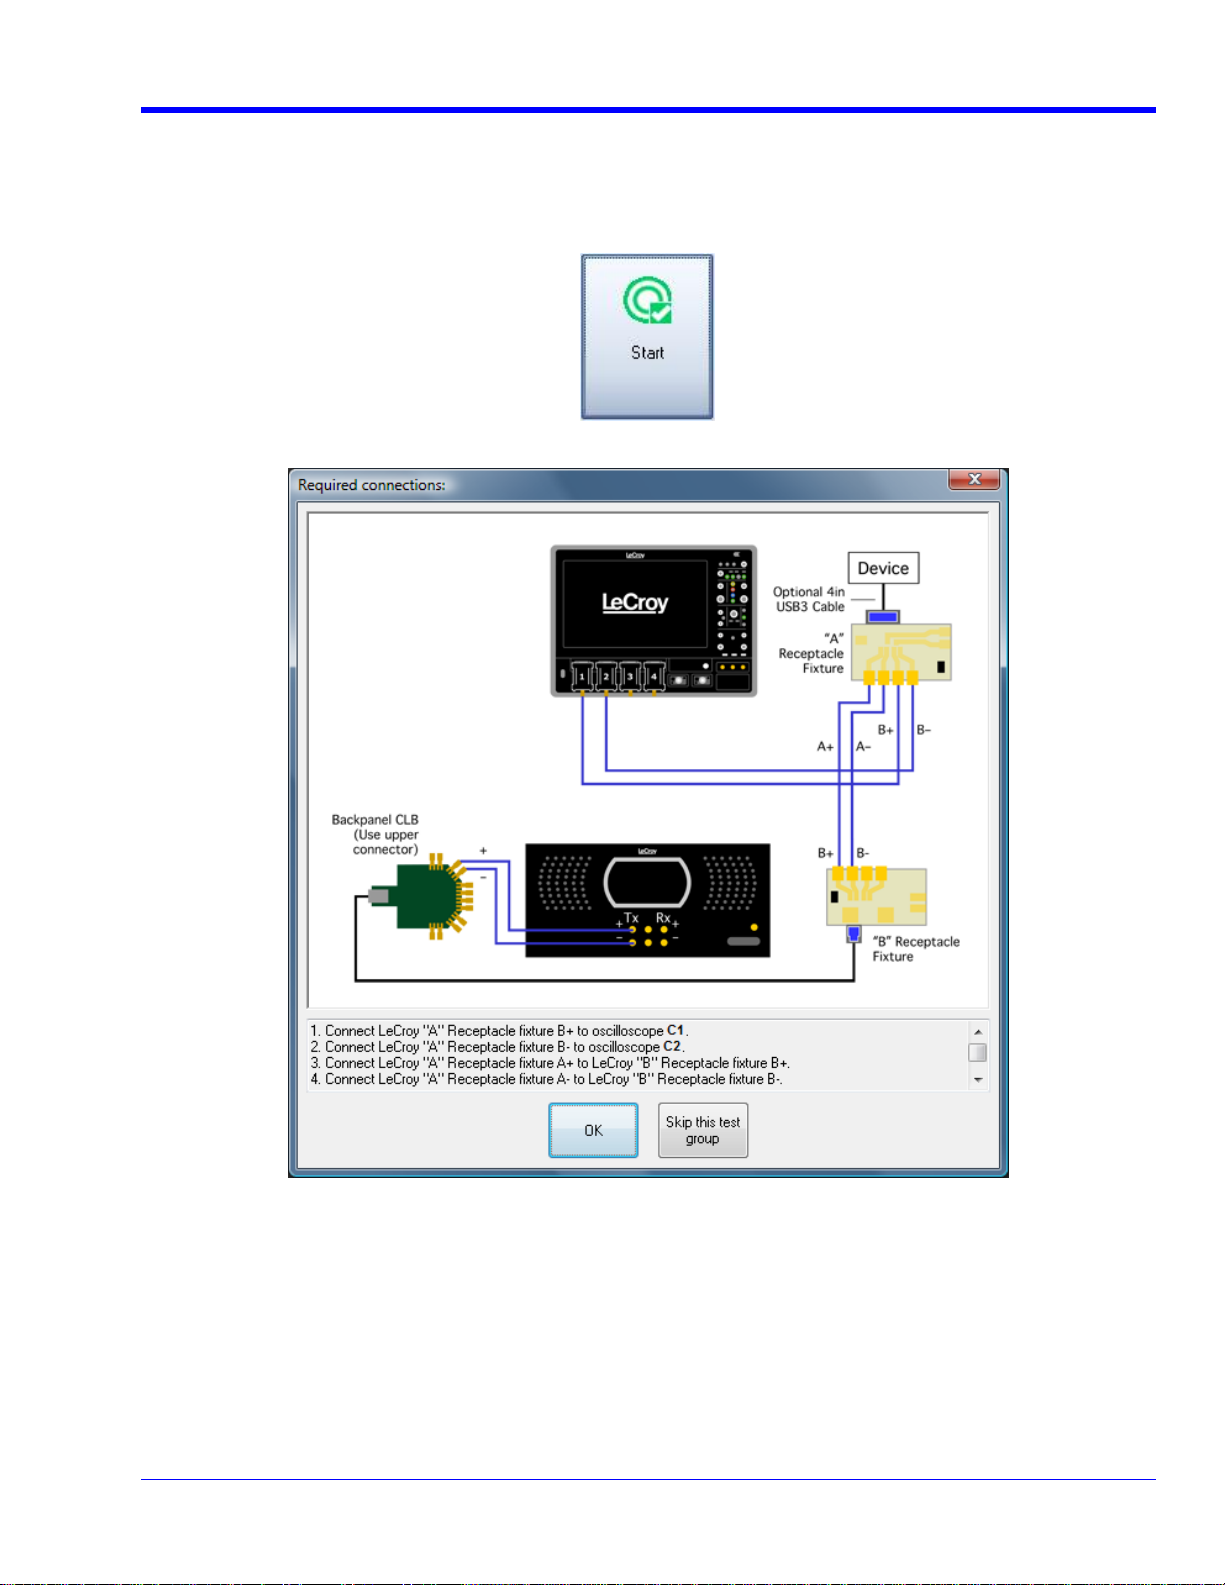
After pressing Start in the QualiPHY menu, the software instructs how to set up the test using pop-up connection
diagrams and dialog boxes. QualiPHY also instructs how to properly configure the Product Under Test (PUT) to
change test signal modes (when necessary).
Figure 8. Start button
Figure 9. Example of pop-up connection diagram and dialog box
917719 Rev A 15
Page 16

GUIDE TO OPERATION
QPHY-USB3-Tx -Rx was designed to utilize the features of the SDA 8Zi and the PeRT3. When using these 2
instruments together, there are many benefits that are not available when using either instrument independently. If
the user wishes to use the PeRT3 without the oscilloscope, the software for the PeRT3 must be used. One of the
many benefits of using the PeRT3 is its ability to stimulate the Product Under Test (PUT) to output the appropriate
compliance patterns required for transmitter testing. Additionally, QPHY-USB3-Tx -Rx can also utilize an RF Switch
to automate the switching of cables that would otherwise have to be manually configured by the user.
There are 2 types of electrical tests required by the SuperSpeed USB Electrical Test Specification: Transmitter
and Receiver tests.
Transmitter Testing
Transmitter testing requires the PUT to output specific compliance patterns and tests are performed on these
patterns. This can be done using only the oscilloscope. This requires the user to manually make the proper
connections between the PUT and the oscilloscope. Additionally, the user must be able to stimulate the PUT to
output the proper compliance pattern as required by QPHY-USB3-Tx-Rx.
If the oscilloscope and PeRT3 are being used together (and the PUT supports Ping.LFPS), then the PeRT3 can be
used to stimulate the PUT to enter compliance mode and transmit the proper compliance pattern. This makes
transmitter testing completely automated.
Receiver Testing
Receiver testing requires the PUT to be put into Loopback mode and the jitter tolerance of the receiver is
measured over 8 frequencies of sinusoidal jitter. When using the PeRT3 alone, receiver testing can be performed
manually using the PeRT3 software application. This requires the user to manually make the proper connections
between the PUT and the PeRT3. This is not supported by QPHY-USB3-Tx-Rx.
If the oscilloscope and PeRT3 are being used together (and the PUT supports Loopback mode), then the PeRT3
can be used to stimulate the PUT to enter loopback mode and then perform the jitter tolerance test as required.
Transmitter and Receiver Testing
When adding the RF Switch to the setup, fully automated transmitter and receiver testing is possible. The RF
Switch automatically routes the receiver of the PUT to the transmitter of the PeRT3 and the transmitter of the PUT
to the oscilloscope. In this configuration, all of the transmitter tests can be performed. When these tests are
complete, the RF Switch automatically switches in the compliance test channel in between the transmitter of the
PeRT3 and the receiver of the PUT. Additionally, the transmitter of the PUT is routed to the receiver of the PeRT3.
In this configuration, the jitter tolerance test can be performed.
Using QPHY-USB3-Tx-Rx
The QualiPHY software makes it easy to test a product for compliance. The extent to which QualiPHY can
automate the instruments and PUT depends on the equipment available and the capabilities of the product under
test. There are three supported hardware configurations in QPHY-USB3-Tx-Rx: Oscilloscope only, Oscilloscope
and PeRT3 and Oscilloscope and PeRT3 with RF Switch. For each hardware configuration there are
corresponding configurations in QualiPHY that are selectable in the top dialog. Refer to the QPHY-USB3-Tx-Rx
Test Configurations section of this manual for more information about selecting configurations.
Oscilloscope Only
Customers that do not have a PeRT3 sh ould select one of the “Scope Only ” configurations. These configurations
can also be selected for reduced automation and more hands-on testing, which can be useful for debugging or if
the PUT does not respond well to automation from the PeRT3. When using these configurations the QualiPHY
software automates the oscilloscope and sets up all the tests. At the appropriate time QualiPHY prompts the user
to make connections to the PUT and to control the PUT to output the proper test signals. Then QualiPHY resumes
the tests and continues to automate the oscilloscope.
16 917719 Rev A
Page 17

QPHY-USB3-Tx-Rx Software Option
Oscilloscope and PeRT3
With the addition of a PeRT3, the control of the PUT can also be automated. In the QualiPHY software there are
corresponding “Scope PeRT3” configurations that can be selected. There are three for devices and three for
hosts: transmitter tests (TX), receiver tests (RX) and both TX and RX tests.
For TX testing the PeRT3 can send an LFPS Ping to the PUT to cycle it through the different compliance patterns
CP0 – CP8. If the PUT does not support the LFPS Ping method of changing the compliance pattern and a
proprietary method must be used then the PeRT3 should not be used for TX testing. Instead use the Oscilloscope
Only configuration as described above. Alternatively, if the PUT supports loopback the TX tests can be run using
PeRT3 automation to place the PUT into loopback mode.
Note, that not all tests can be conducted correctly when using the loopback method. Therefore, the results should
be considered as informative and not used for compliance testing. In particular, the de-emphasis test requires a
compliance pattern that does not have de-emphasis. In loopback mode the de-emphasis in the PUT cannot be
disabled so the de-emphasis measurement cannot be done properly. Furthermore, in loopback mode there are
usually skips present in the data that may cause variations in the results when compared to using the LFPS Ping
mode.
Oscilloscope and PeRT3 with RF Switch
With the addition of an RF switch, QualiPHY can automate connection changes as well. As with the oscillosc ope
and PeRT3 configuratio n, the QualiPHY software has three “Scope PeRT3 RF Switch” configurations that can be
selected.
OPERATING THE PERT3 MANUALLY
The PeRT3 can be operated from the stand-alone PeRT3 application or from within the XStreamDSO application.
For instructions on using the stand-alone application please consult the PeRT3 documentation. In many situations
it is convenient to operate the PeRT3 from within the XStreamDSO application. The PeRT3 control dialog is
located under Analysis -> PeRT3. (The stand-alone PeRT3 application must be installed in order for the PeRT3
controls to appear on the Analysis menu.) When the dialog is first opened it looks as follows:
The first step is to setup the connection to the PeRT3 server. Set the IP Address / Hostname control to the IP
address or hostname of the machine that is physically connected to the PeRT3 via USB2 cable. The default value
is “localhost,” which is used when the PeRT
Server to establish communication with the PeRT3. The text below the Connect to PeRT Server button should
change to indicate the connection is being established and shortly after it should indicate that the PeRT3 is
connected. If the connection fails an error message is shown in the Status Message area at the bottom right of the
dialog. The connection fails if the PeRT3 is already being accessed from the PeRT3 stand-alone application or
from another oscilloscope or computer. After the connection is established a dialog tab is added for each PeRT3
channel.
After the connection is established, set the Protocol, Data Rate, Clock Out and SSC controls as desired and click
Configure PeRT. After a brief delay the text below those controls indicates that the PeRT3 is configured
successfully.
3
is connected to the oscilloscope. Next, click Connect to PeRT
At this point the PeRT3 is ready for use. Most of the controls on the PeRT3 dialogs correspond closely with the
controls in the stand-alone application. One exception is the Output ALIGN/SKP checkbox. When this checkbox
is unchecked the PeRT3 suppresses the symbols required to be inserted periodically (SKP for USB3, ALIGN for
SATA, etc). The default state is checked; however, you may disable those symbols for transmitter testing in
loopback or for receiver test calibration.
The remainder of this section specifically focuses on using the PeRT3 controls when testing USB3. The 3 key
operations are: LFPS Ping, Loopback and, receiver test calibration.
917719 Rev A 17
Page 18

LFPS Ping using the PeRT
To send an LFPS Ping from the PeRT3 the PeRT3 TX+ and TX- should be connected to RX+ and RX- of the PUT.
The PeRT3 controls should be set as follows:
Count Type: Bit Errors
Initialize: Custom Sequence
Custom Init Sequence: TX Test Init
Then click Connect to PUT. The TX Test Init sequence sets the PeRT3 output to electrical idle to prepare for
sending an LFPS Ping. (Some USB3 implementations have been observed to react to the TX Test Init as an LFPS
Ping.) Next, change the Custom Init Sequence to TX Test Ping. Then click Connect to PUT to send an LFPS
Ping. It is convenient to view the output of the PUT on the screen and watch the pattern change when the Ping is
sent.
Loopback Mode using the PeRT3
To place a USB3 product in loopback both the TX and RX of the PeRT3 must be connected to the PUT. The
PeRT3 controls should be set as follows:
Count Type: Bit Errors
Initialize: Loopback
Custom Init Sequence: No Disconnect Support (Default)
Output ALIGN/SKP: Checked
The PUT should be turned off. Click Connect to PUT. The PeRT3 sends out LFPS and waits to see LFPS from
the PUT. Next, turn on the PUT. For devices, VBUS power may need to be applied as well. The PUT should now
be connected.
3
Clicking the Main tab shows the following dialog:
The Termination controls how long a receiver test runs. The termination can be set separately for individual
channels or for all channels at once using the Termination For control. Verify the PUT is correctly in loopback by
setting the controls as follows:
Termination For: All Channels
Termination Type: Run Forever
Now, click the Start button. The Status Message should indicate that the PeRT3 is running and Pattern Locked
should appear in the top right with a green light next to it. It may take a few seconds to load the pattern the first
time Start is pressed before it changes to the Pattern Locked state. If the PeRT3 cannot obtain a pattern lock it
stops running after a short time. If this occurs, using other Initialize and Custom Init Sequence settings may
help debug the problem. Debugging loopback operation is beyond the scope of this manual. Please consult the
PeRT3 documentation for more guidance.
Receiver Test Calibration using the PeRT3
Receiver testing involves applying a fixed amount of jitter to a signal and controlling the amplitude and preemphasis. It is important that these be applied correctly and therefore it is desirable to measure the jitter,
amplitude and pre-emphasis of the PeRT3. Setup the PeRT3 to output the receiver test signal by setting the
controls on the PeRT3 dialog as follows:
Count Type: Bit Errors
Initialize: Loopback (blind / no handshake)
18 917719 Rev A
Page 19

QPHY-USB3-Tx-Rx Software Option
Custom Init Sequence: No Disconnect Support (Default)
Output ALIGN/SKP: unchecked
Click the Connect to PUT button. The Initialize setting Loopback (blind / no handshake) causes the PeRT3 to
skip through the LFPS handshake and behave as if the link is up. In this state the PeRT3 can be used to generate
USB3 signals without the RX inputs connected. By connecting the TX outputs to the oscilloscope the jitter,
amplitude and pre-emphasis can be measured.
Next, click on the CH1 tab and the following dialog is shown:
Adjust the controls on the dialog to apply the amplitude, pre-emphasis and jitter as desired. You can also choose
a pattern.
Note: The USB3 specification refers to de-emphasis, not pre-emphasis. They are effectively the same. However, for pre-emphasis the
amplitude refers to the amplitude of the bits before emphasis is added. For de-emphasis the amplitude refers to the amplitude of the bits
before emphasis is removed. Since the PeRT3 controls are for pre-emphasis the target amplitude is low er than the USB3 specification. For
example, if the desired amplitude of the emphasized bits is 750mV and the amount of emphasis is 3.5dB the amplitude setting f or the PeRT3 is
3.5dB less than 750mV, which is 500mV.
After setting up the channel controls click on the Main tab. Configure the controls as follows:
Termination For: All Channels
Termination Type: Run Forever
Now, click the Start button to begin sending out the pattern chosen with the applied jitter, amplitude and preemphasis.
917719 Rev A 19
Page 20

QPHY-USB3-TX-RX TEST CONFIGURATIONS
Configurations include variable settings and limit sets as well, not just test selections. For more information, refer
to the QPHY-USB3-Tx-Rx Test Descriptions and QPHY-USB3-Tx-Rx Variables sections of this manual.
Empty Template
This confi guration is intentionally left blank so it can easily be copied and configured to the user’s custom
configuration. The limit set in use is ComplianceLimits. All of the variables are set to their default settings.
Pre-Test (Scope PeRT3)
This configuration is meant to be run prior to running any other configuration. This configuration runs the
Ping.LFPS Support Test to determine if the Product under test supports the necessary modes to fully automate
the running of the remaining tests. A PeRT3 is required for this configuration.
Demo of Device Transmitter Tests
This configuration runs all transmitter tests using saved waveforms located on the oscilloscope in the
D:\Waveforms\USB3\Demo directory on the oscilloscope. This configuration is meant to easily demonstrate the
QPHY-USB3-Tx -Rx capabilities when live signals cannot be tested.
Device Scope Only (Host TX Tests)
This configuration is meant to run all of the transmitter tests for a user that does not have a PeRT3 or the RF
Switch. All of the variables are set to default except Product Type is set to “Device” and Channel File is set to
“Host11inWith3mCable.s4p.” The limit set is use is ComplianceLimits. The tests that are run are:
Test 1.1 – Low Frequency Periodic Signaling
Test 1.2 – Spread Spectrum Tests
Test 1.3 – Jitter & Eye Diagram Tests
o Test 1.3.1 – Jitter
o Test 1.3.2 – Phase Jitter Slew Rate
o Test 1.3.3 – SigTest Jitter
o Test 1.3.4 – Eye Diagram
o Test 1.3.5 – SigTest Eye Diagram
Test 1.4 – AC & DC Common Mode Test
Test 1.5 – Differential Voltage & De-emphasis Test
Device Scope PeRT3 (Host RX Tests)
This configuration is meant to run all of the receiver tests for a user that has a PeRT3 but not the RF Switch. All of
the variables are set to default except Product Type is set to “Device”, Use PeRT3 is set to “Yes” and Channel
File is set to “Host11inWith3mCable.s4p.” The limit set used is ComplianceLimits. The test run are:
Test 2.1. – Jitter Tolerance Test
20 917719 Rev A
Page 21

QPHY-USB3-Tx-Rx Software Option
Device Scope PeRT3 (Host TX and RX Tests)
This configuration is meant to run all of the transmitter and receiver tests for a user that has a PeRT3 but not the
RF Switch. All of the variables are set to default except Product Type is set to “Device”, Use PeRT3 is set to
“Yes” and Channel File is set to “Host11inWith3mCable.s4p.” The limit set used is ComplianceLimits. The tests
that are run are:
Test 1.1 – Low Frequency Periodic Signaling
Test 1.2 – Spread Spectrum Tests
Test 1.3 – Jitter & Eye Diagram Tests
o Test 1.3.1 – Jitter
o Test 1.3.2 – Phase Jitter Slew Rate
o Test 1.3.3 – SigTest Jitter
o Test 1.3.4 – Eye Diagram
o Test 1.3.5 – SigTest Eye Diagram
Test 1.4 – AC & DC Common Mode Test
Test 1.5 – Differential Voltage & De-emphasis Test
Test 2.1. – Jitter Tolerance Test
Device Scope PeRT3 (Host TX Tests)
This configuration is meant to run all of the transmitter tests for a user that has a PeRT3 but not the RF Switch. All
variables are set to default except Product Type (set to “Device”), Use PeRT3 (set to “Yes”) and Channel File
(set to “Host11inWith3mCable.s4p”). The limit set used is ComplianceLimits. The tests that are run are:
Test 1.1 – Low Frequency Periodic Signaling
Test 1.2 – Spread Spectrum Tests
Test 1.3 – Jitter & Eye Diagram Tests
o Test 1.3.1 – Jitter
o Test 1.3.2 – Phase Jitter Slew Rate
o Test 1.3.3 – SigTest Jitter
o Test 1.3.4 – Eye Diagram
o Test 1.3.5 – SigTest Eye Diagram
Test 1.4 – AC & DC Common Mode Test
Test 1.5 – Differential Voltage & De-emphasis Test
Device Scope PeRT3 RF Switch (Host RX Tests)
This configuration is meant to run all of the transmitter tests for a user that has a PeRT3 and the RF Switch. All
variables are set to default except Product Type (set to “Device”), Use PeRT3 (set to “Yes”), Use RF Switch (set
to “Yes”), Channel File (set to “Host11inWith3mCable.s4p”) , De-embed Cables (set to “Yes”) and Cable S-
Parameters File (set to “green24white12.s4p”). The green24white12.s4p file is installed with QualiPHY and is
appropriate for de-embedding the 24inch green cables and 12 inch silver cables with white label that are included
as part of the USB3-TX-RX bundle. The limit set used is ComplianceLimits. The tests that are run are:
Test 2.1. – Jitter Tolerance Test
917719 Rev A 21
Page 22

Device Scope PeRT3 RF Switch (Host TX and RX Tests)
This configuration is meant to run all of the transmitter tests for a user that has a PeRT3 and the RF Switch. All
variables are set to default except Product Type (set to “Device”), Use PeRT3 (set to “Yes”), Use RF Switch (set
to “Yes”), Channel File (set to “Host11inWith3mCable.s4p”) , De-embed Cables (set to “Yes”) and Cable S-
Parameters File (set to “green24white12.s4p”). The green24white12.s4p file is installed with QualiPHY and is
appropriate for de-embedding the 24inch green cables and 12 inch silver cables with white label that are included
as part of the USB3-TX-RX bundle. The limit set used is ComplianceLimits. The tests that are run are:
Test 1.1 – Low Frequency Periodic Signaling
Test 1.2 – Spread Spectrum Tests
Test 1.3 – Jitter & Eye Diagram Tests
o Test 1.3.1 – Jitter
o Test 1.3.2 – Phase Jitter Slew Rate
o Test 1.3.3 – SigTest Jitter
o Test 1.3.4 – Eye Diagram
o Test 1.3.5 – SigTest Eye Diagram
Test 1.4 – AC & DC Common Mode Test
Test 1.5 – Differential Voltage & De-emphasis Test
Test 2.1. – Jitter Tolerance Test
Device Scope PeRT3 RF Switch (Host TX Tests)
This configuration is meant to run all of the transmitter tests for a user that has a PeRT3 and the RF Switch. All
variables are set to default except Product Type (set to “Device”), Use PeRT3 (set to “Yes”), Use RF Switch (set
to “Yes”), Channel File (set to “Host11inWith3mCable.s4p”) , De-embed Cables (set to “Yes”) and Cable S-
Parameters File (set to “green24white12.s4p”). The green24white12.s4p file is installed with QualiPHY and is
appropriate for de-embedding the 24inch green cables and 12 inch silver cables with white label that are included
as part of the USB3-TX-RX bundle. The limit set used is ComplianceLimits. The tests that are run are:
Test 1.1 – Low Frequency Periodic Signaling
Test 1.2 – Spread Spectrum Tests
Test 1.3 – Jitter & Eye Diagram Tests
o Test 1.3.1 – Jitter
o Test 1.3.2 – Phase Jitter Slew Rate
o Test 1.3.3 – SigTest Jitter
o Test 1.3.4 – Eye Diagram
o Test 1.3.5 – SigTest Eye Diagram
Test 1.4 – AC & DC Common Mode Test
Test 1.5 – Differential Voltage & De-emphasis Test
Host Scope Only (Host TX Tests)
This configuration is meant to run all of the transmitter tests for a user that does not have a PeRT3 or the RF
Switch. All of the variables are set to default. The limit set used is ComplianceLimits. The tests that are run are:
22 917719 Rev A
Page 23

QPHY-USB3-Tx-Rx Software Option
Test 1.1 – Low Frequency Periodic Signaling
Test 1.2 – Spread Spectrum Tests
Test 1.3 – Jitter & Eye Diagram Tests
o Test 1.3.1 – Jitter
o Test 1.3.2 – Phase Jitter Slew Rate
o Test 1.3.3 – SigTest Jitter
o Test 1.3.4 – Eye Diagram
o Test 1.3.5 – SigTest Eye Diagram
Test 1.4 – AC & DC Common Mode Test
Test 1.5 – Differential Voltage & De-emphasis Test
Host Scope PeRT3 (Host RX Tests)
This configuration is meant to run all of the receiver tests for a user that has a PeRT3 but not the RF Switch. All
variables are set to default except Use PeRT3 is set to “Yes.” The limit set used is ComplianceLimits. The tests
that are run are:
Test 2.1. – Jitter Tolerance Test
Host Scope PeRT3 (Host TX and RX Tests)
This configuration is meant to run all of the transmitter and receiver tests for a user that has a PeRT3 but not the
RF Switch. All of the variables are set to default except Use PeRT3 is set to “Yes.” The limit set used is
ComplianceLimits. The tests that are run are:
Test 1.1 – Low Frequency Periodic Signaling
Test 1.2 – Spread Spectrum Tests
Test 1.3 – Jitter & Eye Diagram Tests
o Test 1.3.1 – Jitter
o Test 1.3.2 – Phase Jitter Slew Rate
o Test 1.3.3 – SigTest Jitter
o Test 1.3.4 – Eye Diagram
o Test 1.3.5 – SigTest Eye Diagram
Test 1.4 – AC & DC Common Mode Test
Test 1.5 – Differential Voltage & De-emphasis Test
Test 2.1. – Jitter Tolerance Test
Host Scope PeRT3 (Host TX Tests)
This configuration is meant to run all of the transmitter tests for a user that has a PeRT3 but not the RF Switch. All
of the variables are set to default except Use PeRT3 is set to “Yes.” The limit set is used is ComplianceLimits.
The tests that are run are:
Test 1.1 – Low Frequency Periodic Signaling
Test 1.2 – Spread Spectrum Tests
917719 Rev A 23
Page 24

Test 1.3 – Jitter & Eye Diagram Tests
o Test 1.3.1 – Jitter
o Test 1.3.2 – Phase Jitter Slew Rate
o Test 1.3.3 – SigTest Jitter
o Test 1.3.4 – Eye Diagram
o Test 1.3.5 – SigTest Eye Diagram
Test 1.4 – AC & DC Common Mode Test
Test 1.5 – Differential Voltage & De-emphasis Test
Host Scope PeRT3 RF Switch (Host RX Tests)
This configuration is meant to run all of the transmitter tests for a user that has a PeRT3 and the RF Switch. All of
the variables are set to default except Use PeRT3 (set to “Yes”), Use RF Switch (set to “Yes”), De-embed
Cables (set to “Yes”) and Cable S-Parameters File (set to “green24white12.s4p”). The green24white12.s4 p file is
installed with QualiPHY and is appropriate for de-embedding the 24inch green cables and 12 inch silver cables
with white label that are included as part of the USB3-TX-RX bundle. The limit set used is ComplianceLimits.
The tests that are run are:
Test 2.1. – Jitter Tolerance Test
Host Scope PeRT3 RF Switch (Host TX and RX Tests)
This configuration is meant to run all of the transmitter tests for a user that has a PeRT3 and the RF Switch. All of
the variables are set to default except Use PeRT3 (set to “Yes”), Use RF Switch (set to “Yes”), De-embed
Cables (set to “Yes”) and Cable S-Parameters File (set to “green24white12.s4p”). The green24white12.s4 p file is
installed with QualiPHY and is appropriate for de-embedding the 24inch green cables and 12 inch silver cables
with white label that are included as part of the USB3-TX-RX bundle. The limit set used is ComplianceLimits.
The tests that are run are:
Test 1.1 – Low Frequency Periodic Signaling
Test 1.2 – Spread Spectrum Tests
Test 1.3 – Jitter & Eye Diagram Tests
o Test 1.3.1 – Jitter
o Test 1.3.2 – Phase Jitter Slew Rate
o Test 1.3.3 – SigTest Jitter
o Test 1.3.4 – Eye Diagram
o Test 1.3.5 – SigTest Eye Diagram
Test 1.4 – AC & DC Common Mode Test
Test 1.5 – Differential Voltage & De-emphasis Test
Test 2.1. – Jitter Tolerance Test
Host Scope PeRT3 RF Switch (Host TX Tests)
This configuration is meant to run all of the transmitter tests for a user that has a PeRT3 and the RF Switch. All of
the variables are set to default except Use PeRT3 (set to “Yes”), Use RF Switch (set to “Yes”), De-embed
Cables (set to “Yes”) and Cable S-Parameters File (set to “green24white12.s4p”). The green24white12.s4 p file is
24 917719 Rev A
Page 25

QPHY-USB3-Tx-Rx Software Option
installed with QualiPHY and is appropriate for de-embedding the 24inch green cables and 12 inch silver cables
with white label that are included as part of the USB3-TX-RX bundle. The limit set used is ComplianceLimits.
The tests that are run are:
Test 1.1 – Low Frequency Periodic Signaling
Test 1.2 – Spread Spectrum Tests
Test 1.3 – Jitter & Eye Diagram Tests
o Test 1.3.1 – Jitter
o Test 1.3.2 – Phase Jitter Slew Rate
o Test 1.3.3 – SigTest Jitter
o Test 1.3.4 – Eye Diagram
o Test 1.3.5 – SigTest Eye Diagram
Test 1.4 – AC & DC Common Mode Test
Test 1.5 – Differential Voltage & De-emphasis Test
917719 Rev A 25
Page 26

QPHY-USB3-TX-RX TEST DESCRIPTIONS
Pre-Test
Test for Ping.LFPS Support
By utilizing the PeRT3, this test checks to see if the Product under test supports the required Ping.LFPS mode
that the PeRT3 uses to stimulate the PUT to generate the appropriate compliance patterns for each test. The
PeRT3 sends the Init.LFPS command to the PUT to stimulate the PUT to enter compliance mode. Then, the
PeRT3 sends a Ping.LFPS command to the PUT and the oscilloscope checks that the appropriate CP0 pattern is
being transmitted by the PUT. Then, another Ping.LFPS command is sent and the oscilloscope checks that the
appropriate CP1 pattern is being transmitted by the PUT. This is repeated for all compliance patterns.
Test 1.1 Low Frequency Periodic Signaling (LFPS)
The purpose of this test group is to verify the voltage and timing parameters of the Low Frequency Periodic
Signaling (LFPS) are within the specification limits.
At the completion of the Low Frequency Periodic Signaling Test the oscilloscope is in the following configuration:
Figure 10 - Oscilloscope Configuration after LFPS Test
On this screen there are 4 traces visible. F1 is the result of the subtraction of C1 and C2. This is the differential
LFPS trace. F2 is the result of the addition of C1 and C2 divided by 2. This is the common mode LFPS trace. F3
shows only the first 6 bursts of the differential LFPS trace and F4 shows only the first 6 bursts of the common
mode LFPS trace.
The burst width is measured in parameter P1. P2 is used to measure the time between the bursts (tRepeat). P3
measures the period of the signal within the burst. P4 and P5 measure the 20-80% rise time and 80-20% fall time
of the pulses within the burst. P6 and P7 measure the duty cycle and amplitude of the signals within the burst. P8
measures the peak-to-peak amplitude of the Common Mode Trace.
26 917719 Rev A
Page 27

QPHY-USB3-Tx-Rx Software Option
Figure 11 - Test Report from LFPS Tests
Test 1.2 Spread Spectrum Tests
The purpose of this test is to measure the spread spectrum modulation frequency and deviation and verify that
they are within the specification limits.
At the completion of the Spread Spectrum Tests the oscilloscope is in the following configuration:
Figure 12 - Oscilloscope Configuration after SSC Tests
917719 Rev A 27
Page 28

On this screen (shown previously) 1 trace is visible. This is the SSCTrack of the captured waveform.
The minimum and maximum of the SSC Track is measured in P1 and P2. The frequency of the SSC Track is
measured in P3.
Figure 13 - Test Report from SSC Tests
Test 1.3 Jitter & Eye Diagram Test
Test 1.3.1 Jitter
The purpose of this test group is to verify that the jitter is within the specification limits. For compliance testing the
measurements are made after a compliance channel after applying the reference Continuous Time Linear
Equalizer (CTLE) function. Measuring the jitter is a multiple step process. First, the jitter must be measured while
the PUT is transmitting the CP1 (101010) pattern. Then, the jitter is measured while the PUT is transmitting the
CP0 (scrambled D0.0) pattern, however the random jitter (Rj) that was measured during the jitter test of CP1 must
be injected into this measurement. This simplifies the separation of random (Rj) and deterministic jitter (Dj) since
there is no data depending jitter (DDj, a component of Dj) when CP1 is transmitted.
At the completion of the CP1 Jitter Test the oscilloscope is in the following configuration:
Figure 14 - Oscilloscope Configuration after CP1 Jitter Test
On this screen there are 2 traces visible. They are the TIE Histogram and the Bathtub Curve. Also, the Tj, Rj
(spectral) and Dj (spectral) are displayed in the SDA Jitter section.
Additionally the minimum pulse width in the acquired waveform is measured in P1.
28 917719 Rev A
Page 29

QPHY-USB3-Tx-Rx Software Option
At the completion of the CP0 Jitter Test the oscilloscope is in the following configuration:
Figure 15 - Oscilloscope Configuration after CP0 Jitter Test
On this screen there are 2 traces visible. They are the TIE Histogram and the Bathtub Curve. Again, the Tj, Rj
(spectral) and Dj (spectral) are displayed in the SDA Jitter section. However, as per the USB 3.0 SuperSpeed
Electrical Compliance Test Specification, the Rj that was measured on CP1 is injected into this measurement.
Additionally the minimum pulse width in the acquired waveform is measured in P1. Average UI is not shown on
the screen, but is reported with the other results.
Figure 16 - Test Report from Jitter Tests
Test 1.3.2 Phase Jitter Slew Rate
The purpose of this test group is to verify that the jitter slew rate is within the specification limits . This is a
measure of how fast the PLL in a USB3.0 receiver has to change in order to keep up with changes in the clock
frequency. Performing this test requires calculation of the first derivative of the PLL Track. The PLL Track is a
waveform that shows the phase change that the PLL was able to follow and track out of the signal. By taking the
first derivative of the PLL Track we can easily measure the minimum and maximum phase jitter slew rate on the
derivative waveform.
917719 Rev A 29
Page 30

At the completion of the Phase Jitter Slew Rate Test the oscilloscope is in the following configuration:
Figure 17 - Oscilloscope Configuration after Phase Jitter Slew Rate Test
On this screen there are 2 traces visible. These are the PLLTrack of the captured waveform and the first
derivative of the PLLTrack is show in F1.
The minimum and maximum of the derivative of the PLL Track is measured in P1 and P2. The Tj, Rj and Dj value
are also on by default when looking at any jitter trace (the PLL Track in this case).
Figure 18 - Test Report from Phase Jitter Slew Rate Test
Test 1.3.3 SigTest Jitter
The purpose of this test group is to verify that the jitter is within the specification limits using the SigTest DLL
provided by the USB-IF and integrated into the oscilloscope software. The test is performed in the same manner
that Test 1.3.1 is performed, with the exception of that the SigTest DLL is used for analysis, not the SDA II
software. For compliance testing the measurements are made after a compliance channel after applying the
reference Continuous Time Linear Equalizer function. The SigTest DLL currently implements the CTLE function,
however, it does not implement the channel emulation. For this reason, the channel emulation is still performed in
Eye Doctor II before the signal is seen by SigTest. Measuring the jitter is a multiple step process. First, the jitter
must be measured while the PUT is transmitting the CP1 (101010) pattern. Then, the jitter is measured while the
PUT is transmitting the CP0 (scrambled D0.0) pattern, however the Rj that was measured during the jitter test of
CP1 must be injected into this measurement. This simplifies the separation of Rj and Dj since there is no DDj
when CP1 is transmitted.
30 917719 Rev A
Page 31

QPHY-USB3-Tx-Rx Software Option
At the completion of the CP1 SigTest Jitter Test the oscilloscope is in the following configuration:
Figure 19 - Oscilloscope Configuration after SigTest CP1 Jitter Test
There are no traces shown on the screen at this time. The parameters displayed are the Tj, Rj and Dj calculated
by SigTest. Additionally, the Maximum Peak-to-peak Jitter, the Average UI, the Bit Rate, and the Minimum
Crossing time are also displayed.
Figure 20 - Test Report from SigTest Jitter Test
Test 1.3.4 Eye Diagram
The purpose of this test group is to verify that the eye diagram is within the specification limits. For compliance
testing the measurements are made after a compliance channel after applying the reference Continuous Time
Linear Equalizer function.
917719 Rev A 31
Page 32

At the completion of the Eye Diagram Test the oscilloscope is in the following configuration:
Figure 21 - Oscilloscope Configuration after Eye Diagram Test
Shown on the screen is the Eye Diagram measured while the PUT is transmitting CP0. Also, the compliance mask
is displayed. The parameters that are shown are the Number of Mask Hits, and the Eye Opening.
Figure 22 - Test Report from Eye Diagram Test
Test 1.3.5 SigTest Eye Diagram
The purpose of this test group is to verify that the eye diagram is within the specification limits using the SigTest
DLL provided by the USB-IF and integrated into the oscilloscope software. The test is performed in the same
manner that Test 1.3.4 is performed, with the exception of that the SigTest DLL is used for analysis, not the SDA
II software. For compliance testing the measurements are made after a compliance channel after applying the
reference Continuous Time Linear Equalizer function. The SigTest DLL currently implements the CTLE function,
however, it does not implement the channel emulation. For this reason, the channel emulation is still performed in
Eye Doctor II before the signal is seen by SigTest.
32 917719 Rev A
Page 33

QPHY-USB3-Tx-Rx Software Option
At the completion of the SigTest Eye Diagram Test the oscilloscope is in the following configuration:
Figure 23 - Oscilloscope Configuration after SigTest Eye Diagram Test
Shown on the screen are the SigTest Non-Transition and Transition Eye Diagrams along with the compliance
mask. The parameters that are shown are the number of Mask Violations, the Minimum Voltage, the Maximum
Voltage, the difference between the minimum high voltage and the mask (MinHMargin), and the difference
between the maximum low voltage and the mask (MinLoMargin). These parameters are shown for both the NonTransition Eye (NT) and the Transition Eye (T).
Figure 24 - Test Report from SigTest Eye Test
917719 Rev A 33
Page 34

Test 1.4 AC and DC Common Mode Voltage Tests
The purpose of this test group is to verify that the AC and DC common mode voltages are within the specification
limits. The AC Common Mode Voltage is defined as the peak-to-peak Voltage of the common mode signal and
the DC Common Mode Voltage is defined as the mean voltage of the common mode signal.
At the completion of the AC and DC Common Mode Voltage Test the oscilloscope is in the following
configuration:
Figure 25 - Oscilloscope Configuration after AC and DC Common Mode Test
On this screen there are 2 traces visible. In F1, the 2 input channels are added together and divided by 2 to
yield the common mode trace. In Z1, we show a zoom of this trace. The AC Common mode is calculated by
measuring the peak-to-peak value of this zoom trace (P1). The DC Common mode measurement is made over a
longer interval of time and is calculated by measuring the mean value of F1, the complete trace (P2).
Figure 26 - Test Report from AC and DC Common Mode Test
Test 1.5 Differential Voltage & De-emphasis Test
The purpose of this test is to verify that the Differential Voltage and De-emphasis are within the specification
limits. These 2 tests are performed together in 2 steps. The first step acquires the CP7 compliance pattern. This
pattern consists of 50-250 1’s followed by 50-250 0’s with de-emphasis applied to the signal. Once this acquisition
is performed, a histogram is created from the data. The difference between the 2 modes of the histogram is
calculated and is the amplitude of the de-emphasized bits.
34 917719 Rev A
Page 35

QPHY-USB3-Tx-Rx Software Option
At the completion of this part of the Differential Voltage & De-emphasis Test the oscilloscope is in the following
configuration:
Figure 27 - Oscilloscope Configuration after Differential Voltage & De-emphasis Test on CP7
On the screen are 2 visible traces. The first is the result of the acquisition of the CP7 signal after (optional) cable
de-embedded has been performed. The second is the histogram created from this signal. P1 and P2 are the 2
modes of the histogram. These 2 parameters only differ in the measurement gates that have been set. P3 is the
difference of the 2 modes.
Then this is repeated on the CP8 pattern. This pattern consists of the same 50-250 1’s followed by 50-250 0’s
without de-emphasis applied to the signal. The histogram is created and the difference between the 2 modes is
calculated. This result is the differential voltage (without de-emphasis). The differential voltage and the amplitude
of the de-emphasized bits are then used to calculate the de-emphasis ratio.
917719 Rev A 35
Page 36

At the completion of this part of the Differential Voltage & De-emphasis Test the oscilloscope is in the following
configuration:
Figure 28 - Oscilloscope Configuration after Differential Voltage & De-emphasis Test on CP8
On the screen are 2 visible traces. The first is the result of the acquisition of the CP8 signal after (optional) cable
de-embedded has been performed. The second is the histogram created from this signal. P1 and P2 are the 2
modes of the histogram. These 2 parameters only differ in the measurement gates that have been set. P3 is the
difference of the 2 modes.
Figure 29 - Test Report from Differential Voltage & De-emphasis Test
Receiver Test Calibration
As of the release of this version of QPHY-USB3-Tx-Rx, the receiver test calibration portion of the specification has
not yet been fully defined. For this reason, this test gives the user the ability to manually set their own jitter
parameters that the PeRT3 uses during each of the 8 points of the jitter tolerance test. The existing calibration
settings are loaded for the user. These values can be verified using the SDA II software and modified as
necessary. If the user modifies the values, they are saved for future use. For additional information, refer to the
Receiver Test Calibration section of this manual.
36 917719 Rev A
Page 37

QPHY-USB3-Tx-Rx Software Option
Test 2.1 Jitter Tolerance Test
The purpose of this test is to verify that the jitter tolerance test is within specification limits. To do this the PeRT3
output must first be calibrated. Specified previously, as of the release of this version of QPHY-USB3-Tx -Rx, the
receiver test calibration portion of the specification has not yet been finalized. Once, the PeRT3 output is
calibrated, the PeRT3 sets the PUT into loopback mode and performs the jitter tolerance test on the 8 required
points: 50MHz, 33MHz, 20MHz, 10MHz, 4.9MHz, 2MHz, 1MHz and 500kHz.
Figure 30 - Test Report from Jitter Tolerance Test
917719 Rev A 37
Page 38

QPHY-USB3-TX-RX VARIABLES
The variable settings in QualiPHY give the user the ability to customize their QualiPHY configurations. These
variables control what connection diagrams are displayed, what additional equipment can be used, filenames for
external files, address, etc. Detailed descriptions of each variable contained within
QPHY-USB3-Tx -Rx are explained as follows:
Always Reconnect PUT
This variable gives the user the ability to force the PeRT3 to always reconnect to the PUT after each run. The
default value for the variable is “No.” In this state, the PeRT3 determines if the PUT is in the correct mode
(compliance or loopback) for the next set of tests. When set to “Yes” the PeRT3 always disconnects and
reconnects to the PUT on every run.
Cable S-Parameters File
This variable allows the user to specify the S-Parameter filename (s4p) used when de-embedding the cables and
fixtures associated with their setup. This variable is only used if the De-embed Cables variable is set to “Yes.” By
default this variable is blank.
De-embed Cables
This variable allows the user to de-embed the cables and/or fixturing associated with their setup. Select “Yes” to
de-embed cables and/or fixturing using the S-Parameter file (s4p) specified in the Cable S-Parameters File
variable. The default value for this variable is “No.”
Demo Mode
This variable allows the user to run the tests in demo mode. When you set this value to “Yes,” you can run the
tests in demonstration mode using saved waveforms. The waveforms must be located in the Saved Waveform
Path. During demo mode, the user is still prompted with connection diagrams based on their other variable
selections. This allows the user to experience running the test as it would be run on live signals. The default value
for this variable is “No.”
RF Switch GPIB Address
This variable allows the user to select the GPIB address for the Keithley S46 RF Switch that can optionally be
used with this system. The default value for this variable is “7.” (This is the default value for the Keithley S46 RF
Switch).
Maximum PeRT3 retries
This variable allows the user to select the maximum number of times for the PeRT3 to retry to connect the link
before aborting. The default value for this variable is “3.”
Disable Connection Diagrams
This variable allows the user to disable the display of connection diagrams. The default for this variable is “No.”
Product Type
This variable allows users to specify if they are testing a Device, Host or Hub. The default for this variable is
“Host.”
Saved Waveform Path
This variable allows the user to specify the path that saved waveforms are recalled from when running in demo
mode or when TestMode is “Use Saved Data.” The default value for this variable is “D:\Waveforms\USB3.”
Save Individual Runs
This variable allows the user to specify if they would like to save the waveforms from multiple runs in the saved
waveform path. When this value is set to “Yes” waveforms are saved in a separate folder each time the test is run
- for example: D:\Waveforms\USB3\[Product under test]\Run1. When set to “No” waveforms are overwritten on
every run and saved in: “D:\Waveforms\USB3\[Product under test].”
38 917719 Rev A
Page 39

QPHY-USB3-Tx-Rx Software Option
S-Parameter Files Path
This variable allows the user to specify the path on the oscilloscope that contains the S-Parameter files used for
emulation and/or de-embedding. The default for this variable is “D:\Applications\EyeDr\USB3.”
SSC
This variable allows the user to specify whether or not Spread Spectrum Clocking (SSC) is enabled on the
Product Under Test. The SigTest Average UI test has different limits based on whether or not SSC is enabled. By
setting this variable, the correct limit for this test can be used. Select “Enabled” if Spread Spectrum Clocking is
enabled, otherwise select “Disabled.” The default is “Enabled” because SSC is required by the USB 3.0
Specification.
Stop On Test to review results
This variable gives the user the option to enable Stop on Test mode. When set to “Yes”, the testing pauses after
each test allowing the user to review the results. The setup is saved so oscilloscope settings can be modified by
the user. When execution is resumed, the setup is recalled. Note that any new acquisition completed while the
testing is paused may cause the testing to misbehave. The default value for this variable is “No.”
Test Mode
This variable allows the user to decide whether the tests should be run on newly acquired data or if previously
saved waveforms should be used. The choices for this variable are “Acquire New Data” and “Use Saved Data.” If
“Use Saved Data” is selected, the waveforms are recalled from the location specified in the Saved Waveform
Path variable. The default value for this variable is “Acquire New Data.”
Use PeRT3
This variable allows the users to select if they would like QualiPHY to automate the PeRT3 to configure the
Product under test for each test. If this variable is set to “No”, the user must have the ability to stimulate their
Product under test to transmit the required test patterns for transmitter testing. The default setting for this variable
is “No.”
Use RF Switch
This variable allows the users to specify whether or not they have an RF Switch. If this variable is set to “Yes,” the
oscilloscope communicates with the RF Switch and makes the required connections without any user interaction.
If this variable is set to “No,” the user must connect their signals when prompted. The default value for this
variable is “No.”
PeRT3 Setup
PeRT3 Hostname or IP Address
This variable allows the user to enter the hostname or IP Address of the PeRT3 Server (the machine that the
PeRT3 is connected to via USB). If QualiPHY is running from a remote PC and not from the oscilloscope,
“localhost” refers to the oscilloscope. The default value for this variable is “localhost.”
PeRT3 SSC Enabled
This variable allows the user to enable SSC on the PeRT3’s clock output. This is required for receiver testing. The
default for this variable is “Yes.”
Transmitter Tests
Deskew measure mode
This variable allows the user to select the method for deskewing their cables. The choices for this variable are
“Wizard Method” and “User Defined.” “Wizard Measured” is used to launch the automated deskew measurement.
“User Defined” is used if the user would like to set the Deskew value in picoseconds variable when the deskew
value is already known. The default value for this variable is “Wizard Method.”
917719 Rev A 39
Page 40

Deskew value in picoseconds
This variable allows the user to specify the channel + cable deskew between channels C1 and C2. The value is in
picoseconds and is applied to the channel C1. This value is only applied to C1 if “User Defined” is selected for the
Deskew measure mode variable.
PeRT3 Amplitude
This variable allows the user to control the amplitude of the PeRT3 during testing. The default for this variable is
0.8mV.
PeRT TX Init Mode
This variable controls the way the PeRT3 configures the product under test to output test patterns. The choices
are “Loopback” or Low Frequency Periodic Signaling (“LFPS”). LFPS mode brings the Product under test into
Compliance Mode and outputs a Ping.LFPS signal to prompt the Product under test to switch to the next
compliance pattern. Loopback mode places the Product under test in Loopback Mode, and then outputs the
required Compliance Test Pattern. This mode does not produce valid compliance test results because the Product
under test outputs SKP symbols into the data. The recommended choice is “LFPS” if it is supported.
Jitter & Eye Diagram Tests
The variables in this section allow the users to decide whether or not they would like the oscilloscope to perform
channel emulation and equalization as described by the specification. If yes, the user also has the ability to
specify the s-parameter file of the channel to emulate. Additionally the user can decide the location of the 2 poles,
the location of the zero and the DC gain for the continuous time linear equalizer (CTLE). Finally, the Jitter Filter
Corner Frequency and Damping Factor that is used by SigTest can be set.
Common Mode Voltage Tests
The variable in this section allows the user to decide what pattern should be used to perform the AC and DC
common mode voltage tests. The default value for the variable is 0 which corresponds to the CP0 compliance
pattern. CP1 – CP8 can also be selected.
Differential Voltage & De-emphasis Test
The variables in this section allow the user to decide what pattern should be used to perform the Differential
Voltage & De-emphasis tests. The default value for the variable is the CP7 compliance pattern for the Pattern with
de-emphasis and the CP8 compliance pattern for the pattern without de-emphasis. CP1 – CP8 can also be
selected. CP0 – CP8 can be selected for either variable.
Receiver Tests
Use Compliance Chanel
This variable allows the user to specify whether or not the compliance channel should be used during the receiver
tests. This variable is only used when the user is also using the RF Switch. Although use of the compliance
channel is required for receiver testing, this variable is useful when debugging problems. The default value for this
variable is “Yes.”
Jitter Tolerance Test
The variables in this section allow the user to specify controls for running the Jitter Tolerance Test. The Symbol
Count variable specifies how many symbols should be tested during the jitter tolerance test. The default value for
this variable is “3e10,” as required for compliance testing. The Frequency to Test variable allows the user to
select “All” or any one particular compliance test frequency for testing. The default value for this variable is “All.”
Also, the Compliance Test Pattern variable allows the user to specify which pattern to use for the jitter tolerance
test. The default value for this variable is “CP0.”
40 917719 Rev A
Page 41

QPHY-USB3-Tx-Rx Software Option
QPHY-USB3-TX-RX LIMITS
The limit sets in QualiPHY give the user the ability to change the criteria that their data values are compared
against. By default, QPHY-USB3-Tx-Rx contains 2 limits sets. They are: ComplianceLimits and SpecLimits. The
ComplianceLimits limit set compares the results only to the limits included in the Electrical Compliance Test
Specification. Only the tests that are specified in the compliance specification are included in this limit set. The
remainders of the tests are considered Informational Only. The SpecLimits limit set compares the results of all of
the tests to the appropriate limit. Only the tests that don’t have specified limits as per the speci fication are
considered Informational Only.
Custom limit sets may also be created. For more information, refer to the QualiPHY Manual.
Figure 31 - QualiPHY Limits Manager
917719 Rev A 41
Page 42

Compliance Pattern
Value
Description
CP0
D0.0 Scrambled
A pseudo-random data pattern that is exactly the same as
logical idle but does not include SKP sequences
CP1
D10.2
Nyquist frequency
CP2
D24.3
Nyquist/2
CP3
K28.5
COM pattern
CP4
LFPS
The low frequency periodic signaling pattern
CP5
K28.7
With de-emphasis
CP6
K28.7
Without de-emphasis
CP7
50-250 1’s and 0’s
With de-emphasis. Repeating 50-250 1’s and then 50-250 0’s
CP8
50-250 1’s and 0’s
Without de-emphasis. Repeating 50-250 1’s and then 50-250
0’s
Compliance Pattern Definitions
The USB3 SuperSpeed compliance patterns are defined in section 6.4.4 of the Universal Serial Bus 3.0
Specification, Revision 1.0 and reproduced as follows for convenience.
42 917719 Rev A
Page 43

QPHY-USB3-Tx-Rx Software Option
MANUAL CALIBRATION PROCEDURES
Cable Deskewing using the Fast Edge Output (WavePro 7 Zi and WaveMaster 8Zi only)
The following procedure demonstrates how to manually deskew two oscilloscope channels and cables using the
fast edge output, with no need for any T connector or adapters.
This can be done once the temperature of the oscilloscope is stable. The oscilloscope must be warmed up for at
least a half-hour before proceeding. This procedure should be run again if the temperature of the oscilloscope
changes by more than a few degrees.
For the purpose of this procedure, the two channels being deskewed are referred to as Channel X and Channel
Y. The reference channel is Channel X and the channel being deskewed is Channel Y.
1. Begin by recalling the Default Oscilloscope Setup
2. Configure the oscilloscope as follows:
Timebase
i. Fixed Sample Rate
ii. Set the Sample Rate to 40 GS/s
iii. Set the Time/Division to 1 ns/div
Figure 32 - Timebase Settings for Deskew with the Fast Edge Output
Channels
i. Turn on Channel X and Channel Y.
ii. Set V/div for Channel X and Channel Y to 100mV/div.
iii. Set the Averaging of Channel X and Channel Y to 500 sweeps.
iv. Set the Interpolation of Channel X and Channel Y to Sinx/x.
Figure 33 - Channel Pre-Processing Settings for Deskew with the Fast Edge Output
Trigger
i. Configure to Source to be FastEdge.
ii. Set the Slope to Positive.
917719 Rev A 43
Page 44

Figure 34 - Trigger Settings for Deskew with the Fast Edge Output
Parameter Measurements:
i. Set the source for P1 to CX and the measure to Delay.
ii. Set the source for P2 to CY and the measure to Delay.
iii. Set the source for P3 to M1 and the measure to Delay.
Figure 35 - Measurement Settings for Deskew with the Fast Edge Output
3. Set the display to Single Grid.
Click Display Single Grid.
4. Using the appropriate adapter, connect Channel X to the Fast Edge Output of the oscilloscope.
5. Adjust the Trigger Delay so that the Channel X signal crosses at the center of the screen.
6. Change the Timebase to 50 ps/div.
Figure 36 - Adjusted Timebase Settings for Deskew
7. Fine tune the Trigger Delay so that the Channel X signal crosses at the exact center of the screen.
8. Press the Clear Sweeps button on the front panel to reset the averaging.
9. Allow multiple acquisitions to occur until the waveform is stable on the screen.
10. Save Channel X to M1.
Click File Save Waveform.
Set Save To Memory.
Set the Source to CX.
Set the Destination to M1.
Click Save Now.
44 917719 Rev A
Page 45

QPHY-USB3-Tx-Rx Software Option
Figure 37 - Save Waveform Settings for Deskew with the Fast Edge Output
11. Disconnect Channel X from the Fast Edge Output and connect Channel Y to the Fast Edge Output.
12. Press the Clear Sweeps button on the front panel to reset the averaging.
13. Allow multiple acquisitions to occur until the waveform is stable on the screen.
14. From the Channel Y menu, adjust the Deskew of Channel Y until Channel Y is directly over the M1 trace.
15. Ensure that P3 and P2 are reasonably close to the same value. (Typically < 5ps difference)
Figure 38 - Final Screen with Channel 2 and 3 Deskewed
917719 Rev A 45
Page 46

Cable Deskewing without using the Fast Edge Output
The following procedure demonstrates how to manually deskew two oscilloscope channels and cables using the
differential data signal, with no need for any T connector or adapters.
This can be done once the temperature of the oscilloscope is stable. The oscilloscope must be warmed up for at
least a half-hour before proceeding. This procedure should be run again if the temperature of the oscilloscope
changes by more than a few degrees.
1. Connect a differential data signal to C2 and C3 using two approximately matching cables. Set up the
oscilloscope to use the maximum sample rate (e.g. for WaveRunner 204Xi: two channel mode; on the
Smart Memory menu set Fixed Sample Rate 10GS/s). Set the timebase for a few repetitions of the
pattern (at least a few dozen edges).
2. On the C3 menu, check Invert. Now C2 and C3 should look the same.
3. Using the Measure Setup, set P1 to measure the Skew of C2, C3. Turn on Statistics (Measure menu).
Write down the mean skew value after it stabilizes. This mean skew value is the addition of Data skew +
cable skew + channel skew.
4. Swap the cable connections on the Data source side (on the test fixture), and then press the Clear
Sweeps button on the oscilloscope (to clear the accumulated statistics; since we changed the input).
5. Write down the mean skew value after it stabilizes. This mean skew value is the addition of (-Data skew)
+ cable skew + channel skew.
6. Add the two mean skew values and divide the sum in half:
UU[Data skew + cable skew + channel skew] + [ (-Data skew) + cable skew + channel skew]UU
7. The above formula simplifies to:
8. Set the resulting value as the Deskew value in C2 menu.
9. Restore the cable connections to their Step 1 settings (previous). Press the Clear Sweeps button on the
oscilloscope. The mean skew value should be approximately zero - that is the data skew. Typically,
results are <1ps given a test fixture meant to minimize skew on the differential pair.
10. On the C3 menu, un-check the Invert checkbox and turn off the parameters.
In the previous procedure, we used the default setup of the Skew parameter (which is detecting positive edges on
both signals at 50%). We also inverted C3 in order to make C2 and C3 both have positive edges at the same
time.
2
[cable skew + channel skew]
46 917719 Rev A
Page 47

QPHY-USB3-Tx-Rx Software Option
Alternately, we clearly could have not inverted C3 and instead selected the Skew clock 2 tab in the P1 parameter
menu and set the oscilloscope to look for negative edges on the second input (C3). However, it is somewhat
agreed that the previous procedure looks much more aesthetically pleasing from the display as it shows C2 and
C3 with the same polarity.
Figure 39 - The Skew parameter right side dialog, Skew clock 2 tab, showing default setup
§ § §
917719 Rev A 47
 Loading...