

Page 1

QPHY-USB
USB Serial Data
Operator’s Manual
Revision F – March, 2011
Relating to the Following Release Versions:
• Software Option Rev. 5.7
• USB Script Rev. 1.5
• Style Sheet Rev. 1.2
Page 2

LeCroy Corporation
700 Chestnut Ridge Road
Chestnut Ridge, NY, 10977-6499
Tel: (845) 578-6020, Fax: (845) 578 5985
Internet: www.lecroy.com
© 2008
Document Number: 915303 Rev F
by
LeCroy Corporation
. All rights reserved.
2
QPHY-USB Operator’s Manual Rev F
Page 3

TABLE OF CONTENTS
QPHY-USB Software Option
INTRODUCTION ........................................................................................................................ 6
Device tests ................................................................................................................................................................ 6
Host tests ................................................................................................................................................................... 6
Hub tests .................................................................................................................................................................... 7
Equipment list ............................................................................................................................................................. 8
LeCroy equipment............................................................................................................................................... 8
Additional equipment .......................................................................................................................................... 8
No cost equipment .............................................................................................................................................. 8
USB Test Fixture ........................................................................................................................................................ 9
QualiPHY Compliance Test Platform ....................................................................................................................... 12
INSTALLATION ....................................................................................................................... 14
Oscilloscope Option Key Installation ........................................................................................................................ 14
Typical (Recommended) Configuration .................................................................................................................... 14
Remote (Network) Configuration ............................................................................................................................. 14
Oscilloscope Selection ............................................................................................................................................. 14
Accessing the QPHY-USB Software using QualiPHY ............................................................................................. 15
Customizing QualiPHY ............................................................................................................................................. 17
QPHY-USB Operation .............................................................................................................................................. 19
USB-IF Test Scripts .................................................................................................................................................. 20
Test Bed Computer .................................................................................................................................................. 20
MATLAB ................................................................................................................................................................... 21
USB Test Wizard ...................................................................................................................................................... 21
HIGH-SPEED SIGNAL QUALITY ............................................................................................ 25
Host and Hub Downstream High-Speed Signal Quality ........................................................................................... 25
Device and Hub Upstream High-Speed Signal Quality ............................................................................................ 26
HIGH-SPEED PACKET PARAMETERS ................................................................................. 28
HOST HIGH-SPEED CHIRP TIMING ...................................................................................... 29
Host High-Speed Chirp Timing ................................................................................................................................. 29
Device and Hub High-Speed Chirp Timing .............................................................................................................. 31
HIGH-SPEED SUSPEND RESUME RESET TIMING .............................................................. 33
Host High-Speed Suspend Resume Reset Timing .................................................................................................. 33
Device or Hub High-Speed Suspend Resume Reset Timing ................................................................................... 34
HOST AND HUB DISCONNECT ............................................................................................. 35
HUB HIGH-SPEED UPSTREAM REPEATER ......................................................................... 37
HUB HIGH-SPEED DOWNSTREAM REPEATER .................................................................. 40
RECEIVER SENSITIVITY ........................................................................................................ 42
FULL AND LOW-SPEED TESTS ............................................................................................ 46
Equipment requirements .......................................................................................................................................... 46
Standard USB products .................................................................................................................................... 46
Hub and Host Drop Test ........................................................................................................................................... 48
Self-powered Hubs or Hosts ............................................................................................................................. 48
Bus-powered Hubs ........................................................................................................................................... 49
Test Criteria ...................................................................................................................................................... 49
Droop Test ................................................................................................................................................................ 50
Test Steps ......................................................................................................................................................... 51
Test Criteria ...................................................................................................................................................... 51
Test Results ...................................................................................................................................................... 52
Reporting Results ............................................................................................................................................. 52
Host Low-Speed Downstream Signal Quality .......................................................................................................... 53
QPHY-USB Operator’s Manual Rev F
3
Page 4

Host Full-Speed Downstream Signal Quality ........................................................................................................... 55
Inrush current ........................................................................................................................................................... 57
Hub Down Stream Low-Speed Signal Quality.......................................................................................................... 58
Hub Full-Speed Downstream Signal Quality ............................................................................................................ 59
Device and Hub Full-Speed Upstream Signal Quality Test ...................................................................................... 61
Device and Hub Full- or Low-Speed Upstream Signal Quality Test ......................................................................... 62
TF-USB-B TEST AND CALIBRATION PROCEDURES ......................................................... 63
Cable Deskewing ..................................................................................................................................................... 63
APPENDIX A ........................................................................................................................... 65
Receiver Sensitivity Test Waveform Setup .............................................................................................................. 65
MIN_ADD1 ........................................................................................................................................................ 65
IN_ADD1 ........................................................................................................................................................... 65
TABLE OF FIGURES
Figure 1. USB 2.0 Test Fixture (Part Number TF-USB-B) ..................................................................................... 9
Figure 2. TF-USB-B package ................................................................................................................................. 10
Figure 3. TF-USB-B Showing Power Supply Selection Jumper ........................................................................ 11
Figure 4. Probe Connection Pins Showing Grounds ......................................................................................... 11
Figure 5. Report menu in QualiPHY General Setup ............................................................................................ 12
Figure 6. The Test Report includes a summary table with links to the detailed test results .......................... 13
Figure 7. QualiPHY main menu and compliance test Standard selection menu ............................................. 15
Figure 8. QualiPHY configuration selection menu ............................................................................................. 16
Figure 9. QualiPHY test item selection menu ...................................................................................................... 17
Figure 10. Variable Setup and Limits Manager windows ................................................................................... 18
Figure 11. Start button ........................................................................................................................................... 19
Figure 12. Example of pop-up message box ....................................................................................................... 19
Figure 13. Example of pop-up connection diagram and dialog box ................................................................. 19
Figure 14. USB-IF HS Electrical Test Tool main menu ....................................................................................... 20
Figure 15. Device test High-Speed Upstream Near End Signal Quality ........................................................... 21
Figure 16. USB camera connected to the Signal Quality section ..................................................................... 22
Figure 17. Step 2 of 4: Probe Hookup .................................................................................................................. 22
Figure 18. Two SMA Cables Connected to the Test Fixture ............................................................................... 23
Figure 19. D600ST-SP Connected to the Test Fixture ........................................................................................ 23
Figure 20. Single-ended Probe Connection Example ........................................................................................ 24
Figure 21. Step 3 of 4: EL_2-EL_7 Signal Quality ............................................................................................... 24
Figure 22. HS Electrical Test Tool Setup for Device High-Speed Signal Quality ............................................. 25
Figure 23. Signal Quality Host Section ................................................................................................................ 25
Figure 24. Host High-Speed Downstream Signal Quality Analysis .................................................................. 26
Figure 25. Device High-Speed Upstream Signal Quality .................................................................................... 27
Figure 26. Host High-Speed packet parameters trace ........................................................................................ 28
Figure 27. Chirp Response Time .......................................................................................................................... 29
Figure 28. Chirp J and Chirp K Duration ............................................................................................................. 30
Figure 29. Chirp to Start of Frame Time ............................................................................................................... 31
Figure 30. Chirp K Latency .................................................................................................................................... 32
Figure 31. Time from Last Start of Frame to Host Suspend .............................................................................. 33
Figure 32. Time from Last Start of Frame to Device Suspend ........................................................................... 34
Figure 33. Host Disconnect Section of Test Fixture ........................................................................................... 35
Figure 34. Initial voltage before disconnect ........................................................................................................ 35
Figure 35. Voltage after disconnect ...................................................................................................................... 36
Figure 36. Hub and Device Fixture Connections for Upstream Repeater Test ................................................ 37
Figure 37. Initial signal acquisition for hub upstream repeater test ................................................................. 37
Figure 38. Hub upstream repeater sync field truncation and corruption ......................................................... 38
4
QPHY-USB Operator’s Manual Rev F
Page 5

QPHY-USB Software Option
Figure 39. Hub upstream repeater end of packet dribble .................................................................................. 38
Figure 40. Hub upstream repeater delay ............................................................................................................. 39
Figure 41. Hub and Device Fixture Connections for Downstream Repeater Test ........................................... 40
Figure 42. Hub downstream repeater delay ........................................................................................................ 40
Figure 43. Hub downstream repeater sync field truncation and corruption .................................................... 41
Figure 44. Hub downstream repeater end of packet dribble ............................................................................. 41
Figure 45. Receiver Sensitivity Test Setup .......................................................................................................... 42
Figure 46. Use Device Command drop down list of HS Electrical Test Tool ................................................... 43
Figure 47. Response to IN tokens with 12-bit sync - all packets NAK’d .......................................................... 43
Figure 48. Intermittent Response to IN tokens at low amplitude ...................................................................... 44
Figure 49. Receiver squelch level – no response to IN tokens ......................................................................... 45
Figure 50. FS/LS Signal Quality Test Fixture Sections....................................................................................... 47
Figure 51. Bus-Powered Hub Drop test equipment setup ................................................................................. 48
Figure 52. Hub Droop Test Equipment Setup ...................................................................................................... 50
Figure 53. Device and oscilloscope connections for droop test ...................................................................... 50
Figure 54. Droop voltage waveform ..................................................................................................................... 51
Figure 55. Host Low-Speed Downstream Signal Quality Test Equipment Setup ............................................ 53
Figure 56. Cursor Positioning for Host Low-Speed Signal Quality Test .......................................................... 54
Figure 57. Host Full-Speed Downstream Signal Quality Test Equipment Setup ............................................. 55
Figure 58. Cursor Positioning for Host Full-Speed Downstream Signal Quality ............................................ 56
Figure 59. Inrush Current Pulse ........................................................................................................................... 57
Figure 60. Hub Low-Speed Downstream Signal Quality Setup ......................................................................... 58
Figure 61. Hub Full-Speed Downstream Signal Quality Setup .......................................................................... 59
Figure 62. Cursor Placement For Hub FS Downstream Signal Quality Test .................................................... 60
Figure 63. Device Full-Speed Upstream Signal Quality Test Equipment Setup .............................................. 61
Figure 64. Isolation of Upstream Data Packet ..................................................................................................... 62
Figure 65. The Skew parameter right side dialog, Skew clock 2 tab, showing default setup ........................ 64
QPHY-USB Operator’s Manual Rev F
5
Page 6

INTRODUCTION
QPHY-USB is an automated test package that performs all the required tests from the USB-IF for physical layer
compliance of USB2.0 hosts, hubs, and devices. The package contains software that runs within the LeCroy
WavePro 7000A series, WaveMaster, SDA, WaveRunner 6000A or WaveRunner Xi series of X-Stream digitizing
oscilloscopes, and an optional pair of test fixtures for coupling into the electrical USB signals.
The QPHY-USB option gives the user the ability to both automate compliance testing and debug devices, hosts
and hubs. Users may be specifically interested in the following capabilities:
• Users interested in compliance testing should begin by using QualiPHY.
• Users interested in debugging circuits, should begin by using the oscilloscope’s embedded test tools.
• Users that begin by using QualiPHY may detect failures on their device, and then have the option of
switching to the oscilloscope’s embedded test tools.
This manual covers the use of both QualiPHY (compliance testing) and the oscilloscope’s embedded test tools
(debugging).
The software and fixture combine to perform the following measurements for USB2.0 hosts, hubs, and devices.
Device tests
• HS Upstream Signal Quality
o Far-end for tethered hubs
o Near-end for un-tethered hubs
• HS Packet Parameters
• HS Chirp Timing
• HS Suspend / Resume / Reset
• HS Upstream J and K Voltages
• HS Upstream Receiver Sensitivity
• FS Upstream Signal Quality
• LS Upstream Signal Quality
• Inrush current
• Back-Voltage
Host tests
• HS Downstream Signal Quality
• HS Downstream Packet Parameters
• HS Downstream Chirp Timing
• HS Downstream Suspend / Resume / Reset
• HS Downstream Disconnect
• HS Downstream J and K Voltages
• FS Downstream Signal Quality
• LS Downstream Signal Quality
• Drop
• Droop
6
QPHY-USB Operator’s Manual Rev F
Page 7

Hub tests
• HS Signal Quality (Upstream/Downstream)
• HS Upstream Packet Parameters
• HS Upstream Chirp Timing
• HS Upstream Suspend / Resume / Reset
• HS Disconnect
• HS J and K Voltages (Upstream/Downstream)
• HS Upstream Repeater
• HS Downstream Repeater
• HS Upstream Receiver Sensitivity
• FS Signal Quality (Upstream/Downstream)
• LS Signal Quality (Upstream/Downstream)
• Inrush current
• Drop
• Droop
• Back-Voltage
QPHY-USB Software Option
In the previous tests, the J and K Voltages tests are performed with the use of a digital voltmeter. This test is
performed for Hosts, Devices, and Hubs.
QPHY-USB Operator’s Manual Rev F
7
Page 8

Equipment list
USB testing requires a number of probes and additional USB devices. The High-Speed receiver sensitivity
test requires a digital pattern generator. The following equipment is required for High-Speed, Full-Speed, and
Low-Speed USB testing:
High-Speed / Full-Speed / Low-Speed Tests Full-Speed / Low-Speed Tests
SDA (Serial Data Analyzer) Series
DDA (Disk Drive Analyzer) Series
WaveMaster Series (3 GHz bandwidth or higher)
WavePro 7300A, 7200A
WaveRunner 6200A, 204Xi, including "MXi" models
WavePro 7xxZi (2 GHz bandwidth or higher)
LeCroy equipment
• USB test fixture (LeCroy TF-USB-B)
• 2 GHz or higher bandwidth active differential probe (LeCroy WL300/D350ST-SP) [for HS tests]
o LeCroy WL600/D600ST-SP recommended (but not mandatory) for WM-class oscilloscopes
o A second differential probe is required for Hub testing
• 2 GHz (or higher) active probe (LeCroy HFP2500, 2 ea.) [for HS/FS/LS tests]
• 1.5 GHz (or lower) active probe (HFP1500) or passive probe (PP006A or equivalent) [for FS/LS tests]
o PP00x passive probe will require AP-1M adapter for WM-class oscilloscopes
• 30A or lower Current probe (LeCroy CP030) [for B.4 Inrush test only]
o Adapter (AP-1M) required for WM-class oscilloscopes
Additional equipment
WavePro 7100A, 7000A
WaveRunner 104Xi, 64Xi, 44Xi, including "MXi" models
WaveRunner 6100A, 6050A
WavePro 715Zi
• Certified High-Speed USB self-powered hub (4 ea.) [for FS/LS tests]
• Certified Full-Speed USB self-powered hub [for FS/LS tests]
• 5 meter USB cables type-A to type-B male (6 ea.) [for FS/LS tests]
• 1 meter USB cables type-A to type-B male (up to 12, depending on hub under test) [for HS/FS/LS tests]
• Certified Low-Speed trigger device (e.g. USB mouse) [for LS tests]
• Certified Full-Speed (or High-Speed) trigger device (e.g. USB memory stick or web camera) [for FS tests]
• Certified High-Speed trigger device (can be used as the FS Certified device) [for HS tests]
• Digital Voltmeter 3 ½ digits (Keithley 2000 multimeter or equivalent) [for HS/FS/LS tests]
• Data Pattern Generator (e.g 2 x Tabor WW1281A with synchronization cable) [for HS tests]
• USB host system [for HS/FS/LS tests]
No cost equipment
• MATLAB runtime component (http://www.lecroy.com/goto/matlabmcrinstaller77/)
• USB High-Speed Electrical Test Tool software (www.usb.org/developers/tools/USBHSET.exe)
8
QPHY-USB Operator’s Manual Rev F
Page 9
QPHY-USB Software Option
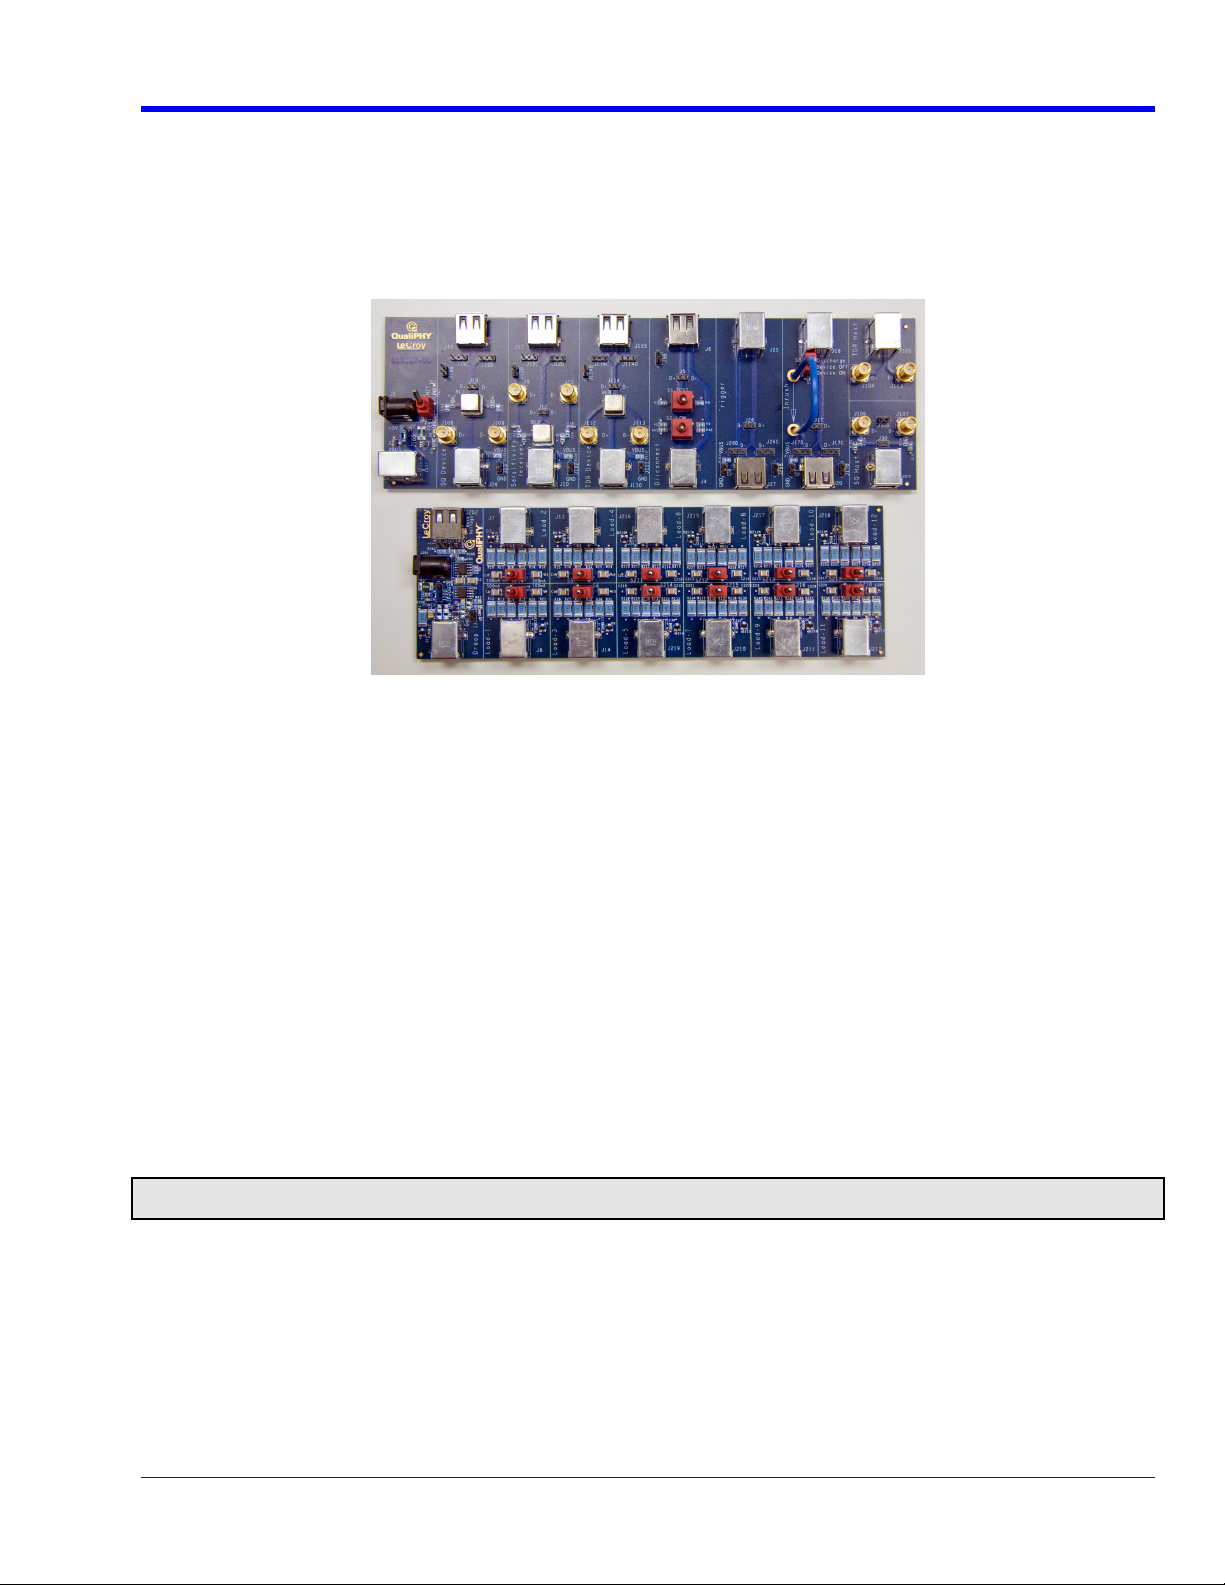
USB Test Fixture
The USB test fixture (TF-USB-B) is required to perform compliance tests. The fixture consists of several sections
designed to allow connection to the electrical signal under test. Each section is marked on the fixture, and the
ports on each section are also labeled. The section and port(s) to use for a given test are called out in the
procedure on the instrument display and in this manual.
Figure 1. USB 2.0 Test Fixture (Part Number TF-USB-B)
The TF-USB-B package is delivered in a black plastic case with a foam insert.
TF-USB-B Standard supplied items
• 1 x safety sheet (# 915235-00)
• 1 x TF active section (# 915189-00)
• 1 x TF loads section (# 915190-00)
• 1 x USB cable (to power the Test Fixture)
• 2 x 50 Ω terminator
• 2 x SMA cables
• 2 x BNC-to-SMA adapter
• 1 x MultiWrench
• 5 x 6" USB cable A-male to B-male
• 1 x USB adapter A-female to B female
• 1 x USB adapter A-male to mini-B male
Note: SMA and USB connectors are not rated for repetitive make/break connections. Use of this fixture for high volume manufacturing should
utilize an appropriately rated intermediate contact fixture.
QPHY-USB Operator’s Manual Rev F
9
Page 10
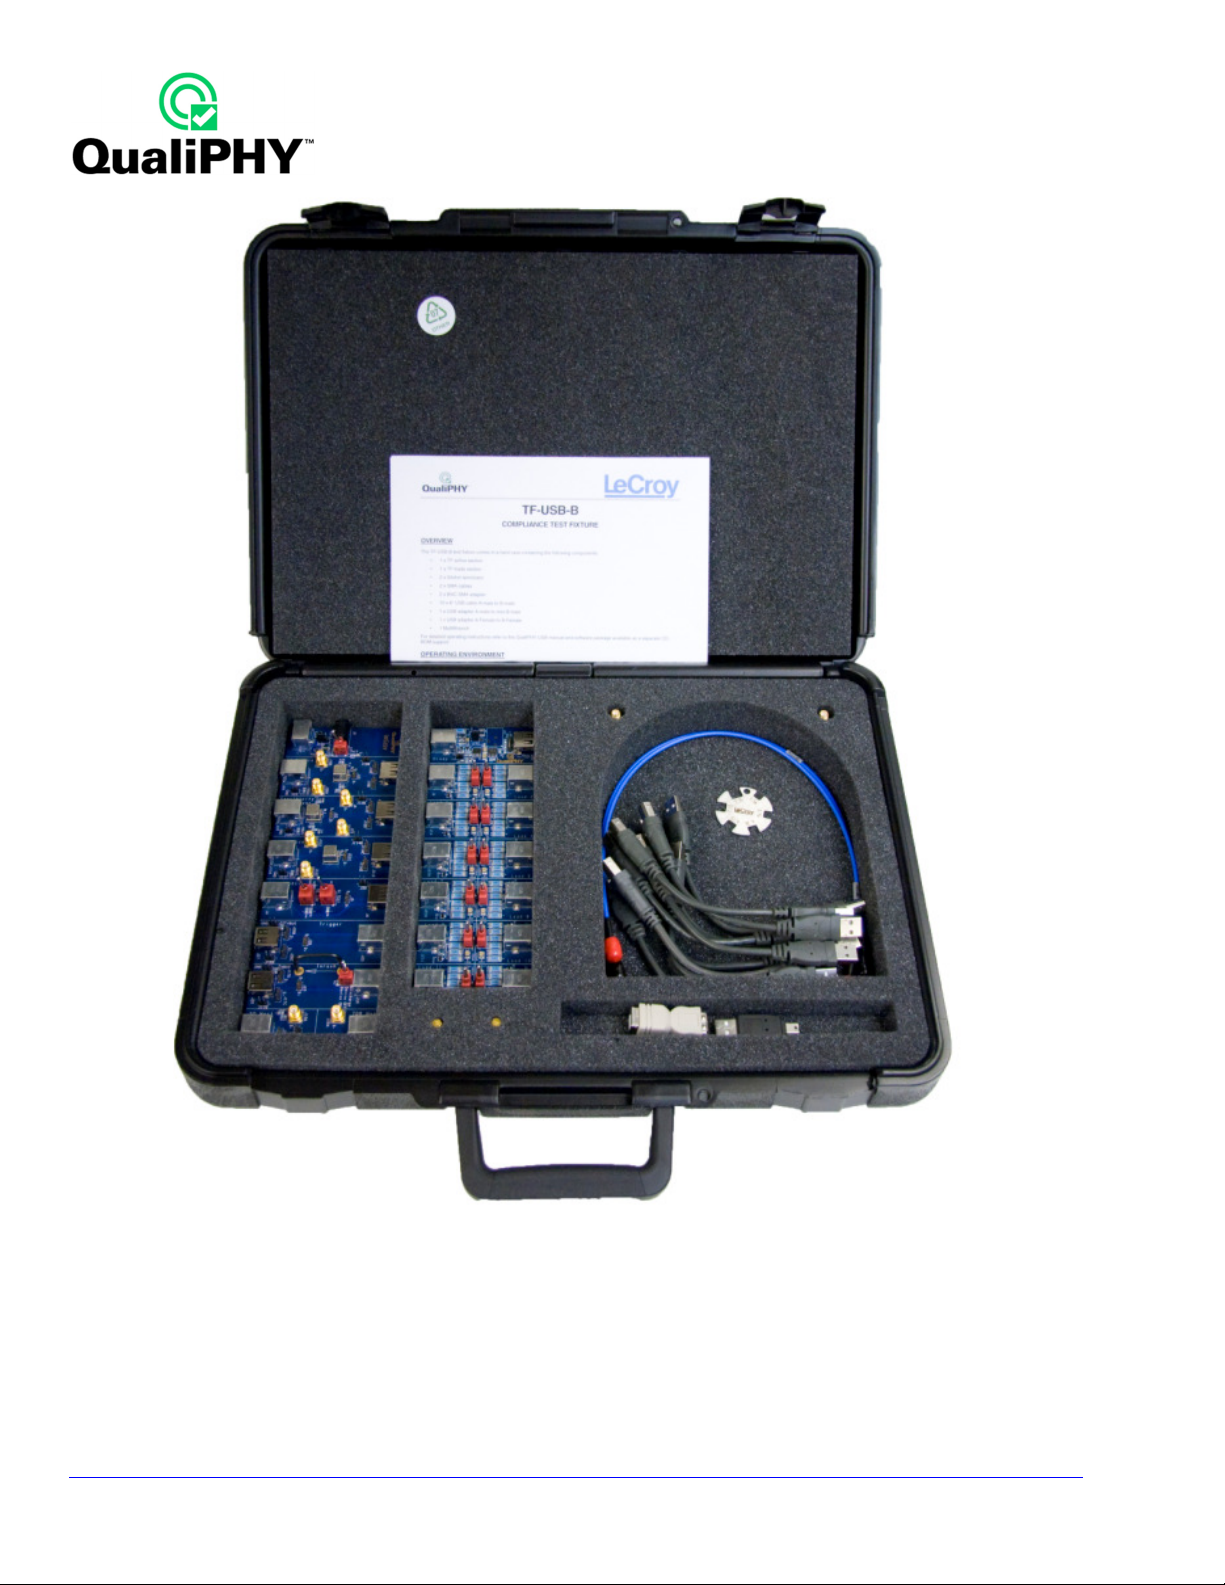
Figure 2. TF-USB-B package
10
QPHY-USB Operator’s Manual Rev F
Page 11
QPHY-USB Software Option
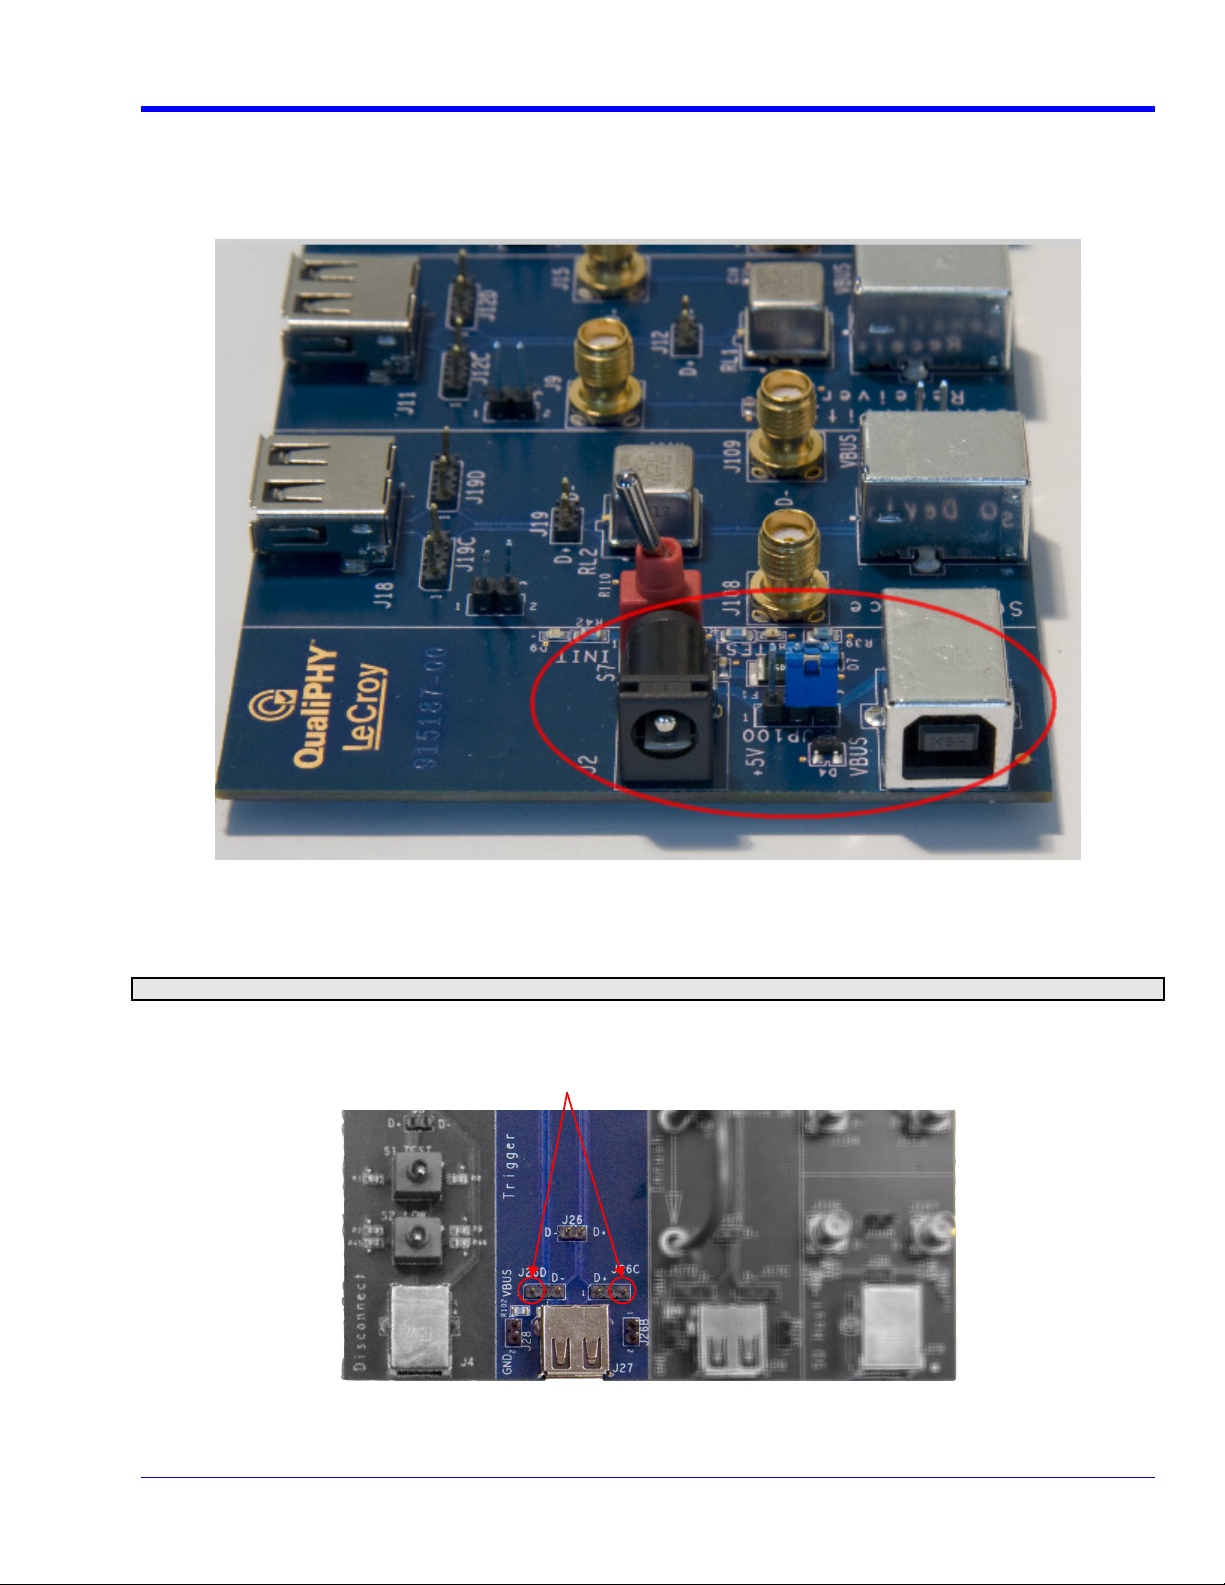
The fixture requires a 5 V power supply for operation. The fixture can be supplied from either a DC adapter or
USB port and is selectable from a jumper on the fixture. When the jumper is placed over pins 2 and 3, the power
is supplied from the USB port (default setting); when placed over pins 1 and 2, the power is supplied from the DC
adapter. The following figure shows the jumper set so the board receives power from the USB port.
Figure 3. TF-USB-B Showing Power Supply Selection Jumper
The USB test fixture has square pins that provide connection points for differential and single-ended probes. The
pins are connected to the “+” and “-“ signal lines and a pair of ground pins are also provided.
Note: Use probes as indicated. All unnecessary probes for a given test must be removed.
Ground Pins
Figure 4. Probe Connection Pins Showing Grounds
QPHY-USB Operator’s Manual Rev F
11
Page 12
QualiPHY Compliance Test Platform
QualiPHY is LeCroy’s unique compliance test framework which leads the user through the compliance tests.
QualiPHY displays connection diagrams to ensure tests run properly, automates the oscilloscope setup, and
generates full compliance reports.
QPHY-USB (DSO option) can be used without QualiPHY if each compliance test is executed manually. However,
QualiPHY makes QPHY-USB easy and fast. QualiPHY is designed to use the TF-USB-B test fixture.
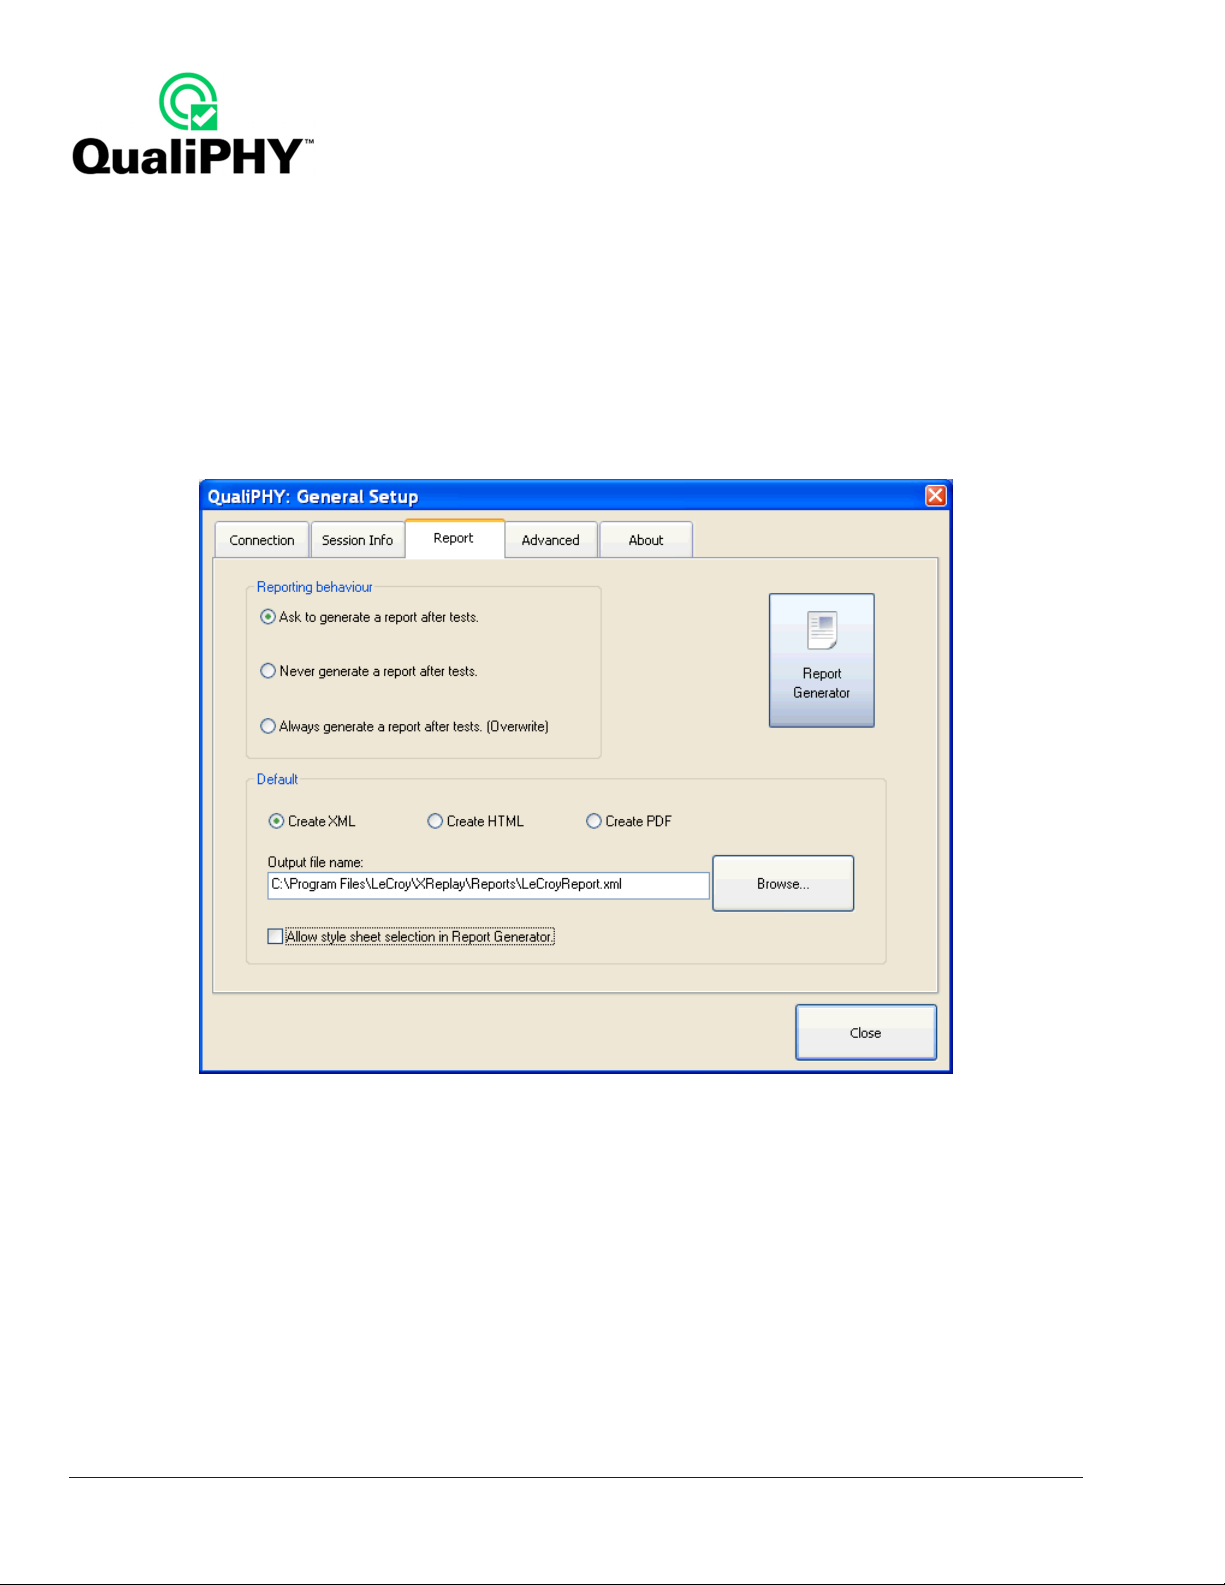
The LeCroy QPHY-USB package displays all parameters for each measurement on the instrument screen along
with pass/fail indicators and appropriate waveforms. Print the screen by using the oscilloscope hardcopy feature.
The QualiPHY software application automates the test and report generation.
Figure 5. Report menu in QualiPHY General Setup
12
QPHY-USB Operator’s Manual Rev F
Page 13
QPHY-USB Software Option
See the QualiPHY Operator’ s Manual for more information on how to use the QualiPHY framework.
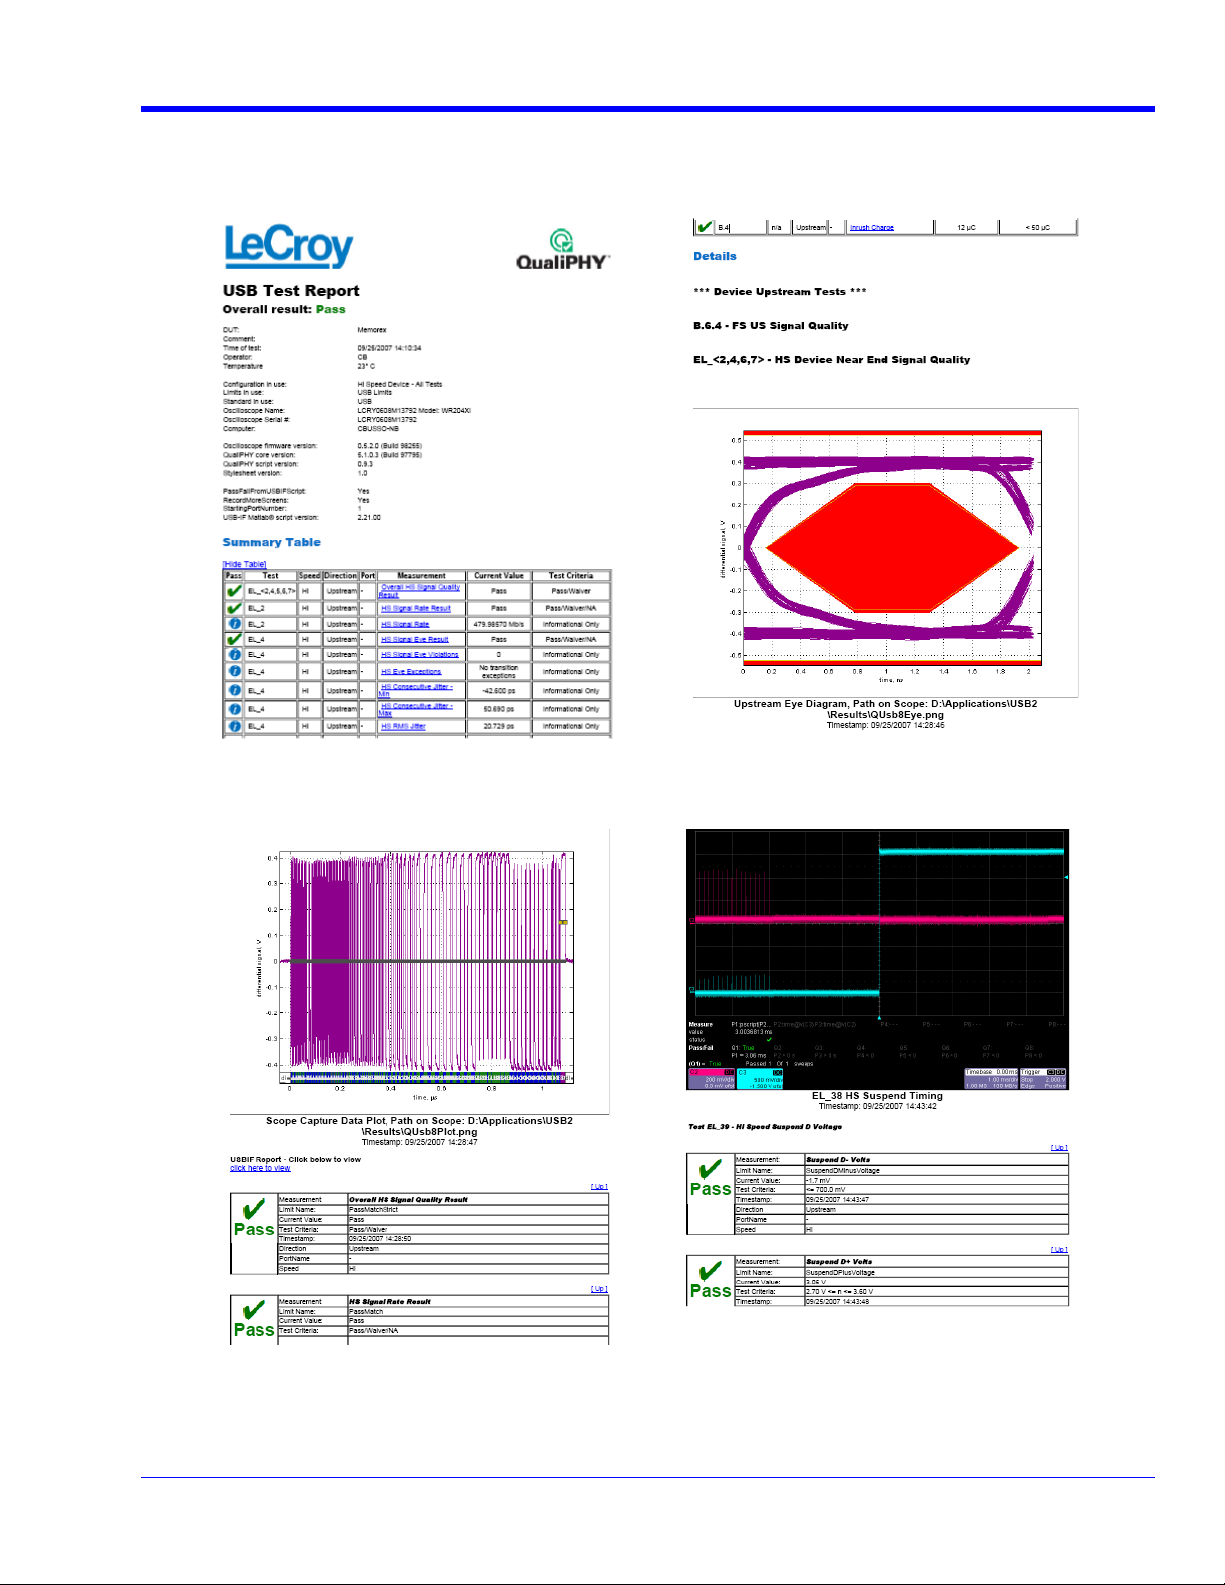
Figure 6. The Test Report includes a summary table with links to the detailed test results
QPHY-USB Operator’s Manual Rev F
13
Page 14

INSTALLATION
Oscilloscope Option Key Installation
An option key must be purchased to enable the QPHY-USB option. Call LeCroy Customer Support to place an
order and receive the code.
Enter the key and enable the purchased option as follows:
1. From the oscilloscope menu select Utilities Utilities Setup...
2. Select the Options tab and click the Add Key button.
3. Enter the Key Code using the on-screen keyboard.
4. Restart the oscilloscope to activate the option after installation.
Typical (Recommended) Configuration
QualiPHY software can be executed from the oscilloscope or a host computer. The first step is to install QualiPHY.
Please refer to the QualiPHY Operator’s Manual for installation instructions.
LeCroy recommends running QualiPHY on an oscilloscope equipped with Dual Monitor Display capability (Option
DMD-1 for oscilloscopes where this is not standard). This allows the waveform and measurements to be shown
on the oscilloscope LCD display while the QualiPHY application and test results are displayed on a second
monitor.
By default, the oscilloscope appears as a local host when QualiPHY is executed in the oscilloscope. Follow the
steps under Oscilloscope Selection (as follows) and check that the IP address is 127.0.0.1.
Remote (Network) Configuration
It is also possible to install and run QualiPHY on a host computer, controlling the oscilloscope with a Network/LAN
Connection.
The oscilloscope must already be configured, and an IP address (fixed or network-assigned) must already be
established.
Oscilloscope Selection
Set up the oscilloscope using QualiPHY over a LAN (Local Area Network) by doing the following:
1. Make sure the host computer is connected to the same LAN as the oscilloscope. If unsure, contact
your system administrator.
2. From the oscilloscope menu, select Utilities Utilities Setup…
3. Select the Remote tab.
4. Verify the oscilloscope has an IP address and the control is set to TCP/IP.
5. Run QualiPHY in the host computer and click the General Setup button.
6. Select the Connection tab.
7. Enter the IP address from step 4 (previous).
8. Click the Close button.
QualiPHY is now ready to control the oscilloscope.
14
QPHY-USB Operator’s Manual Rev F
Page 15
QPHY-USB Software Option
QualiPHY tests the oscilloscope connection after clicking the Start button. The system prompts you if there is a
connection problem. QualiPHY’s Scope Selector function can also be used to verify the connection. Please refer
to the QualiPHY Operator’s Manual for explanations on how to use Scope Selector and other QualiPHY
functions.
Accessing the QPHY-USB Software using QualiPHY
This topic provides a basic overview of QualiPHY’s capabilities. Please refer to the QualiPHY Operator’s Manual
for detailed information.
Access the QPHY-USB software using the following steps:
1. Wait for the oscilloscope to start and have its main application running.
2. Launch QualiPHY from the Analysis menu if installed on the oscilloscope or from the desktop icon if
installed on a host computer.
3. From the QualiPHY main window (as follows), select Standard, then USB from the pop-up menu (if not
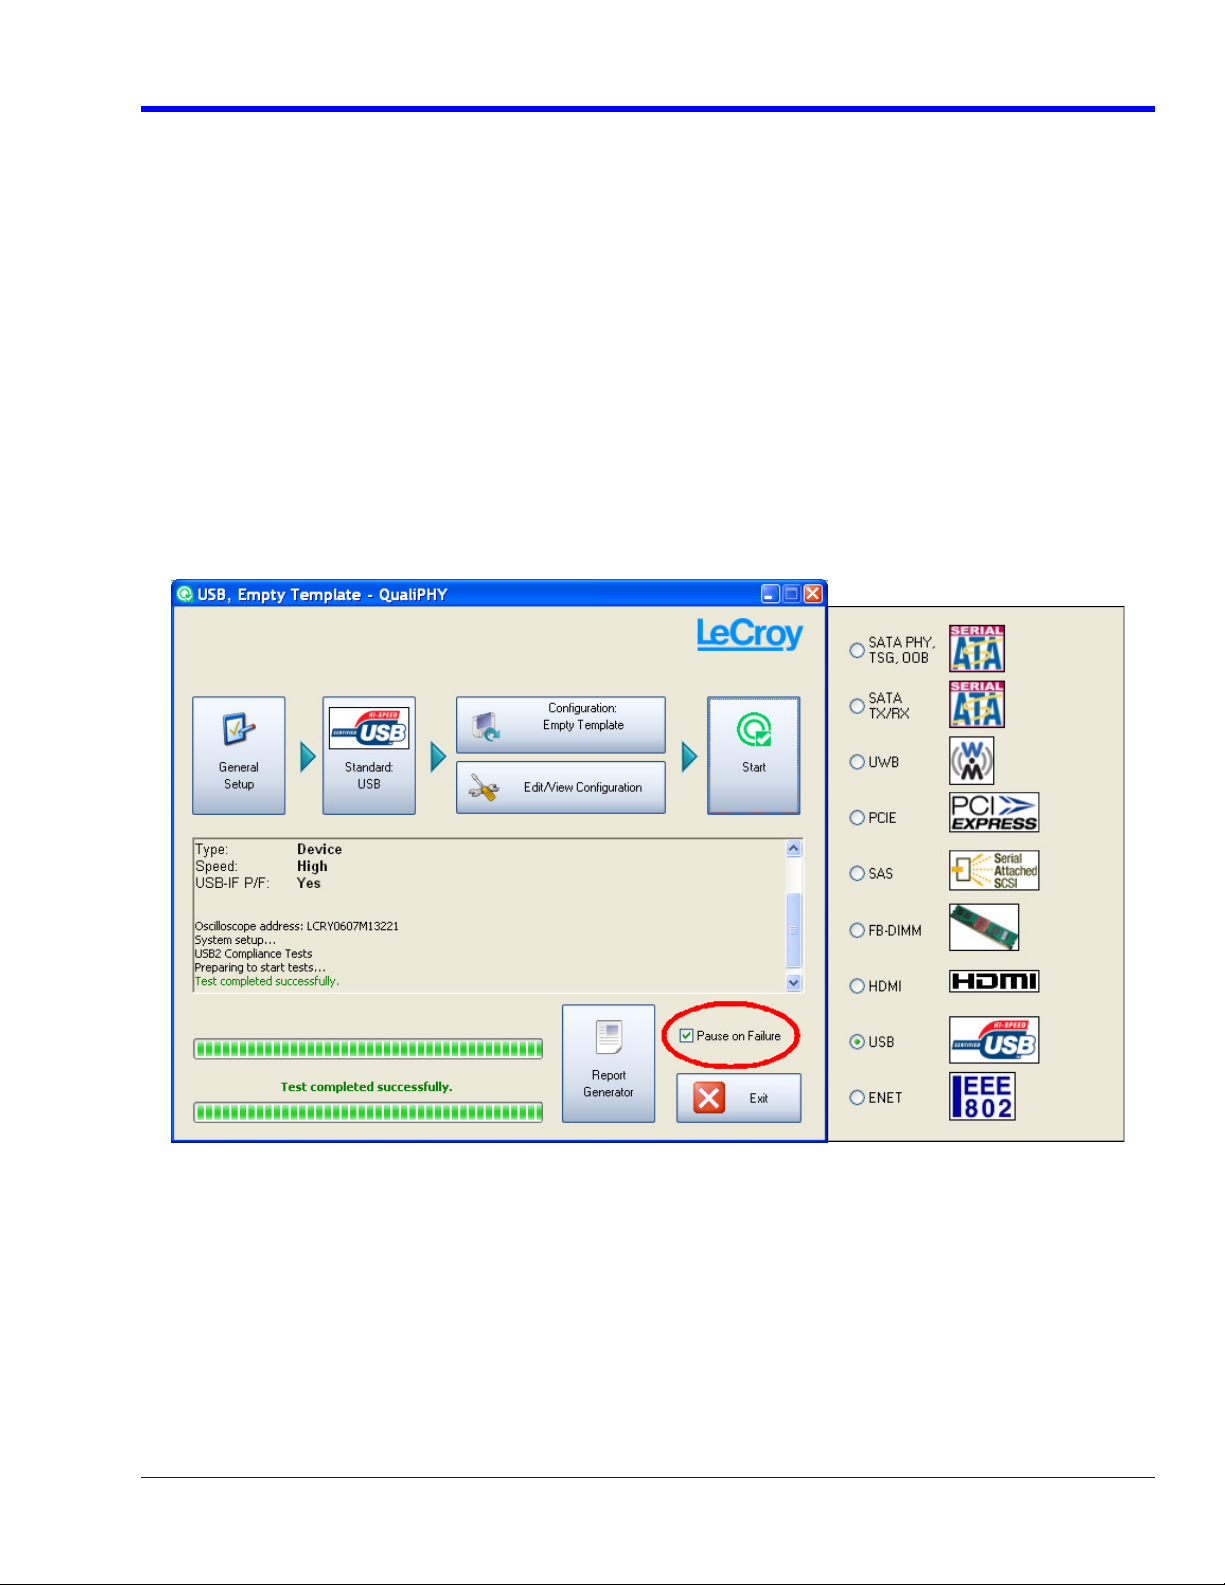
already selected). If you check the Pause on Failure box (circled) QualiPHY prompts to retry the
measure whenever a test fails.
Figure 7. QualiPHY main menu and compliance test Standard selection menu
QPHY-USB Operator’s Manual Rev F
15
Page 16

4. Click the Configuration button in the QualiPHY main menu:
5. Select a configuration from the pop-up menu:
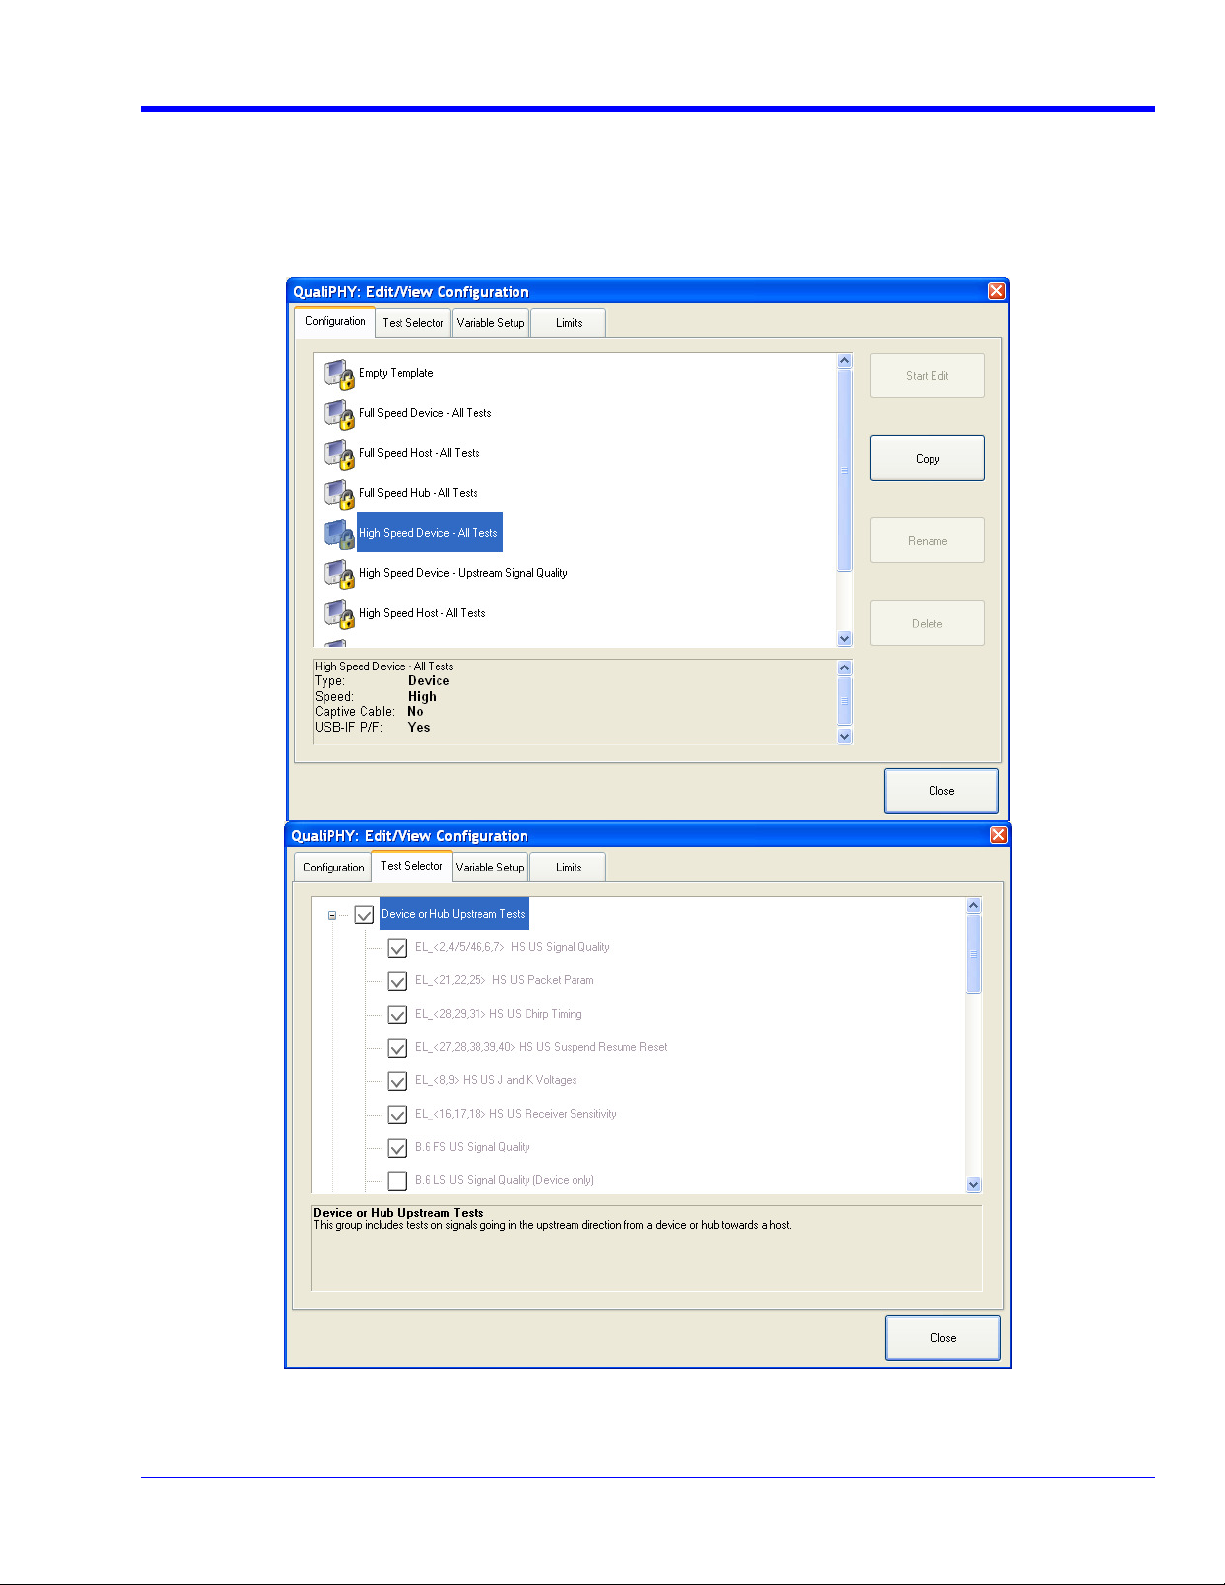
Figure 8. QualiPHY configuration selection menu
6. Click Start.
7. Follow the pop-up window prompts.
16
QPHY-USB Operator’s Manual Rev F
Page 17
QPHY-USB Software Option
Customizing QualiPHY
The predefined configurations in the Configuration screen cannot be modified. However, you can create your
own test configurations by copying one of the standard test configurations and making modifications. A description
of the test is also shown in the description field when selected.
Figure 9. QualiPHY test item selection menu
QPHY-USB Operator’s Manual Rev F
17
Page 18
Once a custom configuration is defined, script variables and the test limits can be changed by using the Variable
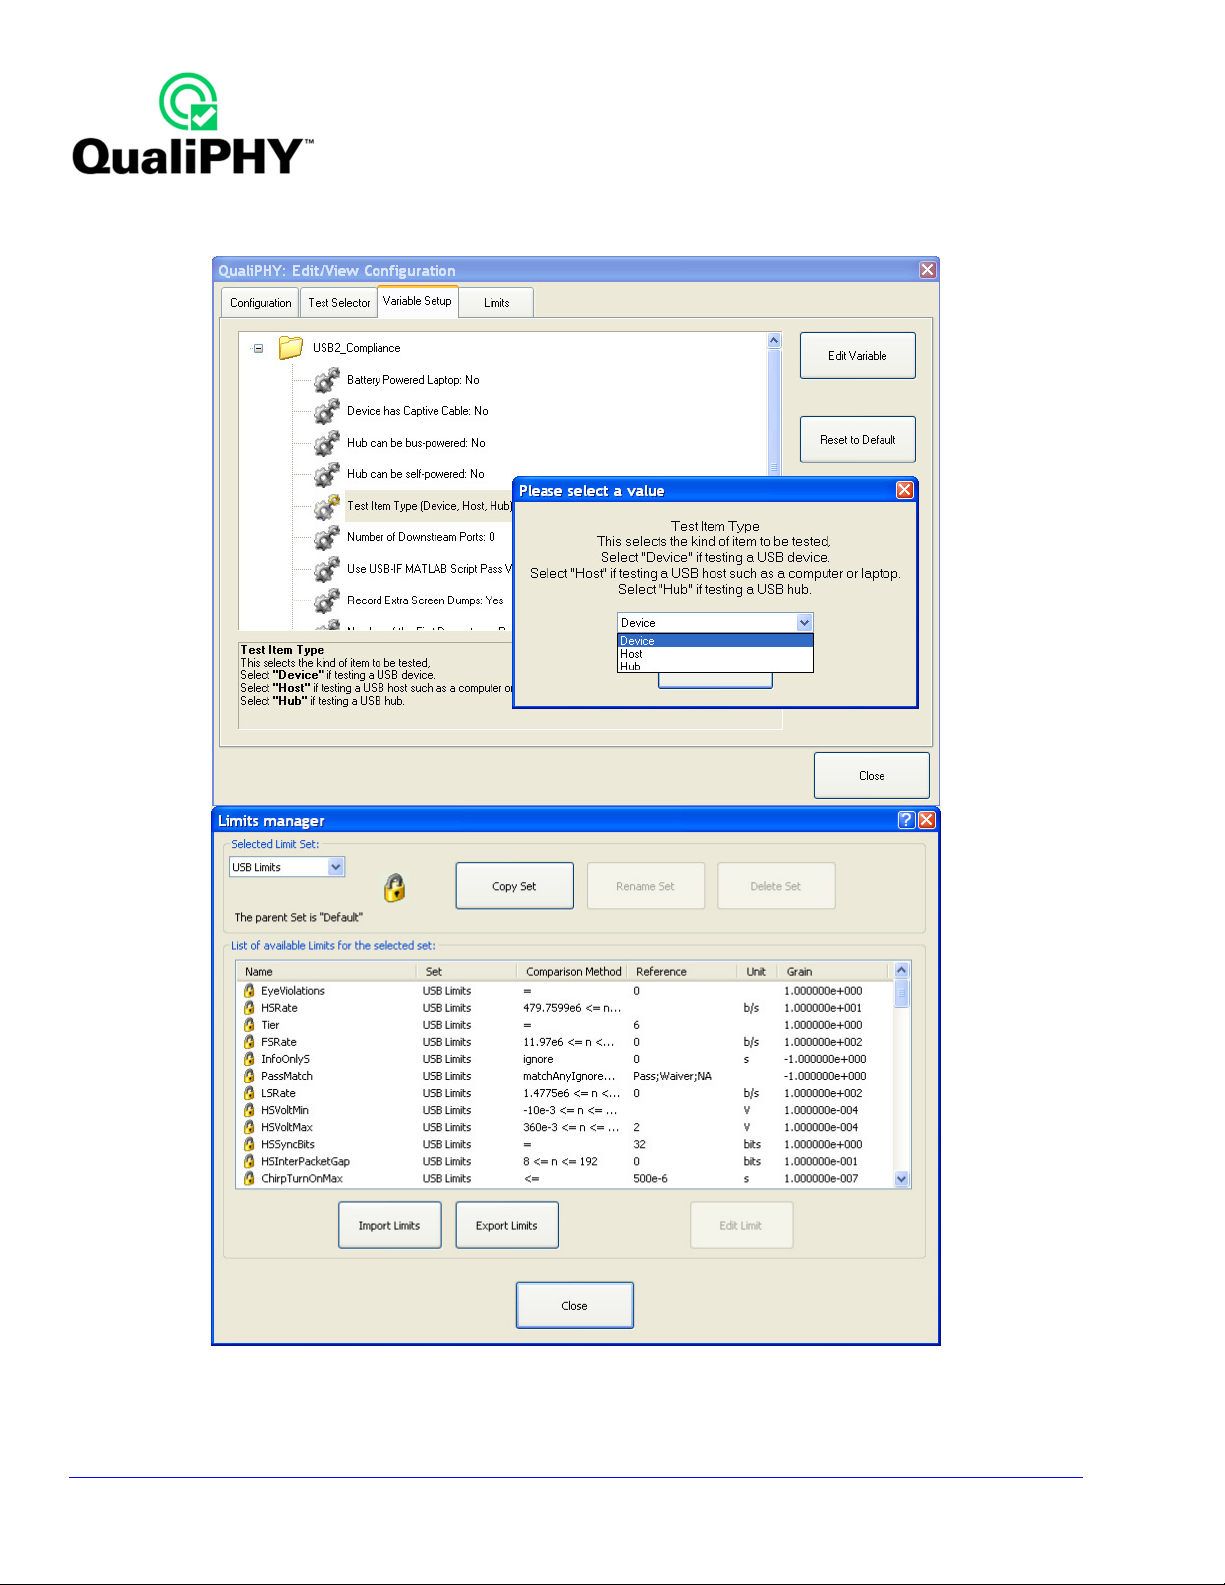
Setup and Limits Manager from the Edit/View Configuration window.
Figure 10. Variable Setup and Limits Manager windows
18
QPHY-USB Operator’s Manual Rev F
Page 19
QPHY-USB Software Option
QPHY-USB Operation
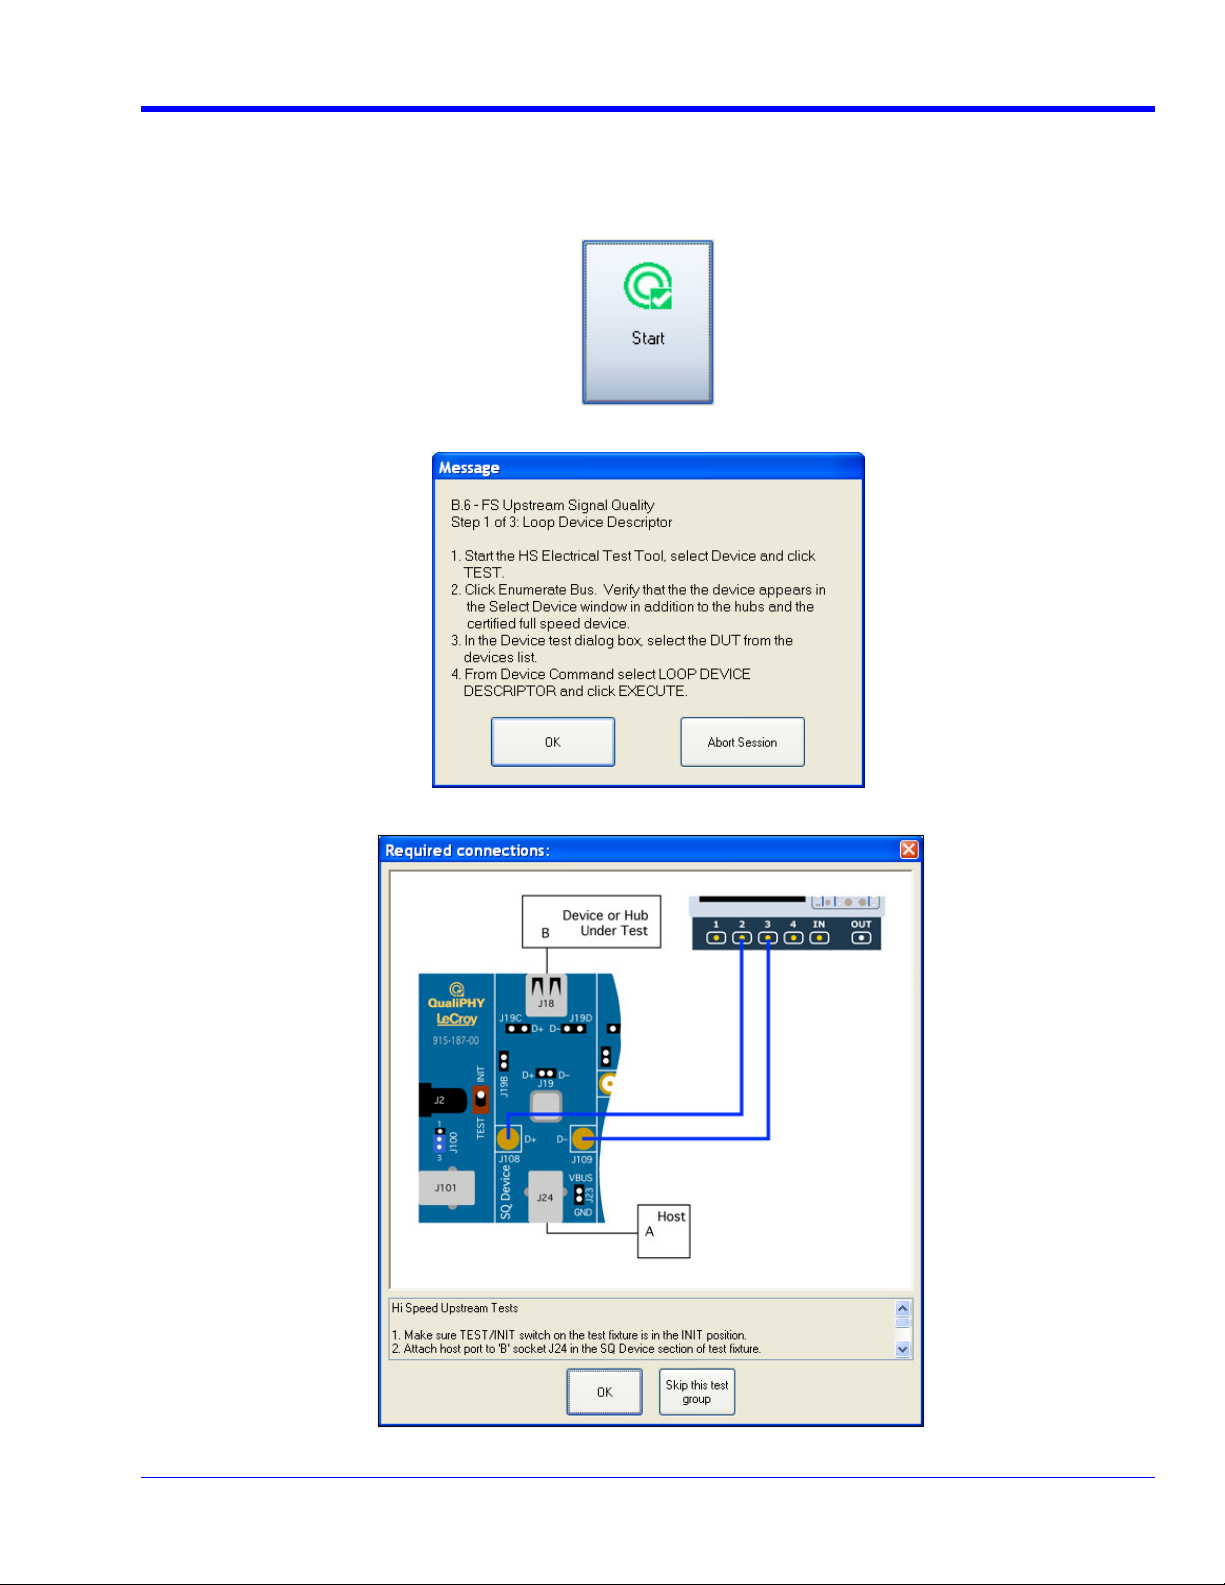
After pressing Start in the QualiPHY menu, the software instructs how to set up the test using pop-up connection
diagrams and dialog boxes. QualiPHY also instructs how to properly configure the USB-IF HS Electrical Test
Toolkit to change test signal modes (when necessary).
Figure 11. Start button
Figure 12. Example of pop-up message box
Figure 13. Example of pop-up connection diagram and dialog box
QPHY-USB Operator’s Manual Rev F
19
Page 20
USB-IF Test Scripts
The test package uses USB-IF written test scripts specifically made to analyze test data acquired by the
oscilloscope. These scripts are also released by the USB-IF as a stand-alone program called the USB Electrical
Analysis Tool (USBET).
Test Bed Computer
A host computer with a USB2.0 controller card is required to place the device under test (DUT) into the necessary
test modes. This computer must be running Windows 2000 Professional or Windows XP, and have the USB-IF
High-Speed Electrical Test Toolkit (USBHSET) installed. The instructions in the LeCroy test package prompt to
execute specific functions within the USB High-Speed Electrical Test Toolkit on the host computer for various
tests. Best practice is to use an external host computer, separate from the oscilloscope, as the test bed computer.
Both the USBET and the USBHSET can be downloaded from the USB-IF Web site at the following address:
UU
http://www.usb.org/developers/tools/UU
The test package has been validated with version 1.1.0.4 of the USBHSET.
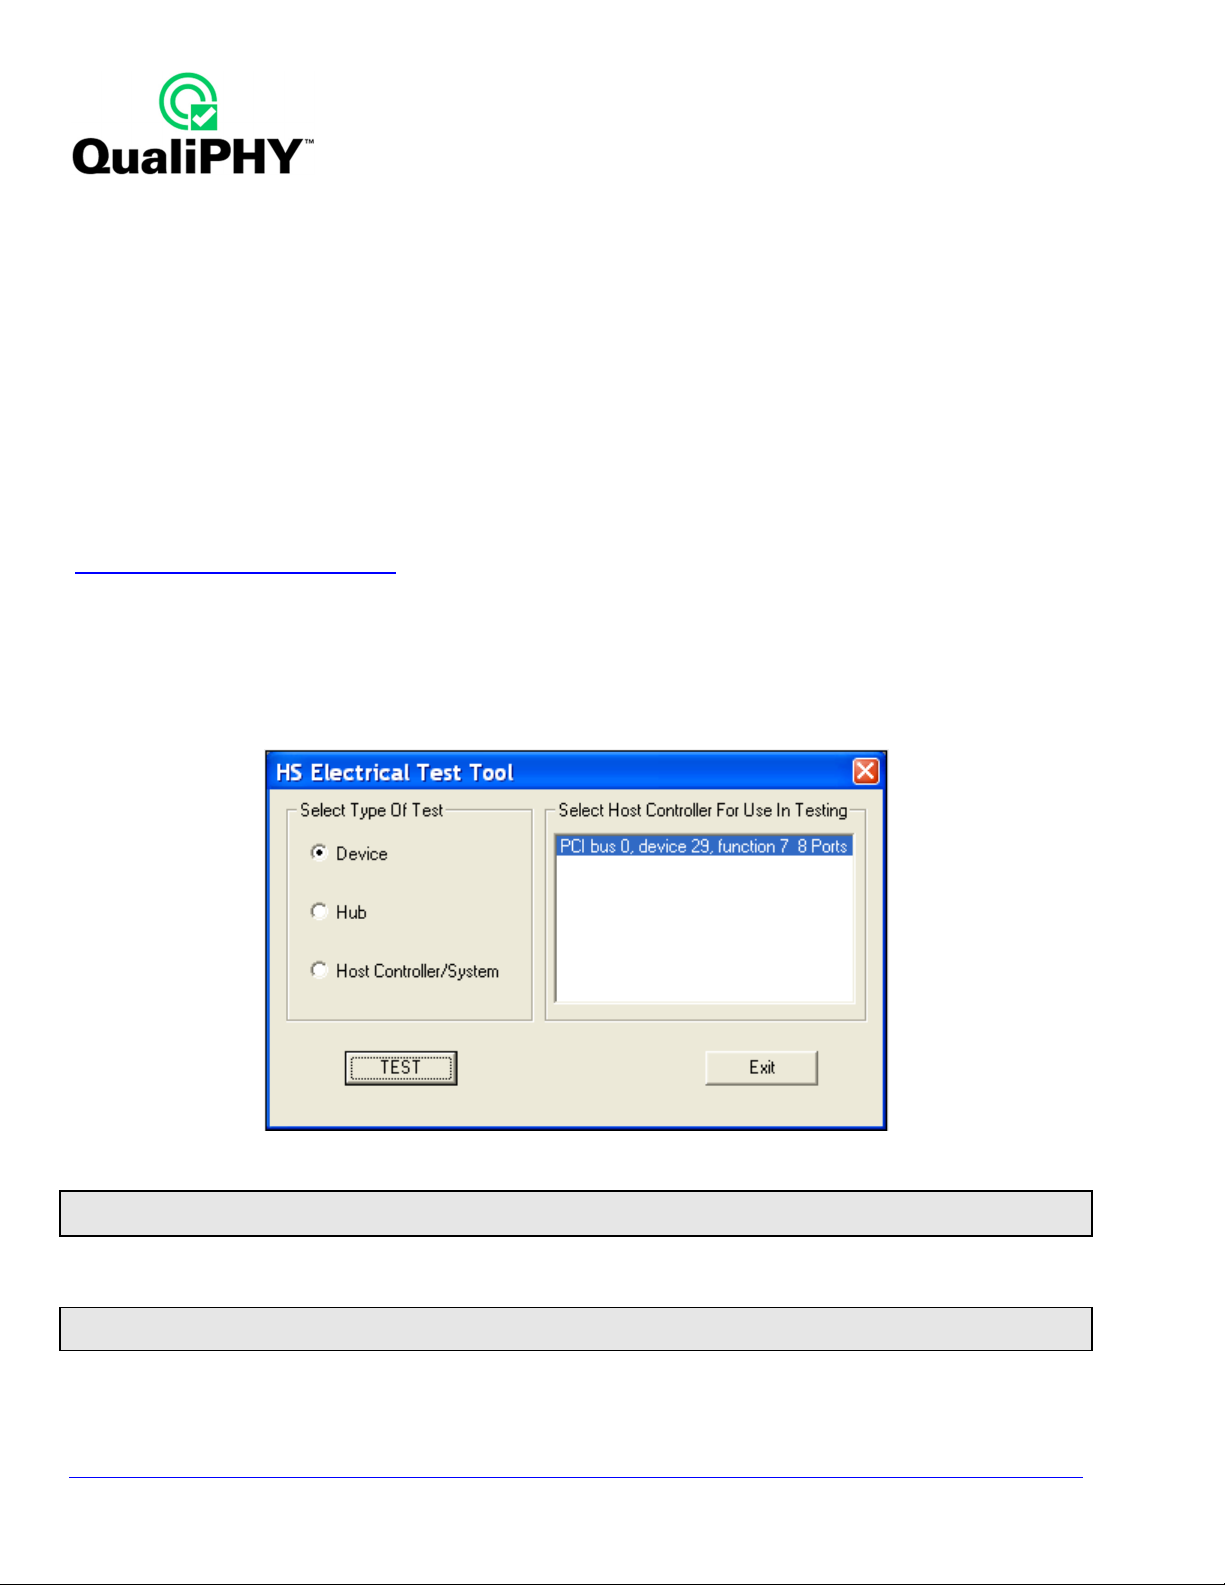
Open the HS Electrical Test Tool as follows: Windows Start Menu Programs USB-IF Test Suite USB
HS Electrical Toolkit HSElectricalTestTool.
The main menu is then shown as follows.
Figure 14. USB-IF HS Electrical Test Tool main menu
Note: All USB devices are disabled when the HS Electrical Test Toolkit is started. Functionality is restored upon exiting the Test Tool menu.
This means that during this process, a USB mouse and/or keyboard are disabled.
If a USB 2.0 host is found, it appears on the list box control. If no host is found either there is no USB 2.0 host or
the driver is not functioning correctly.
Note: If the USB-IF supplied HS Electrical Test Tool stops working and does not exit normally, open the Device Manager and remove all the
USB hosts, devices, and hubs, and then reboot the computer.
20
QPHY-USB Operator’s Manual Rev F
Page 21

QPHY-USB Software Option
MATLAB
Effective with X-Stream version 4.3.1, the LeCroy USB2.0 test suite requires the installation of the MATLAB
Component Runtime even if there is a full installation of the MATLAB software already on the machine. The
MATLAB Component Runtime can be downloaded from:
UU
http://www.lecroy.com/goto/MatlabInstaller/UU
Note: MATLAB scripts are used to perform signal quality and inrush tests. If the MATLAB Component Runtime is not properly installed on the
oscilloscope the tests requiring these scripts are disabled.
USB Test Wizard
The LeCroy USB test software (USB2) provides a test wizard which directs users through the compliance test
procedure for hosts, hubs, and devices. The USB Test Wizard is activated by selecting USB2 from the Analysis
menu of the oscilloscope:
The following wizard dialog page asks for Mode and Test control setup information, and then guides the user
through the test. The Mode refers to the type of product being tested: Host, Hub or Device. Tests must be
followed step by step. Following the instructions closely guarantees the correct operation of the test. Once a test
is selected from the Test field, the instruction resets to Step 1.
• Use the Next button to proceed to the next step.
• Use the Back button to return to the previous step.
• Use the Reset button to start the selected test over again from Step 1.
In the Result File Name field, the directory in which the result file is stored can be changed by using the Browse
button. The default directory is D:\Applications\USB2\Results\.
A Probe selection must be made to perform certain tests. Select the measurement method in the Probe field
between Differential (to use a differential probe) and 2 Cables (to use 2 SMA cables). The 2 Cables method
should be used for measuring signal quality with the TF-USB-B fixture (please refer to the Deskewing topic of this
manual for more details). The Differential probe method is to support old fixtures that do not have SMA
connectors. Some tests do not offer a probe selection and must use a differential probe. For those tests which use
the Signal Quality sections of the test fixture with a differential probe the SMA connectors must be terminated.
Step 1 - Hooking up the USB device, host, and cables to the USB test fixture:
Figure 15. Device test High-Speed Upstream Near End Signal Quality
QPHY-USB Operator’s Manual Rev F
21
Page 22

from USB Host
The following image shows a USB device (camera) connected to the SQ Device section of the test fixture (left),
while the host cable is connected to input J24 (right).
USB Device
Under Test
From USB Host
Power Supplied
Figure 16. USB camera connected to the Signal Quality section
Step 2 - Connects the 2 SMA cables between the oscilloscope and the test fixture:
Figure 17. Step 2 of 4: Probe Hookup
22
QPHY-USB Operator’s Manual Rev F
Page 23

QPHY-USB Software Option
Figure 18. Two SMA Cables Connected to the Test Fixture
Some of the tests require a differential probe connected to the test fixture. The following image shows a typical
differential probe hookup.
Figure 19. D600ST-SP Connected to the Test Fixture
QPHY-USB Operator’s Manual Rev F
23
Page 24

Some of the tests require an active single-ended probe hookup. The following image shows a typical single-ended
probe hookup.
Note: Make sure the lower tip socket of the probe is connected to the ground pin of the test fixture.
Figure 20. Single-ended Probe Connection Example
Step 3 - Sets up the HS Electrical Test Tool that generates the test signal:
Figure 21. Step 3 of 4: EL_2-EL_7 Signal Quality
24
QPHY-USB Operator’s Manual Rev F
Page 25

QPHY-USB Software Option
Figure 22. HS Electrical Test Tool Setup for Device High-Speed Signal Quality
HIGH-SPEED SIGNAL QUALITY
Host and Hub Downstream High-Speed Signal Quality
1. Select Host or Hub in the Mode control and HS Downstream Signal Quality in the Test control of the
USB Test Wizard.
2. Follow the instructions on the right side of the menu. The port under test is connected to the SQ Host
section of the Test Fixture shown as follows.
3. The SMA cables are attached to the SMA connectors in this section of the fixture.
Figure 23. Signal Quality Host Section
The captured waveform should appear as follows. Cursors (dashed vertical lines in the image) must be placed on
either side of the packet as shown. Use the Cursors knobs on the oscilloscope’s front panel to adjust the position
of the cursors if necessary. The waveform between the cursors is processed by the USB-IF signal quality test
script to obtain an eye pattern and jitter measurements.
QPHY-USB Operator’s Manual Rev F
25
Page 26

Figure 24. Host High-Speed Downstream Signal Quality Analysis
Device and Hub Upstream High-Speed Signal Quality
Select the appropriate mode (device or hub) and test (HS Upstream Signal Quality) in the USB test wizard. The
device or hub upstream port is connected to the host computer through the SQ Device section of the Test Fixture.
Note: Select Device HS Upstream NE Signal Quality for a device without a captive cable. Select Device HS Upstream FE Signal Quality
for a device with a captive cable.
The captured waveform should appear as follows (shown for the device test). Cursors (dashed vertical lines in the
image) must appear on either side of the packet, as shown. Use the Cursors knobs on the oscilloscope’s front
panel to adjust the position of the cursors (if necessary). The waveform between the cursors is processed by the
USB-IF signal quality test script to obtain an eye pattern and jitter measurements.
Note: After the device or hub upstream signal quality test is completed, the power to the device or hub must be cycled in order to stop the
transmission of the test packets. The device or hub does not respond to further test commands until the power is cycled. Cycle the power by
unplugging and re-plugging the USB connector and the power cord for a self-powered device or hub.
26
QPHY-USB Operator’s Manual Rev F
Page 27

QPHY-USB Software Option
Figure 25. Device High-Speed Upstream Signal Quality
QPHY-USB Operator’s Manual Rev F
27
Page 28

HIGH-SPEED PACKET PARAMETERS
Packet parameters represent timing measurements of the communications between host, hub, and device. USB
2.0 transmits data in bi-directional packets. The timing of these packets is critical for proper communication. The
sync field at the start of the packet, the width of the EOP (end of packet), and the inter-packet timing is measured
in this test.
Select Host, Hub, or Device in the Mode control and HS Packet Param in the Test control of the USB Test
Wizard.
Follow the instructions in the USB Test Wizard menu to setup the test and acquire the waveform. The captured
trace should look like the following image. The waveform in the center of the upper display contains three packets.
The test measures the sync field and EOP width of the center packet, and two time intervals between the three
packets.
Figure 26. Host High-Speed packet parameters trace
Note: The image shown is for a Host test, but the waveform also looks similar for Hub and Device tests.
28
QPHY-USB Operator’s Manual Rev F
Page 29

QPHY-USB Software Option
HOST HIGH-SPEED CHIRP TIMING
A High-Speed USB port must also be compatible with Full-Speed operation (12 Mb/s). High-Speed operation is
detected using the K and J chirp sequences. Full-Speed operation uses a higher impedance load. When a HS
capable host asserts a reset, an HS capable device must respond with the Chirp K to signal HS support. The Host
then responds with a Chirp J/K sequence to also signal HS support. This test measures the timing and voltages of
the HS handshake. The SQ Device section of the Test Fixture is used for chirp timing measurements.
Host High-Speed Chirp Timing
1. Select Host in the Mode control and HS Chirp Timing in the Test control of the USB Test Wizard.
2. Follow the instructions in the wizard menu to setup the test and acquire the chirp timing waveforms. Two
waveforms are acquired as follows:
CHIRP K DURATION
P1 MEASUREMENT
Figure 27. Chirp Response Time
QPHY-USB Operator’s Manual Rev F
29
Page 30

Figure 28. Chirp J and Chirp K Duration
30
QPHY-USB Operator’s Manual Rev F
Page 31

QPHY-USB Software Option
Figure 29. Chirp to Start of Frame Time
Device and Hub High-Speed Chirp Timing
1. Select Device or Hub in the Mode control and HS Chirp Timing in the Test control of the USB Test
Wizard.
2. Follow the instructions in the wizard menu to acquire the chirp timing waveform. The chirp waveform
should look like the following image:
QPHY-USB Operator’s Manual Rev F
31
Page 32

Figure 30. Chirp K Latency
32
QPHY-USB Operator’s Manual Rev F
Page 33

QPHY-USB Software Option
HIGH-SPEED SUSPEND RESUME RESET TIMING
Host High-Speed Suspend Resume Reset Timing
1. Select Host in the Mode control and HS Suspend Resume Reset in the USB Test Wizard.
2. Follow the instructions on the screen to acquire the suspend and reset timing waveforms as follows:
Figure 31. Time from Last Start of Frame to Host Suspend
QPHY-USB Operator’s Manual Rev F
33
Page 34

Device or Hub High-Speed Suspend Resume Reset Timing
The Suspend Resume Reset test measures the timing of the Suspend Resume and Reset actions as well as the
operating voltage of the device. The voltage upon resuming high-speed operation should be between 360 mV and
440 mV. The voltage measurement is intended to verify entering High-Speed mode. The test conditions are not
optimal for measuring the resume voltage, and therefore it is possible for a compliant device to have a peak-topeak voltage slightly outside this range.
1. Select Device or Hub in the Mode control and HS Suspend Resume Reset in the Test control of the
USB Test Wizard.
2. Follow the instructions in the USB Test Wizard to acquire traces for suspend, resume, reset, and reset
from suspend functions. The traces should look like the following:
Figure 32. Time from Last Start of Frame to Device Suspend
34
QPHY-USB Operator’s Manual Rev F
Page 35

QPHY-USB Software Option
HOST AND HUB DISCONNECT
Figure 33. Host Disconnect Section of Test Fixture
1. Select Host or Hub in the Mode control and HS Disconnect in the Test control of the USB Test Wizard.
2. Follow the instructions in the USB Test Wizard to acquire and measure the disconnect voltages. The
Disconnect Detected message is read from the USB-IF HS Electrical Test Tool dialog box. The traces for
normal and disconnect appears as follows:
Figure 34. Initial voltage before disconnect
Note: The Host trace is shown (previous). The same trace applies to Hub downstream ports.
QPHY-USB Operator’s Manual Rev F
35
Page 36

Figure 35. Voltage after disconnect
Note: The Host trace is shown (previous). Hub downstream ports may vary slightly.
36
QPHY-USB Operator’s Manual Rev F
Page 37

QPHY-USB Software Option
HUB HIGH-SPEED UPSTREAM REPEATER
Figure 36. Hub and Device Fixture Connections for Upstream Repeater Test
1. Select Hub in the Mode control and HS Upstream Repeater in the Test control of the USB Test Wizard.
Note: Longer cables and/or adapters may be used to ease connection of Mini-B and Micro-B connectors.
2. Follow the instructions in the USB Test Wizard to acquire the waveforms as shown:
Figure 37. Initial signal acquisition for hub upstream repeater test
The second packet is the device signal. It passes upstream to the hub (C4) and the hub repeats it to the host
(C1).
QPHY-USB Operator’s Manual Rev F
37
Page 38

Figure 38. Hub upstream repeater sync field truncation and corruption
The two zoom traces are adjusted using the front panel Zoom controls so their end of packet pulses (the wide
negative pulse on the far right) are overlaid and placed at the right edge of the display.
Figure 39. Hub upstream repeater end of packet dribble
The USB 2.0 specification allows the end of packet (EOP) field at the output of a hub to be up to 4 bits shorter
than the input.
38
QPHY-USB Operator’s Manual Rev F
Page 39

QPHY-USB Software Option
Figure 40. Hub upstream repeater delay
The measured time delay between input and output sync fields should be less than 36 bits plus 4 ns (< 79 ns).
The 4 ns are added to account for the delay through the fixture.
QPHY-USB Operator’s Manual Rev F
39
Page 40

To certified High
-
Speed
HUB HIGH-SPEED DOWNSTREAM REPEATER
To hub upstream port To hub downstream port
To host computer
device
Figure 41. Hub and Device Fixture Connections for Downstream Repeater Test
1. Select Hub in the Mode control and HS Downstream Repeater in the Test control in the USB Test
Wizard.
Note: Longer cables and/or adapters may be used to ease connection of Mini-B and Micro-B connectors.
2. Follow the instructions in the USB Test Wizard to acquire the waveforms as shown:
The measured time delay between input and output sync fields should be less than 36 bits plus 4 ns (< 79 ns).
The 4 ns are added to account for the delay through the fixture.
40
Figure 42. Hub downstream repeater delay
QPHY-USB Operator’s Manual Rev F
Page 41

QPHY-USB Software Option
Figure 43. Hub downstream repeater sync field truncation and corruption
The USB 2.0 specification allows the synchronization field at the output of a hub to be up to 4 bits shorter than the
input.
Figure 44. Hub downstream repeater end of packet dribble
The USB 2.0 specification allows the end of packet (EOP) field at the output of a hub to be up to 4 bits shorter
than the input.
QPHY-USB Operator’s Manual Rev F
41
Page 42

RECEIVER SENSITIVITY
The receiver sensitivity is measured for devices and the upstream ports of hubs. Receiver sensitivity is measured
by applying a signal from a data generator to the input of the device or hub and observing the response of the
device or hub. The data generator is setup to transmit IN packets to be acknowledged by the device or hub. The
sensitivity is determined by reducing the level of the signal from the data generator and observing when the DUT
no longer responds. The data generator can be an arbitrary waveform generator or a pattern generator. The test
procedure is as follows:
1. Make sure the TEST/INIT switch on the Test Fixture is in the INIT position. Connect the “B” socket (J10)
of the “Sensitivity Receiver” section of the fixture to a High-Speed port on the Test Bed Computer.
Connect the “A” socket (J11) of the “Sensitivity Receiver” section of the Test Fixture to the device under
test.
2. Start the USB-IF HS Electrical Test Tool, select Device and then click Test. Click the Enumerate Bus
button once to force enumeration of the newly connected device. The device under test should be
enumerated with the device’s VID shown.
3. Load the “MIN_ADD1” waveform into the generator (see Appendix A for details on creating this
waveform). This generates “IN” packets (of compliant amplitude) with a 12-bit SYNC field. Connect the
generator to the “Sensitivity Receiver” section of the Test Fixture, using the supplied SMA cables. When
connecting the outputs of the generator make sure to connect the first channel to the D+ SMA (J9) and
the second channel to the D- SMA (J15).
4. Connect the differential probe from channel 1 of the oscilloscope to the differential probe header J12 of
the “Sensitivity Receiver” section of the Test Fixture. Recall the HSRcvrSensitivity.lss panel file on the
oscilloscope, using the File Recall Setup menu. Use the Browse button in the “Recall Panel From
File” control to select the file from the D:\Applications\USB2\Setups directory. Press the Recall Now
button to select this setup file.
Figure 45. Receiver Sensitivity Test Setup
42
QPHY-USB Operator’s Manual Rev F
Page 43

QPHY-USB Software Option
5. From the HS Electrical Test Tool - Device Command menu, select TEST_SE0_NAK from the Device
Command drop down menu. Click EXECUTE once to place the device into TEST_SE0_NAK test mode.
Figure 46. Use Device Command drop down list of HS Electrical Test Tool
6. Place the TEST/INIT on the Test Fixture to the TEST position. This switches in the data generator in place
of the host controller. The data generator emulates the “IN” packets from the host controller.
7. Verify that there is a response packet (NAK) for all packets sent from the data generator. This should
appear as a sequence of two packets with a small gap between them followed by a larger gap as shown
in the figure below. The first packet is the data generator output and the second packet is the NAK from
the device or hub under test. If there is a response for every packet sent by the generator than the device
or hub passes EL_18.
Figure 47. Response to IN tokens with 12-bit sync - all packets NAK’d
QPHY-USB Operator’s Manual Rev F
43
Page 44

8. Now load the “IN_ADD1” waveform into the generator (see Appendix A for details). The generator
amplitude should be set to the 400 mV. This generates IN tokens with a full 32 bit sync and nominal
amplitude.
9. Verify that there is a response packet (NAK) for all packets sent from the data generator, as in step 7.
10. Reduce the amplitude of the data generator packets in small steps while monitoring the response from the
device on the oscilloscope. The adjustment should be made to both generator outputs such that the level
is set to the same value for both outputs. Reduce the amplitude until the NAK response packet begins to
become intermittent, as shown in the figure below. At this point, increase the amplitude such that the NAK
packet is not intermittent. This is just above the minimum receiver sensitivity levels before squelch.
Figure 48. Intermittent Response to IN tokens at low amplitude
11. Measure the zero-to-positive peak of the packet from the data generator using the cursors in the lower
(zoom) window of the oscilloscope display. Use the upper cursor position knob to position cursor 1 on the
zero level of the waveform and the lower cursor control knob to position cursor 2 on the positive peak of
the waveform. The cursor should be positioned on the plateaus of the wider pulses to avoid inflating the
reading due to overshoots. The difference voltage is indicated in the F1 waveform box, “zoom(C1)”, at the
lower left corner of the oscilloscope screen. Record this value as EL_17 positive threshold.
12. Move cursor 2 to the negative peak of the waveform in the lower window of the oscilloscope screen, using
the lower cursor control knob again, and position the cursor on the wider plateaus to avoid overshoots.
Read the difference voltage in the waveform information box at the bottom left of the oscilloscope display.
Record this value as EL_17 negative threshold. The receiver must continue to NAK packets above +/150 mV to pass EL_17.
44
QPHY-USB Operator’s Manual Rev F
Page 45

QPHY-USB Software Option
13. Now further reduce the amplitude of the packet from the data generator in small steps, still maintaining
balance between the outputs until the receiver just ceases to respond with NAK. This is the squelch level
of the receiver.
14. Measure the Zero-to-Positive Peak and Negative Peak of the packet from the data generator, using the
method described in steps 11 and 12. As long as the receiver ceases to NAK the data generator packet
below +/- 100 mV, it is considered to have passed EL_16.
Figure 49. Receiver squelch level – no response to IN tokens
Note: With certain devices, making an accurate zero-to-peak measurement of the IN packet from the data generator may be difficult due to
excessive reflection artifacts. Also, on devices with captive cable, the measured zero-to-peak amplitudes of the IN packet at the test fixture
could be considerably higher than that seen by the device receiver. In these situations, it is advisable to make the measurement near the
device receiver pins on the PCB.
QPHY-USB Operator’s Manual Rev F
45
Page 46

FULL AND LOW-SPEED TESTS
All HS-capable devices, hosts, and hubs must support Full-Speed (12 Mb/s) data rates. Compliance testing
requires this rate be tested along with the High-Speed (480 Mb/s) rate. Full-Speed compliance requires both
interoperability and electrical tests. The LeCroy USB 2.0 test solution addresses the electrical test requirements
for Full-Speed operation. These tests include signal quality, inrush current, and droop/drop. The package also
supports Low-Speed electrical tests, which apply only to hub/host downstream ports and Low-Speed devices. The
following topics provide detailed descriptions of the Full and Low-Speed electrical tests for hosts, hubs and
devices.
Equipment requirements
Standard USB products
Please refer to the USB-IF Full and Low-Speed Electrical and Interoperability Compliance Test Procedure available at
UU
www.usb.orgUU for a current list of standard USB products recommended for use in FS/LS electrical testing and
interoperability testing. Due to limited product lifetimes the approved products for testing change periodically so it is
important to obtain the latest equipment lists periodically.
The following list of standard equipment is required for performing Full and Low -Speed electrical tests:
Item Quantity
1 100 mA load board (for bus powered hubs only)
1*
2 500 mA load board 1*
3 Droop test board 1
4 SQiDD board 1
5 Full-Speed hub (self powered) 1
6 High-Speed hub (self powered) 4
7 5 m USB cables 6
* Additional load boards may be required depending on the number of downstream ports on the product. The test fixture provides enough
loads to test 12 port hubs/hosts.
46
QPHY-USB Operator’s Manual Rev F
Page 47

QPHY-USB Software Option
D
roop
Red Squares Indicate Load Connectors.
S
ignal
Current Loop for
The first 4 items in the previous list are contained within the LeCroy Test Fixtures. The following figure shows the
sections of the fixtures used for these tests.
Inrush Tests
Quality
Fixtures
(SQIDD)
Test
Switch Position Selects 100 or 500 mA Load.
Figure 50. FS/LS Signal Quality Test Fixture Sections
QPHY-USB Operator’s Manual Rev F
47
Page 48

Hub and Host Drop Test
Note: The drop test is performed using a voltmeter and the test fixture alone. The oscilloscope is not used for this test. The drop test is not
contained in the USB Test Wizard.
Set up the voltmeter to measure the voltage drop across the loads, as shown in the following figure. Attach all the
output ports of the hub or host to any of the loads on the Test Fixture. Make sure the three position switches on
each load are in the center (off) position before connecting the cables.
Note: The Upstream Port VBus voltage measurement (J23) is only required when testing Bus-powered Hubs.
Figure 51. Bus-Powered Hub Drop test equipment setup
Self-powered Hubs or Hosts
1. Switch the loads to the 500 mA position one at a time and verify that the voltage is between 4.75 and
5.25 V.
2. Repeat as necessary for all ports of the hub or host.
V
DROP
= VNL - V
LOADED
Where
VNL = V
at a downstream USB connector with USB ports open circuited (no load)
BUS
And
V
LOADED
= V
at a downstream USB connector with 100 or 500 mA loads, as appropriate, on all
BUS
USB ports
48
QPHY-USB Operator’s Manual Rev F
Page 49

QPHY-USB Software Option
Bus-powered Hubs
1. Switch the loads to the 100 mA position one at a time and verify that the voltage is above 4.4 V.
2. Repeat as necessary for all ports of the hub.
V
Where
DROP
= V
UPSTREAM
– V
DOWNSTREAM
V
UPSTREAM
= V
at a hub’s upstream connection
BUS
And
V
DOWNSTREAM
= V
at one of the hub’s downstream ports
BUS
Test Criteria
Section 7.2.2 of the USB 2.0 specification requires self-powered downstream USB ports to provide a V
between 4.75 and 5.25 V while bus-powered hubs must maintain V
V
under both no-load and full-load (100 or 500 mA, as appropriate) conditions. Self-powered hubs, systems,
BUS
at 4.40 V or greater. Drop testing evaluates
BUS
BUS
and laptops must provide a voltage between 4.75 and 5.25 V under all load conditions. Bus-powered hubs must
have a V
<= 100 mV between their upstream and downstream ports when 100 mA loads are present on all
DROP
downstream ports. This ensures they supply 4.4 V to a downstream device, given a 4.75 V upstream supply,
minus 100 mV drop through the hub and 250 mV drop through the upstream cable. If the hub does not use a
captive cable (the USB cable has a B plug), the voltage drop is the difference between the measured upstream
voltage level and the lowest measured downstream value. Bus-powered hubs with captive cables (the USB cable
does not have a B plug) must have V
less than or equal to 350 mV between the upstream connector and their
DROP
downstream ports. This includes the drop through the cable. Special consideration should be made for laptops
unable to provide compliant voltages with 500 mA loads while running on battery power, provided they can meet
the required voltages with one or more of the loads reduced to 100 mA. However, the end user may experience
confusion and difficulty in this situation, unless the operating system or laptop vendor provides a warning
message window alerting the user that a high-power device cannot be used under battery power.
QPHY-USB Operator’s Manual Rev F
49
Page 50

Droop Test
Equipment setup:
Figure 52. Hub Droop Test Equipment Setup
Figure 53. Device and oscilloscope connections for droop test
50
QPHY-USB Operator’s Manual Rev F
Page 51

QPHY-USB Software Option
Remaining Loads are connected to the remaining downstream ports.
Test Steps
1. Select Host or Hub in the Mode control and Droop in the Test control of the USB Test Wizard. Follow the
instructions in the test wizard to acquire the droop waveform as shown:
Figure 54. Droop voltage waveform
2. Connect port 1 (port under test) of the hub or host under test to the Trigger section B socket (J25) of the
Test Fixture using a short cable. Connect the A socket (J27) of the Trigger section to load 1 (J8) of the
fixture using a 1 meter (3 ft.) USB cable. Connect port 2 of the hub or host under test to the droop section
of the Test Fixture (J1) using a 1 meter (3 ft.) USB cable. Connect the remaining ports of the hub or host
under test to the any of the remaining loads of the Test Fixture using 1 meter (3 ft.) USB cables. All
hub/host ports should have a load attached. Make sure all of the switches are in the center (OFF) position
before connecting the cables.
3. Connect channel 2 of the oscilloscope to J3 in the droop section of the fixture. Connect channel 3 of the
oscilloscope to J28 in the Trigger section of the fixture.
4. Switch all test loads to the appropriate current level (100 mA or 500 mA) as indicated in the table in the
Test Results section as follows.
Test Criteria
Section 7.2.4.1 of the USB 1.1 specification allows a maximum droop of 330 mV in the V
supplied to a USB
BUS
port when a device is hot plugged into another port. Droop testing evaluates worst-case droop by applying a 100
mA load and 10 µF of capacitance, which switches on and off to one of the adjacent available ports when all other
ports are supplying the maximum load possible. All V
measurements are relative to local ground.
BUS
QPHY-USB Operator’s Manual Rev F
51
Page 52

Test Results
LOADED
UPSTREAM
DOWNSTREAM
DROP
Bus-powered
Hub
Self-powered
Hub/System
Laptop
Battery powered Self powered
Load type 100 mA 500 mA __100__500 mA 500 mA
VNL
V
V
V
V
V
Less than
DROOP
330 mV
Reporting Results
No Load Voltage: passing values are from 4.75 to 5.25 V
Loaded Voltage: passing values are from 4.75 to 5.25 V
Upstream Voltage: passing values are from 4.40 to 5.25 V
Downstream Voltage: passing values are from 4.75 to 5.25 V
Voltage Drop
Droop Voltage
Note: Please do not connect a Hub or a Host to the droop fixture longer than 5 minutes. Resistance may become unstable under high
temperature. Touching the resistance area may result in scalding or burning.
52
QPHY-USB Operator’s Manual Rev F
Page 53

QPHY-USB Software Option
Host Low-Speed Downstream Signal Quality
1. Set up the equipment as shown in the following figure.
2. Select Host in the Mode control and LS Downstream Signal Quality in the Test control of the USB Test
Wizard.
3. Use the SQ Device section of the Test Fixture as the SQiDD in the following figure. Ensure the TEST/INIT
switch is in the INIT position. The best method to capture and analyze Low-Speed downstream signal
quality is to capture both a keep-alive (Low-Speed EOP) and a packet. The root hub is required to either
generate a keep-alive or send Low-Speed traffic once per frame whenever a Low-Speed device is directly
attached. Capture downstream traffic with Low-Speed devices with a trigger on the rising edge of D-.
Figure 55. Host Low-Speed Downstream Signal Quality Test Equipment Setup
Note: The USB-IF High-Speed Electrical Test Tool is not used for this test and should not be running.
4. Press the Single Acquisition button on the oscilloscope until a full packet is displayed on the screen. The
full packet may consist of the keep alive and a data packet, or could be just a data packet and should fill
most of the oscilloscope screen. Use the cursors to select the downstream portion of the data packet
(shown as follows). The cursors are set to 1 UI before the first bit in the sync field on the left and 1 UI after
the end of the EOP on the right.
QPHY-USB Operator’s Manual Rev F
53
Page 54

5. Press the Next button in the USB Test Wizard once the proper packet is captured. The MATLAB analysis
script is executed and the signal quality eye pattern is displayed.
Figure 56. Cursor Positioning for Host Low-Speed Signal Quality Test
54
QPHY-USB Operator’s Manual Rev F
Page 55

QPHY-USB Software Option
Host Full-Speed Downstream Signal Quality
1. Connect the system as shown in the following figure.
2. Select Host and FS Downstream Signal Quality in the USB Test Wizard on the oscilloscope.
3. Plug a Full-Speed (or High-Speec) device into the last hub and verify enumeration. If the device fails to
enumerate, this could be due to low receiver sensitivity. Remove the last hub in the chain and repeat the
enumeration. The tier control in the USB Test Wizard should be set to 6 when all hubs in the chain are
being used. Decrease this number for each hubs that must be removed to achieve enumeration.
Note: The USB-IF High-Speed Electrical Test Tool is not used for this test and should not be running
4. Follow the steps in the USB Test Wizard on the instrument display to capture the appropriate waveform. It
may be necessary to repeat the acquisition to capture a full screen of data. Use the cursors to select the
downstream portion of the data packet (as the following figure shows). The cursors are set to 1 UI before
the first bit in the sync field on the left and 1 UI after the end of the EOP on the right. The software then
generates an HTML report on the signal quality.
Figure 57. Host Full-Speed Downstream Signal Quality Test Equipment Setup
QPHY-USB Operator’s Manual Rev F
55
Page 56

Figure 58. Cursor Positioning for Host Full-Speed Downstream Signal Quality
56
QPHY-USB Operator’s Manual Rev F
Page 57

QPHY-USB Software Option
Inrush current
Inrush current is generated by devices when they are connected to a hub or host. Self-powered devices should
have negligible inrush current. So, this test normally does not indicate any inrush current for such devices. Inrush
is measured using the Inrush section of the test fixture.
The arrow on the current probe must point in the same direction as the arrow on the Test Fixture. The current
probe (a LeCroy CP030, or equivalent) is attached to channel 4 of the oscilloscope. The oscilloscope is set to
trigger on the rising edge of the current pulse measured on channel 4. Problems associated with switch bounce
are avoided when initiating the inrush measurement by plugging the device under test into the Inrush section of
the Test Fixture.
The sequence of operations is:
1. Move the switch in the Inrush section from the ON position to the Discharge position.
2. Unplug the device under test.
3. Move the switch back to the ON position. The oscilloscope may trigger and capture a waveform.
4. Plug the device under test into the Inrush port. The oscilloscope triggers again and captures a current
waveform as follows:
Figure 59. Inrush Current Pulse
5. If the waveform’s vertical amplitude is too small or too large (off the screen), adjust the vertical scale of
channel 4 and repeat steps 1 through 4 (previous). The inrush current is measured for a minimum of
100ms after attach. Repeat the steps until a good current trace is captured.
The inrush test measures regions where the current exceeds 100mA for at least 100µs. The region
containing the most charge is used to determine pass or fail. The inrush test integrates the current in each
region to obtain the total charge for each. The USB specification requires the total charge in each region
be less than 50µC.
6. The software then generates an HTML report on the inrush.
QPHY-USB Operator’s Manual Rev F
57
Page 58

Hub Down Stream Low-Speed Signal Quality
1. Set up the equipment as follows. The hub is tested at tier 5 (at the end of a chain of four hubs) connected
to a device at tier 6. The first hub in the chain should be a USB Full-Speed hub. The chain of hubs is
intended to test the receiver sensitivity of the hub.
2. Start the USB High-Speed Electrical Test Tool, select Device, and then press Test. Press Enumerate
Bus and verify the hub under test appears in the Select Device window.
3. A Low-Speed device (mouse) is connected between a downstream port of the hub under test through the
Inrush section of the Test Fixture. Make sure the Inrush switch is in the ON position.
4. Select Hub in the mode control and LS Downstream Signal Quality in the test control of the USB Test
Wizard. The trigger is set up to acquire a waveform on the oscilloscope on the rising edge of the D- line in
Single trigger mode.
5. Press the Single trigger button on the oscilloscope until a full packet is captured on the screen. Use the
cursors to select the downstream portion of the data packet as the following figure shows. The cursors are
set to 1 UI before the first bit in the sync field on the left and 1 UI after the end of the EOP on the right.
6. Press Next in the USB Test Wizard to process the waveform. MATLAB generates an eye pattern
waveform file and an HTML signal quality report. These files are stored in the
D:\Applications\USB2\Results directory.
Figure 60. Hub Low-Speed Downstream Signal Quality Setup
58
QPHY-USB Operator’s Manual Rev F
Page 59

QPHY-USB Software Option
Hub Full-Speed Downstream Signal Quality
1. Set up the equipment as follows. The hub is tested at tier 5 (at the end of a chain of 4 hubs) connected to
a device at tier 6. The first hub in the chain should be a USB Full-Speed hub. The chain of hubs is
intended to test the receiver sensitivity of the hub.
Figure 61. Hub Full-Speed Downstream Signal Quality Setup
1. Start the USB High-Speed Electrical Test Tool, select Device, and then press Test.
2. Press Enumerate Bus and verify the hub under test appears in the Select Device window.
3. A Full-Speed device is connected to the downstream port of the hub under test through the SQ Device
section of the Test Fixture.
4. Select Hub in the mode control and FS Downstream Signal Quality in the test control of the USB Test
Wizard.
5. Press the Single Trigger front panel button on the oscilloscope until a full packet is captured on the
screen. Use the cursors to select the downstream portion of the data packet (as the following figure
shows). The cursors are set to 1 UI before the first bit in the sync field on the left and 1 UI after the end of
the EOP on the right.
6. Press Next in the USB Test Wizard to process the waveform. MATLAB generates an eye pattern
waveform file and an HTML signal quality report. These files are stored in the
D:\Applications\USB2\Results directory.
QPHY-USB Operator’s Manual Rev F
59
Page 60

Figure 62. Cursor Placement For Hub FS Downstream Signal Quality Test
60
QPHY-USB Operator’s Manual Rev F
Page 61

QPHY-USB Software Option
Device and Hub Full-Speed Upstream Signal Quality Test
Upstream signal quality is tested for both hubs and devices and at both Full- and Low-Speed. USB 2.0 devices
require only the Full-Speed mode to be tested. The following setup is used in all cases (Full-Speed setup is
shown, Low-Speed is similar). The device or hub under test is connected to the last hub in the chain through the
Inrush section of the Test Fixture. A second device is connected to the hub through the Trigger section of the Test
Fixture. The second device must be a Low-Speed device for Low-Speed testing or a Full-Speed device for FullSpeed testing. For Low-Speed testing C1 is connected to D- (J26D). The chain of hubs is intended to test the
receiver sensitivity of the hub or device.
Figure 63. Device Full-Speed Upstream Signal Quality Test Equipment Setup
QPHY-USB Operator’s Manual Rev F
61
Page 62

Device and Hub Full- or Low-Speed Upstream Signal Quality Test
1. Start the USB High-Speed Electrical Test Tool, select Device and then press Test.
2. Press Enumerate Bus and verify that the hub or device under test appears in the Select Device window.
If the hub or device under test fails to enumerate, remove Full-Speed hubs one at a time from the end of
the chain until it does. The number of hubs between the host and the device under test plus one is the tier
at which the enumeration takes place.
3. Select the device or hub under test from the list in the Select Device window of the USB High-Speed
Electrical Test Tool and select LOOP DEVICE DESCRIPTOR in the Device Command control.
4. In the USB Test Wizard, select the appropriate mode (Hub or Device) and the appropriate test (FS or LS
Upstream Signal Quality).
5. Press the Single Trigger front panel button until a complete packet is captured. The waveform consists of
both downstream and upstream data. The upstream portion corresponds to the part of the differential
signal (channels 2 and 3) after the last bit in the trigger channel (channel 1). Use the cursors to select the
downstream portion of the data packet (as the following figure shows). The cursors are set to 1 UI before
the first bit in the sync field on the left and 1 UI after the end of the EOP on the right.
Figure 64. Isolation of Upstream Data Packet
6. Press Next in the USB Test Wizard to process the waveform. MATLAB generates an eye pattern
waveform file and an HTML signal quality report. These files are stored in the
D:\Applications\USB2\Results directory.
62
QPHY-USB Operator’s Manual Rev F
Page 63

QPHY-USB Software Option
TF-USB-B TEST AND CALIBRATION PROCEDURES
This topic describes the procedures to deskew, or calibrate the TF-USB-B connection cables.
Cable Deskewing
The following procedure demonstrates how to deskew two oscilloscope channels and cables using the differential
data signal, with no need for any “T” connector or adapters.
This can be done once the temperature of the oscilloscope is stable. The oscilloscope must be warmed up for at
least a half-hour before proceeding. This procedure should be run again if the temperature of the oscilloscope
changes by more than a few degree.
1. Connect a differential data signal to C2 and C3 using two approximately matching cables. Set up the
oscilloscope to use the maximum sample rate (e.g. for WaveRunner 204Xi: two channel mode; on the
Smart Memory menu set Fixed Sample Rate 10GS/s). Set the timebase for a few repetitions of the
pattern (at least a few dozen edges).
2. On the C3 menu, check Invert. Now C2 and C3 should look the same.
3. Using the Measure Setup, set P1 to measure the Skew of C2, C3. Turn on Statistics (Measure menu).
Write down the mean skew value after it stabilizes. This mean skew value is the addition of Data skew +
cable skew + channel skew.
4. Swap the cable connections on the Data source side (on the test fixture), and then press the Clear
Sweeps button on the oscilloscope (to clear the accumulated statistics; since we changed the input).
5. Write down the mean skew value after it stabilizes. This mean skew value is the addition of (-Data skew)
+ cable skew + channel skew.
6. Add the two mean skew values and divide the sum in half:
UU
[Data skew + cable skew + channel skew] + [ (-Data skew) + cable skew + channel skew]UU
2
7. The above formula simplifies to:
[cable skew + channel skew]
8. Set the resulting value as the Deskew value in C2 menu.
9. Restore the cable connections to their Step 1 settings (previous). Press the Clear Sweeps button on the
oscilloscope. The mean skew value should be approximately zero - that is the data skew. Typically,
results are <1ps given a test fixture meant to minimize skew on the differential pair.
10. On the C3 menu, un-check the Invert checkbox and turn off the parameters.
QPHY-USB Operator’s Manual Rev F
63
Page 64

In the previous procedure, we used the default setup of the Skew parameter (which is detecting positive edges on
both signals at 50%). We also inverted C3 in order to make C2 and C3 both have positive edges at the same
time.
Alternately, we clearly could have not inverted C3 and instead selected the Skew clock 2 tab in the P1 parameter
menu and set the oscilloscope to look for negative edges on the second input (C3). However, it is somewhat
agreed that the previous procedure looks much more aesthetically pleasing from the display as it shows C2 and
C3 with the same polarity.
Figure 65. The Skew parameter right side dialog, Skew clock 2 tab, showing default setup
64
QPHY-USB Operator’s Manual Rev F
Page 65

QPHY-USB Software Option
APPENDIX A
Receiver Sensitivity Test Waveform Setup
This section describes the characteristics of the required waveforms used for device or hub receiver sensitivity
testing. Either a two channel pattern generator, such as the Agilent 81130A, or a two channel arbitrary waveform
generator (AWG) can be used. Two Tabor WW1281A one channel AWG can also be used with a specific
synchronization cable. The specific steps used to create the waveforms will vary depending on the model of
generator being used. Please consult the documentation for details.
MIN_ADD1
Description: IN Token of nominal bitrate and amplitude with the shortest allowable sync field (12 bits).
Bitrate: 480 Mb/s
High Level (both channels): 400 mV
Low Level (both channels): 0 mV
Pattern length: 44 bits
Repetition Rate: 2 us (both channels should be at 0 mV for 916 bits following the pattern)
Pattern bits:
1 2 3 4 5 6 7 8 9 10 11 12
CH1 (D+) 0 1 0 1 0 1 0 1 0 1 0 0
CH2 (D-) 1 0 1 0 1 0 1 0 1 0 1 1
13 14 15 16 17 18 19 20 21 22 23 24 25 26 27 28
CH1 (D+) 0 1 0 0 1 1 1 0 0 1 0 1 0 1 0 1
CH2 (D-) 1 0 1 1 0 0 0 1 1 0 1 0 1 0 1 0
29 30 31 32 33 34 35 36 37 38 39 40 41 42 43 44
CH1 (D+) 0 1 0 0 1 1 1 1 0 0 0 0 0 0 0 0
CH2 (D-) 1 0 1 1 0 0 0 0 1 1 1 1 1 1 1 1
IN_ADD1
Description: IN Token of nominal bitrate, amplitude and sync field (32 bits).
Bitrate: 480 Mb/s
High Level (both channels): 400 mV
Low Level (both channels): 0 mV
Pattern length: 64 bits
Repitition Rate: 2 us (both channels should be at 0 mV for 896 bits following the pattern)
Pattern bits:
1 2 3 4 5 6 7 8 9 10 11 12 13 14 15 16
CH1 (D+) 0 1 0 1 0 1 0 1 0 1 0 1 0 1 0 1
CH2 (D-) 1 0 1 0 1 0 1 0 1 0 1 0 1 0 1 0
QPHY-USB Operator’s Manual Rev F
65
Page 66

17 18 19 20 21 22 23 24 25 26 27 28 29 30 31 32
CH1 (D+) 0 1 0 1 0 1 0 1 0 1 0 1 0 1 0 0
CH2 (D-) 1 0 1 0 1 0 1 0 1 0 1 0 1 0 1 1
33 34 35 36 37 38 39 40 41 42 43 44 45 46 47 48
CH1 (D+) 0 1 0 0 1 1 1 0 0 1 0 1 0 1 0 1
CH2 (D-) 1 0 1 1 0 0 0 1 1 0 1 0 1 0 1 0
49 50 51 52 53 54 55 56 57 58 59 60 61 62 63 64
CH1 (D+) 0 1 0 0 1 1 1 1 0 0 0 0 0 0 0 0
CH2 (D-) 1 0 1 1 0 0 0 0 1 1 1 1 1 1 1 1
Note: If the minimum voltage step on the generator is greater than or equal to 50 mV, 6dB attenuators should be used to get a finer minimum
voltage step. These attenuators will reduce the output voltage by approximately half, so the voltage levels on the generator should be
doubled.
§ § §
66
QPHY-USB Operator’s Manual Rev F
 Loading...