

Page 1
Operator's
Manual
Power Analysis Software
Page 2

Power Analysis Software Operator's Manual
© 2013 Teledyne LeCroy, Inc. All rights reserved.
Unauthorized duplication of Teledyne LeCroy documentation materials other than for internal sales and distribution purposes is strictly prohibited. However, clients are encouraged to distribute and duplicate Teledyne LeCroy documentation
for their own internal educational purposes.
Power Analysis and Teledyne LeCroy are registered trademarks of Teledyne LeCroy, Inc. Windows is a registered trademark of Microsoft Corporation. Other product or brand names are trademarks or requested trademarks of their respective holders. Information in this publication supersedes all earlier versions. Specifications are subject to change without
notice.
921326 Rev B
June 2013
Page 3

Operator's Manual
Contents
Power Analysis Software Overview 2
Software Overview 3
Required Equipment 3
Method of Operation 4
Power Analysis Software Dialogs 4
Deskew Voltage and Current Channels 6
Power Device Analysis 9
Device Analysis Preliminary Setup 9
Set Up Device Analysis Input Channels 11
Identify Switching Zone 12
Device Losses Test 13
Device Safe Operating Area Test 15
Device B-H Curve Test 16
Device Dynamic On-resistance Test 17
Device dv/dt Test 18
Control Loop Analysis 19
Control Loop Analysis Preliminary Setup 19
Set Up Control Loop Analysis Source Channel 21
Closed Loop Test 22
Line Power Analysis 23
Line Power Analysis Preliminary Setup 23
Set Up Line Power Analysis Source Channels 23
Line Power Test 25
Line Harmonics Test 26
Performance Analysis 28
Performance Efficiency Test 28
Performance Ripple Test 30
921326 Rev B
1
Page 4

Power Analysis Software
Power Analysis Software Overview
The Power Analyzer Software (PAS) option helps measure and analyze the operating characteristics of
power-conversion devices and circuits for off-line, DC-DC and DC-AC power circuit designs. It provides
automatic detection and measurement of turn-on and turn-off switching device losses, as well as conduction losses. Areas of power loss are clearly delineated by a color-coded waveform overlay, and tools
are provided to reduce measurement errors. A streamlined user interface guides you through the various stages of analysis.
PAS consists of these major analysis areas:
l Device Analysis covers the measurement of switching device performance such as device instant-
aneous power, switching losses, safe operating area (SOA), saturation voltage, dynamic on-resistance, dv/dt or di/dt, and saturation hysteresis curves of magnetic devices. With PAS, these
device measurements can be made either on a test stand or in circuit while the devices are operating in a power conversion system.
l Control Loop Analysis covers the acquisition and analysis of information contained in a power con-
version circuit’s modulated control signal. It analyzes modulation changes in pulse width (PWM),
duty cycle, frequency, or period as the feedback loop responds to changes in line and/or load, as
well as during start-up and shut-down.
l Line Power Analysis covers the measurement of line voltage and current applied to an off-line
power conversion device. Real power, apparent power, power factor, crest factor, and line harmonics are measured. Analysis of line harmonic content is included to assist the design and evaluation engineer in designing for pre-compliance to EN 61000-3-2 requirements.
l Performance Analysis computes the efficiency of the power supply and adds the measurements to
determine the amount of ripple a power source generates.
All Teledyne LeCroy voltage and current probes are integrated with the software, and measurements are
automatic and precise. Documentation and Flashback to prior power-circuit analyses can be accomplished through LabNotebook.
2
921326 Rev B
Page 5

Operator's Manual
Software Overview
Required Equipment
You will need this equipment to utilize the Power Analysis Software.
Oscilloscope
Power Analyzer Software option operates on any Teledyne LeCroy Windows-based oscilloscope. For analysis of phenomenon requiring the acquisition of many cycles, an oscilloscope with a minimum memory
of 1 Mpt per channel is recommended. Steady-state analysis can be accomplished with shorter record
lengths. Two acquisition channels are adequate for most measurements, but a four-channel oscilloscope
is recommended if you would like to analyze multiple devices or use complex triggering. To see the small
signal details hidden in large signals, such as a saturation voltage, or ripple transient analysis, a 12-bit
oscilloscope is recommended.
Probes
Voltage Probes. A wide range of voltage probes are available and are integrated within this software.
Proper section of the following probes should match circuit details, including: single-ended passive,
single-ended high voltage, differential high-voltage, active single and differential high-frequency, and 50
Ohm transmission line probe. Differential voltage probes will support your measurement environment
including isolating your circuits from line power, measuring currents with current sensing resisters, and
viewing switching transients in power supply ripple measurements.
Current Probes. The measurements described in Power Device Analysis require precision wide-bandwidth current probes with DC measurement capability. We recommend Teledyne LeCroy:
l AP015 or CP030 DC-to-50 MHz, 30-ampere current probe
l CP031 DC-to-100 MHz, 30-ampere current probe
l CP150 and CP500 high-current probes
Other, higher current probes are also available from Teledyne LeCroy.
Teledyne LeCroy ProBus probes automatically use correct units and scaling for power measurements
when used with the Power Analyzer software. When other probes are used, the Power Analyzer Software
provides methods for entering the correct units and scaling.
When a channel is selected as the current input within the software, its units are automatically changed
to Amperes. When a differential probe is used to measure the voltage across a shunt resistor, the Power
Analyzer software will support the proper amps/div scaling when the resistor value is entered.
Differential Amplifier
Measuring high-side gate drive signals in an off-line application and capturing a device saturation voltage
to measure conduction loss or Rds(on) are challenging to do. These require a voltage probing solution
that has high CMRR, fast overdrive recovery, voltage clamping (so the oscilloscope is not overdriven),
compensation flatness, gain/ amplification to see small signal details, and precise offset generation to see
the switching device’s turn-off performance. The Teledyne LeCroy DA1855A and its associated DXC Series
Passive Differential Probes are required.
921326 Rev B
3
Page 6

Power Analysis Software
Deskew Signal Source
To assist with eliminating propagation delay differences among voltage and current probes used for
device testing, the DCS015 dekew calibrated source is recommended. This source has time-coincident
voltage and current signals used to adjust deskew values within the oscilloscope channel controls and
Power Analyzer software.
Method of Operation
The general process for using the software to conduct power analysis is:
1. Set up DUT test circuit, consider isolation requirements, attach probes, and setup oscilloscope trigger
This includes all physical circuit setup and oscilloscope setup for timebase and acquisition triggers. We
show recommended connections, probing points, and trigger events for each type of analysis in the preliminary setup topics.
2. Set up voltage and current source channels
Make all Vertical settings on the channels to be used for a test and perform all necessary preliminary
adjustments to ensure measurement accuracy.
Because signals associated with power devices are relatively fast, it is important to determine whether
the propagation time for the current and voltage signal paths are the same. Signal delay characteristics of
the voltage and current probes, as well as the distance the signals must travel from the probe tips to the
input of the oscilloscope, can cause time-coincident points on the voltage and current signals to be
sampled by the oscilloscope at different times. Even a small time difference can cause significant errors to
occur in the measurements. Therefore, we recommend performing a preliminary deskew procedure and
repeating it whenever you change to the physical characteristics of the probes or the bandwidth/filter settings of the input channels.
Likewise, Fine DC Adjust voltage channels to remove any residual charge that may be in the probes.
3. Select analysis type, tests to be performed, and measurements to be displayed
This step comprises most of the work you will do in the Power Analyzer Software. Once the source channels are set up, various tests can be performed on the same inputs. The software automatically calculates your selected power measurements and displays them on screen, with test-appropriate trace
annotations and overlays to help you see significant portions of the input waveforms.
Power Analysis Software Dialogs
The Power Analysis Software presents a series of dialogs for setting up measurements specific to testing
switched-mode power supplies ad devices. Generally, the order of the tabs presents the order in which
you proceed to use the software, working from left to right.
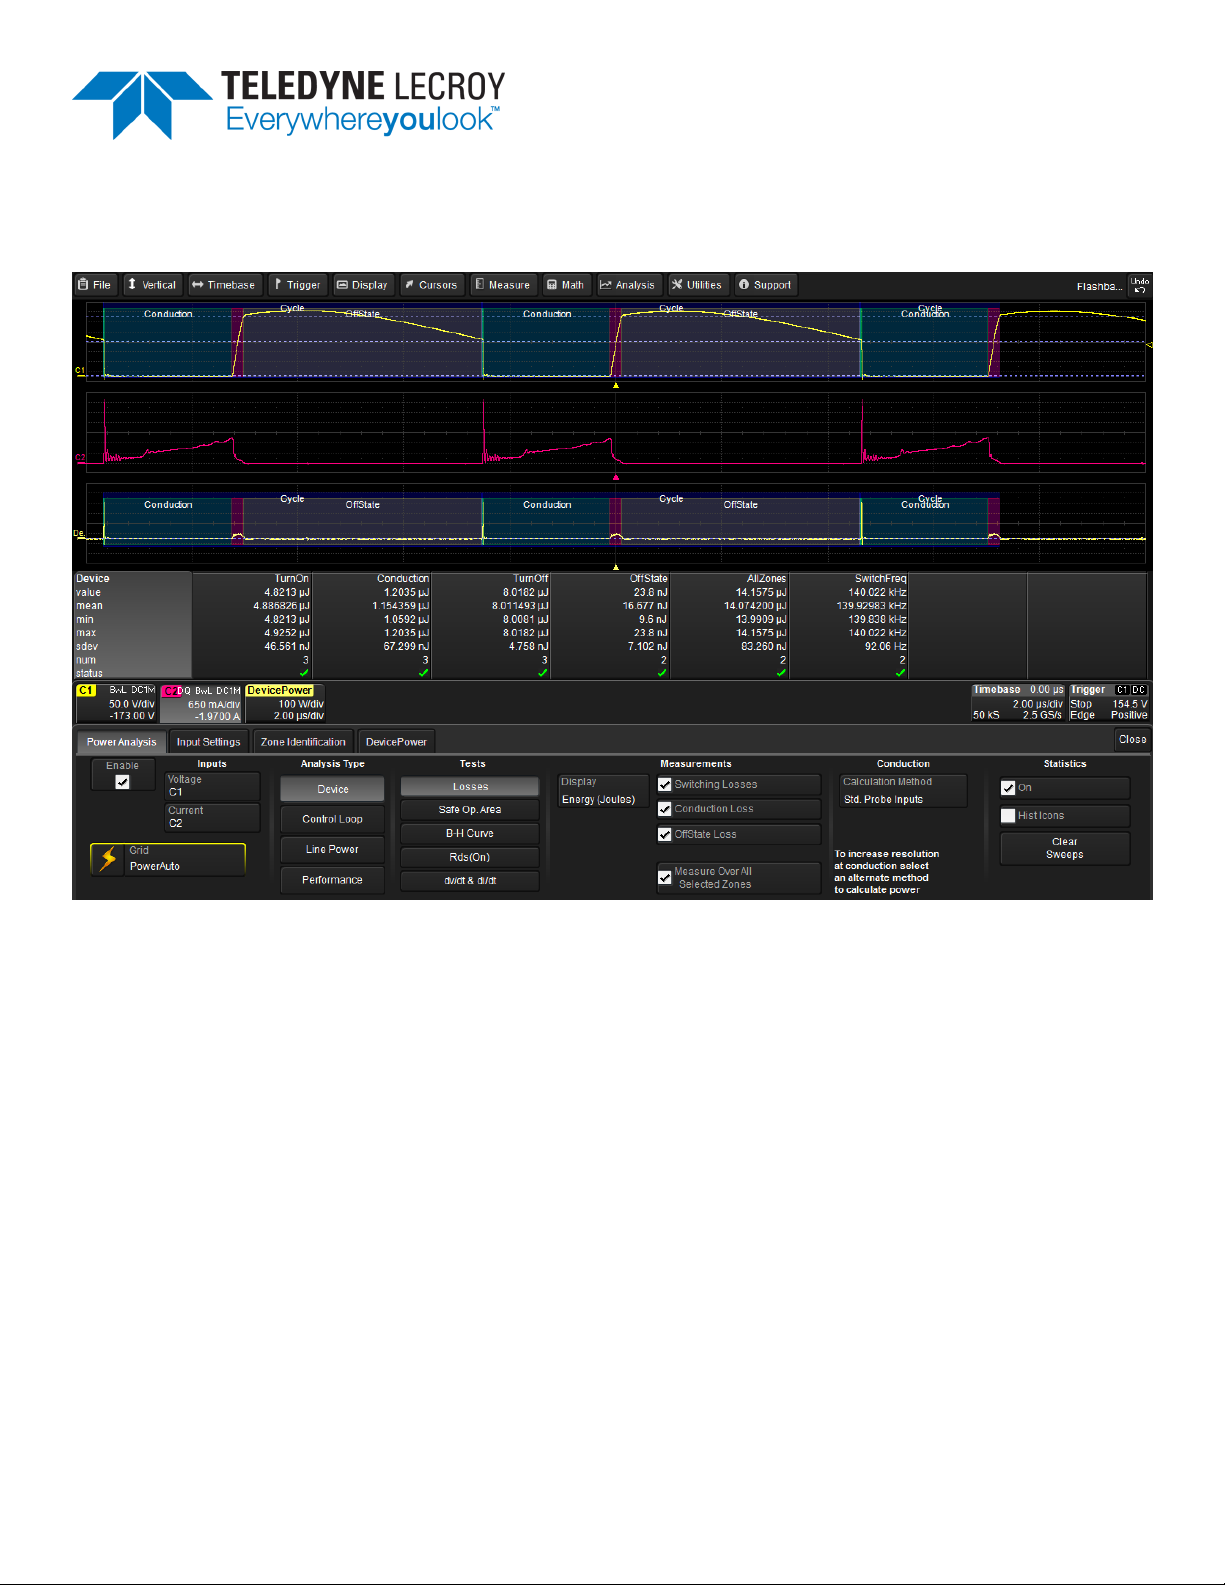
Power Analysis Dialog
The first tab is the Power Analysis dialog. This is the main set of controls where you select the Voltage
and Current Source input channels, the Analysis Type, and the specific Tests to run.
4
921326 Rev B
Page 7
Operator's Manual
The Power Analysis dialog is also where you control the display of Statistics or Histicons within the Power
Analysis Measurements table, and Clear Sweeps to reset the measurement counter.
The Grid control allows you to quickly change the grid style. The default setting, PowerAuto, displays the
correct number and style of grids for the selected power test. This setting is only available when Power
Analysis is enabled.
Quickly return to the Power Analysis dialog from any other dialog by selecting the leftmost section of the
Power Analysis measurement table.
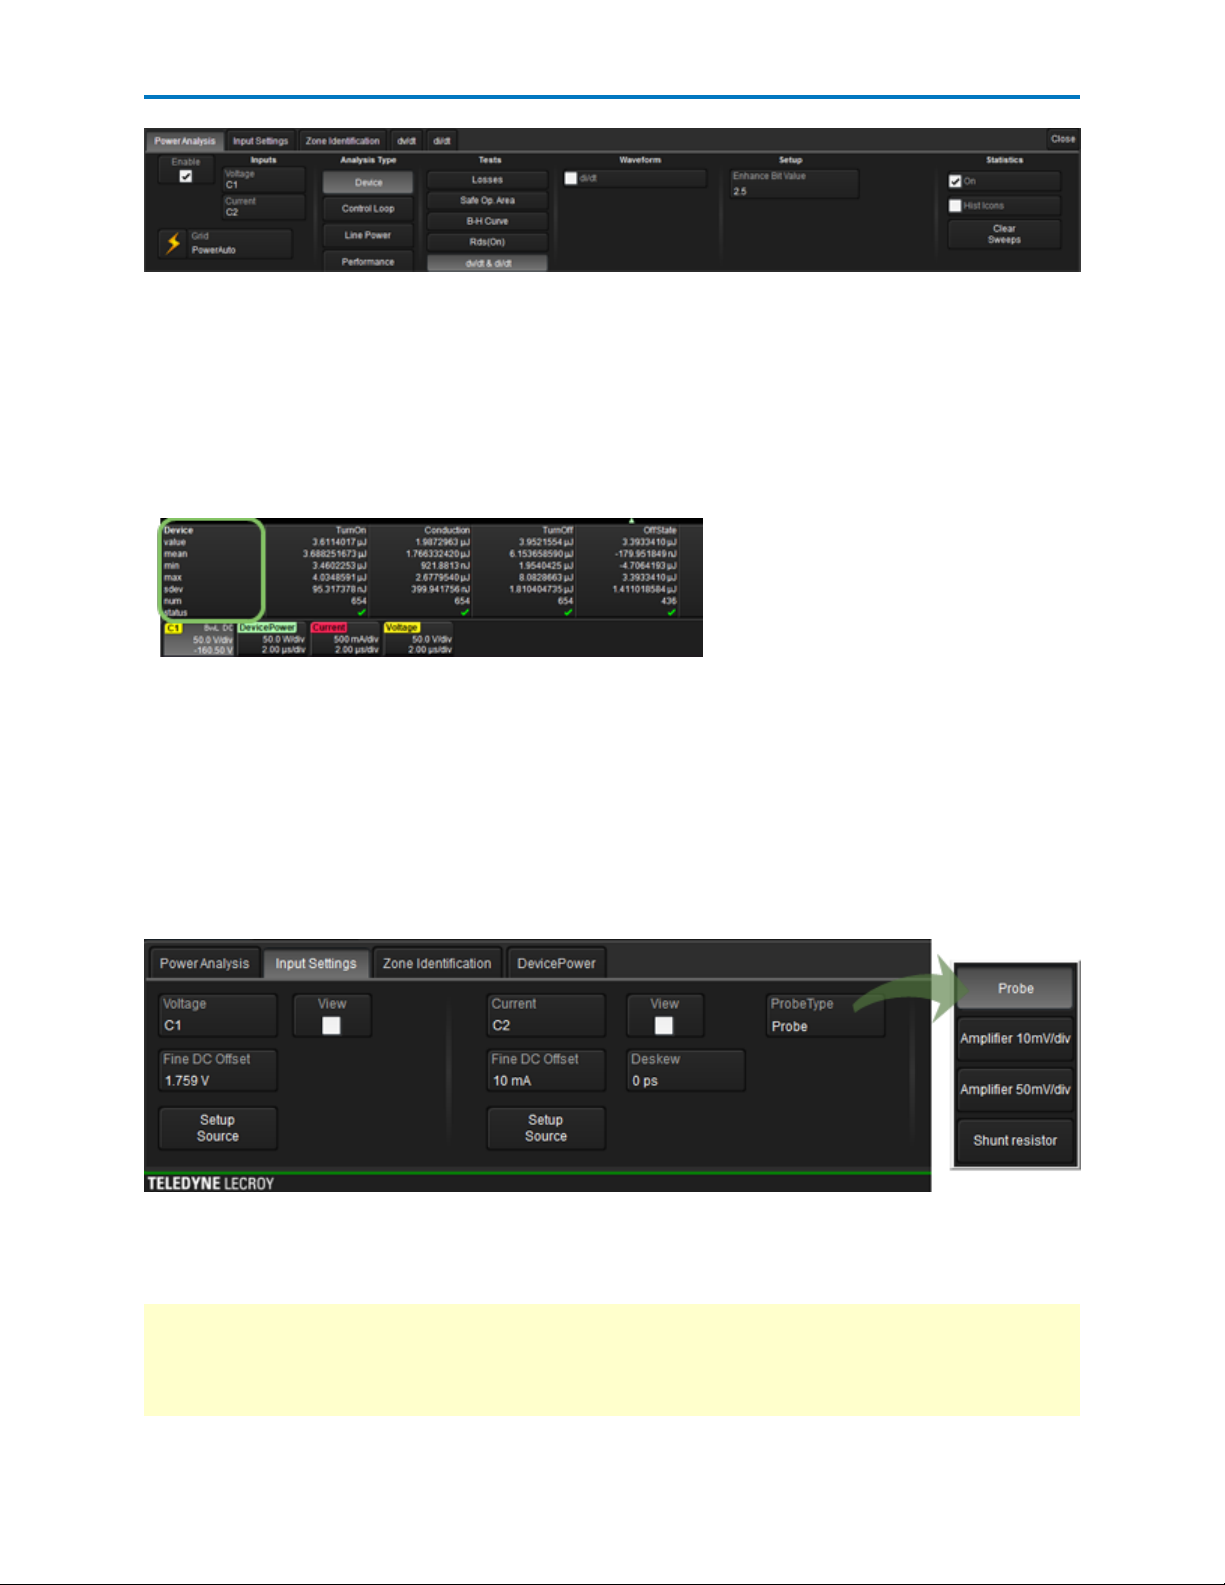
Input Settings Dialog
The second tab opens the Input Settings dialog, which allows you to adjust the Fine DC Offset and
Deskew values of your probes to increase measurement accuracy.
You can view the result of adjusting Fine DC Offset and Deskew by checking View on the Input Settings
dialog. This is a convenience to assist with fine adjustment; it's not necessary to keep this trace open.
Deskew values are duplicated on the Channel dialog, and the Power Analysis Software incorporates the
Fine DC Offset value in its measurement results.
You also use the Input Settings dialog to select the type of device used to measure current in ProbeType.
Setup Source buttons on the Input Settings dialog enable you to quickly access the source Channel
setup dialogs, where you can adjust input bandwidth limits, set up filters, AutoZero voltage probes, or
DeGauss current probes.
NOTE: When selecting Device Analysis, Losses Test and a Conduction Loss calculation method measuring
Vsat with a 2nd voltage probe, a third set of controls will become available for Deskew and DC Fine
Adjust. These controls are made available for use with a probe or amplifier solution that incorporates
voltage clamping and fast overdrive recovery, such as the DA1855A/DXC100A.
921326 Rev B
5
Page 8
Power Analysis Software
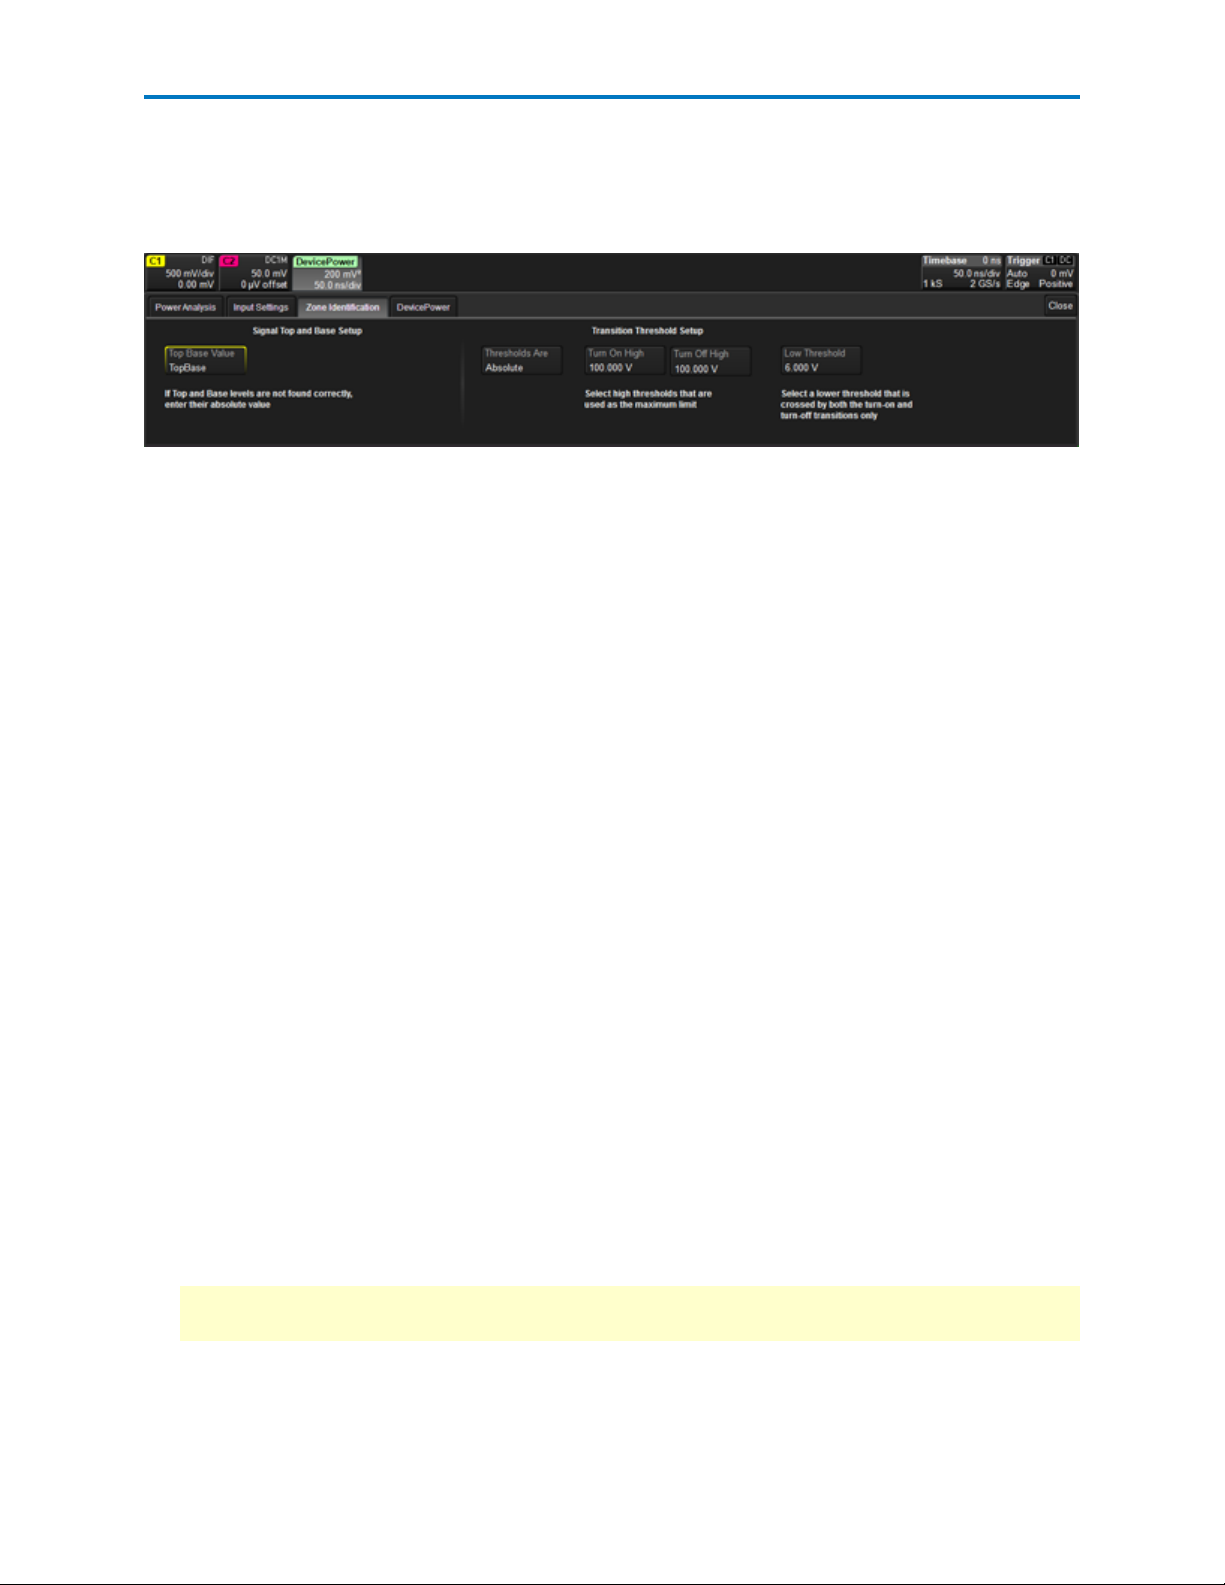
Zone Identification Dialog
This tab appears only when the Analysis Type is Device. The Zone Identification dialog is used to set up
device switching measurement zones, which adds a set of color overlays and annotations to the Power
Analysis trace.
Other Dialogs
Tabs for other dialogs, such as Device Power, appear only when the corresponding Analysis Type and
Test are selected. They contain rescale controls that allow you to “zoom” the result trace to view more or
less waveform detail . The controls are the same as found on any Zoom dialog, although in this case they
will alter the appearance of the Power Analysis trace instead of opening a new zoom trace.
Deskew Voltage and Current Channels
Use this Deskew procedure to check propagation delay differences between the current and voltage channels. This is very important if these signals are going to be used to make instantaneous power Losses,
Safe Operating Area, or Dynamic On-resistance measurements.
This process can be used to characterize and correct the delay difference between more than one current
and one voltage channel. For instance, if you plan to use one voltage channel and alternate measurements between two current channels, the relationship between the voltage channel and each of the
current channels can be characterized. The same is true if you are using a differential amplifier to capture
voltage at key event points. The amount of deskew required for each combination should be recorded
for later use.
Throughout this procedure, the Voltage source channel is used as the reference trace. Adjust all other
traces to this reference.
1. Recall the oscilloscope's factory default settings.
2. Connect the:
l Voltage probe to Channel 1
l Current probe to Channel 2
l DCS015 Deskew Calibration Source to the EXT input.
3. Set Channel 1 scale to 1 V/div. If using a differential probe on Channel 1, also AutoZero the probe.
4. Set Channel 2 scale to 20 mA/div. DeGauss the current probe.
NOTE: It's good practice to leave the current probe disconnected from the test circuit due to the excitation signal used to DeGauss the probe.
5. Connect the voltage and current probes to the DCS015. Be sure to match the proper voltage probe
polarization and current probe direction to the DCS015.
6. Set the oscilloscope timebase to 20 ns/div and zero delay.
6
921326 Rev B
Page 9

Operator's Manual
7. Set the oscilloscope trigger to Channel 1, negative edge, at a level of 2 Volts.
8. Choose Display > Single Grid, then adjust Offset on Channel 1 and Channel 2 so that the voltage
and current waveforms are on top on each other in the middle of the display.
9. Choose Analysis > Power Analysis to open the Power Analysis Software.
10. On the Power Analysis dialog, select C1 as the Voltage source, and C2 as the Current source.
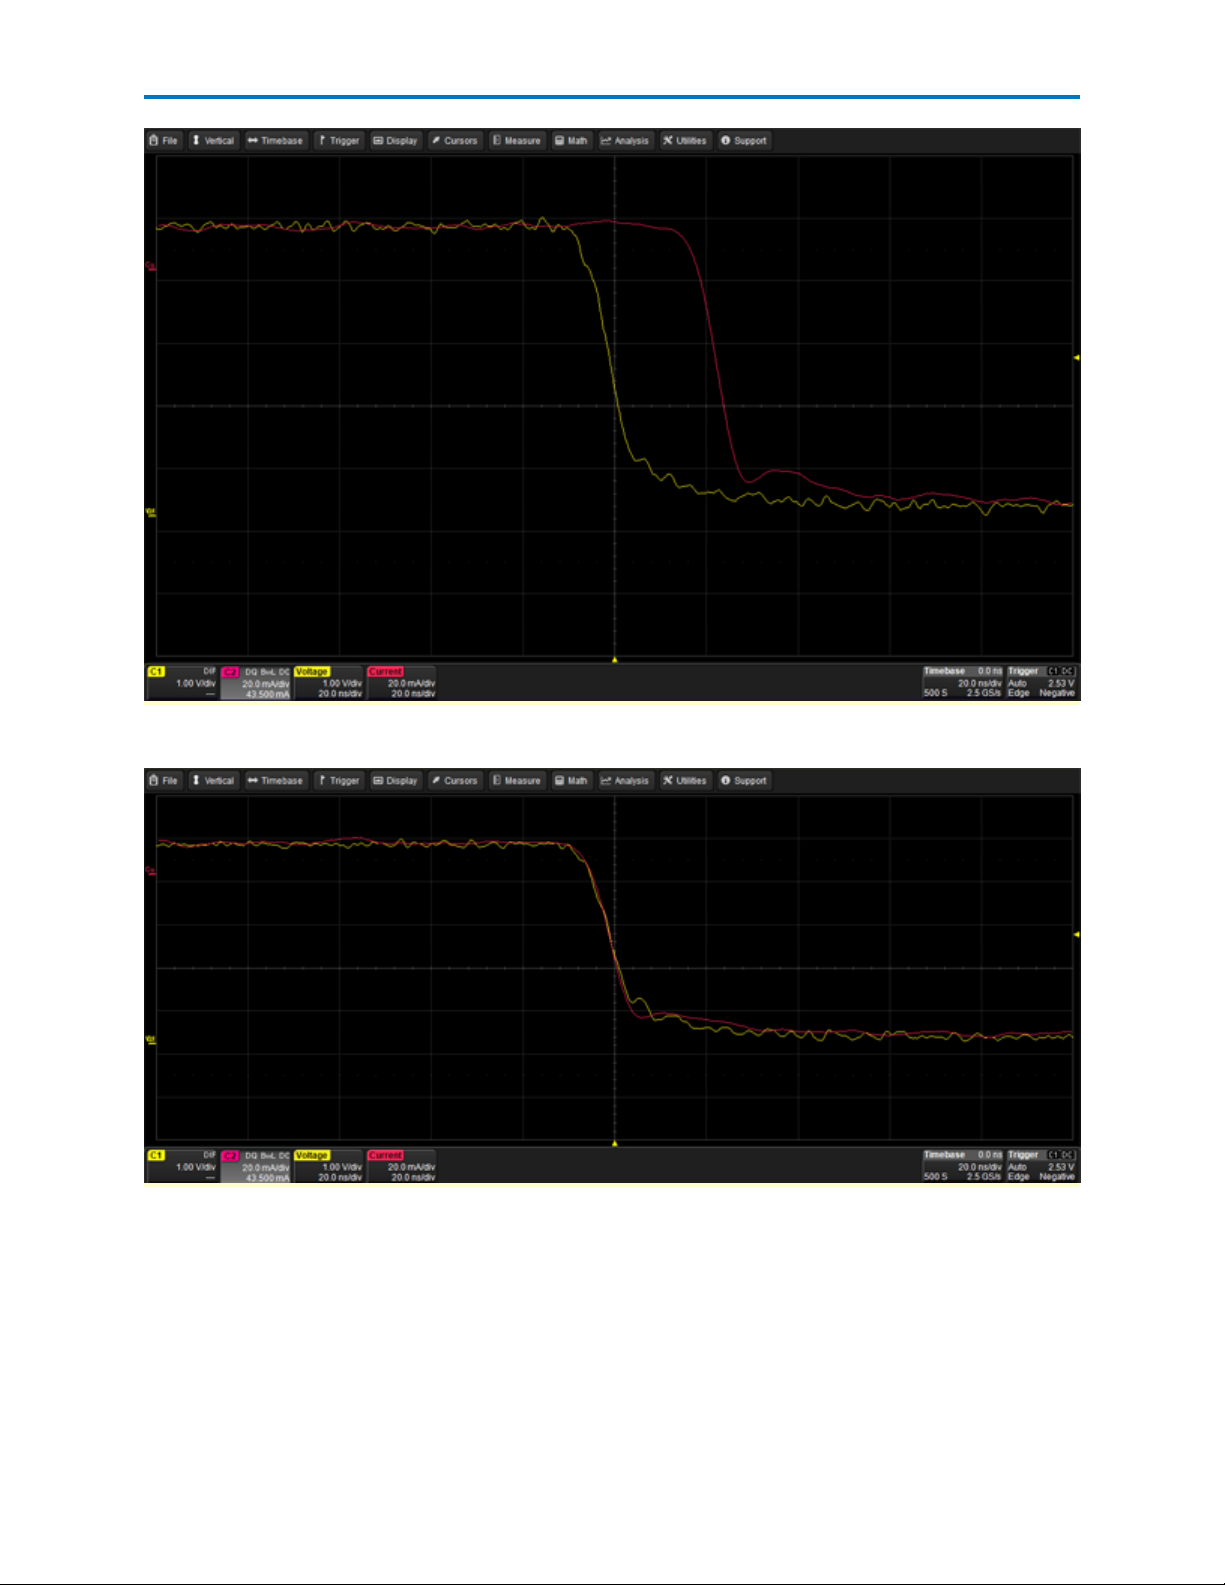
11. On the Input Settings dialog, adjust the Current Deskew value until the slope of the current probe
intersects the voltage waveform at the upper knee of the falling edge.
Tip: You can do this by selecting the Deskew field, then turning the Front Panel Horizontal knob.
12. Repeat the deskew procedure for the differential amplifier or any other probes you have connected
to other channels.
NOTE: The Deskew values you obtain using this procedure are only valid for this particular setup. It is
recommended to repeat the deskew procedure if you change probes, cables, or bandwidth/filter settings
on any channel.
921326 Rev B
7
Page 10
Power Analysis Software
Falling edge of voltage and current traces before deskew adjustment.
Falling edge of voltage and current traces after deskew adjustment.
8
921326 Rev B
Page 11
Operator's Manual
Power Device Analysis
Device Analysis Preliminary Setup
The Device Analysis tests let you make difficult measurements on devices while they operate in circuit.
The exact setup for each measurement will differ depending on what device type is to be analyzed and
where it is located in the circuit.
Test Circuit Setup
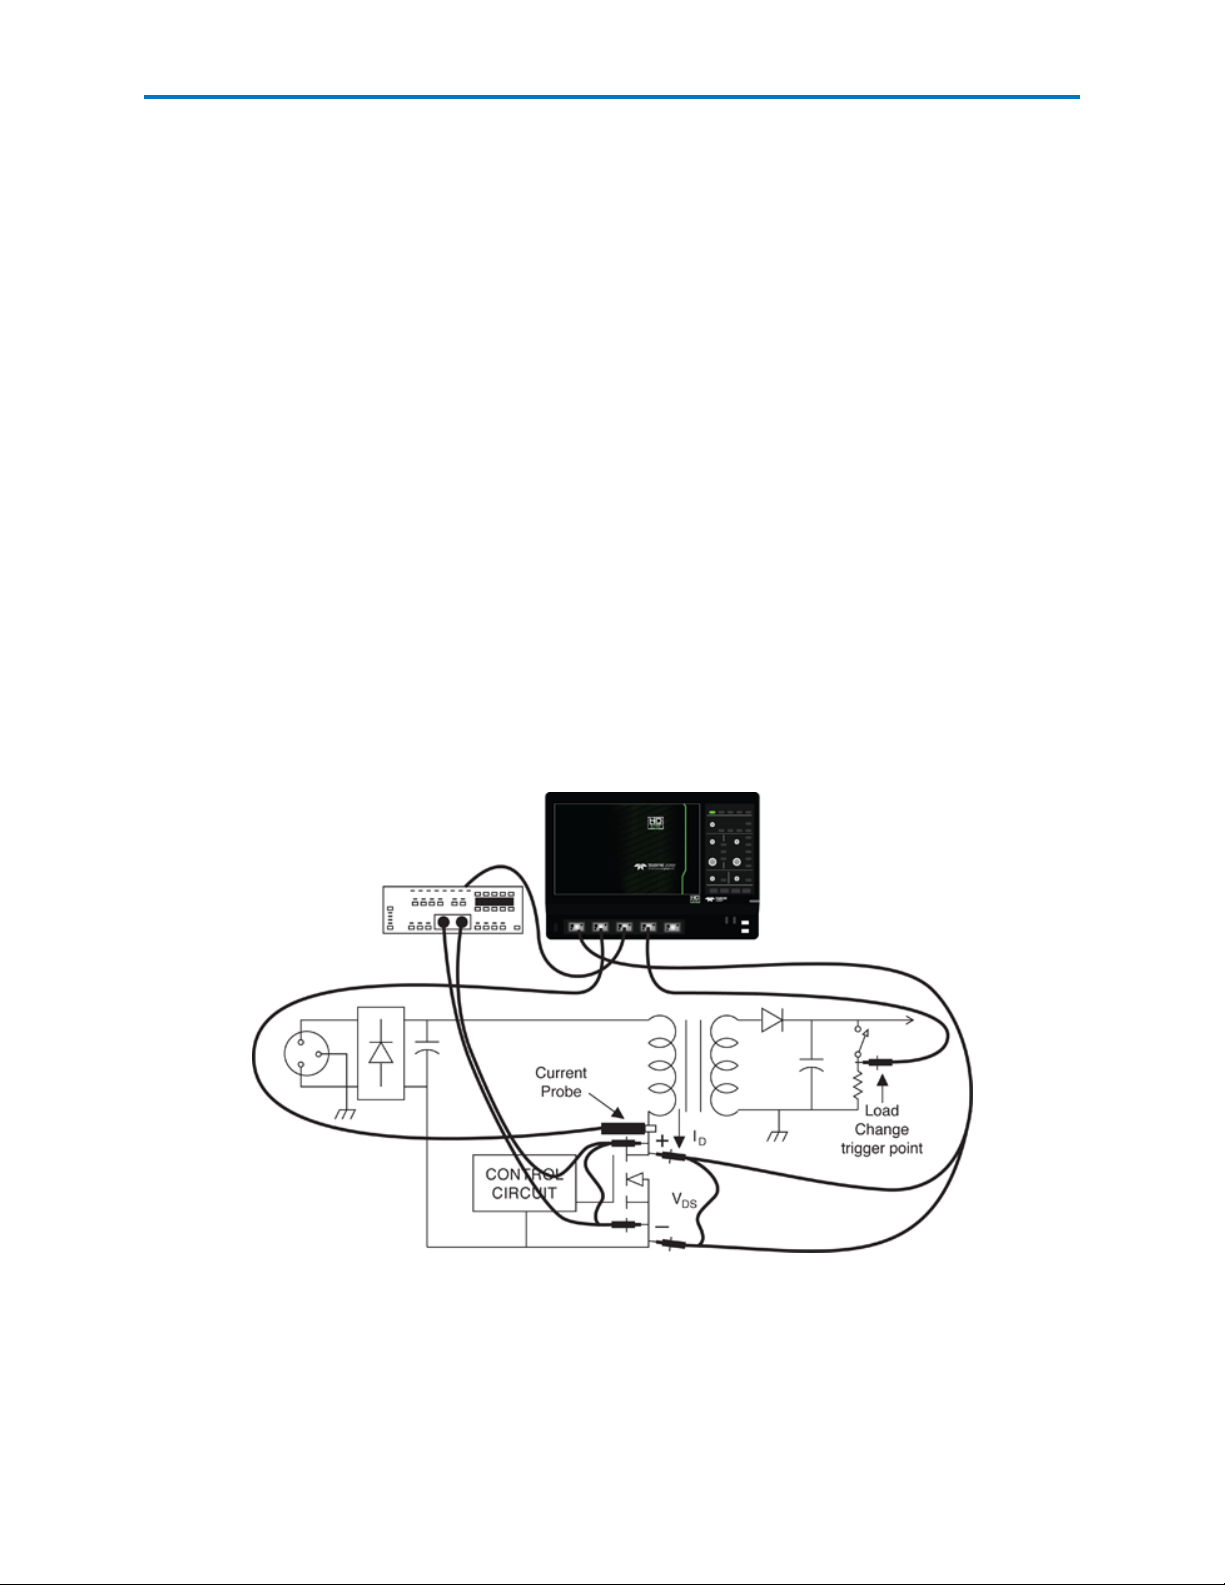
Examples in this section are based on connections to an off-line flyback power supply circuit. Measurements are made on devices such as power transistors, snubber diodes, or similar devices in other
topologies.
A typical setup used to analyze the power MOS-FET in an off-line switching power supply is:
l A differential high-voltage probe is connected to Vds on the oscilloscope’s Channel 1.
l A current probe is connected to the drain current, Id, using a current loop into Channel 2.
l A differential amplifier, with a matched differential probe pair, is used to connect to either Vds or
Vgs into Channel 3. This amplifier will need to have voltage clamping and fast over drive recovery
in order to see the saturation voltage and have high CMRR to capture the high-side gates in an offline application.
The example in the figure below uses the oscilloscope’s Channel 4 to acquire a trigger signal indicating
when the load changes from maximum to minimum. You could also use the oscilloscope’s EXT trigger
input.
921326 Rev B
9
Page 12

Power Analysis Software
Trigger Setup
Triggers for Device analysis are generally associated with a load change or on/off event in the circuit.
Obtain a stable display of at least one cycle of the voltage signal across the device.
10
921326 Rev B
Page 13

Operator's Manual
Set Up Device Analysis Input Channels
This procedure selects the voltage and current source channels and makes any necessary offset or
deskew adjustments to ensure measurement accuracy.
If you have just completed the preliminary deskew procedure, begin at Step 6.
1. From the menu bar, choose Analysis > Power Analysis to open the Power Analysis dialog.
2. Check Enable.
3. Select the Voltage Source channel where the voltage probe is attached.
4. Select the Current Source channel where the current probe is attached.
NOTE: The current input channel is automatically assigned Ampere units.
5. Touch the Input Settings tab and enter the current probe Deskew value obtained during the pre-
liminary deskew procedure.
6. Choose the current ProbeType. If you’re using a current device other than a probe (e.g., shunt res-
istor), also make these entries:
l If an amplifier, also enter the Amps/div.
l If a shunt resistor, also enter Shunt Resistor Ohms.
7. If necessary, touch Select Source and make any final adjustments on the voltage or current Channel
setup dialogs.
NOTE: If you change the probe, bandwidth or filter settings at this point, repeat the preliminary
deskew procedure and re-adjust the Deskew setting on the Input Settings dialog.
8. Choose Display > Auto Grid and set up peak-to-peak waveforms to utilize the full Analog-Digital Con-
verter (ADC). The waveform should cover the full height of the grid.
9. When you have obtained a stable display, go on to identify the switching zone.
921326 Rev B
11
Page 14

Power Analysis Software
Identify Switching Zone
This procedure instructs the software how to recognize the transition event in the device power trace
(e.g., ON to OFF) and focus the analysis on it. To do this, you’ll define the vertical area of interest (Signal
Top and Base) and the horizontal area of interest (Transition Threshold) as a measure of voltage.
1. Set up the source channels.
2. Touch the Zone Identification tab and choose a Top Base Value of either:
l TopBase-- analyze the entire waveform top (mean of all max. V) to base (mean of all min. V)
l Levels—analyze only voltages between this absolute Top Level and Base Level
3. Choose whether the transition Thresholds Are given as a Percent of signal or Absolute values, and
enter the High Threshold and Low Threshold representing the starting voltage and ending voltage
that marks the transition event in the waveform.
Overlays appear on the voltage trace marking the Conduction, On, and Off states, similar to this:
Go on to perform your desired Device Analysis tests.
Losses Test
Dynamic On-resistance Test
Safe Operating Area Test
BH Curve Test
Device dv/dt Test
12
921326 Rev B
Page 15

Device Losses Test
This test measures switching device power losses as:
l Mean power—Watts
l Peak power—instantaneous peaks in Watts
l Energy—Watts/seconds in Joules
1. Select the source channels and identify the switching zone.
2. On the Power Analysis tab choose Analysis Type Device and Test Losses.
3. Select the Measurements to calculate. Options are:
l Switching losses – losses from switch between states
l Conduction loss—loss from internal resistance
l Offstate losses—losses during the off state due to instrumentation as noted below
NOTE: Offstate loss in discontinuous power devices is typically zero, and any value is probably
due to residual DC in the current probe. Therefore, this measurement is useful for fine adjusting the current probe. Adjust the Fine DC Offset field of current probe input settings until the
measured Offstate loss value is as close to zero as possible (ideally in Nano Joules).
Operator's Manual
l Sum—total measured losses over entire switching cycle
4. Choose to display the measured Mean Power, Peak Power, or Energy (Joules).
NOTE: Selecting "Measure Over All Selected Zones" uses all of the zones selected as the region for the
measurements. It will not sum each of the zones individually to give a final result. This is especially
true with displays of Mean Power and Peak Power.
5. If you have selected to calculate Conduction Loss, choose the conduction Calculation Method.
Options are:
l Std. Probe Inputs—Select if you are using only the standard two probes.
l 2nd Voltage Probe—Select if you are using a differential amplifier (or 2nd voltage probe) to
measure saturation voltage at the event site. Select the Voltage Source channel where the
amplifier is connected.
l MOSFET Rds(on) Value—Best if your circuit is a MOSFET and you know the Resistance of the
conductor. Enter the value in Ω.
l IGBT Vce(sat) Value—Best if your circuit is an IGBT and you know the Saturation Voltage.
Enter the value in V.
Readouts for the selected measurements appear in a table below the grid area.
921326 Rev B
13
Page 16

Power Analysis Software
6. Optionally, select Statistics to display mean, minimum and maximum values on the measurements
table. This helps to observe a consistent number.
7. Optionally, select Histicons to display a miniature histogram of the statistical measurements.
14
921326 Rev B
Page 17

Operator's Manual
Device Safe Operating Area Test
This test measures that voltage, current, and power of an event all fall within safe operating levels as
defined by the device manufacturer. You can apply a mask to the power trace to help set your operating
limits or operating margin expectation for the device.
1. Select the source channels and identify the switching zone.
2. On the Power Analysis tab choose Analysis Type Device and Test Safe Operating Area.
The drain-to-source voltage waveform is displayed on the first grid, and the deskewed current waveform is displayed on the second grid.
On the XY plot in the third grid, voltage points are plotted on the x-axis, while current is plotted on
the y-axis. Therefore, the bottom left corner of the XY trace is the 0,0 point; the top of the trace is
maximum current; far right of the trace is maximum voltage. The most frequently occurring samples
are marked by a higher intensity display.
3. To apply a mask test to the power display:
l Check Mask Test.
l Enter the bounds for the mask by entering the device limits defined by the manufacturer or
your desired test limits. The value represented by each grid division appears on the channel
trace descriptor boxes.
A circular red marker appears around each data point that exceeds the mask limits.
4. Optionally, select Statistics to display mean, minimum and maximum values on the measurements
table. This helps to observe a consistent number.
5. Optionally, select Histicons to display a miniature histogram of the statistical measurements.
921326 Rev B
15
Page 18

Power Analysis Software
Device B-H Curve Test
This test displays the B-H hysteresis plot that confirms the saturation status of a magnetic device. The
voltage across a waveform, typically acquired with a differential voltage probe, is set as the voltage
source. The current through the device is captured typically with a current probe. The hysteresis plot is
presented as the integrated voltage across the magnetic device versus the current through the device.
1. Select the source channels and identify the switching zone.
2. On the Power Analysis tab choose Analysis Type Device and Test B-H Curve.
The scope display shows the voltage source before it is integrated, the current source, and the hysteresis plot.
3. Select to View Magnetic Flux Density (B) and/or View Magnetic Field Strength (H). Additional result traces appear for each selection.
4. Optionally, enter the Coil Characteristics in# Wingdings, Cross Section Areaand Magnetic Path
Length. This will set the appropriate scale vales within each of the descriptors. Cursors provide additional details of the values on specific parts of the B and H waveforms.
5. Optionally, select Statistics to display mean, minimum and maximum values on the measurements
table. This helps to observe a consistent number.
6. Optionally, select Histicons to display a miniature histogram of the statistical measurements.
16
921326 Rev B
Page 19

Operator's Manual
Device Dynamic On-resistance Test
This test measures the on-state resistance of a switching device. It utilizes the saturation voltage and current measured during the on-state zone and automatically calculates the Rds(on) value, displayed in the
parameter table. For off-line power supples, it is recommended to use a differential amplifier, such as the
DA1855A and DXC100A, in order to clamp the output voltage level the oscilloscope receives when overdriving to see saturation voltage details.
1. Select the source channels and identify the switching zone.
2. On the Power Analysis tab choose Analysis Type Device and Test Rds(on).
The deskewed voltage (V) and current (I) waveforms are displayed on the first grid.
3. Adjust voltage trace Scale (V/div) and trigger Level until the voltage waveform displayed is the
device saturation voltage.
The voltage waveform is divided by the deskewed current waveform, and the resulting Resistance
waveform trace is displayed on the third grid.
NOTE: Because the device saturation voltage waveform is off screen during the non-saturation portion of circuit, the math-generated resistance waveform should be ignored during this time.
4. Optionally, select Statistics to display mean, minimum and maximum values on the measurements
table. This helps to observe a consistent number.
5. Optionally, select Histicons to display a miniature histogram of the statistical measurements.
921326 Rev B
17
Page 20

Power Analysis Software
Device dv/dt Test
This test measures the speed of a power device’s rate of change (dv/dt) during turn-on and turn-off.
1. Select the source channels and identify the switching zone.
2. On the Power Analysis tab choose Analysis Type Device and Test dv/dt & di/dt.
3. Select di/dt by checking the di/dt box in the Waveform section.
The power device’s drain-to-source voltage (VDS) signal and the drain current are displayed on the
first grid. The derivative of the waveform’s dv/dt is displayed on the second grid. The di/dt waveform
is shown in the third grid.
4. Optionally, enter an Enhance Bit Value in the Setup section. This applies a filter to the data to reduce
noise.
5. Optionally, select Statistics to display mean, minimum and maximum values on the measurements
table. This helps to observe a consistent number.
6. Optionally, select Histicons to display a miniature histogram of the statistical measurements.
18
921326 Rev B
Page 21

Operator's Manual
Control Loop Analysis
Control Loop Analysis Preliminary Setup
Switched-mode power conversion circuits use some method of transferring energy from an unregulated
source to regulated outputs on a cycle-by-cycle basis. Output regulation is achieved by modulating the
amount of energy transferred in each cycle, the most common method being Pulse Width Modulation
(PWM). Other methods (such as frequency modulation) are also used.
Control Loop analysis provides you with tools to view the information contained in the control circuit’s
modulated signals. It does this by taking the time (duty cycle or width) information in the modulated signal that is normally displayed on the horizontal axis, along with elapsed time, and displays it on the vertical axis.
As the number of pulses per division increases, the display of their individual widths forms a “waveform”
that represents the change in pulse width (or other characteristic) as a function of elapsed time. This
“waveform” can be used to gain valuable information about the power supply’s response to various
events, such as load change (step response) or its soft-start performance.
921326 Rev B
19
Page 22

Power Analysis Software
Test Circuit Setup
Control Loop Analysis lets you capture and analyze information contained in the power conversion circuit’s modulation. The exact setup for this measurement will differ depending on the specific circuit topology and where in the circuit under test the modulation signal is to be acquired.
Examples in this section are based on a typical setup to acquire the modulated signal at the output of a
Controller IC, as shown in the image below.
For off-line power supplies, the Teledyne LeCroy DA1855A Differential Amplifier is used to acquire the
device’s gate drive signal.
Trigger Setup
Control Loop analysis measurements usually are made to find the circuit’s response to some event.
Turn-on, turn-off, line trigger, or load change can be used to trigger the modulated signal acquisition. In
the example below, a load change on the output is used as the event trigger, and the power transistor’s
gate drive signal is used as the source of modulation information.
20
921326 Rev B
Page 23

Operator's Manual
When setting up the Control Loop trigger:
l Set up a stable display of the signal that will be used as the source of the modulation information.
Ensure that a clean signal can be acquired that will allow the signal’s width (or other characteristic)
to be readily measured.
l If the modulated signal is to be acquired as the result of a one-time event such as turn-on, test the
trigger for satisfactory operation in Single trigger mode. If the event is repetitive, you can use the
oscilloscope’s Normal trigger.
l Be sure to set trigger Delay and Time/div to a value that will allow the capture of a modulated sig-
nal record sufficiently long to cover the time of interest.
Set Up Control Loop Analysis Source Channel
This procedure selects the voltage source channel and makes any necessary offset or deskew adjustments to ensure measurement accuracy.
If you have just performed the preliminary deskew procedure, begin at Step 5.
1. From the menu bar, choose Analysis > Power Analysis to open the Power Analysis dialog.
2. Check Enable.
3. Select the Voltage Source channel where the voltage probe is attached.
4. If you are using a current device to trigger on a load change event:
l Touch the Input Settings tab and enter the Deskew value obtained during the preliminary deskew
procedure.
l Choose ProbeType.
l If the current device is other than a probe (e.g., shunt resistor), also make these entries:
l If an amplifier, also enter the Amps/div.
l If a shunt resistor, also enter Shunt Resistor Ohms.
5. Adjust Fine DC Offset to zero the level.
6. If necessary, touch Select Source and make any final adjustments on the voltage or current Channel
setup dialogs.
NOTE: If you change the probe, bandwidth or filter settings at this point, repeat the preliminary
deskew procedure and re-adjust the Deskew setting on the Input Settings dialog.
Obtain a stable display of at least one cycle of the voltage signal across the device, then go on to perform
your desired tests.
Closed Loop Test
921326 Rev B
21
Page 24

Power Analysis Software
Closed Loop Test
1. Set up the source channel.
2. On the Power Analysis tab choose Analysis Type Control Loop and Test Closed Loop.
3. Choose the Operator (method) used to modulate the signal. This is the input signal parameter that
will be used to generate the Closed Loop trace.
4. Choose the Slope (Pos. or Neg.) on which to measure.
5. Touch the Level Is field and select to enter the measurement voltage Level as an Absolute Value, Percentage (of top to base), or one of the percent ranges.
6. Enter the absolute or percentage of voltage Level at which to measure the operator. Set this to a
level on the modulated signal where both the rising and falling edges are free of noise.
Tip: When measuring the modulation of the gate drive signal, it is best to avoid placing the level
around the pedestal.
OR
Touch the Find Level button to let the software set Level based on the amplitude of the acquired
gate signal.
The gate-drive signal is captured and displayed in the top trace. With the load change as the trigger
event, the controller's response is displayed as the blue trace in the second grid. Drag-and-drop the
Closed Loop descriptor box on any other grid to move the trace.
22
921326 Rev B
Page 25

Operator's Manual
Line Power Analysis
Line Power Analysis Preliminary Setup
The Line Power Analysis section of PMA2 provides you with tools to measure 50 and 60 Hz line voltage
(Vrms), line current Irms), Apparent Power (VA), Real Power (Watts), and Power Factor (cos θ). It also
enables you to evaluate harmonic currents injected into the power line. Harmonic measurements are
made in accordance with the requirements of standard EN 61000-3-2, Harmonic Current Emissions. Teledyne LeCroy encourages you to refer to the latest version of EN 61000-3-2 for full definitions and limits set
forth by the standard. The information here is abstracted for your convenience.
Test Circuit Setup
In the examples in this section, Channel 2 is used for voltage and Channel 3 is used for current, but any
channel could be used for voltage or current. In the case of 3-phase systems, multiple voltage and/or current channels can be set up before analysis is started.
The current waveform polarity must match that of the voltage waveform. Make sure your current probe
is connected so that this is the case.
Trigger Setup
Triggers for Line Power tests can be either the voltage or current waveforms.
Set Up Line Power Analysis Source Channels
This procedure selects the voltage and current source channels and makes any necessary offset or
deskew adjustments to ensure measurement accuracy.
If you have just completed the preliminary deskew procedure, begin at Step 6.
921326 Rev B
23
Page 26

Power Analysis Software
1. From the menu bar, choose Analysis > Power Analysis to open the Power Analysis dialog.
2. Check Enable.
3. Select the Voltage Source channel where the voltage probe is attached.
4. Select the Current Source channel where the current probe is attached.
NOTE: The current input channel will be assigned Ampere units even if a voltage probe or a non-Probus probe is used.
5. Touch the Input Settings tab and enter the Deskew value obtained during the preliminary deskew
procedure.
6. Choose the ProbeType. If you’re using a current device other than a probe (e.g., shunt resistor), also
make these entries:
l If an amplifier, enter the Amps/div.
l If a shunt resistor, enter Shunt Resistor Ohms.
7. Adjust Fine DC Offset to zero the level.
8. If necessary, touch Select Source and make any final adjustments on the voltage or current Channel
setup dialogs.
NOTE: If you change the probe, bandwidth or filter settings at this point, repeat the preliminary
deskew procedure and re-adjust the Deskew setting on the Input Settings dialog.
Obtain a stable display of at least one cycle of the voltage signal across the device, then go
on to perform your desired tests.
Line Power Test
Line Harmonics Test
24
921326 Rev B
Page 27

Operator's Manual
Line Power Test
This test analyzes the line current, voltage, power, and power factor of the device under test.
1. Set up the source channels.
2. On the Power Analysis tab choose Line Power Analysis, and Power Test
3. Optionally, select to display Reactive Power, Phase Angle and/or Crest Factor measurements.
The display shows the line voltage and current waveform, as well as the power and energy waveforms.
Parameters displayed are rms voltage, rms current, real power, apparent power (apwr) power factor (pf)
and, if selected, reactive power (reactpwr), phase angle (phase), and crest factor (Icrest).
921326 Rev B
25
Page 28

Power Analysis Software
Line Harmonics Test
This test checks the line harmonics to see if they meet EN 6000-3-2 pre-compliance levels. In addition, for
class C, tests differentiate devices above and below 25 W; for class D, a Current per Watt pre-compliance
test is provided.
1. Set up the source channels.
2. On the Power Analysis dialog choose Line Power Analysis and Harmonics Test.
3. Touch Class and select the equipment’s EN 61000-3-2 classification from the pop-up menu:
l Class A, Balanced three-phase equipment, household appliances (excluding those in class D),
non-portable tools, audio equipment, dimmers for incandescent lamps, and all other equipment except that stated in one of the following classes
l Class B, Portable tools, non-professional arc welding equipment
l Class C, Lighting equipment (except dimmers)
l Class D, Personal computers and computer monitors, radio or TV receivers (75W-600W)
4. If you selected Class C, open the Limits dialog and choose the correct Active Input Power and Equipment Type.
5. On the Power Analysis dialog, touch Frequency and select the line frequency at which the equipment
is operating. You can optionally select to Use Measured Frequency to enter the value as measured
by the current probe.
6. Touch Units and select Amps or dBuA (decibels referred to one microAmp).
7. Optionally, select Total Harmonic Distortion to see the contribution of each frequency to the total
distortion.
26
921326 Rev B
Page 29

Operator's Manual
TIP: You may need to open the Line Harmonics or Current per Watt dialogs to adjust the zoom of the
trace.
To see the harmonics readout in the measurements table:
l Stop acquisition by pressing the front panel Stop trigger button.
l Choose Cursor > Horizontal Abs from the menu bar.
l Turn the front panel Cursor knob or touch-and-drag the white cursor line to move it along the
line harmonics trace.
921326 Rev B
27
Page 30

Power Analysis Software
Performance Analysis
This section of the Power Analyzer option provides tools to evaluate the performance of your power supply.
l The Efficiency Test lets you measure input power, output power, and overall efficiency.
l The Ripple Test measures ripple—including pk-pk, maximm, and minimum ripple—and generates
a spectral plot of the frequency content of the power supply's output.
Because of the varying ranges of voltages and currents of different power supply topologies, including
requirements to maintain isolation, please use the appropriate probes when performing these tests. Be
sure to maintain the proper probe setups and make fine adjustments to DC offsets and DeGuassing
using the Input Settings tab controls.
Performance Efficiency Test
This test checks the efficiency of the power conversion by computing power on output divided by power
at input.
Efficiency Test Setup
For input power, attach the voltage and current probes to the corresponding input sources shown
below. Ouput Power is measured using the voltage and current probes as shown below. Confirm the
Power Analyzer software input and output probe sources are matched to this setup.
28
921326 Rev B
Page 31

Operator's Manual
Efficiency Test Procedure
1. From the menu bar, choose Analysis > Power Analysis.
2. Check Enable.
3. On the Power Analysis dialog choose Performance Analysis and Efficiency Test.
4. Choose the Input Voltage, Input Current, Output Voltage and Output Current channels.
5. Optionally, select Statistics to display mean, minimum and maximum values on the measurements
table. This helps to observe a consistent number.
6. Optionally, select Histicons to display a miniature histogram of the statistical measurements.
921326 Rev B
29
Page 32

Power Analysis Software
Performance Ripple Test
This test supports the measurement and anlysis of a power supply's output characteristics. Measurements include the peak to peak ripple, the maximum and minumum values of ripple, and the spectral
content of ripple are provided.
Ripple Test Setup
Sources for this section can be voltage or current. Confirm the correct input source has been selected in
the main Power Analyzer menu. Connect the probe to the output of the power supply.
Ripple Test Procedure
1. From the menu bar, choose Analysis > Power Analysis to open the Power Analysis dialog.
2. Check Enable.
3. Choose Performance Analysis and Efficiency Test.
4. Select the input Voltage source channel.
30
921326 Rev B
Page 33

5. On the Input Settings dialog, touch Setup Source and choose AC Coupling.
Operator's Manual
921326 Rev B
31
Page 34

 Loading...