

Page 1
PROTOCOL SOLUTIONS GROUP
3385 SCOTT BLVD
SANTA CLARA, CA 95054
PETracer Summit™ and Summit T2-16
™
PCI Express Multi-Lane Protocol Analyzer
User Manual
For Software Version 6.7x
June 2013
Page 2

Summit User Manual
Document Disclaimer
The information in this document has been carefully checked and is believed to be
reliable. However, no responsibility can be assumed for inaccuracies that may not have
been detected.
Teledyne LeCroy reserves the right to revise the information in this document without
notice or penalty.
Trademarks and Servicemarks
Teledyne LeCroy, CATC Trace, PCI Express, PETracer Edge, PETracer EML, PETracer
ML, PETracer, PETrainer EML, PETrainer ML, PETracer Summit, Summit T2-16,
Summit Z2-16, Universal Protocol Analyzer System, UPAS, and BusEngine are
trademarks of Teledyne LeCroy.
Microsoft and Windows are registered trademarks of Microsoft Inc.
All other trademarks are property of their respective companies.
Copyright
© 2012 Teledyne LeCroy, Inc. All Rights Reserved.
This document may be printed and reproduced without additional permission, but all
copies should contain this copyright notice.
WEEE Program
Teledyne LeCroy
Page 3

Summit User Manual
TABLE OF CONTENTS
Section 1. General. . . . . . . . . . . . . . . . . . . . . 1
Chapter 1 Overview . . . . . . . . . . . . . . . . . . . . . . . . . . . . . 3
1.1 PETracer Analyzer Hardware and Software . . . . . . . . . . . . . . . . . . . . . . . . 3
1.2 CATC Trace Software . . . . . . . . . . . . . . . . . . . . . . . . . . . . . . . . . . . . . . . . . 4
1.3 Summit T2-16 Analyzer . . . . . . . . . . . . . . . . . . . . . . . . . . . . . . . . . . . . . . . . 5
1.4 PETracer Gen2 Summit Analyzer . . . . . . . . . . . . . . . . . . . . . . . . . . . . . . . . 7
1.5 Other Documents . . . . . . . . . . . . . . . . . . . . . . . . . . . . . . . . . . . . . . . . . . . . 8
Chapter 2 Hardware Description . . . . . . . . . . . . . . . . . . . 9
2.1 System Components . . . . . . . . . . . . . . . . . . . . . . . . . . . . . . . . . . . . . . . . . . 9
2.2 Host Machine Requirements . . . . . . . . . . . . . . . . . . . . . . . . . . . . . . . . . . . . 9
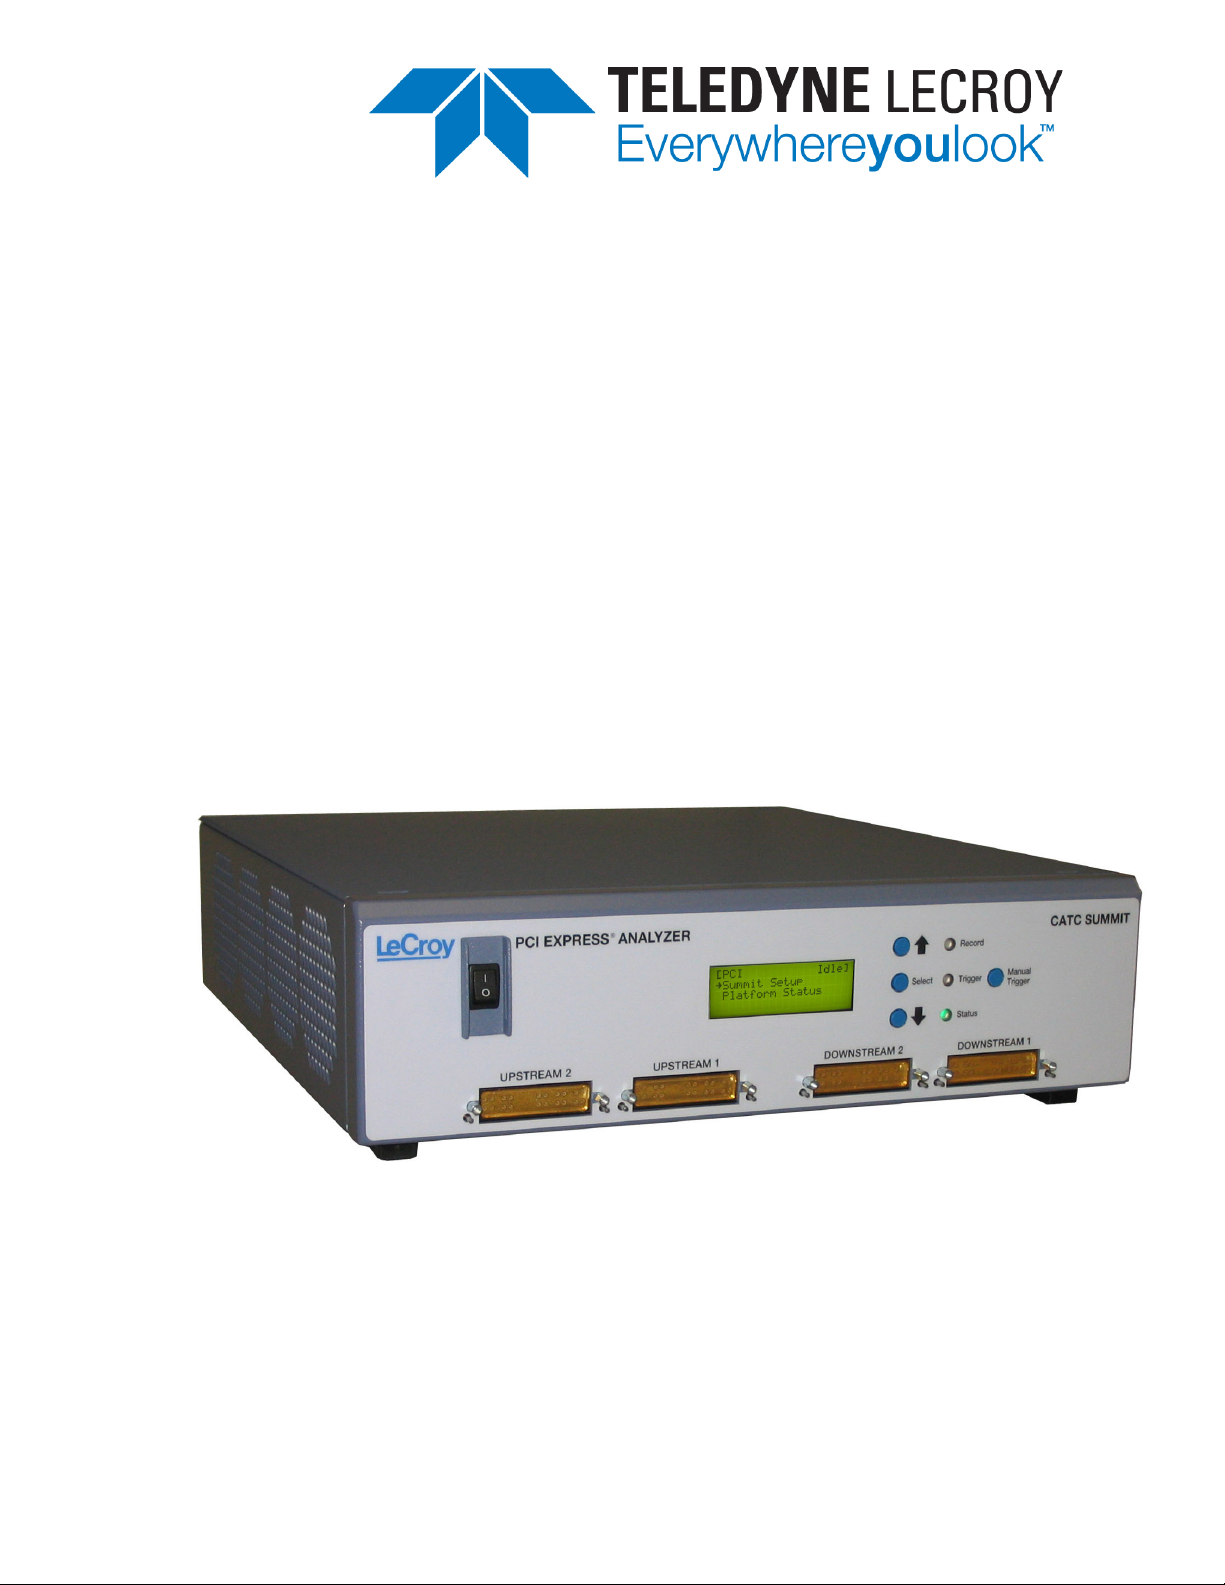
2.3 Summit T2-16 Front Panel Description . . . . . . . . . . . . . . . . . . . . . . . . . . . 10
LCD Menus . . . . . . . . . . . . . . . . . . . . . . . . . . . . . . . . . . . . . . . . . . . . . . 11
2.4 PETracer Summit Front Panel Description . . . . . . . . . . . . . . . . . . . . . . . . 13
LCD Menus . . . . . . . . . . . . . . . . . . . . . . . . . . . . . . . . . . . . . . . . . . . . . . 14
2.5 Summit T2-16 Rear Panel Description . . . . . . . . . . . . . . . . . . . . . . . . . . . 16
2.6 PETracer Summit Rear Panel Description . . . . . . . . . . . . . . . . . . . . . . . . 18
2.7 External Interface Breakout Board . . . . . . . . . . . . . . . . . . . . . . . . . . . . . . 20
Pin-Outs for the Data In/Out Connector . . . . . . . . . . . . . . . . . . . . . . . . 21
Prototype Rework Area . . . . . . . . . . . . . . . . . . . . . . . . . . . . . . . . . . . . . 21
Breakout Board Input and Output Signals. . . . . . . . . . . . . . . . . . . . . . . 22
Chapter 3 Installation and Setup . . . . . . . . . . . . . . . . . . 23
3.1 Installing the PETracer Software . . . . . . . . . . . . . . . . . . . . . . . . . . . . . . . . 23
3.2 Setting Up the Summit T2-16 Analyzer using an Ethernet Connection. . . 25
Connecting to a Summit T2-16 Analyzer in the Local Network. . . . . . . 25
3.3 Setting Up the Summit T2-16 Analyzer using a USB Connection . . . . . . . 28
3.4 Setting Up the PETracer Summit Analyzer . . . . . . . . . . . . . . . . . . . . . . . . 29
Connecting to a PETracer Summit Analyzer in the Local Network. . . . 29
3.5 Interposers and Probes . . . . . . . . . . . . . . . . . . . . . . . . . . . . . . . . . . . . . . . 32
3.6 Using Probes . . . . . . . . . . . . . . . . . . . . . . . . . . . . . . . . . . . . . . . . . . . . . . . 33
Example: Connecting the Summit T2-16 Analyzer to the Device Under
Test Using a Gen2 MidBus Probe . . . . . . . . . . . . . . . . . . . . . . . . . . . . . 33
Example: Connecting the Summit T2-16 Analyzer to the Device Under
Test Using a Gen2 Multi-lead Probe for x1 and x4 . . . . . . . . . . . . . . . . 36
Example: Connecting the Summit T2-16 Analyzer to the Device Under
Test Using a Gen2 Multi-lead Probe for x8 and x16 . . . . . . . . . . . . . . . 38
3.7 Using Interposers . . . . . . . . . . . . . . . . . . . . . . . . . . . . . . . . . . . . . . . . . . . 40
Example: Connecting the Summit T2-16 Analyzer to the Device Under
Test Using a Gen2 Passive Interposer . . . . . . . . . . . . . . . . . . . . . . . . . 40
Example: Connecting the Summit T2-16 Analyzer to the Device Under
Test Using a Gen2 Active Interposer. . . . . . . . . . . . . . . . . . . . . . . . . . . 42
Teledyne LeCroy iii
Page 4

Summit User Manual
Section 2. PETracer Analyzer Software . . 45
Chapter 4 Software Overview . . . . . . . . . . . . . . . . . . . . 47
4.1 The PETracer Software . . . . . . . . . . . . . . . . . . . . . . . . . . . . . . . . . . . . . . . 47
4.2 Application Layout . . . . . . . . . . . . . . . . . . . . . . . . . . . . . . . . . . . . . . . . . . . 48
4.3 Using the Toolbar . . . . . . . . . . . . . . . . . . . . . . . . . . . . . . . . . . . . . . . . . . . 48
Multi-Segment Toolbar . . . . . . . . . . . . . . . . . . . . . . . . . . . . . . . . . . . . . 51
Toolbar Hide Buttons. . . . . . . . . . . . . . . . . . . . . . . . . . . . . . . . . . . . . . . 52
4.4 Using the Menus . . . . . . . . . . . . . . . . . . . . . . . . . . . . . . . . . . . . . . . . . . . . 54
4.5 Tool Tips . . . . . . . . . . . . . . . . . . . . . . . . . . . . . . . . . . . . . . . . . . . . . . . . . . 60
4.6 Keyboard Shortcuts . . . . . . . . . . . . . . . . . . . . . . . . . . . . . . . . . . . . . . . . . . 60
4.7 Status Bar . . . . . . . . . . . . . . . . . . . . . . . . . . . . . . . . . . . . . . . . . . . . . . . . . 61
4.8 Making a PCI Express Recording . . . . . . . . . . . . . . . . . . . . . . . . . . . . . . . 63
4.9 Recording Multi-Segmented CATC Traces . . . . . . . . . . . . . . . . . . . . . . . . 65
How to Create a Multisegment Recording . . . . . . . . . . . . . . . . . . . . . . 65
4.10 PETracer Files. . . . . . . . . . . . . . . . . . . . . . . . . . . . . . . . . . . . . . . . . . . . . 67
CATC Trace Files . . . . . . . . . . . . . . . . . . . . . . . . . . . . . . . . . . . . . . . . . 67
Recording Options Files . . . . . . . . . . . . . . . . . . . . . . . . . . . . . . . . . . . . 67
Display Options Files . . . . . . . . . . . . . . . . . . . . . . . . . . . . . . . . . . . . . . 67
4.11 Opening CATC Trace Files . . . . . . . . . . . . . . . . . . . . . . . . . . . . . . . . . . . 68
4.12 Saving CATC Trace Files . . . . . . . . . . . . . . . . . . . . . . . . . . . . . . . . . . . . 69
Using the Save As Function . . . . . . . . . . . . . . . . . . . . . . . . . . . . . . . . . 69
Saving a Portion of a CATC Trace . . . . . . . . . . . . . . . . . . . . . . . . . . . . 69
4.13 Exporting a CATC Trace File . . . . . . . . . . . . . . . . . . . . . . . . . . . . . . . . . . 70
4.14 Printing Data Files . . . . . . . . . . . . . . . . . . . . . . . . . . . . . . . . . . . . . . . . . . 71
4.15 Analyzer Chat Window . . . . . . . . . . . . . . . . . . . . . . . . . . . . . . . . . . . . . . 72
Chapter 5 Reading CATC Traces . . . . . . . . . . . . . . . . . . 73
5.1 Viewing PCI Express CATC Traces. . . . . . . . . . . . . . . . . . . . . . . . . . . . . . 73
5.2 Expand and Collapse Data Fields . . . . . . . . . . . . . . . . . . . . . . . . . . . . . . . 73
5.3 Resizing Cells . . . . . . . . . . . . . . . . . . . . . . . . . . . . . . . . . . . . . . . . . . . . . . 73
5.4 Pop-up Menus . . . . . . . . . . . . . . . . . . . . . . . . . . . . . . . . . . . . . . . . . . . . . . 74
5.5 View Data Block . . . . . . . . . . . . . . . . . . . . . . . . . . . . . . . . . . . . . . . . . . . . 74
5.6 Show Raw 10b Codes . . . . . . . . . . . . . . . . . . . . . . . . . . . . . . . . . . . . . . . . 75
5.7 Show Header Fields . . . . . . . . . . . . . . . . . . . . . . . . . . . . . . . . . . . . . . . . . 76
5.8 Packet Cell Popup Menus . . . . . . . . . . . . . . . . . . . . . . . . . . . . . . . . . . . . . 77
Packet Header R-> Cell Popup Menu. . . . . . . . . . . . . . . . . . . . . . . . . . 77
Packet Header G1 Cell Popup Menu . . . . . . . . . . . . . . . . . . . . . . . . . . 78
5.9 Set Marker . . . . . . . . . . . . . . . . . . . . . . . . . . . . . . . . . . . . . . . . . . . . . . . . . 79
5.10 Edit or Clear Marker . . . . . . . . . . . . . . . . . . . . . . . . . . . . . . . . . . . . . . . . 80
5.11 Decoding Traffic. . . . . . . . . . . . . . . . . . . . . . . . . . . . . . . . . . . . . . . . . . . . 81
Packet . . . . . . . . . . . . . . . . . . . . . . . . . . . . . . . . . . . . . . . . . . . . . . . . . . 81
Link . . . . . . . . . . . . . . . . . . . . . . . . . . . . . . . . . . . . . . . . . . . . . . . . . . . . 81
Split . . . . . . . . . . . . . . . . . . . . . . . . . . . . . . . . . . . . . . . . . . . . . . . . . . . . 81
Chapter 6 Searching CATC Traces . . . . . . . . . . . . . . . . 83
6.1 CATC Trace Search Overview. . . . . . . . . . . . . . . . . . . . . . . . . . . . . . . . . . 83
6.2 Go to Trigger . . . . . . . . . . . . . . . . . . . . . . . . . . . . . . . . . . . . . . . . . . . . . . . 83
6.3 Go to Packet . . . . . . . . . . . . . . . . . . . . . . . . . . . . . . . . . . . . . . . . . . . . . . . 83
6.4 Go to Time. . . . . . . . . . . . . . . . . . . . . . . . . . . . . . . . . . . . . . . . . . . . . . . . . 84
iv Teledyne LeCroy
Page 5

Summit User Manual
6.5 Go to Marker . . . . . . . . . . . . . . . . . . . . . . . . . . . . . . . . . . . . . . . . . . . . . . . 84
2. Markers . . . . . . . . . . . . . . . . . . . . . . . . . . . . . . . . . . . . . . . . . . . . . . . . . . . . 85
Markers Overview . . . . . . . . . . . . . . . . . . . . . . . . . . . . . . . . . . . . . . . . . 85
Functionality of Markers . . . . . . . . . . . . . . . . . . . . . . . . . . . . . . . . . . . . 86
Attaching Markers . . . . . . . . . . . . . . . . . . . . . . . . . . . . . . . . . . . . . . . . . 88
Adding an Attachment. . . . . . . . . . . . . . . . . . . . . . . . . . . . . . . . . . . . . . 88
5. Recording an Audio File . . . . . . . . . . . . . . . . . . . . . . . . . . . . . . . . . . . . . . . 89
Video Files supported . . . . . . . . . . . . . . . . . . . . . . . . . . . . . . . . . . . . . . 89
Attachment Types and Visualization . . . . . . . . . . . . . . . . . . . . . . . . . . . 90
Embedded Attachments to a Marker. . . . . . . . . . . . . . . . . . . . . . . . . . . 90
Viewing Attachments of a Marker . . . . . . . . . . . . . . . . . . . . . . . . . . . . . 91
Text . . . . . . . . . . . . . . . . . . . . . . . . . . . . . . . . . . . . . . . . . . . . . . . . . . . . 91
Audio . . . . . . . . . . . . . . . . . . . . . . . . . . . . . . . . . . . . . . . . . . . . . . . . . . . 93
Video . . . . . . . . . . . . . . . . . . . . . . . . . . . . . . . . . . . . . . . . . . . . . . . . . . . 93
File Attachment . . . . . . . . . . . . . . . . . . . . . . . . . . . . . . . . . . . . . . . . . . . 93
URL Link . . . . . . . . . . . . . . . . . . . . . . . . . . . . . . . . . . . . . . . . . . . . . . . . 94
YouTube Video . . . . . . . . . . . . . . . . . . . . . . . . . . . . . . . . . . . . . . . . . . . 94
Images . . . . . . . . . . . . . . . . . . . . . . . . . . . . . . . . . . . . . . . . . . . . . . . . . 95
Other Attachments . . . . . . . . . . . . . . . . . . . . . . . . . . . . . . . . . . . . . . . . 95
Edit Marker . . . . . . . . . . . . . . . . . . . . . . . . . . . . . . . . . . . . . . . . . . . . . . 95
All Markers Window . . . . . . . . . . . . . . . . . . . . . . . . . . . . . . . . . . . . . . . 96
6.6 CATC Walk Playlist . . . . . . . . . . . . . . . . . . . . . . . . . . . . . . . . . . . . . . . . . . 98
Playlist Functionality . . . . . . . . . . . . . . . . . . . . . . . . . . . . . . . . . . . . . . . 99
Playback Window . . . . . . . . . . . . . . . . . . . . . . . . . . . . . . . . . . . . . . . . 101
Playlist Playback Controls. . . . . . . . . . . . . . . . . . . . . . . . . . . . . . . . . . 102
6.7 Go To Menu . . . . . . . . . . . . . . . . . . . . . . . . . . . . . . . . . . . . . . . . . . . . . . . 103
6.8 Search Direction . . . . . . . . . . . . . . . . . . . . . . . . . . . . . . . . . . . . . . . . . . . 104
6.9 Find . . . . . . . . . . . . . . . . . . . . . . . . . . . . . . . . . . . . . . . . . . . . . . . . . . . . . 105
Event Groups . . . . . . . . . . . . . . . . . . . . . . . . . . . . . . . . . . . . . . . . . . . 107
6.10 Search for the Next Packet Type. . . . . . . . . . . . . . . . . . . . . . . . . . . . . . 107
Chapter 7 Display Options . . . . . . . . . . . . . . . . . . . . . . 109
7.1 Setting Display Options . . . . . . . . . . . . . . . . . . . . . . . . . . . . . . . . . . . . . . 109
7.2 Specifying General Display Options . . . . . . . . . . . . . . . . . . . . . . . . . . . . 110
Analysis Tools Checkboxes. . . . . . . . . . . . . . . . . . . . . . . . . . . . . . . . . 110
Fonts . . . . . . . . . . . . . . . . . . . . . . . . . . . . . . . . . . . . . . . . . . . . . . . . . . 110
Configuration Name . . . . . . . . . . . . . . . . . . . . . . . . . . . . . . . . . . . . . . 111
7.3 Color, Format, and Hiding Options . . . . . . . . . . . . . . . . . . . . . . . . . . . . . 111
Setting Field Colors. . . . . . . . . . . . . . . . . . . . . . . . . . . . . . . . . . . . . . . 111
Changing Field Formats . . . . . . . . . . . . . . . . . . . . . . . . . . . . . . . . . . . 114
7.4 Load a Previously Saved Display Options File . . . . . . . . . . . . . . . . . . . . 118
7.5 Saving Display Options . . . . . . . . . . . . . . . . . . . . . . . . . . . . . . . . . . . . . . 118
Chapter 8 Recording Options . . . . . . . . . . . . . . . . . . . .119
8.1 Setting Recording Options . . . . . . . . . . . . . . . . . . . . . . . . . . . . . . . . . . . 119
8.2 General Tab . . . . . . . . . . . . . . . . . . . . . . . . . . . . . . . . . . . . . . . . . . . . . . . 119
Recording Type. . . . . . . . . . . . . . . . . . . . . . . . . . . . . . . . . . . . . . . . . . 122
Buffer Size. . . . . . . . . . . . . . . . . . . . . . . . . . . . . . . . . . . . . . . . . . . . . . 122
Target Analyzer . . . . . . . . . . . . . . . . . . . . . . . . . . . . . . . . . . . . . . . . . . 123
Trigger Position . . . . . . . . . . . . . . . . . . . . . . . . . . . . . . . . . . . . . . . . . . 123
Trigger On . . . . . . . . . . . . . . . . . . . . . . . . . . . . . . . . . . . . . . . . . . . . . . 123
Teledyne LeCroy v
Page 6

Summit User Manual
Trace Filename and Path . . . . . . . . . . . . . . . . . . . . . . . . . . . . . . . . . . 124
Options Name . . . . . . . . . . . . . . . . . . . . . . . . . . . . . . . . . . . . . . . . . . . 124
Save As MultiSegment Trace . . . . . . . . . . . . . . . . . . . . . . . . . . . . . . . 125
Viewing Multisegmented Files. . . . . . . . . . . . . . . . . . . . . . . . . . . . . . . 125
Misc. . . . . . . . . . . . . . . . . . . . . . . . . . . . . . . . . . . . . . . . . . . . . . . . . . . 126
Link for Summit and Summit T2-16. . . . . . . . . . . . . . . . . . . . . . . . . . . 127
Saving and Loading Previously Saved Recording Options . . . . . . . . . 130
Setting Default Recording Options . . . . . . . . . . . . . . . . . . . . . . . . . . . 130
8.3 Recording Rules Overview . . . . . . . . . . . . . . . . . . . . . . . . . . . . . . . . . . . 131
Global State vs. Sequences . . . . . . . . . . . . . . . . . . . . . . . . . . . . . . . . 132
8.4 Recording Rules Buttons. . . . . . . . . . . . . . . . . . . . . . . . . . . . . . . . . . . . . 133
8.5 Creating Recording Rules . . . . . . . . . . . . . . . . . . . . . . . . . . . . . . . . . . . . 133
8.6 Recording Rules Logic: How Contradictory Rules are Resolved . . . . . . 136
Recording Rules Examples. . . . . . . . . . . . . . . . . . . . . . . . . . . . . . . . . 136
8.7 Properties Dialog Boxes . . . . . . . . . . . . . . . . . . . . . . . . . . . . . . . . . . . . . 143
8.8 Event Properties Dialog. . . . . . . . . . . . . . . . . . . . . . . . . . . . . . . . . . . . . . 144
Accessing the Properties Dialog . . . . . . . . . . . . . . . . . . . . . . . . . . . . . 144
Dialog Settings and Features . . . . . . . . . . . . . . . . . . . . . . . . . . . . . . . 144
Error Properties Dialog . . . . . . . . . . . . . . . . . . . . . . . . . . . . . . . . . . . . 145
Actions Properties Dialog . . . . . . . . . . . . . . . . . . . . . . . . . . . . . . . . . . 145
TLP Header Properties Dialog . . . . . . . . . . . . . . . . . . . . . . . . . . . . . . 146
TLP Prefix Properties Dialog. . . . . . . . . . . . . . . . . . . . . . . . . . . . . . . . 146
Payload Properties Dialog. . . . . . . . . . . . . . . . . . . . . . . . . . . . . . . . . . 147
DLLP Packet Properties Dialog. . . . . . . . . . . . . . . . . . . . . . . . . . . . . . 147
Ordered Set Properties Dialog . . . . . . . . . . . . . . . . . . . . . . . . . . . . . . 148
8.9 Counting Events . . . . . . . . . . . . . . . . . . . . . . . . . . . . . . . . . . . . . . . . . . . 148
8.10 Creating a Payload Match . . . . . . . . . . . . . . . . . . . . . . . . . . . . . . . . . . . 150
8.11 Trigger . . . . . . . . . . . . . . . . . . . . . . . . . . . . . . . . . . . . . . . . . . . . . . . . . . 152
8.12 Filter In and Filter Out . . . . . . . . . . . . . . . . . . . . . . . . . . . . . . . . . . . . . . 153
Chapter 9 BitTracer Recording . . . . . . . . . . . . . . . . . . 155
9.1 Overview . . . . . . . . . . . . . . . . . . . . . . . . . . . . . . . . . . . . . . . . . . . . . . . . . 155
PETracer Summit and Summit T2-16 Only. . . . . . . . . . . . . . . . . . . . . 155
9.2 Enabling BitTracer Recording . . . . . . . . . . . . . . . . . . . . . . . . . . . . . . . . . 155
9.3 Trigger Modes . . . . . . . . . . . . . . . . . . . . . . . . . . . . . . . . . . . . . . . . . . . . . 156
9.4 Views Available for Captured Data . . . . . . . . . . . . . . . . . . . . . . . . . . . . . 157
9.5 De-Skewing Data. . . . . . . . . . . . . . . . . . . . . . . . . . . . . . . . . . . . . . . . . . . 158
9.6 Data Display Formats . . . . . . . . . . . . . . . . . . . . . . . . . . . . . . . . . . . . . . . 158
9.7 Color-Coding of BitTracer Contents . . . . . . . . . . . . . . . . . . . . . . . . . . . . 159
9.8 Report and Analysis Windows. . . . . . . . . . . . . . . . . . . . . . . . . . . . . . . . . 159
9.9 Timing Measurements Bar . . . . . . . . . . . . . . . . . . . . . . . . . . . . . . . . . . . 160
Markers Bar. . . . . . . . . . . . . . . . . . . . . . . . . . . . . . . . . . . . . . . . . . . . . 161
9.10 Errors Bar . . . . . . . . . . . . . . . . . . . . . . . . . . . . . . . . . . . . . . . . . . . . . . . 162
9.11 Symbols Bar . . . . . . . . . . . . . . . . . . . . . . . . . . . . . . . . . . . . . . . . . . . . . 163
9.12 Events Bar . . . . . . . . . . . . . . . . . . . . . . . . . . . . . . . . . . . . . . . . . . . . . . . 163
9.13 Packets Bar . . . . . . . . . . . . . . . . . . . . . . . . . . . . . . . . . . . . . . . . . . . . . . 164
9.14 Decoding Bar. . . . . . . . . . . . . . . . . . . . . . . . . . . . . . . . . . . . . . . . . . . . . 165
9.15 Search . . . . . . . . . . . . . . . . . . . . . . . . . . . . . . . . . . . . . . . . . . . . . . . . . . 166
9.16 Link Configuration . . . . . . . . . . . . . . . . . . . . . . . . . . . . . . . . . . . . . . . . . 167
9.17 Export of BitTracer Capture to CATC Trace Format . . . . . . . . . . . . . . . 169
Exports Involving Multiple Logical Links on One Physical Link. . . . . . 169
vi Teledyne LeCroy
Page 7

Summit User Manual
9.18 Compressing and Expanding the Data View . . . . . . . . . . . . . . . . . . . . . 169
9.19 Opening and Saving BitTracer Captures . . . . . . . . . . . . . . . . . . . . . . . . 169
Chapter 10 Reports and Tools . . . . . . . . . . . . . . . . . . . . 171
10.1 File Information . . . . . . . . . . . . . . . . . . . . . . . . . . . . . . . . . . . . . . . . . . . 172
10.2 Error Summary . . . . . . . . . . . . . . . . . . . . . . . . . . . . . . . . . . . . . . . . . . . 173
10.3 Traffic Summary . . . . . . . . . . . . . . . . . . . . . . . . . . . . . . . . . . . . . . . . . . 174
Using the Traffic Summary Window to Search the CATC Trace . . . . . 174
Traffic Summary Buttons. . . . . . . . . . . . . . . . . . . . . . . . . . . . . . . . . . . 175
10.4 Bus Utilization . . . . . . . . . . . . . . . . . . . . . . . . . . . . . . . . . . . . . . . . . . . . 176
Bus Utilization Pop-up Menu. . . . . . . . . . . . . . . . . . . . . . . . . . . . . . . . 177
Bus Utilization Buttons . . . . . . . . . . . . . . . . . . . . . . . . . . . . . . . . . . . . 179
10.5 Link Tracker. . . . . . . . . . . . . . . . . . . . . . . . . . . . . . . . . . . . . . . . . . . . . . 181
Using the Link Tracker Window . . . . . . . . . . . . . . . . . . . . . . . . . . . . . 182
Link Tracker Buttons . . . . . . . . . . . . . . . . . . . . . . . . . . . . . . . . . . . . . . 185
10.6 Data Flow Window. . . . . . . . . . . . . . . . . . . . . . . . . . . . . . . . . . . . . . . . . 187
10.7 Using the CATC Trace Navigator . . . . . . . . . . . . . . . . . . . . . . . . . . . . . 188
Displaying the Navigator . . . . . . . . . . . . . . . . . . . . . . . . . . . . . . . . . . . 188
Navigator Toolbar . . . . . . . . . . . . . . . . . . . . . . . . . . . . . . . . . . . . . . . . 189
Navigator Ranges . . . . . . . . . . . . . . . . . . . . . . . . . . . . . . . . . . . . . . . . 189
Navigator Panes . . . . . . . . . . . . . . . . . . . . . . . . . . . . . . . . . . . . . . . . . 191
10.8 LTSSM Flow Graph . . . . . . . . . . . . . . . . . . . . . . . . . . . . . . . . . . . . . . . . 194
10.9 Packet Header Bar . . . . . . . . . . . . . . . . . . . . . . . . . . . . . . . . . . . . . . . . 195
10.10 Packet Data Window . . . . . . . . . . . . . . . . . . . . . . . . . . . . . . . . . . . . . . 196
10.11 Configuration Space View . . . . . . . . . . . . . . . . . . . . . . . . . . . . . . . . . . 197
10.12 Using Unit Metrics . . . . . . . . . . . . . . . . . . . . . . . . . . . . . . . . . . . . . . . . 199
Show Metrics in the CATC Trace Display . . . . . . . . . . . . . . . . . . . . . . 200
Show Metrics in the Traffic Summary Window . . . . . . . . . . . . . . . . . . 202
Show Metrics in the Bus Utilization Window . . . . . . . . . . . . . . . . . . . . 204
10.13 Real-Time Statistics Window . . . . . . . . . . . . . . . . . . . . . . . . . . . . . . . . 207
Real-Time Statistics Buttons . . . . . . . . . . . . . . . . . . . . . . . . . . . . . . . . 208
Real-Time Statistical Monitor Pop-up Menu . . . . . . . . . . . . . . . . . . . . 210
Real-Time Statistics Graph Areas . . . . . . . . . . . . . . . . . . . . . . . . . . . . 211
10.14 TC to VC Mapping . . . . . . . . . . . . . . . . . . . . . . . . . . . . . . . . . . . . . . . . 213
10.15 Timing and Bus Usage Calculations . . . . . . . . . . . . . . . . . . . . . . . . . . 214
10.16 Running Verification Scripts. . . . . . . . . . . . . . . . . . . . . . . . . . . . . . . . . 216
Chapter 11 Updates and Licensing . . . . . . . . . . . . . . . . 219
11.1 Updating the Analyzer . . . . . . . . . . . . . . . . . . . . . . . . . . . . . . . . . . . . . . 219
11.2 License Keys . . . . . . . . . . . . . . . . . . . . . . . . . . . . . . . . . . . . . . . . . . . . . 220
11.3 License Information . . . . . . . . . . . . . . . . . . . . . . . . . . . . . . . . . . . . . . . . 220
Appendix A Configuration Space Decoding . . . . . . . . . 221
A.1 Mandatory Definitions . . . . . . . . . . . . . . . . . . . . . . . . . . . . . . . . . . . . . . . 221
A.2 Mandatory Module Functions . . . . . . . . . . . . . . . . . . . . . . . . . . . . . . . . . 221
A.3 Configuration Register Types . . . . . . . . . . . . . . . . . . . . . . . . . . . . . . . . . 222
A.4 Primitives . . . . . . . . . . . . . . . . . . . . . . . . . . . . . . . . . . . . . . . . . . . . . . . . 222
A.5 Helper File. . . . . . . . . . . . . . . . . . . . . . . . . . . . . . . . . . . . . . . . . . . . . . . . 223
Appendix B China Restriction of Hazardous Substances
Table224
Teledyne LeCroy vii
Page 8

Summit User Manual
How to Contact Teledyne LeCroy . . . . . . . . . . . . . . . . . 225
Index 227
viii Teledyne LeCroy
Page 9

Summit User Manual Section 1
Section 1. General
Teledyne LeCroy 1
Page 10

Section 1 Summit User Manual
2 Teledyne LeCroy
Page 11

Summit User Manual Chapter 1: Overview
Chapter 1: Overview
Designed for developers and validators, the Teledyne LeCroy PETracer Summit™ and
Summit T2-16™ are Gen1/Gen2 PCI Express advanced verification systems.
By leveraging years of experience in protocol analysis tools for emerging markets,
PETracer Summit and Summit T2-16 blend sophisticated functionality with practical
features to speed the development of PCI Express™ IP cores, semiconductors, bridges,
switches, add-in boards, and systems.
1.1 PETracer Analyzer Hardware and Software
Features and Benefits
PETracer Summit and Summit T2-16 Analyzers have these features and benefits:
Features Benefits
Powerful and Intuitive
CATC Trace™ Analysis Software
Extensive Decoding Complete, accurate and reliable decoding of TLPs (Transaction
Monitoring and Link Utilization View link utilization and other performance measurements
Advanced Triggering Isolate important traffic, specific errors, or data patterns. Trigger
Hardware Filtering
Intelligent Reporting
Sophisticated Viewing View Packet, Link and Split Transaction levels of the PCI Express
Faster interpretation and debug of PCI Express traffic with
color-coded, clearly labeled protocol elements in a graphical
display. Reduces coding and deciphering.
Layer Packets), DLLPs (Data Link Layer Packets), and all
PCI Express Primitives
changing in real time.
condition setup is made simple with drag and drop tools to link
events to trigger or filter actions.
Analyze faster and understand transactions more clearly by
removing non-essential fields from the trace.
Quickly identify and track error rates and abnormal link or timing
conditions. Display configuration space and protocol specification
details.
protocol. Collapsible/expandable headers with Tool tip
explanations make it easy to navigate and interpret packet
contents, headers, and commands. View packets, transactions of
TLPs and DLLPs in classic CATC Trace™ format or in raw 10b
code for deeper analysis.
8 GB Recording Capacity,
4 GB in each direction
Teledyne LeCroy 3
Capture long recording sessions for analysis and problem solving
Page 12

Chapter 1: Overview Summit User Manual
Flexible Host Interface Summit T2-16: USB and GigE .
PETracer Summit: 10/100 MBps.
Downloadable CATC Trace
Viewer
Bidirectional x1-x16,
2.5 GBps to 5.0 GBps
recording support
Field-upgradeable firmware and
recording engine
Flexible probing options Active and passive slot interposers
External interface for probing
and monitoring auxiliary digital
signals
Share and annotate CATC Trace recordings within a development
team. Freely distributable PETracer software enables collaborative
analysis across sites and time zones.
Accurate and non-intrusive collection of PCI Express CATC Trace
data
Upgrades available for download direct from the Teledyne LeCroy
website
MidBus probe
Flying lead probe
Gen1 AMC interposer
Gen1 XMC interposer
Gen1 SIOM interposer
Gen1 Express card interposer
Enables cross triggering between other test instruments.
Dword to Transaction Level
Viewer
CRC checking Know that info being displayed is accurate.
View Dwords, Packet, Link and Split Transaction levels of the PCI
Express protocol.
1.2 CATC Trace Software
PETracer Summit and Summit T2-16 utilize the CATC Trace™ to assist users in
analyzing how PCI Express components work together, diagnose problems, and test for
interoperability and standards compliance.
The CATC Trace is a powerful and intuitive expert software system embedding detailed
knowledge of the protocol hierarchy and intricacies, as defined in the protocol
specification. The software allows the user to control the Analyzer and set specific
real-time triggering and filtering conditions. The CATC Trace utilizes a Windows-based
graphical display that has been optimized for fast and easy navigation through a captured
traffic session. Users are alerted as violations are detected at all levels of the protocol
layering and can easily drill down on areas of interest or collapse and hide fields that are
not relevant.
4 Teledyne LeCroy
Page 13
Summit User Manual Chapter 1: Overview
1.3 Summit T2-16 Analyzer
The Teledyne LeCroy Summit T2-16 is Teledyne LeCroy’s fourth-generation PCI Express
analyzer for customers in server, workstation, desktop, graphics, storage and network
card markets.
With advanced features such as support for PCI Express Spec 2.1, data rates of both 2.5
and 5 GBps, lane widths from x1 to x16, and a full 8 GB of trace (recording) memory, the
Summit T2-16 provides unmatched capability and flexibility for developers and users of
advanced PCI Express products. The Summit T2-16 is the most advanced and
sophisticated PCI Express Analyzer available in the market today.
As with other Teledyne LeCroy PCI Express analyzers, the Summit T2-16 leverages the
intuitive and powerful CATC Trace analysis software system, embedding a deep
understanding of the PCI Express protocol hierarchy and intricacies. The colorful,
intuitive and easy-to-use graphical display allows you to quickly capture and validate
PCI Express product designs. All Teledyne LeCroy PCI Express protocol analyzers
employ high-impedance, non-intrusive probing technology, thereby allowing fully
unaltered data pass-through.
In addition to a full suite of advanced hardware and software features, the Summit T2-16
introduces new user-convenience and analysis features, such as support for “lane
swizzling,” which allows a board developer to lay out a mid-bus probe pad with lanes in
non-standard order, simplifying the design of the board. Internally, the Summit T2-16
maps the lanes back into their correct order and accurately displays the embedded bus
traffic. Other new software features include enhanced error checking for automatic
identification of additional error types, more compact CATC Trace files that allow for
faster analysis of data, and the choice of simplified or advanced modes for setting up
recording options. An optional raw-recording mode allows bytes to be recorded as they
come across the link, allowing debugging of PHY layer problems and combining the
features of a logic analyzer format with a protocol analyzer format. The new
auto-sense-link feature monitors negotiation between devices of different lane widths.
The Summit T2-16 supports USB and GIGE host interfaces. By connecting over GIGE,
engineers can operate the system remotely (for example, install the client software on
their desktop systems to control an analyzer operating in a remote lab). Also, multiple
engineers working collaboratively can time-share use of a single analyzer, reducing the
need for an additional analyzer for each engineer and increasing the cost effectiveness
of the product.
Teledyne LeCroy 5
Page 14

Chapter 1: Overview Summit User Manual
Features
• Powerful and Intuitive CATC Trace Analysis Software System: The CATC Trace
embeds deep understanding of the PCI Express protocol hierarchy and intricacies.
This knowledge is presented in a colorful, intuitive and easy-to-use graphical
display, allowing you to quickly capture and validate PCI Express product designs.
• Protocol Hierarchical Viewing: Displays Packet, Transaction, and
Split Transaction levels of the PCI Express protocol, with increased drill-down detail
for PCI Express primitives, errors, payloads or individual packets.
• Advanced Triggering: Allows you to trigger on various PCI Express Events such
as Link Conditions, TLP Headers, DLLP Messages, and Data Payload.
• Lane-Reversal Compatible: Triggers, records, and displays PCI Express traffic
logically, regardless of the physical configuration of the lanes.
• Statistical and Error Reporting: Provides a quick summary of the CATC Trace file
to identify and track error rates and abnormal link or timing conditions.
• Raw Recording Mode (optional): Records the bytes exactly as they come across
the link, allowing debugging of PHY layer problems.
• Auto Speed detection: Follows link transitions through speed changes.
• Auto Polarity detection: Automatically detects lanes with inverted polarity.
• Auto Sense Lane Width: Analyzes all negotiation traffic between devices with
different lane widths, eliminating the need to set up lane widths before a trace.
• Lane Swizzling Support: Allows board developers to lay out lanes in a
non-standard order, simplifying board design.
• Powerful Real-time BusEngine Protocol Processor Technology: Sophisticated
triggering and filtering help you focus on critical protocol data and isolate important
protocol traffic, specific errors, or data patterns.
• Field-upgradeable Firmware and Engine: Positions you to receive the latest
PETracer enhancements and future additional capabilities. Allows field upgrades of
all system types.
• 8-GB Data Buffer: Capture long time windows for in-depth analysis and
identification of erratic problems.
• GIGE Ethernet Connectivity: Allows connection to an Ethernet network and
sharing of analyzer resources by multiple engineers.
• USB connectivity: Allows connection by USB cable.
6 Teledyne LeCroy
Page 15
Summit User Manual Chapter 1: Overview
1.4 PETracer Gen2 Summit Analyzer
The Teledyne LeCroy PETracer Gen2 Summit is Teledyne LeCroy’s first-generation
high-performance PCI Express analyzer for customers in server, workstation, desktop,
graphics, storage and network card markets.
With advanced features such as support for PCI Express Spec 2.0, data rates of both 2.5
and 5 GBps, lane widths from x1 to x16, and a full 8 GB of memory, the PETracer Gen2
Summit provides excellent capability and flexibility for developers and users of advanced
PCI Express products.
As with other Teledyne LeCroy PCI Express analyzers, the PETracer Gen2 Summit
leverages the intuitive and powerful CATC Trace analysis software system, embedding a
deep understanding of the PCI Express protocol hierarchy and intricacies. The colorful,
intuitive and easy-to-use graphical display allows you to quickly capture and validate
PCI Express product designs. All Teledyne LeCroy PCI Express protocol analyzers
employ high-impedance, non-intrusive probing technology, thereby allowing fully
unaltered data pass-through.
In addition to a full suite of advanced hardware and software features, the
PETracer Gen2 Summit supports “lane swizzling,” which allows a board developer to lay
out a mid-bus probe pad with lanes in non-standard order, simplifying the design of the
board. Internally, the PETracer Gen2 Summit maps the lanes back into their correct order
and accurately displays the embedded bus traffic. Other new software features include
enhanced error checking for automatic identification of additional error types, more
compact CATC Trace files that allow for faster analysis of data, and the choice of
simplified or advanced modes for setting up recording options. An optional Bit Tracer
mode allows bytes to be recorded as they come across the link, allowing debugging of
PHY layer problems and combining the features of a logic analyzer format with a protocol
analyzer format. The new auto-sense-link feature monitors negotiation between devices
of different lane widths.
The PETracer Gen2 Summit supports both a USB and a 10/100 MBps Ethernet LAN port
as standard features. By connecting over a LAN, engineers can operate the system
remotely (for example, install the client software on their desktop systems to control an
analyzer operating in a remote lab). Also, multiple engineers working collaboratively can
time-share use of a single analyzer, reducing the need for an additional analyzer for each
engineer and increasing the cost effectiveness of the product.
Teledyne LeCroy 7
Page 16

Chapter 1: Overview Summit User Manual
Features
• Powerful and Intuitive CATC Trace Analysis Software System: The CATC Trace
embeds deep understanding of the PCI Express protocol hierarchy and intricacies.
This knowledge is presented in a colorful, intuitive and easy-to-use graphical
display, allowing you to quickly capture and validate PCI Express product designs.
• Protocol Hierarchical Viewing: Displays Packet, Transaction, and
Split Transaction levels of the PCI Express protocol, with increased drill-down detail
for PCI Express primitives, errors, payloads or individual packets.
• Advanced Triggering: Allows you to trigger on various PCI Express Events such
as Link Conditions, TLP Headers, DLLP Messages, and Data Payload.
• Lane-Reversal Compatible: Triggers, records, and displays PCI Express traffic
logically, regardless of the physical configuration of the lanes.
• Statistical and Error Reporting: Provides a quick summary of the CATC Trace file
to identify and track error rates and abnormal link or timing conditions.
• Raw Recording Mode (optional): Records the bytes exactly as they come across
the link, allowing debugging of PHY layer problems.
• Auto Speed detection: Follows link transitions through speed changes.
• Auto Polarity detection: Automatically detects lanes with inverted polarity.
• Auto Sense Lane Width: Analyzes all negotiation traffic between devices with
different lane widths, eliminating the need to set up lane widths before a trace.
• Lane Swizzling Support: Allows board developers to lay out lanes in a
non-standard order, simplifying board design.
• Powerful Real-time BusEngine Protocol Processor Technology: Sophisticated
triggering and filtering help you focus on critical protocol data and isolate important
protocol traffic, specific errors, or data patterns.
• Field-upgradeable Firmware and Engine: Positions you to receive the latest
PETracer enhancements and future additional capabilities. Allows field upgrades of
all system types.
• 8-GB Data Buffer: Capture long time windows for in-depth analysis and
identification of erratic problems.
• 10/100 MBps Ethernet Connectivity: Allows connection to an Ethernet network
and sharing of analyzer resources by multiple engineers.
1.5 Other Documents
For more information, refer to the following documents:
• Teledyne LeCroy Analyzers File-based Decoding Manual
• PETracer/Trainer Automation Manual
• PETracer VSE Manual
• PETracer Gen2 Multi Lead Probe User Manual
• PETrainer Scripting Language Reference Manual
•PETracer Online Help
8 Teledyne LeCroy
Page 17

Summit User Manual Chapter 2: Hardware Description
Chapter 2: Hardware Description
The PCI Express™ system features Summit Analyzers.
2.1 System Components
•PETracer Summit system:
•PETracer Gen2 Summit™ analyzer box
• Breakout Board with cable
•PETracer Software program CD-ROM
• Active or Passive interposer (optional)
• Active or Passive interposer card with 12V power supply
• One or two (for x8 or x16 recording) Mid Box assemblies
• Two or four (for x8 or x16 recording) Analyzer-to-Pod cables
• One or two (for x8 or x16 recording) iPass Y probe data cables
• MidBus probe (optional)
• One or two (for x8 or x16 recording) PCI Express Midbus Pods with
12-volt power supplies
• One or two (for x8 or x16 recording) MidBus probe assemblies
• Two or four (for x8 or x16 recording) Analyzer-to-Pod cables
• Summit T2-16 system:
• Summit T2-16™ analyzer box
• AC Power Cable
• One or two (for x8 or x16 recording) iPass Y probe data cables
• Breakout Board with cable
•PETracer Software program CD-ROM
• Active interposer with Power Supply (optional)
• Passive interposer with Power Supply (optional)
• MidBus probe (optional)
• One or two (for x8 or x16 recording) MidBus probe assemblies
• One or two (for x8 or x16 recording) T2 MidBus Pods
2.2 Host Machine Requirements
PETracer Summit and Summit T2-16 connect to a host machine. Please consult the
readme file on the installation CD for the latest host machine requirements.
Teledyne LeCroy 9
Page 18
Chapter 2: Hardware Description Summit User Manual
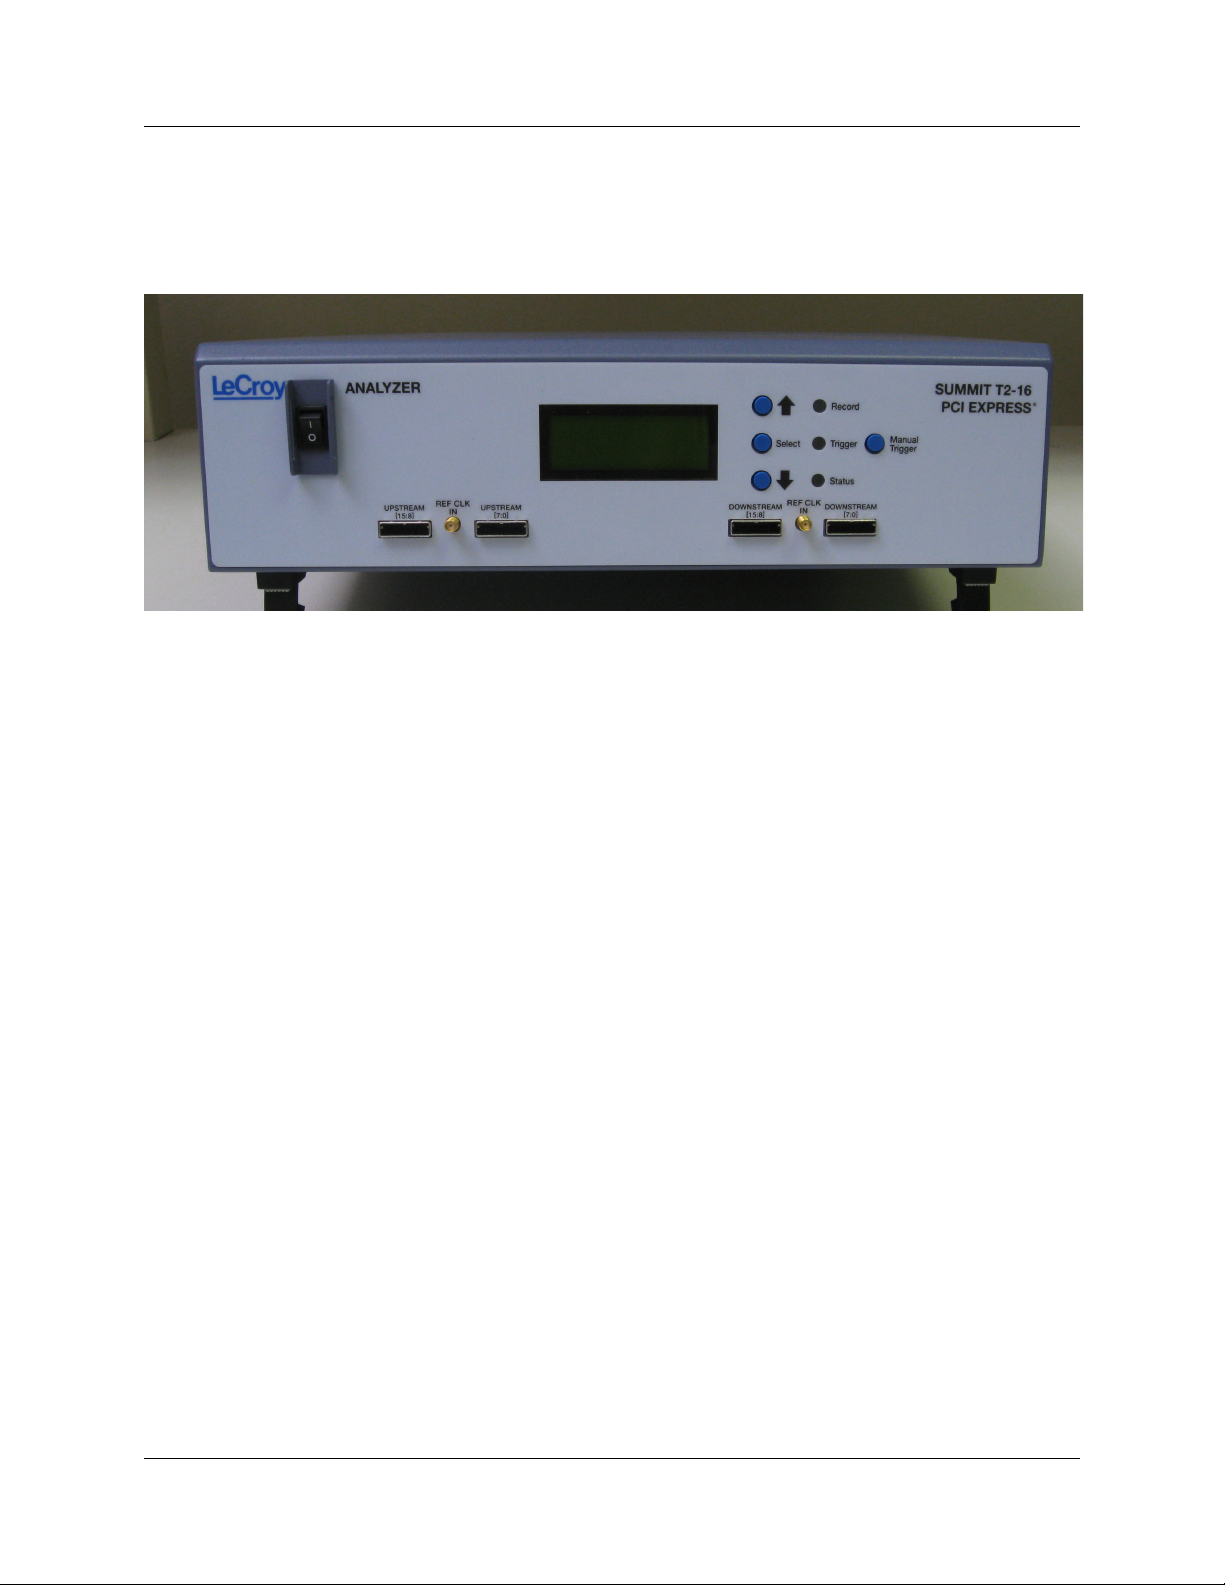
2.3 Summit T2-16 Front Panel Description
When powered on, the Summit T2-16 activates the user-accessible controls and LEDs
on the front and rear panels.
Warning! Do not open the enclosure. There are no operator serviceable parts inside.
Refer servicing to Teledyne LeCroy.
The controls and LEDs are:
• Power Switch (black): 1 = On and 0 = Off.
• LCD Menus: Allows you to set up the Summit T2-16 and view status. See “LCD
Menus” on page 11.
• Up Arrow (top blue button): Move up in the LCD menu.
• Select (middle blue button): Select or change an option.
• Down Arrow (bottom blue button): Move down in the LCD menu.
• Record LED: Lights when the Summit T2-16 is recording.
• Trigger LED: Lights when the Summit T2-16 triggers on an event.
• Status LED: Displays Analyzer status: blue = good or red = error.
• Manual Trigger (right blue button): Forces a trigger.
• UPSTREAM [15:8] and UPSTREAM [7:0] connectors: Connection to the probe or
MidBus module for the capture of upstream direction of the link.
• DOWNSTREAM [15:8] and DOWNSTREAM [7:0] connectors: Connection to the
probe or MidBus module for the capture of downstream direction of the link.
• REF CLK IN (Reference Clock In): Provides an optional alternative connection
from an external reference clock source to the Summit T2-16 analyzer.
Note: In standard configuration, the Summit T2-16 analyzer uses the reference
clock from a probe cable.
10 Teledyne LeCroy
Page 19

Summit User Manual Chapter 2: Hardware Description
LCD Menus
The Summit T2-16 has a front LCD panel that displays menus with commands for
configuring the device.
Boot Sequence
The boot sequence for the analyzer takes a few seconds. As the analyzer boots, it
initializes itself, beeps, and shows the status on the LCD panel. If the analyzer boots
successfully, the LCD panel Root menu appears.
During initialization, the LCD panel displays boot status messages.
Booting from Boot-Code
If the analyzer does not boot successfully, or if it becomes non-responsive, you can boot
from default settings called boot-code.
Boot-code is a simplified version of Summit firmware. It allows the analyzer to boot to the
point where it can communicate with the Summit software application. After
communication is established between the analyzer and software application, you can
download a different version of firmware and BusEngine files to the analyzer.
To boot from boot-code:
Step 1 Press and hold the Manual Trigger button on the analyzer front panel.
Step 2 While holding the button DOWN, turn the box ON.
After you complete these steps, download the new version of BusEngine and firmware
files, then reboot the analyzer from the LCD panel menu (Summit Setup > Reboot).
Root Menu
The Root menu appears after successful boot-up. The top line of the Root menu displays
the device status with the following:
• [PCI]: Indicates the hardware platform.
• Idle: Shows analyzer status.
Submenus
The Root menu has these options:
• Summit Setup menu: Allows setup using submenus.
• Platform Status menu: Shows the results for the power-on self-diagnostics.
Note: When lists of options are presented in a menu, the current selections are
indicated with an asterisk.
To navigate, use the Up Arrow and Down Arrow buttons (top and bottom blue buttons)
on the front of the unit.
To select or change an option, use the Select button (middle blue button).
Teledyne LeCroy 11
Page 20

Chapter 2: Hardware Description Summit User Manual
Summit T2-16 Setup Menu
Menu Submenu Command
IP Mode Static
Dynamic
IP Address If IP Mode = Dynamic, this field is ignored.
Subnet Mask Default is 0.0.0.0
Default Gateway Default is 0.0.0.0
Reboot Cancel
Confirm
Shutdown Cancel
Confirm
About Displays status on the following parameters:
Static = You assign an IP address.
Dynamic = A DHCP server assigns an IP address.
If IP Mode = Dynamic, this field is ignored.
If IP Mode = Dynamic, this field is ignored.
Selecting Confirm causes Summit to save the
current configuration and reboot.
Selecting Confirm causes Summit to save the
current configuration and shut down.
• Subnet Mask
• Default Gateway
• BootCode
•Firmware
• Bus Engine
• IP Mode: Dynamic or Static
Note: To go back to the previous menu, press the
Select button (middle button).
[Back] Returns to the Root menu.
12 Teledyne LeCroy
Page 21
Summit User Manual Chapter 2: Hardware Description
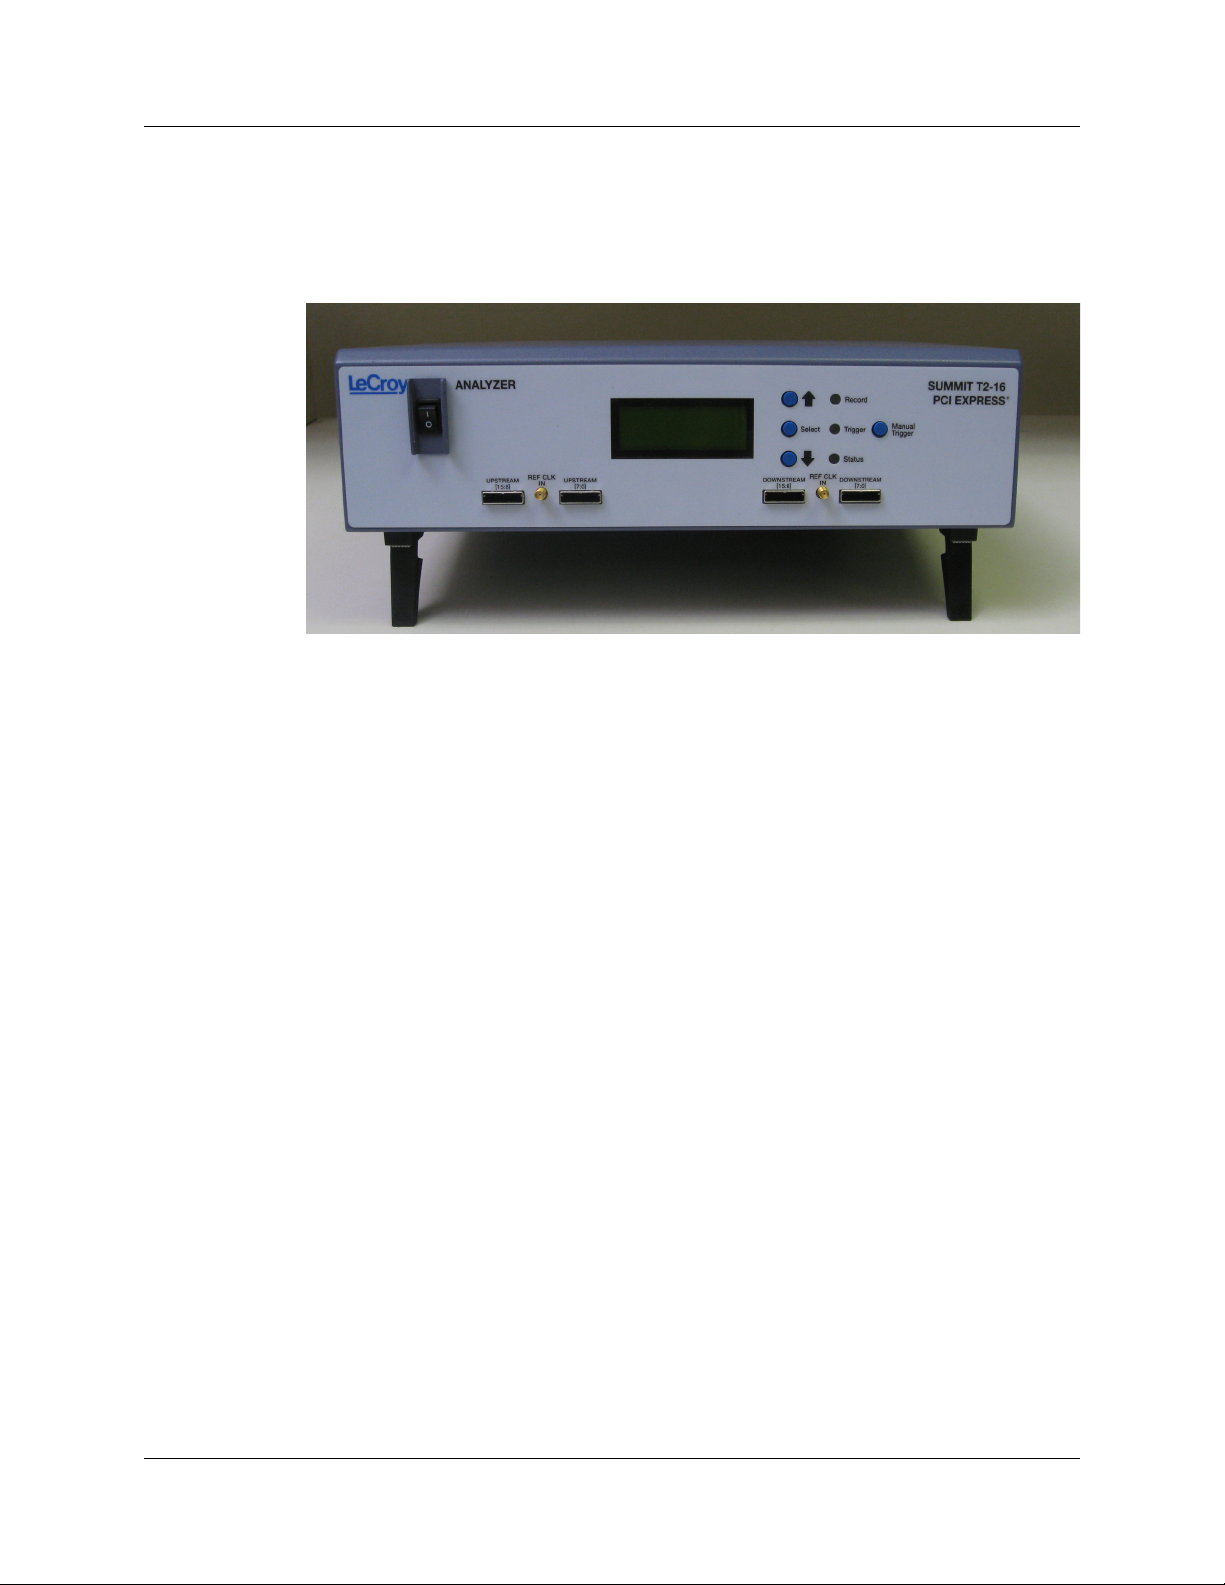
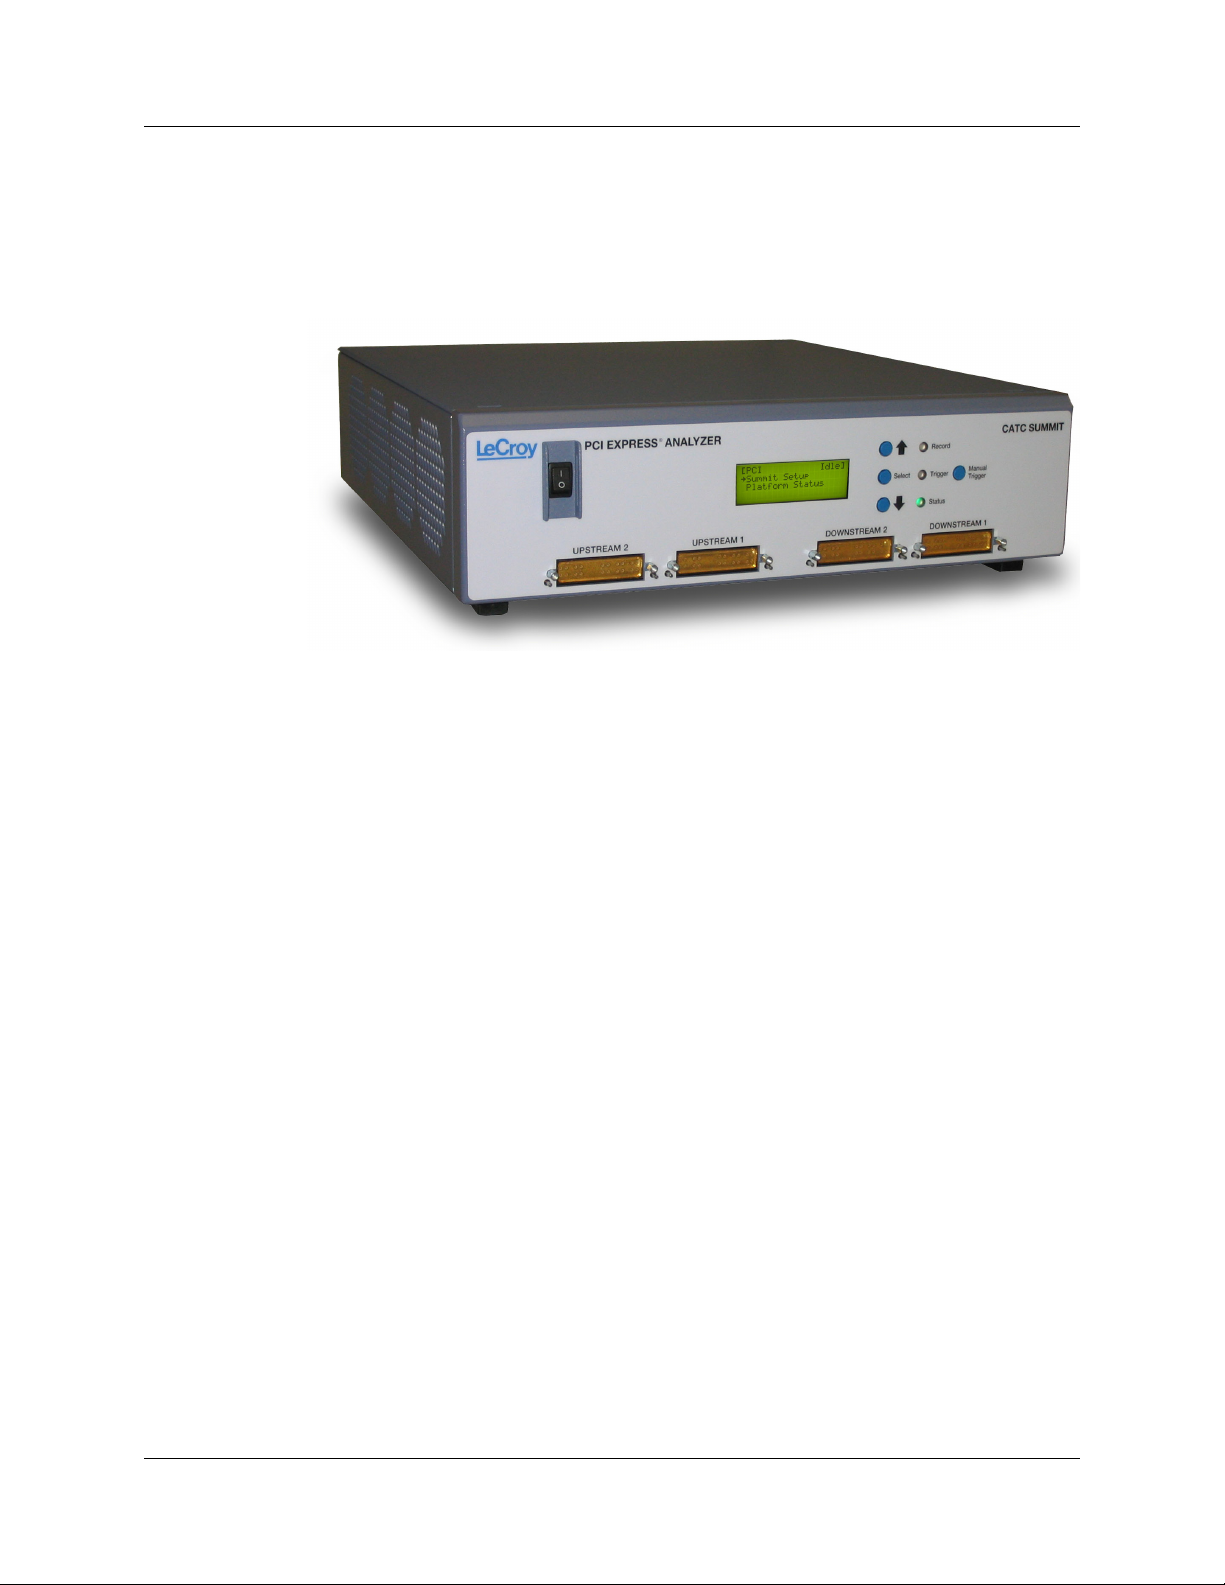
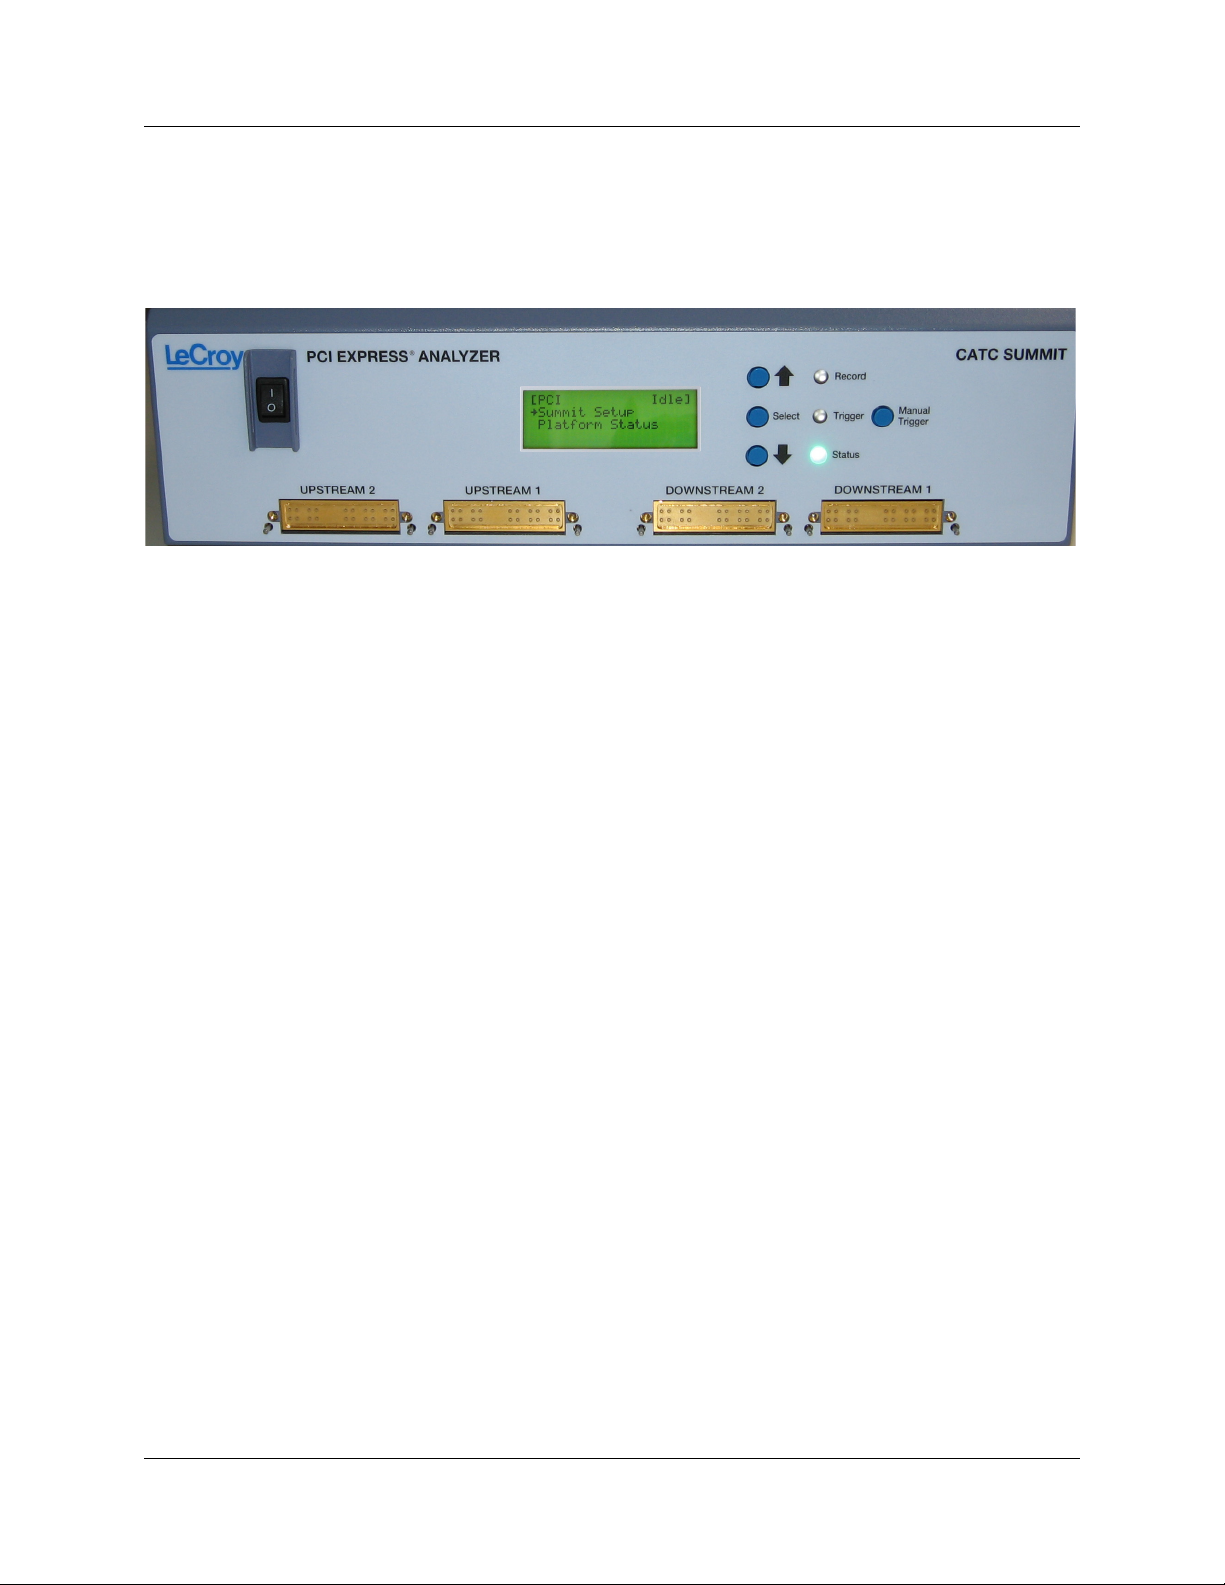
2.4 PETracer Summit Front Panel Description
When powered on, the PETracer Summit activates the user-accessible controls and
LEDs on the front and rear panels.
Warning! Do not open the enclosure. There are no operator serviceable parts inside.
Refer servicing to Teledyne LeCroy.
The controls and LEDs are:
• Power Switch (black): 1 = On and 0 = Off.
• LCD Menus: Allows you to set up the PETracer Summit and view status. See “LCD
Menus” on page 14.
• Up Arrow (top blue button): Move up in the LCD menu.
• Select (middle blue button): Select or change an option.
• Down Arrow (bottom blue button): Move down in the LCD menu.
• Record LED: Lights when the PETracer Summit is recording.
• Trigger LED: Lights when the PETracer Summit triggers on an event.
• Status LED: Displays Analyzer status: blue = good or red = error.
• Manual Trigger (right blue button): Forces a trigger.
• UPSTREAM 1 (lanes [7:0]) and UPSTREAM 2 (lanes [15:8]) connectors:
Connection to the Pod for the capture of upstream direction of the link.
• DOWNSTREAM 1 (lanes [7:0]) and DOWNSTREAM 2 (lanes [15:8]) connectors:
Connection to the Pod for the capture of downstream direction of the link.
Teledyne LeCroy 13
Page 22

Chapter 2: Hardware Description Summit User Manual
LCD Menus
The PETracer Summit has a front LCD panel that displays menus with commands for
configuring the device.
Boot Sequence
The boot sequence for the Summit box takes a few seconds. As the box boots, it
initializes itself, beeps, and shows the status on the LCD panel. If the box boots
successfully, the LCD panel Root menu appears.
During initialization, the LCD panel displays boot status messages.
Booting from Boot-Code
If the Summit box does not boot successfully, or if it becomes non-responsive, you can
boot from default settings called boot-code.
Boot-code is a simplified version of Summit firmware. It allows the box to boot to the point
where it can communicate with the Summit software application. After communication is
established between the box and software application, you can download a different
version of firmware and BusEngine files to the box.
To boot from boot-code:
Step 1 Press and hold the Manual Trigger button on the Summit box front
panel.
Step 2 While holding the button DOWN, turn the box ON.
After you complete these steps, download the new version of BusEngine and firmware
files, then reboot the box from the LCD panel menu (Summit Setup > Reboot).
Root Menu
The Root menu appears after successful boot-up. The top line of the Root menu displays
the device status with the following:
• [PCI]: Indicates the hardware platform.
• Idle: Shows analyzer status.
Submenus
The Root menu has these options:
• Summit Setup menu: Allows setup using submenus.
• Platform Status menu: Shows the results for the power-on self-diagnostics.
Note: When lists of options are presented in a menu, the current selections are
indicated with an asterisk.
To navigate, use the Up Arrow and Down Arrow buttons (top and bottom blue buttons)
on the front of the unit.
To select or change an option, use the Select button (middle blue button).
14 Teledyne LeCroy
Page 23

Summit User Manual Chapter 2: Hardware Description
PETracer Summit Setup Menu
Menu Submenu Command
IP Mode Static
Dynamic
IP Address If IP Mode = Dynamic, this field is ignored.
Subnet Mask Default is 0.0.0.0
Default Gateway Default is 0.0.0.0
Reboot Cancel
Confirm
Shutdown Cancel
Confirm
About Displays status on the following parameters:
Static = You assign an IP address.
Dynamic = A DHCP server assigns an IP address.
If IP Mode = Dynamic, this field is ignored.
If IP Mode = Dynamic, this field is ignored.
Selecting Confirm causes Summit to save the
current configuration and reboot.
Selecting Confirm causes Summit to save the
current configuration and shut down.
• Subnet Mask
• Default Gateway
• BootCode
•Firmware
• Bus Engine
• IP Mode: Dynamic or Static
Note: To go back to the previous menu, press the
Select button (middle button).
[Back] Returns to the Root menu.
Teledyne LeCroy 15
Page 24
Chapter 2: Hardware Description Summit User Manual
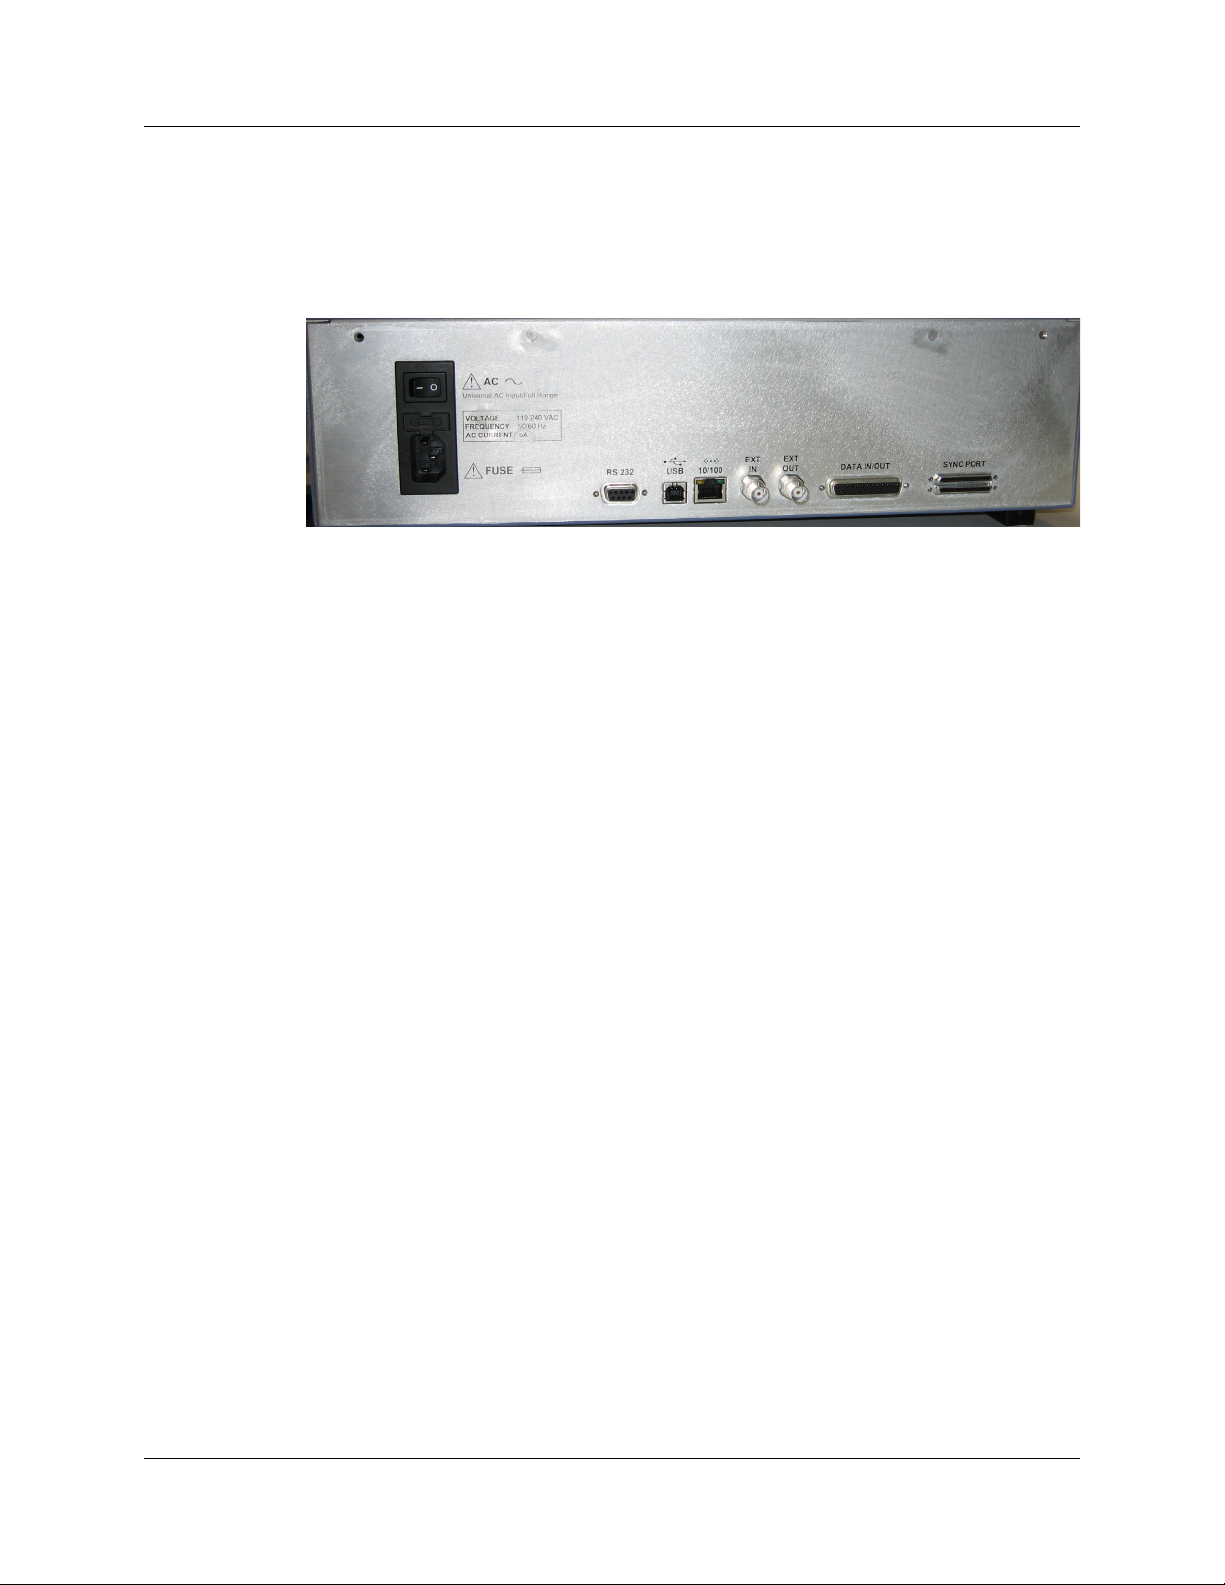
2.5 Summit T2-16 Rear Panel Description
From left to right, the Summit T2-16 rear panel contains the following components:
Figure 2.1 Summit T2-16 Rear Panel
Wide-range AC Connector Module
• Power on/off switch
• Enclosed 5x20 mm 2.0A 250 V fast acting glass fuse
• Power socket
Warning! For continued protection against fire, replace fuse only with the type and
rating specified above.
Sync In and Sync Out Connectors
(not currently active) These connectors allow multiple Summit T2-16 analyzers to send
synchronization and control messages to one another.
USB Type B Host Machine Computer Connector
This connector links an Analyzer to the host machine for the purpose of transmitting
commands from the host machine to the Analyzer and uploading traces from the
Analyzer’s recording memory to the PETracer software for viewing and analysis.
Note: For each Analyzer or Exerciser, use either USB or Ethernet, not both.
Ethernet Port
GIGE Connectivity allows connection to an Ethernet network and sharing of analyzer
resources by multiple engineers. Note: For each Analyzer or Exerciser, use either USB
or Ethernet, not both.
BNC Connectors Trigger In and Trigger Out
These BNC connectors allow the Analyzer to transmit or receive trigger event signals.
Triggering: The Ext. In can receive a signal from another device and use that signal to
trigger the end of the recording. Conversely, the Ext. Out connector can be used to send
an output signal from the Analyzer to another device.
The BNC connectors are not used for the PETrainer Exerciser.
16 Teledyne LeCroy
Page 25

Summit User Manual Chapter 2: Hardware Description
RS-232 25-pin Data Input/Output Connector
This connector links a 25 pin RS-232 cable to an external Breakout Board. The
Breakout Board allows signals to be sent from the Exerciser or Analyzer to an external
device such as an oscilloscope or from an external device to the Exerciser or Analyzer
for the purpose of triggering on an external input. You configure input/output through the
Recording Options dialog box. The Breakout Board use is described at the end of this
chapter.
Teledyne LeCroy Bus Connector
The Teledyne LeCroy Bus Connector is not currently active.
Teledyne LeCroy 17
Page 26
Chapter 2: Hardware Description Summit User Manual
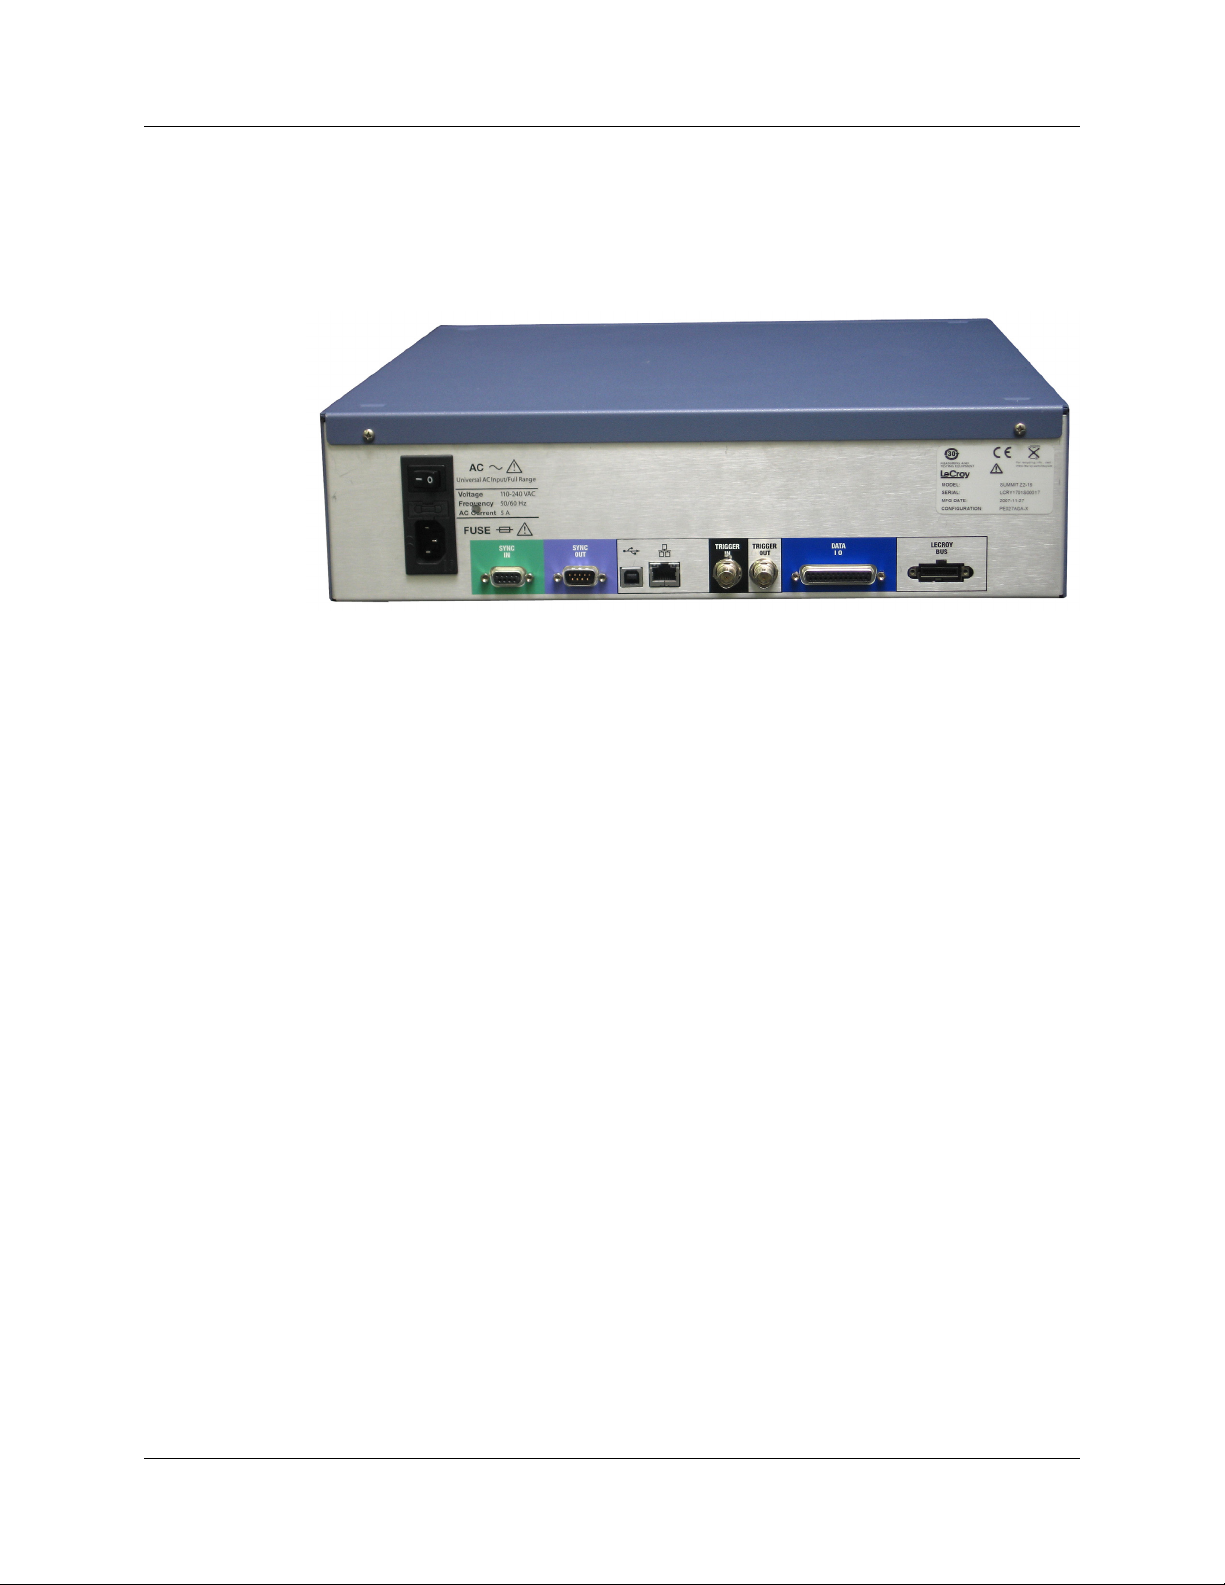
2.6 PETracer Summit Rear Panel Description
From left to right, the PETracer Summit rear panel contains the following components:
Figure 2.2 PETracer Summit Rear Panel
Wide-range AC Connector Module
• Power socket
• Enclosed 5x20 mm 2.0A 250 V fast acting glass fuse
• Power on/off switch
Warning! For continued protection against fire, replace fuse only with the type and
rating specified above.
RS-232 25-pin Data Input/Output Connector
This connector links a 25 pin RS-232 cable to an external Breakout Board. The
Breakout Board allows signals to be sent from the Analyzer to an external device such
as an oscilloscope or from an external device to the Analyzer for the purpose of triggering
on an external input. You configure input/output signalling through the Recording Options
dialog box. The Breakout Board use is described at the end of this chapter.
USB Type B Host Machine Connector
This connector links the Analyzer to the host machine for the purpose of transmitting
commands from the host machine to the Analyzer and uploading traces from the
Analyzer’s recording memory to the PETracer software for viewing and analysis. Note:
May not be active on some Summit systems.
Ethernet Port
10/100 Mbps Ethernet Connectivity allows connection to an Ethernet network and
sharing of analyzer resources by multiple engineers.
18 Teledyne LeCroy
Page 27

Summit User Manual Chapter 2: Hardware Description
BNC Connectors Ext. In and Ext. Out
These BNC connectors allow the Analyzer to transmit or receive external signals.
External signaling, in turn, can serve two functions:
• Linking of Analyzers: On dual Analyzer systems, the BNC connectors are used to
create a loop for transmitting clocking information and commands between the
Analyzers. This linking allows the two Analyzers to function as a single, logical
Analyzer.
• Triggering: The Ext. In can receive a signal from another device and use that
signal to trigger the end of the recording. Conversely, the Ext. Out connector can be
used to send an output signal from the Analyzer to another device.
The Ext. In and Ext. Out connectors have the same function as the 25 pin RS-232
connector - i.e., they channel input and output signals but do not support the use of a
Breakout Board.
VHDCI Sync In and Sync Out Connectors
These connectors allow multiple PETracer Summit or Summit T2-16 analyzers to send
synchronization and control messages to one another.
Teledyne LeCroy 19
Page 28
Chapter 2: Hardware Description Summit User Manual
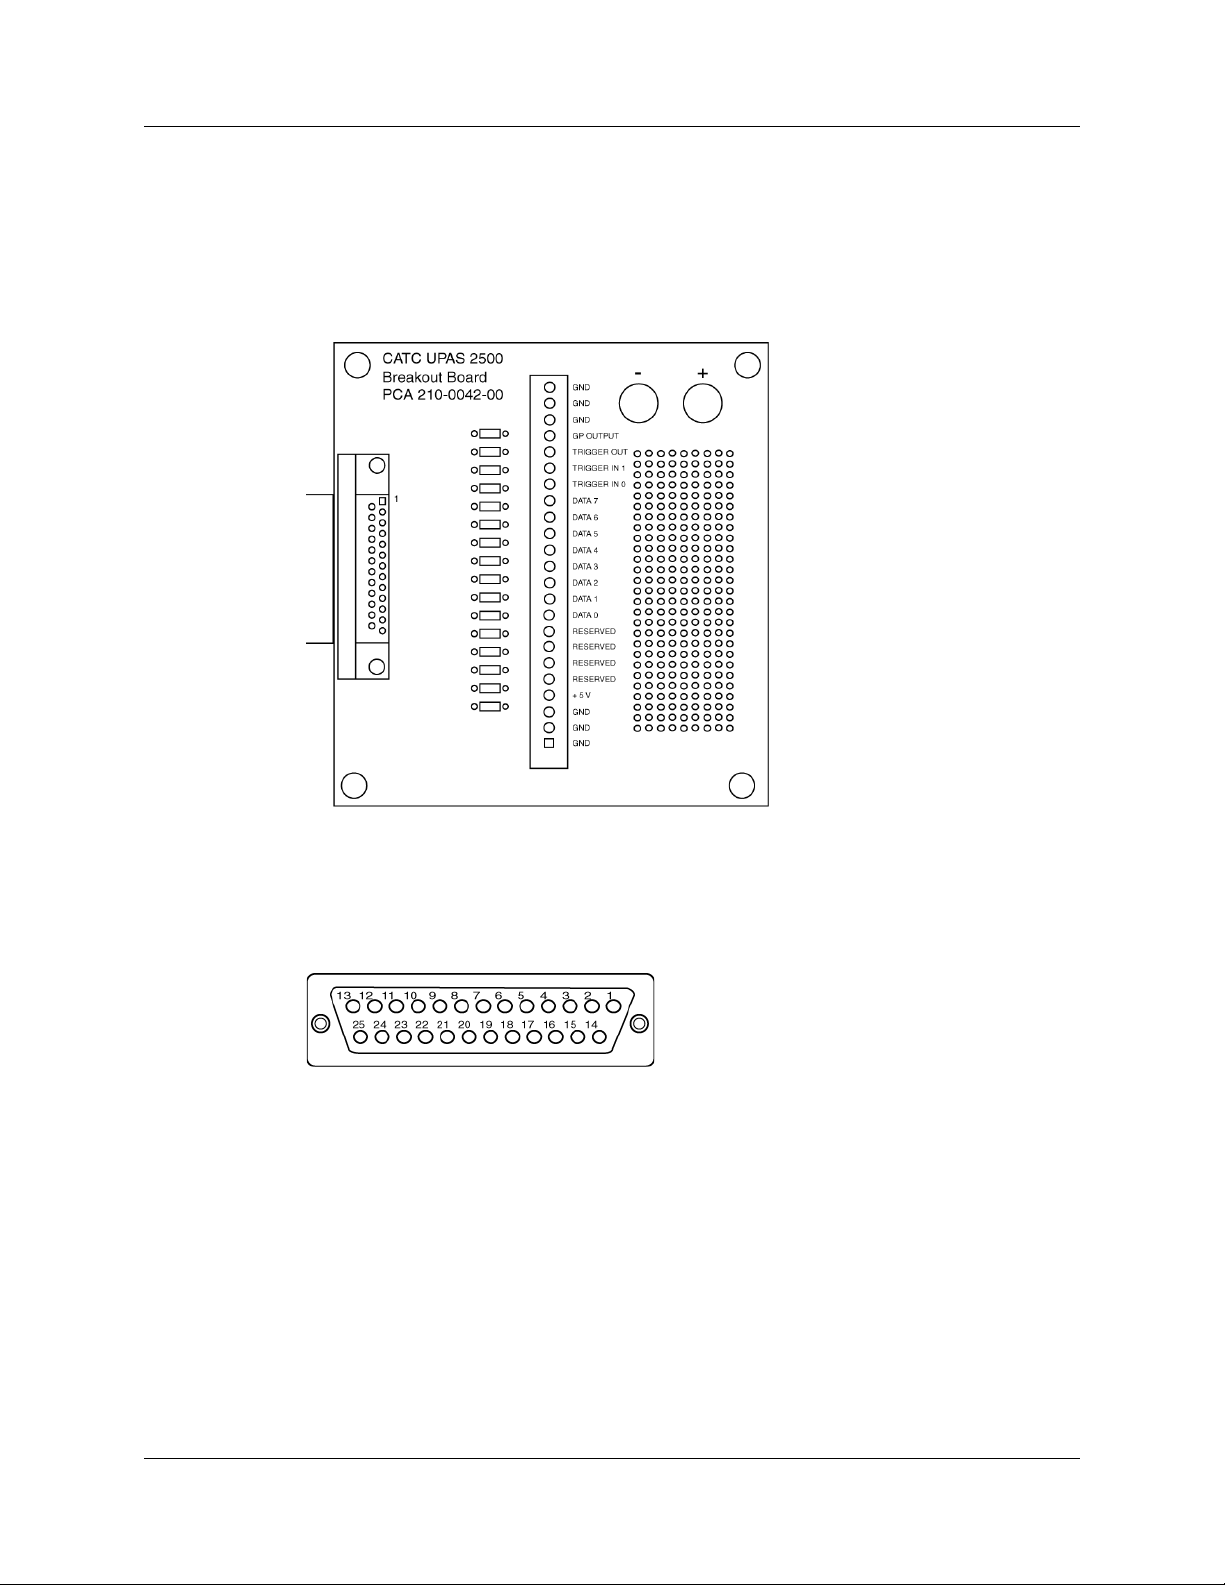
2.7 External Interface Breakout Board
With each Analyzer, Teledyne LeCroy includes an External Interface Breakout Board for
accessing several potentially useful standard, LV TTL output and input signals. The
Breakout Board also offers a simple way to connect logic Analyzers or other tools to the
Analyzer unit. Six ground pins and one 5-volt pin are provided.
The Breakout Board connects via a cable to the Data In/Out connector located on the
rear of the Analyzer unit. Each signaling pin is isolated by a 100 series resistor and a
buffer inside the Analyzer unit.
Data In/Out Connector (on cable)
20 Teledyne LeCroy
Page 29

Summit User Manual Chapter 2: Hardware Description
Pin-Outs for the Data In/Out Connector
The following table lists the pin-out and signal descriptions for the Data In/Out connector
on a cable that connects to the Breakout Board.
Data In/Out Connector – Pin-Out
Pin Signal Name Signal Description
1RSV Reserved
2 GND Ground
3 GP OUT General Purpose Output
4 TRG IN 1 Trigger In 1
5 GND Ground
6 DATA 6 Data 6
7 DATA 4 Data 4
8 DATA 3 Data 3
9 DATA 1 Data 1
10 GND Ground
11 RSV Reserved
12 RSV Reserved
13 +5V +5 Volts, 250 mA DC Source
14 RSV Reserved
15 GND Ground
16 TRG OUT Trigger Out
17 TRG IN 0 Trigger In 0
18 DATA 7 Data 7
19 DATA 5 Data 5
20 GND Ground
21 DATA 2 Data 2
22 DATA 0 Data 0
23 GND Ground
24 RSV Reserved
25 RSV Reserved
Note:
(*) Pins 4 and 17 have the same function: they allow external signals to be
used to cause triggering or recording. Pins 3 and 16 are used to transmit
output signals. Pins 6, 7, 8, 9, 18, 19, 21, and 22 (data pins) are used to
define data patterns for external input signals.
Note: All models of PETracer only support Data 0 - Data 3.
Prototype Rework Area
The Breakout Board contains a prototype rework area for making custom circuits for rapid
development. The area consists of plated-through holes, 20 columns wide by 27 rows
long. The top row of holes is connected to GND and the bottom row is connected to +5V.
The remaining holes are not connected. Use the rework area to insert custom
components and wire-wrap their respective signal, power, and ground pins.
Teledyne LeCroy 21
Page 30

Chapter 2: Hardware Description Summit User Manual
Breakout Board Input and Output Signals
A Breakout Board can be used to channel input signals into the Analyzer in order to cause
triggering. A Breakout Board can also be used to channel signals from the Analyzer to an
external source.
Drive strength for all outputs is about 30 mA high (@2 V) and 60 mA low (@0.5 V). Inputs
can handle 0 V to 5.5 V. Inputs above 2 V are detected as logic high; inputs below 0.8 V
are detected as logic low.
The Breakout Board connects via a cable to the Data In/Out connector on the rear of the
Summit systems.
External Recordable Signals
Breakout Board Data 0-3: These pins let you define a 4-bit Data Pattern that can be
recorded in a CATC Trace file.
External Input Triggers
You can use either an external input signal or the Trigger button on the front of the UPAS
to cause triggering. The following descriptions show what pins or buttons to use:
Breakout Board Data 3 - Data 0: Triggers on a 4-bit input pattern.
Breakout Board Trigger In 0: Selectable Edge triggered inputs. Triggers on any edge it
detects.
Breakout Board Trigger In 1: Selectable Edge triggered inputs. Triggers on any edge it
detects.
BNC Trigger (EXT IN): Selectable Edge triggered inputs. Triggers on any edge it detects.
Located on the back of the chassis.
Push Button Trigger: The Trigger button on the front of the UPAS can be pressed to
manually cause a trigger.
External Outputs
The Analyzer can be configured to send an external signal anytime a trigger and/or event
occurs. The following descriptions show the behavior of these output signals:
Breakout Board Trigger Out: Changes from low to high when Analyzer triggers
(one time per recording only)
Breakout Board G.P. Output: Programmable waveform (low or high pulse, toggle). Each
event can be programmed to enable this external signal.
BNC Output (EXT OUT): Same as Breakout Board G.P. Output. Located on the back of
the chassis.
Setting Recording Options to Support External Input/Output
Signaling
After a Breakout Board has been connected to a Summit system, the Analyzer must be
configured for external or internal input signaling.
22 Teledyne LeCroy
Page 31

Summit User Manual Chapter 3: Installation and Setup
Chapter 3: Installation and Setup
PETracer Summit™ and Summit T2-16™ are stand-alone systems.
You can begin making PCI Express™ recordings after following the steps in this chapter.
3.1 Installing the PETracer Software
PETracer software operates all of Teledyne LeCroy’s PCI Express protocol Analyzer and
Exerciser products:
The PETracer software is installed on a Microsoft
serves as the interface for the Analyzer.
To install the PETracer software on the host machine, before attaching the Analyzer to
the system:
Step 1 Insert the CD into the CD ROM drive of the host machine that will control
the Analyzer. The installation window opens and displays links to the
PETracer software, user manuals, a readme file, and Acrobat Reader.
Step 2 Select Install Software and follow the on-screen instructions.
®
Windows®-based host machine and
The PETracer software installs automatically on the host machine’s hard disk.
During installation, all necessary USB drivers are loaded automatically. Drivers
included in the installation are:
• summit.sys: Summit T2-16 driver
Note: PETracer Summit needs no driver installation.
Step 3 To start the application, launch the PETra c er program from the Start
menu:
Start > Programs > LeCroy > PETracer > LeCroy PETracer
Teledyne LeCroy 23
Page 32

Chapter 3: Installation and Setup Summit User Manual
The PETracer program opens:
Note: The software may be used with or without the Analyzer attached to the
system. When used without an Analyzer attached to the computer, the
program functions as a CATC Trace Viewer to view, analyze, and print
captured traffic.
24 Teledyne LeCroy
Page 33

Summit User Manual Chapter 3: Installation and Setup
3.2 Setting Up the Summit T2-16 Analyzer using an Ethernet Connection
Step 1 Remove the Analyzer from its shipping container.
Step 2 Connect the Analyzer to a 100-volt to 240-volt, 50 Hz to 60 Hz,
120 W power outlet using the provided power cord.
Note: The Analyzer is capable of supporting supply voltages between 100 volts
and 240 volts, 50 Hz or 60 Hz, thus supporting all known supply voltages around
the world.
Step 3 Connect the Ethernet cable between the Ethernet port on the back of the
Analyzer and a Ethernet port (hub, switch or wall) in your local network.
Continue with Step 4 below.
Note on USB: To connect using USB, see “Setting Up the Summit T2-16
Analyzer using a USB Connection” on page 28.
Step 4 Turn on the rear power switch and the front power switch.
Note: At power-on, the Analyzer initializes itself in approximately five seconds
and performs an exhaustive self-diagnostic that lasts about forty seconds. The
results are reflected by messages on the Summit T2-16 LCD display (see
“Summit T2-16 Front Panel Description” on page 10). If the LCD display indicates
failure, call Teledyne LeCroy Customer Support for assistance.
Connecting to a Summit T2-16 Analyzer in the Local Network
After you have installed the PETra c e r application software, perform the following
procedure to connect to a Summit T2-16 analyzer in the local network.
Step 1 Select the Setup > All connected devices… menu in the PETracer
application to display the Analyzer Devices dialog.
Teledyne LeCroy 25
Page 34

Chapter 3: Installation and Setup Summit User Manual
The PETracer software fills the list with devices that are connected over USB or
discovered on the Ethernet network. The discovery mechanism works only within
one network subnet. If a Summit is connected to the network on a different
subnet, you can manually add the subnet to the list by clicking the Add Device
button and specifying the IP address.
The Summit devices in the list are marked:
• Locked: Some other client on the network is already connected to that
device
• Ready to connect: Available for connection
Step 2 If a Summit device is marked Ready to Connect, you can select that
device and press the Connect button to execute the connection
procedure.
After the connection is established, the application displays the Connection
Properties dialog:
Step 3 Select an option:
• Automatically connect to the device: When the application is started or
when the named device is added to the network while the PETracer
application is running on this computer, the PETracer application will try to
connect to the named device.
• Ask if I want to connect to the device: When the application is started or
when the named device is added to the network while the PETracer
application is running on this computer, the PETracer application will display a
message box allowing you to connect to the named device.
• Take no action: When you start the application or when you add the named
device to the network while the PETracer application is running on this
computer, you must connect manually to use the named device.
Note: When you close the application on this computer (or you perform manual
disconnect), the application disconnects from the device.
26 Teledyne LeCroy
Page 35

Summit User Manual Chapter 3: Installation and Setup
Step 4 Press OK in the Connection Properties dialog.
After you finish the connect procedure, the Summit device to which you have
connected is marked as Ready and you can use it for recording:
Note: To disconnect from a device, display this dialog, select the device, and click
the Disconnect button.
Warning! Do not change from USB to Ethernet, or back, without power cycling
the analyzer.
Teledyne LeCroy 27
Page 36

Chapter 3: Installation and Setup Summit User Manual
3.3 Setting Up the Summit T2-16 Analyzer using a USB Connection
To set up the Analyzer using a USB connection:
Step 1 Remove the Analyzer from its shipping container.
Step 2 Insert and install the Installation CD.
Step 3 Connect the Analyzer to a 100-volt to 240-volt, 50 Hz to 60 Hz,
120 W power outlet using the provided power cord.
Note: The Analyzer is capable of supporting supply voltages between 100 volts
and 240 volts, 50 Hz or 60 Hz, thus supporting all known supply voltages around
the world.
Step 4 Connect the USB port to a USB port on the host machine using a USB
cable.
Note on Ethernet: To connect using Ethernet, see “Setting Up the Summit T2-16
Analyzer using an Ethernet Connection” on page 25.
Step 5 Turn on the rear power switch and the front power switch.
Note: At power-on, the Analyzer initializes itself in approximately five seconds
and performs an exhaustive self-diagnostic that lasts about forty seconds. The
results are reflected by messages on the Summit T2-16 LCD display (see
“Summit T2-16 Front Panel Description” on page 10). If the LCD display indicates
failure, call Teledyne LeCroy Customer Support for assistance.
Step 6 Click Next after you see the Add New Hardware Wizard window.
Step 7 Follow the Microsoft
for the automatic installation of the Analyzer as a USB device on your
analyzing host machine. (The required USB files are included on the
Installation CD and were installed on your system when you installed the
software CD.)
Step 8 Click Finish when you see the message that says “Windows has
finished installing the software that your new hardware requires” and the
file has been installed in your host machine.
Warning! Do not change from USB to Ethernet, or back, without power cycling
the analyzer.
®
Windows® on-screen Plug-and-Play instructions
28 Teledyne LeCroy
Page 37

Summit User Manual Chapter 3: Installation and Setup
3.4 Setting Up the PETracer Summit Analyzer
Step 1 Remove the Analyzer from its shipping container.
Step 2 Connect the Analyzer to a 100-volt to 240-volt, 50 Hz to 60 Hz,
120 W power outlet using the provided power cord.
Note: The Analyzer is capable of supporting supply voltages between 100 volts
and 240 volts, 50 Hz or 60 Hz, thus supporting all known supply voltages around
the world.
Step 3 Connect the Ethernet cable between the Ethernet port on the back of the
Analyzer and a Ethernet port (hub, switch or wall) in your local network.
Step 4 Turn on the rear power switch and the front power switch.
Note: At power-on, the Analyzer initializes itself in approximately five seconds
and performs an exhaustive self-diagnostic that lasts about fifteen seconds. The
results are reflected by messages on the PETracer Summit LCD display (see
“PETracer Summit Front Panel Description” on page 13). If the LCD display
indicates failure, call Teledyne LeCroy Customer Support for assistance.
Note: No driver installation is needed for the PETracer Summit device.
Connecting to a PETracer Summit Analyzer in the Local Network
After you have installed the PETra c e r application software, perform the following
procedure to connect to a PETracer Summit analyzer in the local network.
Step 1 Select the Setup > All connected devices… menu in the PETracer
application to display the Analyzer Devices dialog.
The PETracer software fills the list with devices that are connected over USB or
discovered on the Ethernet network. The discovery mechanism works only within
one network subnet. If a Summit is connected to the network on a different
subnet, you can manually add the subnet to the list by clicking the Add Device
button and specifying the IP address.
Teledyne LeCroy 29
Page 38

Chapter 3: Installation and Setup Summit User Manual
The Summit devices in the list are marked:
• Locked: Some other client on the network is already connected to that
device
• Ready to connect: Available for connection
Step 2 If a Summit device is marked Ready To Connect, you can select that
device and press the Connect button to execute the connection
procedure.
After the connection is established, the application displays the Connection
Properties dialog:
Step 3 Select an option:
• Automatically connect to the device: When the application is started or
when the named device is added to the network while the PETracer
application is running on this computer, the PETracer application will try to
connect to the named device.
• Ask if I want to connect to the device: When the application is started or
when the named device is added to the network while the PETracer
application is running on this computer, the PETracer application will display a
message box allowing you to connect to the named device.
• Take no action: When you start the application or when you want to add the
named device to the network while the PETracer application is running on this
computer, you must connect manually to use the named device.
Note: When you close the application on this computer (or you perform manual
disconnect), the application disconnects from the device.
30 Teledyne LeCroy
Page 39

Summit User Manual Chapter 3: Installation and Setup
Step 4 Press OK in the Connection Properties dialog.
After you finish the connect procedure, the Summit device to which you have
connected is marked as Ready and you can use it for recording:
Note: To disconnect from a device, display this dialog, select the device, and click
the Disconnect button.
Teledyne LeCroy 31
Page 40

Chapter 3: Installation and Setup Summit User Manual
3.5 Interposers and Probes
PETracer Summit and Summit T2-16 work with Interposers and Probes.
• Gen2 MidBus Probe: The Gen2 MidBus Probe is designed for use with the Summit
T2-16 Analyzer and supports lane widths from x1 to x16 at data rates of 2.5
GT/s (Gen1) or 5.0 GT/s (Gen2).
• Gen2 Multi-lead Probe: The Summit Multi-lead Probe is designed for use with the
Summit T2-16 Protocol Analyzer. The probe consists of 1 to 4 probe pods, which
are connected to the analyzer using either iPass Y-Cables (for x1 and x4) or straight
x4-to-x8 iPass cables (for x8 and x16). Each probe pod supports up to 8 Flex Tips,
with each Flex Tip connected via two coax cables.
•
Gen2 Passive Slot Interposer: The Gen2 Passive Slot Interposer is designed for use
with the Summit T2-16 Analyzer and supports lane widths from x1 to x16 at data
rates of 2.5 GT/s (Gen1) or 5.0 GT/s (Gen2). A separate interposer is used for each
lane width that you would like to probe. Lane reducers should NOT be used with the
Gen2 Passive Slot Interposer. For lane widths up to x8, one iPass Y-cable is
required. For x16 applications, two iPass Y-cables are required.
•
Gen2 Active Slot Interposer: The Gen2 Active Slot Interposer is designed for use
with the Summit T2-16 Analyzer and supports lane widths from x1 to x16 at data
rates of 2.5 GT/s (Gen1) or 5.0 GT/s (Gen2). Lane reducers/adapters may be used
with the Gen2 Active Slot Interposer. For lane widths up to x8, one iPass Y-cable is
required. For x16 applications, two iPass Y-cables are required.
The following sections describe how to set up probe systems.
32 Teledyne LeCroy
Page 41

Summit User Manual Chapter 3: Installation and Setup
3.6 Using Probes
Example: Connecting the Summit T2-16 Analyzer to the Device Under Test Using a Gen2 MidBus Probe
Components
• 1 or 2 iPass Y-cable
• 1 or 2 MidBus Probe pod
Teledyne LeCroy 33
Page 42

Chapter 3: Installation and Setup Summit User Manual
• 1 or 2 MidBus Probe Cable, Attachment Pad, and Header
• 1 or 2 Clock Cable
34 Teledyne LeCroy
Page 43

Summit User Manual Chapter 3: Installation and Setup
Connections Overview for Gen2 MidBus Probe
Use a 1-pod or 2-pod setup depending on the lane width of the recording:
• For x16 recordings, use the 2-pod setup.
• For all other lane width recordings, use a one-pod setup.
Use the iPass Y-cables to connect the probe data connectors on the Analyzer to the
MidBus pod(s).
On the other side of the pod, connect the MidBus probe assembly.
Connect the header on the MidBus probe assembly to the MidBus footprint on the
System Under Test (host platform/root complex). The following picture shows two midbus
footprints, with one connected to the MidBus probe assembly:
Connection Procedure
To connect the Summit T2-16 to the System Under Test (host platform/root complex):
Step 1 Connect the MidBus pods to the Analyzer using the iPass Y-cables.
Step 2 Connect the MidBus probe assemblies to the MidBus pods.
Step 3 Connect the MidBus probe assemblies to the MidBus footprints on the system
under test.
Step 4 Connect external reference clock signal to Mid-Bus External Clock In on
Mid-Bus probe pod, using external reference clock cable. For x16, you
need to chain the pods.
Teledyne LeCroy 35
Page 44

Chapter 3: Installation and Setup Summit User Manual
Example: Connecting the Summit T2-16 Analyzer to the
Device Under Test Using a Gen2 Multi-lead Probe for
and x4
x1
Components
• 1 iPass Y-cable for x1 and x4 (see “1 or 2 iPass Y-cable” on page 33)
• 1 Multi-lead Probe Pod for x1 and x4
• up to 16 MidBus Probe SSMP Cables, and up to 8 Flexible Leads, per pod
• 1 Clock Cable (see “1 or 2 Clock Cable” on page 34)
36 Teledyne LeCroy
Page 45

Summit User Manual Chapter 3: Installation and Setup
Connections Overview for Gen2 Multi-lead Probe
Use a 1-pod setup.
For x1 or x4, use the iPass Y-cable to connect the probe data connectors on the Analyzer
to the pod(s).
On the other side of the pod, connect the flexible lead tips.
Connection Procedure
To connect Summit T2-16 to the System Under Test (host platform/root complex):
Step 1 Connect the pods to the Analyzer using the iPass Y-cable cables.
Step 2 Connect the flexible lead tips to the pods using the SSMP cables.
Step 3 Connect the lead tips to the system under test by soldering to the trace.
Teledyne LeCroy 37
Page 46

Chapter 3: Installation and Setup Summit User Manual
Example: Connecting the Summit T2-16 Analyzer to the
Device Under Test Using a Gen2 Multi-lead Probe for
and x16
x8
Components
• 2 iPass Straight cables for x8 and 4 iPass Straight cables for x16
• 2 Multi-lead Probe pods for x8
4 Multi-lead Probe pods for x16
(see “1 Multi-lead Probe Pod for x1 and x4” on page 36)
• up to 16 MidBus Probe SSMP Cables, and up to 8 Flexible Leads, per pod
(see “up to 16 MidBus Probe SSMP Cables, and up to 8 Flexible Leads, per pod” on
page 36)
• 1 Clock Cable (see “1 or 2 Clock Cable” on page 34)
38 Teledyne LeCroy
Page 47

Summit User Manual Chapter 3: Installation and Setup
Connections Overview for Gen2 Multi-lead Probe
Use a 1-pod or 2-pod setup depending on the lane width of the recording:
• For x16 recordings, use the 2-pod setup.
• For all other lane width recordings, use a one-pod setup.
For x8 and x16, use the straight iPass cables to connect the probe data connectors on
the Analyzer to the pod(s).
On the other side of the pod, connect the flexible lead tips.
Connection Procedure
To connect Summit T2-16 to the System Under Test (host platform/root complex):
Step 1 Connect the pods to the Analyzer using the straight iPass cables.
Step 2 Connect the flexible lead tips to the pods using the SSMP cables.
Step 3 Connect the lead tips to the system under test by soldering to the trace.
Teledyne LeCroy 39
Page 48

Chapter 3: Installation and Setup Summit User Manual
3.7 Using Interposers
Example: Connecting the Summit T2-16 Analyzer to the Device Under Test Using a Gen2 Passive Interposer
Summit T2-16 Components
Summit T2-16 components used in the installation are:
• iPass Y-Cable: The cable supports eight lanes from two directions. Side A of the
probe cable connects to the Upstream port on the Analyzer (on the left in the photo
above), and Side B of the probe cable connects to the Downstream port (on the
right).
Note: x16 recordings require two cables.
• Summit T2-16 x16 Slot Gen2 Passive Interposer: The slot Interposer provides
the point of attachment for the Analyzer to the Device Under Test (DUT). The Interposer is designed to fit between a motherboard and one of its device cards - for
example, a LAN card. The Interposer has three sets of connectors: a gold male connector that fits into a standard x16 PCI Express slot on a motherboard, a black
female connector that accepts a x16 PCI Express device such as a graphics card,
and two Interposer cable connectors that connect the Interposer to the Analyzer.
40 Teledyne LeCroy
Page 49

Summit User Manual Chapter 3: Installation and Setup
Installing the Gen2 Passive Interposer
To install the Interposer, perform the following steps.
Step 1 Insert the gold male connector on the Interposer probe into a
x16 PCI Express slot in the motherboard. Use edge adapters for x1, x4,
and x8 slots.
Step 2 Insert the PCI Express DUT into the Interposer’s black female device
connector.
Step 3 The slot Interposer is shipped from Teledyne LeCroy with a metal face
plate for attachment to a PC case. If you are working with a motherboard
that is not in a PC case, you may prefer to remove the metal face plate
so the Interposer can sit flat with the motherboard. To remove the face
plate, unscrew the two screws that hold it onto the Interposer.
Connecting the Probe Data Cable
x8 recordings require one cable. To connect a single Interposer data cable, connect the
probe data cable to the Interposer card at [7:0]. Connect Side A of the probe cable to the
Upstream [7:0] port on the Analyzer, and connect Side B of the probe cable to the
Downstream [7:0] port.
x16 recordings require two cables. Connect the second probe data cable to the
Interposer card at [15:8]. Connect Side A of the second probe cable to the Upstream
[15:8] port on the Analyzer, and connect Side B of the second probe cable to the
Downstream [15:8] port.
Power On Analyzer and then DUT
Important: Power on the Analyzer before you power on the DUT.
Step 1 Power on the Summit T2-16 Analyzer.
Step 2 Power on the DUT.
Step 3 Open the PETracer software on the host machine. The Analyzer is now
ready for PCI Express traffic recording.
Teledyne LeCroy 41
Page 50

Chapter 3: Installation and Setup Summit User Manual
Example: Connecting the Summit T2-16 Analyzer to the Device Under Test Using a Gen2 Active Interposer
Summit T2-16 Components
Summit T2-16 components used in the installation are:
• iPass Y-Cable: The cable supports eight lanes from two directions. Side A of the
probe cable connects to the Upstream port on the Analyzer (on the left in the photo
above), and Side B of the probe cable connects to the Downstream port (on the
right).
Note: x16 recordings require two cables.
• Summit T2-16 x16 Slot Gen2 Active Interposer: The slot Interposer provides the
point of attachment for the Analyzer to the Device Under Test (DUT). The Interposer
is designed to fit between a motherboard and one of its device cards - for example,
a LAN card. The Interposer has three sets of connectors: a gold male connector that
fits into a standard x16 PCI Express slot on a motherboard, a black female connector that accepts a x16 PCI Express device such as a graphics card, and two Interposer cable connectors that connect the Interposer to the Analyzer.
Note: Edge reducers are required for lane widths less than x16.
42 Teledyne LeCroy
Page 51

Summit User Manual Chapter 3: Installation and Setup
Installing the Gen2 Active Interposer
To install the Interposer, perform the following steps.
Step 1 Insert the gold male connector on the Interposer probe into a
x16 PCI Express slot in the motherboard. Use edge adapters for x1, x4,
and x8 slots.
Step 2 Insert the PCI Express DUT into the Interposer’s black female device
connector.
Step 3 The slot Interposer is shipped from Teledyne LeCroy with a metal face
plate for attachment to a PC case. If you are working with a motherboard
that is not in a PC case, you may prefer to remove the metal face plate
so the Interposer can sit flat with the motherboard. To remove the face
plate, unscrew the two screws that hold it onto the Interposer.
Connecting the Probe Data Cable
x8 recordings require one cable. To connect a single Interposer data cable, connect the
probe data cable to the Interposer card at [7:0]. Connect Side A of the probe cable to the
Upstream [7:0] port on the Analyzer, and connect Side B of the probe cable to the
Downstream [7:0] port.
x16 recordings require two cables. Connect the second probe data cable to the
Interposer card at [15:8]. Connect Side A of the second probe cable to the Upstream
[15:8] port on the Analyzer, and connect Side B of the second probe cable to the
Downstream [15:8] port.
Power On Analyzer and then DUT
Important: Power on the Analyzer before you power on the DUT.
Step 1 Power on the Summit T2-16 Analyzer.
Step 2 Power on the DUT.
Step 3 Open the PETracer software on the host machine. The Analyzer is now
ready for PCI Express traffic recording.
Teledyne LeCroy 43
Page 52

Chapter 3: Installation and Setup Summit User Manual
44 Teledyne LeCroy
Page 53

Summit User Manual Section 2
Section 2. PETracer Analyzer Software
Teledyne LeCroy 45
Page 54

Section 2 Summit User Manual
46 Teledyne LeCroy
Page 55

Summit User Manual Chapter 4: Software Overview
Chapter 4: Software Overview
4.1 The PETracer Software
The PETracer™ software administers Analyzer platforms and handles all CATC Trace
analysis and display. The core software is thus the same for all of Teledyne LeCroy's
PCI Express products.
The software runs on a Windows
via an Ethernet or USB 2.0 connection (USB 1.0 is also supported). PETracer software
can be used without the Analyzer as a CATC Trace viewer for viewing, analyzing and
printing traces.
The PETracer software operates in Microsoft
®
-based host machine that is attached to the Analyzer
®
Windows® XP and Vista environments.
Teledyne LeCroy 47
Page 56

Chapter 4: Software Overview Summit User Manual
4.2 Application Layout
The PETracer application contains the following components:
Title bar: The title bar is at the top of the application window and displays the CATC Trace
file name or generation script name.
Menu bar: The menu bar is located below the title bar, by default. The menu bar can be
moved by clicking a blank area of the bar and then dragging the menu to a new position.
It can be docked in another part of the application window or moved outside of the window
to become a floating menu.
Toolbar: The toolbar is composed of buttons that represent the commonly used
commands. The toolbar divides into smaller toolbars that can be moved and docked in a
new position or made to float outside of the window.
Display area: The display area is the main part of the application window in which
CATC Traces are displayed.
Status bar: The status bar is located at the bottom of the application window. The left end
of the status bar displays descriptions of buttons and menu items when the mouse is
positioned over them. The right end of the bar shows the search direction.
4.3 Using the Toolbar
You can use the PETracer application Toolbar as a shortcut to most of the operations
supplied by the menus.
Opens a previously recorded
CATC Trace file.
Save As
Allows the open file to be saved
with a new name.
Edit as text.
Script Editor. Opens a text editor for editing traffic
generation files (*.peg)
48 Teledyne LeCroy
Page 57

Summit User Manual Chapter 4: Software Overview
Setup Recording Options
Opens the Recording Options
dialog box.
Setup Generation Options
Opens the Generation Options
dialog box.
Start Recording. Real Time Statistics monitor
Stop Recording. Disconnect/Connect Link.
Repeat Upload.
Opens a dialog box that allows you
to select a portion of memory to
upload from memory, then causes
the Analyzer to re-send the
CATC Trace from the Analyzer
buffer to the host machine
Setup Display Options
Opens the Display Options dialog box.
Opens a window that displays real-time
information.
Click once to break and momentarily later restore
link. Open menu to select either Connect or
Disconnect.
Zoom in display. Wraps display information.
Zoom out display.
Teledyne LeCroy 49
Page 58

Chapter 4: Software Overview Summit User Manual
Hide Training Sequence. Hide Downstream traffic/recording.
Hide SKIP and Update FC
packets.
Hide Upstream recording/traffic. Compact View
Find
Opens a dialog box that allows you
to select one or more items to find
in the recording, then searches to
that point.
View Packet Level data.
View Link Transaction Level data. View Split Transaction Level data
Advanced Hiding Options
Opens a dialog box that allows you to select
items to hide from view.
Toggles compacting of training sequences to
analyze
compacting to display more data.
Find Next. Repeats last Find or Search action.
CATC Trace data faster, or no
File Information
Lists the conditions under which
the recording was made.
Error Report
Opens a window that lists all errors
identified in the recording.
Traffic Summary
Opens a window that lists all
events that occurred during the
recording
Navigator. Shows/hides the
Navigator bar - a utility that lets you
easily navigate the CATC Trace.
Bus Utilization
Opens a window that graphically represents
various information about the recording.
Link Tracker
Opens a window that displays symbol information
per lane.
Opens the Data Flow window.
Shows recorded data in a compressed tabular
format.
LTSSM Flow Graph
Shows a state diagram of the LinkTraining
and Status State machine.
50 Teledyne LeCroy
Page 59

Summit User Manual Chapter 4: Software Overview
Displays the Data/Payload
window for the current packet.
Opens the Timing and Bus Usage
Calculations window.
Multi-Segment Toolbar
First Segment. Open first segment
in the multisegment CATC Trace.
Previous segment. Open previous
segment in the multisegment
CATC Trace.
Displays the Packet Header bar.
Opens a window that displays the header
information in the current packet, as it would be
viewed in the specification.
Running Verification Scripts
Opens a dialog that allows you to select and run
verification scripts.
Index file. This button becomes active if a
multisegment CATC Trace file is open and
displays the index file for the recording.
Next Segment. Open next segment in
multisegment CATC Trace.
Last segment. Open last segment in
multisegment CATC Trace.
Teledyne LeCroy 51
Page 60

Chapter 4: Software Overview Summit User Manual
Toolbar Hide Buttons
The PETracer application toolbar has five buttons related to show/hide of CATC Trace file
contents. The buttons allow you to quickly adjust the display to your needs.
Hide Training: Brings up a drop-down menu that lets you to hide all or a portion of the
packets in the training portion of the CATC Trace.
Hide SKIP and Update FC: Brings up a drop-down menu that lets you hide SKIP or
Update FC packets in a CATC Trace.
Hide Upstream: Hide all traffic from endpoint devices to the root complex.
{
Hide Downstream: Hide all traffic from the root complex to endpoint devices.
52 Teledyne LeCroy
Page 61

Summit User Manual Chapter 4: Software Overview
Advanced Hiding Options: Brings up the Level Hiding pane of the Display Options
window. Use this pane to tune the show/hide options within the CATC Trace display.
Teledyne LeCroy 53
Page 62

Chapter 4: Software Overview Summit User Manual
4.4 Using the Menus
The PETracer application main display includes the following set of pull-down menus:
File Menu
New Generator Script Creates a new Traffic Generation file.
Open Opens a file.
Close Closes the current file.
Save as Saves all or a specified range of packets to a uniquely named file.
Convert Old Files Convert CATC Trace files made in previous versions of PETracer to the new format for
PETracer version 6.5x and higher.
Print Prints part or all of the current traffic data file.
Print Preview Produces an on-screen preview before printing.
Print Setup Setup your current or new printer.
Edit Comment Create or edit the comment field in a CATC Trace file.
Export
>> to Text
>> Packets to CSV Text
>> to Generator
File Format
Exit Exit the PETracer application.
Saves all or part of a CATC Trace to a text file or traffic generation file. This text file
summarizes the traffic in the CATC Trace.
Saves the CATC Trace to a text file in Comma Separated Value (CSV) format.
Saves the CATC Trace to a generation file.
54 Teledyne LeCroy
Page 63

Summit User Manual Chapter 4: Software Overview
Setup Menu
Display Options Allows you to customize display options such as field colors, field formats and level
hiding.
Recording Options Allows you to customize control and setup features associated with recording,
triggering, and filtering recorded events.
Generation Options The Generation Options dialog box is used to set configuration settings in a traffic
generation script (*.peg). This dialog provides a convenient alternative means of
editing a traffic generation file.
Generation Macros Opens a dialog for creating buttons on the status bar that can be used to run traffic
generation macros.
Update Device Opens a dialog box that lets you update the BusEngine™ and Firmware.
Calibrate Device Opens a dialog box that lets you calibrate the BusEngine™ and Firmware.
Analyzer Network
Displays
you want to use for recording or traffic generation
All Connected Devices Opens a dialog box with a list of locally or remotely connected devices. Allows you to
update the BusEngine, Firmware, and your licensing information.
the list of host machines with connected analyzers or exercisers that
.
Record Menu
Start Causes the Analyzer to begin recording traffic.
Stop Causes the Analyzer to stop recording traffic.
Reupload Causes the Analyzer to re-send all, or selected portions, of the CATC Trace from the
Analyzer buffer to the host machine.
Disconnect/Connect
Reset Link Configuration Causes the Analyzer to reset the Serdes and thereby reset the Analyzers current link
Causes the Analyzer to momentarily break, and then establish the
connection in both link directions.
configuration. This command is needed when lane width or other lane settings are
changed. Otherwise, the old link configuration is used and errors are generated in the
CATC Trace.
PCI Express link
Teledyne LeCroy 55
Page 64

Chapter 4: Software Overview Summit User Manual
Report Menu
Report Menu operations are only available when you are working with a CATC Trace file.
File Information Displays information about the file contents and describes the conditions of the file’s
recording (Recording Options, hardware information, and so on).
Error Summary Displays an error summary of the current CATC Trace file and allows you to go to a
specific packet, and save the error file to a uniquely named file.
Traffic Summary Details the number and types of packets that were transferred during the recording.
You can hide, save, send, text, print, and view.
Bus Utilization Opens a window with graphs of bus usage for the open CATC Trace.
Link Tracker Opens a window for displaying a detailed chronological view of traffic. The window
provides view and navigation options.
Data Flow Opens the Data Flow Window, providing a tabular view of transactions and their
payload.
Trace Navigator Shows the Navigator bar for navigating a CATC Trace. Shows a snapshot of the
recording and allows you to adjust the memory area for the view.
LTSSM Flow Graph
Shows a state diagram of bus activity. Also allows you to navigate through
the LTSSM, based on the current recording.
Packet Header Opens the Packet Header bar, showing the Packet Header information as it would be
veiwed in the specification.
Packet Data/View Data Opens the Data Window for the current packet, with the options: Hide, Save,
Hexadecimal, ASCII, Decimal, Binary, MSB Format, LSB Format, Big Endian, and
Little Endian. Format Line allows you to enter the number of bytes, words, or dwords
per line.
Configuration Space Presents a list of Configuration Spaces. Clicking an item displays the selected
Configuration Space in a Configuration Table format.
56 Teledyne LeCroy
Page 65

Summit User Manual Chapter 4: Software Overview
Search Menu
Search Menu operations are only available when you are working with a CATC Trace file.
Go to Trigger Repositions the display to show the first packet following the trigger event.
Go to Packet Repositions the display to a specific packet, Link Transaction, or Split Transaction
number.
Go to Time Repositions the display to specific timestamp.
Go to Marker Repositions the display to a previously marked packet, Link Transaction, or
Split Transaction.
Go to Allows searching for specific link events: TLP Type, DLLP Type, .Ordered Set,
Link Event, Traffic Class, DLLP Virtual Channel, TLP Virtual Channel, Direction,
Speed, Link Width, Requester ID, Completer ID, Data Lengths, Errors.
Find Displays the Find dialog to allow searching for various events within a CATC Trace.
You can search by Display Level: Packets, Link Transactions, Split Transactions.
You can search packets by Event Group: TLP Type, TLP Header, TLP Requester ID,
TLP Completer ID, TLP Data Pattern, TLP Data Lengths, TLP Tag,
TLP Sequence Number, DLLP Type, DLLP Header, DLLP Virtual Channel,
ACK/NAK Seq Number, Ordered Sets, Link Event, Direction, Errors.
You can search link transactions by Event Group: TLP Type, Traffic Class,
Virtual Channel, Direction, Requester ID, Completer ID, Status, Tag.
You can search split transactions by Event Group: TLP Type, Traffic Class,
Virtual Channel, Direction, Requester ID, Completer ID, Status, Tag.
Find allows you to create complex searches based on numerous criteria.
Find Next Repeats the previous Find or Search operation.
Search Direction Allows you to specify a forward or backward search of a CATC Trace file.
Teledyne LeCroy 57
Page 66

Chapter 4: Software Overview Summit User Manual
View Menu
Toolbars>> Displays available toolbars: Standard, Frequently Used, Analysis, and Transaction
Level. Use Customize to display the Windows Customize window.
Script Editor Displays the Script Editor (only appears if a .peg file is open).
Analyzer Network
Chat Bar
Status Bar Switches display of the Status Bar on or off.
Real Time Statistics Opens the Real Time Statistics monitor dialog and displays a real-time graph of link
Zoom In Zoom in increases the size of the displayed elements.
Zoom Out Zoom out decreases the size of the displayed elements.
Wrap Allows the display to wrap.
FC Credits Toggles a display for tracking Flow Control Credit update and consumption on a PCI
FC Credits Setup Allows you to customize the display for tracking Flow Control Credits.
Compact View
Opens a chat window for communicating with persons working with networked
Analyzers. This command requires that your host machine be attached to a LAN. The
Chat window broadcasts messages to whatever hosts have been connected to via the
Analyzer Network command (under Setup in the menu).
activity.
Express link.
Toggles compacting of the Link Training sequence to analyze CATC Trace
data faster or no compacting to display more data.
Packet Level View the current recording at the Packet Level.
Link Transaction Level View the current recording at the Link Transaction Level.
Split Transaction Level View the current recording at the Split Transaction Level.
58 Teledyne LeCroy
Page 67

Summit User Manual Chapter 4: Software Overview
Tools Menu
TC to VC Mapping Allows Traffic Classes to be mapped to Virtual Channels for purposes of simplifying
navigation (for example, Search > Go to > TLP Virtual Channel) and changing the way
the CATC Trace is displayed (for example, in Split Transactions).
Timing Calculations Starts the mode-less calculator dialog for calculating various timing and bandwidth
parameters in the recording file.
Run Verification Scripts Presents a list of verification scripts, from which you can run a verification script.
Window Menu
New Window Opens a copy of the current CATC Trace window.
Cascade Displays all open CATC Trace windows in an overlapping arrangement.
Tile Displays all open CATC Trace windows as a series of strips across the display.
Arrange Icons Arranges minimized CATC Trace windows at the bottom of the display.
Synchronize Traces Synchronizes the CATC Trace View windows so that a move in one window
repositions the other window of the same recording.
Help Menu
Help Topics Accesses the PETracer application's Online Help.
Register Product Online Register at the Teledyne LeCroy website registration page.
Check for Updates
Update License Displays a dialog box for entering updated license information.
Display License Information Opens an information box describing the current license information.
About Displays version information about the attached Analyzer and its Firmware and
Check whether a new software version is available. If so, you can download
from the Teledyne LeCroy web site.
You can select to Check for updates at application startup
BusEngine™.
Teledyne LeCroy 59
Page 68

Chapter 4: Software Overview Summit User Manual
4.5 Tool Tips
Tool tips provide details about fields within the CATC Trace. To see a tool tip, position your
mouse pointer over a field within the CATC Trace.
You can turn off this capability in the Display Options menu.
4.6 Keyboard Shortcuts
Keystrokes Operation
Ctrl + N New PETracer script
Ctrl+O Open file
Ctrl+P Print
Ctrl+S Save file
Ctrl + R Start Analyzer recording
Ctrl + T Stop Analyzer recording
Ctrl+Home Jump to first packet
Ctrl+End Jump to last packet
Ctrl + G Go to packet ...
Ctrl+F Search forward
F3 Find next
F6 Next pane
Shift+F6 Previous pane
Ctrl+B Search backward
60 Teledyne LeCroy
Page 69

Summit User Manual Chapter 4: Software Overview
4.7 Status Bar
The Status Bar is a gray bar that runs along the bottom of the application window.
From left to right:
PETracer SN:309: Analyzer Serial Number
Ready: Analyzer Status
Recording Progress Bar: The colored bar to the right of the serial number represents
how much traffic has been recorded. The trigger point is indicated by the black line at the
left side of the bar. In this example, the trigger occurred at the very beginning of the
CATC Trace. If the trigger is set in the middle of the CATC Trace, the line is positioned in
the middle of the bar. Additionally, the color of the bar is different on each side of the
trigger point. For examples, see “Recording Progress Bar” on page 61. The white strip
along the top edge of the color bar indicates how much traffic has been uploaded from
the Analyzer buffer to the host machine.
Uploading and 20%: Indicates the Analyzer's recording status, what part of the
recording process the Analyzer is now in. In this example, the Analyzer is in the upload
stage and has completed 20% of the upload from the Analyzer to the host machine. See
“Recording Status” on page 61 for details on other status messages.
Activity: The colored bar moves to indicate that the Analyzer is currently recording.
Search: Fwd: Indicates search direction. The direction can be toggled to Search: Bwd
by double-clicking the search direction or by selecting Search Direction from the Search
menu.
Recording Progress Bar
This indicator bar changes color to reflect the recording progress.
• Black vertical line is at the location of Trigger position.
• Black vertical line wiggles when Trigger Position is nearly reached.
• Field to right of Trigger Position changes color to indicate post-trigger activity.
• Upper half of progress indicator turns white when recording is complete.
Recording Status
The second segment from the left in the Status Bar indicates recording status.
During recording, this status flashes one of the following messages:
• Trigger?
• Triggered!
• Uploading
After recording stops, the message changes to
• Uploading data - x% done (where x equals the percent that has been uploaded.)
As uploading progresses, the percent increases to 100. You can abort this upload if you
wish by pressing the <escape> button on your keyboard or
clicking in the Tool Bar.
Teledyne LeCroy 61
Page 70

Chapter 4: Software Overview Summit User Manual
Recording Activity
The third segment displays recorded activity. Activity is indicated in blue:
Search Direction Indicator
The fourth segment in the status bar indicates search direction. The direction can be
changed by selecting Search Direction from the Search menu.
62 Teledyne LeCroy
Page 71

Summit User Manual Chapter 4: Software Overview
4.8 Making a PCI Express Recording
After connecting the Analyzer to the device(s), you must configure the
Recording Options. Then you can test the Analyzer by creating a 16-MB snapshot
recording.
To make this recording, follow these steps:
Step 1 From the Setup menu, select Recording Options.
Step 2 Select the General tab.
The following window displays the factory default settings in Simple Mode, such
as Snapshot and 16-MB buffer size. For your first recording, you can leave these
settings unchanged.
Step 3 In the Link section, specify the lane width of the PCI Express link to be
analyzed. The rest of the settings in this section can be left at the factory
defaults for most PCI Express systems.
Teledyne LeCroy 63
Page 72

Chapter 4: Software Overview Summit User Manual
Step 4 For multi-lane PCI Express links, the Analyzer needs to observe
link training in order to record link traffic correctly.
Note: For PETracer Summit, If link training (or re-training) is not easily
controllable for the devices under test, the Analyzer includes the capability to
force link training by disconnecting and reconnecting the PCI Express link.
Clicking the Connect/Disconnect button disconnects the PCI Express
link for one second in both directions, then re-establishes the link.
Note: For x1 PCI Express links, it is not necessary for the Analyzer to observe
link training in order to record link traffic; this step may be skipped.
Step 5 Click OK at the bottom of the Recording Options dialog box to apply the
Analyzer recording settings specified.
Step 6 Click the Record button.
Stopping a Recording
You can stop the recording process at any time by pressing the Stop button on the
toolbar. This causes the Analyzer to stop the recording and upload the CATC Trace to the
host machine.
You can interupt a session by pressing the Escape key. If Recording is finished and
Upload has started but has not finished, a message box appears:
You can:
• Stop: Aborts further CATC Trace upload and displays whatever data that has
already been uploaded.
• Continue: Resumes the upload. This command tells the Analyzer to finish
uploading whatever CATC Trace data is still in its buffer.
• Flush: Flushes the CATC Trace without saving or displaying it.
If you allow the traffic data to be uploaded, it is automatically saved on the host machine’s
hard drive as a file named data.pex or the name you assign as the default filename in the
recording options.
Saving a Recording
Step 1 To save a current recording for future reference, select Save As from the
File menu.
Step 2 Give the recording a unique name, then save it to the appropriate
directory.
64 Teledyne LeCroy
Page 73

Summit User Manual Chapter 4: Software Overview
4.9 Recording Multi-Segmented CATC Traces
If Save as Multisegment trace is enabled, PETracer divides the CATC Trace as it
records it into segments and stores them on the host's hard drive.
This option is useful for very large recordings and for host machines with limited memory.
In the latter case, multi-segmenting gives a host machine with limited memory a way to
open recordings that are otherwise too large to open.
The only downside to multi-segmenting is that limits the scope of reports such as
Traffic Summary, Bus Utilization, and Error Summary to each of the segments. You
cannot perform summary statistics on the full recording.
The default segment size is 10 MB. Before attempting large recordings, it is
recommended that you play with this number to see what value best suits your needs.
How to Create a Multisegment Recording
To create a Multisegment recording:
Step 1 Select Setup > Recording Options to open the Recording Options
dialog at the General tab. Click Switch to Advanced Mode.
Step 2 Check the box marked Save as Multisegment trace.
Step 3 In the box marked MB Segments, enter a value of 4 to 128 MB.
What Gets Created
Multisegmenting produces an index file and segmented CATC Trace files. The default
name of the index file is data.pem.
The index file and the segmented CATC Trace files are stored in a directory named after
the index file. The directory is named data_pem_files. Below this directory additional,
sequentially numbered sub-directories (up to 100,000) hold the segmented CATC Trace
files. These sub-directories bear simple numerical names: 00000 to 00999. Each of these
subdirectories can hold up to 100 sequentially numbered segment files. Collectively, the
entire directory structure can hold up to 10 million files.
Teledyne LeCroy 65
Page 74

Chapter 4: Software Overview Summit User Manual
Example
If you create a 1010 MB recording using 10 MB segments, the following files and
sub-directories are created:
data.pem (This is the index file.)
data_pem_files\00000\segment_00000.pex
data_pem_files\00000\segment_00001.pex
...
data_pem_files\00000\segment_00099.pex
data_pem_files\00001\segment_00100.pex
data_pem_files\00001\segment_00101.pex
Note: An additional index file is created called segments.col. This is an internal
system file that users should not modify.
66 Teledyne LeCroy
Page 75

Summit User Manual Chapter 4: Software Overview
4.10 PETracer Files
The PETracer software creates and uses different kinds of files:
• CATC Trace Files: Recorded traffic
• Recording Options Files: Configuration file that contains the various options
selected in the Recording Options dialog box to configure the recording
• Display Options Files: Configuration file that contains the options selected in the
Display Options dialog box to configure how traffic is displayed
CATC Trace Files
PETracer records PCI Express traffic into a CATC Trace file with the default name
data.pex or any other that you specified in the Recording Options. This file is overwritten
with new data each time PCI Express traffic is recorded.
When Multisegment CATC Traces are created, a special index file is also created called
<filename>.pem. This index file provides a high level view of the CATC Trace segments
created in the recording session.
If you want to save a CATC Trace, use the File > Save As function. This option allows
you to save the current CATC Trace to a unique file name, thereby ensuring that it is not
overwritten. This option also allows you to save a range of packets in a CATC Trace file.
You can pre-define the name of the recorded CATC Trace file using the Trace Filename
and Path option in Recording Options.
Recording Options Files
Recording Options files are created when you set recording options. These files use the
.rec extension and contain recording option information.
Display Options Files
Display Options files are created when you set display options. These files use the .opt
extension and contain the display options information.
Teledyne LeCroy 67
Page 76

Chapter 4: Software Overview Summit User Manual
4.11 Opening CATC Trace Files
To open an existing CATC Trace file, click File > Open or .
If the file was made in a previous version of PETrace r, the application presents the
Convert dialog box:
You must convert CATC Trace files made in previous versions of PETracer for them to
open in PETracer version 6.5x or higher. The converted file has all the information that
was in the original file.
You can:
• Convert & Backup old file: Convert the file, open it in PETracer version 6.5x
or higher, and save it with the original name. Save the original file with the
same name plus the extension .bak.
• Convert: Convert the file, open it in PETracer version 6.5x or higher, and save
it with the original name.
Note: After you convert a CATC Trace file, you cannot open the converted file in a
previous PETracer version.
68 Teledyne LeCroy
Page 77

Summit User Manual Chapter 4: Software Overview
4.12 Saving CATC Trace Files
Using the Save As Function
When you record a CATC Trace file, the Analyzer software provides a pre-defined name
to the CATC Trace file (data.pex or any other that you specified in the Recording
Options). If you do consecutive recordings, each time the previous recording is
overwritten. If you see a recording you want to analyze later, you need to give a unique
name to the CATC Trace file, so it is not overwritten with the next recording.
Also, when you analyze a recorded CATC Trace file, you might be interested in
preserving just a part of the PCI Express traffic that was recorded. If you save a portion
of a CATC Trace file, it can get significantly smaller, allowing you to attach it to an e-mail.
To save a portion of a CATC Trace file or the whole file to a unique name, select Save As
from the File menu.
If you want to give a unique name to the CATC Trace file, select the All option and keep
Rename original file checked. This is the default setting for the dialog.
Saving a Portion of a CATC Trace
If you want to save a portion of a CATC Trace file, select Save packet range. Enter
starting and ending packet numbers in the From Packet and To Packet fields. By default,
it has the numbers of the first and the last packets in the file. The software is going to save
all the packets in specified range to the new file, unless you have Do not save hidden
packets checked. In this case it is going to save all packets in the range, EXCLUDING
the currently hidden packets.
Teledyne LeCroy 69
Page 78

Chapter 4: Software Overview Summit User Manual
4.13 Exporting a CATC Trace File
By default, PETracer saves CATC Trace files in the .pex format. However, you can export
a CATC Trace to a file in any of the following other formats:
•Text
• Comma Separated Value (CSV)
• Generator file format
Exporting to Generator file format is a simple way to create a script file from your
CATC Trace.
To export a CATC Trace file, select File > Export:
70 Teledyne LeCroy
Page 79

Summit User Manual Chapter 4: Software Overview
4.14 Printing Data Files
To print all or part of the open CATC Trace:
Step 1 Select File > Print from the menu or
click the Printer button on the toolbar.
The Print Packets dialog opens:
Step 2 To select a range of packets, enter values in the From packet # and To
packet # fields and click Print.
Step 3 To print an entire file, leave the From and To fields empty and click Print.
The specified traffic information is printed as currently displayed, in color or gray scale as
supported by your printer. Any CATC Trace File comments you entered are printed
following the current document name at the top of each page.
Note: CATC Trace File comments can be created by using Edit Comment on the File
menu.
Teledyne LeCroy 71
Page 80

Chapter 4: Software Overview Summit User Manual
4.15 Analyzer Chat Window
PETracer has a Chat window that allows you to communicate with users on remote host
machines. For Chat to work, two conditions must be met:
1. The host machine must have PETracer software installed and running.
2. The host machines must be listed in each other's Network Browse list. This means that
your host machine must have the remote host machine listed in its Network Browse
window and the remote host machine must have your host machine listed in its Network
Browse window.
If the above conditions are met, a Chat session is initiated by running the command:
View > Analyzer Network Chat Bar. The following dialog opens.
Enter some text, then press Send. The message is then broadcast to all host machines
listed in your network browse window. If a target host machine also lists your host
machine in its Network Browse window, then it can receive your message. When the
message arrives, the Chat window automatically opens.
72 Teledyne LeCroy
Page 81

Summit User Manual Chapter 5: Reading CATC Traces
Chapter 5: Reading CATC Traces
5.1 Viewing PCI Express CATC Traces
PETracer™ displays traffic as labeled, color-coded, and time-stamped rows.
Tool tips provide details about fields within the CATC Trace. Hold the mouse cursor over
a field to see a tool tip.
Additional information is available from pop-up menus. For example, if you click the left
mouse button on the first cell in a packet a menu appears with an option to view
Raw 10b Codes.
5.2 Expand and Collapse Data Fields
Packet data fields are displayed in a short format by default.
You can view a data field’s long format by performing one of the following three actions:
• Click the small triangle in the left corner.
• Double-click anywhere in the data field.
• Click once in the Data Field with the left mouse button, then choose
Expand Data from the pop-up menu.
A repeat of any above methods causes the display to return to a Short Data format.
5.3 Resizing Cells
Data cells can be resized by pointing the mouse pointer on the edge of a data cell,
depressing and holding the left mouse button, and then repositioning the mouse pointer
while keeping the mouse button depressed.
Teledyne LeCroy 73
Page 82

Chapter 5: Reading CATC Traces Summit User Manual
5.4 Pop-up Menus
The Analyzer software makes extensive use of pop-up menus. In some instances,
pop-up menus provide the only means of accessing dialog boxes that contain detailed
information about cells within the CATC Trace, for example, the Show Configuration
Space dialog box.
To see a pop-up menu, left-click or right-click a cell within the CATC Trace. Right-click or
left-click behavior depends on the Display Options setting. For default left-click, the
right-click menu is not cell-dependent. For other left-click behavior, the type of menu that
opens varies depending on the type of cell that is selected. Take some time to explore
CATC Traces and the various pop-up menus.
5.5 View Data Block
To view the raw bits that make up the data in a data field, left-click a data field, then click
or select View Data Block from the pop-up menu to display the Data Block window.
You can display data in Hexidecimal, ASCII, Decimal, or Binary formats.
Bit Order is Most Significant Bit or Least Significant Bit.
You can display data in Big Endian or Little Endian.
Format lets you display data as BYTEs, WORDs, or DWORDs.
Columns lets you select the number of columns.
You can enter hexidecimal offset values.
You can go to or search Previous or Next.
74 Teledyne LeCroy
Page 83

Summit User Manual Chapter 5: Reading CATC Traces
5.6 Show Raw 10b Codes
You can view the raw bits that make up the data field by left-clicking the field and selecting
View Data Block from the pop-up menu.
To view Raw 10b Codes:
Step 1 Left-click the first cell in a packet.
Step 2 Select Show Raw 10b Codes from the pop-up menu to display the
Raw 10b Codes window.
Step 3 To change the format of the data, use the options along the right side of
the dialog.
Step 4 To navigate the CATC Trace, use the Prev and Next buttons.
Teledyne LeCroy 75
Page 84

Chapter 5: Reading CATC Traces Summit User Manual
5.7 Show Header Fields
You can view details about header fields by opening the Show Header Fields dialog box.
Step 1 Click a header. A pop-up menu appears.
Step 2 Select Show Header Fields. The following dialog box opens.
Step 3 Use the Prev and Next buttons to navigate to other headers.
76 Teledyne LeCroy
Page 85

Summit User Manual Chapter 5: Reading CATC Traces
5.8 Packet Cell Popup Menus
The Packet cell has a left-click pop-up menu that includes the Show Raw 10b Codes
command:
The right-click pop-up menu from Packet cell is:
Packet Header R-> Cell Popup Menu
The Packet Header R-> cell has a pop-up menu with the Swap Upstream/Downstream
command, which changes the directionality of the packets in the CATC Trace.
Teledyne LeCroy 77
Page 86

Chapter 5: Reading CATC Traces Summit User Manual
Packet Header G1 Cell Popup Menu
The Packet Header G1 cell has a pop-up menu with the Show Header Fields command
(see “Show Header Fields” on page 76), which exposes a detailed view of the selected
Header field.
78 Teledyne LeCroy
Page 87

Summit User Manual Chapter 5: Reading CATC Traces
5.9 Set Marker
A marker is a unique label for a packet that allows you to go to that packet and also serves
as a comment string for a specific packet. When you select a marker, the identified
packet appears at the top of the screen. Packets that have been marked have a red bar
on the left edge.
To set a marker, perform the following steps:
Step 1 Left-click the Packet field of the packet you want to mark.
Step 2 Click Set Marker.
Step 3 When the Edit Marker for Packet # pop-up appears, enter a unique
identifier for the packet in the Comment field.
Later, you can go directly to this packet using the Go To Marker operation in the Search
Menu.
Teledyne LeCroy 79
Page 88

Chapter 5: Reading CATC Traces Summit User Manual
5.10 Edit or Clear Marker
To change a markers identifier, or clear (delete) the marker:
Step 1 Left-click the Packet field of the desired packet to display a pop-up
menu:
Step 2 Choose Edit Marker and enter a new identifier into the
Edit Marker for Packer # pop-up, or
Choose Clear Marker. When you choose Clear Marker, the marker is
removed and the red line disappears.
80 Teledyne LeCroy
Page 89

Summit User Manual Chapter 5: Reading CATC Traces
5.11 Decoding Traffic
The PETracer software has three decode levels:
Packet
Packet level decode includes all TLP packets, DLLP packets, and all ordered sets.
Link
Link level decode is composed of TLP packets matched with a corresponding ACK
or NAK coming from the opposite direction.
Split
Split level decode is composed of two Link transactions, the Request TLP and the
Completion TLP from the other direction.
Teledyne LeCroy 81
Page 90

Chapter 5: Reading CATC Traces Summit User Manual
82 Teledyne LeCroy
Page 91

Summit User Manual Chapter 6: Searching CATC Traces
Chapter 6: Searching CATC Traces
This chapter describes how to search for CATC Trace events.
6.1 CATC Trace Search Overview
Several search commands let you navigate a CATC Trace view to search for key events,
such as errors and triggers.
To view the search options, click Search in the Menu bar.
6.2 Go to Trigger
To position a trigger packet at the top of the screen:
•Select Search > Go to Trigger.
6.3 Go to Packet
To position a packet at the top of the screen:
Step 1 Select Go to Packet from the Search menu. A pop-up menu prompts
you for the packet number, marker, or time.
Step 2 Enter the packet number, marker, or time.
Step 3 Click OK.
Teledyne LeCroy 83
Page 92

Chapter 6: Searching CATC Traces Summit User Manual
6.4 Go to Time
To position a specific time at the top of the screen:
Step 1 Select Go to Time from the Search menu. A pop-up menu prompts you
for the time in Seconds or Clocks.
Step 2 Enter the time and format (seconds or clocks).
Step 3 Click Go.
6.5 Go to Marker
Usethisoperationtogodirectlytoaspecificpacketthathas
beenmarkedwithauniquemarkerbytheSetMarker
operation.
Togotoamarker:
1. SelectGoToMarkerfromtheSearchMenu.
2. Selectthemarkeryouwantfromthefly‐outmenu.
Alternatively,selectAllMarkerstodisplaytheAll
Markerswindow,thenselectamarkerandclickGoto.
84 Teledyne LeCroy
Page 93

Summit User Manual Chapter 6: Searching CATC Traces
Thepacketyouwantappearsatthetopofthescreen.
Markedpacketshavearedbarontheleftedge.
Markers
ThissectionexplainsthefeaturesofMarkers.Amarkerisan
entitythatflagsaphysicalorlogicalitemofinterestwithina
tracefile.Amarkercontainsoneormoreattachments.You
canaddamarkertoatracefileorunmarkatracefileby
removingthemarker.
Markers
application.Youcannotonlyaddmarkerstothepacketsbutit
isgranularenablingyoutoalsoaddmarkerstoindividual
cells.
Markers Overview
Thisfunctionalityprovidestheuseraneasywaytonavigate
throughattachmentswhichisadiscretepieceofinformation
ordataaddedtoamarker,forexample,atextdescriptionor
file,anattachmentofatracefile byapredefinedorder,video
oraudiofiles,URLlinksoranyother
arerepresentedgraphicallyinadifferentwayinthe
files.
Teledyne LeCroy 85
Page 94

Chapter 6: Searching CATC Traces Summit User Manual
Functionality of Markers
Themarkersfunctionalityallowsyoutoaddmarkersto:
• Whole packets or frames
• Specific Cells
• Specific values within a cell: Bytes, words, etc.
Youcanaddattachmentstomarkers.
Right‐clickonanycellofapacketandselectSetMarkerfrom
themenuasshownbelow.
selectanoption.
TheCreateMarkerdialogdisplays(seeFigureonpage87).
86 Teledyne LeCroy
Page 95

Summit User Manual Chapter 6: Searching CATC Traces
Create Marker for Packet Dialog
Asshownaboveyoucan:
Addicon.Clickonthis
icontoaddanyfile.See
“AddinganAttachment”
onpage88.
Recordicon.Clickonthis
icontorecordaudio.See
“RecordinganAudio
File”onpage89.
NewURLicon.Clickon
thisicontoaddanyURL.
Exporticon.Clickonthisiconto
exportanattachment.
Deleteicon.Clickonthisiconto
delete
anattachment
Teledyne LeCroy 87
Page 96

Chapter 6: Searching CATC Traces Summit User Manual
Attaching Markers
Youcanattachadiscretepieceofinformation/datatoa
marker,forexample,atextdescriptionorfile,anat tachment
ofatracefilebyapredefinedorder,videooraudiofiles,URL
linksoranyotherfiles.Youcanalsoremoveanattachment
fromaMarker.
Adding an Attachment
Performthefollowingstepstoaddanattachmenttoa
marker:
1. Right‐clickonanycellinthetraceandselectSet
Marker.
TheCreateMarkerwindowdisplays.
2. ClickontheAddicon.
TheAddFiletotheMarkerdialogdisplays.
3. Gotothefileandselectittoaddittothemarkerasan
attachment.
4. ClickOpen.
ThefilewillappearintheCreateMarkerforTransfer...
dialogasshownbelow.TheMarker#appearsinthetop
panel,theiconsaredisplayedinthesecondpaneland
youcanclickontheicononthethirdpaneltoviewthe
fileyouareabouttoattach.
5. ClickOKtoaddtheattachments.
88 Teledyne LeCroy
Page 97

Summit User Manual Chapter 6: Searching CATC Traces
Create Marker for Transfer Dialog
Recording an Audio File
Theaudioqualitysupportsvoiceattachmentandisnot
designedforhigh‐qualityaudioPlaybackofaudiocontentis
notlimitedanddependsontheformatssupportedbythe
installedplaybackengine.
Clicktherecordiconandspeakintothemicrophoneto
recordanaudiofile.
Note: This functionality is disabled if a microphone is not installed.
Video Files supported
Theusercanattachvideoclipstothetracefile(“addtothe
marker”).TheplaybackoftheVideoclipsislimitedtothe
formatsthataresupportedbythevideocodecsinstalledin
thesystem.
Teledyne LeCroy 89
Page 98

Chapter 6: Searching CATC Traces Summit User Manual
Marked Cell
Attachment Types and Visualization
Themarkersarerepresentedgraphicallybyayellowtriangle
atthetoprightofthemarkeditemandaredverticalbarat
theleft‐mostcellofapacketasshownbelow.
Amarkermaycompriseanynumberofattachmentsofany
types.
Embedded Attachments to a Marker
Embeddedfilesareattachedtotheitemmarkedand
transportedwiththetrace.Youcanembedthefollowing
typesoffilestoamarker:
• Audio Files
• Video Files
• Image Files
• YouTube Files
•Web Pages
•Text Attachments
• Other Attachments
Attachmentsareembeddedinthemarkerandsavedinthe
tracefile.Onceattachmentsareplacedinamarker,the
markercanthenbepresentedtoauserinastory
structuredform.Onopeningthemarkerthewindow
resemblesthemarkereditingdialog.
Note: TheuseofAudioandVi deomarkersislimitedtothefiletypes
supportedonauser’ssystem.CATCWalkhasbeentestedwith
.mp3and.wmvfiles,whicharesupportedbyWindowsas
installed.Ifadditionalcodecsareinstalled,theyshouldalsowork,
butitistheuser’sresponsibilitytochooseformatsthatwillwork
forwhomever
theyintendtoexchangeCATCtracefiles(no
differentthanemailattachmentsinthisregard).Becauseofthis
dependencyoninstalledcodecs,therearesituationswherebugs
inthecodec ssuppliedbyMicrosoftorthird‐partyapplicationscan
preventproperoperationoftheTeledyneLeCroyPETracer
application.SeetheTeledyne
LeCroyPETracerApplication
90 Teledyne LeCroy
Page 99

Summit User Manual Chapter 6: Searching CATC Traces
Read‐Mefileformoreinformationifyouhaveproblemswith
applicationcrashes,etc.
Viewing Attachments of a Marker
Ifyouhoveroverthemarkedcell(yellowtriangleatthetop
rightofthemarkeditem),referto“At ta chm en tTypesand
Visualization”onpage90,awindowpopsupdisplayingthe
contentsofthemarkedcellasshownbelow.
Toviewanattachmentyoucanclickonanyoftheiconsinthe
attachmentbarandoryoucandouble‐clickontheiconitself
toopentheattachment.
Pop-up Displaying Marker Contents
Text
Thetextattachmentisdisplayedintheiconbarandinthe
mainpop‐upwindow.Tex tattachmentsarealwaysshownat
thetop.Theattachmentfilenameisdisplayedinthefieldas
shownbelow.
Teledyne LeCroy 91
Page 100

Chapter 6: Searching CATC Traces Summit User Manual
Text Attachment Pop-up Window
Ifthereisnoattachment,NoAttachmentsdisplaysinthe
statusbaratthebottom.
No Attachments Pop-up Window
Ifthereareattachments,thestatusbarishidden.Youcan
movethecursortoanattachmenticoninthelistviewanda
previewoftheattachmentstarts.
Preview Attachments Pop-up Window
92 Teledyne LeCroy
 Loading...