

Page 1
Operator's
Manual
JITKIT Software
Page 2

JITKIT Software Operator's Manual
© 2013 Teledyne LeCroy, Inc. All rights reserved.
Unauthorized duplication of Teledyne LeCroy documentation materials other than for internal sales and distribution
purposes is strictly prohibited. However, clients are encouraged to distribute and duplicate Teledyne LeCroy
documentation for their own internal educational purposes.
JITKIT and Teledyne LeCroy are trademarks of Teledyne LeCroy, Inc. Windows is a registered trademark of Microsoft
Corporation. Other product or brand names are trademarks or requested trademarks of their respective holders.
Information in this publication supersedes all earlier versions. Specifications are subject to change without notice.
922810 Rev A
October 2013
Page 3

Operator's Manual
Contents
JITKIT Overview 2
Key Features 3
JITKIT Example 3
Setting up JITKIT 4
Quick View 5
JITKIT Source Setup 7
JITKIT Gating 9
JITKIT Measure 10
Jitter Parameters 10
JITKIT Measurement Table 10
Set Up Jitter Measurements 11
JITKIT Plot 12
JITKIT Plot Types 12
Set Up Jitter Plot 13
922810 Rev A
1
Page 4

JITKIT Software
JITKIT Overview
Teledyne LeCroy's JITKIT option makes it simple and easy to understand basic system jitter performance
of clock signals or clock-clock and clock-data timing activity. JITKIT is specifically designed for these types
of measurements. Teledyne LeCroy offers other software options for in-depth and comprehensive jitter
decomposition and analysis of serial data signals.
Jitter is a deviation in timing, period, width, or amplitude from a “perfect” or a “reference” position(s). By
measuring jitter on a clock signal, between clock signals, or between clock and data signals, a value or
statistically relevant set of jitter values can be obtained that allow you to understand whether the circuit
is operating in its designed range. Jitter is measured as a set of parametric values and viewed in a variety
of domains using additional functions.“Jitter” is an all encompassing term and includes measurements of
the following types:
l Phase (Time Interval Error) Jitter – clock signal variation referenced to a “perfect” clock
l Period or Half Period (Width) Jitter – clock signal variation referenced to a “mean” clock value
l Cycle-Cycle Jitter – clock signal variation referenced to the previous clock period (cycle)
l Timing Jitter – variation in the timing between two clock or clock and data signals. This could be
skew variation or setup/hold timing variations, for instance.
l Amplitude Jitter – variation in the amplitude of a signal
l Other Jitter – variation in some other parametric value, such as rise time, overshoot, differential
crossing point, etc.
Jitter that manifests itself in a phase jitter measurement may not be manifested in a period jitter or cyclecycle jitter measurement, or vice versa. For instance, modulation in a signal, whether intentional as with
spread-spectrum clocking or unintentional due to crosstalk impacts, is easily measured and viewed as
phase jitter but is not generally detected as a period measurement. Some circuit effects may be apparent
in a half period (width) jitter measurement and not in a full period jitter measurement. Therefore, a
means to rapidly switch a jitter analysis setup from one measurement to another is highly desirable for
debugging purposes.
Jitter measurements are displayed as a statistical set of values. These measurements may then be
viewed in a variety of “domains” to make it easier to understand the characteristics or the root cause of
the jitter.
Teledyne LeCroy supports several domain views in JITKIT:
l Statistical Domain – using the Jitter Histogram function/view to display the distribution of values
as a histogram display
l Time Domain – using the Jitter Track function/view to display each jitter measurement value
plotted vertically and time-correlated to the original acquisition
l Folded Time Domain – using the Jitter Overlay function/view to display the waveform as a
pseudo-eye diagram for the selected jitter parameter.
l Frequency Domain – using the Jitter Spectrum function/view to understand the spectral qualities
of the jitter to trace it to a cause (e.g. switching power supply noise)
2
922810 Rev A
Page 5
Operator's Manual
Key Features
l Provides direct display of jitter measurement values, for both clock signals and clock-clock or
clock-data timing.
l Jitter parameter readouts include maximum positive and negative deviations, worst case devi-
ation, peak to peak, and standard deviation on more than 25 jitter related parameters.
l Jitter plots show the time domain, frequency domain and statistical domain views of jitter.
l Time correlated views of input signals and jitter track functions allow easy diagnosis of jitter
sources, while an overlay view provides an intuitive and accurate view of jitter and how it affects a
signal.
l Quick View provides an instant setup that includes four different views of jitter and the key jitter
parameters.
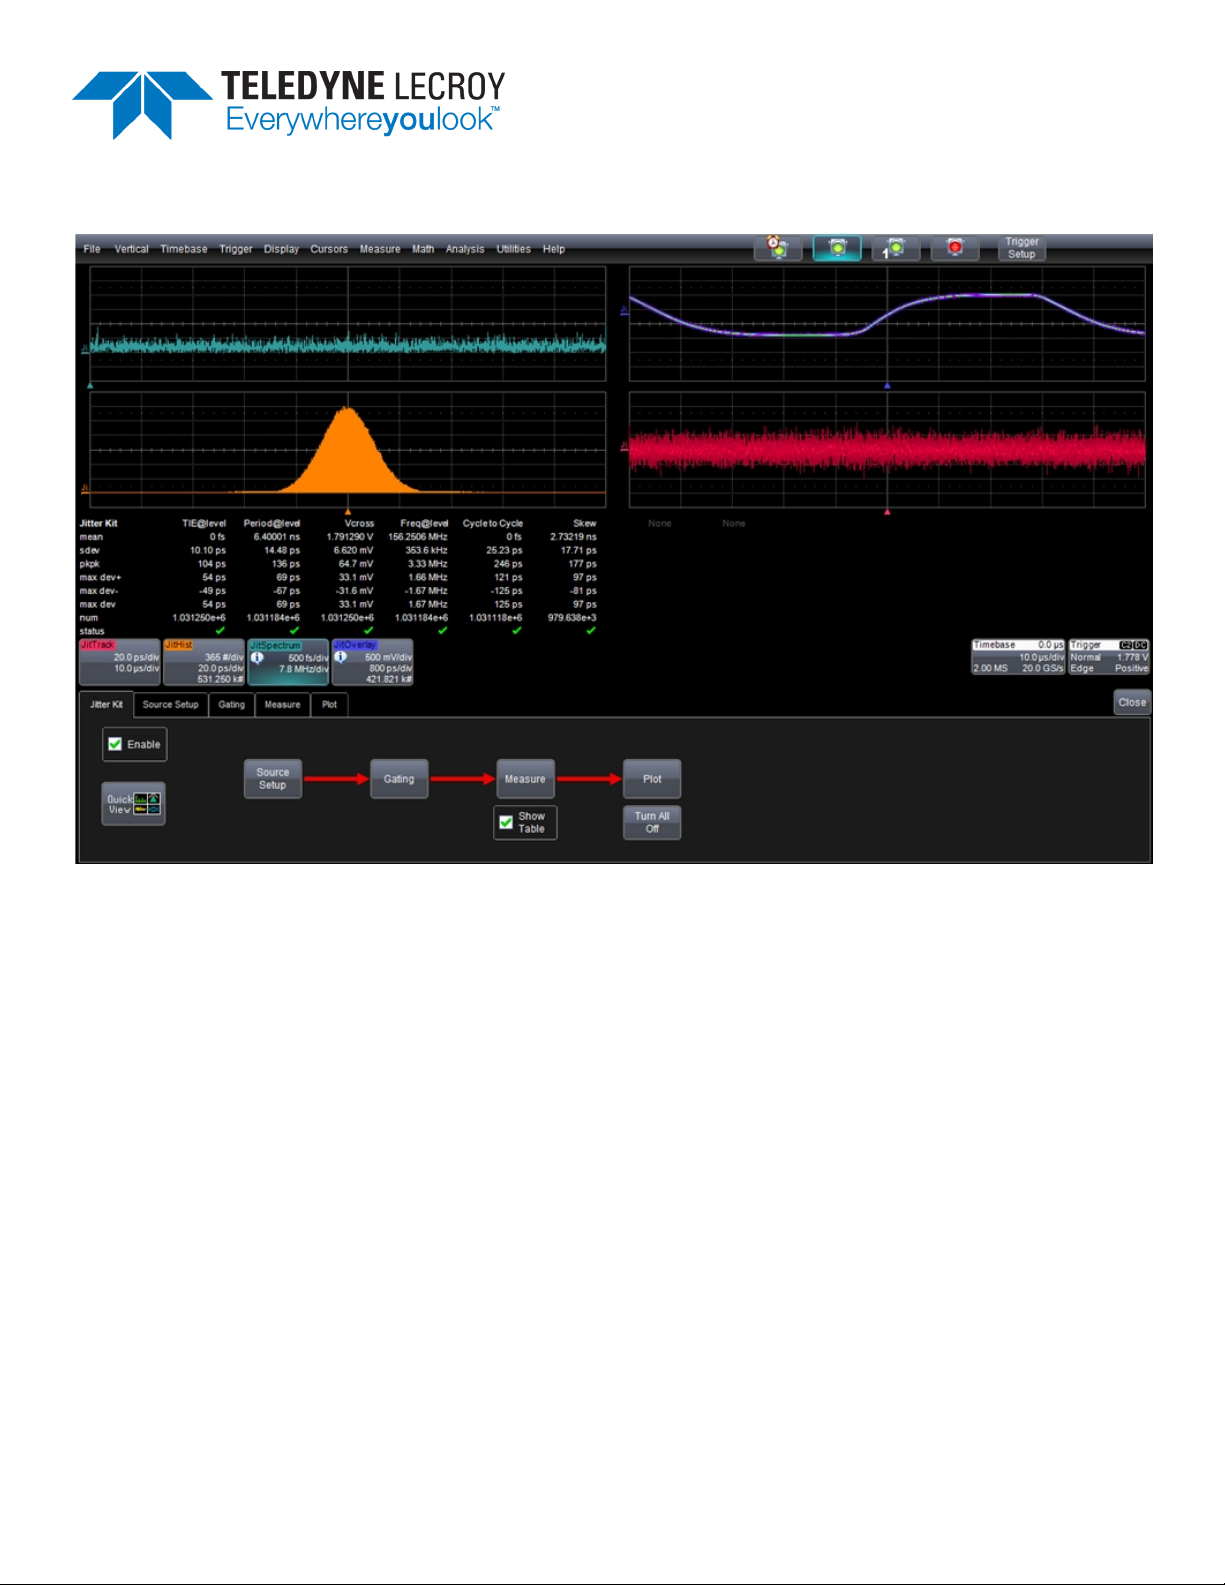
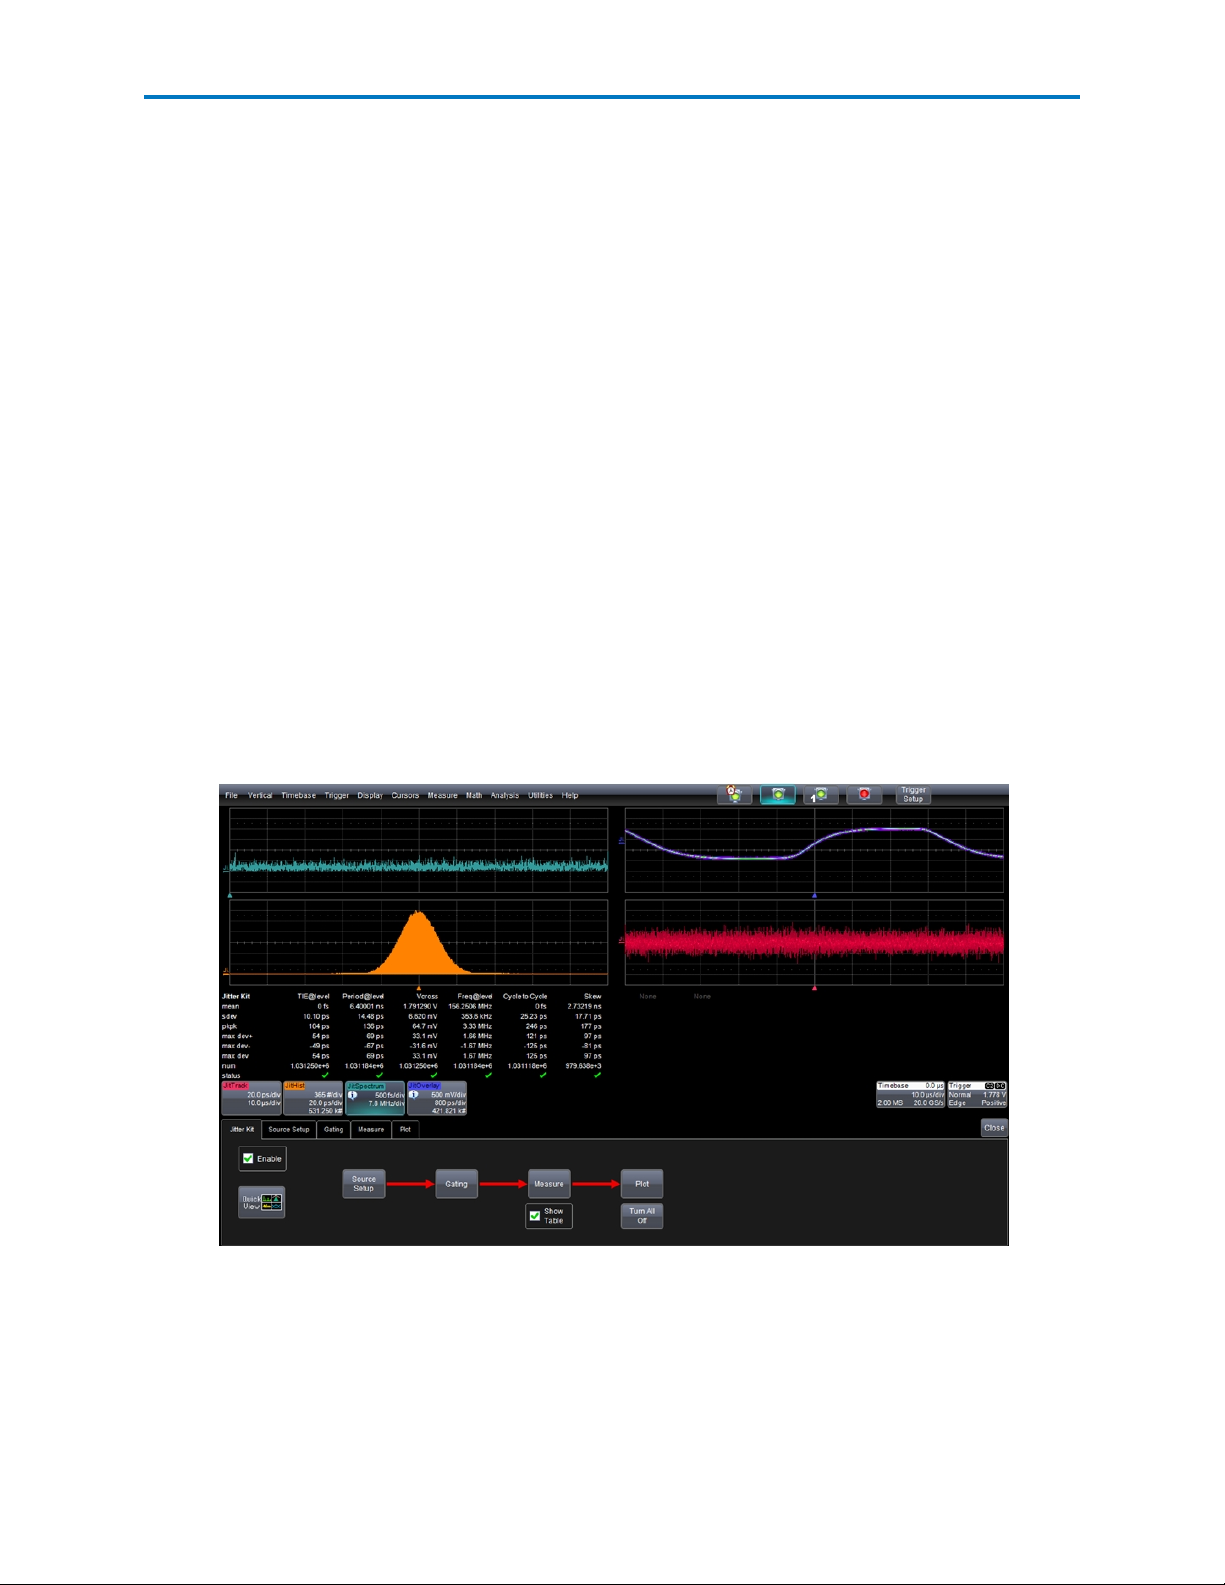
JITKIT Example
In the following example, measurement parameters for the Time Interval Error (TIE), Period, and Cycleto-Cycle period jitter are displayed along with the crossing voltage (Vcross) of the differential input
components, frequency, and skew. The measurement table includes the mean value, standard deviation
(rms jitter), peak to peak jitter, maximum positive deviation from the mean, maximum negative
deviation, and the maximum or worst case deviation. It also reports the number of measurements
included in the statistics. The jitter plots include the Jitter Histogram of TIE, the Jitter Track of TIE (which
shows TIE as a function of time), the Jitter Spectrum showing the frequency distribution of jitter values,
and the Jitter Overlay, a persistence display of the input waveform on a cycle by cycle basis.
Analysis of a 156.25 MHz differential clock signal including a) jitter measurements, b) views of
jitter in the time, frequency and statistical domains, and c) the jitter overlay.
922810 Rev A
3
Page 6

JITKIT Software
Setting up JITKIT
1. Access the JITKIT dialogs by choosing Analysis → Jitter Kit.
The main dialog (Jitter Kit) shows the basic flow of the jitter analysis through a simple block diagram
progressing from left to right. Each block in the diagram is also a button. Touching any of the buttons
opens its corresponding dialog.
2. Check the Enable checkbox. Clearing this box turns off all trace and parameter displays, however, the
setup remains in effect.
3. Touch the Source Setup button to configure your signal input sources, crossing levels, and signal
type.
4. Touch the Gating button to configure gate types, such as by Division, by Number of measurements
and using Waveform gate types.
5. Touch the Measure button to select and configure up to 8 measurement parameters. Place a checkmark in the Show Table box to display statistics below the grid
6. Touch the Plot button to configure the Jitter Kit display to show different domain views of the jitter
measurements for a single jitter measurement parameter at a time.
7. Touch the Quick View button to quickly set up the four views of jitter and several common jitter
parameters.
The following topics explain each of these steps and options in more detail.
4
922810 Rev A
Page 7

Operator's Manual
Quick View
The JITKIT Quick View provides an instant setup that includes the four views of jitter and the key jitter
parameters.
The only required user input in the Quick View setup is the definition of the input signal. Additionally, you
may specify the crossing level.
Quick View Signal Input(s) to be Analyzed dialog
Follow these steps to set up Quick View:
1. Touch Analysis → Jitter Kit on the menu bar.
2. On the Jitter Kit dialog, touch the Quick View button. The Signal Input(s) to be Analyzed pop-up
window opens.
3. In the JitSource1 (Clock) section, if you are using a differential probe, touch the 1 Input (or Diff.
Probe) button. Now, touch inside the Data field below the 1 Input (or Diff. Probe) button and select
an input source from the Select Source pop-up window.
OR
If you are using two single-ended probes to calculate the differential signal, touch the Input1-Input2
button. Input2 is subtracted from Input1. Touch inside each Data field and select an input source for
each from the Select Source pop-up window.
4. In the Crossing Levels section, choose the Level Type from the pop-up menu.
For example, if you want to set an absolute crossing level, touch inside the Use Level Type field and
choose Absolute from the pop-up menu. Then, touch inside the Abs Level data entry field and enter
the voltage level at which the signal timing is measured.
OR
922810 Rev A
5
Page 8

JITKIT Software
If you want to use a relative level set to the selected percentage on each acquisition, touch inside the
Use Level Type field and choose Percent from the pop-up menu. Then, you can use the quick
buttons below to select commonly used percentage levels, for example, if you selected the Percent
level type, you can touch the Set to 10%, 50%, or 90% button to quickly set the levels or touch the
High, Mid and Low buttons to set the levels using your preferred input control method.
5. Click OK to view the results all on one screen.
6
922810 Rev A
Page 9

Operator's Manual
JITKIT Source Setup
Use the JITKIT Source Setup dialog to set up the jitter source signal(s). The JitSource1 and JitSource2
traces are replicas of your channel, but they also have the ability to be easily and automatically time
synchronized with the Jitter Track (JitTrack). They also provide the convenience of using two inputs of a
differential signal to the oscilloscope and having one trace without needing to separately set up a math
function to perform this activity.
You can define shared source settings that apply to all measurement parameters or you can define
individual source settings for each measurement. If you choose to define individual source settings, you
define the source settings for each separate measurement parameter that you select in the Measure
dialog.
JITKIT Source Setup dialog
1. Under Global Source Settings Control, select a mode:
l Use Shared Settings - applies the definitions and settings on this dialog to all measurement
parameters.
l Use Individual Settings - lets you configure individual settings for each measurement. If you
choose to configure individual settings you define the source settings for each separate measurement parameter in the Measure dialog.
2. For each source, touch the check box next to the Trace On field to turn the trace on.
3. In the JitSource1 (Clock) Definition and Settings section, if you are using a differential probe, touch
the 1 Input (or Diff. Probe) button. Now, touch inside the Input1 field below the 1 Input (or Diff.
Probe) button and select an input source from the Select Source pop-up window.
OR
If you are using two single-ended probes to calculate the differential signal, touch the Input1-Input2
button. Input2 is subtracted from Input1. Touch inside each Input field and select an input source for
each from the Select Source pop-up window.
Note: If you do use two single-ended input channels on the oscilloscope to acquire a differential
signal, be sure to correctly deskew the two inputs prior to using them as an input to JitSource.
922810 Rev A
7
Page 10

JITKIT Software
4. Touch the Input button to select an input from the Select Source dialog.
5. Touch the Use Level Type to choose a level type from the pop-up menu (Absolute, Percent, etc.).
For example, if you want to set an absolute crossing level, touch inside the Use Level Type field and
choose Absolute from the pop-up menu. Then, touch inside the Abs Level data entry field and enter
the voltage level at which the signal timing is measured.
OR
If you want to use a relative level set to the selected percentage on each acquisition, touch inside the
Use Level Type field and choose Percent from the pop-up menu. Then, you can use the quick
buttons below to select commonly used percentage levels, for example, if you selected the Percent
level type, you can touch one of the Set to xx% buttons to quickly set the levels, or touch the High,
Mid and Low buttons to set them to a custom value.
6. Touch inside the Slope data entry control and choose the direction of the voltage transition (Positive
or Negative).
8
922810 Rev A
Page 11

Operator's Manual
JITKIT Gating
Using gates, you can narrow the span of the waveform on which to perform jitter measurements,
allowing you to focus on the area of greatest interest. You have the option of dragging the gate posts
horizontally along the waveform, or specifying a gate type. There are three gate types:
l Division - specify a position down to the hundredths of a division. The default starting positions of
the gate posts are 0 div and 10 div, which coincide with the left and right ends of the grid. The
gate, therefore, initially encloses the entire waveform.
l Number - limit the number of jitter measurement results per acquisition by setting a maximum
limit.
l Waveform - specify values based on the waveform state (for example, when the waveform state is
High or when the level is a specified percentage.
You can define shared gate settings that apply to all measurements or you can define individual gates for
each measurement. If you choose to define individual gates, you define the gate settings on the Measure
dialog for each measurement.
Note: If you apply gating, subsequent jitter domain views will only be applied on measurement values in
the gated area.
1. Touch Analysis → Jitter Kit... on the menu bar , then touch the Gating tab to access the Gating
dialog.
2. Under Global Gate Settings Mode, select a mode:
l Use Shared Gates - applies the gate settings on this dialog to all measurements.
l Use Individual Gates - lets you configure individual gate settings for each measurement. If
you choose to configure individual gate settings you can define the gates on the Measure
dialog.
3. Under Global Gate Type, touch Divisions, Number, or Waveform. The corresponding area of the
dialog becomes available.
4. If you want to specify gate divisions, in the Divisions area of the dialog touch inside the Start Div
data entry control and enter a value. Touch inside the Gate Width data entry control and enter a
value.
5. If you want to specify a limit, in the Number area of the dialog place a checkmark in the box next to
Limit # of Results per Acquisition. Touch inside the Max # data entry control and enter a maximum
value.
6. If you want to specify values based on the waveform state, in the Waveform area of the dialog place
a checkmark in the box next to Values Based on Waveform State.
922810 Rev A
9
Page 12

JITKIT Software
JITKIT Measure
Selecting your jitter parameter measurements is the key step in performing jitter analysis on your
signals. You can define measurements on up-to-8 waveforms.
Jitter Parameters
There are parameter modes for the amplitude and time domains, custom parameter groups, and
parameters for jitter testing.
The Jitter Parameter list is limited to a subset of all of the measurements available in the scope that are
specifically relevant to jitter timing, amplitude or other common measurements used in clock, clock-clock
or clock-data jitter analysis.
JITKIT Measure dialog
JITKIT Measurement Table
JITKIT enables a jitter centric view of the measurement table where all of the entries are relative to the
mean value. This removes the need to perform any additional math on the values provided in this table
to achieve jitter values. This measurement table provides the mean, standard deviation, peak to peak
value, maximum positive, negative and absolute deviation from the mean, number of measurements,
and the measurement status.
JITKIT Measurement Table
10
922810 Rev A
Page 13

Operator's Manual
Set Up Jitter Measurements
1. Touch Analysis → Jitter Kit... on the menu bar,then touch the Measure tab to access the Measure
dialog.
2. Touch the Show Table checkbox to display the Jitter Kit Measurement Table below the grid.
3. Touch the Clear Sweeps Every Acq checkbox to clear data from every sweep (acquisitions).
Note:Touch Clear Sweeps Now to clear data from sweeps (acquisitions). If you touch it during
waveform readout, it cancels the readout.
4. For each parameter touch a number button, then touch the On checkbox to enable the parameter.
5. Touch the parameter button alongside the checkbox. A pop-up menu of parameters categorized by
type appears.
l Display only icons by touching the icon button at the bottom of the menu.
l Display the icons in list form, along with an explanation of each parameter, by touching the
list button.
l Use the Up/Down buttons to scroll through the list of parameters.
Note: Depending on the measurement parameter you select and whether you are using shared or
individual settings, you can define measurement settings in the right hand dialogs that appear to the
right of the main dialog. If you are using shared parameter or gate settings, the measurement
parameter uses those shared settings as defined on the Source Setup and Gate dialogs. If you are
using individual parameter or gate settings, you can define measurement settings in the right hand
dialogs.
922810 Rev A
11
Page 14

JITKIT Software
JITKIT Plot
You define the plot and grid modes on the Jitter Kit Plot dialog.
JITKIT Plot Types
You can choose to display any of the following types of plots:
JitSource1 and JitSource2 - These traces are replicas of your channels, but they also have the ability to be
easily and automatically time synchronized with the Jitter Track (JitTrack). They also provide the
convenience of using two inputs of a differential signal to the oscilloscope and having one trace without
needing to separately set up a math function to perform this activity.
Jitter Histogram - Histograms allow you to see how a parameter's values are distributed over many
measurements. They do this by dividing a range of parameter values into sub-ranges called bins. A count
of the number of parameter values (events) that fall within ranges of the bin itself is maintained for each
bin. After a process of several thousand events, the bar graph of the count for each bin (its histogram)
provides a good understanding of the distribution of values. Histograms generally use the 'x' axis to show
a bin's sub-range value, and the 'Y' axis for the count of parameter values within each bin. The leftmost
bin with a non-zero count shows the lowest parameter value measurements. The vertically highest bin
shows the greatest number of events falling within its sub-range.
Jitter Track - Tracks allow you to understand how a measurement value is varying in time, and to easily
time correlate an unusual measurement value(s) with another waveform, which could be your clock or
data lines, or something else, like a power supply line or another signal on your board near the clock or
data signal. Tracks display a measurement value on the Y-axis and time on the X-axis. When there are
thousands of measurement values, it can seem that the Track is a solid trace, but in fact, it is composed
of many discrete points. Jitter Track is different from the normal Track since, by definition, it is displaying
jitter values on the Y-axis instead of directly displaying a measurement parameter value.
Jitter Spectrum - The Jitter Spectrum is essentially an FFT of the Jitter Track with additional capability to
locate and annotate peak values automatically. It shows the frequency distribution of the jitter with
magnitude plotted on the Y-axis and frequency plotted on the X-axis. Oftentimes, high jitter is due to a
nearby interfering signal that has a specific frequency characteristics (e.g. a switching power supply with
an 80 kHz switching frequency). By viewing the Jitter Spectrum, knowledge can be gained that can lead to
the source of a jitter peak.
Jitter Overlay - One of the most basic ways that engineers think of jitter is as a variation in a horizontal
clock position that they can view on an oscilloscope display. This can be created by triggering on a rising
or falling clock edge, setting the timebase to be ~1 period, and turning on infinite persistence. This simple
method of viewing jitter has two significant drawbacks:
l Jitter in the oscilloscopes trigger circuit is included in the persisted display, which can lead to erro-
neous conclusions about how much jitter is really present.
l It is not possible to view more complex jitter behaviors such as phase (TIE) or cycle-cycle jitter.
12
922810 Rev A
Page 15

Operator's Manual
The Jitter Overlay overcomes these limitations. Using knowledge obtained mathematically from a single
long acquisition, it recreates the display described above for any jitter behavior without a contribution of
jitter from the oscilloscopes trigger circuitry and. This simple view can quickly and intuitively reveal quite
a bit about the circuit behavior.
Set Up Jitter Plot
1. Touch Analysis → Jitter Kit... on the menu bar, then touch the Plot tab.
2. On the Plot dialog, touch the Measure to Plot field and choose a measurement.
3. Touch the Plot Mode button and select Jitter or Value for the Plot mode.
l The Jitter plot mode provides a plot of the jitter value with the mean compensated for.
l The Value plot mode provides a plot of the actual value without the mean accounted for.
4. Touch one of the Grid Mode buttons to change the grid display (for example, Auto, Single, Tandem,
or Quattro). The image label for each Grid Mode button indicate its corresponding grid configuration. Autogrid automatically adds or deletes grids as you select more or fewer waveforms to display.
5. Touch the check box to turn on the plot you want to display (for example, Jitter Histogram, Jitter
Spectrum, etc.). By touching each of the plot icons this will bring up the corresponding settings menu
in the right hand dialog.
To turn off all plots, you can press the Turn Off All Plots button.
6. You can also change the grid display (for example, Auto, Single, Tandem, or Quattro).
922810 Rev A
13
Page 16

 Loading...