

Page 1

Computer Access Technology
Corporation
2403 Walsh Avenue, Santa Clara, CA 95051-1302 Tel: +1/408.727.6600 Fax: +1/408.727.6622
CATC™ Inspector
™
Advanced USB Bus & Protocol Analyzer
User’s Manual
Copyright 1997, 1998, Computer Access Technology Corporation (CATC)
CATC, Inspector, Detective,
and
Traffic Generator
Version 2.31
1 October 1998
are trademarks of Computer Access Technology Corporation
Page 2

CATC CATC Inspector User’s Manual Version 2.31
TABLE OF CONTENTS
1. INTRODUCTION....................................................................................................................................................1
1.1 USB O
VERVIEW.......................................................................................................................................................2
2. CATC INSPECTOR ADVANCED USB BUS & PROTOCOL ANALYZER....................................................2
2.1 G
ENERAL..................................................................................................................................................................2
2.2 CATC I
2.3 T
NSPECTOR SYSTEM COMPONENTS................................................................................................................3
HE INSPECTOR USB BOX .......................................................................................................................................4
2.3.1 Front Panel Description ..................................................................................................................................4
2.3.2 Back Panel Description ...................................................................................................................................4
2.3.3 External Triggers .............................................................................................................................................5
2.3.3.1 The Manual Trigger Push-Button ...............................................................................................................................5
2.3.3.2 EXT TRG Signal Generation......................................................................................................................................5
2.4 THE EXTERNAL INTERFACE BREAKOUT BOARD.......................................................................................................7
2.5 S
YSTEM SETUP..........................................................................................................................................................7
2.5.1 Parallel Port Connection .................................................................................................................................8
2.5.2 USB Connection...............................................................................................................................................9
2.5.3 Power Connection............................................................................................................................................9
3. SOFTWARE INSTALLATION (ALL VERSIONS) ............................................................................................9
3.1 G
ENERAL..................................................................................................................................................................9
3.1.1 Standard Version (Win 3.1 & Win 95) ...........................................................................................................10
3.1.2 Standard Version (Win NT)............................................................................................................................11
3.1.3 “CATC USB Trace Viewer” Version (Win 3.1, Win 95, & Win NT)..............................................................11
3.2 R
UNNING THE SOFTWARE.......................................................................................................................................12
4. THE CATC INSPECTOR SOFTWARE.............................................................................................................12
4.1 G
ETTING STARTED..................................................................................................................................................12
4.2 T
HE MAIN DISPLAY WINDOW.................................................................................................................................12
4.2.1 The Status Bar................................................................................................................................................13
4.2.1.1 Device Class Status...................................................................................................................................................14
4.2.1.2 Recording Options Status .........................................................................................................................................14
4.2.1.3 Search Status.............................................................................................................................................................14
4.2.1.4 Recording Status .......................................................................................................................................................14
4.2.2 USB Packet Error Displays ...........................................................................................................................15
4.3 T
HE FILE MENU......................................................................................................................................................15
4.3.1 Open...............................................................................................................................................................16
4.3.2 Close ..............................................................................................................................................................16
4.3.3 Save As...........................................................................................................................................................16
4.3.4 Save As Text... ................................................................................................................................................16
4.3.5 Edit Comment.................................................................................................................................................16
4.3.6 Printer Setup... ...............................................................................................................................................17
4.3.7 Print... ............................................................................................................................................................17
4.3.8 Exit.................................................................................................................................................................17
4.4 T
HE SETUP MENU...................................................................................................................................................18
4.4.1 Recording Options... ......................................................................................................................................18
4.4.1.1 Trigger Selection.......................................................................................................................................................19
4.4.1.1.1 Manual Trigger .................................................................................................................................................19
4.4.1.1.2 External Start Trigger .......................................................................................................................................19
4.4.1.1.3 External Stop Trigger........................................................................................................................................19
4.4.1.1.4 Event Trigger....................................................................................................................................................19
4.4.1.1.4.1 Packet Events ...........................................................................................................................................20
4.4.1.1.4.2 Error Events..............................................................................................................................................22
4.4.1.1.4.3 Static Events.............................................................................................................................................23
4.4.1.1.4.4 Post-Trigger Recording ............................................................................................................................23
4.4.1.1.4.5 External Event Trigger .............................................................................................................................23
i
Page 3

CATC CATC Inspector User’s Manual Version 2.31
4.4.1.2 Idle State Recording Selection..................................................................................................................................24
4.4.1.2.1 User Input Data Recording ...............................................................................................................................24
4.4.1.3 Connection Speed Selection .....................................................................................................................................25
4.4.1.4 File Name..................................................................................................................................................................25
4.4.1.5 Save... (Recording Options)......................................................................................................................................25
4.4.1.6 Load... (Recording Options) .....................................................................................................................................25
4.4.1.7 Save As Default (Recording Options).......................................................................................................................25
4.4.1.8 Buffer Size ................................................................................................................................................................25
4.4.2 Display Options..............................................................................................................................................26
4.4.2.1 View Type.................................................................................................................................................................27
4.4.2.2 Data Presentation ......................................................................................................................................................27
4.4.2.3 Field Formats ............................................................................................................................................................28
4.4.2.4 Hidden Elements.......................................................................................................................................................28
4.4.2.5 Field Colors ..............................................................................................................................................................29
4.4.2.6 User Input Data.........................................................................................................................................................30
4.4.2.7 Save... (Display Options) ..........................................................................................................................................30
4.4.2.8 Load... (Display Options)..........................................................................................................................................30
4.4.2.9 Save As Default (Display Options)...........................................................................................................................31
4.4.2.10 Display Configuration Name ..................................................................................................................................31
4.5 THE RECORD MENU ...............................................................................................................................................31
4.5.1 Start................................................................................................................................................................31
4.5.2 Stop ................................................................................................................................................................31
4.6 T
HE REPORT MENU................................................................................................................................................32
4.6.1 File Information .............................................................................................................................................32
4.6.2 Timing Calculations.......................................................................................................................................33
4.6.3 Packet Error Summary...................................................................................................................................35
4.6.4 Transaction Error Summary ..........................................................................................................................35
4.6.5 Traffic Summary.............................................................................................................................................36
4.6.6 Saving Summaries as Text Files.....................................................................................................................37
4.7 T
HE VIEW MENU....................................................................................................................................................38
4.7.1 Add View ........................................................................................................................................................38
4.7.2 Hide SOF .......................................................................................................................................................38
4.7.3 Hide NAKed Transactions..............................................................................................................................39
4.7.4 Zoom In..........................................................................................................................................................39
4.7.5 Zoom Out .......................................................................................................................................................39
4.7.6 Set Current Zoom Value as Default ...............................................................................................................39
4.8 T
HE DECODE MENU ...............................................................................................................................................39
4.8.1 Select Device Class... .....................................................................................................................................39
4.8.2 Decode Device Request..................................................................................................................................40
4.8.2.1 Decoded Standard Requests......................................................................................................................................42
4.8.2.2 Decoded Hub Class Requests....................................................................................................................................47
4.8.2.3 Decoded Requests for Other Device Classes ............................................................................................................49
4.9 THE SEARCH MENU................................................................................................................................................50
4.9.1 Go to Packet...................................................................................................................................................50
4.9.2 Go to Trigger .................................................................................................................................................50
4.9.3 Go To Marker.................................................................................................................................................50
4.9.4 Find................................................................................................................................................................50
4.9.4.1 Find PID ...................................................................................................................................................................52
4.9.4.2 Find Error Condition.................................................................................................................................................53
4.9.4.3 Find Frame................................................................................................................................................................53
4.9.4.4 Find ADDR and ENDP.............................................................................................................................................54
4.9.4.5 Find Static Bus Event................................................................................................................................................54
4.9.4.6 Find Data String........................................................................................................................................................55
4.9.5 Next ................................................................................................................................................................55
4.10 T
HE WINDOW MENU............................................................................................................................................55
4.11 T
HE HELP MENU ..................................................................................................................................................55
4.12 T
HE DATA FIELD VIEW POP-UP MENU.................................................................................................................56
4.13 T
HE PACKET MARKER & TIMING POP-UP MENUS................................................................................................56
4.14 T
HE DEVICE DECODING POP-UP MENUS..............................................................................................................57
ii
Page 4

CATC CATC Inspector User’s Manual Version 2.31
4.15 THE I/O OPERATION POP-UP MENU.....................................................................................................................58
5. TRIGGERING LOGIC ANALYZERS AND OSCILLOSCOPES BASED ON USB TRAFFIC ...................59
6. HOW TO CONTACT CATC ...............................................................................................................................60
7. WARRANTY AND LICENSE..............................................................................................................................60
iii
Page 5

CATC CATC Inspector User’s Manual Version 2.31
1. INTRODUCTION
The CATC INSPECTOR Advanced USB Bus & Protocol Analyzer is an invaluable development
and test tool for Universal Serial Bus designers. When connected to any point in a USB network,
the Inspector USB analyzer, like the CATC Detective USB analyzer, continuously monitors all
bus activities and alerts the user to any abnormal bus conditions in an easy to use, menu driven,
Windows software environment.
Inspector Features:
• advanced USB bus & protocol analyzer, compatible with the CATC Detective USB analyzer
and the CATC Traffic Generator
• operates with portable and desktop PCs, controlled through the parallel port
• enhanced triggering—data recording can be triggered by real-time USB events:
• any possible data field error (PID, CRC, stuff bits)
• any user defined PID or PID combination
• any data pattern (DATA0, DATA1, or DATA0/DATA1)
• any address and endpoint combination with any PID combination
• any frame number
• any static bus event (Reset, Suspend, Resume)
• user defined trigger position allows specification of the pre/post-trigger recording ratio
• provides real time USB event decoding signals on an external interface connector
• records four external signals along with the USB traffic, enabling recording of user-provided
data or timing information along with USB bus traffic
• built-in, high impedance probe connects non-intrusively to any branch of a USB system
• captures both full- and low-speed USB traffic
• sophisticated software analyzes all bus transactions, identifies & highlights abnormal bus
conditions, and decodes generic device class, hub class, and other standard device class
messages
• easy to use Windows environment (Win 3.1, Win 95, and Win NT)
• tested for compliance with the USB specification
• one year warranty and hot-line customer support
• non-recording, view-only version of software available (no hardware required)
This document explains how to install the CATC Inspector hardware and software in your PC. It
also explains how to connect and activate the analyzer in a USB system environment.
1
Page 6

CATC CATC Inspector User’s Manual Version 2.31
1.1 USB Overview
The Universal Serial Bus (USB) is an open industry standard, providing a simple and inexpensive way to connect up to 127 devices to a single computer port. Keyboards, mice, tablets,
digitizers, scanners, bar-code readers, modems, printers, and more can all run at the same time.
USB devices plug into any platform that supports the standard, from notebooks to desktop PCs to
workstations.
The USB is a dynamically reconfigurable serial bus with an elementary data rate of 12,000,000
bits/sec, based on off the shelf, low cost micro-controller technology. Its modular layered software protocol supports sophisticated device drivers and application programs.
Please refer to the USB Specifications for details on the USB protocol. The USB specifications
are available from the USB Implementers Forum at:
USB IF
M/S JF2-51 Tel: +1/ 503 264 0590
2111 NE 25th Avenue Fax: +1/ 503 693 7975
Hillsboro, OR 97124 Web: http://www.usb.org/
2. CATC INSPECTOR ADVANCED USB BUS & PROTOCOL
ANALYZER
2.1 General
The CATC Inspector Advanced USB Bus & Protocol Analyzer builds on the success of the
CATC Detective USB Bus & Protocol Analyzer; it incorporates the functionality of this earlier
product, and adds four major features:
• operation with both portable and desktop PCs
• enhanced triggering—data recording can be triggered by real-time USB events
• provision of real time USB event decoding signals
• recording of four user-provided external signals along with the USB traffic
The Inspector USB analyzer is a stand-alone unit configured and controlled through the PC bidirectional parallel port. It can be used with portable PCs for field service and maintenance, as
well as with desktop units in a development lab environment. The analyzer is easily installed,
without opening up the PC, by connecting a cable to the parallel port.
The Inspector analyzer includes provisions for on-the-fly detection of, and triggering on,
numerous USB events. Such events include specific user-defined PIDs or PID combinations, data
patterns, address + endpoint, special USB signaling, and many USB abnormal (error) bus
conditions. The Inspector analyzer continuously records the USB data in a wrap-around mode.
Upon detection of a triggering event, the analyzer continues to record data (post-trigger) up to a
point specified by the user. Real-time event detectors can be individually enabled or disabled to
allow triggering on USB events as they happen. This includes pre-defined exception or error
2
Page 7

CATC CATC Inspector User’s Manual Version 2.31
conditions, and a user-defined set of search conditions. The unit can also be triggered by an
externally supplied signal. On-board memory provides a path for externally supplied data or
timing information to be recorded along with bus traffic.
Real-time USB event detection information is available via an external DB37 connector, making
many control, timing, and recovered signals available externally. These signals can be probed
and used by other circuitry.
The Inspector USB analyzer is designed to turn any 386/486 or Pentium class PC (including
laptop and notebook as well as desktop PCs) into a USB test station. The PC itself does not need
to have a USB interface. The Inspector package includes the stand-alone Inspector box, an
External Interface Breakout Board with a 37-pin ribbon cable, USB and parallel port cables, an
AC to DC power converter, a sophisticated software program running under Microsoft Windows
(3.1, 95, and NT versions), and comprehensive product documentation (including on-line help).
The Inspector analyzer has a built-in high impedance USB probe and several status LEDs. The
analyzer monitors the two USB wires (D+ and D-) and translates the raw differential data into a
single NRZI bit stream. It samples the data with the recovered synchronized clock, and stores the
resulting bit stream on disk. The analyzer also detects and reports the static bus conditions
Suspend, Resume, Reset, and Idle.
The Inspector software scans the collected data and displays it in several meaningful formats.
The user can view the data as a continuous stream, or as complete transactions. In continuous
mode, the analyzer fills the entire display line with data; in transaction mode, each line is
dedicated to one bus transaction, such as token, data, or handshake.
The Inspector software provides a powerful search function that enables investigation of
particular bus events, with the software identifying and highlighting specific events such as Bad
PID, Undefined PID, Bad CRC, Bad Stuffing Bits, Missing Frames, etc.
In addition to immediate analysis, the user can print any part of the data and save all or selected
portions of the data on disk for later viewing. The program also provides a variety of timing
information.
The Inspector USB analyzer comes with a one year warranty and hot-line customer support.
2.2 CATC Inspector System Components
The CATC Inspector package includes the following components:
• the stand-alone Inspector USB box
• an External Interface Breakout Board with a 37 pin ribbon cable
• USB and parallel port cables
• an AC to DC power converter
• two diskettes with the associated application software program, for operation under Microsoft
Windows 95, Windows 3.1, or Windows NT
• comprehensive product documentation, including on-line help
3
Page 8

CATC CATC Inspector User’s Manual Version 2.31
t
2.3 The Inspector USB Box
The Inspector USB box has several user-accessible controls on its front and back panels.
2.3.1 Front Panel Description
Manual
Power
The front panel, viewed above, has two USB connectors, three LEDs, and two switches:
• The four-pin A-type and four-pin B-type USB connectors are marked “USB In/Out”.
• The red “ON” LED lights when the box is powered by an external 12V DC @ 1A power
source and the power switch is turned on.
• The yellow “Trigger Event” LED lights when a trigger event has occurred.
• The green “Recording” LED lights when the Inspector analyzer is recording USB traffic.
• The “Manual Trigger” push button can be used to manually start and/or end recording
sessions (when enabled in the Recording Options dialog box).
ON
Trigger
Trigger
Event
Recording
USB In / Out
2.3.2 Back Panel Description
The back panel has three connectors:
Enhanced Parallel Por
• The +12V DC @ 1A input power connector, marked “9–15V DC” (Earlier versions of this
product are marked “9V DC”, but are equivalent in capability).
• A 25-pin parallel port connector, marked “Enhanced Parallel Port”.
• A 37-pin external interface connector, marked “Data In/Out”.
Data In / Out 9–15V
4
Page 9

CATC CATC Inspector User’s Manual Version 2.31
2.3.3 External Triggers
The CATC Inspector box offers two ways to generate an external trigger to control a recording
session: the “Manual Trigger” push-button, and the “EXT TRG” pin on the External Interface
Breakout Board.
2.3.3.1 The Manual Trigger Push-Button
The simplest way to generate an external trigger (when enabled in the Recording Options dialog
box) is by manually activating the Manual Trigger push button located on the front panel of the
Inspector box.
2.3.3.2 EXT TRG Signal Generation
In order to view a particular USB event (to determine—for example—how a particular device
behaves during the initialization phase), it is necessary to activate the CATC Inspector analyzer
to record the bus activities during a specific time period. If the USB host allows manual control
of the bus traffic, then in theory the CATC Inspector recording could be started manually at the
same time. Because of USB speed, correspondingly slow human reaction time, and buffer
memory limitations (1 Mbytes), however, manually coordinating the host actions with the
Inspector recording is generally impractical.
A simple solution is to generate a signal in the USB host PC, or in the USB hub or device under
observation, that will be synchronized to the particular event to be recorded. Such a signal can be
generated on the PC by calling a small software routine (see sample code below) that uses a
standard I/O Write command to a specific pin on an available serial or parallel port.
Alternatively, the EXT TRG signal might be generated by programming one of the general I/O
ports on the USB controller in the hub or device.
A short cable connects this (active low) signal to the EXT TRG pin of the External Interface
Breakout Board.
TRIG Signal Sample software Routine
case IOCTL_START_TRIGGER_RTS:
switch (gTriggerDongle) {
case SERIAL_PORT_TRIGGER_DONGLE:
outp (0x3fc, 00);
break;
case PARALLEL_PORT_TRIGGER_DONGLE:
outp (0x378, 00);
break;
}//switch
break;
5
Page 10

CATC CATC Inspector User’s Manual Version 2.31
case IOCTL_STOP_TRIGGER_RTS:
switch (gTriggerDongle) {
case SERIAL_PORT_TRIGGER_DONGLE:
outp (0x3fc, 02);
break;
case PARALLEL_PORT_TRIGGER_DONGLE:
outp (0x378, 0xFF);
break;
}//switch
break;
The CATC Inspector analyzer has two basic recording modes, timed and event driven. Both may
be used with external triggering. With timed recording, the analyzer can be set to start or stop
recording based on its EXT TRG (input) signal. This mode of operation is the same as the CATC
Detective USB Bus & Protocol Analyzer.
With the event driven mode of operation, it is possible to combine other triggering events with
the EXT TRG signal. For example, if some external device (such as a logic analyzer) is set up to
trigger the CATC Inspector tool, it is still possible to enable USB error checks or PID checks as
well. In this situation the first detected event, internal or external, will trigger the analyzer.
6
Page 11

CATC CATC Inspector User’s Manual Version 2.31
2.4 The External Interface Breakout Board
The breakout board is an Inspector accessory that allows convenient access to twelve potentially
useful output signals. It also provides a means to supply up to five inputs: one to act as an
(externally supplied) trigger, and four to sample user signals for display purposes. All signals use
TTL levels (0–5V). The following diagram illustrates the breakout board connector:
GND Signal Ground
GND Signal Ground
–SUSPEND Suspend condition—Active Low Output
–RESUME Resume condition—Active Low Output
–RESET Reset condition—Active Low Output
–BAD CRC Bad CRC condition—Active Low Output
–BAD PID Bad PID condition—Active Low Output
–STUFF ERR Stuff Error condition—Active Low Output
–TRIGGER Trigger event detected—Active Low Output
–TRIGGERED Inspector triggered and saved data—Active Low Output
DRCLK Recovered USB clock [output]
RDATA Recovered USB data [binary output]
RSE0 Recovered SE0 signal [output]
–IDLE Bus Idle condition—Active Low Output
SPARE (unused)
SPARE (unused)
–EXT TRG External Trigger—Active Low Input
DX0 User Signal Data input #0—Normally Pulled High
DX1 User Signal Data input #1—Normally Pulled High
DX2 User Signal Data input #2—Normally Pulled High
DX3 User Signal Data input #3—Normally Pulled High
GND Signal Ground
GND Signal Ground
2.5 System setup
The Inspector is designed to work with either desktop or portable PCs. The PC does not have to
be equipped with a USB interface in order to work with the Inspector analyzer. Three steps are
involved in the setup of the system hardware: connecting to the parallel port, connecting to the
USB system under test, and connecting to electrical power.
7
Page 12

CATC CATC Inspector User’s Manual Version 2.31
2.5.1 Parallel Port Connection
Turn off the PC power, and connect the 25-pin cable between the CATC Inspector “Parallel
Port” connector and the PC parallel port. It is suggested that the length of the interface cable be
kept as short as possible and a high quality cable be used. PC power may then be restored.
A PC’s parallel port can be configured for up to four different operational modes:
1) Standard mode (sometimes called Compatible mode or Compatibility mode)
2) Bi-directional mode (sometimes called Standard/Bi-directional mode)
3) Enhanced Parallel Port mode, or EPP (sometimes called simply Enhanced mode)
4) Extended Capabilities Port mode, or ECP
The parallel port mode is selected using one of the following approaches:
1) BIOS settings (for most computers having a parallel port I/O controller on the motherboard)
2) PC manufacturer-provided hardware setup utility (on some laptop and desktop PCs)
3) jumper settings (for most add-on I/O cards with a parallel port)
CATC Inspector analyzer models that have “Enhanced Parallel Port” written by the parallel port
connector are capable of operating in both EPP and bi-directional modes; Earlier Inspector
models that have simply “Parallel Port” written by the connector are designed for bi-directional
mode only. The current parallel port connection mode is shown in the program’s “About”
display, available via the Help menu.
Whenever EPP mode is available, it should be used, as the data transfers using this mode are at
least twice as fast as bi-directional mode.
ECP mode is supposed to implement the bi-directional mode as a subset. If it does so correctly,
the Inspector will function properly (in bi-directional mode). Note, however, that it is fairly
common (especially in portable systems, concerned with power-saving shortcuts) to implement
non-standard versions of ECP, which can cause the Inspector analyzer to malfunction.
If, at startup, the software finds that the PC has ports running only in standard mode, it displays
an information box with the following message:
The CATC Inspector software could not detect the Inspector USB box. The Inspector box must be
powered and connected to the system’s Parallel Port (configured to support bi-directional data
transfers) to enable the capture and recording of USB traffic. The software found that none of
the parallel ports in this system currently supports a bi-directional mode. Use the BIOS setting to
set the parallel port to EPP (preferred, for enhanced performance), ECP, or bi-directional mode.
If EPP mode has been attempted and the Inspector box still can’t be found, try using ECP or bidirectional mode.
If, at startup, the application finds that the PC has ports running in a mode other than standard,
but it still cannot communicate with the Inspector USB box, it displays an information box with
the following message:
The CATC Inspector software could not detect the Inspector USB box. The Inspector box must be
powered and connected to the system’s Parallel Port (configured to support bi-directional data
transfers) to enable the capture and recording of USB traffic. The software found that this system
has parallel ports capable of bi-directional data transfers. Ensure that the Inspector USB box is
8
Page 13

CATC CATC Inspector User’s Manual Version 2.31
both connected properly and powered, then select the OK button. If this message appears again,
select the Help button for more information, or the Cancel button to quit the Inspector
application.
2.5.2 USB Connection
Locate the CATC Inspector Box near the USB system under test.
In the USB system, at a point where USB bus traffic is to be analyzed, open a connection and
reconnect the open link through the CATC Inspector box as follows:
• Connect a USB cable between one side of the open connection and one of the two
USB receptacles on the front panel of the CATC Inspector box (the two receptacles
are functionally identical).
• Connect another USB cable between the other side of the open USB connection and
the other USB receptacle of the CATC Inspector box.
Note: CATC recommends the use of USB cables shorter than 2 meters (6 feet) for all
connections to the Inspector USB box.
Note: The B-type USB connector on the Inspector box is normally connected to the upstream
USB port, while the A-type connector is connected to the downstream port.
To use the external interface signals provided by the Inspector hardware, connect the 37-pin
ribbon cable between the External Interface Breakout Board and the “Data In/Out” connector at
the back of the Inspector box. To enable external triggering, connect the trigger signal to the EXT
TRG pin on the breakout board. To record user input data, connect the user data signals to the
DX0–3 pins on the breakout board.
2.5.3 Power Connection
Connect the DC plug of the AC to +12V DC @ 1A converter to the “9–15V DC” receptacle on
the CATC Inspector back panel.
To activate the Inspector, plug the AC to DC converter into a 110V or 220V power outlet and
turn on the “Power” switch on the front panel.
The CATC Inspector Bus & Protocol Analyzer hardware is now ready for operation.
3. SOFTWARE INSTALLATION (ALL VERSIONS)
3.1 General
The CATC Inspector software is available in three different versions:
• standard version for Windows 3.1 and Windows 95
• standard version for Windows NT
9
Page 14

CATC CATC Inspector User’s Manual Version 2.31
• view-only version (the “CATC USB Trace Viewer”) for Windows 3.1, Windows 95, and
Windows NT (This version does not require the Inspector USB hardware; it is used only for
viewing and analyzing previously created USB traffic files. It also serves as a product
demonstration vehicle.)
The software diskette label identifies the program version. To install the CATC Inspector
software, run the installation program from the Inspector software diskette, and follow the
instructions on the screen.
• For the standard version on Windows NT systems, run the ‘setup.exe’ installation program.
Note that correct installation requires logging in as administrator.
• For all other versions/systems, run the ‘install.exe’ installation program.
The installation program creates a program group for the Inspector application once it has
finished copying all the files. The icon for an Uninstall program is also placed in the program
group. This Uninstall program can be run later, if desired, to remove the CATC Inspector
software from the system.
To run the software, double-click on the Inspector icon in the program group created during
installation. Section 4 describes the software in detail.
3.1.1 Standard Version (Win 3.1 & Win 95)
The installation program copies the following files to the PC’s hard drive.
To the \USBINSPR directory (or that otherwise specified by the user):
• USBINSPR.EXE executable code of the CATC Inspector program
• USBINSPR.DLL DLL for the CATC Inspector program
• CLS_HID.DLL DLL for HID Class device decoding
• USBINSPR.HLP CATC Inspector help file
• DEFAULT.OPT default DISPLAY function settings
• DEMO.USB sample USB traffic file
to the \WINDOWS\SYSTEM directory:
• USBINSPR.386 Windows CATC Inspector virtual device driver
• CTL3D.DLL Windows 3D Control Library
• CTL3DV2.DLL Windows 3D Control Library
to the \WINDOWS directory:
• CLSDECOD.INI USB Device Class decoding initialization
In the \WINDOWS\SYSTEM.INI file, the installation program adds a reference to the CATC
Inspector driver in the [386Enh] section.
device=usbinspr.386
10
Page 15

CATC CATC Inspector User’s Manual Version 2.31
3.1.2 Standard Version (Win NT)
The installation program copies the following files to the PC’s hard drive.
To \Program Files\CATC\Inspector directory (or that otherwise specified by the user):
• USBINSPR.EXE executable code of the CATC Inspector program
• USBINSPR.DLL DLL for the CATC Inspector program
• CLS_HID.DLL DLL for HID Class device decoding
• USBINSPR.HLP CATC Inspector help file
• DEFAULT.OPT default DISPLAY function settings
• DEMO.USB sample USB traffic file
to the \WINDOWS\SYSTEM32 directory:
• CTL3D32.DLL Windows 3D Control Library
to the \WINDOWS directory:
• CLSDECOD.INI USB Device Class decoding initialization
to the \WINDOWS\SYSTEM32\DRIVERS directory:
• USBINSPR.SYS Windows NT CATC Inspector device driver
The installation program modifies the system registry to install the CATC Inspector driver. Thus,
in order to install this version on Windows NT systems, it is necessary to log in as administrator.
3.1.3 “CATC USB Trace Viewer” Version (Win 3.1, Win 95, & Win NT)
The installation program copies the following files to the PC’s hard drive.
To the \CATCVIEW directory (or that otherwise specified by the user):
• CATCVIEW.EXE executable code of the CATC USB Trace Viewer program
• CLS_HID.DLL DLL for HID Class device decoding
• USBINSPR.HLP CATC Inspector help file
• DEFAULT.OPT default DISPLAY function settings
• TRIGUSER.USB full-speed USB trace file (illustrates event trigger, user data)
• HID.USB low-speed USB trace file (illustrates HID class decoding)
• SOF.USB full-speed USB trace file (illustrates many SOF packets)
• ISO.USB full-speed USB trace file (illustrates isochronous traffic)
• NAK.USB full-speed USB trace file (illustrates many NAKed transactions)
• REPORT.USB full-speed USB trace file (illustrates statistics report, view by device)
• ERROR.USB full-speed USB trace file (illustrates field & transaction errors)
to the \WINDOWS\SYSTEM directory:
• CTL3D.DLL Windows 3D Control Library
• CTL3DV2.DLL Windows 3D Control Library
11
Page 16

CATC CATC Inspector User’s Manual Version 2.31
to the \WINDOWS directory:
• CLSDECOD.INI USB Device Class decoding initialization
3.2 Running The Software
The CATC Inspector software is a Windows application, and can be run under Windows 3.1,
Windows 95, and Windows NT. To start the program, double-click on the file name (located
with the Explorer or equivalent service), or on the CATC Inspector icon created during the
software installation.
The program will start with the main window active.
4. THE CATC INSPECTOR SOFTWARE
4.1 Getting Started
The CATC Inspector Bus & Protocol Analyzer continuously monitors all USB activity. At the
operator’s discretion, the analyzer will record a snap shot view of the bus traffic. It will store the
data in a file (initially named “data.usb”) on the system hard drive and then display the
information on the screen. Once the information is captured and displayed, it can be viewed and
analyzed using a variety of tools. The data can be stored permanently, and conveniently viewed
on any PC equipped with the CATC Inspector software. A view-only version of the software
permits subsequent viewing without the need for any Inspector hardware.
4.2 The Main Display Window
The CATC Inspector analyzer’s main display incorporates the following set of Windows pulldown menus:
• File
• Setup
• Record
• Report
• View
Clicking on any of these menus will expand it, offering various function selections. Subsequent
sections of this document describe the operation of each menu item.
• Decode
• Search
• Window
• Help
12
Page 17
CATC CATC Inspector User’s Manual Version 2.31
Additionally, several of the most frequently used functions can be activated by specific icons
located on the toolbar immediately below the pull-down menus. Each icon’s functionality is
identified in the left portion of the status bar (at the bottom of the window) when the pointing
device cursor moves over the icon. Finally, several operations can be invoked by clicking directly
on the affected packet fields (using pop-up menus).
4.2.1 The Status Bar
The status bar is located at the bottom of the Inspector main display window. The functionality of
each icon and menu item is briefly described in the bar when the pointing device cursor moves
over the icon/item. At other times, the bar is divided into three segments, used to display the
following:
13
Page 18

CATC CATC Inspector User’s Manual Version 2.31
4.2.1.1 Device Class Status
The center segment displays the currently selected USB Device Class, used when displaying
decoded Device Class requests. As described under Recording Status, below, this information
will be temporarily overwritten during recording activity.
4.2.1.2 Recording Options Status
The center segment displays the current Recording Options, consisting of trigger state (“Event”,
“Manual”, “ExtStart”, or “ExtStop”), idle recording state (“with idle” or “no idle”), and
connection speed (“FS” or “LS”, for full- and low-speed respectively). As described under
Recording Status, below, this information will be temporarily overwritten during data-saving
operations.
4.2.1.3 Search Status
The rightmost segment displays the current search direction (forward or backward) and start
position (from start/end of file, or from last match).
4.2.1.4 Recording Status
During recording activity, the leftmost segment temporarily displays the current recording status.
When the user activates the Record function, this segment will flash one of the following
messages (depending on the selected Recording Options):
Recording...
Awaiting trigger to start recording...
Recording; awaiting trigger to stop...
Recording... awaiting event
Recording... event occurred
After the Inspector stops recording, the flashing message changes to “Saving data...”, which is a
multiphase operation. In the first phase, the software scans the recorded data stream, computing
the packet boundaries; during this phase, the center segment of the status bar displays the packet
number currently being processed by the software. In the second phase, the traffic data is copied
to disk, using the default file name “data.usb” (overwriting any previous version of this file). If
user input data has been recorded, it will also be copied to disk (as part of the same file); the
display will flash “Saving user data...” during this third phase.
When the software has finished saving the data, the recorded data file appears in the main display
window and the recording status window is cleared. If the recording was the result of an Event
Trigger, the first packet following the trigger (or the packet that caused the trigger) will initially
be positioned second from the top of the display; otherwise, the display will begin with the first
packet in the traffic file.
14
Page 19

CATC CATC Inspector User’s Manual Version 2.31
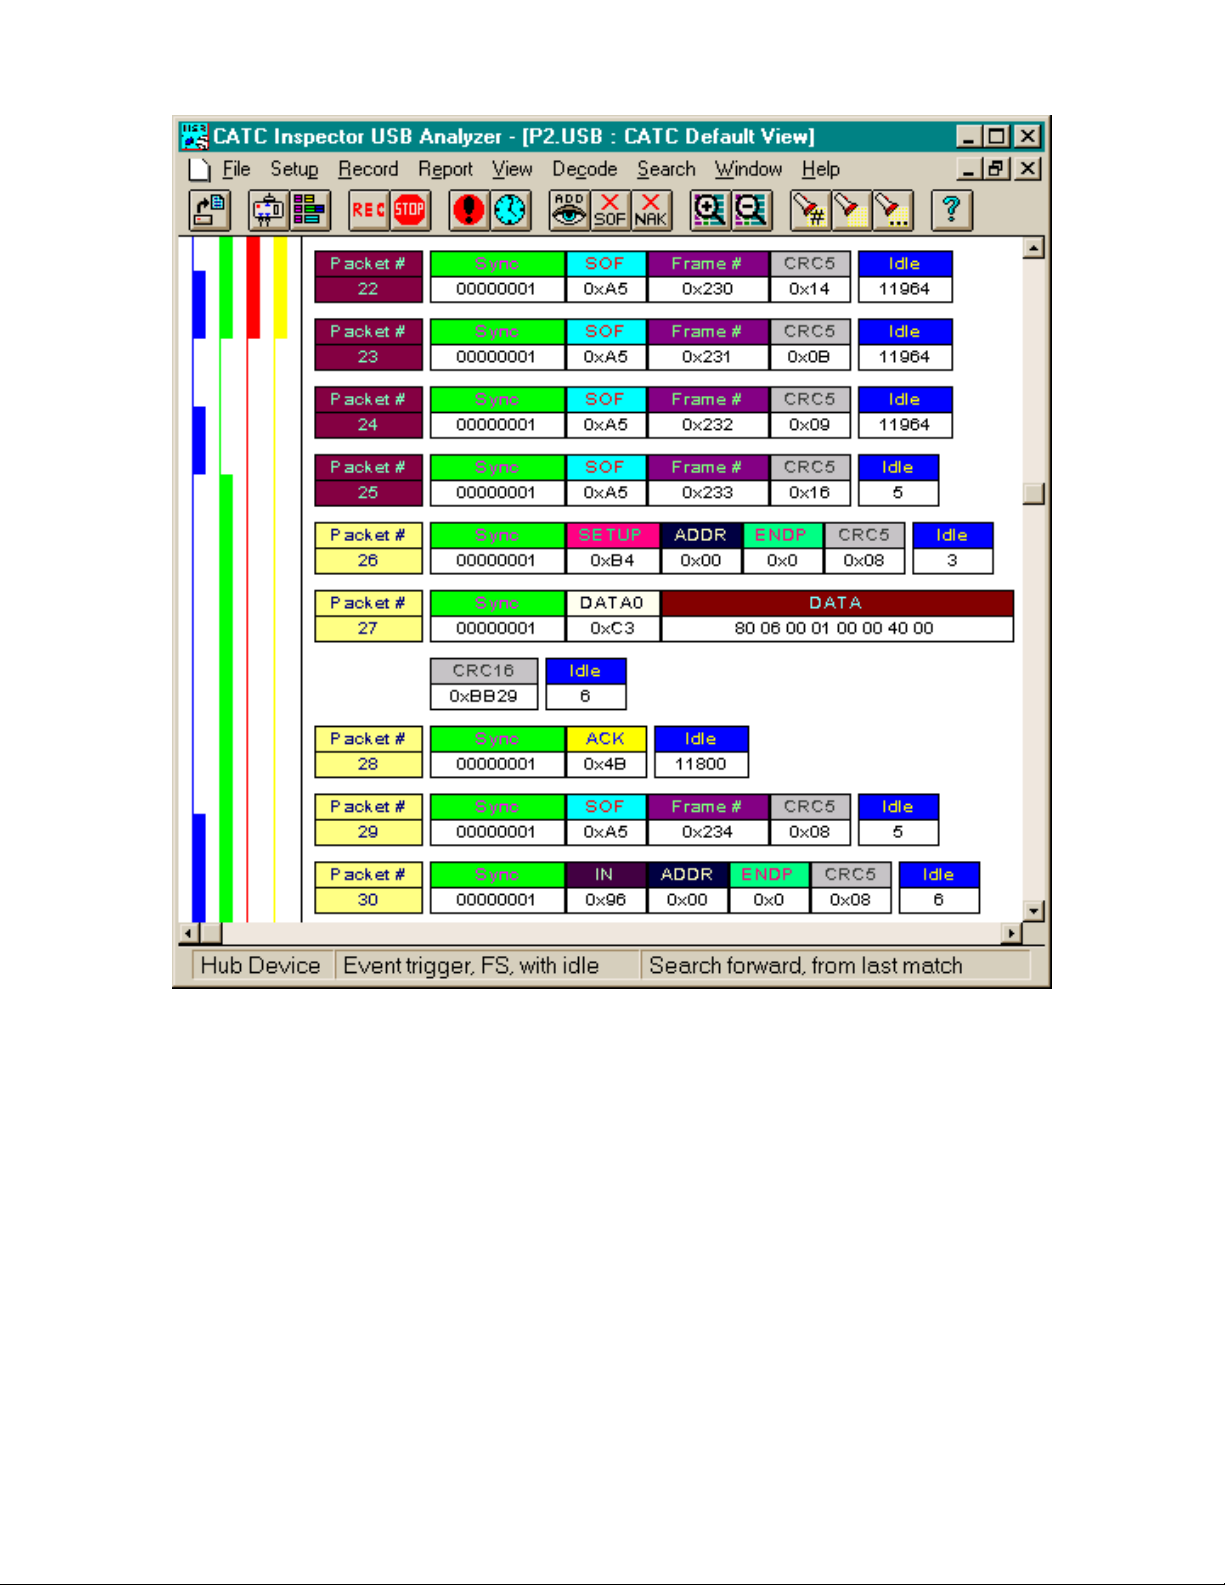
4.2.2 USB Packet Error Displays
The analyzer detects a variety of USB packet errors, and displays them as follows:
Packet #3 above has an invalid PID value; the PID value field is colored red, and the rest of the
packet is marked as “Invalid Data”. Packets #4 and #5 have incorrect CRCs; the CRC value field
is colored red, as are the preceding fields associated with the CRC value. Packet #6 has bit
stuffing errors; the affected field is marked as “Invalid Data”, with any byte containing a bit
stuffing error bracketed with exclamation marks (“!”). When a bit stuffing error occurs, it is no
longer possible to determine the correct data byte boundaries; thus all affected data (through the
end of the packet) are collected into a field labeled “Invalid Data”, displaying the raw data
received, from left to right (regardless of the order specified in the Field Format Display
Options).
A related situation is the special case of Sync fields. Occasionally, the analyzer does not
synchronize with the data stream until part way through the Sync token; such situations are
marked by replacing the missed leading zero bits with underscore (“_”) characters. This situation
is not considered an error, but the analyzer reports only bits it has actually acquired.
In addition to packet errors, the Inspector analyzer also detects a wide variety of transaction
errors. Reporting of these and other errors is discussed in section 4.6 (“The Report Menu”).
4.3 The File Menu
The file menu behaves as a standard Windows File menu, allowing the operator to open existing
analyzer traffic data files from previous sessions, save the data file from the current session,
create/edit data file comments, and print all or selected portions of the selected data file.
15
Page 20
CATC CATC Inspector User’s Manual Version 2.31
The File menu includes the following functions:
4.3.1 Open...
Open an existing, previously recorded “*.usb” file (i.e., a CATC Bus & Protocol analyzer USB
traffic file).
4.3.2 Close
Close an open traffic data file.
4.3.3 Save As...
Save the currently displayed USB traffic data file with a newly-specified file name (more
correctly, Rename... the file). If this function is not used following the capture of new data
(which is recorded in the default file “data.usb”), the next recording will overwrite it. Any file
name can be specified, though use of the “.usb” extension is recommended (see “Open”, above);
if no extension is specified, “.usb” will be added by default.
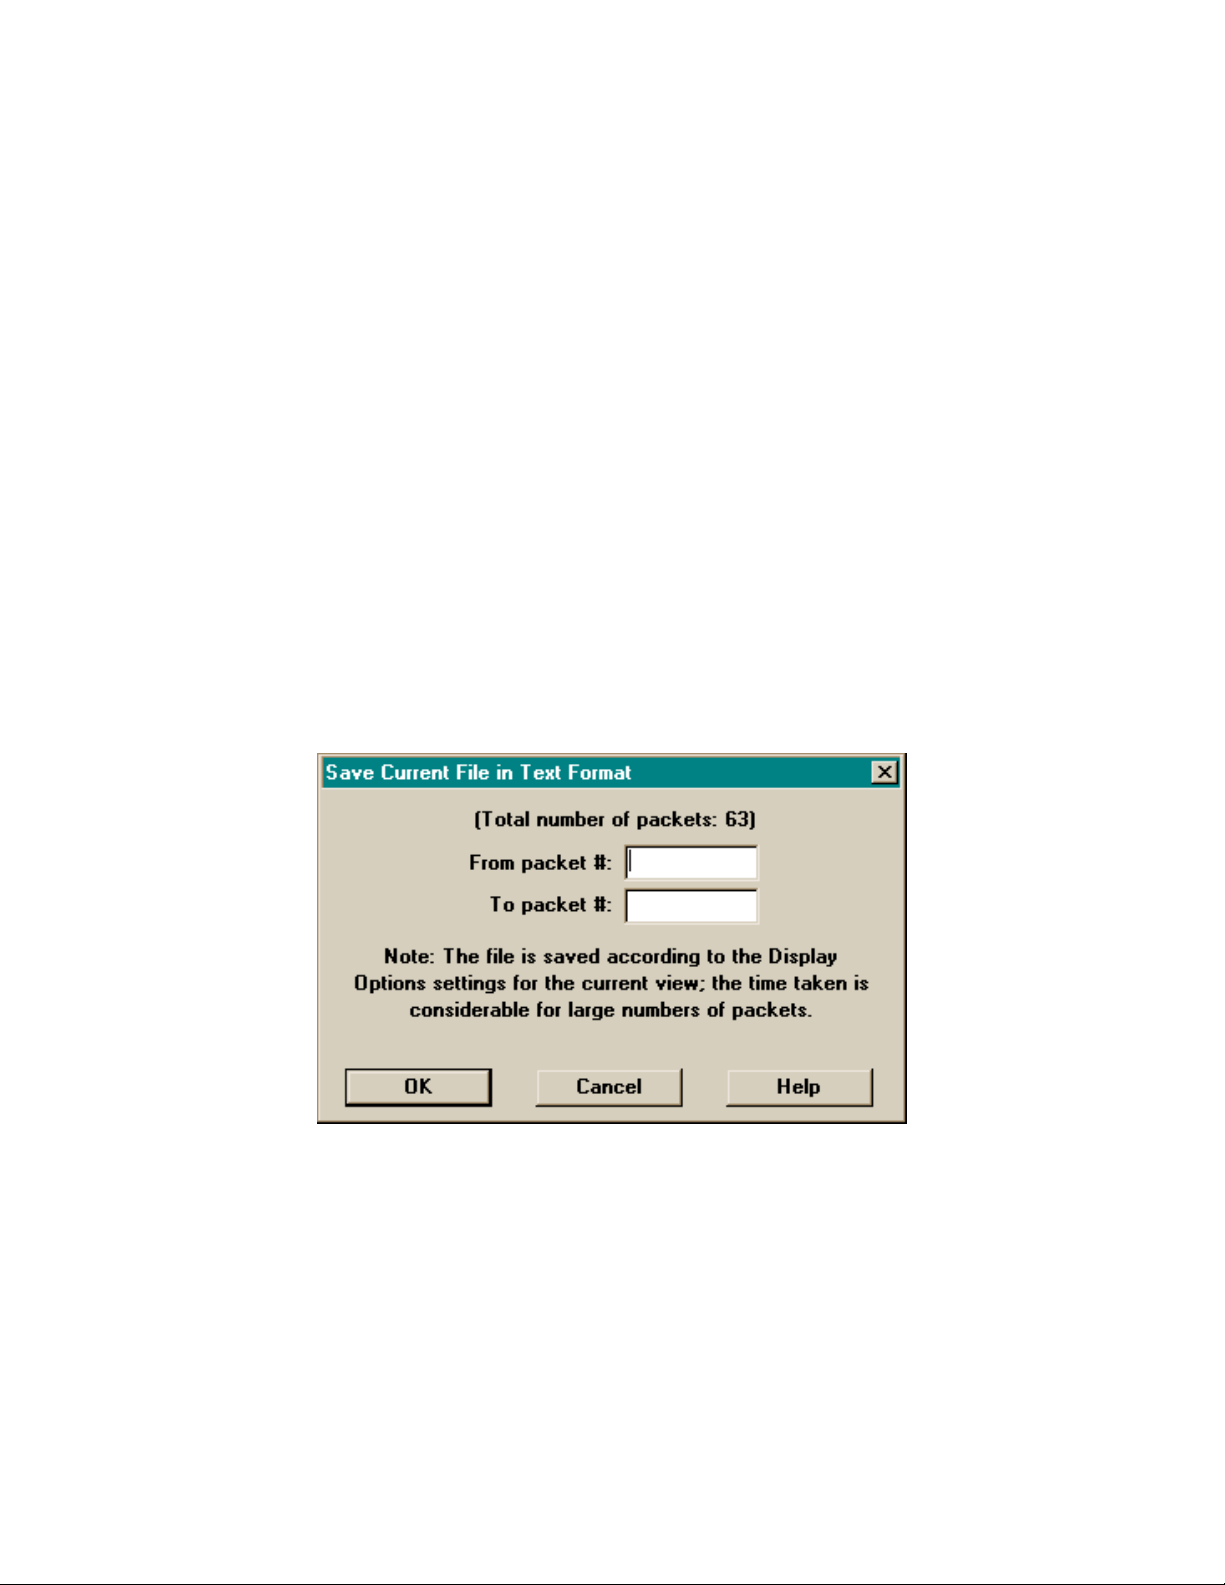
4.3.4 Save As Text...
Save all or a selected range of the current USB traffic data file in a text format for further
viewing, analysis, and/or printing. Activating this function opens up the following selection box:
Data are saved according to the Display Options settings for the current view. The saved file can
be opened with any standard text editor.
4.3.5 Edit Comment
Create, view, and/or edit the 50-character comment field associated with each USB traffic data
file.
16
Page 21

CATC CATC Inspector User’s Manual Version 2.31
4.3.6 Printer Setup...
The “Printer Setup...” menu item is a standard Windows function that allows configuring of the
printer (paper size, source, orientation, etc.).
4.3.7 Print...
Print all or a selected range of the current USB traffic data file. Activating this function opens up
the following selection box:
The specified traffic information will be printed as currently displayed, in color or grayscale as
supported by the destination printer. Any supplied comment (up to 60 characters in length) will
be printed following the current document name at the top of each page.
4.3.8 Exit
Terminate the CATC Inspector Windows application.
17
Page 22

CATC CATC Inspector User’s Manual Version 2.31
4.4 The Setup Menu
The CATC Inspector software offers many choices for recording, viewing, and analyzing USB
traffic. The Setup menu includes “Recording Options” and “Display Options” functions that
allow customization of these choices. Both functions are additionally available as individual
icons on the toolbar in the main display window.
4.4.1 Recording Options...
The “Recording Options...” menu item enables customization of the recording criteria, using the
following dialog box:
This box includes controls for trigger selection, idle state recording, bus speed selection,
constraining the memory buffer size, and a variety of file-related functions. Once the desired
recording options are specified (by activating the “OK” button), they remain valid until changed
again by the Recording Options function.
Note: Selecting the OK button to confirm record option selections does not start recording. To
actually record USB traffic, either the “REC” icon or the Record menu’s “Start” item
must be activated.
18
Page 23

CATC CATC Inspector User’s Manual Version 2.31
4.4.1.1 Trigger Selection
The CATC Inspector supports four modes of data recording triggering:
• Manual
• External Start
• External Stop
• Event Trigger
The external trigger modes work in conjunction with the trigger (active low) input on the
External Interface Breakout Board, as previously described under “External Triggers”.
4.4.1.1.1 Manual Trigger
In this mode, the analyzer will start to record when the user activates the “REC” icon or “Start”
in the Record Menu, and stop when the CATC Inspector on-board buffer memory is full or when
the “STOP” icon (or menu function) is activated, whichever comes first.
4.4.1.1.2 External Start Trigger
In this mode, the analyzer starts recording when an external trigger signal is detected. This
permits recording following a specific point of interest (aided by external decoding).
It is still necessary to “arm” the Inspector software by activating the “REC” icon or “Start” in the
Record Menu. Actual recording will begin following detection of an external trigger signal, and
stop when the CATC Inspector on-board buffer memory is full or when the “STOP” icon (or
menu function) is activated, whichever comes first.
4.4.1.1.3 External Stop Trigger
In this mode the analyzer stops recording when an external trigger signal is detected. This
permits recording up to a specific point of interest (aided by external decoding).
The operation is initialized by activating the “REC” icon or “Start” in the Record Menu. At
which time the analyzer will start recording immediately, and continuously, until it detects the
external trigger signal, or when the “STOP” icon (or menu function) is activated, whichever
comes first. The system’s buffer memory is filled cyclically until the stop trigger occurs, and thus
will hold (a maximum of) the last megabyte of USB data that appeared on the bus prior to the
trigger.
4.4.1.1.4 Event Trigger
In this mode, the analyzer will record the USB traffic stream surrounding the detection of one or
more specific events. These events are selected by the user, and include:
• a packet of a particular type
• a specific frame number
• a reference (Setup, In, or Out) to a particular address/endpoint
• a distinctive value in a data packet
• a protocol error condition (bad CRC, invalid PID, bit stuffing error)
19
Page 24

CATC CATC Inspector User’s Manual Version 2.31
• a static bus event (Suspend, Resume, Reset)
• an external trigger signal input
• various combinations of the above
Selection of the “Event Trigger” recording mode will enable the “Setup...” button immediately to
its right; clicking on the button will bring up the following dialog:
This dialog box contains four panels and a checkbox; the following examines each of these in
turn...
4.4.1.1.4.1 Packet Events
This panel allows for the selection of a variety of packet types (and, in some cases, contents). The
detection of a packet matching the specified criteria will be interpreted as a trigger event.
PID Type: This is the default event selection (using the dialog box shown above); it permits the
operator to select a particular PID type to act as the Event Trigger. Two of the permitted options
(“IN, OUT, or SETUP” and “DATA0 or DATA1”) combine multiple PID types into one
selection. A checkbox (“Trigger on any PID type NOT selected”) inverts the meaning of the PID
selection: the chosen item will be the only one not interpreted as a trigger event.
20
Page 25

CATC CATC Inspector User’s Manual Version 2.31
Frame Number: This option permits the definition of a trigger event as a specified frame number,
using the following dialog box:
The frame number can be entered in hexadecimal (the default), or—by marking the checkbox—
in binary.
Address and Endpoint: This option permits the definition of a trigger event as a specified
address/endpoint number, found in either or any of an In, Out, or Setup packet, using the
following dialog box:
The address and endpoint values can be entered in hexadecimal (the default), or—by marking the
checkbox—in binary.
21
Page 26

CATC CATC Inspector User’s Manual Version 2.31
Data String: This option permits the definition of a trigger event as a specified bit sequence,
using the following dialog box:
When searching specifically within a DATA0 or DATA1 packet, the Inspector hardware restricts
the length of the bit string to 8 bits; if both DATA0 and DATA1 packets are included in the
search target, the string can be 16 bits. The search makes no assumptions as to bit alignment; the
specified string will match any such sequence in the specified type(s) of data packets. Data
values can be entered in hexadecimal (the default), or—by marking the checkbox, as illustrated
above—in binary.
None: Selecting this option is appropriate when trigger events are to be chosen only from among
Error Events, Static Events, and an External Event (i.e., no packet-type-specific event is
required). It displays the following panel in the dialog box:
4.4.1.1.4.2 Error Events
Any combination of bad PID value, bad CRC value, and bit stuffing errors can be detected and
used as a trigger event, by marking the appropriate checkboxes.
22
Page 27

CATC CATC Inspector User’s Manual Version 2.31
4.4.1.1.4.3 Static Events
Any combination of USB Reset, Resume, and Suspend signals can be detected and defined as a
trigger event, by marking the appropriate checkboxes.
4.4.1.1.4.4 Post-Trigger Recording
The user can select the percentage of buffer memory assigned to post-trigger data recording;
available selections are: 95%, 75%, 50%, 25%, 5% and nonstop.
The software uses the analyzer’s full one megabyte memory to capture event-triggered USB
traffic (regardless of any buffer size specified by the user). Following the trigger event, recording
continues until the selected percentage of the total memory contains post-trigger data, and then
stops recording. When recording ceases, the program saves and displays the complete recorded
data stream, or the final megabyte of recording, whichever is less.
Note: The specified percentage is always that of the total memory; if the trigger event occurs
quickly, only a small portion of the buffer might be used for pre-trigger traffic, but the
post-trigger data will always occupy the specified amount of memory.
In nonstop mode, the analyzer continues to record indefinitely. This feature can be used to
generate USB event-decoding signals on the External Interface Breakout Board’s “Data In/Out”
connector for external circuitry.
4.4.1.1.4.5 External Event Trigger
To enable an external trigger, mark the Enable External Trigger checkbox in the Data Recording
Options dialog box.
23
Page 28

CATC CATC Inspector User’s Manual Version 2.31
4.4.1.2 Idle State Recording Selection
“Idle” is a valid state of the USB physical layer between packets. By default, the CATC Inspector
analyzer records all bus activity, including the Idle state; in this mode, the available buffer space
permits the recording of just under 0.67 second of full-speed (5.36s of low-speed) traffic.
Idle state recording can be disabled by selecting the “Don’t Record” option (in the Idle State
panel of the Data Recording Options dialog box, shown above); this will increase the recording
time to just under 4 minutes of full-speed traffic (low-speed recording time is traffic-dependent,
and could be hours). In this mode the analyzer suspends recording upon detection of the Idle, and
resumes upon detection of the start of the next packet (SOP), which is a transition from the J to
the K state.
Although this permits greatly increased recording times, there are two associated drawbacks:
1. When bus traffic is at a minimum, it can take a long time to fill the analyzer’s recording
memory. This is especially true if event detection mode is selected (and thus the memory size
cannot be reduced below one megabyte). Once a triggering event has been detected it may
still take several minutes before recording stops, due to limited bus traffic filling the memory.
Two things can be done to help alleviate this problem: setting the amount of post trigger
memory to a minimum, and stopping manually once the trigger has been detected. The
analyzer provides both LED and on-screen “triggered” indicators for this purpose.
2. Recording without Idle state eliminates the real-time information, so the CATC Inspector
software will not be able to support any of the timing related features.
4.4.1.2.1 User Input Data Recording
Whenever the Idle state is being recorded, it is also possible to simultaneously record up to four
externally supplied User Input Data signals (from the External Interface Breakout Board) along
with USB traffic. To select this option, mark the “Save User Input Data” checkbox in the Idle
State panel.
This can be quite useful for recording state or timing information from external devices, or for
extending the event detection capability of the analyzer. For example, it is possible to “jumper”
output signals from the breakout board back to the user data inputs, in order that selected events
can be viewed in the display while not selected as triggers. External timing signals (which should
be TTL levels to be recorded properly) are sampled once for each byte of USB traffic.
Recording, saving (in USB data files), and displaying this external timing and state data adds
notably to the processing time of the Inspector software (and the size of the traffic files); thus it is
recommended that this only be enabled as required.
24
Page 29

CATC CATC Inspector User’s Manual Version 2.31
4.4.1.3 Connection Speed Selection
This panel of the Data Recording Options dialog box allows specification of the USB branch
where the analyzer is connected. If Low-Speed is specified, the analyzer views the bus traffic as
would a low-speed device, switching its internal clock (from the full-speed 12 MHz) to 1.5 MHz
clock. Additionally, it inverts the data polarity to provide the software with the correct binary
information.
Note: To use the analyzer’s full event triggering capability with USB low-speed bus
transactions, it should be connected directly to the low-speed bus branch under test. If the
unit is connected to a full-speed branch containing low-speed traffic, the data content of
the low-speed packets will not be evaluated for triggering events. The PRE PIDs remain
valid triggering events, however, and all displays of USB traffic show complete full- and
low-speed packets.
4.4.1.4 File Name...
Use the specified file name when saving the recorded traffic data file; the default name is
“data.usb”. Any file name can be specified, though use of the “.usb” extension is recommended
(see “Open”, under “The File Menu”, above); if no extension is specified, “.usb” will be added
by default.
4.4.1.5 Save... (Recording Options)
Save the currently specified Recording Options for use in future recording sessions. Any file
name can be specified, though use of the “.rec” recommended is suggested (see “Load...”,
following); if no extension is specified, “.rec” will be added by default.
4.4.1.6 Load... (Recording Options)
Load a previously saved “*.rec” file, thus restoring a previous set of Recording Options.
4.4.1.7 Save As Default (Recording Options)
The “Save As Default” function is equivalent to the “Save...” function, specifying the file name
“default.rec”. Whenever the CATC Inspector software begins execution, it automatically loads
the “default.rec” file, if one exists.
4.4.1.8 Buffer Size
When recording without Idle, or from a low-speed branch, it is often useful to use less than the
full buffer space of the Inspector analyzer (to save recording time, or reduce the amount of
25
Page 30

CATC CATC Inspector User’s Manual Version 2.31
captured data). The “Buffer Size” panel of the Data Recording Options dialog box allows
selection of the desired portion (from 10% to 100%) of the buffer memory.
Note: This option has no effect when an Event Trigger is selected, in which case the entire buffer
memory is used.
4.4.2 Display Options...
The “Display Options...” menu item allows customization of the way that the recorded USB
traffic data files are presented on the screen. The USB Data Display Options dialog box includes
control buttons for the selection of data presentation and screen formatting options, plus the
ability to save and restore custom display option configurations. The Inspector software will
display the recorded data as specified, highlighting any packet fields that violate USB
specifications (e.g., missing stuff bits, invalid PID type, bad CRC, etc.).
Once the desired options are established (by selecting the OK button), they will remain valid
until the Display Options function (which can also be invoked from the Add View function in the
Display menu) is used again.
Note: Selecting the “OK” button to confirm the display options selection does not change the
current data view. Only newly created views are affected.
26
Page 31

CATC CATC Inspector User’s Manual Version 2.31
4.4.2.1 View Type
The user can choose whether to view recorded data in a “global” fashion (i.e., displaying all of
the data) or “by device”. In the latter case, a device is specified by entering its address and,
optionally, an endpoint number (if no ENDP is specified, all endpoints are included);
subsequently, only SOF (start of frame) packets, and those pertaining to transactions with the
specified device will be displayed. Note that the display of SOF and NAKed transaction packets
can be independently suppressed (see “Hidden Elements”, below).
4.4.2.2 Data Presentation
Recorded data is displayed either as a “Continuous” stream, or separated “By Packet”, as
selected. The following screen duplicates the USB traffic information of the screen shown in
section 4.2 (“The Main Display Window”), but uses a continuous mode display:
27
Page 32

CATC CATC Inspector User’s Manual Version 2.31
4.4.2.3 Field Formats
The CATC Inspector software supports several different formats in which the USB traffic data
can be displayed. When the ‘Field Formats’ button is selected, the following dialog box opens,
enabling a choice of viewing mode (either binary or hexadecimal format) for each of the special
message fields (Sync, PID, CRC, etc.). In addition, each field can be viewed with the most
significant bit (MSB) positioned on its left or right side.
Data fields can sometimes be quite lengthy. To reduce screen clutter, data fields longer than 64
bytes are always displayed in hexadecimal, regardless of the field format specification. In
addition, if the “Curtail long DATA” checkbox is marked, data fields longer than 16 bytes will
be displayed as their initial two bytes (one byte when in binary mode) plus a remaining byte
count. Thus a field that might otherwise occupy several lines of display will be shown as:
It is possible to revert back to the default setting at any time by selecting the ‘Set to Defaults’
button. After making the desired selections, selecting the OK button will close this dialog box
and return to the Display Options dialog box for additional selections.
4.4.2.4 Hidden Elements
It is occasionally convenient to display only some of the different USB packet fields. For
example, eliminating the display of Sync and Idle state fields (in situations where they are not
significant) can often simplify, and thus clarify, the traffic display. The Hidden Elements button,
28
Page 33

CATC CATC Inspector User’s Manual Version 2.31
which brings up the following dialog box, allows customization of the message fields to be
included in the display.
The suppression of certain entire packets may additionally be of benefit; the CATC Inspector
analyzer enables the removal of all SOF packets, and also those pertaining to any NAKed
transaction, from the traffic display. Note that the hiding of SOF and NAKed transaction packets
can also be controlled specifically for the current view (see section 4.7, “The View Menu”).
4.4.2.5 Field Colors
The Field Colors button allows customization of the color associated with each field in the
message, using the following dialog box:
29
Page 34

CATC CATC Inspector User’s Manual Version 2.31
Users may choose to experiment with this option to achieve a color combination that is best
suited to a particular graphic system. A brighter color might be appropriate for a specific field
that should stand out in the display (e.g. the Setup PID field). Note that the color of an Invalid
Data (packet error) field cannot be changed; it is permanently set to red.
Two color fields are provided for packet number displays. The first (“- Packet #”) is used to
define the color for packets prior to an Event Trigger; the second (“+ Packet #”) defines the color
for packets following the trigger. If the packet itself was the trigger-causing event, it will be
colored in the second color. In traffic streams that were recorded without an Event Trigger, all
packet number displays use the first color.
4.4.2.6 User Input Data
Selecting the User Input Data button brings up the following menu, with checkboxes for each of
the four channels of user input data that can be recorded by the CATC Inspector analyzer:
This merely chooses which of the user input data channels will be displayed; actual recording of
the input data is controlled by the “Save User Input Data” checkbox, located in the Idle State
panel of the Recording Options dialog box.
User input data is displayed to the left of—and time correlated with—the USB packet traffic, in
much the fashion of a traditional logic analyzer display. It is only shown in packet (i.e., not
continuous presentation) display mode. Note that the display colors for these items is fixed, and
cannot be altered by the user.
The displayed resolution of the USB traffic is on a per-packet basis, thus user input data that is
changing at a frequency greater than the packet rate will not be properly represented.
4.4.2.7 Save... (Display Options)
Save the currently specified Display Options for use in future sessions. Any file name can be
specified, though use of the “.opt” extension is recommended (see “Load...”, following); if no
extension is specified, “.opt” will be added by default.
4.4.2.8 Load... (Display Options)
Load a previously saved “*.opt” file, thus restoring a previous set of Display Options.
30
Page 35

CATC CATC Inspector User’s Manual Version 2.31
4.4.2.9 Save As Default (Display Options)
The “Save As Default” function is equivalent to the “Save...” function, specifying the file name
“default.opt”. Whenever the CATC Inspector software begins execution, it automatically loads
the “default.opt” file, if one exists.
4.4.2.10 Display Configuration Name
This field is used to enter a text string (30 characters maximum) to be associated with the current
set of Display Options. This name will be saved with the option set, and appear as part of the title
of the view window that is created using this set of options.
4.5 The Record Menu
The Record menu has two items (“Start” and “Stop”, described below), used to activate
recording activity. When the record function is active, the current recording status is displayed in
the status bar.
4.5.1 Start
Selecting the Start function instructs the CATC Inspector analyzer to begin recording USB traffic
data, as specified by the Recording Options.
4.5.2 Stop
Selecting the Stop function instructs the analyzer to stop the data recording process. This feature
is primarily of use when recording low-speed traffic, or not recording Idle states, which could
take a long time to fill the recording buffer.
31
Page 36

CATC CATC Inspector User’s Manual Version 2.31
4.6 The Report Menu
The Report Menu contains five items, used to generate information displays concerning the
current traffic data view.
4.6.1 File Information
The File Information menu item displays information about the traffic file currently being
viewed, including the recording time and conditions, and any comment line that may have been
added to the file.
32
Page 37

CATC CATC Inspector User’s Manual Version 2.31
4.6.2 Timing Calculations
This menu item (enabled only for files recorded with Idle state) opens the following “calculator”
display, permitting computation of the time difference between any two packets in the file:
Entering relevant packet numbers and selecting the “Calculate” button results in a display of the
packet-to-packet time (measured from start of Sync to start of Sync) in both microseconds (or
milliseconds), and bit times. If no packet numbers are entered, the computation is performed over
the entire range of packets in the currently displayed file. An appropriate error message is
provided if either of the selected packets does not contain a Sync field (i.e., SUSPEND or
RESET sequences).
If additional check boxes are marked, further information will be calculated and displayed (note
that bus usage computation can take a noticeable amount of time, depending on the range of
packets selected). Usage will also be computed for specific addresses (and optionally, endpoints;
if ENDP is left blank, all endpoints for the specified address will be included).
33
Page 38

CATC CATC Inspector User’s Manual Version 2.31
The following example shows such a display for a data capture of USB traffic, using isochronous
data transfers (the nature of the device—a camera—accounts for the high percentage of bus
utilization):
Selecting the “Show Formulas” button presents the following display, summarizing the formulas
used to compute bandwidth utilization.
34
Page 39

CATC CATC Inspector User’s Manual Version 2.31
Note: The active file display can be scrolled, and other files opened; the calculator dialog box
remains open (and frontmost) until “Cancel” is selected, or all files closed. Computations are
always performed on the currently active file.
4.6.3 Packet Error Summary
The Packet Error Summary menu item displays a summary table of abnormal bus conditions
detected in the current recorded file, as follows:
For each error type, the summary lists the packet number(s) in which these errors occur. The
dialog box remains open (and frontmost) even if the window is no longer active, allowing
manipulation of the open data file view while the error summary is visible (for example, scroll or
go to an error packet listed in the error summary). Packet error summary data can be saved (with
the “Save As...” button) for future use. See “Saving Summaries as Text Files”, below.
Note: The number of error packets listed in the error summary is limited to a maximum of 200
for each error type.
4.6.4 Transaction Error Summary
Selecting the Transaction Error Summary menu item brings up a dialog box enabling the
specification of a range of packets to search for transaction errors (initialized to the complete set
of packets in the file), as follows:
35
Page 40

CATC CATC Inspector User’s Manual Version 2.31
Selecting “OK” in this dialog will subsequently display a listing of possible transaction errors
detected in the specified range of packets, such as:
When there are long lists of packets containing the same transaction error (as in the above
example), only the first 20 will be shown, followed by an ellipsis (...).
Note that it is not always possible to precisely determine the existence (or lack thereof) of
transaction errors, particularly in the presence of isochronous traffic; all suspect occurrences
should thus be interpreted as “potential” errors. The above example, for instance, is actually the
result of sampled isochronous traffic, and the reported “errors” are merely artifacts of the
isochronous data streams.
Transaction error summary data can be saved (with the “Save As...” button) for future use. See
“Saving Summaries as Text Files”, below.
4.6.5 Traffic Summary
Selecting this menu item brings up a dialog box enabling the specification of a range of packets
over which to accumulate traffic statistics (initialized to the complete set of packets in the file),
as with the Transaction Error Summary. Selecting “OK” then generates a summary of a variety of
traffic statistics for the currently selected file, including counts of packets, frames, empty frames,
transaction errors, and packet errors, plus listings of transactions (ordered by device) and control
transfers, such as the following:
36
Page 41

CATC CATC Inspector User’s Manual Version 2.31
Note that—unlike the other statistics—the packet error count is computed for the entire data file,
not just for the range of packets selected in the earlier dialog box.
Traffic statistics data can be saved (with the “Save As...” button) for future use. See “Saving
Summaries as Text Files”, below.
4.6.6 Saving Summaries as Text Files
Results of the three summary items in the Report Menu (as well as exported I/O data; see “The
I/O Operation Pop-Up Menu”, below) can be saved as text files. Any file name can be specified,
though use of the “.txt” extension is recommended; if no extension is specified, “.txt” will be
added by default.
If the saved file is opened with a text editor using a monospaced type font, the text will not be
aligned in the same fashion as it appears in the analyzer’s display window. To most closely
approximate this display use the MS Sans Serif font in an 8 point size.
37
Page 42

CATC CATC Inspector User’s Manual Version 2.31
4.7 The View Menu
4.7.1 Add View
The Add View function is used to open a new window with an additional view of the currently
selected USB data file. This is useful to:
• view the recorded data in a different format, or
• view (in conjunction with the “Tile Windows” function) two portions of the data file
simultaneously.
As the former is the more common usage, the following dialog box is automatically opened to
allow modification of the current viewing format.
Note that this is identical to the default Display Options dialog box, except for the title bar
(which is intended to remind the user that the options about to be specified are for this particular
view only, and will not be retained for subsequent use). The newly specified view of the data file
will then be displayed.
Note: The previous display window remains open; the user can switch among display windows,
or arrange them for simultaneous viewing, by using the Window menu.
4.7.2 Hide SOF
In order to reduce display “clutter”, this menu item removes the display of all Start of Frame
packets from the current view (a new view is not created; the current view is redrawn). The
action takes place immediately, unlike the otherwise equivalent operation in the Display Options
selection, where it affects subsequent presentations.
As with several of the more frequently-used Inspector options, the Hide SOF feature is accorded
its own toolbar icon; this particular button indicates its current state by appearing depressed (or
not, as appropriate) in the toolbar display.
38
Page 43

CATC CATC Inspector User’s Manual Version 2.31
4.7.3 Hide NAKed Transactions
This menu item functions identically to the Hide SOF operation, except that it is used to suppress
the display of any packets pertaining to NAKed transactions.
4.7.4 Zoom In
The zoom entries in the View Menu provide an ability to adjust the size of the displayed
elements in a USB traffic file, in order to represent more (or less) information on the screen (or
printed output). Nine levels of zoom are implemented.
“Zoom In” increases the size of the displayed elements, allowing fewer (but larger) packet fields
per screen. This function is also available as an icon in the toolbar.
4.7.5 Zoom Out
This function decreases the size of the displayed elements, allowing more (but smaller) packet
fields per screen. This function is also available as an icon in the toolbar.
4.7.6 Set Current Zoom Value as Default
This function causes the current element size to be used as the default value upon subsequent
invocations of the CATC Inspector analyzer.
4.8 The Decode Menu
If the current file contains class-specific USB device requests, the CATC Inspector software can
decode the contained information according to the appropriate Device Class specifications.
4.8.1 Select Device Class...
The “Select Device Class...” menu item brings up the following dialog box, allowing selection of
a USB Device Class:
39
Page 44

CATC CATC Inspector User’s Manual Version 2.31
Selecting a Device Class will cause future Decode Device Requests to interpret the protocol
information according to the specification for the selected class.
IMPORTANT: If the appropriate Device Class is not supported by the Inspector software, the
user should select the Standard Request Only option. Applying an improper Device Class
specification to class-specific commands will display undefined results!
Note: A Device Class can also be selected by clicking with the right mouse button on the title of
any SETUP field on the screen. See “The Device Decoding Pop-Up Menus”.
Note: The Inspector software incorporates support for standard and Hub Class operations
directly in the application code. Other classes are added at system startup time, by
reading a set of library files (e.g., “CLS_HID.DLL” for the Human Interface Device
Class); these additional classes will automatically show up as options on the above dialog
box (which here shows an added “HID Class”). Contact CATC for information on the
availability of these additional Device Class files.
4.8.2 Decode Device Request...
Control Transfers from the USB host to Endpoint 0 of a specific device are defined by the USB
specification as USB Device Requests. The “Decode Device Request...” menu item displays a
decoding of such requests (including the naming of the standard requests and descriptor types)
according to USB Specification 1.0, using the following dialog box:
Two options are available: letting the software automatically search for the next SETUP and
perform the decoding of the associated request, and providing the packet number for the SETUP
token that begins the setup stage of the desired request. Selecting the OK button then decodes the
specified Device Request.
Note: A specific Device Request can also be decoded by clicking with the left mouse button on
the title of its SETUP field on the screen. See “The Device Decoding Pop-Up Menus”.
40
Page 45

CATC CATC Inspector User’s Manual Version 2.31
The following dialog box is displayed following a Decode Device Request operation (The
contents of the decoded display depend somewhat upon the Device Class and the specific Device
Request):
41
Page 46

CATC CATC Inspector User’s Manual Version 2.31
4.8.2.1 Decoded Standard Requests
If the decoded standard request is GET_DESCRIPTOR and the requested descriptor is DEVICE
or CONFIGURATION, or the request is SET_DESCRIPTOR, a button called “Show Descriptor
Data” appears in the USB Device Request Data dialog box (as in the above example). Selecting
this button brings up a form similar to the following, displaying the descriptor(s) returned by (or
sent to) the device, decoded according to USB Specification 1.0:
The scrollbar at the right side of the form permits viewing of all descriptor fields. If the device
only sends a portion of a descriptor, the Inspector software marks missing fields with “N/A”.
42
Page 47

CATC CATC Inspector User’s Manual Version 2.31
If the decoded standard request is GET_DESCRIPTOR and the requested descriptor is STRING,
the “Show Descriptor Data” button displays a form similar to the following, showing the string
decoded according to USB Specification 1.0:
In the above example, the representation of the string size as “78+2” is intended to remind the
user that the total length of the string is comprised of the data portion (78 bytes in this instance)
plus two bytes used to store the data length.
43
Page 48

CATC CATC Inspector User’s Manual Version 2.31
If a Configuration request is made, the device is expected to return a configuration descriptor and
all interface and endpoint descriptors. In this case, Next and Previous buttons will appear at the
bottom of the form, allowing viewing of all the returned descriptors in the order in which they
were sent by the device.
The scrollbar at the right side of the form permits viewing of all the entries. If the device only
sends a portion of the data, the Inspector software marks missing entries with “N/A”.
44
Page 49

CATC CATC Inspector User’s Manual Version 2.31
If the decoded standard request is GET_INTERFACE (or GET_CONFIGURATION), a button
called “Show Alternate Setting:” (or “Show Configuration:”) appears in the USB Device Request
Data dialog box, as follows:
Selecting this button displays the value that was returned by the device (on the same form, in a
small window immediately below the button).
45
Page 50

CATC CATC Inspector User’s Manual Version 2.31
If the decoded standard request is GET_STATUS), a button called “Show Status” appears in the
USB Device Request Data dialog box; selecting this button brings up a form similar to the
following, displaying the status information returned by the device, decoded according to USB
Specification 1.0:
The form displays the recipient of the request (device, interface, or endpoint) as part of its title.
For interface and endpoint recipients, it also displays the corresponding number. The scrollbar at
the right side of the form permits viewing of all the entries. If the device only sends a portion of
the data, the Inspector software marks missing entries with “N/A”.
46
Page 51

CATC CATC Inspector User’s Manual Version 2.31
4.8.2.2 Decoded Hub Class Requests
Decoded USB Hub Descriptor
If the decoded standard request is GET_DESCRIPTOR, a button called “Show Descriptor Data”
appears in the USB Device Request Data dialog box (as in the earlier example). Selecting this
button brings up a form similar to the following, displaying the returned Hub descriptor, decoded
according to USB Specification 1.0:
The scrollbar at the right side of the form permits viewing of all the entries. If the device only
sends a portion of the data, the Inspector software marks missing entries with “N/A”.
47
Page 52

CATC CATC Inspector User’s Manual Version 2.31
Decoded Hub Status/Change for Hub Device
The following form displays the hub status information that was returned by the USB Hub on a
hub-class-specific GET_STATUS (GetHubStatus) request, decoded according to USB
Specification 1.0:
Corresponding change information can be viewed using the Next button at the bottom of the
form. The scrollbar at the right side of the form permits viewing of all the entries. If the device
only sends a portion of the data, the Inspector software marks missing entries with “N/A”.
48
Page 53

CATC CATC Inspector User’s Manual Version 2.31
Decoded Port Status/Change for Hub Device
The following form displays the port status information returned by the Hub on a hub-classspecific GET_STATUS (GetPortStatus) request, decoded according to USB Specification 1.0:
The form displays the number of the port for which status information was requested in its title.
Corresponding change information can be viewed using the Next button at the bottom of the
form. The scrollbar at the right side of the form permits viewing of all the entries. If the device
only sends a portion of the data, the Inspector software marks missing entries with “N/A”.
4.8.2.3 Decoded Requests for Other Device Classes
The Inspector software incorporates support for standard and Hub Class operations directly in the
application code. Other classes are added at system startup time, by reading a set of library files
(e.g., “CLS_HID.DLL” for the Human Interface Device Class); these additional classes will
automatically show up as options on the “Select Device Class...” dialog box. Contact CATC for
information on the availability of these additional Device Class files.
49
Page 54

CATC CATC Inspector User’s Manual Version 2.31
4.9 The Search Menu
The CATC Inspector software provides several options for searching through the recorded USB
traffic, allowing the user to find specific packets, based on triggering status, or packet number,
marking, or content. The three most common actions (Go to Packet, Find, and Next) also have
their own individual icons on the toolbar.
4.9.1 Go to Packet...
When the “Go to Packet...” menu item (or the associated toolbar icon) is selected, the following
dialog box opens. To move quickly to a view of a specific packet, enter the packet number and
select OK; the display will be repositioned with the specified packet at the top.
4.9.2 Go to Trigger
The “Go to Trigger” menu item is only enabled when the traffic file is the result of an Event
Trigger. When the item is selected, the display will be repositioned with the first packet
following the trigger event (or the packet that caused the trigger) at the top.
4.9.3 Go To Marker
The “Go to Marker” menu item is only enabled when one of the packets in the traffic data file
has been marked (using the Packet Marker & Timing pop-up menu, described below). When the
item is selected, the display will be repositioned with the marked packet at the top.
4.9.4 Find...
The “Find...” menu item enables searching for specific bus events within the recorded data file.
The CATC analyzer will search for:
1. protocol violations:
• bad PID (check field)
• undefined PID
• bad CRC5
• bad CRC16
• missing stuff bits
2. packets with specific PIDs (e.g., Setup)
3. bus transactions with specific device Ids
50
Page 55

CATC CATC Inspector User’s Manual Version 2.31
4. specific frame numbers
5. empty frames (with SOF token only)
6. non-empty frames (including one or more non-SOF fields)
7. specific bit strings in data fields
8. transactions with low speed devices (PRE)
9. reset conditions (SE0)
10. suspend & resume conditions
Selecting “Find...” (or the associated toolbar icon) brings up the following dialog box:
As a rule, the general search parameters (Direction, Origin, and Scope of search) should be
selected prior to the specific ones (PID, Error Condition, Frame, ADDR & ENDP, Static Bus
Event, and Data String), as selecting the “OK” button in the specific event dialogs will launch the
search immediately, without returning to this initial setup screen.
Note: The “Start of File” and “End of File” origins are considered temporary in nature;
immediately following a search from either location, the origin will be changed to “Last
Match”. This convention provides intuitive behavior when the “Search Next” feature is
employed.
The following keyboard shortcuts can also be used (at any time) to change the direction and
origin of searches:
Ctrl-f
Ctrl-b
direction: forward
direction: backward
51
Page 56

CATC CATC Inspector User’s Manual Version 2.31
Ctrl-t
Ctrl-m
The current settings for the search direction and origin are always displayed in the right segment
of the status bar.
origin: top of screen
origin: last match
4.9.4.1 Find PID
Selecting the PID button brings up the following dialog box, to allow selection of a specific PID
type:
Selecting the “OK” button will then launch the search for the selected PID, using the search
direction, origin, and scope previously specified.
The following keyboard shortcuts can also be used (at any time) to search for a specific PID:
Shift-s
Shift-o
Shift-i
Shift-f
Shift-0
Shift-1
Shift-a
Shift-n
Shift-l
Shift-p
SETUP
OUT
IN
SOF
DATA0
DATA1
ACK
NAK
STALL
PRE
52
Page 57

CATC CATC Inspector User’s Manual Version 2.31
4.9.4.2 Find Error Condition
Selecting the Error Condition button brings up the following dialog box, to allow specification of
particular error conditions (or, by selecting “All”, any error condition):
Selecting the “OK” button will then launch the search for the selected error condition, using the
search direction, origin, and scope previously specified.
4.9.4.3 Find Frame
Selecting the Find Frame button brings up the following dialog box, to allow selection of a
specific frame (by Frame ID number), an empty frame (containing only an SOF token), or a nonempty frame (containing one or more fields other than SOF):
Selecting the “OK” button will then launch the search for the selected frame, using the search
direction, origin, and scope previously specified.
The following keyboard shortcuts can also be used (at any time) to search for empty or nonempty frames:
< (Shift-comma)
> (Shift-period)
empty frame
non-empty frame
53
Page 58

CATC CATC Inspector User’s Manual Version 2.31
4.9.4.4 Find ADDR and ENDP
Selecting the ADDR and ENDP button brings up the following dialog box, to allow selection of
a specific device address and endpoint:
The search can be restricted to any combination of In, Out, and Setup packets by marking the
appropriate checkboxes. Selecting the “OK” button will then launch the search for a packet with
the selected device address and endpoint, using the search direction, origin, and scope previously
specified.
4.9.4.5 Find Static Bus Event
The Static Bus Event button is only enabled when the traffic file was recorded with Idle state; it
permits searching for the static bus events Reset and Suspend/Resume. Selecting this button
brings up the following dialog box, to allow specification of a particular event:
Selecting the “OK” button will then launch the search for a packet with the specified static bus
event, using the search direction, origin, and scope previously specified.
54
Page 59

CATC CATC Inspector User’s Manual Version 2.31
4.9.4.6 Find Data String
Selecting the Data String button brings up the following dialog box, to allow selection of a
specific data pattern within the DATA fields of the traffic file:
Up to 10 bytes of data (hexadecimal notation, MSB of each byte on the left) can be specified.
Selecting the “OK” button will then launch the search for a packet with the selected data string,
using the search direction, origin, and scope previously specified.
An example: to search for the standard device request “Get Device Descriptor”, specify the data
string ‘80060001’.
Note: Data string searches are performed on a strict bit-by-bit basis; thus, if the specified bit
string appears anywhere within a data field (whether or not its position-based
hexadecimal representation is identical to that entered) it will produce a match.
4.9.5 Next
Selecting the “Next” menu item (or the associated toolbar icon) will repeat the previous search;
that is, it will initiate another search using the previously selected parameters (recall that
“start/end of file” origins are automatically converted to “last match”). In keeping with Windows
tradition, function key F3 also invokes this function.
4.10 The Window Menu
The Window menu is a standard Windows function that allows the open windows to be viewed
and arranged in different ways.
4.11 The Help Menu
The Help menu is a standard Windows function that supplies additional information on the
various functions of the CATC Inspector program when it is in use.
55
Page 60

CATC CATC Inspector User’s Manual Version 2.31
4.12 The Data Field View Pop-Up Menu
Clicking on the title of any DATA field will bring up the following Data Field menu for short
data fields:
or one of the following menus for data fields containing more than 16 bytes:
Selecting the single “What’s the length?” menu item will display the length of the associated data
field, using the following display box:
The second menu item enables toggling of the current data display format, between full and
curtailed display modes, as previously described under Field Formats. When invoked by the popup menu, the display change will take place immediately.
4.13 The Packet Marker & Timing Pop-Up Menus
Clicking on the “Packet #” title of any packet display will bring up the following menu (files
recorded without Idle state will not show the timing-related items):
The first menu item is associated with the concept of “marking” a particular packet in the traffic
data file (only one packet can be marked at any given time). This marked packet (displayed with
a distinctive red outline) can be the target of a Search operation (see above), and also a point of
reference for timing measurements. If any packet is marked, subsequent invocation of this pop-up
menu will produce one of the following displays:
56
Page 61

CATC CATC Inspector User’s Manual Version 2.31
Selecting the relevant menu item will then either clear the marker or relocate it to the current
packet (that which spawned the pop-up menu).
The remaining menu items (displayed only for files recorded with Idle state) are used to compute
timing information for the associated packet. Selecting “Packet Length” will display the time
taken by the packet, from start of Sync to the end of EOP signaling. Selecting “Packet Position”
will display the frame-related position of the packet (the time from the closest previous Start of
Frame/keep-alive and the time to the closest following SOF/keep-alive). Both durations are
displayed as equivalent bit times and in microseconds, as in the following example:
Appropriate error messages are displayed if the selected packet contains a RESET or SUSPEND/
RESUME, or if the lack of an SOF/keep-alive makes the computation of the associated time
impossible.
Finally, selecting the “Time From Marker” (or “Time To Marker”, as appropriate) menu item
will display the elapsed time from the marked packet, using the “Timing & Bus Usage
Calculator” display.
4.14 The Device Decoding Pop-Up Menus
Clicking on the title of any SETUP field with the right mouse button will bring up the following
menu, allowing the selection of a USB Device Class to be used in subsequent decoding:
Clicking on the title of any SETUP field with the left mouse button will bring up the following
single item menu, allowing decoding of its device-specific information, according to the
currently selected Device Class:
57
Page 62

CATC CATC Inspector User’s Manual Version 2.31
4.15 The I/O Operation Pop-Up Menu
Clicking on the title of any IN or OUT field will bring up the following menu:
The “Export Bulk/Control Data” and “Export Isochronous Data” menu items are intended for the
output of data to a file. The analyzer is not able to determine with certainty the type of data
transfer involved, so uses the user’s specification of the associated transfer type (bulk/control or
isochronous) to guide its “best effort” attempt to isolate the chosen data transfer. Any NAKed
data is not included. The collected data is first displayed in a form such as the following:
The extracted data can now be saved (with the “Save As...” button) for future use. See “Saving
Summaries as Text Files”, above.
58
Page 63

CATC CATC Inspector User’s Manual Version 2.31
Selecting the “Response Time” menu item brings up the following display, showing the elapsed
time from the selected I/O request and the closest following positive response to same:
5. TRIGGERING LOGIC ANALYZERS AND
OSCILLOSCOPES BASED ON USB TRAFFIC
It is sometimes desirable to capture the internal state of some USB device at the time of a
specific Bus event. This might be something like “one-shot” tracing of a control program with a
logic analyzer upon some error condition, or looking for a logic error by triggering an
oscilloscope every time a specific device or endpoint is addressed. The CATC Inspector tool can
easily be used to produce triggering signals for these operations.
This is facilitated by the External Interface Breakout Board, which provides output pins for (and
thus convenient access to) the configurable trigger signal and those representing pre-determined
USB events, error conditions, and clocking information. All such signals are TTL/CMOS
compatible, low level true.
For the Logic analyzer example above, the analyzer’s Recording Options are set to Event
Trigger, and the desired triggering event(s) specified. These might include a specific Address and
Endpoint or Data String value. When recording is initiated, the CATC Inspector tool will monitor
USB traffic and produce a TRIGGER (out) signal when the desired event occurs. This signal can
be used to start or stop logic analyzers and digital storage oscilloscopes. Traditional analog
oscilloscopes can benefit from a slightly different analyzer setup. Recording Options and Trigger
Selection are as above, but the Post-Trigger Recording selection should be set to Nonstop. This
prevents the analyzer itself from stopping on the selected event, thereby providing TRIGGER
signals upon each occurrence.
59
Page 64

CATC CATC Inspector User’s Manual Version 2.31
6. HOW TO CONTACT CATC
Type of Service Contact
Call for technical support... US and Canada: +1/ 800 909 2282
Worldwide: +1/ 408 727 6600
Fax your questions... Worldwide: +1/ 408 727 6622
Write a letter... Computer Access Technology Corp.
Customer Support
2403 Walsh Avenue
Santa Clara, CA 95051-1302
Send e-mail...
Visit CATC’s Website...
7. WARRANTY AND LICENSE
Computer Access Technology Corporation (hereafter CATC) warrants this product to be free
from defects in material, content, and workmanship, and agrees to repair or replace any part of
the enclosed unit that proves defective under these terms and conditions. Parts and labor are
warranted for one year from the date of first purchase.
The CATC Inspector software is licensed for use on a single PC. The software may be copied for
backup purposes only.
This warranty covers all defects in material or workmanship. It does not cover accidents, misuse,
neglect, unauthorized product modification, or acts of nature. Except as expressly provided
above, CATC makes no warranties or conditions, express, implied, or statutory, including
without limitation, the implied warranties of merchantability and fitness for a particular purpose.
CATC shall not be liable for damage to other property caused by any defects in this product,
damages based upon inconvenience, loss of use of the product, loss of time or data, commercial
loss, or any other damages, whether special, incidental, consequential, or otherwise, whether
under theory of contract, tort (including negligence), indemnity, product liability, or otherwise. In
no event shall CATC’s liability exceed the total amount paid to CATC for this product.
support@catc.com
http://www.catc.com/
60
 Loading...