

Page 1
PROTOCOL SOLUTIONS GROUP
3385 SCOTT BLVD
SANTA CLARA, CA 95054
Analyzer/Exerciser/DC Verification
Conquest
USB 2.0/1.x
User Manual
Version 7.45
For Software Version 7.45
August 2009
Page 2

Trademarks and Servicemarks
disposal and recycling regulations that
var y b y country and region. Man y
countries prohibit the disposal of
waste electronic equipment in
standard waste receptacles.
For more information about proper
disposal and recycling of your Catalyst
product, please visit
www.getcatalyst.com/recycle.
LeCroy and Conquest are trademarks of LeCroy Corporation.
Universal Serial Bus and On-The-Go are registered trademarks of USB-IF.
Microsoft and Windows are registered trademarks of Microsoft Corporation.
Intel and Pentium are registered trademarks of Intel Corporation.
AMD Duron and AMD Athlon are trademarks of Advanced Micro Devices Inc.
All other trademarks and registered trademarks are property of their respective owners.
Disclaimer
THE SPECIFICATIONS AND INFORMATION REGARDING THE PRODUCTS IN THIS MANUAL ARE
SUBJECT TO CHANGE WITHOUT NOTICE. ALL INFORMATION, EXAMPLES AND
RECOMMENDATIONS IN THIS MANUAL ARE BELIEVED TO BE ACCURATE BUT ARE
REPRESENTED WITHOUT WARRANTY OF ANY KIND, EXPRESS OR IMPLIED. USERS ARE FULLY
RESPONSIBLE FOR THEIR APPLICATION OF ANY PRODUCTS.
THE SOFTWARE LICENSE AND LIMITED WARRANTY FOR THE ACCOMPANYING PRODUCT ARE
SET FORTH IN INFORMATION THAT SHIPPED WITH THE PRODUCT AND ARE INCORPORATED
HEREIN BY THIS REFERENCE. IF YOU ARE UNABLE TO LOCATE THE SOFTWARE LICENSE OR
LIMITED WARRANTY, CONTACT LeCroy FOR A COPY.
Copyright
Copyright © 2009, LeCroy Corporation; All rights reserved.
This document may be printed and reproduced without additional permission, but all copies should contain
this copyright notice.
WEEE Program
This electronic product is subject to
Page 3

Contents
Table of Contents
Conquest Versions - - - - - - - - - - - - - - - - - - - - - - - - - - - - - - - - - - - - 1
Conquest M2 versus Conquest - - - - - - - - - - - - - - - - - - - - - - - - - - - - - - - - - 1
Common Software - - - - - - - - - - - - - - - - - - - - - - - - - - - - - - - - - - - - - - - - - - 1
Conquest M2 (SBAE30) and Conquest Supported Features - - - - - - - - - - - 2
Introduction- - - - - - - - - - - - - - - - - - - - - - - - - - - - - - - - - - - - - - - - - - 3
Overview - - - - - - - - - - - - - - - - - - - - - - - - - - - - - - - - - - - - - - - - - - - - - - - - - 3
Analyzing USB Designs With the Analyzer - - - - - - - - - - - - - - - - - - - - - - - - 4
Conquest M2 Options - - - - - - - - - - - - - - - - - - - - - - - - - - 5
Host Exerciser- - - - - - - - - - - - - - - - - - - - - - - - - - - - - - - - - - - - - - - - - - 5
Device Emulation- - - - - - - - - - - - - - - - - - - - - - - - - - - - - - - - - - - - - - - - 5
OTG Exerciser - - - - - - - - - - - - - - - - - - - - - - - - - - - - - - - - - - - - - - - - - 5
DC Compliance measurement - - - - - - - - - - - - - - - - - - - - - - - - - - - - - - 5
Timing Analyzer- - - - - - - - - - - - - - - - - - - - - - - - - - - - - - - - - - - - - - - - - 5
Conquest M2 Interface - - - - - - - - - - - - - - - - - - - - - - - - - - - - - - - - - - - - - - - 6
Status LED Function Description - - - - - - - - - - - - - - - - - - - - - - - - - - - - - - - 6
Manual Trigger - - - - - - - - - - - - - - - - - - - - - - - - - - - - - - - - - - - - - - - - - - - 6
External Signals (Ext. Out, Ext. Trig In, and Ext. Clk) - - - - - - - - - - - - - - - - - 6
Ports - - - - - - - - - - - - - - - - - - - - - - - - - - - - - - - - - - - - - - - - - - - - - - - - - - - 7
Power In - - - - - - - - - - - - - - - - - - - - - - - - - - - - - - - - - - - - - - - - - - - - - - - - 7
Analyzer/Exerciser Connection Identification - - - - - - - - - - - - - - - - - - - - - - 8
Receiving the Analyzer - - - - - - - - - - - - - - - - - - - - - - - - - - - - - - - - - 9
Conquest M2 - - - - - - - - - - - - - - - - - - - - - - - - - - - - - - - - - - - - - - - - - - - - - - 9
Conquest - - - - - - - - - - - - - - - - - - - - - - - - - - - - - - - - - - - - - - - - - - - - - - - - - 9
Unpacking the Analyzer - - - - - - - - - - - - - - - - - - - - - - - - - - - - - - - - - - - - - - 9
iii
Page 4

Contents
Installing the Analyzer - - - - - - - - - - - - - - - - - - - - - - - - - - - - - - - - - 10
Hardware Setup - - - - - - - - - - - - - - - - - - - - - - - - - - - - - - - - - - - - - - - - - - - 10
Exerciser Configuration Connections - - - - - - - - - - - - - - - - - - - 11
OTG Analysis Connections - - - - - - - - - - - - - - - - - - - - - - - - - - - - - - - - - - 11
OTG Exerciser as DRD A-Device Connections - - - - - - - - - - - - - - - - - - - - 12
OTG Exerciser as DRD or Peripheral Only B-Device Connections - - - - - - 12
Device Emulation Connections - - - - - - - - - - - - - - - - - - - - - - - - - - - - - - - 13
Conquest Analyzer Connections - - - - - - - - - - - - - - - - - - - - - - - - - - - - - - 14
Conquest Exerciser Connections - - - - - - - - - - - - - - - - - - - - - - - - - - - - - - 14
Conquest M2 External I/O Connector Pin Assignment - - - - - - - - - - 15
Conquest External I/O Connector Pin Assignment - - - - - - - - - - - - - - - - - 15
Software Installation - - - - - - - - - - - - - - - - - - - - - - - - - - - - - - - - - - - - - - - - 16
Manual USB Driver Installation - - - - - - - - - - - - - - - - - - - - - - - - - - - - - - - 17
Updating the Conquest USB Driver Manually - - - - - - - - - - - - - - - - - - - - - 17
Directory Structure on Windows XP and Vista - - - - - - - - - - - - - - - - - - - - 18
Windows XP - - - - - - - - - - - - - - - - - - - - - - - - - - - - - - - - - - - - - - - - - - - - 18
Windows Vista - - - - - - - - - - - - - - - - - - - - - - - - - - - - - - - - - - - - - - - - - - - 19
Launching the USB Analyzer - - - - - - - - - - - - - - - - - - - - - - - - - - - - 20
Connecting via Ethernet - - - - - - - - - - - - - - - - - - - - - - - - - - - - - - - - - - - - - 21
Connecting to a Network - - - - - - - - - - - - - - - - - - - - - - - - - - - - - - - - - - - 22
Connecting via Hub, Switch or Similar device - - - - - - - - - - - - - - - - - - - - - 23
Operating in Simulation Mode - - - - - - - - - - - - - - - - - - - - - - - - - - - - - - - - - 23
Authorization - - - - - - - - - - - - - - - - - - - - - - - - - - - - - - - - - - - - - - - - - - - - - 24
Example Projects - - - - - - - - - - - - - - - - - - - - - - - - - - - - - 25
Project File Types - - - - - - - - - - - - - - - - - - - - - - - - - - - - - - - - - - - - - - - - 26
Run an Example Project - - - - - - - - - - - - - - - - - - - - - - - - - 28
Default Capture - - - - - - - - - - - - - - - - - - - - - - - - - - - - - - 29
Creating Projects- - - - - - - - - - - - - - - - - - - - - - - - - - - - - - 30
Capture and Timing Analysis Projects - - - - - - - - - - - - - - - - - - - - - - - - - - 30
Performance Analysis Projects - - - - - - - - - - - - - - - - - - - - - - - - - - - - - - - 31
Device Emulation & OTG Advanced Exerciser - - - - - - - - - - - - - - - - - - - - 31
Current and Voltage Measurements - - - - - - - - - - - - - - - - - - - - - - - - - - - 31
iv
Page 5

Contents
Protocol Analysis - - - - - - - - - - - - - - - - - - - - - - - - - - - - - - - - - - - - 33
Easy Mode (Pre-Defined Setups) - - - - - - - - - - - - - - - - - - - - - - - - - - - - - - - 33
Easy Data Capture - - - - - - - - - - - - - - - - - - - - - - - - - - - - 34
Trigger on Data - - - - - - - - - - - - - - - - - - - - - - - - - - - - - - - - - - - - - - - - 36
Data Capture Options - - - - - - - - - - - - - - - - - - - - - - - - - - 43
Custom Transaction - - - - - - - - - - - - - - - - - - - - - - - - - - - 45
Exercise and Capture (Optional) - - - - - - - - - - - - - - - - - - - - - - 46
Programming the Exerciser in Easy Mode - - - - - - - - - - - - - - - - 47
Settings - - - - - - - - - - - - - - - - - - - - - - - - - - - - - - - - - 50
Auxiliary Port- - - - - - - - - - - - - - - - - - - - - - - - - - - - - - - - - - - - - - - - - - 53
Advanced Mode (User-Defined) - - - - - - - - - - - - - - - - - - - - - - 55
Capture Data Project - - - - - - - - - - - - - - - - - - - - - - - - - - - - - - - - - - - - - - 55
Defining Packets - - - - - - - - - - - - - - - - - - - - - - - - - - - - - - - - - - - - - - - 56
Packet Payload Data - - - - - - - - - - - - - - - - - - - - - - - - - - - - - - - - - - - - 58
The Sequencer - - - - - - - - - - - - - - - - - - - - - - - - - - - - - 60
Sequencer Operation Overview - - - - - - - - - - - - - - - - - - - - - - - - - - - - 60
Programming the Sequencer - - - - - - - - - - - - - - - - - - - - - - - - - - - - - - 61
Protocol Errors - - - - - - - - - - - - - - - - - - - - - - - - - - - - - - - - - - - - - - - - - - 66
Setting a Protocol Error Mask - - - - - - - - - - - - - - - - - - - - - - - - - - - - - - 66
Host Exerciser (Optional) - - - - - - - - - - - - - - - - - - - - - - - - - - 67
Programming the Exerciser In Advanced Mode - - - - - - - - - - - - - - - - - - - 67
Programming with Transfers - - - - - - - - - - - - - - - - - - - - - - - - - - - - - - - - - 68
Specifying a New Class - - - - - - - - - - - - - - - - - - - - - - - - - - - - - - - - - - 73
Specifying Data for Transfer - - - - - - - - - - - - - - - - - - - - - - - - - - - - - - - 74
Reduced Bit Width - - - - - - - - - - - - - - - - - - - - - - - - - - - - 79
Exerciser Programming Shortcuts - - - - - - - - - - - - - - - - - - - - 80
Creating an Exerciser Program by Importing - - - - - - - - - - - - - - - - - - - 80
Advanced Refresh - - - - - - - - - - - - - - - - - - - - - - - - - - - - - - - - - - - - - - 82
Creating an Exerciser Program by Copying and Pasting - - - - - - - - - - - 83
v
Page 6

Contents
Creating a Data Block - - - - - - - - - - - - - - - - - - - - - - - - - - - - - - - - - - - - - 86
Naming a Data Block - - - - - - - - - - - - - - - - - - - - - - - - - - - - - - - - - - - - 87
Creating and Editing Data Blocks as Text - - - - - - - - - - - - - - - - - - - - - 91
Settings - - - - - - - - - - - - - - - - - - - - - - - - - - - - - - - - - 92
Running the Project - - - - - - - - - - - - - - - - - - - - - - - - - - - 93
Set Data Capture Options - - - - - - - - - - - - - - - - - - - - - - - - - - - - - - - - - - - 93
Run Project - - - - - - - - - - - - - - - - - - - - - - - - - - - - - - - - - - - - - - - - - - - - - 93
Reports - - - - - - - - - - - - - - - - - - - - - - - - - - - - - - - - - - - - - - - - - - - - - - - - 94
View Statistical Report - - - - - - - - - - - - - - - - - - - - - - - - - - - - - - - - - - - 94
View Data Report - - - - - - - - - - - - - - - - - - - - - - - - - - - - - - - - - - - - - - 95
View Data Report Statistics - - - - - - - - - - - - - - - - - - - - - - - - - - - - - - - 97
Display Histogram - - - - - - - - - - - - - - - - - - - - - - - - - - - - - - - - - - - - - - 98
Search a Data Report for a Pattern - - - - - - - - - - - - - - - - - - - - - - - - - - 99
High Level Interpretation Assignment - - - - - - - - - - - - - - - - - - 101
User-Defined Decodes - - - - - - - - - - - - - - - - - - - - - - - - - - - - - - - - - - 102
Protocol Errors - - - - - - - - - - - - - - - - - - - - - - - - - - - - - - 104
Protocol Errors Detected While Capturing Data - - - - - - - - - - - - - - - - - - 104
Protocol Errors Detected Post-Process - - - - - - - - - - - - - - - - - - - - - - - - 105
Pre-Trigger - - - - - - - - - - - - - - - - - - - - - - - - - - - - - - - - - - - - - - - - - - - - - 107
Performance Analysis - - - - - - - - - - - - - - - - - - - - - - - - - - - - - - - - 109
Performance Analysis (Easy Mode) - - - - - - - - - - - - - - - - - - - - - - - - - - - - 109
Performance Analysis (Advanced Mode) - - - - - - - - - - - - - - - - - 112
Real Time Analysis - - - - - - - - - - - - - - - - - - - - - - - - - - - - - - - - - - - - - - 112
Perform a Pre-defined Analysis - - - - - - - - - - - - - - - - - - - - - - - - - - - - - - 113
Create a New Analysis - - - - - - - - - - - - - - - - - - - - - - - - - - - - - - - - - - - - 113
Define Packets - - - - - - - - - - - - - - - - - - - - - - - - - - - - - - - - - - - - - - - 114
Program The Exerciser - - - - - - - - - - - - - - - - - - - - - - - - - - - - - - - - - 114
Creating Analysis Expressions - - - - - - - - - - - - - - - - - - - - - - - - - - - - 115
Saved Performance Analysis Review - - - - - - - - - - - - - - - - - - 121
vi
Page 7

Contents
Timing Analysis (Optional) - - - - - - - - - - - - - - - - - - - - - - - - - - - - 123
Easy Mode Timing Analysis - - - - - - - - - - - - - - - - - - - - - - - - - - - - - - - - - - 123
Advanced Mode Timing Analysis - - - - - - - - - - - - - - - - - - - - - 125
Device Emulation (Optional) - - - - - - - - - - - - - - - - - - - - - - - - - - - 129
Device Emulation (Easy Mode) - - - - - - - - - - - - - - - - - - - - - - 130
Programming the Device - - - - - - - - - - - - - - - - - - - - - - - - - - - - - - - - - - - 130
Endpoint Errors Generated by OTG DRD & Device Emulation - - - - - 137
Device Emulation (Advanced Mode)- - - - - - - - - - - - - - - - - - - - 138
Test Mode - - - - - - - - - - - - - - - - - - - - - - - - - - - - - - - - - - - - - - - - - - - - - 139
Programming the Device - - - - - - - - - - - - - - - - - - - - - - - - - - - - - - - - - - - 139
OTG Exerciser (Optional) - - - - - - - - - - - - - - - - - - - - - - - - - - - - - 145
OTG Exerciser as an A-Device - - - - - - - - - - - - - - - - - - - - - - - - - - - - - - - - 145
Programming the Device - - - - - - - - - - - - - - - - - - - - - - - - 146
Create Exerciser Program - - - - - - - - - - - - - - - - - - - - - - - - - - - - - - - - - - 147
Define OTG Device Configuration - - - - - - - - - - - - - - - - - - - - - - - - - - - - - 149
Starting a Session - - - - - - - - - - - - - - - - - - - - - - - - - - - - - - - - - - - - - - - - 149
Dropping a Session - - - - - - - - - - - - - - - - - - - - - - - - - - - 150
OTG Exerciser as a Peripheral B-Device - - - - - - - - - - - - - - - - - - - - - - - - - 150
Define OTG Device Configuration - - - - - - - - - - - - - - - - - - - - - - - - - - - - - 152
Create Exerciser Program - - - - - - - - - - - - - - - - - - - - - - - - - - - - - - - - - - 152
Requesting a Session - - - - - - - - - - - - - - - - - - - - - - - - - - - - - - - - - - - - - 153
Terminating the Exerciser Program - - - - - - - - - - - - - - - - - - - - - - - - - - - - 153
Host Negotiation Protocol (HNP) - - - - - - - - - - - - - - - - - - - - - - - - - - - - - 153
Session Request Protocol (SRP) - - - - - - - - - - - - - - - - - - - - - - - - - - - - - 154
How to Turn Off the VBUS (in an OTG Script) - - - - - - - - - - - - - - - - - - - - 154
How Long Does Conquest Take to Drop D+ Pull-up? - - - - - - - - - - - - - - - 154
vii
Page 8

Contents
Current Measurement (Optional) - - - - - - - - - - - - - - - - - - - - - - - - 155
Unconfigured Current Measurement - - - - - - - - - - - - - - - - - - - 156
Operating Current Measurement - - - - - - - - - - - - - - - - - - - - - 158
Making the VBus Measurement - - - - - - - - - - - - - - - - - - - - 161
VBus Droop Measurement - - - - - - - - - - - - - - - - - - - - - - - 163
Inrush Current Measurement - - - - - - - - - - - - - - - - - - - - - - - - - - - - - - - 165
Inrush Current Display Features - - - - - - - - - - - - - - - - - - - - - - - - - - - 167
Suspend Current Measurement - - - - - - - - - - - - - - - - - - - - 170
Current Measurement Calibration Board - - - - - - - - - - - - - - - - 172
Display Manipulation - - - - - - - - - - - - - - - - - - - - - - - - - - - - - - - - - 175
Results Display Viewing Preferences - - - - - - - - - - - - - - - - - - - - - - - - - - - 176
Compact View - - - - - - - - - - - - - - - - - - - - - - - - - - - - - 177
Display Idle Time - - - - - - - - - - - - - - - - - - - - - - - - - - - 178
Waveform Display - - - - - - - - - - - - - - - - - - - - - - - - - - - 179
Filter - - - - - - - - - - - - - - - - - - - - - - - - - - - - - - - - - - - - - - - - - - - - - - - - - - 180
Smart on Screen Filtering - - - - - - - - - - - - - - - - - - - - - - - - 181
Save Display Settings - - - - - - - - - - - - - - - - - - - - - - - - - - - - - - - - - - - - - - 182
Timing Analysis Display - - - - - - - - - - - - - - - - - - - - - - - - - 183
Set Timing Display Viewing Options - - - - - - - - - - - - - - - - - - 184
View Timing Details - - - - - - - - - - - - - - - - - - - - - - - - - - - - - - - - - - - - - - 184
Using the Cursors and Bookmarks - - - - - - - - - - - - - - - - - - - - - - - - - - - - - 186
Search - - - - - - - - - - - - - - - - - - - - - - - - - - - - - - - - - - 189
Display Configuration- - - - - - - - - - - - - - - - - - - - - - - - - - - 194
Mnemonics - - - - - - - - - - - - - - - - - - - - - - - - - - - - - - - - - - - - - - - - 197
Utilities - - - - - - - - - - - - - - - - - - - - - - - - - - - - - - - - - - - - - - - - - - - 198
Self Test - - - - - - - - - - - - - - - - - - - - - - - - - - - - - - - - - - - - - - - - - - - - - - - 198
View Scan Descriptors - - - - - - - - - - - - - - - - - - - - - - - - - - 199
Attach/Detach Device - - - - - - - - - - - - - - - - - - - - - - - - - - 200
Capture Screen - - - - - - - - - - - - - - - - - - - - - - - - - - - - - 201
viii
Page 9

Contents
Appendix A - - - - - - - - - - - - - - - - - - - - - - - - - - - - - - - - - - - - - - - - 203
Advanced Script Language (ASL) - - - - - - - - - - - - - - - - - - - - - - - - - - - - - - 203
Document Conventions - - - - - - - - - - - - - - - - - - - - - - - - - - - - - - - - - - - - 203
Language Elements - - - - - - - - - - - - - - - - - - - - - - - - - - 204
ASL Script Structure - - - - - - - - - - - - - - - - - - - - - - - - - - 206
Protocol Extraction Section - - - - - - - - - - - - - - - - - - - - - - - 208
Protocol Decoding Section - - - - - - - - - - - - - - - - - - - - - - - 214
DefineOptions Block - - - - - - - - - - - - - - - - - - - - - - - - - - - - - - - 215
ValidRanges Block - - - - - - - - - - - - - - - - - - - - - - - - - - - - - - - - 216
Main Block - - - - - - - - - - - - - - - - - - - - - - - - - - - - - - - - - - - - - 217
USB Descriptor Section - - - - - - - - - - - - - - - - - - - - - - - - - 227
Descriptor Block - - - - - - - - - - - - - - - - - - - - - - - - - - - - - - - - - - 228
Functions - - - - - - - - - - - - - - - - - - - - - - - - - - - - - - - 229
Samples - - - - - - - - - - - - - - - - - - - - - - - - - - - - - - - - - - - - - - - - - - - - - - - - 232
Script Editor - - - - - - - - - - - - - - - - - - - - - - - - - - - - - - - - - - - - - - - - - - - - - 240
Creating the Script - - - - - - - - - - - - - - - - - - - - - - - - - - - 241
China Restriction of Hazardous Substances Table - - - - - - - - - - - - - - - - - 244
Index - - - - - - - - - - - - - - - - - - - - - - - - - - - - - - - - - - - - - - - - - - - - - 245
ix
Page 10

Contents
x
Page 11

Conquest Versions
Conquest Versions
Conquest M2 versus Conquest
Conquest M2 supersedes all SBAE-30 versions.
Conquest supports a subset of features of Conquest M2.
Conquest does not support the following:
• Device Emulation
• OTG Analysis and Exercising
• Timing Analysis
• VBus Measurement
• Automatic Bus Speed Detection
• Performance Analysis
Common Software
This manual describes the use and operation of all available Conquest
options. In the product that you receive, access to options that were not
included in your purchase are disabled. For feature upgrades and any other
questions, please contact psgsupport@lecroy.com.
The following table summarizes the supported features of Conquest M2 and
Conquest.
1
Page 12

Conquest Versions
Conquest M2 (SBAE30) and Conquest Supported Features
Conquest M2
Feature
Standard
Low Speed (1.5 Mb/s) and Full Speed (12 Mb/s) ++++
High Speed (480 Mb/s) ++++
Trace Memory Size 128 MB 128 MB 394 MB 394 MB
Upload to Host via USB 2.0 or LAN ++++
Global & Raw Bit View ++++
View Hex, Decimal or Binary ++++
Search on Errors ++++
Search within Data Payload ++++
Export Text / ASCII / Binary ++++
Snapshot Capture ++++
Data Report ++++
Upper-level USB Device Class Decodes ++++
User-defined Decodes ++++
Single-level Event Triggering (Easy mode) ++++
Trigger on Protocol Errors ++++
Trigger on Setup / In / Out / Data / Ping ++++
Statistical Reports +++
Multi-level Event Triggering (Advanced mode) +++
Trigger on Split Setup Transaction +++
Trigger on Split Bulk In/Out Transaction +++
Trigger on Split Interrupt In/Out Transaction +++
Trigger on Split Isoch In/Out Transaction +++
Filter In / Out specific Address / Endpoints +++
Trigger on Data Pattern and Length ++
Trigger on Vbus & Operating Current ++
Event Counters ++
Event Timers ++
Auto Run (multiple trace capture) ++
Auto detect Speed ++
Slow-clock Capability ++
Performance Analyzer (Easy \ Advanced Option) ++
OTG Analysis ++
Timing Analysis Display ++
DC Compliance measurement ++
Find Device (View Scan descriptor) +
Exerciser Graphical User Interface (GUI) +
Traffic Generation / Host emulation +
Simultaneous Transmit and Record +
Device emulation +
OTG Device Emulation +
Advanced
Pro
Pro
Exerciser
2
Page 13

Introduction
Introduction
This manual describes the installation and operation of the
LeCroy Conquest™ and Conquest M2 USB Analyzer/Exerciser. Conquest
has a subset of features of Conquest M2 (see “Conquest Versions” on
page 1).
Conquest – The Conquest is LeCroy’s entry-level USB analyzer, designed
for easy setup with time-saving features like predefined trigger settings. The
Conquest Advanced adds multi-state sequential triggering to provide
sophisticated triggering debugging intermittent problems.
Conquest M2 – The Conquest M2 Pro combines full function analysis
capabilities with an integrated exerciser option. The Pro model includes the
same easy-to-understand display of bus traffic and adds advanced multi-state
triggering, OTG support, real-time performance analysis, special timing and
DC Compliance measurements. The exerciser can be enabled via software
key to allow host, device, and OTG emulation.
Overview
Conquest M2 is a serial bus Analyzer/Exerciser that is capable of analyzing
and exercising data transfers for USB 1.x and USB 2.0 Low speed, Full speed,
and High speed protocols. One upstream and one downstream auxiliary
connector allows convenient testing of Hub input and output I/O ports. The
following is a description of Conquest M2 capabilities if all options are
installed.
Conquest M2 incorporates two modes of operation, Easy and Advanced. You
can operate each of the installed options, except the OTG Exerciser, in any
mode combination. As an example, you can perform a Capture and Trigger
with either the Easy Mode Exerciser or the Advanced Mode Exerciser.
The convenient, easy-to-use Easy Mode allows you to perform 95% of USB
data capture and triggering with a minimum of programming. In the Easy
Mode, you can quickly:
• Capture and Trigger on USB packets.
• Generate Host traffic with the Host Exerciser while monitoring and
• Analyze and Exercise OTG Devices.
• Perform a real time Performance Analysis.
• Perform simultaneous Protocol and Timing Analysis.
analyzing the result.
3
Page 14
Introduction
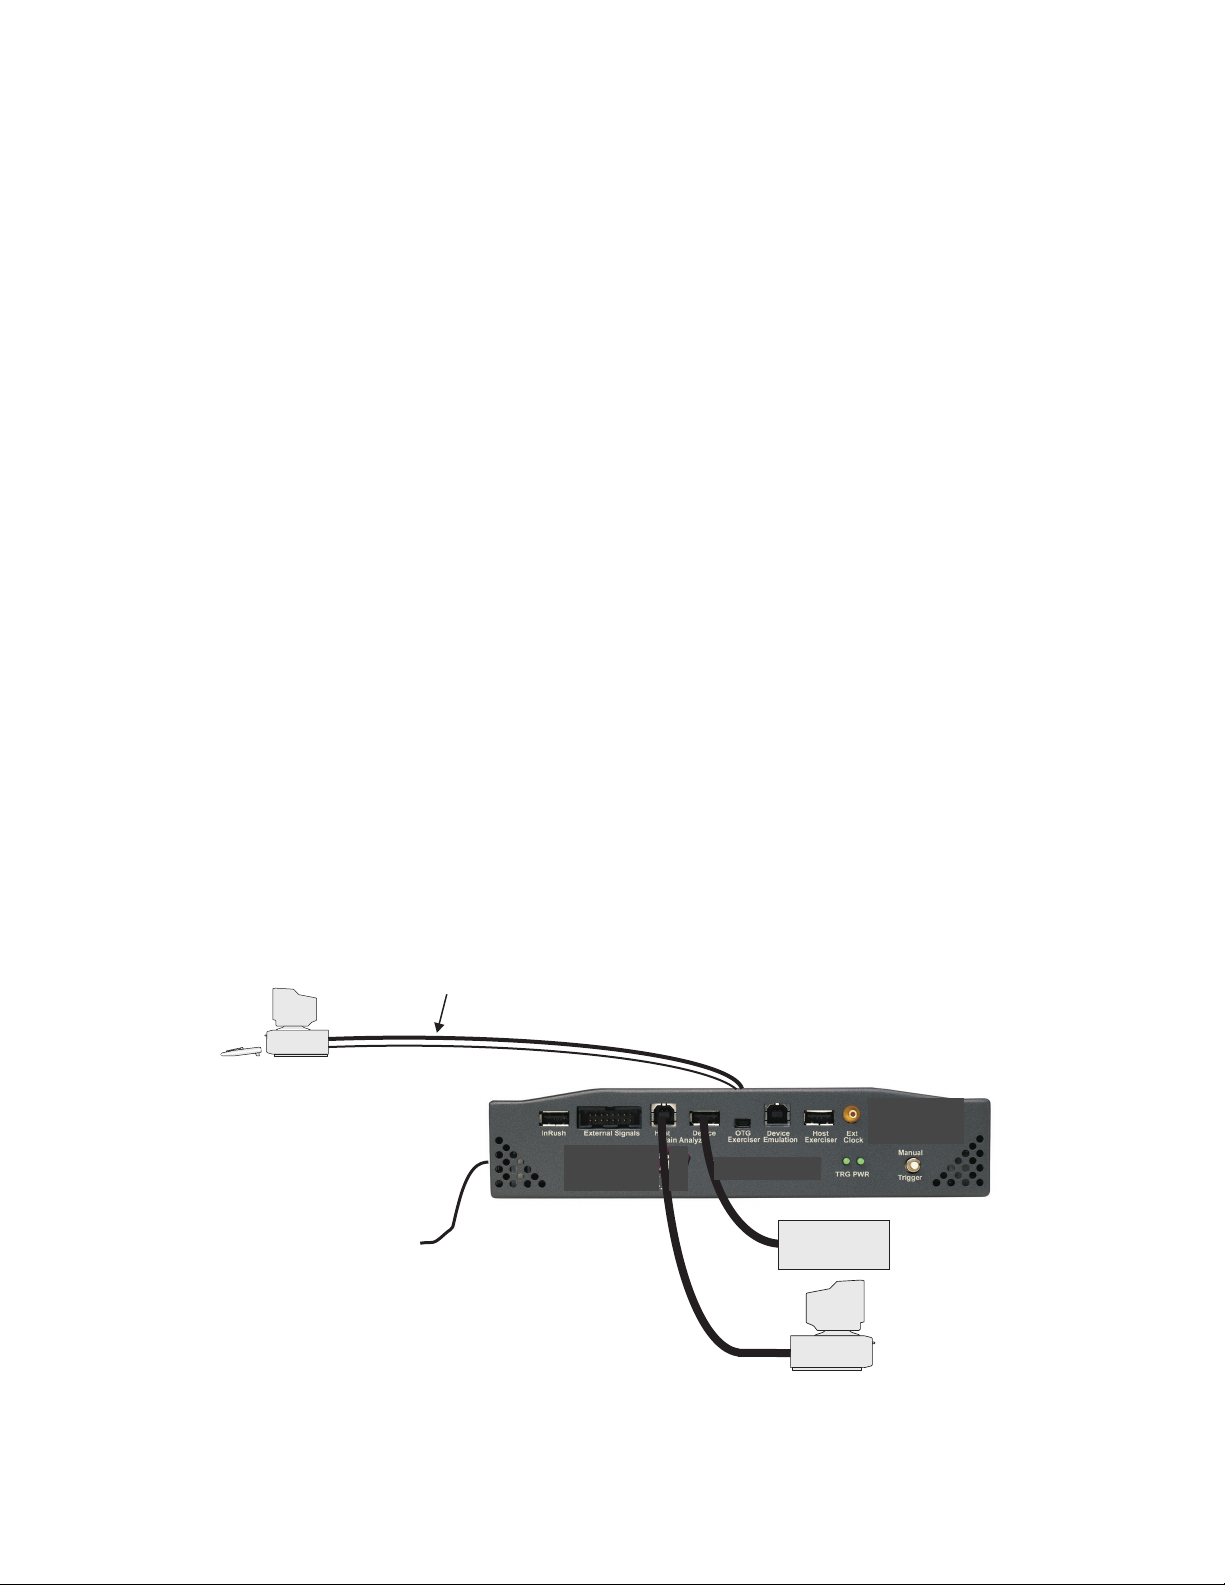
USB Host
Host Interface Cables
Windows Based System
With Analyzer Software
100V - 240V In
USB Device
Under Test
The comprehensive Advanced Mode incorporates a powerful easy to use
programming capability that allows you to design projects with sophisticated
data capture and triggering. In the Advanced Mode, you can program the
Analyzer/Exerciser to:
• Capture all bus traffic or specific packets
• Trigger on specific packets or events as programmed in a 32 state
sequencer.
• Generate more flexible host traffic with the Host Exerciser.
• Emulate more complicated devices while monitoring and analyzing the
result.
• Analyze and Exercise OTG Devices.
• Perform a detailed Timing Analysis to trigger as defined in the Sequencer
or on a user-specified bus signal pattern.
• Program Conquest M2 as a Device Emulation for testing the USB
development software.
•Perform Unconfigured, Suspend, Operating, and Inrush current
measurements.
• Perform VBus and VBus Droop measurements.
• Trigger protocol analyzer based on VBus and Operating current
measurements.
Analyzing USB Designs With the Analyzer
The Analyzer allows you to perform comprehensive USB analysis by capturing
data and triggering on events and packets, conduct Performance Analysis in
real-time, capture and trigger on USB errors and also to allow verification and
debug of Hub input and output ports.
Figure 1 Typical USB Test Setup of Basic Analyzer
4
Page 15

Introduction
Conquest M2 Options
You can expand Analyzer capability with the following options:
Host Exerciser
The Host Exerciser option allows you to generate bus traffic as a host for
analysis.
Device Emulation
This option allows you to operate Conquest M2 as a Device for testing the
USB development system. You can define each Device to include up to 3
configurations with 2 interfaces each and assign up to 7 endpoints to these
interfaces. The Device can be a Low, Full, High, or a High/Full speed device.
OTG Exerciser
This option allows you to operate Conquest M2 as an OTG Dual-Role Device.
In this mode, Conquest M2 is a combination of Device Emulation and
Host Exerciser. A DRD emulation can be either a host or a peripheral.
DC Compliance measurement
This option allows you to measure operational current and inrush current
through a special port over the first 10 milliseconds of Device activation and to
display a pass/fail result with respect to the USB compliance specifications.
This option also allows the measurement of VBus voltage through the
Analyzer port.
Timing Analyzer
This option offers precision timing analysis. The Conquest M2 Timing Analyzer
samples bus signals at different sampling rates depending on the bus speed
selected.
5
Page 16

Conquest M2 Interface
Status LED Function Description
PWR When illuminated indicates that Analyzer is powered up.
TRG When illuminated indicates that the Analyzer has triggered.
Manual Trigger
Manual trigger is activated by a push button switch on the front panel.
External Signals (Ext. Out, Ext. Trig In, and Ext. Clk)
The Conquest M2 Analyzer can output a unique 8-bit, user-defined CMOS
level when triggered. You can use these outputs for activating external
devices, such as other types of test equipment, when certain events are
detected in USB data capture.
Introduction
Additionally, the Conquest M2 Analyzer provides you with an External Trigger
Input that allows you to trigger the Analyzer from externally generated
sources. Trigger input can be masked or programmed to respond to a 1 or 0
level or a rising or falling edge. For setting the external trigger input options,
see page 51.
Conquest M2 offers a number of internally generated pre-defined low
frequency clock settings, however you can apply an external clock to the
External Clock Input. Supported frequencies are in ranges of 400KHz - 8MHz
for High Speed and 1KHz-100KHz, 400KHz - 8MHz for Full/Low speed.
6
Page 17

Introduction
Ports
Main Analyzer
This port supports Analyzer using 8 packets and a 32 state sequencer that are
used in Easy Mode or Advanced Mode for data capturing and triggering,
operating and unconfigured current measurement and timing analysis.
InRush
A dedicated connector to allow the measurement of USB Device Inrush
current.
Host Exerciser
A dedicated connector to exercise a USB Device and capture and trigger data
in conjunction with the Analyzer port.
OTG Exerciser
A dedicated connector to exercise an OTG Dual-Role or SRP- capable
Peripheral Device.
Note: Use only one, either Parallel Port or USB connection, for connecting the
Power In
Device Emulation
A dedicated connector used when Conquest M2 is operated as a device.
Paral. Host Interface
Bi-directional Parallel Port interface located on the back of the unit for
connection between the Analyzer and the system hosting the GUI software.
USB Host Interface
Interface connection, located on the back of the unit, for connection between
the Analyzer and the system hosting the GUI software.
Analyzer and the system software.
Conquest and Conquest M2 operate on 100V - 240V 50/60Hz power that is
connected on the back.
7
Page 18
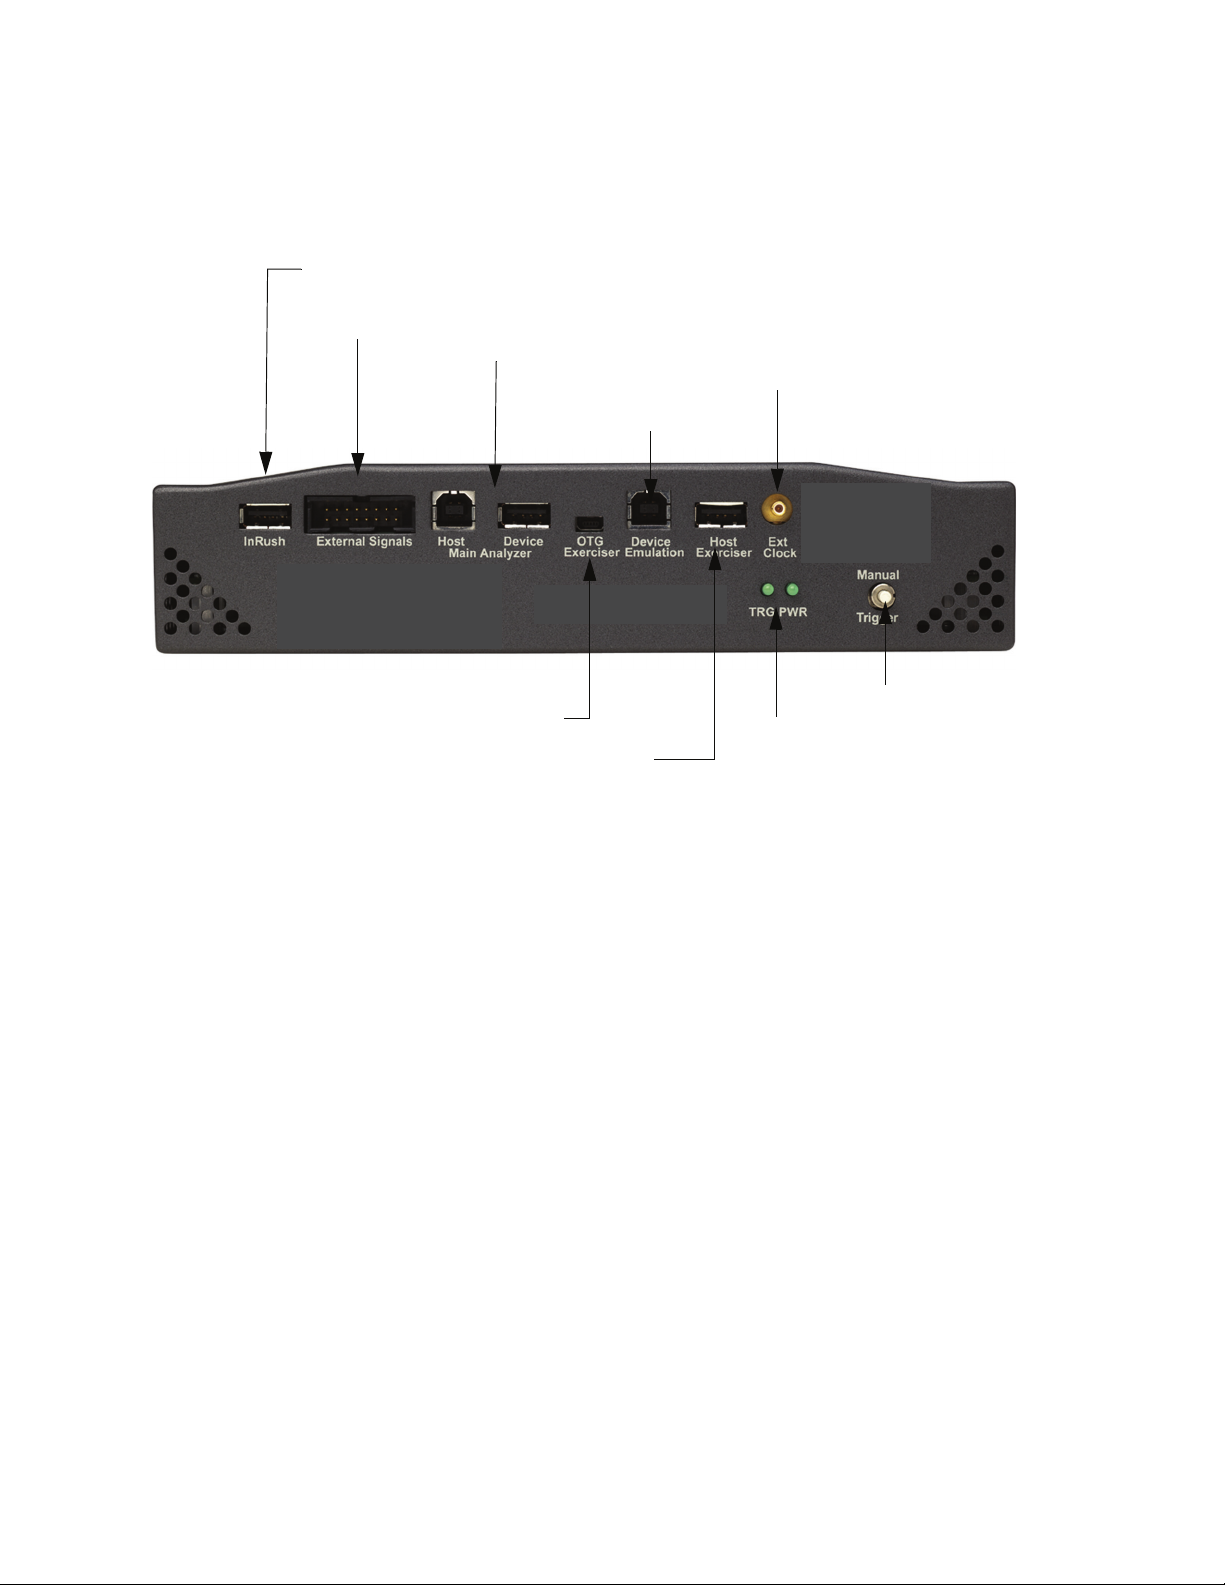
Analyzer/Exerciser Connection Identification
External Signals (See Note 1.)
USB 2.0/1.x Analyzer Connectors
Inrush/Suspend Current Measurement Connector
Host Exerciser Connector
Manual Trigger Button
Status LEDs
OTG Exerciser Connector
External Clock
Device Emulation
Input
Connector
Introduction
Note 1 For External I/O connector pin assignment, see page 15.
8
Page 19

Receiving the Analyzer
Receiving the Analyzer
Conquest M2
The Conquest M2 Analyzer includes the following components:
• Carrying Case
• Conquest M2 identified in the packing list
• Software on the CD Rom
• DB-25 -> SCSI II 26, Parallel Port connection
• Two USB 2.0 Cables, 1.8 meter
• USB 2.0 Cable, 4” (10 cm)
• Two USB 2.0 Cables, 2 meter Standard - A to Mini - B
• One Mini - A to Standard - B.
• 3M Ethernet Cable
• External I/O Ribbon and External Clock SMB to BNC Cables
• Current Measurements Calibration Board
• Power cable
• User Manual (PDF version on CD only) for both Conquest and
Conquest M2
Conquest
The Conquest Analyzer includes the following components
• Carrying Case
• Conquest identified in the packing list
• Software on the CD Rom
• Two USB host interface cables, 1.8 M A to Mini - B
• USB, A to B cable, 4” (10cm)
• 3M Ethernet Cable 10ft (3M)
• External trigger cable (SMB2BNC)
• External signals cable
• Power cable, 6ft (1.8M)
• User Manual
Unpacking the Analyzer
Inspect the received shipping container for any damage. Unpack the container
and account for each of the system components listed on the accompanying
packing list. Visually inspect each component for absence of damage. In the
event of damage notify the shipper and LeCroy. Retain all shipping materials
for shippers inspection.
9
Page 20
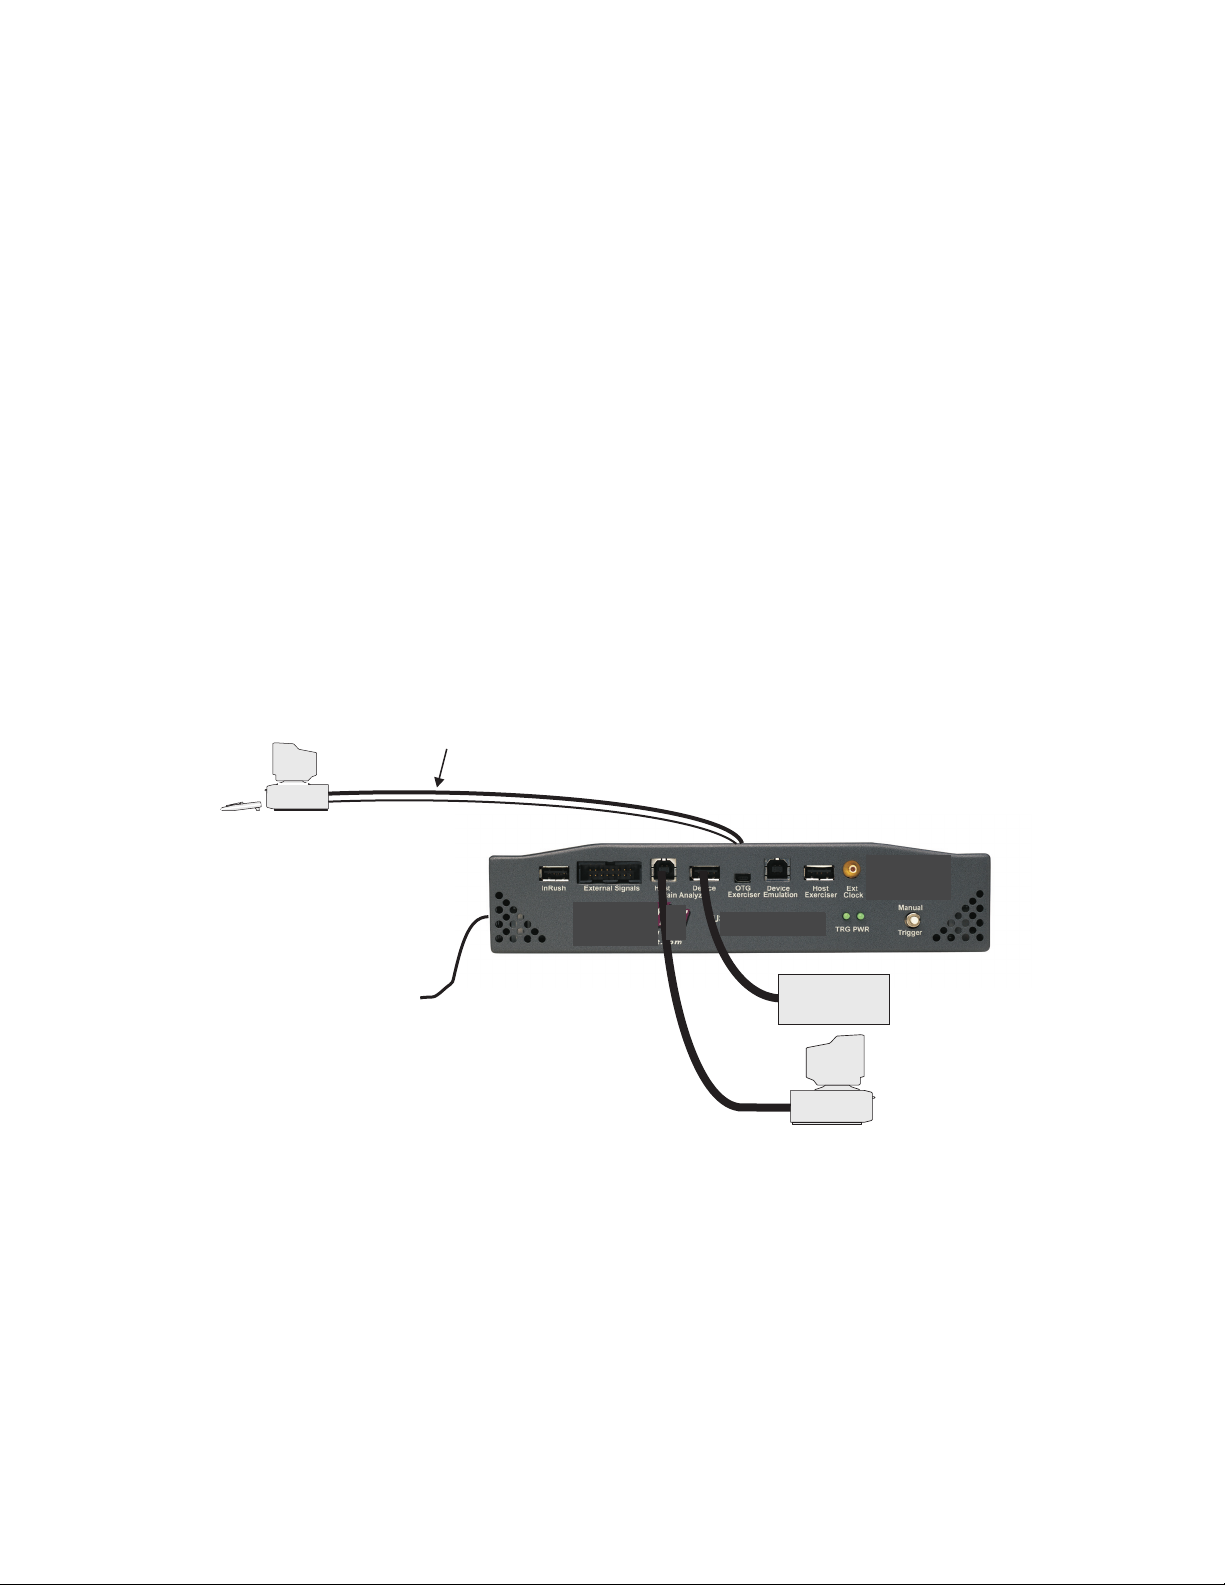
Installing the Analyzer
USB Host
Host Interface Cables
Windows Based System
With Analyzer Software
100V - 240V In
USB Device
Under Test
This section covers hardware and software setup.
Hardware Setup
You can set up the Analyzer/Exerciser in any of the following configurations:
• As an Analyzer to analyze USB Host and Device transactions.
• As an Exerciser to exercise a USB Device.
• As an Analyzer/Exerciser for OTG Device testing.
• As an Analyzer/Exerciser in Hub testing.
• To measure Inrush current, Configured current, Unconfigured current,
Suspended current and VBus measurement
• As a Device for Host software testing.
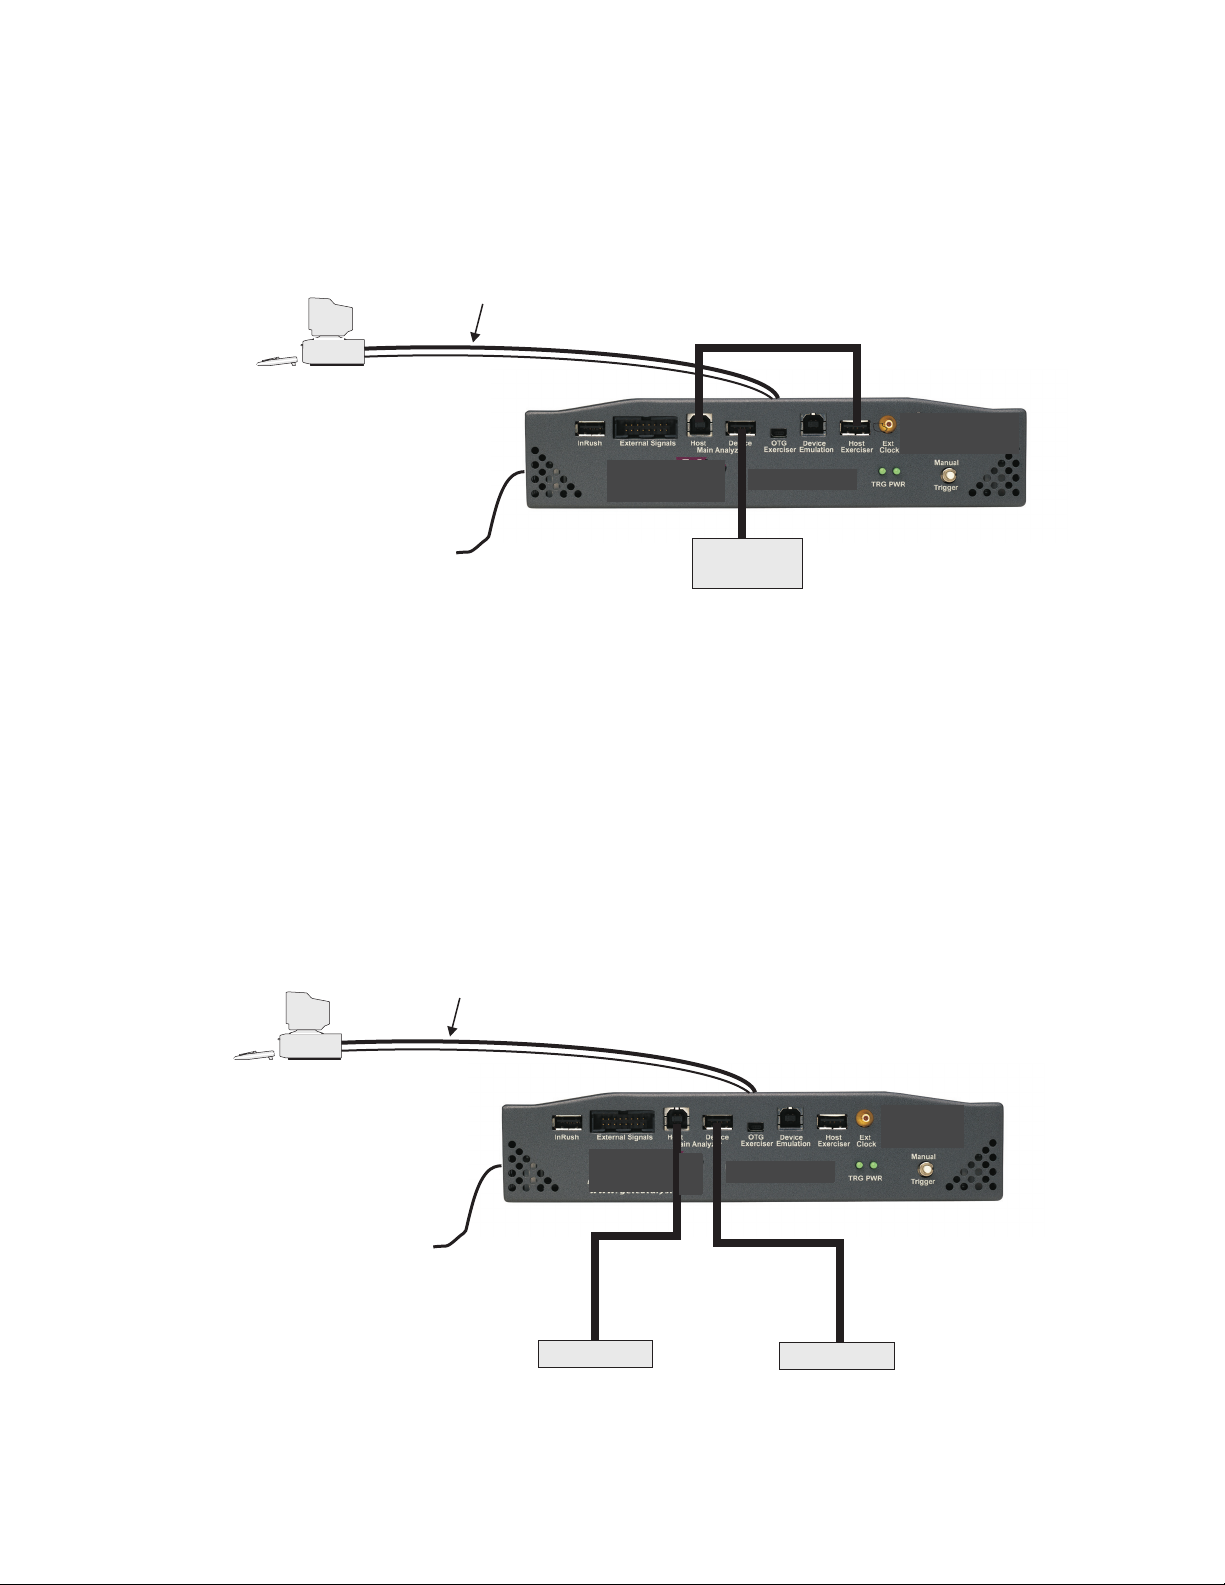
Separate Systems
It is highly recommended that you employ separate systems for the Analyzer
software and the USB Host as shown in Figure 2 (the preferred configuration)
to analyze USB Host and Device transactions. Using just one system for both
functions can lead to confusing results because of shared bus traffic.
Installing the Analyzer
Figure 2 Conquest M2 Configured as an Analyzer
1. Connect Conquest M2 to a Parallel, USB, or Ethernet Port on a system
running the Conquest Protocol Suite software, with the appropriate
cable.
2. Connect the USB Device to the Main Analyzer Port on Conquest M2.
3. Connect the USB Host to the Main Analyzer Port on Conquest M2, using
a USB cable.
10
Page 21
Installing the Analyzer
Host Interface Cables
Windows Based System
With Analyzer Software
100V - 240V In
USB Device
Exercised
Host Interface Cables
Windows Based System
With Analyzer Software
100V - 240V In
OTG B-Device
OTG A-Device
OTG Std-A to Mini-B Cable
OTG Mini-A to Std-B Cable
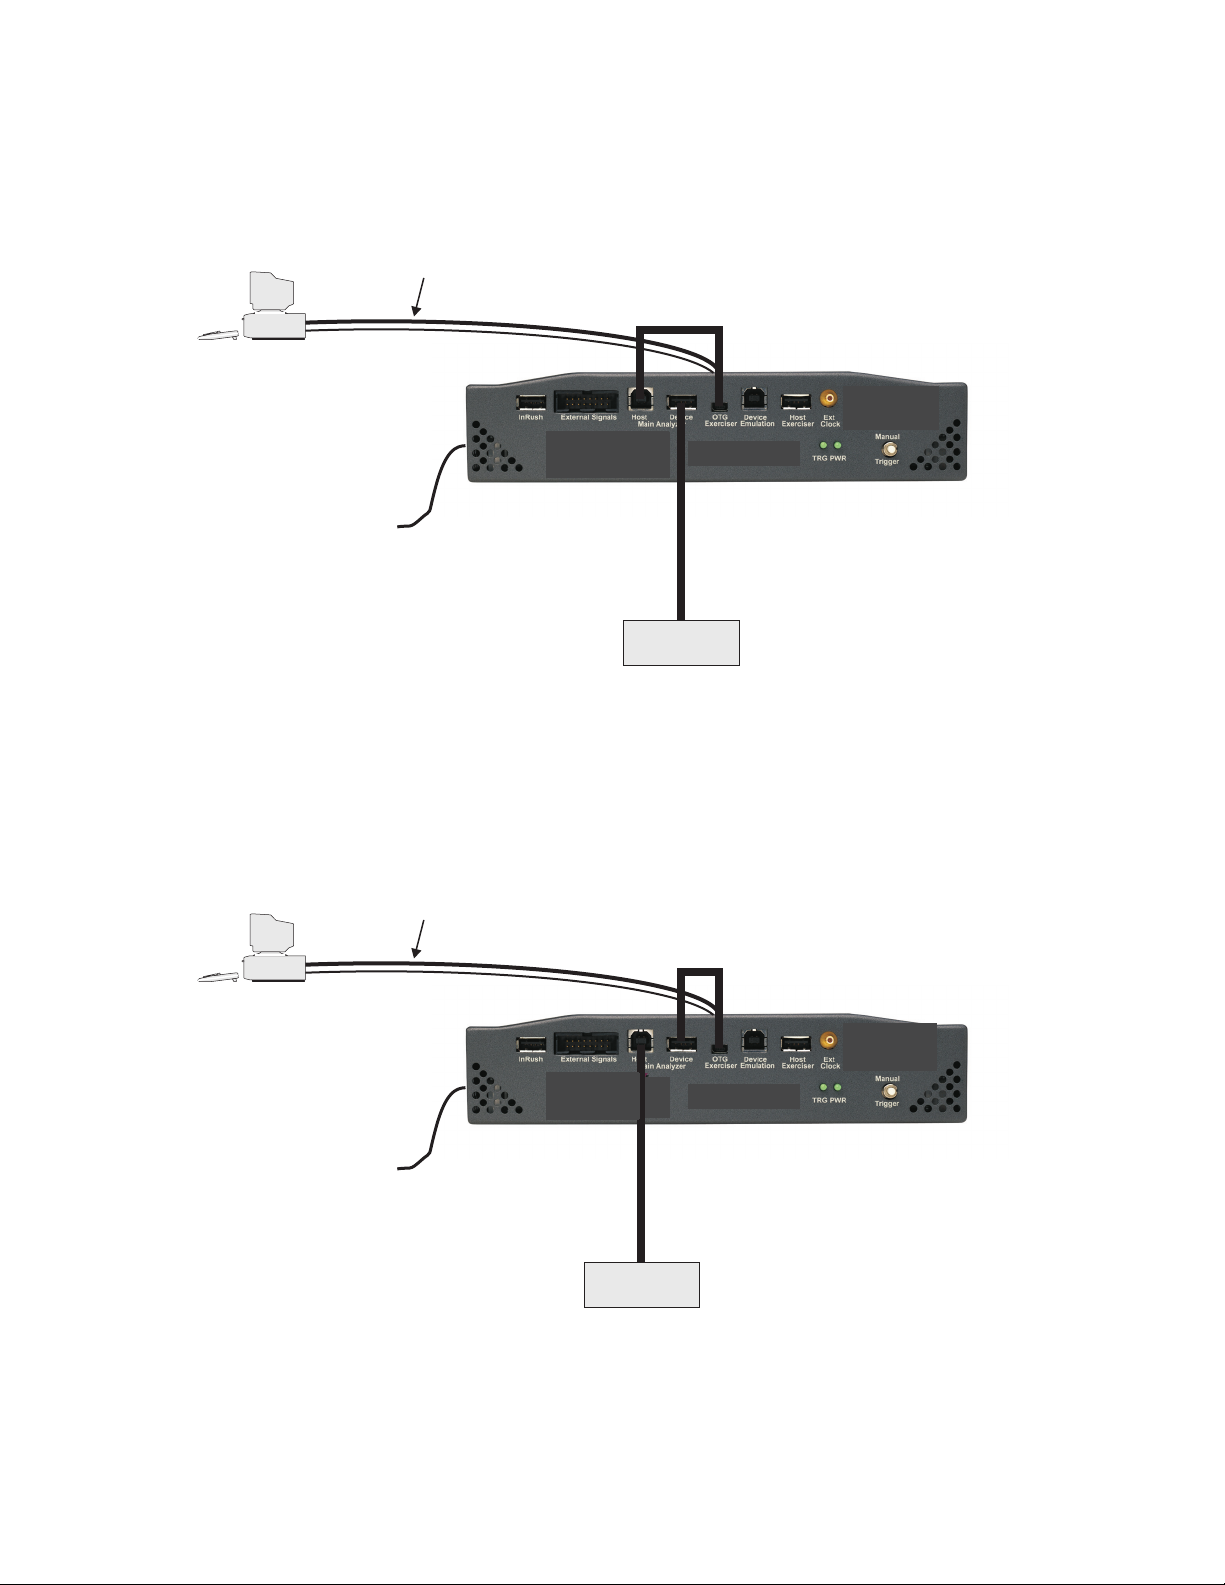
Exerciser Configuration Connections
Figure 3 shows Conquest M2 used to exercise a USB Device. In this
configuration, Conquest M2 acts as the USB Host.
Figure 3 Conquest M2 Configured as an Exerciser
1. Connect Conquest M2 to a Parallel, USB, or Ethernet Port on a system
running the Conquest Protocol Suite analysis software, with the
appropriate cable.
2. Connect the USB Device to the Main Analyzer Port on Conquest M2.
3. Connect the Main Analyzer Port to the Host Exerciser Port using a USB
cable.
OTG Analysis Connections
Figure 4 Conquest M2 Connections for OTG Analysis
11
Page 22
OTG Exerciser as DRD A-Device Connections
Host Interface Cables
Windows Based System
With Analyzer Software
100V - 240V In
OTG B-Device
OTG -A to CableMini Standard-B
DUT
Host Interface Cables
Windows Based System
With Analyzer Software
100V - 240V In
OTG A-Device
OTG -A to -B CableStandard Mini
DUT
Installing the Analyzer
OTG Exerciser as DRD or Peripheral Only B-Device Connections
Figure 5 OTG Exerciser as DRD A-Device
Figure 6 OTG Exerciser as DRD or Peripheral Only B-Device
12
Page 23
Installing the Analyzer
Host Interface Cables
Windows Based System
With Analyzer Software
100V - 240V In
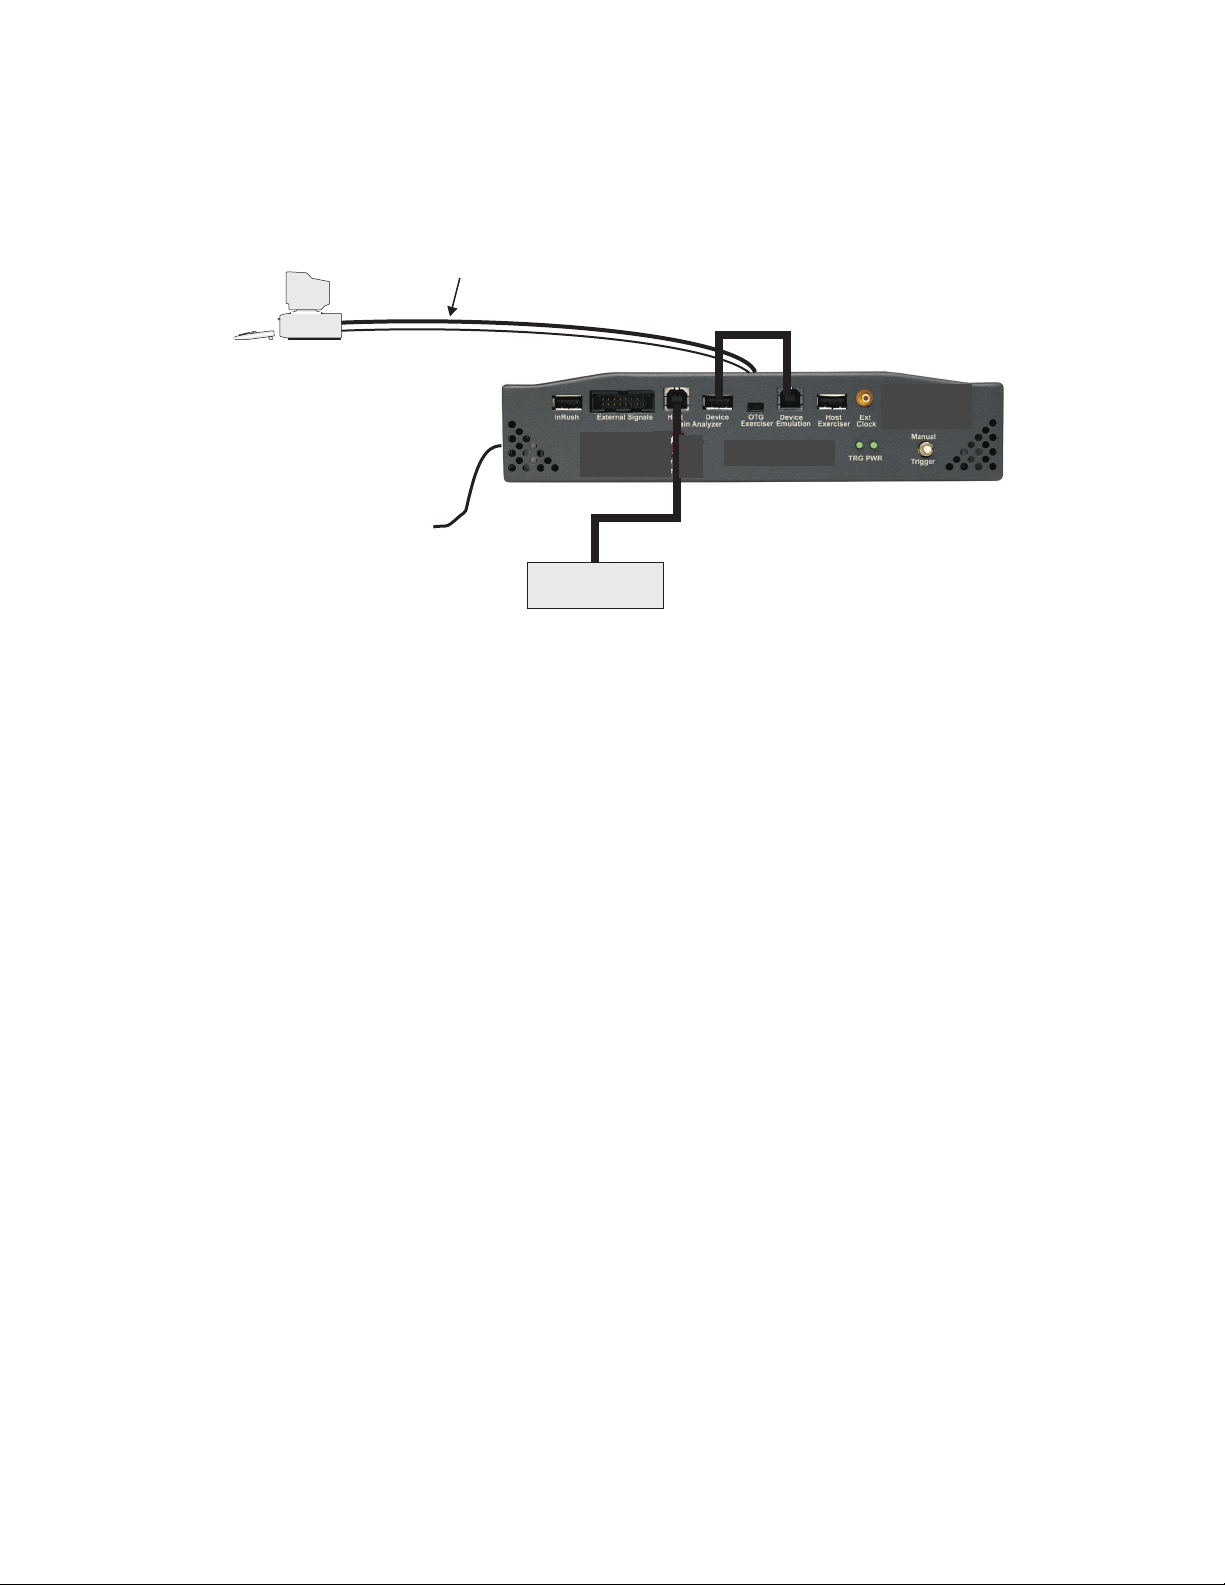
System
Exercised
Device Emulation Connections
Figure 7 Conquest M2 Connections for Device Emulation
13
Page 24
Conquest Analyzer Connections
Host Interface Cables
Windows Based System
With Analyzer Software
100V - 240V In
USB Host
USB Device
Under Test
Host Interface Cables
Windows Based System
With Analyzer Software
100V - 240V In
DUT
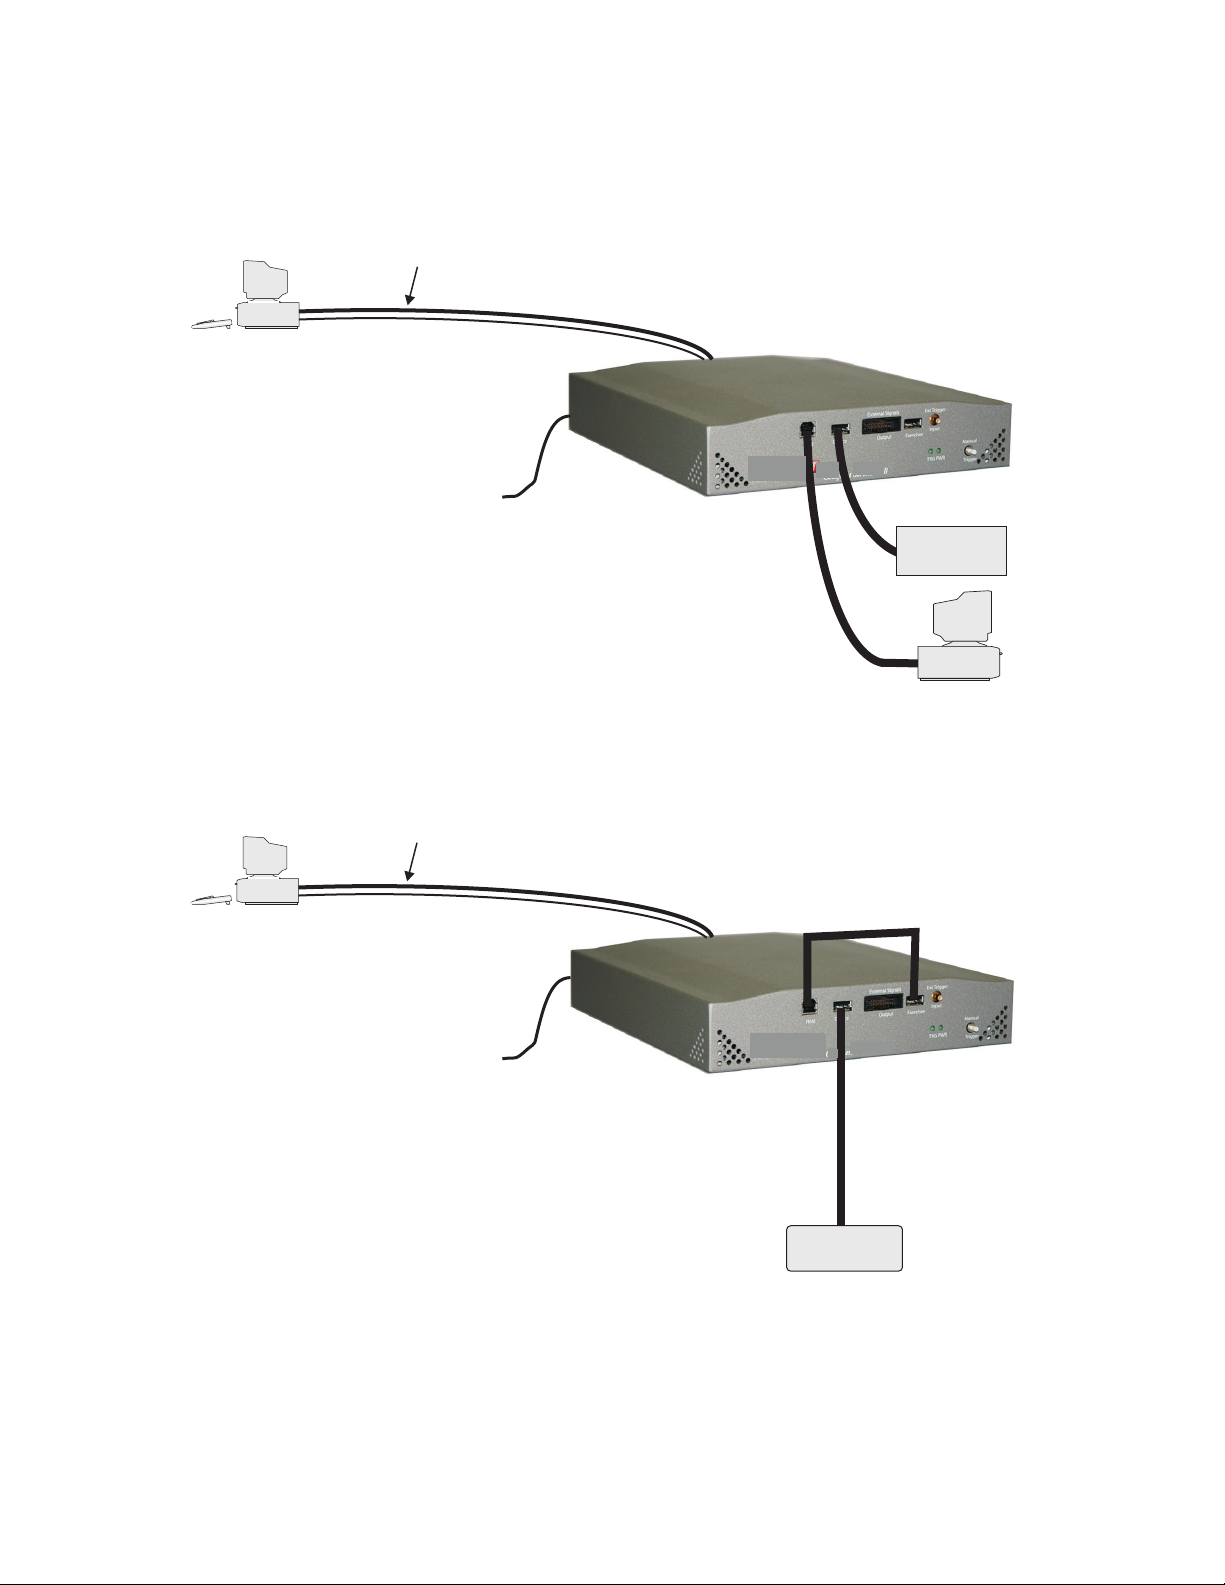
Installing the Analyzer
Conquest Exerciser Connections
Figure 8 Conquest Connected as an Analyzer
Figure 9 Conquest Connected as an Exerciser
Note: The Exerciser option is no longer available on the Conquest platform.
Exerciser is offered on the Conquest M2 system only.
14
Page 25

Installing the Analyzer
Conquest M2 External I/O Connector Pin Assignment
The external I/O connector provides the means for accepting a CMOS level
input trigger and 8 CMOS level outputs that represent an 8-bit value.
Table 1 External I/O Connector Pin Assignment
Signal Pin Color Signal Pin Color
External Trigger In 1 Brown External Out 7 2 Red
GND 3 Orange External Out 6 4 Yellow
GND 5 Green External Out 5 6 Blue
GND 7 Violet External Out 4 8 Grey
GND 9 White External Out 3 10 Black
GND 11 Grey External Out 2 12 Red
GND 13 Orange External Out 1 14 Yellow
GND 15 Green External Out 0 16 Blue
Conquest External I/O Connector Pin Assignment
Table 2 External I/O Connector Pin Assignment
Signal Pin Color Signal Pin Color
No connect 1 Brown No connect 2 Red
GND 3 Orange External out 7 4 Yellow
GND 5 Green External out 6 6 Blue
GND 2 7 Violet External out 5 8 Gray
GND 9 White External out 4 10 Black
GND 11 Brown External out 3 12 Red
GND 13 Orange External out 2 14 Yellow
GND 15 Green External out 1 16 Blue
External out 0 N/A
Note 1 Pin 1 is the right-most in the cable (Brown) and pin 16 is the left-most in the
cable (Blue).
Note 2 The signal “External out 0” (LSB) is not externally available.
15
Page 26

Software Installation
On systems operating under Windows® 2000, Windows XP, and
Windows Vista.
Note: Do not connect the Analyzer to the host system until software
installation is complete!
1. Insert the CD Rom in the CD Rom drive.
2. The installation automatically starts the setup, unless the Auto Run is
turned off. In this case, select the CD Rom from “My Computer” and click
setup.
3. After the warning to close all other programs and before starting the
installation, the Install component selection opens.
4. Select components for installation.
Installing the Analyzer
System Restart
Error Message
5. Click N
You must restart the computer before you can use the Analyzer software.
If you get an error message during installation of the drivers for Windows
2000, XP, or Vista, consult your system administrator. Your system may allow
only an administrator-level user to copy driver files.
ext to complete the installation.
16
Page 27

Installing the Analyzer
Manual USB Driver Installation
To manually install the USB driver, perform the following:
1. Power up Conquest.
2. Connect the USB cable between the Conquest USB Port interface and
the Host Computer USB port.
3. After Windows detects the new Device, select the Search For Suitable
Driver for My Device option button.
4. Click Next.
5. Choose the Specific location option button and deselect all other option
buttons.
• Click Next.
• Go to the C:\program files\LeCroy\Conquest\usb driver\win2k
folder.
• Choose Ibusb.inf.
• Click OK.
6. Click Next and then Finish to complete the Conquest USB port driver
installation.
Updating the Conquest USB Driver Manually
1. Click S
Device Manager tab.
2. Find the Test To ols entry.
3. Select and right-click the Conquest board.
4. Select Properties and click the drivers tab.
5. Click Update Driver.
6. Select recommended method
7. Choose the Specific location option button and deselect all other option
buttons.
• Click Next.
• Go to the C:\program files\LeCroy\Conquest\usb driver\win2k
• Choose Ibusb.inf
• Click OK.
8. Click Next and then Finish to complete the USB driver update.
tart > Settings > Control Panel > System and click the
folder.
17
Page 28

Directory Structure on Windows XP and Vista
The Conquest Protocol Suite application stores files in a specific directory
structure under the C:\Program Files\LeCroy\Conquest directory. It also
stores files in Windows-specific locations that differ for Windows
Windows Vista (which uses UAC).
In particular, Windows XP has a Documents and Settings\All Users folder,
and Windows Vista has a Users\Public folder, which are not equivalent.
The Windows XP All Users folder is not readily available to users and is for
storing shared files, to which normal user folders point using shortcuts.
The Windows Vista Users\Public folder and its subdirectories:
• Are available to all users logged onto a system (not just the person who
installed the application).
• Are not hidden.
• Are always present, because it is provided by the Windows Vista OS
installation.
• Are readable and writable by all users.
• Do not require Administrator privileges.
Methods of using shared folders differ for the two operating systems, so the
Conquest Protocol Suite application stores files on them differently, as
described in the next two sections.
Installing the Analyzer
®
XP and
Windows XP
For Conquest Protocol Suite on Windows XP, all application and user files
(such as sample files, user files, default files, and scripts) are in the
<drive>\Program Files\LeCroy\Conquest directory folder and its
subdirectories:
•Doc
• CAPI
•SystemData
•UserData
•Examples
The installation process creates the folder
<drive>\Program Files\Lecroy\Conquest.
Running the application the first time creates the folder
<drive>\Users\Public\Public Documents\LeCroy\Conquest 7.40.xx
18
Page 29

Installing the Analyzer
Windows Vista
User-modifiable Files
For Conquest Protocol Suite on Windows Vista, user-modifiable files are in the
Windows Explorer
<drive>\Users\Public\Public Documents\LeCroy\Conquest 7.40.xx folder,
which is the same as the Command Tool
<drive>\Users\Public\Public Documents\LeCroy\Conquest 7.40.xx folder
and Desktop\Public Documents\LeCroy\Conquest 7.40.xx folder.
The Command Tool name is the correct folder name when using scripts.
The Users\Public\Public Documents\LeCroy\Conquest 7.40.xx\UserData
folder contains files that the user can modify, such as new.cpr and Out.smp.
It also has the directories:
•SystemData
•Temp
•UserData
Application Files
For Conquest Protocol Suite on Windows Vista, read-only application files
(such as the application, bus engine, firmware, user manual, help, and readme files) are in the <drive>\Program Files\LeCroy\Conquest folder, which
has the directories:
• CAPI
•Doc
•Examples
•SystemData
• usb driver
•UserData
Note On Windows Vista systems, the Conquest Protocol Suite application creates
an image of its directories in
Public\Public Documents\LeCroy\Conquest 7.40.xx.
Note 2 For Windows Vista systems, the Conquest Protocol Suite application creates
directories for Conquest when the application is first run, not when it is
installed.
19
Page 30
Launching the USB Analyzer
Open sample file
Open last saved project
Default data blocks
Mnemonics
Protocol error mask
Default capture
Set up project
Launching the USB Analyzer
To launch the software, select LeCroy > Conquest in the Start menu or
double-click the Conquest Suite button in the Program Manager Window.
Each time you run the software, it searches for a default host interface and, if it
is found, the software launches. If no interface is found, the software launches
in simulation mode.
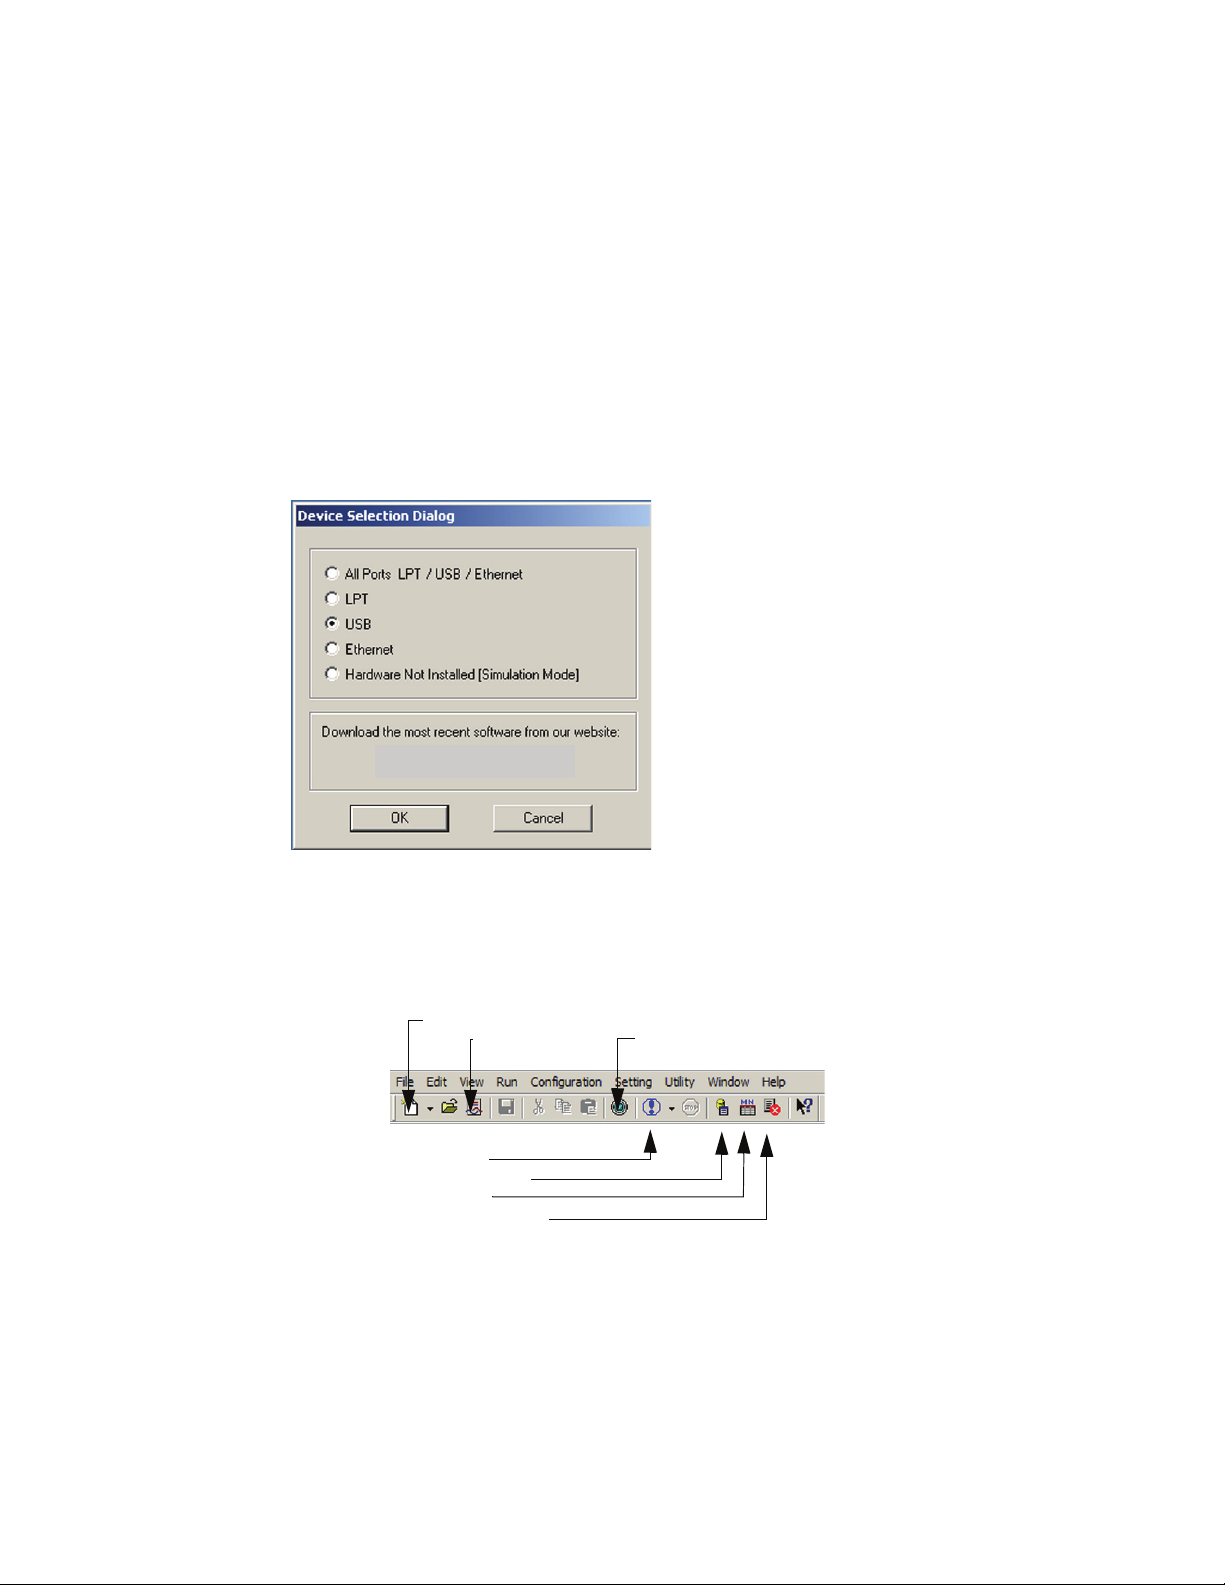
Establish Interface
If no interface is detected initially, then establish an available interface and
relaunch the software.
Click OK. The Analyzer launches and displays the Analyzer toolbar as shown
below.
Note: The very first time that you run the software, the USB Class Decodes loads.
This process takes approximately one minute.
20
Page 31

Launching the USB Analyzer
If Conquest is not detected, the software displays the Hardware Not
Detected message.
Multiple Analyzers
If you have multiple Analyzers installed, you get the following message. In
such cases choose the Analyzer and click Attach.
Connecting via Ethernet
You can use the ethernet connection using any one of the following three
supported configurations:
1. Conquest connected to a network via a hub, switch, or similar device.
2. Conquest connected to the host computer (machine running the
application software), via a hub, switch or similar device.
3. Conquest connected directly to the host computer using a crossover
cable.
21
Page 32

Connecting to a Network
Conquest
Conquest
When connected to a network, Conquest must communicate with the DHCP
server to establish a connection. The DHCP server continually sends the next
available IP address to Conquest until the Conquest Protocol Suite software
starts.
When you start the software, the system may prompt to automatically use the
offered IP address or use an assigned IP address. (The assigned IP address
must be on the same network segment as the host computer.) The menu also
allows you to save the selected option (automatic or specific address). If the
assigned IP address is not available, the OS notifies you of an IP address
conflict.
Launching the USB Analyzer
After you click OK, the software searches for all Conquest units connected to
the network and displays a list of available Conquest units. After you select a
Conquest unit, the software assigns the IP address to the selected unit,
completing the connection, and launches the software.
22
Page 33

Launching the USB Analyzer
Connecting via Hub, Switch or Similar device
When connected to the host machine via a hub, switch, or other similar
device, or directly using a crossover cable, the board must communicate with
the host computer to establish a connection. The host computer continually
broadcasts the next available IP address to the board until the
Conquest Protocol Suite software starts.
When the software starts, the system may prompt if you want the software to
automatically use the offered IP address or use an assigned IP address. (The
assigned IP address must be on the same network segment as the host
computer.) The menu also allows you to save the selected option (automatic
or specific address). If the assigned IP address is not available, the OS
notifies you of an IP address conflict.
After you click OK, the software searches for all boards connected to the
network and displays a list of available boards. After you select a board, the
software assigns the IP address to the selected board, completing the
connection, and launches the software.
Operating in Simulation Mode
The system operates in Simulation Mode as default if the hardware is not
detected. However, you can operate in Simulation Mode directly without
installing the Analyzer hardware. To operate without hardware, select
Hardware Not Installed (Simulation Mode).
The Analyzer software launches and displays the tool bar, but with the
limitation that the Analyzer operates on static, previously captured bus data.
Limitations
The Simulation mode lets you try all of the available functions, but keep in
mind that the system is not capturing any real data and is displaying
pre-captured results.
23
Page 34

Authorization
An authorization code is required to activate features not originally included
and purchased at a later time.
To enter the authorization code, click Configuration on the main toolbar and
then select Authorization.
The Authorization Code dialog opens.
Launching the USB Analyzer
Enter the authorization code for the product(s) purchased and click OK.
24
Page 35

Launching the USB Analyzer
Example Projects
Conquest includes a number of pre-defined example projects that you can use
to perform an immediate analysis without any setup.
The Conquest Protocol Suite software comes with a pre-defined folder
(directory) structure for storing all files. All example files are stored in the
Examples folder.
It is strongly recommended that you open some of these files to get an
introduction to project types.
25
Page 36

Project File Types
The various Conquest configurations may have the following file types (see
the next page for which configurations support which file types):
*.acp Advanced capture project file
*.ade Advanced emulation example
*.adm Device Emulation project file
*.aoe OTG Exerciser file
*.app Advanced performance analysis project file
*.asl Advanced Script language file
*.bin Binary file
*.cfg Viewer Display Configuration settings
*.cpr Custom project file
*.dat Data block file
Launching the USB Analyzer
*.ecp Easy capture project file
*.epp Easy performance analysis file
*.irc Previously performed inrush current measurement file
*.paf Easy performance analysis project file
*.rpt Viewer report file
*.sdv Scan descriptor file
*.smp Previously performed project results file
*.tas Previously performed timing analysis file
*.txt Text file
*.vbd VBus Droop file
*.vdr Viewer data report file
26
Page 37

Launching the USB Analyzer
Conquest Standard and Advanced configurations do not support all project
types. The table below outlines which project and report types can be created,
opened, executed by each of the Conquest configurations.
Table 3 File Types in Conquest Models
File Types Conquest
Standard
Conquest
Advanced
Conquest
M2 Pro
Conquest
M2 Pro
with
Exerciser
*.ecp Easy capture project file
*.cfg Viewer Display Configuration settings
*.asl Advanced Script language file
*.vdr Viewer data report file
*.rpt Viewer report file
*.txt Text file
*.smp Previously performed project results file
*.acp Advanced capture project file
*.bin Binary file
*.cpr Custom project file
*.dat Data block file
*.epp Easy performance analysis file
*.irc Previously performed inrush current
measurement file
xxxx
xxxx
xxxx
xxxx
xxxx
xxxx
xxxx
xxx
x
xx
x
xx
xx
*.paf Easy performance analysis project file
*.app Advanced performance analysis project file
*.sdv Scan descriptor file
*.tas Previously performed timing analysis file
*.vbd VBus Droop file
*.ade Advanced emulation example
*.adm Device Emulation project file
*.aoe OTG Exerciser file
xx
xx
x
xx
xx
x
x
x
27
Page 38

Run an Example Project
To run a project:
Launching the USB Analyzer
1. On the menu bar, select F
2. Choose the example type from the Files of Type Combination box,
choose an example, and click O
ile > Open.
pen.
3. Click R
un to execute the example.
28
Page 39

Launching the USB Analyzer
Default Capture
The default capture offers you one button activation of a default project.
The software includes a pre-defined default capture. However, you can define
your own default capture by creating a new capture project and setting it to be
the Default Project for immediate capture.
Click the Default Capture button on the main toolbar to perform
an immediate data capture and trigger.
After a short time, current bus activity displays.
Note: After completion of data capture, the system uploads a 64-kilobyte page for
each screen view. The system saves uploaded 64-kilobyte pages in the \Temp
folder as temporary files with extension .smp_. If you Save the data capture,
the system saves the whole recorded capture on a hard disk. Saving data
replaces the temporary extension .smp_ with extension .smp.
29
Page 40

Creating Projects
The Conquest M2 Analyzer allows you to create projects using Easy and
Advanced mode capabilities in any combination.
Click the New Project button on the main toolbar to display the
Project Setup dialog.
Click the project type and configure the project to define Easy and/or
Advanced mode operation as applicable.
Launching the USB Analyzer
Capture and Timing Analysis Projects
See page 33 for setup of an Easy Mode Capture.
See page 55 for setup of an Advanced Mode Capture.
See page 46 for setup of an Easy Mode Exerciser.
See page 67 for setup of an Advanced Mode Exerciser.
See page 123 for setup of Easy and Advanced Mode Timing Analysis.
30
Page 41

Launching the USB Analyzer
Performance Analysis Projects
Check a Performance Analyzer, Exerciser option and click the
Create Project button to display the corresponding project setup dialog.
See page 109 for setup of an Easy Mode Performance Analysis.
See page 112 for setup of an Advanced Mode Performance Analysis.
Device Emulation & OTG Advanced Exerciser
Check the Emulation to use to open the corresponding project setup dialog.
See page 130 for setup of an Easy Mode Device Emulation.
See page 138 for setup of an Advanced Mode Device Emulation.
See page 145 for setup of the OTG Advanced Exerciser.
Current and Voltage Measurements
Check a measurement type to start the measurement.
See page 165 to perform an Inrush Current measurement.
See page 156 to perform an Unconfigured Current measurement.
See page 170 to perform an Suspend Current measurement.
See page 158 to perform an Operating Current measurement.
See page 161 to perform a VBus measurement.
See page 163 to perform a VBus droop
measurement.
31
Page 42

Launching the USB Analyzer
32
Page 43

Protocol Analysis
- Timing and Clock Distribution
- Real Time Protocol Error and Event Recognition
- High Speed State Machine (Sequencer)
MEMORY
MEMORY
MEMORY
MEMORY
MEMORY
INRUSH &
SUSPEND
CURRENT
DIGITIZER &
MEASUREMENT
USB 2.0
ANALYZER
DEVICE
EMULATION
ALL SPEED
USB2.0 AUX.
ANALYZER
HOST
DEVICE
HOST
DEVICE
DEVICE
DEVICE
ALL SPEED
SBAE-30
MEMORY
OTG
MEMORY
HOST
EXERCISER
HOST
USB DEVICE
HOST
CONTROLLER
OTG
EXERCISER
I
C
I
U
TIMING
ANALYZER
Protocol Analysis
Easy Mode (Pre-Defined Setups)
This mode allows you to operate Conquest with a minimum of setup. You can
perform a Trigger and Data capture only, or program an Exerciser to generate
bus traffic for triggering and data capture. Figure 10 shows a functional
Capture and Trigger setup.
Figure 10 Capture and Trigger Functional Connection
33
Page 44

Easy Data Capture
Make sure that the configuration is set to use Easy Analyzer. See “Creating
Projects” on page 30.
Click the Green button on the main toolbar to open the last saved
project.
New Project
To start a New project:
Protocol Analysis
1. Select F
2. Click the drop-down arrow next to the Trigger drop-down list box and
choose a trigger. Table 4 on page 42 lists the available trigger selections.
The available triggers are different for High speed and Full/Low speed
operation. All triggering selections, however, are available when the
Analyzer is set to operate in the Auto Speed mode.
ile > New and choose Analyzer Host Exerciser Project.
Figure 11 Trigger and Capture Data Dialog Box
34
Page 45

Protocol Analysis
3. If known, you can specify a Device address (in hex) and an endpoint
address (in binary) by making the appropriate entries in the Dev Addr
and Endpoint text box.
Figure 12 Trigger Choices in High Speed Mode
4. Choose up to three Data Capture selections from the three available
Data Capture drop-down list boxes. Table 5 on page 44 lists the
available selections. The capture selections are different for High speed
and Full/Low speed operation. All capture selections, however, are
available when the Analyzer is set to operate in the Auto Speed mode
(only in Conquest M2).
Figure 13 Data Capture Choices in High Speed Mode
To exclude NAK, NYET Transactions and/or SOF, Keep Alive Events, check
the corresponding check box. These are filtered in real time by the hardware
without using memory resources.
5. Click R
display, as shown in Figure 14.
un to capture and trigger immediately and wait for the results to
35
Page 46

For ways to enhance results analysis in the results display, see “Display
Manipulation” on page 175.
Note: After completion of data capture, the system uploads a 64-kilobyte page for
each screen view. The system saves uploaded 64-kilobyte pages in the \Temp
folder as temporary files with extension .smp_. If you Save the data capture,
the system saves the whole recorded capture on a hard disk. Saving data
replaces the temporary extension .smp_ with extension .smp.
Data Capture Options
The capture and triggering is performed with default Data Capture Options.
For explanation on setting the Data Capture Options see page 43.
Protocol Analysis
Trigger on Data
Trigger on Data is a useful triggering option when looking for a data stream of
up to 8 bytes within one or two consecutive transactions. Selecting Data as a
triggering choice offers the following Data triggering choices:
•Packet
• Pattern
• Length
Figure 14 Captured Results Display
36
Page 47

Protocol Analysis
Trigger on a Data Packet
This is the default setting when trigger on Data is selected.
Choose Packet Type
Click the down arrow next to the Type list box and select a packet type on
which to trigger.
Trigger on a Data Pattern
To trigger on a data pattern, check the Pattern button. A pattern can be across
up to eight similar transaction types by checking the Multiple Transaction
check box.
Figure 15 Trigger on a Data Packet Dialog
Figure 16 Trigger on Data Pattern Dialog
Click the down arrow next to the Data Pattern list box, then select a
pre-defined pattern or enter a pattern directly in the list box (eight bytes
maximum).
37
Page 48

Multiple Transactions
To trigger on a pattern over multiple transactions, check the Multiple
Transaction and define the transaction types for triggering in the Advanced
Trigger dialog.
Set Address
Specify a Device Address and an Endpoint Address to prevent
mis-triggering by different devices.
Protocol Analysis
Figure 17 Advanced Trigger Setting Dialog
Trigger on Data Length
To trigger on Data Length, check the Length button.
Define Pattern Length
Choose a length condition by clicking the down arrow next to the Condition list
box. Make a selection and enter a Payload Length value.
38
Page 49

Protocol Analysis
Sample Capture Result for trigger on data pattern
Figure 18 shows a capture result with a trigger on a data pattern identified.
Figure 18 Trigger on Data Pattern
To view details of the trigger, click the Data Pattern Triggered On button to
open the Triggering Transactions dialog as shown in Figure 19.
39
Figure 19 Triggering Transactions
Page 50

Manual Trigger
Protocol Analysis
To perform a manual trigger, select Manual from the Trigger drop-down list
and choose a Data Capture transaction.
Figure 20 Enabling Manual Trigger
Push the Manual Trigger button on the front panel to trigger the Analyzer.
External Trigger
To trigger on an external signal, select External from the Trigger
drop-down list box.
40
Page 51

Protocol Analysis
To trigger on Protocol Error
Select Protocol Error from the Trigger drop-down list. For a definition of
protocol errors see page 104.
Figure 21 Triggering on Protocol Errors
Exclude Protocol Errors
To exclude specific protocol errors from triggering, define a Protocol Error
mask.
To mask protocol errors, click the Protocol Errors button on the
toolbar to open the Protocol Errors Dialog box.
Uncheck the protocol errors to exclude and click OK.
41
Figure 22 Protocol Error Mask
Page 52

Protocol Analysis
Table 4 Pre-Defined Trigger Selections
1 Snap Shot (Note 1) 16 Split Setup Transaction*
2 Any Transaction 17 Split Bulk IN Transaction*
3 Data 18 Split Bulk OUT Transaction*
4 Bus Reset 19 Split Interrupt IN Transaction*
5 Resume 20 Split Interrupt OUT Transaction*
6 Suspend 21 Split Isochronous IN Transaction*
7 Chirp* 23 Split Isochronous OUT Transaction*
8 HNP (OTG event) 24
9 SRP (OTG event) 25
10 Session (OTG event) 26
11 Protocol Error 27 Timing Patterns (Note 4)
12 Setup Transaction 28 VBus Measurement (Note 2)
13 In Transaction 28 Operating Current (Note 3)
14 Out Transaction 29 Manual
15 Ping Transaction* 30 External
Setup With Preamble Transaction
Asynchronous IN With Preamble Transaction
Asynchronous OUT With Preamble Transaction
31 Bus Error (SE1)
#
#
#
Note 1 Snapshot triggers at state 0 allowing you to get an overview of bus activity
independently of the occurrence of an event, packet or transaction.
Note 2 To trigger on VBus, the level has to remain at the specified value for 2 µsec
with a tolerance of ±10 mV.
Note 3 To trigger on Operating Current, the Operating Current has to remain at the
specified value for at least 0.2 µsec with a tolerance of ±1.5 mA.
Note 4 Triggering on Timing Patterns is available only with the Timing Analysis option.
* Not available in Full/Low speed.
#
Full/Low speed only.
42
Page 53

Protocol Analysis
Data Capture Options
Memory Display
You can limit the captured data display to a specific number of samples by
checking Partial Memory and entering the number of Samples to capture or,
you can check entire memory to allow the capture for the entire memory.
Pre-Trigger
Pre-Trigger is set by default at 50%, which defines the percentage of data to
capture before and after the triggering event. You can change this percentage
by dragging the slider to a value.
Pre-Trigger Data
The capture of the specified percentage of the data prior to the triggering
event cannot be guaranteed and may in some cases be 0. This can occur in
cases where the triggering event occurs before the required amount of
pre-trigger event data can be stored. In these cases, the data display shows
fewer than the specified data points prior to the triggering event. For more
detail see Pre-Trigger on page 107.
Manual Trigger
Select this option to manually interrupt the data capture based on some
external event. Select this option from the Trigger drop down list (see page 40)
and start the capture. Data is continually captured to memory and overwritten,
until you push the Manual Trigger button on the front panel.
43
Page 54

Auto Run
Protocol Analysis
To repeat the current capture and trigger setup automatically, check the
Auto Run checkbox and enter the number of times in the Times text box. The
capture and trigger repeat automatically for the specified number of times and
the results saved in consecutively numbered Out.smp files.
Table 5 Pre-Defined Data Capture Selections
1 Everything 10 Split Bulk OUT Transaction
2 Any Transaction 11 Split Interrupt IN Transaction
3 Custom Transaction 12 Split Interrupt OUT Transaction
4 Setup Transaction 13 Split Isochronous IN Transaction
5 In Transaction 14 Split Isochronous OUT Transaction
6 Out Transaction 15 Setup with Preamble Transaction
7 Ping Transaction 16 Asynchronous IN with Preamble Transaction
8 Split Setup Transaction 17 Asynchronous OUT with Preamble Transaction
9 Split Bulk IN Transaction
44
Page 55

Protocol Analysis
Custom Transaction
This mode allows a quick setup to perform a capture that includes or excludes
a specific transaction type.
To set up a custom capture:
1. Select Custom Transaction from the Data Capture dropdown list.
Figure 23 Custom Transaction Dialog
2. Click the down arrow next to the Transaction Type drop down list box
and choose a transaction.
3. Click either the Capture or Exclude button to define the capture.
4. You can additionally refine the capture by specifying a Device and
Endpoint address, a packet type and Data.
45
Page 56

Exercise and Capture (Optional)
- Timing and Clock Distribution
- Real Time Protocol Error and Event Recognition
- High Speed State Machine (Sequencer)
MEMORY
MEMORY
MEMORY
MEMORY
MEMORY
INRUSH &
SUSPEND
CURRENT
DIGITIZER &
MEASUREMENT
USB 2.0
ANALYZER
DEVICE
EMULATION
ALL SPEED
USB2.0 AUX.
ANALYZER
HOST
DEVICE
HOST
DEVICE
DEVICE DEVICE
ALL SPEED
SBAE-30
MEMORY
OTG
MEMORY
HOST
EXERCISER
HOST
USB DEVICE
OTG
EXERCISER
EXTERNAL CABLE
TIMING
ANALYZER
I
C
I
U
To perform Exercise and Capture you must connect the Exerciser to the port
that is used for analysis with the external cable provided. Figure 24 shows a
functional Exercise and Capture setup for a High Speed Device.
Protocol Analysis
Figure 24 Exercise and Capture Functional Connection
46
Page 57

Protocol Analysis
Programming the Exerciser in Easy Mode
Click the Exerciser Program tab to open the Exerciser Programming dialog
box as shown in Figure 25.
Figure 25 Exerciser Easy Mode Programming Dialog Box
Set up the Device
You must use Find Device first to enumerate the device automatically. After
enumeration is complete, the system sends SOF or Keep Alive packets to
prevent the device for entering a suspended state.
Click F
Device connected automatically.
Verify that the USB Device is powered up and operational by noting the
display of Detecting First Device ..., followed by Devices that Conquest
detects connected to the Main Analyzer USB port.
ind Dev. to command the system to identify the USB
47
Page 58

Data
Protocol Analysis
After a short time the connected USB Device identification appears in the
Attached Device list box as shown in Figure 26.
Figure 26 Device Identified
At this point you are ready to create an exerciser program for the identified
Device. As an example, choose Control as the Endpoint Type, Get
Descriptor as the command and Device as the Descriptor Type from the
corresponding list boxes and click Add. Repeat for additional program steps.
Insert Line
For commands requiring data blocks, click the down arrow next to the Data
drop down list box and choose from a set of pre-defined data blocks. If you
need a new data block, click the Settings tab and then the Data Blocks
button. See page 50.
Figure 27 Sample Exerciser Program
You can insert an additional program line anywhere in the program by
highlighting an existing program line above which to insert the new line, define
the command, and click the Insert button.
48
Page 59

Protocol Analysis
Define Loops
To define program loops, click under Loops in the program line in which to
start the loop and click Start. Similarly click under Loops in the program line in
which to end the loop and click End. See page 50 for setting the number of
times to run the loop.
Enable Exerciser
Make sure that the Run Exerciser check box is checked.
Choose Trigger and Capture Options
Click the Data Capture and Trigger tab, then choose a Trigger and Data
Capture option or options to analyze the traffic generated by the exerciser.
Figure 28 Sample Trigger and Data Capture Selection
Click R
as shown in Figure 29.
un to exercise the Device and wait for the captured results to display,
49
Figure 29 Captured Data Display
Page 60

Settings
Protocol Analysis
Click the Settings tab to open the Project settings dialog box as shown in
Figure 30.
Figure 30 Project Settings Dialog Box
Analyzer Speed
The default is Auto Speed for automatic speed detection, however, you can
force the speed by choosing Full/Low or High for special testing needs.
Looping
You can specify the number of times to loop the command line(s) or you can
run them continually. You can set the number of times from 2 to a maximum of
1,048,575 times.
Clock
To specify a clock speed or an external clock, check the Full/Low Speed or
High Speed option buttons and the NonStandard check box. Then make a
Clocks choice. The available choices are four pre-set clock speeds and an
External clock, which must be connected to the Analyzer as described on
page 8.
Generate SOFs/Keep Alives when exerciser program ends
Check this box to keep device from suspending.
Data Blocks
If you require a new data block, click the button next to the
Data Block File dialog to open the data block definition dialog. Define a new
data block as described on page 86.
50
Page 61

Protocol Analysis
High Speed Test Mode
When a High Speed USB Device is set into a Test_Packet mode it must
respond with a standard Data0 packet with pre-defined data. Selecting this
option allows capture of this packet.
High Speed Test Mode Usage
1. Set Test Mode on the Device (the exerciser can do this).
2. On the Settings tab, set Analyzer Speed to High Speed instead of
Autospeed and select the High Speed Test Mode.
Trigger Mask
External Bits
3. Press R
If you selected an External Trigger as described on page 40, click the Trigger
Mask button in the Project Settings dialog repeatedly to set a trigger option.
To output a data pattern whenever a trigger occurs, enter a pattern in the
External_Bits text box in Easy Mode and in the Sequencer when operating in
the Advanced Mode. To access the data pattern as external signals see
“Conquest M2 External I/O Connector Pin Assignment” on page 15.
un to capture the test packet.
To trigger on a “0” level.
To trigger on a “1” level
To trigger on a rising edge.
To trigger on a falling edge.
Transaction Retry
The settings dialog default is per USB specification, however, you can enter
non standard conditions for the application.
51
Page 62

Partial Data Payload Capture
To refine the capture check the Partial Data Payload Capture check box,
choose a transaction type.
You can further enter a Device and Endpoint address, set a limit of the number
of bytes to capture or to capture from an offset.
Protocol Analysis
52
Page 63

Protocol Analysis
ALL SPEED
USB2.0 AUX.
ANALYZER
- Timing and Clock Distribution
- Real Time Protocol Error and Event Recognition
- High Speed State Machine (Sequencer)
MEMORY
MEMORY
MEMORY
MEMORY
MEMORY
INRUSH &
SUSPEND
CURRENT
DIGITIZER &
MEASUREMENT
USB 2.0
ANALYZER
DEVICE
EMULATION
HOST
DEVICE
HOST
DEVICE
DEVICE DEVICE
ALL SPEED
SBAE-30
MEMORY
OTG
MEMORY
HOST
EXERCISER
HOST
OTG
EXERCISER
USB
DEVICE
HOST
CONTROLLER
HUB
IN
OUT
I
C
I
U
I
C
TIMING
ANALYZER
Auxiliary Port
To perform Hub testing using the Auxiliary port, connect as shown in Figure
31.
Figure 31 Auxiliary Connector in Hub Testing
53
Page 64

Auxiliary Port Data Capture
Protocol Analysis
Figure 32 Auxiliary Port Data Capture Selection
Analyzer Only
Project Note
When used for Hub testing, the Conquest M2 Auxiliary Port performs as an
Analyzer only with pre-defined data capture options and has no triggering
capability. Triggering is limited to the Main Analyzer Port.
To enter a note about the current project, click the Project Note tab and enter
the data to associate with this project.
54
Figure 33 Easy Project Note
Page 65

Protocol Analysis
Advanced Mode (User-Defined)
This mode expands Analyzer capability by allowing you to program complex
triggering and data capture projects. Such projects are programmed by
defining USB transaction packets and then including them for data
manipulation and trigger in a sequencer. Additionally, you have the capability
to exercise the bus with pre-determined data by programming and invoking
the exerciser.
Capture Data Project
Make sure that the configuration is set to use Advanced Analyzer. See
“Creating Projects” on page 30.
Last Project
New Project
Note: To perform data capture and triggering with exerciser generated data you must
Clicking the Green button opens the last project saved.
To start a New project, select F
For a custom project:
• Define a set of packets
• Program the Sequencer
• Program the Exerciser (Optional)
use the Exerciser Port as shown in Figure 3.
ile > New > Analyzer/Host Exerciser Project.
55
Page 66

Defining Packets
You can define up to eight different packets. To define a packet, click the
Packet tab to display the packet definition dialog on top.
Protocol Analysis
Figure 34 New Project Dialog Box
56
Page 67

Protocol Analysis
1. Click the down arrow in the Packet Type list box and choose a packet
type from the following choices:
Packet Types
1
SOF Start of frame (Full Speed) or start of microframe
(High Speed)
SPLIT (Token) Defines split transaction type
IN (Token) Requests information from a Device
OUT (Token) Designates a data transfer to a device
SETUP (Token) Indicates the start of a control transfer
PING (Token) High-speed flow control probe for a
bulk/control endpoint
DATA0 Data Packet PID even
DATA1 Data Packet PID odd
DATA2 Data Packet PID for High Speed, High bandwidth,
Isochronous transactions
MDATA Data Packet PID for High Speed Split or High bandwidth
Isochronous transactions
ACK Target received data without error
NAK Target unable to accept data
NYET No response yet from receiver
STALL Indicates error preventing data transfer
PRE (Token) Preamble, enables low speed port (Full/Low speed
mode only)
ERR Split transaction error handshake (High speed mode only)
User-defined Arbitrary set of patterns that you define
2. Complete the enabled packet definition parameters for the selected
packet Type
• Check: Default value that you can change to search for other
check values on the bus
• Device Address: The address of the token packet to capture (0-7F)
• Endpoint: The end point of the token packet (0-15) (Entered in binary)
• CRC5: Default value that you can change to search for other CRC5
values on the bus. (5-bit CRC used by packets other than data)
• CRC16: Default value that you can change to search for other CRC16
values on the bus. (16-bit CRC used by data packets)
1. For a detailed description of USB packets, see Universal Serial Bus Specification, Revision
2.0, April 27, 2000
57
Page 68

Packet Payload Data
For packet types that include payload data, Conquest M2 offers a set of predefined or user-defined data blocks.
Data
Enter data directly into the data edit box, define a data block by clicking the
Data Blocks... button, or open a previously created data block file. For
detailed instructions on creating Data Blocks, see “Creating a Data Block” on
page 86.
User Defined Dialog
When you choose a “User Defined” packet type, the following dialog allows
you to define an arbitrary set of patterns by checking available choices.
Protocol Analysis
Figure 35 User Defined Packet Dialog Box
58
Page 69

Protocol Analysis
Overlap Warning
In the event that you make user-defined packet choices that result in overlaps,
you get the following warning message.
Figure 36 Overlap Warning
If you proceed with overlapping selections, you cannot edit the results,
because of “don’t care” entries. For example, combining 1101 with 1001
results in 1X01.
59
Page 70

The Sequencer
The Sequencer is for data capture manipulation, generating complex
triggering, and starting the exerciser. Sequencer operation at each state
controls the Analyzer capture functions in response to specified bus activity.
The USB Analyzer Sequencer allows you to define up to 32 states. The
Sequencer always starts at “State0”. You can program each state to go to any
other state, depending upon the occurrence of packets or events in that state.
Jump to any state is conditional and the jump may occur to several other
possible states depending on which of the specified conditions is met first.
You can set a trigger in the Sequencer, to occur at any state, on:
• Every packet (unconditional)
• Every event (unconditional)
• Occurrence of any packet or a boolean expressions of packets.
• Occurrence of Bus_Idle, Resume, Bus_Reset, Disconnect, Keep Alive,
Suspend, Chirp, Session, SRP, Connect, HNP or Protocol Error
Protocol Analysis
Sequencer Operation Overview
Whenever a project runs, Conquest starts monitoring data on the bus and
starts the sequencer in “State0”. You can program “State0” to
start capture immediately (Default) or to wait for a specific occurrence on
the bus. You can select what to capture:
• Capture all events
• Capture all Packets
• Capture a specific event or events
• Capture a specific packet or packets
If a user-selected event, packet, or logical combination of these occurs, the
sequencer transitions to another state you selected.
You can program each state to output an external bit pattern, set a trigger, and
change what is to capture. If the capture involves the use of the exerciser you
can only start it in “State0”.
60
Page 71

Protocol Analysis
Set initial actions: Set trigger, set external bit pattern or start exerciser
Set Start or Stop data capture
Define what to capture
Choose condition for state transition
Choose next state
Programming the Sequencer
To program the Sequencer, click the Sequencer tab to display the sequencer
programming dialog as shown in Figure 37.
The sequencer programming dialog opens with default settings and all of the
programmable parameters displayed in blue.
Click the Add State button to add additional states, up to 32.
Program State0
In “State0” you choose, if you want to set a trigger, set an external bit pattern,
start the exerciser, when to start a data capture, what to capture and when to
transition to another state
Figure 37 Sequencer Programming Dialog
1. To set the initial sequencer actions, click the ellipses next to “State0”
2. Choose one or all of the available choices one at a time.
61
Page 72

Counters
Protocol Analysis
The sequencer incorporates two counters each of which you can configure as
a timer or an event counter, with the following commands:
• Set_Timer1
• Set_Counter1
• Enable_Timer1
• Enable_Counter1
• Set_Timer2
• Set_Counter2
• Enable_Timer2
• Enable_Counter2
Set the counters with the Set_Timer and Set_Counter commands, with
corresponding timer or counter values in any state.
Whenever a state transition occurs, the timer or counter stops, unless an
Enable_Timer or Enable_Counter command is set in the next state.
Start Exerciser
You can start the exerciser at “State0” only. To start the exerciser, click the
ellipses next to “State0”. Note, however, that you must program the exerciser
prior to running the project to get meaningful results. For instructions on
programming the exerciser, see page 67.
External Outputs
You can set the eight external output bits on the output connector at any state
by clicking the ellipses next to the sate, choosing External_Bits from the
drop-down list for that state, and then entering a bit pattern. See page 15 for
external output connector pin assignment.
62
Page 73

Protocol Analysis
To define what to capture, click Every_Event to display the capture choices.
Every_Event is the default, however, you can choose every packet, a specific
packet or event or create a boolean expression from the available choices.
Create Boolean Expression
You can create a boolean expression by clicking the left mouse button
immediately after entering the first parameter, to open the boolean list box.
1. Choose a boolean operator and then select the next parameter in the
expression resulting e.g. Name2+Name3.
The operator convention used is + for “or” and * for “and”.
2. To transition to another state, click the blue Name1 to display the
transition choices.
Choose a packet or bus event or create a logical expression. When the
bus detects this choice, the sequencer transitions to another state.
63
Page 74

Protocol Analysis
3. Choose the next state by clicking the blue State1 to display the available
states, then choose the next state.
4. Conquest starts capturing all bus activity at start by default. To delay the
start of capture until some occurrence, click the blue While button to
toggle it to Stop.
5. Define the operation of each additional state similarly.
6. If you are testing for receipt of an expected packet, such as Data or
Handshake, select Timeout. This is equivalent to a
Truncated Transaction protocol error, PE 14.
7. By clicking the ellipses after If “Packet” Occurs”...” and choosing either
Tag_Event or Discard, you can identify a block of data to discard.
Setting Tag_Event tags the start of a data discard. Setting Discard
designates the point up to which to discard the data. Discarded data is
between the last Tag_Event set and the Discard set.
64
Page 75

Protocol Analysis
Add Else If
You can include Else If statements in your program, to allow transition to
additional states.
Click the Add Else If button to add an else if line to the program.
To remove the added Else If, double-click it and choose Delete from the open
list box.
To Delete a Parameter
Highlight it and push the Delete key on the keyboard.
Optimized Workspace
To avoid scrolling the display in long sequencer programs, you can minimize
completed states by clicking the symbol next to the state to minimize. To
expand the minimized state, click the state name. Alternatively, click the state
name.
You can maximize the workspace to full screen by clicking the
Full View button.
To delete a State
To delete a state, place the cursor in the text for that state and click the D
button.
Note: You cannot delete a state if it is used in another state.
Manual Trigger
To use the Manual Trigger button on the front panel, remove all “Set Trigger”
commands from the sequencer program.
elete
65
Page 76

Protocol Errors
You can set the sequencer to trigger on protocol errors at any state by clicking
Packet and then choosing Protocol_Error. To exclude some protocol errors,
set the protocol mask as described in the following section.
For a description of the detected protocol errors, see page 104.
Setting a Protocol Error Mask
To mask protocol errors, click the Protocol Errors button on the
toolbar to open the Protocol Errors Dialog box. Uncheck the protocol errors to
exclude and click OK.
Protocol Analysis
66
Figure 38 Protocol Error Mask
Page 77

Protocol Analysis
Add/Insert Toggle (Shown in Add state)
Add/Insert Packet
Add/Insert Event
Add/Insert Transaction
Add/Insert Split Transaction
Delete Program Line
Add/Insert Transfer
Host Exerciser (Optional)
Note: To perform data capture and triggering with exerciser generated data, you
must use the Exerciser Port as shown in Figure 3.
Programming the Exerciser In Advanced Mode
To program the exerciser, click the Exerciser Program tab to open the
exerciser programming dialog box, as shown in Figure 39
Set the Host Speed First!
Click the down arrow for the speed selection drop-down box and choose an
operating speed.
Maximum Program Lines
You can define up to 999 exerciser program lines. Each line is an event or
packet transmitted on the bus.
Add Program Lines
To add program lines, enter the number of lines to add, select the type of
program lines to add by clicking the appropriate category button from the
choices shown below, and then select the line type.
Figure 39 Exerciser Programming Dialog Box
67
Page 78

Insert Program Lines
You can insert additional program lines by positioning the cursor on an
existing line. Click Add/Insert to toggle to the insert state, enter the number of
lines to insert, and click the appropriate line-type button and select the line
type to insert. The specified number of lines inserts above the line where you
positioned the cursor.
Delete Program Lines
To delete a program line, position the cursor in the line to remove and click the
elete button. You can also select and highlight multiple lines for deletion.
D
Programming with Transfers
Transfers are a powerful way to create an exerciser program that automates
time consuming tasks such as generating several transactions that make up a
transfer.
Start with Bus Reset
Protocol Analysis
Insert a Reset followed by a SOF packet in the start of the program to assure
that the timing and frame number are automatically set, allowing you to insert
your own transactions between the SOF packets.
Note: Small Reset values are not supported and will prevent the script from
executing. Values should be greater than 5 µsec for Low/Full speed scenarios
and greater than 1 msec for Hi Speed scenarios.
To add a Bus Reset Event, click the Add/Insert Event button and choose
Reset from the drop-down list.
68
Figure 40 Adding a Bus Reset
Page 79

Protocol Analysis
Add a Control Transfer(s)
To add a control transfer line, click the Add/Insert Transfer button and choose
Control from the drop-down list.
Figure 41 Adding a Control Transfer in High Speed Protocol
Control Transfers
Control Transfers transfer specific requests and commands to a Standard,
Class or Vendor Device, Interface or Endpoint. Other user-defined setups are
available. The most commonly used is the selection of a request or command
for a Standard Device. These selections are made on the inserted Transfer
line. See Figure 44.
69
Page 80

Transfer Type
Protocol Analysis
The default transfer type is Standard. However, you can choose Class,
Vendor, or user-defined by clicking the down arrow under Type and choosing
from the drop-down list.
To choose a Class, click the down arrow under Type and select Class to open
the select class dialog.
Figure 42 Choosing Class
Click the down arrow for Select class name, choose a pre-defined class,
click OK, then click in the blank program entry area to register the choice.
Note that, once you register, all parameters for the transfer line are updated
automatically for the request or command selected.
Specify a New Class
You can specify a new class by clicking Classes in the Select Class Dialog
and proceed as described on page 73.
To choose a request or command, click the down arrow under
bRequest(Hex), choose a request or command, and click the blank program
entry area to register. Note: After you register, all parameters for the transfer
line are updated automatically for the request or command selected.
Enter and set up additional Control Transfers, for example, Set Address to set
up exercising session.
Figure 43 Select Class Dialog
Figure 44 Choosing a Request or Command
70
Page 81

Protocol Analysis
Non Control Transfers
Non Control transfers provide for writing data to and reading data from a
Device, Interface, or Endpoint. Non Control transfers are provided for Bulk,
Interrupt, or Isochronous data transferring.
Add a Data Transfer(s)
Click the Add/Insert Transfer button and choose a data transfer from the
drop-down list, for example, Bulk Out.
Set up Data Transfer
For each data transfer inserted, you must specify the appropriate Device and
Endpoint addresses. Additionally, for Out Transfers, you can specify the data
to transfer, as a pre-defined data block, manually entered data at the transfer
level, or directly entered at the transaction level.
Specify Endpoint number
To specify an endpoint number for the current data transfer, highlight the
number (default 1) under EndP(Hex) and enter an endpoint number.
Note: The example shows data entry in Hex. However, you can right-click the
EndP(Hex), choose Format, and change the entry format to Binary or
Decimal.
Figure 45 Adding a Data Transfer in High Speed Protocol
Figure 46 Transfer Setup Fields
71
Page 82

Define Endpoint Settings
1. Click the Define/Modify endpoint settings button to open the
endpoint setting dialog.
Protocol Analysis
Figure 47 Endpoint Setting Dialog
2. Highlight the Device Address, highlight each endpoint, enter a packet
size value in the Max Packet Size text box (for a value other than the
default 8), and click the Add button until all endpoints appear in the
Endpoint Properties box.
3. Click OK.
72
Page 83

Protocol Analysis
Specifying a New Class
1. Click the Classes button on the Select Class dialog to open the Class &
Class Requests Definition Dialog.
Figure 48 Class & Class Requests Definition Dialog
2. Click the Add Class button, enter the new class name in the Enter Class
Name dialog, and click OK.
Figure 49 Enter Class Name Dialog
Figure 50 Defining Requests for a New Class
73
Page 84

3. Highlight the new class name and click the Add button to open the
Request Specification dialog.
4. Enter a request name, request type code and a data default value, and
click OK.
5. Repeat for all requests for the new class.
6. To modify a previously entered request, click the Modify button, enter
the new parameters in the Request Specification dialog, and click OK.
Specifying Data for Transfer
You can define data for transfer at the Transfer layer or at the Transaction
layer.
Specify data in Transfer layer
Click Transfer Data(Hex) to enable the Block transfer field. Either click the
down arrow next to this field and choose a pre-defined data block from the
drop-down list, or highlight the field and type specific data that to use in this
transfer.
Protocol Analysis
Note: The entry format is selectable as described for EndP(Hex)
Figure 51 Choosing Data to Transfer
Note Important: A significant advantage of this method of Data Transfer setup is
that the Exerciser program automatically generates the number of
transactions, based on maximum packet size, required to transfer the
data block. This is especially useful for large data blocks requiring perhaps
hundreds of transactions.
When the Endpoint number and the data to transfer has been specified, click
the blank program entry area to register the choice. Once the choice is
registered, the Bytes Transferred(Dec) field displays the number of data out
Transactions created.
You can add additional transfers.
74
Page 85

Protocol Analysis
Choose # of transactions
Data to transfer
Expand/Close Splits
Expand/Close Transactions
Expand/Close Transfers
Specify data in Transaction layers
Transfers specified in Transaction layers are a flexible way to set up a
Transfer with different data patterns in each transaction for that transfer.
1. Insert a Transfer type, click Transactions No, and enter a number of
transactions. (The following example shows three entered).
2. Expand the transfer to display the created transactions.
3. Expand each transaction and enter data to transfer by that transaction.
Note: Data entered this way is limited to a maximum of 1024 bytes.
4. Specify the end point in the same way as described for byte transfers.
Create a data block
For commands that involve data transfers, click the Data Block button and
define a data block. See page 86 for how to create data blocks.
Expand/Close
You can quickly expand/close Splits or Transfers by clicking the corresponding
button on the toolbar.
Figure 52 Transfer With 3 Transactions
75
Page 86

Zoom In/Zoom Out
Zoom In
Zoom Out
Clicking a Zoom button on the toolbar optimizes the size of the displayed code
lines.
Forcing Errors
You can introduce errors for any field of a packet by highlighting the field to
change and making the change directly in the field. Bit Stuff error (unchecked
has Bit Stuff) and force no EOP (unchecked has EOP) are available by
right-clicking the packet.
Program Loops
Program loops allow you to choose a series of program steps to repeat when
the program executes. A loop is defined by a start instruction and an end
instruction.
Protocol Analysis
76
Page 87

Protocol Analysis
Set up Loops
To set up a loop in the exerciser program, right-click next to the line to start the
loop and choose S
loop and choose E
Figure 53 illustrates a programmed loop.
tart Loop. Similarly right-click next to the line to end the
nd Loop.
77
Figure 53 Loop Start and End Set
Page 88

Deleting Loops
Undo
Redo
Loop count
Protocol Analysis
To delete a loop, right-click the Start Loop or End Loop symbol and click the
appropriate S
Loop count is the number of times to execute a loop. You can set the loop to
execute a fixed number of times or to run continually, on the Settings tab, as
described on page 92.
tart Loop or End Loop in the menu to remove the check marks.
Undo/Redo
You can exercise up to 200 levels of Undo/Redo steps in an exerciser program
by clicking the corresponding button on the toolbar.
78
Page 89

Protocol Analysis
Reduced Bit Width
Full/Low Speed Mode Only
The reduced bit width feature is available for the Full/Low speed mode only.
Adjustable bit width of 40, 60, 80, and 100% is allowed for all packet fields,
except data, for Device response testing. You can reduce bit width for all bits
in a packet or individual bits in a packet.
To set the Bit Width
Right-click in a packet field and choose Bit W
dialog.
idth to open the Set Bit Width
Figure 54 Set Bit Width Dialog
Select a field for bit width reduction, choose a percentage bit width reduction
for either all of the bits in the field or each bit individually, and click OK.
79
Page 90

Exerciser Programming Shortcuts
You can quickly create an exerciser program from an existing *.smp file.
There are two ways to quickly create an exercise program. You can import a
complete *.smp file or open an *.smp file and copy the lines.
Creating an Exerciser Program by Importing
Right-click in an open Exerciser Program window and choose
Import from SMP file to open the File Import dialog.
Protocol Analysis
Figure 55 Import Exerciser Program
Figure 56 File Import Dialog
Choose an *.smp file to use for an exerciser program and click O
now have an exerciser program ready to run. It is recommended that you
perform a refresh before running the program.
pen. You
80
Page 91

Protocol Analysis
Refresh Timing button
Refresh the Program
Click the Refresh Timing button on the Exerciser Program toolbar. For Full/
Low speed projects you must choose the operating speed from the refresh
button’s drop-down list.
Auto Refresh
Choosing Auto Refresh adjusts the starting time of packets, transactions, and
splits automatically after a paste operation.
Manual Refresh
Choosing Manual Refresh requires you to adjust start times yourself.
Auto Generate SOFs
Choosing Auto Generate SOFs causes the Host Exerciser to automatically
insert SOF packets.
81
Page 92

Advanced Refresh
Advanced Refresh specifies the refresh range and changes device addresses
and endpoint numbers for all selected transactions.
Right-click in the exerciser program area and choose Advanced Refresh to
open the advanced refresh dialog.
Protocol Analysis
Figure 57 Advanced Refresh Dialog
82
Page 93

Protocol Analysis
Creating an Exerciser Program by Copying and Pasting
To create an exerciser program by copying and pasting:
1. Open an *.smp file, hold down the left mouse button, draw a rectangle
around a group of data lines with the mouse cursor, and then release the
mouse button to select them.
Figure 58 Lines Selected
Note: The appearance of red check marks next to the lines indicates that they have
been selected.
2. Click the Copy button, or right-click the data area, and choose
opy.
C
3. Open an Advanced Project and click the Exerciser Program tab.
83
Page 94

Protocol Analysis
4. Click the Paste button, or right-click the exerciser program
area, and select Paste.
Refresh
Figure 59 New Exerciser Program
When copying and pasting program lines from different projects, it is
recommended that you refresh the program window prior to running the
program. This is required to ensure correct start time computation, which is
dependent on consistent project speed definition.
84
Page 95

Protocol Analysis
To Refresh the Program
Click the Refresh button on the Exerciser Program toolbar.
For Full/Low speed projects, choose the operating speed from the Refresh
button’s drop-down list.
Auto Refresh
Choosing Auto Refresh adjusts the starting time of packets, transactions, and
splits automatically after a paste operation.
Manual Refresh
Choosing Manual Refresh requires you to adjust start times yourself.
Auto Generate SOFs
Choosing Auto Generate SOFs causes the Host Exerciser to automatically
insert SOF packets.
You can now use this new exerciser program immediately in the current
project or save it for use elsewhere.
85
Page 96

Creating a Data Block
You can create the following four types of data blocks for use wherever data
fields are used:
• Custom data pattern specifically for your application
• Random data pattern
• Counter
• Walking “1” or “0” pattern.
1. To create a data block, click the Default Data Block button on
the Main toolbar to open the Data Block dialog box, as shown in
Figure 60.
Protocol Analysis
Figure 60 Default Data Block Dialog Box
2. To add another data block, click the N
box.
Figure 61 New Data Block Dialog Box
3. Choose the number of data columns (up to 16 Data Cells/Row) and the
Cell length (up to 16 Bytes/Cell). This is a display function only.
4. Click either the Bin or Hex button to choose a number format.
ew button in the Data Block dialog
86
Page 97

Protocol Analysis
Naming a Data Block
Each new data block is automatically assigned a sequential data block
number as it is created. To assign a unique descriptive name to a data block,
right-click the data block name to open the data block edit menu.
Choose Renam
Enter a descriptive name in the New Name edit box and click OK.
e.
Figure 62 Sample Active Data Block Hub Port Power
You can enter data in the defined cell structure by choosing one of the four
available methods. Define your own pattern, set a counter, choose a Random
Pattern or choose a Walking Bit Pattern
87
Page 98

Define Your Own Pattern
To define a pattern:
1. Click the Generate button and choose Pattern to open the
Define Pattern dialog box, as shown in Figure 63
2. Enter a data pattern in the Data Pattern edit box.
3. Choose the number of times to repeat that pattern and click OK.
Protocol Analysis
Address
The cell address starts at 0 for the first data entry and automatically
increments to the next available address as data is written. You can set it back
to a previously defined address to modify its content or insert additional data at
that point.
Insert/Overwrite Data
To define if the data in a previously defined cell is overwritten or new data is
inserted after that cell, click the Insert/Overwrite button to toggle to an
operation.
Figure 63 Define Your Own Data Pattern
88
Page 99

Protocol Analysis
Counter
To use a counter as data, click the G
Starting Number for the counter, enter the data address to which to count,
and click OK.
Random Data Pattern
To use a random data pattern, click the G
times to repeat the pattern, and click OK.
enerate button, choose Counter, enter a
Figure 64 Set Counter as Data
enerate button, enter the number of
89
Figure 65 Choose a Random Pattern
Page 100

Walking Bit Pattern
Protocol Analysis
To use a walking bit pattern, click the G
of “0” or “1”, the walk direction, the start position, and the number of times to
repeat the pattern.
Sample Data Block
Figure 67 illustrates a data block with a defined pattern AA starting at
address 0 and repeated four times, followed by a random pattern starting at
address 4 and repeated four times, then a left-to-right walking 0 pattern
starting at address 8 and repeated six times.
enerate button. Choose a walking bit
Figure 66 Define a Walking Bit Pattern
Close & Save
Figure 67 Sample Data Block Definition
When you have completed a data block definition, click the Close&Save
button to save the newly created data block.
The saved data block automatically is assigned a sequentially numbered
(DataBlock##) title. To rename for easier identification later, see “Naming a
Data Block” on page 87.
90
 Loading...