

Page 1
Complimentary Reference Material
This PDF has been made available as a complimentary service for you to assist in
evaluating this model for your testing requirements.
TMG offers a wide range of test equipment solutions, from renting short to long
term, buying refurbished and purchasing new. Financing options, such as
Financial Rental, and Leasing are also available on application.
TMG will assist if you are unsure whether this model will suit your requirements.
Call TMG if you need to organise repair and/or calibrate your unit.
If you click on the “Click-to-Call” logo below, you can all us for FREE!
TMG Corporate Website TMG Products Website
Disclaimer:
All trademarks appearing within this PDF are trademarks of their respective owners.
Form 080/01
Page 2

User Manual
TLS 216
Logic Scope
070-8834-01
This document supports firmware version 1.0.2e
and above.
Page 3

&(- .3897:2*39 2&3:+&(9:7*) '> "*09743.= -&8 & 8*7.&1 3:2'*7 43 & 5&3*1 .38*79 47 9&, 47 89&25*) 43 9-*
(-&88.8 "-* +.789 1*99*7 .3 9-* 8*7.&1 3:2'*7 )*8.,3&9*8 9-* (4:397> 4+ 2&3:+&(9:7* "-* 1&89 +.;* ).,.98 4+ 9-*
8*7.&1 3:2'*7 &7* &88.,3*) 8*6:*39.&11> &3) &7* :3.6:* 94 *&(- .3897:2*39 "-48* 2&3:+&(9:7*) .3 9-*
#3.9*) !9&9*8 -&;* 8.= :3.6:* ).,.98 "-* (4:397> 4+ 2&3:+&(9:7* .8 .)*39.+.*) &8 +4114<8
"*09743.= 3( *&;*7943 7*,43 #!
"*09743.= #3.9*) .3,)42 9) 43)43
!43>"*09743.= &5&3
"*09743.= 411&3) $ **7*3;**3 "-* *9-*71&3)8
3897:2*398 2&3:+&(9:7*) +47 "*09743.= '> *=9*73&1 ;*3)478 4:98.)* 9-* #3.9*) !9&9*8 &7* &88.,3*) & 9<4 ).,.9
&15-& (4)* 94 .)*39.+> 9-* (4:397> 4+ 2&3:+&(9:7* *, +47 &5&3 +47 43, 43, +47 87&*1 *9(
"*09743.= 3( 4= *&;*7943
7.39*) .3 #!
45>7.,-9 E "*09743.= 3( 11 7.,-98 7*8*7;*) "*09743.= 574):(98 &7* (4;*7*) '> #! &3) +47*.,3
5&9*398 .88:*) &3) 5*3).3, "-* +4114<.3, &7* 7*,.89*7*) 97&)*2&708 "" % " " &3)
!? :8472 # # &3) # &7* 97&)*2&708 4+ "*09743.=
5843 .8 & 7*,.89*7*) 97&)*2&70 4+ 5843 2*7.(& 3(
*80/*9 &8*7/*9 &3) "-.30/*9 &7* 7*,.89*7*) 97&)*2&708 4+ *<1*99?&(0&7) 47547&9.43
? &3) ? &7* 7*,.89*7*) 97&)*2&708 4+ &9.43&1 3897:2*398 47547&9.43
.8 & 7*,.89*7*) 97&)*2&70 4+ *<1*99?&(0&7) 47547&9.43
.8 & 7*,.89*7*) 97&)*2&70 4+ 39*73&9.43&1 :8.3*88 &(-.3*8
39*71*&+ .8 & 97&)*2&70 4+ 39*71*&+ 3(
.(7484+9 .8 & 7*,.89*7*) 97&)*2&70 4+ .(7484+9 47547&9.43
489!(7.59 .8 & 7*,.89*7*) 97&)*2&70 4+ )4'* !>89*28 3(47547&9*)
Page 4

TLS 216 WARRANTY
" ! ! ! #
# !# " !
! ! "
!# # " " !#
# " ! "
# ! # ! "
# " #
#
!# # # #
" !# #
"
!
! #
THIS WARRANTY IS GIVEN BY TEKTRONIX WITH RESPECT TO THIS PRODUCT IN LIEU OF ANY OTHER
WARRANTIES, EXPRESSED OR IMPLIED. TEKTRONIX AND ITS VENDORS DISCLAIM ANY IMPLIED WARRANTIES OF
MERCHANTABILITY OR FITNESS FOR A PARTICULAR PURPOSE. TEKTRONIX' RESPONSIBILITY TO REPAIR OR
REPLACE DEFECTIVE PRODUCTS IS THE SOLE AND EXCLUSIVE REMEDY PROVIDED TO THE CUSTOMER FOR
BREACH OF THIS WARRANTY. TEKTRONIX AND ITS VENDORS WILL NOT BE LIABLE FOR ANY INDIRECT, SPECIAL,
INCIDENTAL, OR CONSEQUENTIAL DAMAGES IRRESPECTIVE OF WHETHER TEKTRONIX OR THE VENDOR HAS
ADVANCE NOTICE OF THE POSSIBILITY OF SUCH DAMAGES.
P6240 WARRANTY
" ! ! ! #
# !# " !
! ! "
!# # " " !#
# " ! "
# ! # ! "
# " #
#
!# # # #
" !# #
"
!
! #
THIS WARRANTY IS GIVEN BY TEKTRONIX WITH RESPECT TO THIS PRODUCT IN LIEU OF ANY OTHER
WARRANTIES, EXPRESSED OR IMPLIED. TEKTRONIX AND ITS VENDORS DISCLAIM ANY IMPLIED WARRANTIES OF
MERCHANTABILITY OR FITNESS FOR A PARTICULAR PURPOSE. TEKTRONIX' RESPONSIBILITY TO REPAIR OR
REPLACE DEFECTIVE PRODUCTS IS THE SOLE AND EXCLUSIVE REMEDY PROVIDED TO THE CUSTOMER FOR
BREACH OF THIS WARRANTY. TEKTRONIX AND ITS VENDORS WILL NOT BE LIABLE FOR ANY INDIRECT, SPECIAL,
INCIDENTAL, OR CONSEQUENTIAL DAMAGES IRRESPECTIVE OF WHETHER TEKTRONIX OR THE VENDOR HAS
ADVANCE NOTICE OF THE POSSIBILITY OF SUCH DAMAGES.
Page 5

Page 6

EC Declaration of Conformity
We
Tektronix Holland N.V.
Marktweg 73A
8444 AB Heerenveen
The Netherlands
declare under sole responsibility that the
TLS 216 Logic Scope
meets the intent of Directive 89/336/EEC for Electromagnetic Compatibility.
Compliance was demonstrated to the following specifications as listed in the Official
Journal of the European Communities:
EN 50081-1 Emissions:
EN 55022 Class B Radiated and Conducted Emissions
EN 60555-2 AC Power Line Harmonic Emissions
EN 50082-1 Immunity:
IEC 801-2 Electrostatic Discharge Immunity
IEC 801-3 RF Electromagnetic Field Immunity
IEC 801-4 Electrical Fast Transient/Burst Immunity
IEC 801-5 Power Line Surge Immunity
Page 7

Page 8

Table of Contents
Getting Started
Operating Basics
List of Figures iii. . . . . . . . . . . . . . . . . . . . . . . . . . . . . . . . . . . . . . . . . . . . .
List of Tables vii. . . . . . . . . . . . . . . . . . . . . . . . . . . . . . . . . . . . . . . . . . . . . .
Safety Summary ix. . . . . . . . . . . . . . . . . . . . . . . . . . . . . . . . . . . . . . . . . . .
Preface xi. . . . . . . . . . . . . . . . . . . . . . . . . . . . . . . . . . . . . . . . . . . . . . . . . . .
Product Description 1–1. . . . . . . . . . . . . . . . . . . . . . . . . . . . . . . . . . . . . . . . .
Start Up 1–3. . . . . . . . . . . . . . . . . . . . . . . . . . . . . . . . . . . . . . . . . . . . . . . . . .
Setting Up for Examples 1–7. . . . . . . . . . . . . . . . . . . . . . . . . . . . . . . . . . . . .
Example 1: Displaying Waveforms 1–11. . . . . . . . . . . . . . . . . . . . . . . . . . . .
Example 2: Grouping Waveforms 1–17. . . . . . . . . . . . . . . . . . . . . . . . . . . . .
Example 3: Taking Measurements Automatically 1–23. . . . . . . . . . . . . . . .
Example 4: Saving Setups 1–29. . . . . . . . . . . . . . . . . . . . . . . . . . . . . . . . . . . .
Overview 2–1. . . . . . . . . . . . . . . . . . . . . . . . . . . . . . . . . . . . . . . . . . . . . . . . . .
At a Glance 2–3. . . . . . . . . . . . . . . . . . . . . . . . . . . . . . . . . . . . . . . . . . . . . . . .
Triggering 2–13. . . . . . . . . . . . . . . . . . . . . . . . . . . . . . . . . . . . . . . . . . . . . . . . .
Acquisition 2–19. . . . . . . . . . . . . . . . . . . . . . . . . . . . . . . . . . . . . . . . . . . . . . . .
Scaling and Positioning Waveforms 2–23. . . . . . . . . . . . . . . . . . . . . . . . . . .
Measurements 2–27. . . . . . . . . . . . . . . . . . . . . . . . . . . . . . . . . . . . . . . . . . . . .
Reference
TLS 216 User Manual
Overview 3–1. . . . . . . . . . . . . . . . . . . . . . . . . . . . . . . . . . . . . . . . . . . . . . . . . .
Adjusting the Horizontal Setup 3–3. . . . . . . . . . . . . . . . . . . . . . . . . . . . . . .
Adjusting the Vertical Setup 3–7. . . . . . . . . . . . . . . . . . . . . . . . . . . . . . . . . .
Autosetting the Logic Scope 3–13. . . . . . . . . . . . . . . . . . . . . . . . . . . . . . . . . .
Choosing an Acquisition Mode 3–17. . . . . . . . . . . . . . . . . . . . . . . . . . . . . . .
Choosing a Group Display Mode 3–23. . . . . . . . . . . . . . . . . . . . . . . . . . . . . .
Communicating with Remote Instruments 3–31. . . . . . . . . . . . . . . . . . . . . .
Customizing the Display 3–35. . . . . . . . . . . . . . . . . . . . . . . . . . . . . . . . . . . . .
Customizing the Display Colors 3–41. . . . . . . . . . . . . . . . . . . . . . . . . . . . . . .
Doing a Probe Cal 3–49. . . . . . . . . . . . . . . . . . . . . . . . . . . . . . . . . . . . . . . . . .
Doing a Signal Path Compensation 3–53. . . . . . . . . . . . . . . . . . . . . . . . . . . .
Grouping Waveforms 3–55. . . . . . . . . . . . . . . . . . . . . . . . . . . . . . . . . . . . . . .
Managing the File System 3–61. . . . . . . . . . . . . . . . . . . . . . . . . . . . . . . . . . . .
i
Page 9

Table of Contents
Measuring Waveforms Automatically 3–67. . . . . . . . . . . . . . . . . . . . . . . . . .
Measuring Waveforms with Cursors 3–81. . . . . . . . . . . . . . . . . . . . . . . . . . .
Printing a Hardcopy 3–87. . . . . . . . . . . . . . . . . . . . . . . . . . . . . . . . . . . . . . . .
Probing of Circuits 3–97. . . . . . . . . . . . . . . . . . . . . . . . . . . . . . . . . . . . . . . . .
Saving and Recalling Setups 3–105. . . . . . . . . . . . . . . . . . . . . . . . . . . . . . . . . .
Saving and Recalling Waveforms 3–109. . . . . . . . . . . . . . . . . . . . . . . . . . . . .
Selecting Groups and Channels 3–117. . . . . . . . . . . . . . . . . . . . . . . . . . . . . . .
Triggering After Delay 3–121. . . . . . . . . . . . . . . . . . . . . . . . . . . . . . . . . . . . . .
Triggering on Edges 3–127. . . . . . . . . . . . . . . . . . . . . . . . . . . . . . . . . . . . . . . .
Triggering on Patterns 3–131. . . . . . . . . . . . . . . . . . . . . . . . . . . . . . . . . . . . . .
Triggering on Pulses 3–141. . . . . . . . . . . . . . . . . . . . . . . . . . . . . . . . . . . . . . . .
Triggering on a Sequence 3–147. . . . . . . . . . . . . . . . . . . . . . . . . . . . . . . . . . . .
Triggering on Signals 3–159. . . . . . . . . . . . . . . . . . . . . . . . . . . . . . . . . . . . . . .
Triggering on States 3–165. . . . . . . . . . . . . . . . . . . . . . . . . . . . . . . . . . . . . . . .
Viewing Help 3–171. . . . . . . . . . . . . . . . . . . . . . . . . . . . . . . . . . . . . . . . . . . . . .
Viewing Status 3–173. . . . . . . . . . . . . . . . . . . . . . . . . . . . . . . . . . . . . . . . . . . . .
Zooming on Waveforms 3–175. . . . . . . . . . . . . . . . . . . . . . . . . . . . . . . . . . . . .
Appendices
Glossary
Index
Appendix A: Options and Accessories A–1. . . . . . . . . . . . . . . . . . . . . . . . . .
Appendix B: Algorithms B–1. . . . . . . . . . . . . . . . . . . . . . . . . . . . . . . . . . . . .
Appendix C: Packaging for Shipment C–1. . . . . . . . . . . . . . . . . . . . . . . . . .
Appendix D: Factory Initialization Settings D–1. . . . . . . . . . . . . . . . . . . . .
ii
TLS 216 User Manual
Page 10

List of Figures
Table of Contents
Figure 1-1: Rear Panel Controls Used in Start Up 1–4. . . . . . . . . . . . . . . .
Figure 1-2: ON/STBY Button 1–5. . . . . . . . . . . . . . . . . . . . . . . . . . . . . . . . .
Figure 1-3: Probe Connections for the Examples 1–7. . . . . . . . . . . . . . . . .
Figure 1-4: SETUP Button Location 1–8. . . . . . . . . . . . . . . . . . . . . . . . . . .
Figure 1-5: The Setup Menu 1–8. . . . . . . . . . . . . . . . . . . . . . . . . . . . . . . . . .
Figure 1-6: Trigger Controls 1–9. . . . . . . . . . . . . . . . . . . . . . . . . . . . . . . . . .
Figure 1-7: The Display After Factory Initialization 1–10. . . . . . . . . . . . . .
Figure 1-8: The Group Buttons and LEDs 1–11. . . . . . . . . . . . . . . . . . . . . .
Figure 1-9: Group Readouts 1–13. . . . . . . . . . . . . . . . . . . . . . . . . . . . . . . . . .
Figure 1-10: The VERTICAL and HORIZONTAL Controls 1–14. . . . . . .
Figure 1-11: TRIGGER Controls 1–15. . . . . . . . . . . . . . . . . . . . . . . . . . . . . .
Figure 1-12: AUTOSET Button Location 1–15. . . . . . . . . . . . . . . . . . . . . . .
Figure 1-13: The Display After Pressing Autoset 1–16. . . . . . . . . . . . . . . . .
Figure 1-14: Vertical Waveform Groups 1–18. . . . . . . . . . . . . . . . . . . . . . . .
Figure 1-15: Group 6 Displayed as a Timing Diagram 1–20. . . . . . . . . . . .
Figure 1-16: Binary Value of a Group 1–21. . . . . . . . . . . . . . . . . . . . . . . . . .
Figure 1-17: Measure Main Menu and Select Measurement
Side Menu 1–24. . . . . . . . . . . . . . . . . . . . . . . . . . . . . . . . . . . . . . . . . . . . .
Figure 1-18: Four Simultaneous Measurement Readouts 1–25. . . . . . . . . .
Figure 1-19: General Purpose Knob Indicators 1–26. . . . . . . . . . . . . . . . . .
Figure 1-20: Snapshot of Channel 2 1–28. . . . . . . . . . . . . . . . . . . . . . . . . . .
Figure 1-21: Save/Recall Setup Menu 1–30. . . . . . . . . . . . . . . . . . . . . . . . . .
Figure 2-1: Triggered Versus Untriggered Displays 2–13. . . . . . . . . . . . . . .
Figure 2-2: Trigger Holdoff Time Ensures Valid Triggering 2–16. . . . . . . .
Figure 2-3: Slope and Level Controls Help Define the Trigger 2–17. . . . . .
Figure 2-4: Acquisition: Input Analog Signal, Sample, and
Digitize 2–19. . . . . . . . . . . . . . . . . . . . . . . . . . . . . . . . . . . . . . . . . . . . . . . .
Figure 2-5: Real-Time Sampling 2–20. . . . . . . . . . . . . . . . . . . . . . . . . . . . . .
Figure 2-6: Scaling and Positioning 2–23. . . . . . . . . . . . . . . . . . . . . . . . . . . .
Figure 2-7: Aliasing 2–25. . . . . . . . . . . . . . . . . . . . . . . . . . . . . . . . . . . . . . . . .
Figure 2-8: Graticule, Cursor, and Automated Measurements 2–27. . . . .
Figure 2-9: Cursor Modes 2–28. . . . . . . . . . . . . . . . . . . . . . . . . . . . . . . . . . . .
Figure 3-1: Horizontal Controls 3–3. . . . . . . . . . . . . . . . . . . . . . . . . . . . . . .
Figure 3-2: Record View and Time Base Readout 3–4. . . . . . . . . . . . . . . .
Figure 3-3: Vertical Controls 3–8. . . . . . . . . . . . . . . . . . . . . . . . . . . . . . . . .
TLS 216 User Manual
iii
Page 11

Table of Contents
Figure 3-4: Vertical Readout and Vertical Controls Menu 3–10. . . . . . . . .
Figure 3-5: How the Acquisition Modes Work 3–18. . . . . . . . . . . . . . . . . . .
Figure 3-6: Acquisition Menu and Readout 3–19. . . . . . . . . . . . . . . . . . . . .
Figure 3-7: Acquire Menu — Stop After 3–20. . . . . . . . . . . . . . . . . . . . . . . .
Figure 3-8: Display Modes 3–24. . . . . . . . . . . . . . . . . . . . . . . . . . . . . . . . . . .
Figure 3-9: Snapshot of Group Status 3–25. . . . . . . . . . . . . . . . . . . . . . . . . .
Figure 3-10: Group Display Mode Menu 3–26. . . . . . . . . . . . . . . . . . . . . . .
Figure 3-11: Group Display Mode Set to Analog Select 3–27. . . . . . . . . . .
Figure 3-12: Typical GPIB Network Configuration 3–32. . . . . . . . . . . . . . .
Figure 3-13: Stacking GPIB Connectors 3–32. . . . . . . . . . . . . . . . . . . . . . . .
Figure 3-14: Connecting the Logic Scope to a Controller 3–33. . . . . . . . . .
Figure 3-15: Utility Menu 3–34. . . . . . . . . . . . . . . . . . . . . . . . . . . . . . . . . . . .
Figure 3-16: Snapshot of Display Status 3–35. . . . . . . . . . . . . . . . . . . . . . . .
Figure 3-17: Display Menu — Style Settings 3–36. . . . . . . . . . . . . . . . . . . .
Figure 3-18: Trigger Point and Level Indicators 3–38. . . . . . . . . . . . . . . . .
Figure 3-19: Snapshot of Display Status 3–41. . . . . . . . . . . . . . . . . . . . . . . .
Figure 3-20: Display Menu — Color Settings 3–42. . . . . . . . . . . . . . . . . . . .
Figure 3-21: Display Menu — Change Colors 3–44. . . . . . . . . . . . . . . . . . .
Figure 3-22: Display Menu — Map Group Colors 3–45. . . . . . . . . . . . . . . .
Figure 3-23: Display Menu — Restore Colors 3–46. . . . . . . . . . . . . . . . . . .
Figure 3-24: Probe Cal Menu and Probe Cal Display 3–51. . . . . . . . . . . . .
Figure 3-25: Performing a Signal Path Compensation 3–54. . . . . . . . . . . .
Figure 3-26: Groups — Valid and Invalid 3–56. . . . . . . . . . . . . . . . . . . . . . .
Figure 3-27: Vertical Readout Displaying Two Group Readouts 3–57. . . .
Figure 3-28: The Group Definition Menu 3–58. . . . . . . . . . . . . . . . . . . . . . .
Figure 3-29: File Utilities Menu and Listing 3–62. . . . . . . . . . . . . . . . . . . . .
Figure 3-30: File System — Labelling Menu 3–64. . . . . . . . . . . . . . . . . . . .
Figure 3-31: Measurement Readouts 3–68. . . . . . . . . . . . . . . . . . . . . . . . . . .
Figure 3-32: Measure Menu 3–71. . . . . . . . . . . . . . . . . . . . . . . . . . . . . . . . . .
Figure 3-33: Measure Menu — Gating 3–72. . . . . . . . . . . . . . . . . . . . . . . . .
Figure 3-34: Measure Menu — Reference Levels 3–74. . . . . . . . . . . . . . . .
Figure 3-35: Measure Delay Menu — Delay To 3–75. . . . . . . . . . . . . . . . . .
Figure 3-36: Measure Setup Menu 3–77. . . . . . . . . . . . . . . . . . . . . . . . . . . .
Figure 3-37: Snapshot Menu and Readout 3–79. . . . . . . . . . . . . . . . . . . . . .
Figure 3-38: Cursor Types 3–81. . . . . . . . . . . . . . . . . . . . . . . . . . . . . . . . . . .
Figure 3-39: Cursor Modes 3–82. . . . . . . . . . . . . . . . . . . . . . . . . . . . . . . . . . .
Figure 3-40: Vertical Bar Cursor Readout (With Binary Readout) 3–83. .
Figure 3-41: Cursor Menu and Readouts — Paired Cursors
Selected 3–84. . . . . . . . . . . . . . . . . . . . . . . . . . . . . . . . . . . . . . . . . . . . . . . .
iv
TLS 216 User Manual
Page 12

Table of Contents
Figure 3-42: Utility Menu — System I/O 3–88. . . . . . . . . . . . . . . . . . . . . . .
Figure 3-43: Hardcopy Formats 3–89. . . . . . . . . . . . . . . . . . . . . . . . . . . . . . .
Figure 3-44: Date and Time Display 3–90. . . . . . . . . . . . . . . . . . . . . . . . . . .
Figure 3-45: Connecting the Logic Scope Directly to the
Hardcopy Device 3–91. . . . . . . . . . . . . . . . . . . . . . . . . . . . . . . . . . . . . . . .
Figure 3-46: Connecting the Logic Scope and Hardcopy Device
Via a PC 3–93. . . . . . . . . . . . . . . . . . . . . . . . . . . . . . . . . . . . . . . . . . . . . . .
Figure 3-47: Basic Probe Connection 3–98. . . . . . . . . . . . . . . . . . . . . . . . . .
Figure 3-48: Installing Accessories — Standard and Optional 3–99. . . . . .
Figure 3-49: A Probe Adds Resistance, Capacitance, and
Inductance 3–103. . . . . . . . . . . . . . . . . . . . . . . . . . . . . . . . . . . . . . . . . . . . .
Figure 3-50: Signal Variation Introduced by Probe Ground Lead
(1 ns/division) 3–103. . . . . . . . . . . . . . . . . . . . . . . . . . . . . . . . . . . . . . . . . . .
Figure 3-51: Save/Recall Setup Menu 3–105. . . . . . . . . . . . . . . . . . . . . . . . . .
Figure 3-52: Save Group Menu 3–111. . . . . . . . . . . . . . . . . . . . . . . . . . . . . . .
Figure 3-53: Save Group to File Menu 3–112. . . . . . . . . . . . . . . . . . . . . . . . .
Figure 3-54: More Menu for Displaying Reference Groups 3–113. . . . . . . .
Figure 3-55: The Vertical Readout 3–118. . . . . . . . . . . . . . . . . . . . . . . . . . . . .
Figure 3-56: Delayed Runs After Main 3–121. . . . . . . . . . . . . . . . . . . . . . . . .
Figure 3-57: Delayed Triggerable 3–122. . . . . . . . . . . . . . . . . . . . . . . . . . . . .
Figure 3-58: How the Delayed Triggers Work 3–123. . . . . . . . . . . . . . . . . . .
Figure 3-59: Delayed Trigger Menu 3–125. . . . . . . . . . . . . . . . . . . . . . . . . . .
Figure 3-60: Snapshot of Trigger Status 3–128. . . . . . . . . . . . . . . . . . . . . . . .
Figure 3-61: Main Trigger Menu — Edge Type 3–129. . . . . . . . . . . . . . . . . .
Figure 3-62: Snapshot of Trigger Status 3–134. . . . . . . . . . . . . . . . . . . . . . . .
Figure 3-63: Pattern Trigger Menu 3–135. . . . . . . . . . . . . . . . . . . . . . . . . . . .
Figure 3-64: Triggering on a Pattern: Time Out Qualified 3–137. . . . . . . . .
Figure 3-65: Time-Qualified Pattern Triggering: > Time 3–138. . . . . . . . . .
Figure 3-66: Pulse Trigger Readouts 3–142. . . . . . . . . . . . . . . . . . . . . . . . . . .
Figure 3-67: Pulse Trigger Menu 3–143. . . . . . . . . . . . . . . . . . . . . . . . . . . . . .
Figure 3-68: Trigger Readout 3–150. . . . . . . . . . . . . . . . . . . . . . . . . . . . . . . . .
Figure 3-69: Sequence Trigger Menu 3–151. . . . . . . . . . . . . . . . . . . . . . . . . .
Figure 3-70: Triggering on a Sequence: > Time, Minimum Time
Qualification 3–155. . . . . . . . . . . . . . . . . . . . . . . . . . . . . . . . . . . . . . . . . . .
Figure 3-71: Time-Qualified Pattern Triggering: Time Out 3–156. . . . . . . .
Figure 3-72: TRIGGER Controls and Status Lights 3–159. . . . . . . . . . . . . .
Figure 3-73: Trigger Type, Record View, Trigger Position, and
Trigger Level Bar Readouts 3–161. . . . . . . . . . . . . . . . . . . . . . . . . . . . . . .
Figure 3-74: Snapshot of Trigger Status 3–166. . . . . . . . . . . . . . . . . . . . . . . .
Figure 3-75: State Trigger Menu 3–167. . . . . . . . . . . . . . . . . . . . . . . . . . . . . .
TLS 216 User Manual
v
Page 13

Table of Contents
Figure 3-76: Initial Help Screen 3–171. . . . . . . . . . . . . . . . . . . . . . . . . . . . . . .
Figure 3-77: Status Menu — System 3–173. . . . . . . . . . . . . . . . . . . . . . . . . . .
Figure 3-78: Zoom Mode with Horizontal Lock Set to All 3–177. . . . . . . . .
Figure B–1: MCross Calculations B–4. . . . . . . . . . . . . . . . . . . . . . . . . . . . .
Figure B–2: Fall Time B–7. . . . . . . . . . . . . . . . . . . . . . . . . . . . . . . . . . . . . . .
Figure B–3: Hold Time B–8. . . . . . . . . . . . . . . . . . . . . . . . . . . . . . . . . . . . . .
Figure B–4: Rise Time B–12. . . . . . . . . . . . . . . . . . . . . . . . . . . . . . . . . . . . . . .
Figure B–5: Setup Time B–14. . . . . . . . . . . . . . . . . . . . . . . . . . . . . . . . . . . . .
Figure B–6: Skew Time B–15. . . . . . . . . . . . . . . . . . . . . . . . . . . . . . . . . . . . . .
Figure B–7: Choosing Minima or Maxima to Use for Envelope
Measurements B–16. . . . . . . . . . . . . . . . . . . . . . . . . . . . . . . . . . . . . . . . . .
vi
TLS 216 User Manual
Page 14

List of Tables
Table of Contents
Table 1–1: Fuse and Fuse Cap Part Numbers 1–4. . . . . . . . . . . . . . . . . . .
Table 3–1: Autoset Defaults 3–15. . . . . . . . . . . . . . . . . . . . . . . . . . . . . . . . . .
Table 3–2: Logic Family Presets 3–29. . . . . . . . . . . . . . . . . . . . . . . . . . . . . . .
Table 3–3: Measurement Definitions 3–68. . . . . . . . . . . . . . . . . . . . . . . . . .
Table 3–4: Probe-Related Accessories 3–100. . . . . . . . . . . . . . . . . . . . . . . . .
Table 3–5: Group Selection Priority 3–120. . . . . . . . . . . . . . . . . . . . . . . . . . .
Table 3–6: Logic Qualifiers 3–131. . . . . . . . . . . . . . . . . . . . . . . . . . . . . . . . . .
Table 3–7: Time Qualifiers 3–132. . . . . . . . . . . . . . . . . . . . . . . . . . . . . . . . . .
Table 3–8: Pulse Trigger Definitions 3–142. . . . . . . . . . . . . . . . . . . . . . . . . . .
Table 3–9: Logic Functions 3–148. . . . . . . . . . . . . . . . . . . . . . . . . . . . . . . . . .
Table 3–10: Time Qualifiers 3–148. . . . . . . . . . . . . . . . . . . . . . . . . . . . . . . . .
Table 3–11: State Triggers 3–165. . . . . . . . . . . . . . . . . . . . . . . . . . . . . . . . . . .
Table 3–12: Zoom Defaults 3–178. . . . . . . . . . . . . . . . . . . . . . . . . . . . . . . . . .
Table A–1: International Power Cords A–1. . . . . . . . . . . . . . . . . . . . . . . .
Table A–2: Standard Accessories A–2. . . . . . . . . . . . . . . . . . . . . . . . . . . . .
Table A–3: Optional Accessories A–3. . . . . . . . . . . . . . . . . . . . . . . . . . . . . .
Table A–4: Accessory Software A–4. . . . . . . . . . . . . . . . . . . . . . . . . . . . . . .
Table D–1: Factory Initialization Defaults D–1. . . . . . . . . . . . . . . . . . . . . .
TLS 216 User Manual
vii
Page 15

Table of Contents
viii
TLS 216 User Manual
Page 16
Safety Summary
Symbols and Terms
Please take a moment to review these safety precautions. They are provided for
your protection and to prevent damage to the logic scope. This safety information applies to all operators and service personnel.
These two terms appear in manuals:
CAUTION. These statements identify conditions or practices that could result in
damage to the equipment or other property.
WARNING. These statements identify conditions or practices that could result in
personal injury or loss of life.
These two terms appear on equipment:
H CAUTION indicates a personal injury hazard not immediately accessible as
one reads the marking or a hazard to property including the equipment itself.
H DANGER indicates a personal injury hazard immediately accessible as one
reads the marking.
This symbol appears in manuals:
Static-Sensitive Devices
These symbols appear on equipment:
DANGER
High Voltage
Protective ground
(earth) terminal
ATTENTION
Refer to
manual
TLS 216 User Manual
ix
Page 17

Safety Summary
Specific Precautions
Observe all of these precautions to ensure your personal safety and to prevent
damage to either the logic scope or equipment connected to it.
Power Source
Grounding the Logic
Scope
Use the Proper Power
Cord
Use the Proper Fuse
Do Not Remove Covers or
Panels
The logic scope is intended to operate from a power source that will not apply
more than 250 V
conductor and ground. A protective ground connection, through the grounding
conductor in the power cord, is essential for safe system operation.
The logic scope is grounded through the power cord. To avoid electric shock,
plug the power cord into a properly wired receptacle where earth ground has
been verified by a qualified service person. Do this before making connections to
the input or output terminals of the logic scope.
Without the protective ground connection, all parts of the logic scope are
potential shock hazards. This includes knobs and controls that may appear to be
insulators.
Use only the power cord and connector specified for your product. Use only a
power cord that is in good condition.
To avoid fire hazard, use only the fuse specified in the parts list for your product,
matched by type, voltage rating, and current rating.
To avoid personal injury, do not operate the logic scope without the panels or
covers.
between the supply conductors or between either supply
RMS
Electric Overload
Do Not Operate in
Explosive Atmospheres
Provide Proper Ventilation
Do Not Operate With
Suspected Failures
x
Never apply a voltage to a connector on the logic scope that is outside the
voltage range specified for that connector.
The logic scope provides no explosion protection from static discharges or arcing
components. Do not operate the logic scope in an atmosphere of explosive gases.
To prevent overheating, keep the logic scope ventilation holes free from
obstruction.
If you suspect the logic scope is damaged, have it inspected by a qualified
service person.
TLS 216 User Manual
Page 18

Preface
Conventions
This is the User Manual for the TLS 216 Logic Scope.
Section 1 Getting Started familiarizes you with the operation of your logic
scope.
Section 2 Operating Basics covers basic principles of the operation of the logic
scope. The topics covered help you understand why your logic scope operates
the way it does.
Section 3 Reference teaches you how to perform specific tasks. See page 3–1 for
a complete list of tasks covered in that section.
The Appendices provide an options listing, an accessories listing, and other
useful information.
In the Getting Started and Reference sections, you will find various procedures
which contain steps of instructions for you to perform. To keep those instructions
clear and consistent, this manual uses the following conventions:
H Names of front-panel controls and menu labels appear in boldface print.
H Names also appear in the same case (initial capitals, all uppercase, etc.) in
the manual as is used on the logic scope front panel and menus. Front panel
names are all upper case letters, for example, GROUP MENU and
GROUP 1.
H Instruction steps are numbered. The number is omitted if there is only one
step.
H When steps require that you make a sequence of selections using front-panel
controls and menu buttons, an arrow ( ➞
front panel button and a menu, or between menus. Also, whether a name is a
main menu or side menu item is clearly indicated: Press HORIZONTAL
MENU
Trigger Position (main) ➞ Set to 20% (side).
Using the convention just described results in instructions that are graphically
intuitive and simplifies procedures. For example, the instruction just given
replaces these five steps:
1. Press the front-panel button HORIZONTAL MENU.
2. Press the main menu button Record Length.
➞ Record Length (main) ➞ 500 points in 10 divs (side) ➞
) marks each transition between a
TLS 216 User Manual
xi
Page 19

Preface
Related Manuals
3. Press the side menu button 500 points in 10 divs.
4. Press the main menu button Trigger Position
5. Press the side menu button Set to 20%
Sometimes you may have to make a selection from a popup menu: Press
TRIGGER MENU
repeatedly press the main menu button Type until Edge is highlighted in the
pop-up menu.
The following documents are related to the use or service of the logic scope.
H The TLS 216 Programmer Manual (Tektronix part number 070-8835-XX)
describes using a computer to control the logic scope through the GPIB
interface.
➞ Type (main) ➞ Edge (pop-up). In this example, you
H The TLS 216 Reference (Tektronix part number 070-8833-XX) gives you a
quick overview of how to operate your logic scope.
H The TLS 216 Performance Verification and Specifications Technical
Reference (Tektronix part number 070-8832-XX) tells how to verify the
performance of the logic scope.
H The TLS 216 Service Manual (Tektronix part number 070-8831-XX)
provides information for maintaining and servicing your logic scope to the
module level.
xii
TLS 216 User Manual
Page 20

Getting Started
Page 21
Product Description
The Tektronix TLS 216 Logic Scope is a superb tool for analyzing and debugging digital circuits. Its performance addresses the needs of digital designers and
troubleshooters of such circuits with the following features:
H sixteen channels, equipped with sixteen 2.5 pF FET probes, for acquiring
waveforms from digital circuits
H three display modes — displays analog waveforms, digital BusForms, and
dual-threshold timing diagrams
H four threshold level presets based on four logic families, TTL, CMOS,
+ECL, and –ECL, for deriving digital levels for BusForm
diagram displays
H five trigger types — Edge, Pulse, Pattern, State, and Sequence
H 500 MHz maximum bandwidth, a 2 Gigasamples/second maximum
digitizing rate, eight-bit digitizers, and up to a 2,000-sample record length
per channel
H full GPIB software programmability and hardcopy output using GPIB,
RS-232, or Centronics ports
H complete measurement and documentation capability
H intuitive operation using graphic icons and the more familiar and traditional
horizontal and vertical knobs
H on-line help at the touch of a button
TM
and timing
TLS 216 User Manual
1–1
Page 22

Product Description
Product Specification
The product specification is found in the TLS 216 Performance Verification and
Specifications Technical Reference which is shipped as a standard accessory with
the TLS 216 Logic Scope.
1–2
TLS 216 User Manual
Page 23
Start Up
Before You Begin
Operation
Before you use the TLS 216 Logic Scope, ensure that it is properly installed and
powered on.
To ensure maximum accuracy for your most critical measurements, you should
know about signal path compensation.
Be sure you compensate your logic scope for the surrounding temperature. This
action, called Signal Path Compensation (SPC), ensures maximum possible
accuracy for your most critical measurements. See Doing a Signal Path
Compensation on page 3–53 for a description of use and operation of this
feature.
To properly install and power on the logic scope, do the following tasks.
Installation
1. Be sure you have the appropriate operating environment. Specifications for
temperature, relative humidity, altitude, vibrations, and emissions are
included in the manual TLS 216 Performance Verification and Specification
shipped with this logic scope.
2. Leave space for cooling. Do this task by verifying that the air intake and
exhaust holes on the sides of the cabinet (where the fan operates) are free of
any airflow obstructions. Leave at least 5.1 cm (2 inches) free on each side.
WARNING. To avoid electrical shock, be sure that the power cord is disconnected
before checking the fuse.
3. Check the fuse to be sure it is the proper type and rating (stated on rear
panel). You can use either of two fuses. (See Figure 1-1 for fuse location.)
Each fuse requires its own cap. (See Table 1–1.) The logic scope is shipped
with the UL approved fuse installed.
4. Check that you have the proper electrical connections. The logic scope
requires 90 to 250 VAC
require up to 300 W.
, continuous range, 47 Hz to 63 Hz, and may
RMS
TLS 216 User Manual
1–3
Page 24
Start Up
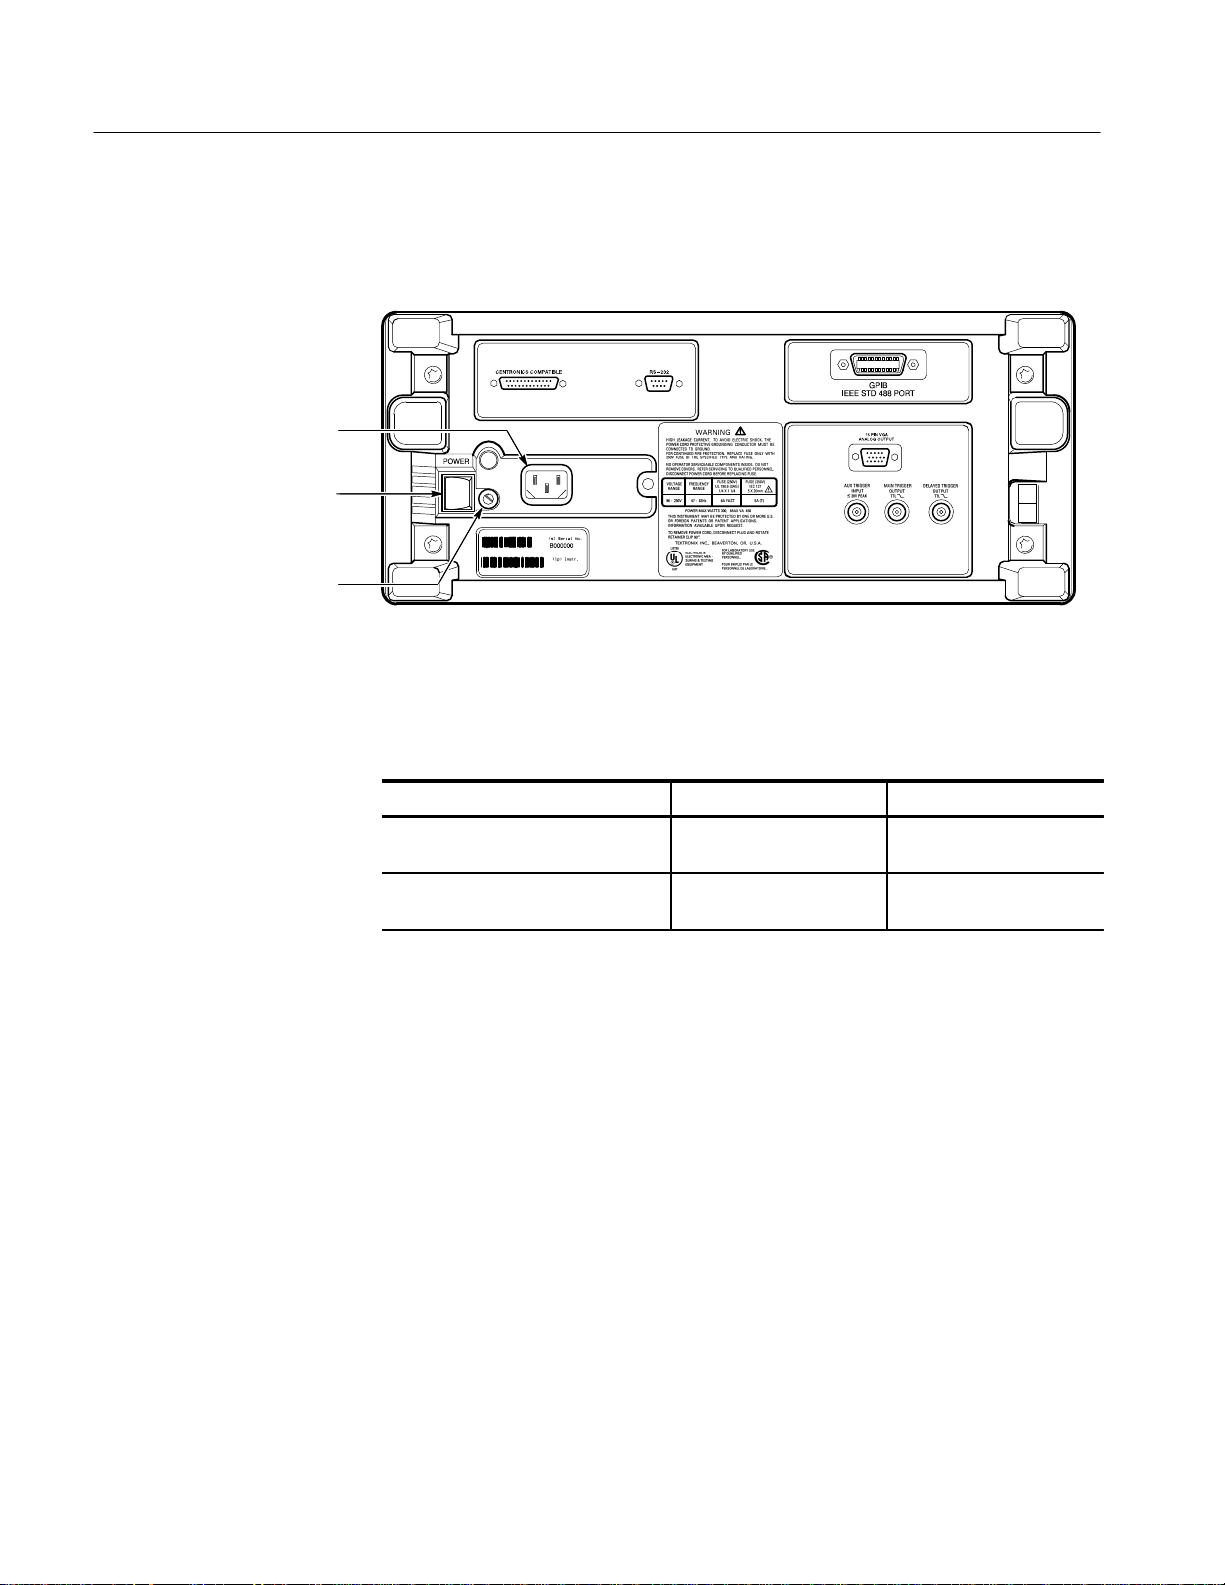
5. Connect the proper power cord from the rear-panel power connector (see
Figure 1-1) to the power system.
Power Connector
Principal Power Switch
Fuse
Figure 1-1: Rear Panel Controls Used in Start Up
Power On
T able 1–1: Fuse and Fuse Cap Part Numbers
Fuse Fuse Part Number Fuse Cap Part Number
.25 inch × 1.25 inch (UL 198.6,
3AG): 6 A FAST, 250 V.
5 mm × 20 mm (IEC 127): 5 A (T),
250 V .
159–0013–00 200–2264–00
159–0210–00 200–2265–00
6. Remove the front cover by grasping its left and right edges and snapping it
off of the front subpanel. (When reinstalling, align and snap back on.)
1. Check that the rear-panel principal power switch is on. (See Figure 1-1.) The
principal power switch controls all AC power to the instrument.
2. If the logic scope is not powered on (the screen is blank), press the front-panel ON/STBY button to toggle it on. (See Figure 1-2.)
The ON/STBY button controls power to most of the instrument circuits.
Power continues to go to certain parts even when this switch is set to STBY.
Once the logic scope is installed, it is typical to leave the principal power
switch on and use the ON/STBY button as the power switch.
1–4
TLS 216 User Manual
Page 25
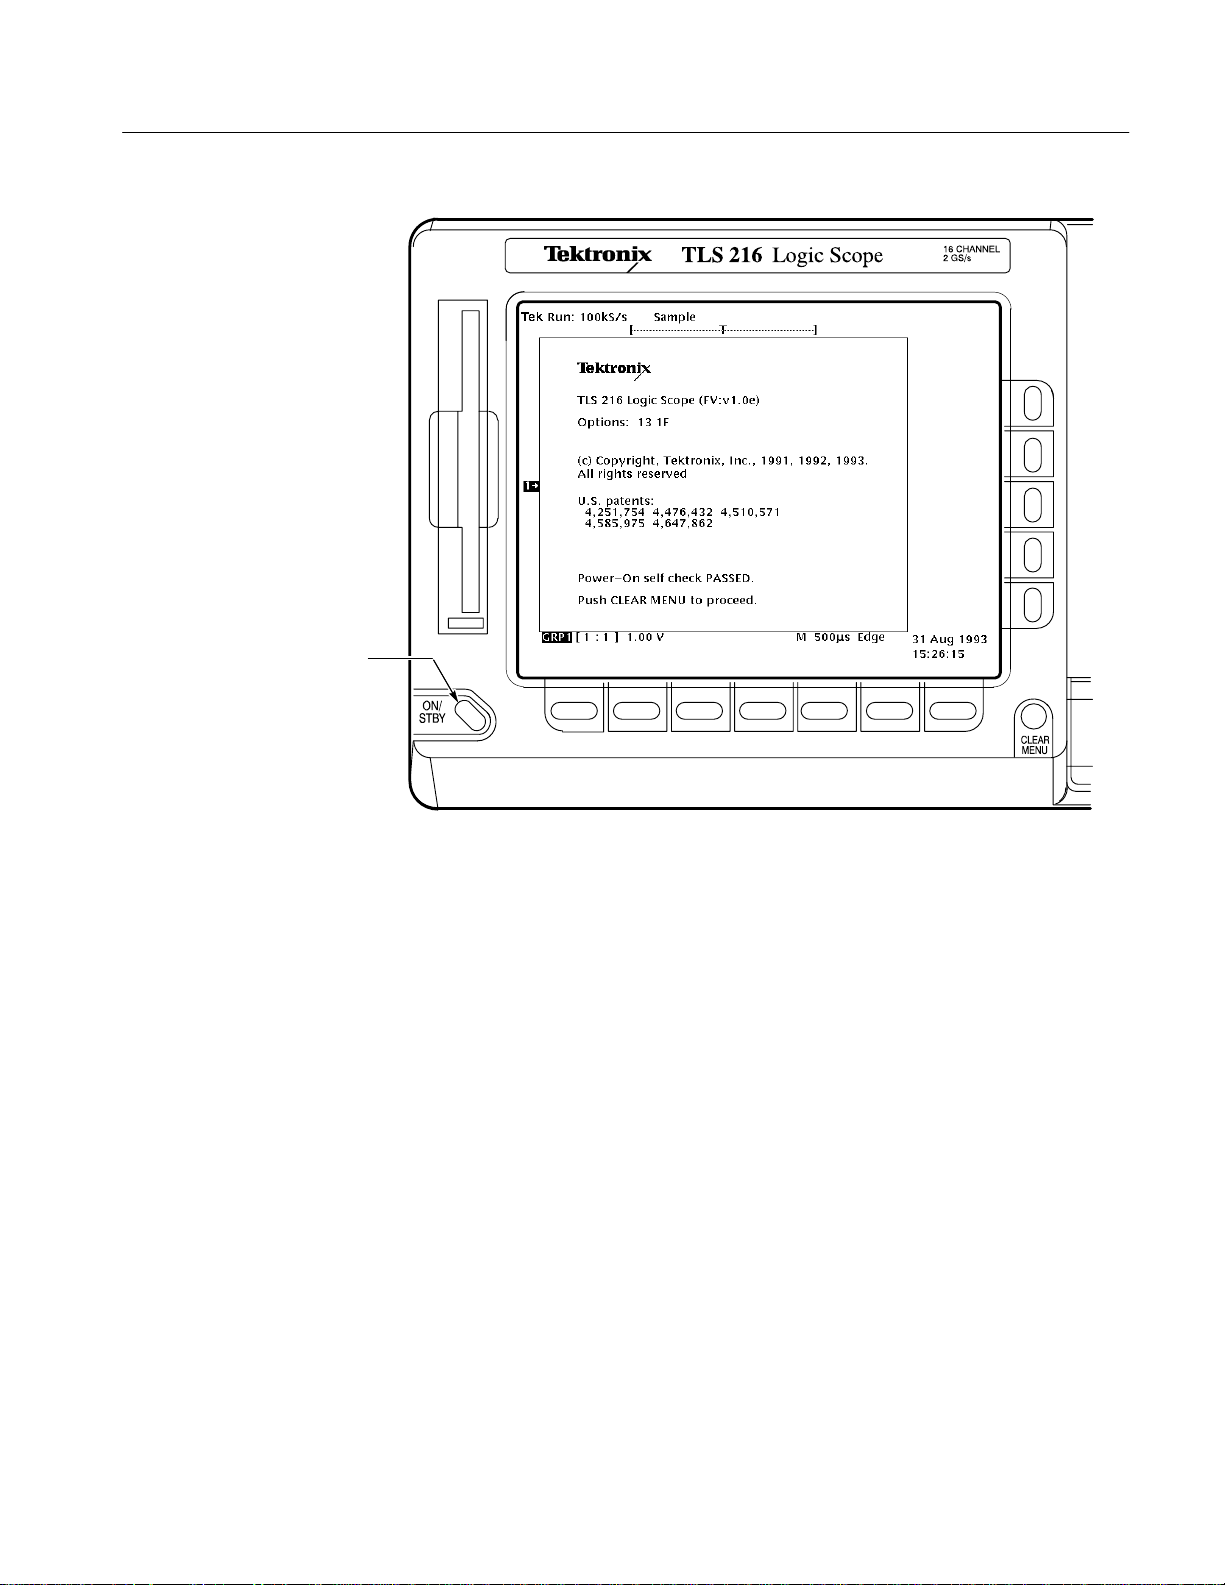
ON/STBY Button
Start Up
Self Test
Power Off
Figure 1-2: ON/STBY Button
Check the self test results. The logic scope automatically performs power-up
tests each time it is turned on. It will display a status screen that states whether
or not it passed self test. (If the self test passed, the logic scope removes the
status display screen after a few seconds.)
If the self test fails, call your local Tektronix Service Center. Depending on the
type of failure, you may still be able to use the logic scope before it is serviced.
Press the ON/STBY switch to turn off the logic scope.
TLS 216 User Manual
1–5
Page 26

Start Up
1–6
TLS 216 User Manual
Page 27
Setting Up for Examples
Perform the following tasks to connect input signals to the TLS 216 Logic
Scope, to reset it, and to become acquainted with its display screen. Once
completed, these tasks ready the logic scope for use in the examples that follow.
Perform the examples that follow this subsection to learn how to display and
measure waveforms with the logic scope.
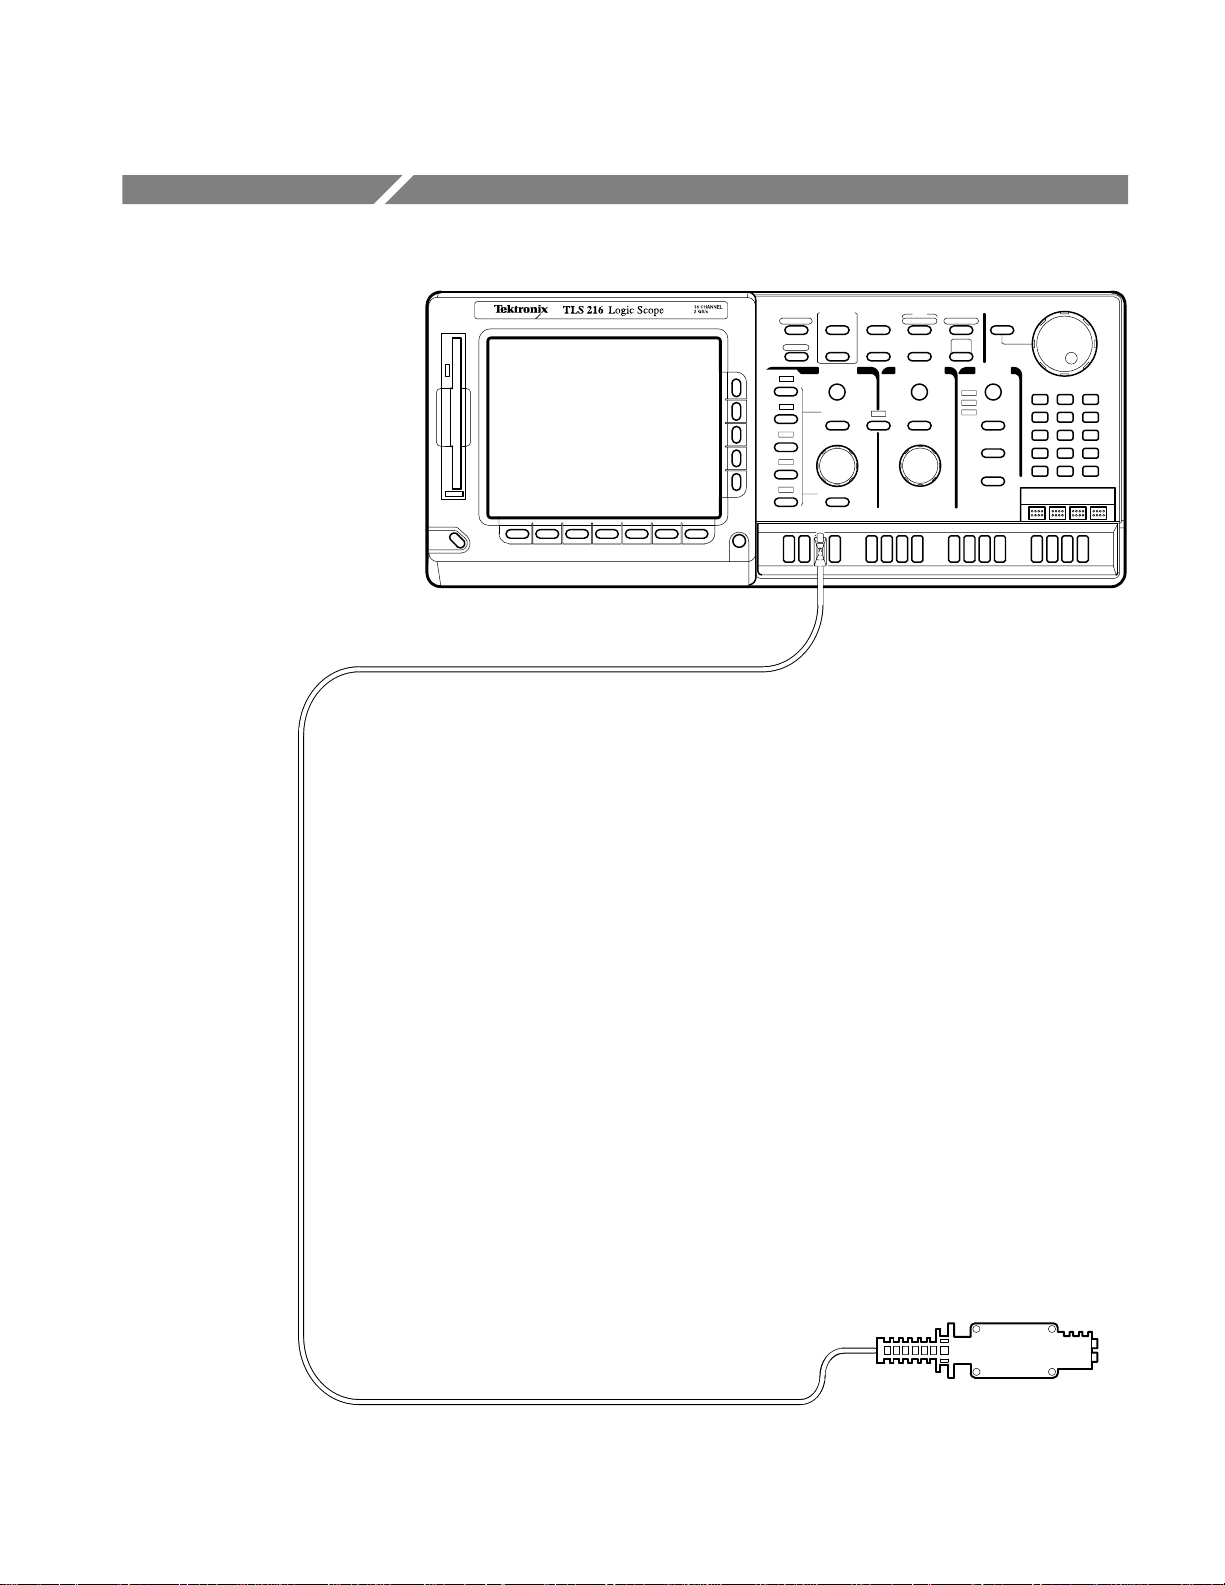
Connect the Input Signals
Do the following steps to couple input signals to the logic scope for use in the
examples.
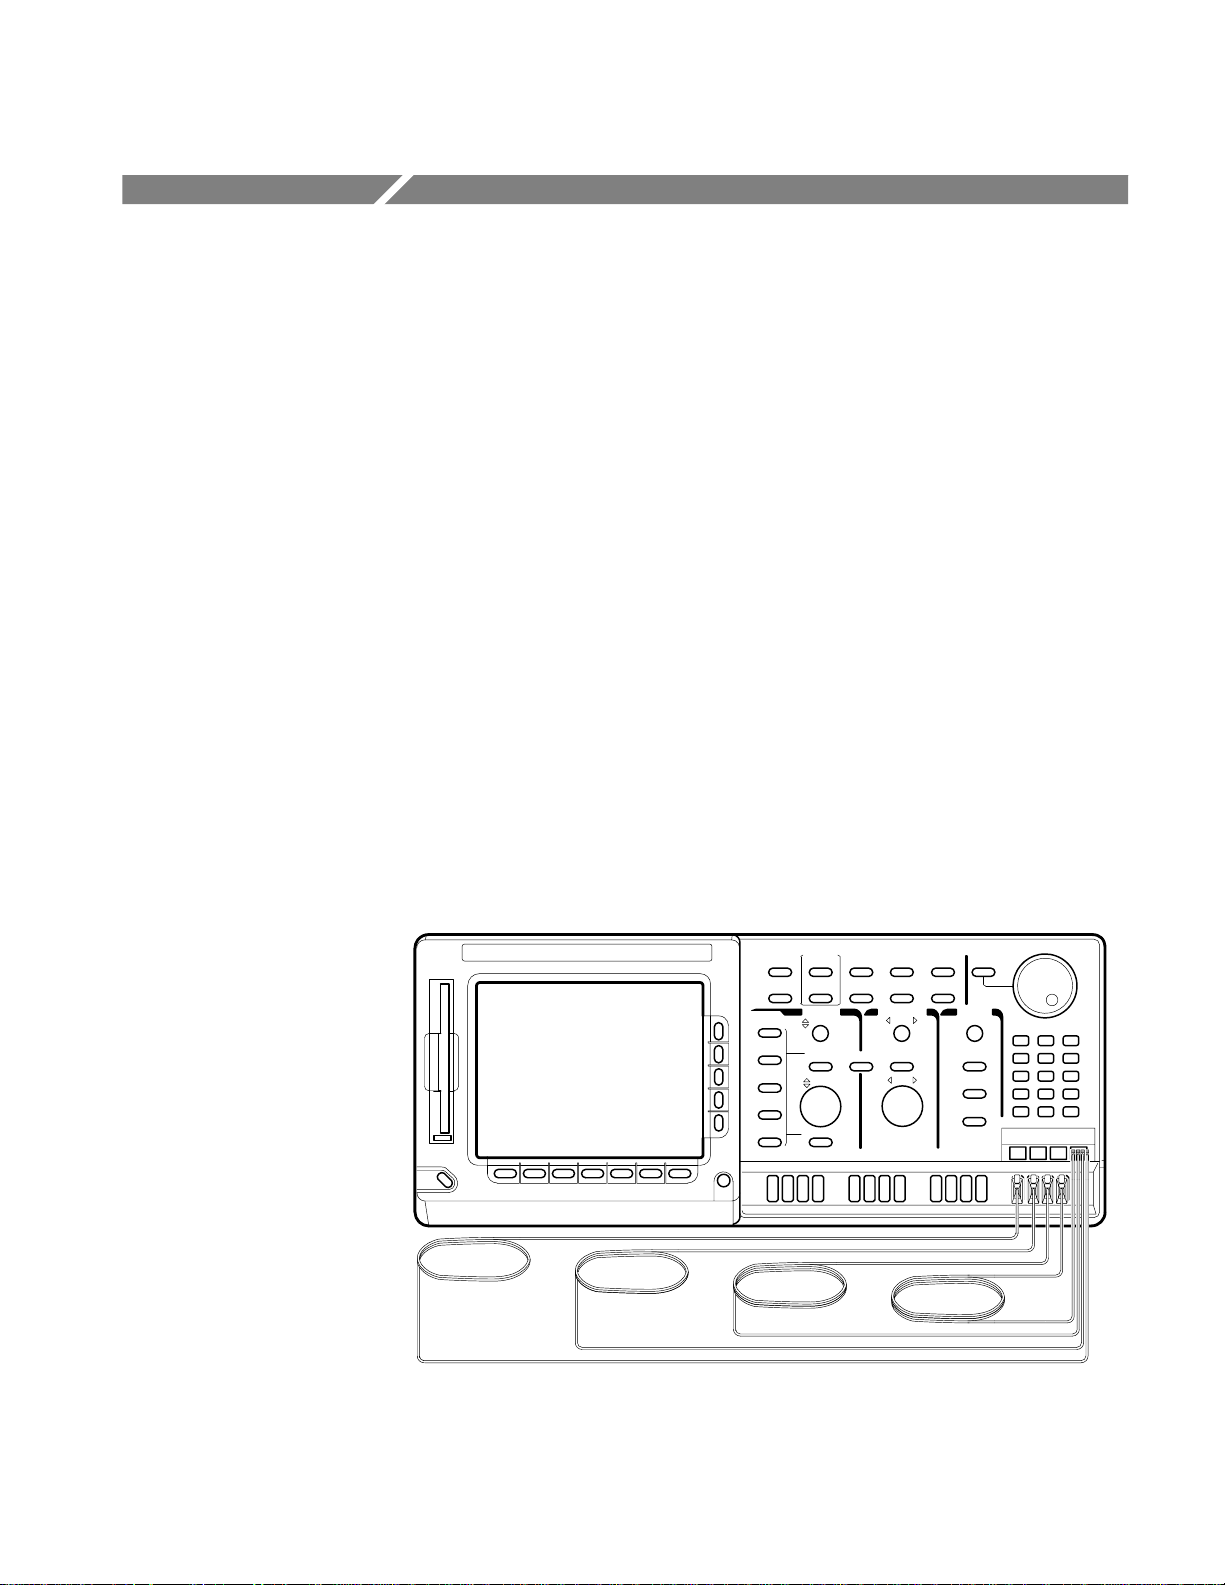
1. Remove all probes and signal inputs from the 16 input connectors along the
lower right of the front panel.
2. Connect a probe to each of the Channel 1 through Channel 4 inputs using
four of the probes supplied with the logic scope. (See Figure 1-3.)
3. Connect the input of the four probes to any four of the 16 probe calibration
outputs. (See Figure 1-3). Be sure to connect so the positive terminal of the
each probe (indicated by three ribs at the end of the probe tip) goes to the
positive (upper) terminal of the probe calibration output.
TLS 216 User Manual
Figure 1-3: Probe Connections for the Examples
1–7
Page 28
Setting Up for Examples
Reset the Logic Scope
SETUP Button
Do the following steps to reset the logic scope to a known factory default state
before doing the examples. (You can reset the logic scope anytime you begin a
new task and need to “start fresh” with known default settings.)
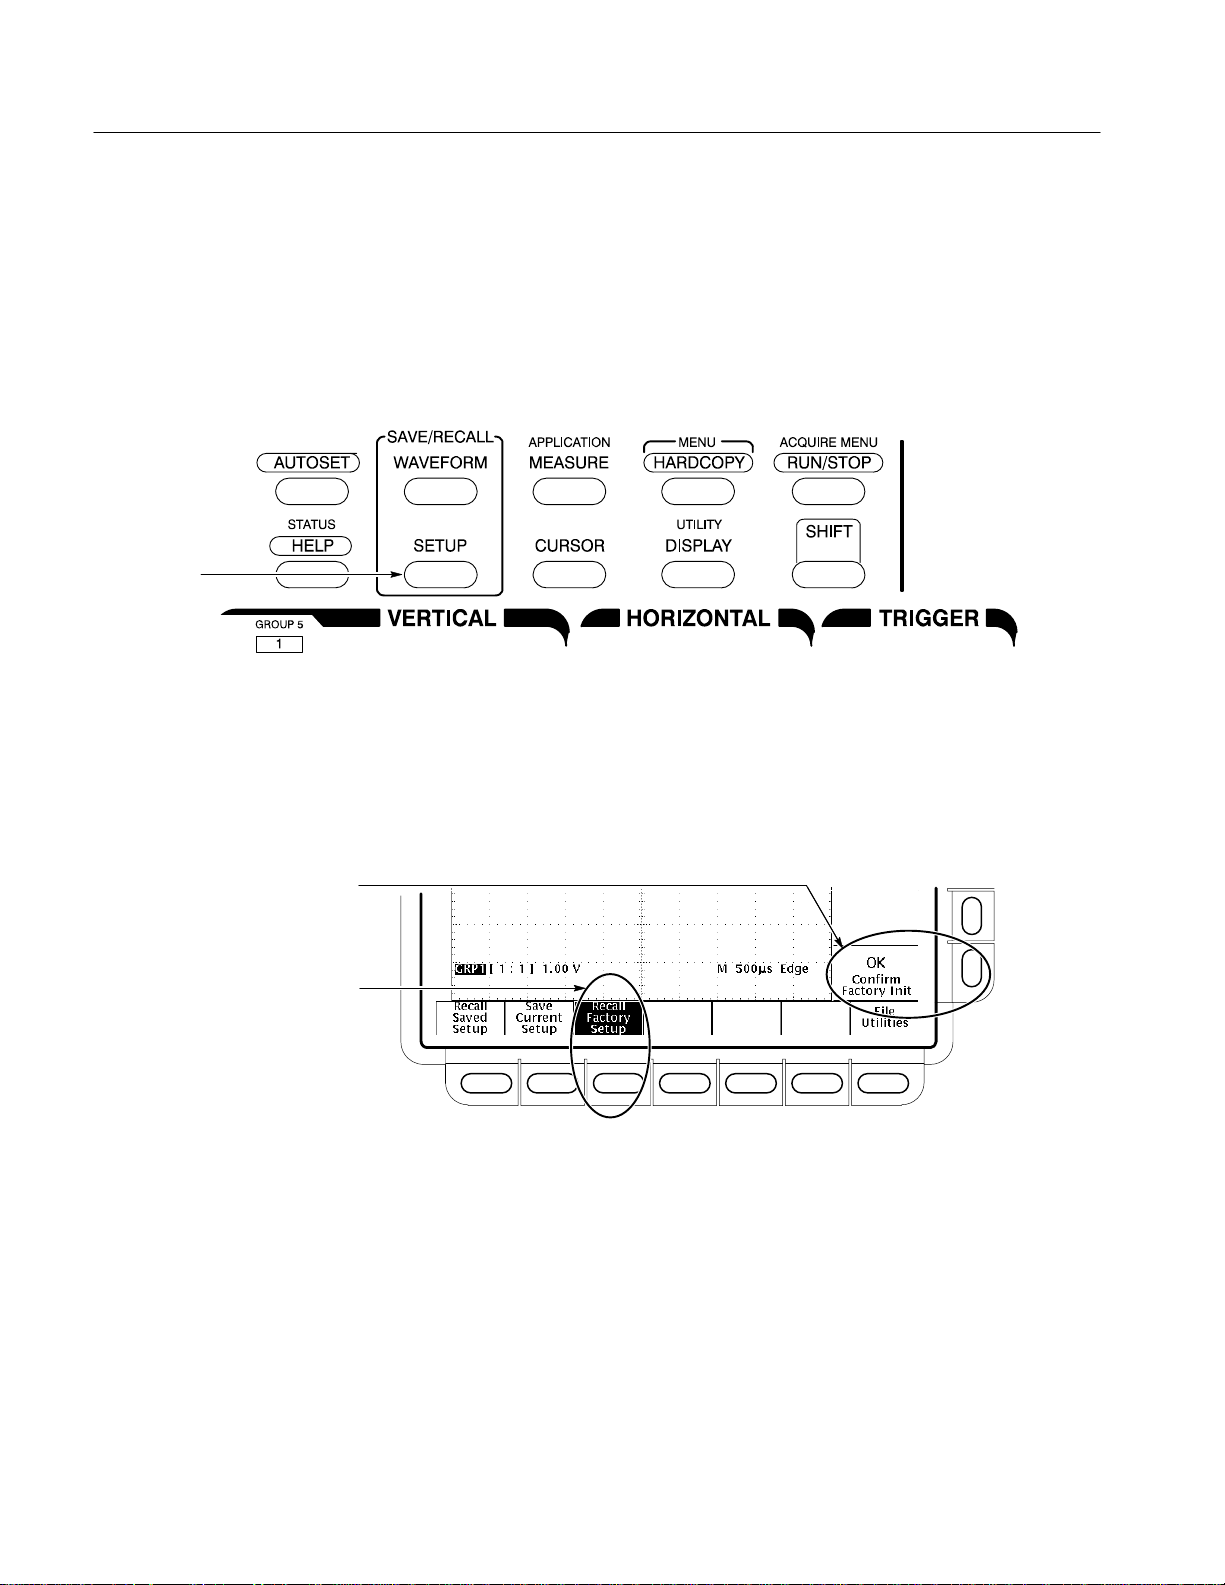
1. Press the save/recall SETUP button to display the Setup menu (Figure 1-4).
Figure 1-4: SETUP Button Location
OK Confirm Factory Init
Menu Item and Button
Recall Factory Setup
Menu Item and Button
The logic scope displays main menus along the bottom of the screen.
Figure 1-5 shows the Setup main menu.
Figure 1-5: The Setup Menu
2. Press the button directly below the Recall Factory Setup menu item.
The display shows side menus along the right side of the screen. The buttons
to select these side menu items are to the right of the side menu.
1–8
Because an accidental instrument reset could destroy a setup that took a long
time to create, the logic scope asks you to verify the Recall Factory Setup
selection. (See Figure 1-5.)
TLS 216 User Manual
Page 29
Setting Up for Examples
3. Press the button to the right of the OK Confirm Factory Init side menu
item.
NOTE. This manual uses the following notation to represent the sequence of
selections you made in steps 1, 2 and 3: Press save/recall SETUP ➞ Recall
Factory Setup (main) ➞ OK Confirm Factory Init (side).
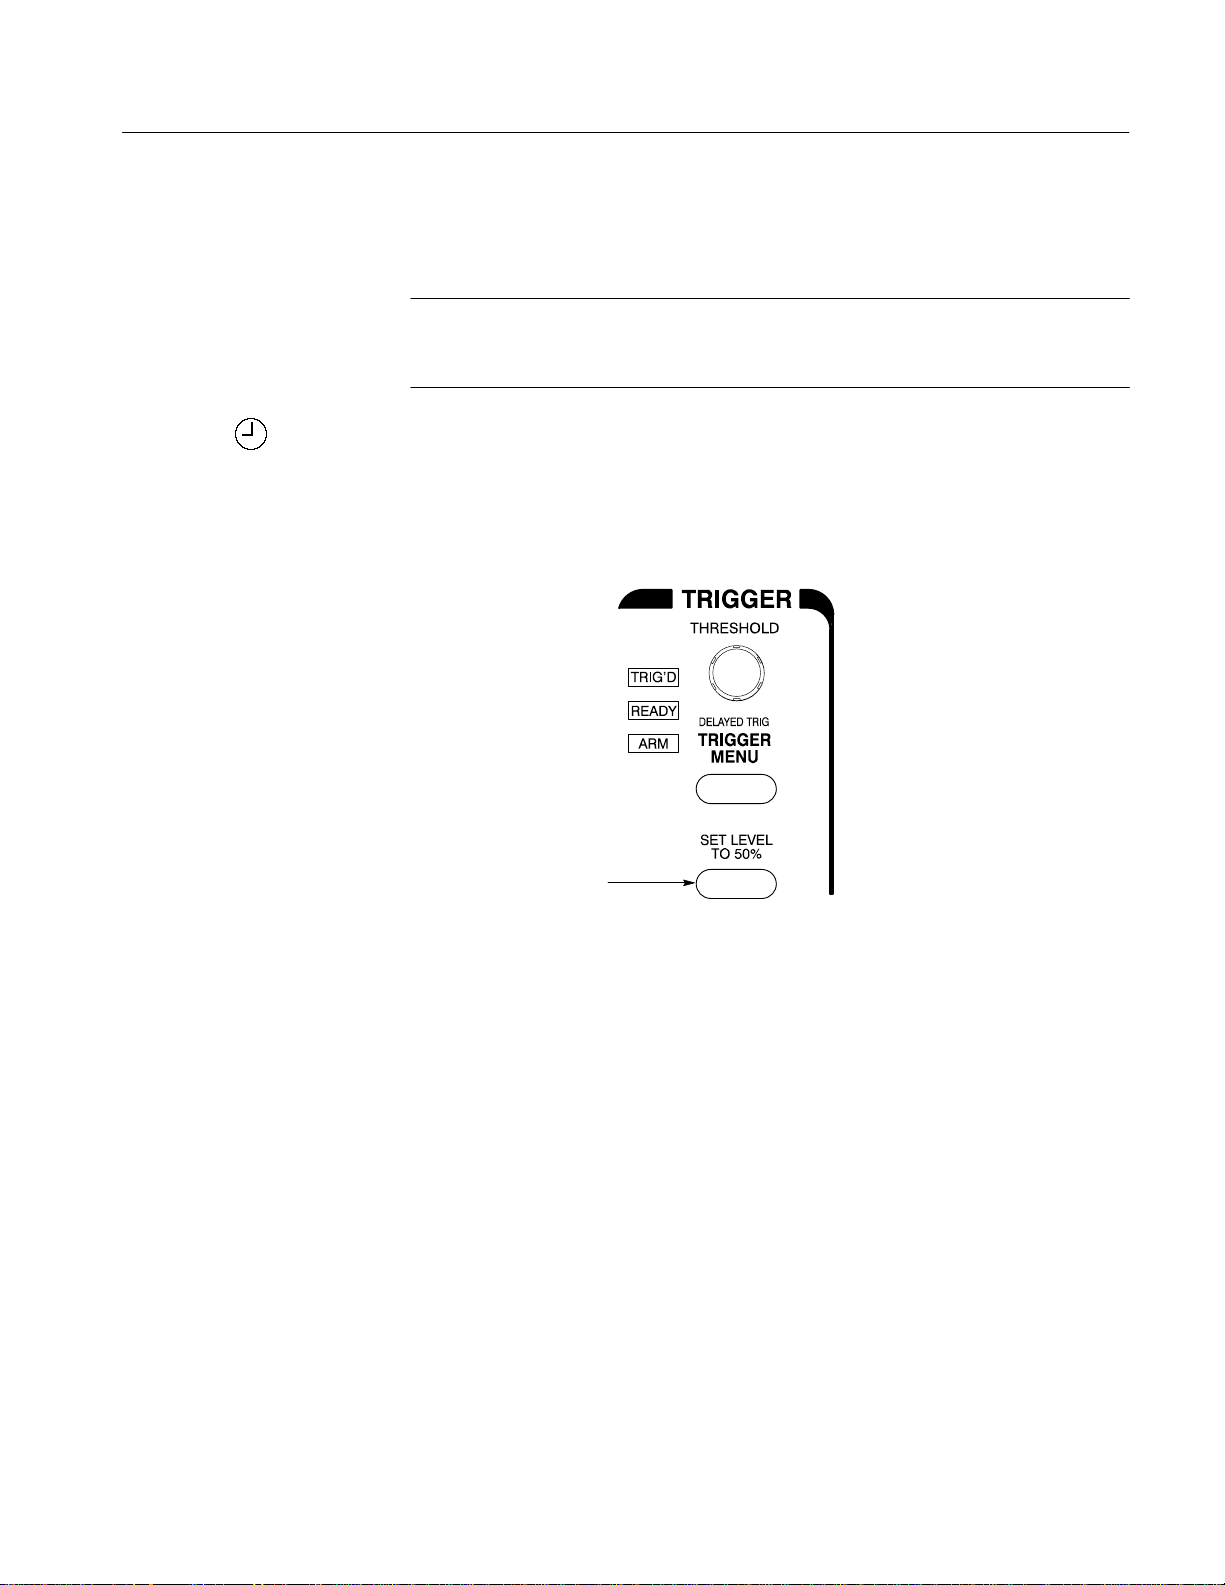
Note that a clock icon appears on screen. The logic scope displays this icon
when performing operations that take longer than several seconds.
4. Press SET LEVEL TO 50% to be sure the logic scope triggers on the input
signal. (See Figure 1-6.)
SET LEVEL TO 50% Button
Figure 1-6: Trigger Controls
Examine the Display Elements
Read the following information to become familiar with the logic scope display
before doing the examples.
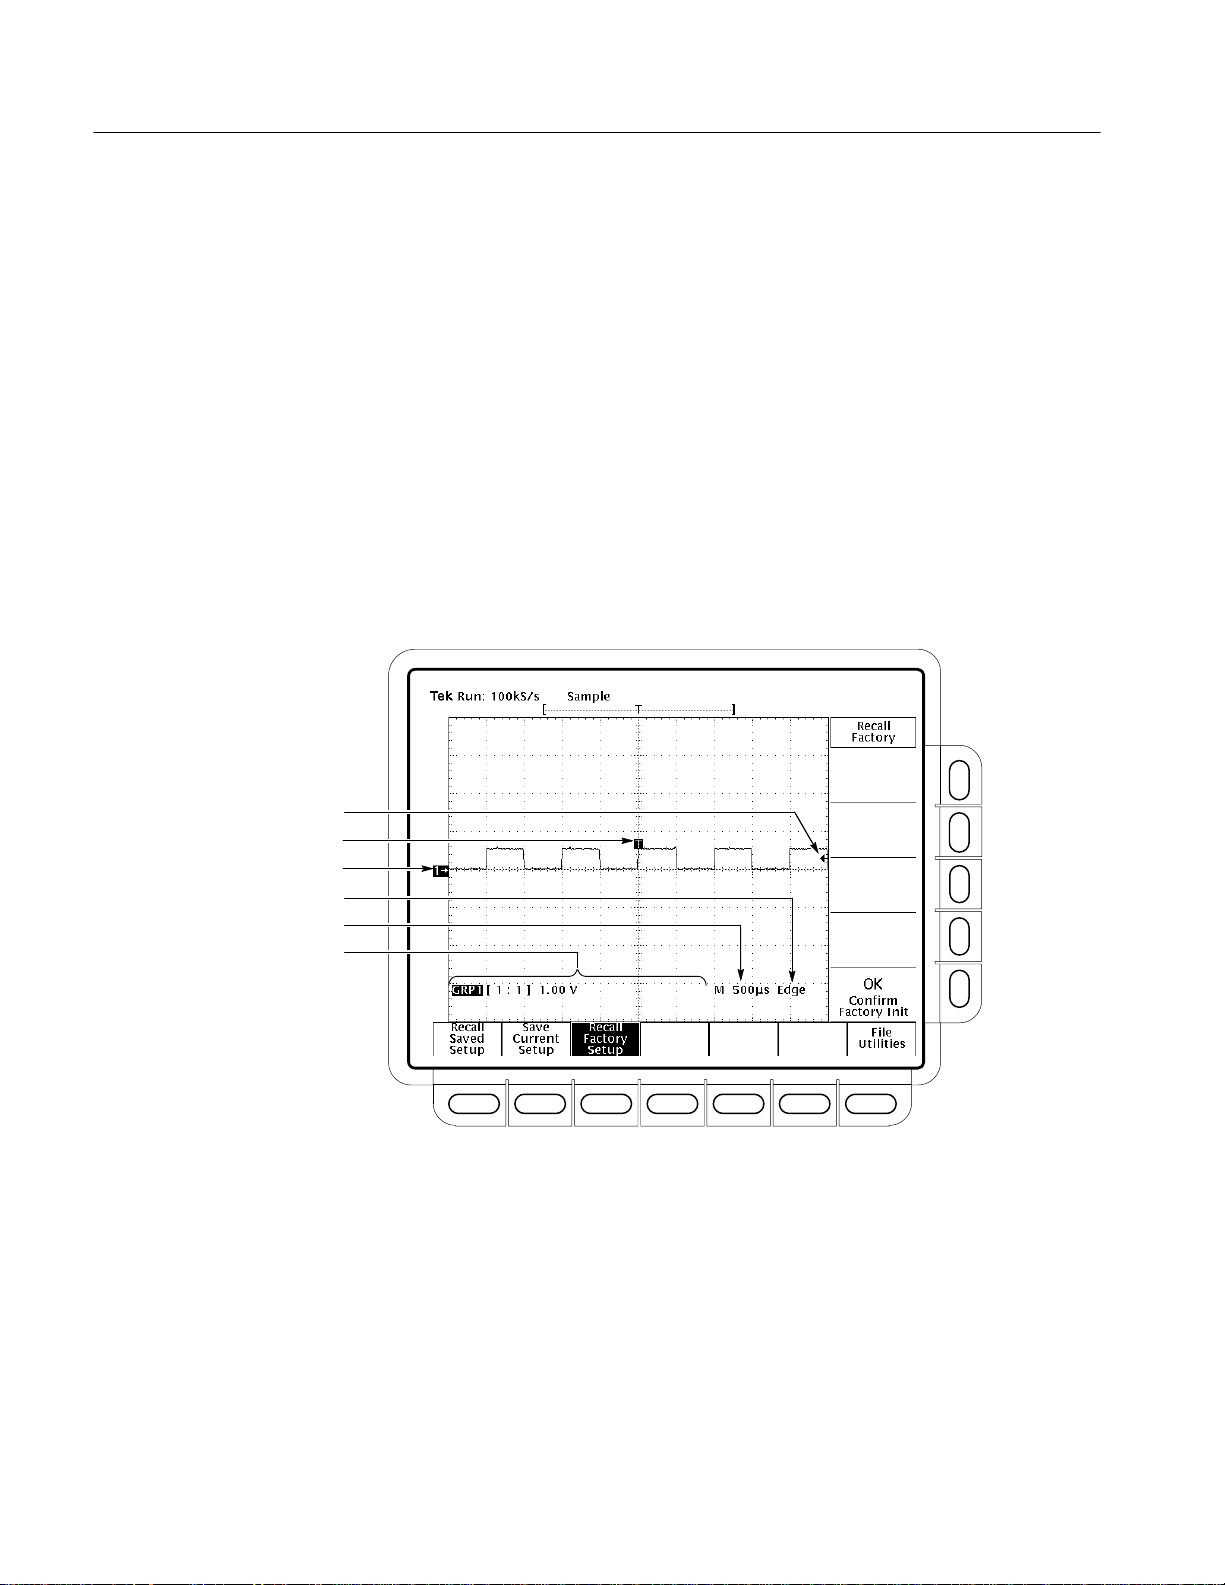
Figure 1-7 shows the display that results from the instrument reset. Note the
following characteristics.
The logic scope always displays a single group (Group 1) which contains only
one channel (Channel 1) after a reset.
The trigger threshold bar shows that the logic scope triggered the waveform at a
threshold level near 50% of its amplitude (from step 4).
The trigger position indicator shows that the trigger position of the waveform is
located at the horizontal center of the graticule.
TLS 216 User Manual
1–9
Page 30
Setting Up for Examples
The group reference indicator shows the vertical position of any channels that
Group 1 contains when the channels have no input signal. For the current group
display mode (Analog), this indicator points to the ground level for all channels
in the group when vertical offset is set to 0 V in the group menu; when vertical
offset is not set to 0 V, it points to the vertical offset level.
The trigger readout shows that the logic scope triggers using the edge of a signal
(rising or falling signal transitions that pass through the trigger threshold).
The time base readout shows that the main time base is set to a horizontal scale
of 500 ms/div.
The vertical readout indicates that Group 1 is displayed and that it includes
Channel 1 as the first and also the last channel in the group. The logic scope uses
this format for each group readout in the vertical readout: group number [last
channel:first channel] group volts/division setting.
Trigger Threshold Bar
Trigger Position Indicator
Group Reference Indicator
Trigger Readout
Time Base Readout
Vertical Readout
Figure 1-7: The Display After Factory Initialization
Right now, the channel, time base, and trigger readouts appear in the graticule
area to make room for display of the menu. You can press the CLEAR MENU
button any time to remove any menus and to move the readouts below the
graticule.
1–10
TLS 216 User Manual
Page 31

Example 1: Displaying W aveforms
The TLS 216 Logic Scope can be operated as a full-featured digitizing storage
oscilloscope with up to 16 live and 16 reference waveforms on screen. Do the
following tasks to learn how to display individual waveforms, to adjust those
waveforms individually, and how to use the Autoset function.
Display a Waveform
The default settings established by doing a reset display one waveform group
containing one channel on screen. Do the following steps to add additional
groups, with one channel for each group.
1. If you have changed any control settings since resetting the logic scope, reset
it now: press SETUP ➞ Recall Factory Setup (main) ➞ OK Confirm
Factory Init (side). Press SET LEVEL TO 50%.
2. Locate the VERTICAL section of the front panel and the group selection
buttons it contains. (See Figure 1-8.) These are labeled GROUP 1 through
GROUP 8 and MORE. (
selects the group appearing above the button: one of GROUP 5 through
GROUP 8.)
Pressing SHIFT before pressing a group button
TLS 216 User Manual
Figure 1-8: The Group Buttons and LEDs
1–11
Page 32

Example 1: Displaying Waveforms
3. Disconnect the Channel 2 probe from the probe calibration output.
4. Press GROUP 2.
Each of the group buttons has an LED above it. Right now, the GROUP 1
LED is on. This LED indicates that the vertical controls are set to adjust
Group 1.
The display shows a second waveform, which represents the signal on
Channel 2 in Group 2. Since there is nothing connected to the Channel 2
probe, this waveform is a flat line.
There are several other important things to observe:
H The vertical readout displays settings for both Group 1, which contains
Channel 1, and Group 2, which contains Channel 2.
H The logic scope created Group 2 containing only one channel — the
lowest-numbered channel not belonging to any group.
H The group readout for each group indicates single channel groups by
displaying the channel it contains as the first and last channel. (See
Figure 1-9.)
H There are two group indicators at the left edge of the graticule. Right
now, they overlap.
H The LED next to the GROUP 2 button is now on, and the GROUP 1
LED is off. Because the knobs control only one group at a time, the
vertical controls are now set to adjust Group 2.
NOTE. The logic scope still triggers on Channel 1. It does not change trigger
source when adding (or removing) groups. (You can change the trigger source to
any channel by using the TRIGGER MENU button to display the trigger menu.)
1–12
TLS 216 User Manual
Page 33

Selected Group
Group Readout for Group 1
First Channel
Group Label
Example 1: Displaying Waveforms
Adjust Each Waveform
Last Channel
Volts/Div or Group Display Mode
Figure 1-9: Group Readouts
Each example waveform group contains only one channel that, in turn, contains
only one waveform. Thus, adjusting a group is the same as adjusting a
waveform.
Do the following steps to select each waveform individually and to adjust its size
and placement. Refer to Figure 1-10 for knob locations.
1. Press GROUP 1. Note the logic scope displays the waveform of the selected
group “highlighted” on screen.
2. Turn the vertical SCALE knob clockwise. Observe the change in the
selected waveform and the group readout at the bottom of the display.
3. Turn the vertical POSITION knob first one direction, and then the other.
Observe the change in the displayed waveform, and note the group indicator
at the left side of the graticule moves with the group. (Also note the group
indicator of the selected group appears in reverse video. (See Figure 1-9.)
Then return the waveform to the center of the graticule.
TLS 216 User Manual
4. Turn the horizontal SCALE knob one click clockwise. Observe the time
base readout at the bottom of the display. With the time base set to
250 ms/div now, you should see two complete waveform cycles on the
display.
1–13
Page 34

Example 1: Displaying Waveforms
Figure 1-10: The VERTICAL and HORIZONTAL Controls
Autoset the Waveforms
5. Reconnect the CH 2 probe to the probe compensator output.
6. Press GROUP 2. Adjust vertical scale and position using the same controls
as you used above.
As you see, pressing a group button sets the vertical controls to operate on the
group selected. (The vertical position and scale knobs always affect all channels
in the selected group in the same way.) It also adds the group and its channel(s)
to the display if that group is not already defined.
When you first connect a signal to a channel and display it, the logic scope may
not scale and trigger that signal correctly. Use the autoset function, and you
should quickly get a meaningful display.
1. Reset the logic scope: press Save/Recall SETUP ➞ Recall Factory Setup
(main) ➞ OK Confirm Factory Init (side). Press SET LEVEL TO 50%.
2. To create an unstable display, slowly turn the trigger THRESHOLD knob
(see Figure 1-11) first one direction, and then the other. Observe what
happens when you move the trigger threshold level above the highest part of
the displayed waveform. Leave the trigger threshold so the display remains
untriggered.
1–14
TLS 216 User Manual
Page 35

AUTOSET Button
Example 1: Displaying Waveforms
THRESHOLD Knob
Figure 1-11: TRIGGER Controls
3. Press AUTOSET (see Figure 1-12) and observe the stable waveform
display.
Figure 1-12: AUTOSET Button Location
Figure 1-13 shows the display after pressing AUTOSET. If necessary, you can
adjust the waveform now by using the knobs discussed earlier in this example.
NOTE. Executing Autoset forces the display mode to Timing Diagram for all the
groups displayed. A table of all default settings after an autoset appears on
page 3–15.
TLS 216 User Manual
1–15
Page 36

Example 1: Displaying Waveforms
Figure 1-13: The Display After Pressing Autoset
Removing a Waveform from the Display
Pressing the GROUP OFF button ends display of the currently selected group of
waveforms. Since in this example each group includes only one channel, turning
off a group turns off the display of only one waveform. (Groups that include
more than one channel end the display of more than one waveform when turned
off.)
1. Press GROUP 2.
2. Press GROUP OFF (located below the vertical SCALE knob).
Since Group 2 was selected when you pressed the GROUP OFF button, the
logic scope ended display of the Group 2 waveform. Note the vertical
readout displays “OFF” in the Group 2 readout. When turned off, a group
exists but is not displayed.
The Group 1 LED is lit. Group 1, containing Channel 1, has become the
selected group. When you end display of the last group, one group LED
remains on (one group must always be selected).
1–16
3. Press GROUP OFF again to end display of the Group 1 waveform.
HINT: Although channels you remove are not acquired (sampled and digitized),
you can still select them to provide sources for triggering.
TLS 216 User Manual
Page 37

Example 2: Grouping W aveforms
The TLS 216 Logic Scope displays and controls waveforms as groups of one or
more waveforms, with eight groups available for display at the same time. Once
grouped, you can display waveforms as analog waveforms, or as digital levels on
a bus (BusFormst), or as a timing diagram, depending on which display mode
best helps you analyze your digital circuit.
Do the following tasks to learn to how to define and display groups of
waveforms, to adjust the waveforms as a group, and to choose a display mode.
Display a Waveform Group
Do the following steps to define and display a waveform group.
1. If you are not continuing from the previous example, follow the instructions
on page 1–7 under the heading “Setting Up for the Examples.”
2. If you have changed any control settings since resetting the logic scope, reset
it now: press Save/Recall SETUP ➞ Recall Factory Setup (main) ➞ OK
Confirm Factory Init (side). Press SET LEVEL TO 50%.
3. Use the vertical POSITION knob to move GROUP 1 to the top of the
display.
4. Press SHIFT, and then press GROUP 6. There are several changes to the
display:
H The vertical readout indicates that a new group (Group 6) has been
created containing the first available channel (that is, the lowest
numbered channel not already belonging to a group—in this case,
Channel 2).
H The Group 1 readout no longer appears in the vertical readout. The
vertical readout displays the group labels in two pages: Group 1 through
Group 4 on page one, and Group 5 through Group 8 on page two. To
force the readout to display group labels in either of these two pages,
select a group in the desired page.
H The logic scope lights the LED below Group 6 to indicate it is selected.
It lights the same LED when Group 2 is selected. You can always
determine the selected group by looking at the vertical readout. It always
displays the selected group with its label in reverse video.
H The logic scope displays each group (up to the sixth displayed) in a
different color to help you distinguish one group from another (the group
TLS 216 User Manual
1–17
Page 38

Example 2: Grouping Waveforms
indicators at the left side of the screen can also be used to identify each
group).
5. Press GROUP MENU to display the menu for defining the selected group.
6. Press Group Definition in the main menu.
Note that the side menu settings for First Channel, Last Channel, and
Selected Channel match the GROUP 6 readout. With the same channel (2)
set for First Channel and Last Channel, the group is currently defined to
include only one channel.
7. Press First Channel in the side menu. In the key pad, press 3, and then press
ENTER.
8. Press Last Channel in the side menu. In the key pad, press 6, and then press
ENTER.
Observe that Channels 3 through 6 are displayed as a superimposed,
contiguous, four-channel group. (See Figure 1-14.) The driven channels,
Channel 3 and Channel 4, appear as closely overlapped waveforms; the
channels not coupled to probe calibration signals, Channel 5 and Channel 6,
appear as closely overlapped flat lines.
In addition to using the key pad, you can turn the general purpose knob or
toggle the appropriate side menu button to set the first, last, and selected
channels.
1–18
Figure 1-14: Vertical Waveform Groups
TLS 216 User Manual
Page 39

Adjust the Waveform Group
When a waveform group contains multiple channels, adjusting a group adjusts
all channels and waveforms in the group. Do the following steps to adjust all
waveforms in a group at the same time.
1. Turn the vertical SCALE knob clockwise. Observe that all selected
waveforms are affected equally. (Channels 5 and 6 contain no waveforms
and therefore do not change amplitude on screen.)
2. Turn the vertical POSITION knob first one direction, and then the other.
Observe the change in the display position of all waveforms in the group.
Return the waveform group to the center of the graticule.
3. Turn the horizontal SCALE knob one click clockwise. Observe the time
base readout at the bottom of the display. It should read out a time base
setting of 250 ms/div now, and you should see two complete waveform
cycles on the display.
Example 2: Grouping Waveforms
Select a Single Channel
The display of waveforms in an overlapping group sometimes makes it difficult
to see an individual waveform. Do the following steps to select a channel and
display it without any other channel (in the same group) appearing on screen.
1. Press Group Definition in the main menu.
2. Press Selected Channel in the side menu. In the key pad, press 3, and then
press ENTER.
3. Press Display in the main menu.
4. Press Analog in the side menu to toggle it to Selected.
Observe that Channels 4 through 6 are no longer displayed. The logic scope
turns off the display of all but the waveform acquired by the selected channel
(Channel 3 from step 2).
5. Press Analog in the side menu to toggle it to ALL before continuing with
the example task that follows.
NOTE. Adjusting the Vertical SCALE and POSITION knobs scales and positions
all waveforms in the groups regardless of whether ANALOG ALL or ANALOG
SELECTED is set in the Group Mode menu.
TLS 216 User Manual
1–19
Page 40

Example 2: Grouping Waveforms
Select a Display Mode
The logic scope can display a waveform group in any of three display modes:
Analog, BusForm, or Timing Diagram. The waveform group currently displayed
appears in Analog mode, which displays analog waveforms overlapped, with
their ground levels superimposed, when set to ALL. Do the following steps to
select a new display mode.
1. Press Display in the main menu.
2. Press Timing Diagram. Use the vertical position knob to center the display
vertically.
There are several important points to observe here (see Figure 1-15):
H The logic scope vertically skews the waveforms relative to each other so
you can compare and measure the time relation between any two
waveform edges of all waveforms in the group.
H The logic scope intensifies the channel currently selected in the Group
Definition menu (true for all display modes).
Side Menu Title
Group 6, Timing Mode,
Ch 6 – Ch 3
H The logic scope displays the waveforms as flat lines, since Timing
Diagram and Bus modes display amplitude levels based on how the
compare relative to the settings for Display Thresholds. (The amplitude
of the probe calibration signal qualifies as a low TTL level at all times.)
1–20
Figure 1-15: Group 6 Displayed as a Timing Diagram
TLS 216 User Manual
Page 41

3. Press Display Thresholds, and then press Vhigh, min.
4. Enter 400 mv using the key pad (press 0.4, and then press ENTER). The
logic scope now displays the 500 mV probe waveforms as time related
digital waveforms, since 500 mV exceeds the minimum Vhigh.
Determining the Binary Value of a Group
When displaying a group in BusForm or Timing Diagram mode, you are
probably interested in its digital value. The logic scope can display the binary
value of the selected group based on the levels of the waveforms the group
contains. Do the following steps to display the binary value of a group.
1. Press CURSOR.
2. Press Function in the main menu, and then V Bars in the side menu.
3. Rotate the general purpose knob until the selected cursor (the solid one)
moves into the positive half cycle of the two displayed waveforms.
Example 2: Grouping Waveforms
Cursor Readout
Active Cursor
4. Read the binary value of all acquired waveforms in the cursor readout (see
Figure 1-16). The most significant bit (left-most bit in the readout) corresponds to the highest numbered channel currently acquired.
TLS 216 User Manual
Figure 1-16: Binary Value of a Group
1–21
Page 42

Example 2: Grouping Waveforms
NOTE. You might wonder why channel 1 displays a zero in the binary readout
instead of one. Remember, the logic scope displays binary values based on logic
thresholds. The procedure just listed changed only the Group 2 threshold levels
and, therefore, the probe calibration signal in Group 1 still qualifies as a low
logic level.
Cursors also measure time and amplitude. Read about using cursors (and the
binary readout) in Measuring Waveforms with Cursors on page 3–81.
Deleting Waveform Groups
When creating new groups, you may want to delete groups you no longer use.
Do the following steps to delete a waveform group and make its channels
available for creating new groups.
1. Press the button corresponding to the group, one of Group 1 through
Group 8, that you want to delete.
2. Press GROUP MENU ➞ Group Definition (main) ➞ Delete Group.
The logic scope removes the group which, in turn, removes all its channels
and its readout from the screen. It continues to make the released channels
available for including in new or existing groups or for use as trigger
sources. However, it will not display them until you include them in a new
or existing group.
NOTE. You cannot delete all groups. If you try to delete the last defined group,
the logic scope will retain the group, assign it Channel 1 as first, last, and
selected channel, and display it on screen.
NOTE. Sometimes you may just want to end display of a group, rather than
deleting that group. In that case, use the GROUP OFF button to turn the display
of the selected group off. To later restore display of the group, select it and turn
it on in the Display Group Mode menu (press GROUP MENU).
1–22
TLS 216 User Manual
Page 43

Example 3: Taking Measurements Automatically
The TLS 216 Logic Scope can measure many waveform parameters automatically and read out the numeric results on screen. Do the following tasks to discover
how to select various measurements, to take them on various waveforms, and to
display a snapshot of most measurements.
Select the Measurements
To use the automated measurement system, you must have a stable display of
your signal. Also, the waveform must have all the segments necessary for the
measurement you want. For example, a rise time measurement requires at least
one rising edge, and a frequency measurement needs at least one complete cycle.
1. If you are not continuing from the previous example, follow the instructions
on page 1–7 under the heading Setting Up for the Examples.
2. If you have changed any control settings since resetting the logic scope, reset
it now: press SETUP ➞ Recall Factory Setup (main) ➞ OK Confirm
Factory Init (side).
3. Press AUTOSET.
4. Press MEASURE to display the Measure main menu. (See Figure 1-17.)
5. If it is not already selected, press Select Measrmnt (main). The readout for
that menu item indicates which channel or group the measurement will be
taken from. The logic scope takes most automated measurements on the
currently selected channel in the currently selected group.
The Select Measurement side menu lists some of the measurements that can
be taken on waveforms. The logic scope can take many different measurements. It can continuously update and display up to four measurements at
any one time. Pressing the button next to the –more– menu item brings up
the other measurement selections.
6. Press Frequency (side). If the Frequency menu item is not visible, press
–more– (side) repeatedly until the Frequency item appears. Then press
Frequency (side).
Observe that the frequency measurement appears within the graticule area at
the right side. The measurement readout includes the notation C1, meaning
that the measurement is taken on the Channel 1 waveform.
To take a measurement on another channel, make sure the selected group
contains that channel (use the group front-panel buttons). Then use the
TLS 216 User Manual
1–23
Page 44

Example 3: Taking Measurements Automatically
Group Definition menu to select the channel. Return to the Measure menu to
select the measurement.
Figure 1-17: Measure Main Menu and Select Measurement Side Menu
7. Press GROUP MENU ➞ Group Definition (main) ➞ Last Channel
(side). Press Last Channel again to increment it to 2. Press AUTOSET.
8. Press Selected Channel (side) twice to select it and increment it to
Channel 2.
Note that, for any group, the logic scope intensifies the selected waveform in
that group on screen to help you identify it.
9. Press MEASURE ➞ Select Measmnt (main).
10. Press Positive Width (side) ➞ –more– (side) ➞ Rise Time (side) ➞
Positive Duty Cycle (side).
Observe from the measurement readouts that the logic scope takes all three
measurements on the channel you just selected, Channel 2.
11. To move the measurement readouts outside the graticule area, press CLEAR
MENU. (See Figure 1-18.)
1–24
TLS 216 User Manual
Page 45

Example 3: Taking Measurements Automatically
Figure 1-18: Four Simultaneous Measurement Readouts
Remove Measurement Readouts
The Measure menu lets you remove measurements you no longer want displayed. You can remove any one measurement, or you can remove them all at
once.
Press MEASURE ➞ Remove Measrmnt (main) ➞ Measurement 1, Measure-
ment 2, and Measurement 4 (side) to remove those measurements. Leave the
rise time measurement displayed.
Changing the Measurement Reference Levels
By default, the measurement system will use the 10% and 90% levels of the
waveform for taking the rise time measurement. You can change these values to
other percentages or change them to absolute voltage levels.
Press here to remove
menus from screen.
TLS 216 User Manual
To examine the current values, press Reference Levels (main) ➞ High Ref
(side).
1–25
Page 46

Example 3: Taking Measurements Automatically
The General Purpose
Knob
General Purpose Knob
Setting and Readout
General Purpose
Knob Icon
Highlighted Menu Item with Boxed
Readout Value
The general purpose knob is now set to adjust the high reference level. (See
Figure 1-19.)
Figure 1-19: General Purpose Knob Indicators
There are several important things to observe on the screen:
H The knob icon appears at the top of the screen. Its presence indicates that the
general purpose knob has just been set to adjust a parameter.
H The upper-right corner of the screen shows the readout High Ref: 90%.
H The High Ref side menu item is highlighted, and a box appears around the
90% readout in the High Ref menu item. The box indicates that the general
purpose knob is currently set to adjust that parameter.
Turn the general purpose knob left and right, and then use it to adjust the high
level to 80%. This adjustment sets the high measurement reference to 80%.
NOTE. To make large changes quickly with the general purpose knob, press the
SHIFT button before turning the knob. When the light above the SHIFT button is
lit and the display says Coarse Knobs in the upper-right corner, the general
purpose knob speeds up significantly.
1–26
TLS 216 User Manual
Page 47

Example 3: Taking Measurements Automatically
The Numeric Keypad
Any time the general purpose knob is set to adjust a numeric parameter, you can
enter the value as a number using the keypad instead of using the knob. Always
end the entry of a number by pressing the ENTER (
The numeric keypad also provides multipliers for engineering exponents, such as
m for milli, M for mega, and
the SHIFT button, then press the multiplier.
1. Press Low Ref (side).
2. On the numeric keypad, press the 2, the 0, and the ENTER (
which sets the low measurement reference to 20%. Observe that the rise-time
value has changed.
3. Press Remove Measrmnt (main) ➞ All Measurements (side). The display
will return to its original state.
Take a Snapshot of Measurements
You have seen how the logic scope can display up to four individual automated
measurements on screen. You can also pop up a display of almost all the
automated measurements available in the Select Measrmnts side menus. This
snapshot of measurements is taken on the currently selected waveform in the
currently selected group. (Use the group front-panel buttons to select the group;
use the Group Menu to select the channel in the selected group.)
) key.
m for micro. To enter these multiplier values, press
) buttons,
As when displaying individual measurements, you must have a stable display of
your signal, and the signal must have all the segments necessary for the
measurement you want.
1. Press Snapshot (main) to pop up a snapshot of all available single waveform
measurements. (See Figure 1-20).
The snapshot display includes the notation Ch 2, meaning that the logic
scope took the measurements listed on the Channel 2 waveform. To take a
snapshot of a waveform in another channel, first select the group that
includes the channel and then select the channel.
The snapshot measurements do not continuously update. Snapshot executes a
one-time capture of all measurements and does not update those measurements unless you execute another snapshot.
TLS 216 User Manual
1–27
Page 48

Example 3: Taking Measurements Automatically
Figure 1-20: Snapshot of Channel 2
2. Press Again (side) to do another snapshot and update the snapshot measurements.
3. Press Remove Measrmnt (main) to remove the snapshot display. (You can
also press CLEAR MENU, but a new snapshot will be executed the next
time you display the Measure menu.)
1–28
TLS 216 User Manual
Page 49

Example 4: Saving Setups
The TLS 216 Logic Scope can save its control settings and recall them later to
quickly re-establish the previously saved setup. The logic scope provides several
storage locations where you can save the setups. Do the following tasks to save a
setup and then to recall it.
NOTE. Besides being able to save several complete setups, the logic scope
remembers all the current control settings when you power it off. You can power
on and continue with the same setup as when you left off. You do not have to
reconstruct the setup.
Save a Setup
First, you need to create an instrument setup you want to save. The next several
steps establish a two-waveform display with a measurement on one waveform.
The setup created is complex enough that you might prefer not to go through all
these steps each time you want that display.
1. If you are not continuing from the previous example, follow the instructions
on page 1–7 under the heading “Setting Up for the Examples.”
2. If you have changed any control settings since resetting the logic scope, reset
it now: press Save/Recall SETUP ➞ Recall Factory Setup (main) ➞ OK
Confirm Factory Init (side).
3. Press AUTOSET.
4. Press MEASURE ➞ Select Measrmnt (main) ➞ Frequency (side). (Press
the –more– side menu item if the Frequency selection does not appear in
the side menu.)
5. Press GROUP 2.
6. Press Save/Recall SETUP ➞ Save Current Setup (main) to display the
Setup main menu. (See Figure 1-21.)
CAUTION. Setup locations in the side menu appear with the label user if they
already contain a stored setup and with the label factory if they do not. To avoid
overwriting (and losing forever) a saved setup, save your current setup in a
location labeled factory; otherwise, save it in any setup location desired.
TLS 216 User Manual
1–29
Page 50

Example 4: Saving Setups
Recall a Setup
Figure 1-21: Save/Recall Setup Menu
7. Press one of the To Setup side menu buttons to store the current instrument
settings into that setup location. Remember which setup location you
selected for use later.
There are more setup locations than can be listed at one time in the side
menu. The –more– side menu item gives you access to all the setup
locations.
Once you have saved a particular setup, you can change the settings as you
wish, knowing that you can come back to that setup at any time.
8. Press GROUP OFF twice to turn both groups off.
To recall the setup, press Save/Recall SETUP ➞ Recall Saved Setup (main) ➞
Recall Setup (side) for the setup location you used in the last exercise. The
groups you just removed (in step 8, above) should appear in the recalled setup.
This completes the examples. To restore the default settings, press Save/Recall
SETUP ➞ Recall Factory Setup (main) ➞ OK Confirm Factory Init (side).
1–30
TLS 216 User Manual
Page 51

Operating Basics
Page 52

Overview
This section describes the basic concepts of operating the TLS 216 Logic Scope.
Understanding the basic concepts of your logic scope will help you use it much
more effectively.
The first part, At a Glance, quickly shows you how the logic scope controls are
organized and gives some very general operating instructions. It also contains an
overview of all the main menus. This part includes the titles:
H Front Panel Map—Left Side
H Front Panel Map—Right Side
H Rear Panel Map
H Display Map
H To Operate a Menu
H Menu Map
The second part explains the following concepts:
H The triggering system, which establishes conditions for acquiring signals.
Properly set, triggers can convert displays from unstable jumbles or blank
screens into meaningful waveforms. See Triggering on page 2–13.
H The acquisition system, which converts analog data into digital form. See
Acquisition on page 2–19.
H The waveform scaling and positioning system, which changes the dimen-
sions of the waveform display. Scaling waveforms involves increasing or
decreasing their displayed size. Positioning means moving them up, down,
right, or left on the display. See Scaling and Positioning Waveforms on
page 2–23.
H The measurement system, which provides numeric information on the
displayed waveforms. You can use graticule, cursor and automated measurements. See Measurements on page 2–27.
At the end of each topic, To Find More Information points you to sources where
more information can be found.
To explore these topics in more depth and to read about topics not covered in this
section, see Reference. Page 3–1 lists the topics covered.
TLS 216 User Manual
2–1
Page 53

Overview
2–2
TLS 216 User Manual
Page 54

At a Glance
The At a Glance section contains illustrations of the display, the front and rear
panels, and the menu system. These illustrations will help you understand and
operate the logic scope. This section also contains a visual guide to using the
menu system.
Front Panel Map — Left Side
Side Menu Buttons,
page 2–7
ON/STBY Switch,
page 1–3
TLS 216 User Manual
CLEAR MENU Removes
Menus from the Display
Main Menu Buttons,
page 2–7
2–3
Page 55

At a Glance
Front Panel Map — Right Side
Measuring Waveforms Automatically
Measuring Waveforms with Cursors,
Saving and Recalling
Waveforms,
page 3–109
Managing the File System,
page 3–27
Saving and Recalling Setups,
page 3–105
Autosetting the Logic Scope,
page 3–13
Viewing Help, page 3–171
Viewing Status, page 3–173
page 3–81
page 3–67
Printing a Hardcopy,
page 3–87
Managing the File System,
page 3–27
Customizing Display Colors,
page 3–41
Customizing the Display,
page 3–35
Communicating with Remote
Instruments, page 3–31
Choosing an Acquisition Mode,
page 3–17
Measuring Waveforms
with Cursors,
page 3–81
Selecting Groups and
Channels,
page 3–117
Adjusting the Vertical Setup,
page 3–7
Zooming on Waveforms,
page 3–175
Adjusting the Horizontal Setup,
page 3–3
Triggering on Signals, page 3–159
Triggering After Delay, page 3–121
Triggering on Edges, page 3–127
Triggering on Patterns, page 3–131
Triggering on a Sequence, page 3–147
Triggering on Pulses, page 3–141
Doing a Probe Cal,
page 3–49
2–4
TLS 216 User Manual
Page 56

Rear Panel Map
At a Glance
Principal Power Switch,
page 1–3
Fuse,
page 1–3
Serial Number
Centronics
Connector
RS-232
Connector
Power Connector,
page 1–3
VGA Output
GPIB Connector
page 3–31
Auxiliary Trigger Input, Main
Trigger and Delayed Trigger
Outputs (TTL)
Security
Bracket
TLS 216 User Manual
2–5
Page 57

At a Glance
Display Map
The waveform
record icon,
page 2–23
Trigger level on waveform (bar
may be replaced by an arrow at
right side of screen)
page 3–161
The acquisition status,
page 3–17
Shows what part of the waveform
record is displayed, page 3–3
Trigger position (T),
page 3–159
Indicates position of
vertical bar cursors in
the waveform record,
page 3–7
The value entered with the
general purpose knob or keypad
Displayed when the general
purpose knob is set to make
coarse adjustments
Cursor
measurements,
page 3–81
Group indicator ,
page 3–23
Group readout by number,
last and first channel, and
scale or display mode,
page 3–56
2–6
The side menu
with choices of
specific actions
Time base type,
horizontal scale,
and trigger type,
page 3–3 and 3–159
The main menu with
choices of major actions
TLS 216 User Manual
Page 58

To Operate a Menu
1. Press front-panel menu button.
(Press SHIFT first if button label is blue.)
At a Glance
2. Press one of these buttons
to select from main menu.
3. Press one of these buttons to select
from side menu (if displayed).
4. If side menu item has an adjustable value
(shown in reverse video), adjust it with the
general purpose knob or keypad.
TLS 216 User Manual
2–7
Page 59

At a Glance
To Operate a Pop-Up Menu
Press
to display pop-ups.
Press it again
to advance to the next selection.
A pop-up selection changes the other
main menu titles.
Press here to
remove menus from
screen.
2–8
TLS 216 User Manual
Page 60

Menu Map
Acquire Menu
(see page 3–17)
Application Menu
(see the Programmer
manual for more details)
Cursor Menu
(see page 3–81)
At a Glance
To bring up these menus:Press these buttons:
Delayed Trigger Menu – Edge
(see pages 3–121 and 3–127)
Delayed Trigger Menu – Pulse
(see pages 3–121 and 3–141)
Delayed Trigger Menu – Pattern
(see pages 3–121 and 3–131)
Delayed Trigger Menu – Sequence
(see pages 3–121 and 3–147)
TLS 216 User Manual
2–9
Page 61

At a Glance
Delayed Trigger Menu – State
(see pages 3–121 and 3–165)
Display Menu – Settings Color
(see page 3–41)
Display Menu – Settings Display
(see page 3–35)
To bring up these menus:Press these buttons:
Group Menu
(see pages 3–23 and 3–55)
Hardcopy Menu
(see page 3–87)
Horizontal Menu
(see page 3–3)
Main Trigger Menu – Edge
(see page 3–127)
Main Trigger Menu – Pulse
(see page 3–141)
2–10
TLS 216 User Manual
Page 62

Main Trigger Menu – Pattern
(see page 3–131)
Main Trigger Menu – State
(see page 3–165)
Main Trigger Menu – Sequence
(see page 3–147)
At a Glance
To bring up these menus:Press these buttons:
Measure Menu (see
page 3–67)
More Menu
(see page 3–117)
Save/Recall Setup Menu
(see page 3–105)
Save/Recall Waveform Menu
(see page 3–109)
Status Menu
(see page 3–173)
TLS 216 User Manual
2–11
Page 63

At a Glance
Utility Menu – Calibration
(see page 3–53)
Utility Menu – Config
(see pages 3–108 and 3–89)
Utility Menu – Diagnostics
see the Service manual)
(
To bring up these menus:Press these buttons:
Utility Menu – I/O – GPIB
(see page 3–31)
Utility Menu – I/O – RS232
(see page 3–31)
Zoom Menu
(see page 3–175)
2–12
TLS 216 User Manual
Page 64

Triggering
This section describes the edge trigger of the main trigger system and explores,
in a general sense, the topic of triggering. The TLS 216 Logic Scope also has
pulse, pattern, state, and sequence triggers for triggering on digital and pulse
waveforms, and a delayed trigger system. Section 3 describes these trigger types
and the delayed trigger system.
Triggers determine when the logic scope starts acquiring and displaying a
waveform. They help create meaningful waveforms from unstable jumbles or
blank screens. (See Figure 2-1.)
Triggered Waveform Untriggered Waveforms
Figure 2-1: Triggered Versus Untriggered Displays
Trigger Sources
The trigger event establishes the time-zero point in the waveform record, and all
points in the record are located in time with respect to that point. The logic scope
continuously acquires and retains enough sample points to fill the pretrigger
portion of the waveform record (that part of the waveform that is displayed
before, or to the left of, the triggering event on screen).
When a trigger event occurs, the logic scope starts acquiring samples to build the
posttrigger portion of the waveform record (displayed after, or to the right of, the
trigger event). Once a trigger is recognized, the logic scope will not accept
another trigger until the acquisition is complete.
The basic trigger is the edge trigger. An edge trigger event occurs when the
trigger source (the signal that the trigger circuit monitors) passes through a
specified voltage level (the trigger threshold) in a specified direction (the trigger
slope).
You can derive your trigger from various sources. The logic scope DC couples
all source signals to the triggering circuit.
TLS 216 User Manual
2–13
Page 65

Triggering
Types
Input channels provide the most commonly used trigger source. The trigger
source can be any one of the 16 input channels. The channel you select as a
trigger source will function whether it is displayed or not, or whether it belongs
to a waveform group or not.
AC Line Voltage is the trigger source most often used when you are looking at
signals related to the power line frequency. Examples include devices such as
lighting equipment and power supplies. Because the logic scope generates the
trigger, you do not have to input a signal to create it.
Auxiliary Trigger is the trigger source most often used in digital design and
repair. For example, you might want to trigger with an external clock or with a
signal from another part of the circuit. To use the auxiliary trigger, connect the
external triggering signal to the Auxiliary Trigger input connector on the logic
scope rear panel.
The logic scope includes five standard trigger types in both the main and the
delay trigger systems. All five types are described in individual articles found in
the Section 3 Reference. A brief definition of each type follows:
Edge is the “basic” or general-purpose trigger. You can use it with both analog
and digital test circuits. An edge trigger event occurs when the trigger source (the
signal the trigger circuit is monitoring) passes through a specified voltage level
in the specified direction (the trigger slope).
Pulse is a special-purpose trigger primarily used on digital circuits. Two classes
of pulse triggers are width and glitch. Triggering occurs when time constraints
you specify on pulse or glitch width are satisfied.
Pattern is a special-purpose trigger primarily used on digital logic circuits. You
select Boolean operators and define logic levels for the trigger sources. Triggering occurs when the Boolean conditions are satisfied relative to a time limit or
time range you specify.
State is a special-purpose trigger primarily used on digital logic circuits. Like
pattern trigger, you select Boolean operators and define logic levels for trigger
sources. Triggering occurs when the Boolean conditions are satisfied at the active
edge of the clock.
Sequence is a special-purpose trigger primarily used on digital logic circuits.
Like pattern trigger, you select Boolean operators and define logic levels for
trigger sources, but you do so for two events, a start event and a stop event.
Triggering occurs when the Boolean conditions are first satisfied, for the start
event and then for the end event, relative to a time limit or time range you
specify.
2–14
TLS 216 User Manual
Page 66

Trigger Modes
Triggering
The trigger mode determines how the logic scope behaves in the absence of a
trigger event. The logic scope provides two different trigger modes, normal and
automatic.
Normal trigger mode allows the logic scope to acquire a waveform only when it
is triggered. If no trigger occurs, the logic scope will not acquire a waveform.
(You can push FORCE TRIGGER to force the logic scope to make a single
acquisition.)
Automatic trigger mode (auto mode) allows the logic scope to acquire a
waveform even if a trigger does not occur. Auto mode uses a timer that starts
after a trigger event occurs. If another trigger event is not detected before the
timer times out, the logic scope forces a trigger anyway. The length of time it
waits for a trigger event depends on the time base setting.
Be aware that auto mode, when forcing triggers in the absence of valid triggering
events, does not sync the waveform on the display. In other words, successive
acquisitions will not be triggered at the same point on the waveform; therefore,
the waveform will appear to roll across the screen. Of course, if valid triggers
occur the display will become stable on screen.
Holdoff
Since auto mode will force a trigger in the absence of one, you can use it to
monitor signals the amplitude level of which is your only concern. Although the
unsynced waveform may “roll” across the display, it will not “freeze” as it would
in normal trigger mode. Monitoring of a power supply output is an example of
such an application.
When a trigger event is recognized, the logic scope disables the trigger system
until acquisition is complete. In addition, the trigger system remains disabled
during the holdoff period that follows each acquisition. You can set holdoff to
help ensure a stable display.
For example, the trigger signal might be a complex waveform with many
possible trigger points. Though the waveform is repetitive, a simple trigger
might get you a series of patterns on the screen instead of the same pattern each
time.
Digital pulse trains are good examples (see Figure 2-2). Each pulse looks like
any other, so many possible trigger points exist. Not all of these will result in the
same display. The holdoff period allows the logic scope to trigger on the correct
edge, resulting in a stable display.
TLS 216 User Manual
2–15
Page 67
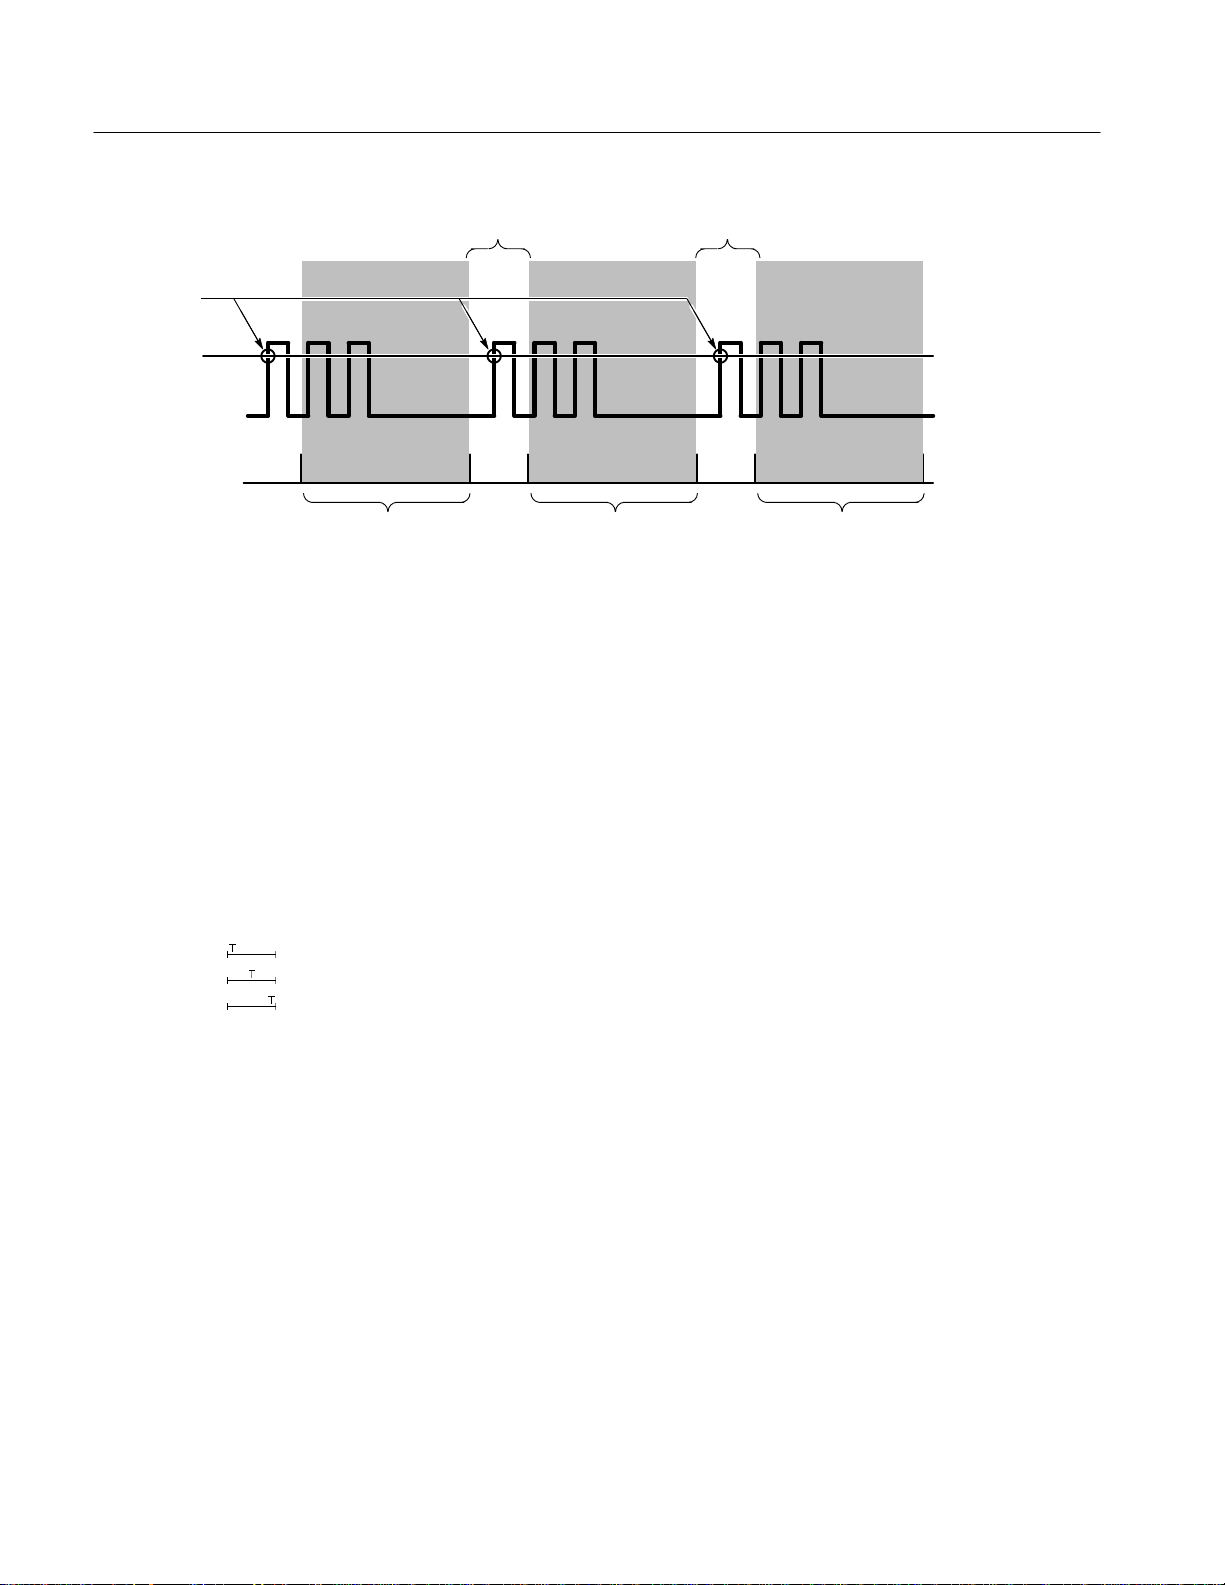
Triggering
Trigger Points
Trigger Level
Acquisition Interval Acquisition Interval
Holdoff Holdoff
Triggers are Not Recognized During Holdoff Time
Figure 2-2: Trigger Holdoff Time Ensures Valid Triggering
Holdoff is settable from 0% (minimum holdoff available) to 100% (maximum
available). To see how to set holdoff, see Set Mode & Holdoff on page 3–129.
The minimum and maximum holdoff varies with the horizontal scale. See the
characteristic called Holdoff, Variable, Main Trigger in the TLS Performance
Verification and Specifications shipped with the logic scope for the typical
minimum and maximum values.
T rigger Position
The adjustable trigger position defines where on the waveform record the trigger
occurs. It lets you properly align and measure data within records. The part of
the record that occurs before the trigger is the pretrigger portion. The part that
occurs after the trigger is the posttrigger portion.
To help you visualize the trigger position setting, the top part of the display has
an icon indicating where the trigger occurs in the waveform record. You use the
Horizontal menu to select what percentage of the waveform record will contain
pretrigger information.
Holdoff
2–16
Many users find displaying pretrigger information a valuable troubleshooting
technique. For example, when trying to find the cause of an unwanted glitch in
your test circuit, trigger on the glitch and make the pretrigger period large
enough to capture the data before the glitch. By analyzing what happened before
the glitch, you may uncover clues about its source.
TLS 216 User Manual
Page 68

Slope and Threshold
Triggering
The slope control determines whether the logic scope finds the trigger point on
the rising or the falling edge of a signal. (See Figure 2-3.)
You set trigger slope by selecting Slope in the Main Trigger menu and then
selecting from the rising or falling slope icons in the side menu that appears.
The threshold control determines where on that edge the trigger point occurs.
(See Figure 2-3.)
Positive-Going Edge Negative-Going Edge
Trigger Threshold Can
be Adjusted Vertically
Figure 2-3: Slope and Level Controls Help Define the Trigger
The logic scope lets you set the main trigger level with the trigger THRESHOLD
knob (pulse and edge triggers only).
Delayed Trigger
As mentioned earlier in this section, there is also a delayed trigger system that
provides all the functions of the main trigger. When using the delayed time base,
you can also delay the acquisition of a waveform for a user-specified time or a
user-specified number of delayed trigger events (or both) after a main trigger
event.
To Find More Information
See Triggering After Delay, on page 3–121, to learn about taking acquisition that
are delayed by time or events from the main trigger event.
Trigger Slope Can be Positive or Negative
TLS 216 User Manual
See Trigger on Edges, on page 3–127, to learn how to trigger on the edge of a
input signal.
See Triggering on Patterns, on page 3–131, to learn how to trigger on an input
pattern of logic levels you define.
2–17
Page 69

Triggering
See Triggering on Pulses, on page 3–141, to learn how to trigger on or ignore
glitches and pulses based on their duration.
See Triggering on a Sequence, on page 3–147, to learn how to trigger on a
sequence of two patterns of logic levels.
See Triggering on Signals, on page 3–159, to learn about the trigger controls and
features that are common to several or all five trigger types.
See Triggering on States, on page 3–165, to learn how to trigger on an input
pattern of logic levels that are TRUE at the active edge of a clock signal.
2–18
TLS 216 User Manual
Page 70

Acquisition
Acquisition is the process of sampling the analog input signal, converting it into
digital data, and assembling it into a waveform record. The TLS 216 Logic
Scope creates a digital representation of the input signal by sampling the voltage
level of the signal at regular time intervals. (See Figure 2-4.)
Sampling and Digitizing
+5.0 V
0 V 0 V 0 V 0 V
–5.0 V
Input Signal Sampled Points Digital Values
Figure 2-4: Acquisition: Input Analog Signal, Sample, and Digitize
The sampled points are stored in memory along with corresponding timing
information. You can use this digital representation of the signal for display,
measurements, or further processing.
You specify how the logic scope acquires data points and assembles them into a
waveform record.
The trigger point marks time zero in a waveform record. All record points before
the trigger event make up the pretrigger portion of the waveform record. Every
record point after the trigger event is part of the posttrigger portion. All timing
measurements in the waveform record are made relative to the trigger event.
+5.0 V
–5.0 V
Record Length
TLS 216 User Manual
Each time the logic scope takes a sample, it digitizes it to produce a numeric
representation of the signal.
The logic scope creates a waveform record containing a user-specified number of
data points. Each record point represents a certain voltage level that occurs a
determined amount of time from the trigger event.
The record length determines the number of points that make up the waveform
record. Use the record length in the Horizontal menu. The logic scope provides
record lengths of 500, 1000, and 2000 points.
2–19
Page 71

Acquisition
Sampling
Interpolation
Sampling is the process of converting the analog input signal to digital data for
display and processing. (See Figure 2-5.)
Record Points
Sampling Rate
Figure 2-5: Real-Time Sampling
Two factors that affect real-time sampling are interleaving and interpolation.
Turning the Horizontal SCALE knob clockwise causes the scope to assign
shorter time periods to the waveform record. The smaller the time period gets,
the faster the logic scope needs to acquire record points to fill up the record.
If you turn the Horizontal SCALE knob to a point that the time base is faster
than 25 ns, the logic scope will not acquire enough samples for a complete
waveform record. When that happens, the logic scope uses a process called
interpolation to create the intervening points in the waveform record. There are
two options for interpolation: linear or sin(x)/x.
Linear interpolation computes record points between the samples acquired by
using a straight line fit. It assumes all the interpolated points fall in their
appropriate point in time on that straight line. Linear interpolation is useful for
many waveforms such as pulse trains.
Sin(x)/x interpolation computes record points using a curve fit between the actual
values acquired. It assumes all the interpolated points fall along that curve. That
is particularly useful when acquiring more rounded waveforms such as sine
waves. Actually, it is appropriate for general use, although it may introduce some
overshoot or undershoot in signals with fast rise times.
NOTE. When using either type of interpolation, you may wish to set the display
style so that the real samples are displayed intensified relative to the interpolated
samples. The instructions under To Choose a Display Style on page 3–36
explain how to turn on intensified samples.
2–20
TLS 216 User Manual
Page 72

Acquisition Modes
Bandwidth
Acquisition
The logic scope supports three acquisition modes.
H Sample
H Envelope
H Average
Sample acquisition mode, which acquires in real time, is the mode most
commonly used. You can read about Sample and the other acquisition modes in
Choosing an Acquisition Mode, beginning on page 3–17.
Bandwidth refers to the range of frequencies that the logic scope can acquire and
display accurately (that is, with less than 3 dB attenuation).
You can set different bandwidths with the logic scope. Lower bandwidth settings
let you eliminate the higher frequency components of a signal. The TLS 216
offers Full (500 MHz) and 20 MHz bandwidth settings.
Coupling
The TLS 216 Logic Scope provides DC coupling for all input channels. The
input resistance of each channel is 1 MW at the probe tip or 50 W with the
optional coaxial adapter.
To Find More Information
See Choosing an Acquisition Mode, on page 3–17, to learn how to select the best
acquisition mode to suit your measurement task.
TLS 216 User Manual
2–21
Page 73

Acquisition
2–22
TLS 216 User Manual
Page 74

Scaling and Positioning W aveforms
Scaling and positioning waveforms means increasing or decreasing their
displayed size and moving them up, down, right, and left on the display. Since
the TLS 216 Logic Scope controls groups of waveforms, it scales and positions
all waveforms in the group at the same time. This section discusses how to scale
and position waveform groups in Analog mode.
Two display icons, the group indicator and the record view, help you quickly see
the position of the waveform in the display. (See Figure 2-6.) The ground
reference icon points to the ground level for all waveforms in the group (display
mode must be set to analog) when group offset is set to 0 V. When you change
vertical scale, each waveform in the group contracts or expands around this level.
The record view, at the top of the display, indicates where the trigger occurs and
what part of the waveform record is displayed.
Record View
Group Reference Icon
Original Position Positioned Vertically Positioned Horizontally
Original Scale Scaled Horizontally
Figure 2-6: Scaling and Positioning
Scaled Vertically
TLS 216 User Manual
2–23
Page 75

Scaling and Positioning Waveforms
Vertical System
You can adjust the vertical position of the selected waveform group by moving it
up or down on the display. For example, when trying to compare two groups of
waveforms, you can put one above another and compare them, or you can
overlay them on top of each other. To move the selected waveform group, turn
the Vertical POSITION knob.
Besides using the position knob, you can set the vertical position to an exact
number. You do that with the Position selection in the Vertical menu and the
general purpose knob and/or the keypad.
Scale
Offset
Horizontal System
You can also alter the vertical scale. The logic scope shows the scale (in volts per
division) for each active group of channels toward the bottom left of the display.
As you turn the vertical SCALE knob clockwise, the scale decreases. The
decreased scale results in higher resolution because you see a smaller part of
each waveform. As you turn the knob counterclockwise, the scale increases
allowing you to see more of each waveform but with lower resolution.
Vertical offset changes where the group reference indicator is shown with respect
to the graticule. Offset adds a voltage to the reference indicator without changing
the scale. That feature allows you to move the waveform group up and down
over a large area without decreasing the resolution.
Offset is useful in cases where a waveform has a DC bias. One example is
looking at a small ripple on a power supply output. You may be trying to look at
a 100 mV ripple on top of a 12 V supply. The range available with offset can
prove valuable as you try to move and scale the ripple to meet your needs.
Adjusting the horizontal position of waveform groups moves them right or left
on the display. That is useful when the record length of a waveform is so large
(greater than 500 points) that the logic scope cannot display the entire waveform
record at one time.
2–24
You can also adjust the scale of the waveform. For example, you might want to
see just one cycle of a waveform to measure the overshoot on its rising edge.
You adjust the horizontal scale of the displayed waveform records using the
horizontal SCALE knob and the horizontal position using the horizontal
POSITION knob.
The logic scope shows the actual scale in the bottom right of the display. The
scale readout shows the time per division used. Since all groups containing live
TLS 216 User Manual
Page 76

Scaling and Positioning Waveforms
(as opposed to saved reference) waveforms use the same time base, the logic
scope only displays one value for all the active channels.
Aliasing
Actual High-Frequency Waveform
Apparent Low-Frequency
Waveform Due to Aliasing
Sampled Points
When aliasing happens, you see a waveform with a frequency lower than the
actual waveform being input or a waveform that is not stable even though the
light next to TRIG’D is lit. Aliasing occurs because the logic scope cannot
sample the signal fast enough to construct an accurate waveform record
(Figure 2-7).
Figure 2-7: Aliasing
One simple way to check for aliasing is to slowly change the horizontal scale
(time per division setting). If the shape of the displayed waveform changes
drastically, you may have aliasing.
Delayed Time Base
TLS 216 User Manual
In order to represent a signal accurately and avoid aliasing, you must sample the
signal more than twice as fast as the highest frequency component. For example,
a signal with frequency components of 500 MHz would need to be sampled at a
rate faster than 1 Gigasamples/second.
There are various ways to prevent aliasing. Try adjusting the horizontal scale, or
simply press the AUTOSET button. You can also counteract some aliasing by
changing the acquisition mode in the Acquisition menu. For example, if you are
using the sample mode and suspect aliasing, try changing to envelope mode.
Since the envelope mode searches for multiple acquisitions with the highest and
lowest values, it can detect faster signal components over time.
You can set a main time base and a delayed time base. Each time base has its
own trigger. There are two types of delayed time base acquisitions, with each
based on its triggering relationship to the main time base. These are delayed runs
after main and delay triggerable (after time, events, or both) acquisitions.
The delayed time base is useful in catching events that follow other events. See
Triggering on page 2–13 for more information on the delayed trigger.
2–25
Page 77

Scaling and Positioning Waveforms
Zoom
You can use zoom to see more detail without changing the acquired signal. When
you use zoom, a portion of the waveform record can be expanded or compressed
on the display, but the record points stay the same. When expanding waveforms
vertically, zoom expands all waveforms in the selected group.
To display the cursor menu, press the ZOOM button. Use zoom when you wish
to temporarily expand a waveform to inspect small feature(s) on that waveform.
For example, to temporarily expand the front corner of a pulse to inspect its
aberrations, use zoom to expand it horizontally and vertically. After you are
finished, you can return to your original horizontal scale setting by pressing one
menu button. (The zoom feature is also handy if you have acquired a waveform
while using the fastest time per division and want to further expand it horizontally.)
Autoset
Autoset lets you quickly obtain a stable waveform display. It automatically
adjusts a wide variety of settings including vertical and horizontal scaling. Other
settings affected include trigger coupling, type, position, slope, mode, and
display intensities. Autosetting the Logic Scope on page 3–13 describes in detail
what autoset does.
To Find More Information
See Autosetting the Logic Scope, on page 3–13 to learn how to execute an
Autoset and the setup defaults it puts into effect.
See Adjusting the Horizontal Setup, on page 3–3.
See Adjusting the Vertical Setup, on page 3–7.
See Choosing a Group Display Mode, on page 3–23, to learn how to vertically
size waveform groups in BusForm and Timing Diagram display modes.
See Triggering After Delay, on page 3–121, to learn how to set up to capture an
event that occurs after another.
See Zooming on Waveforms, on page 3–175, to learn how to magnify on screen
the waveform groups you acquire.
2–26
TLS 216 User Manual
Page 78

Measurements
The TLS 216 Logic Scope not only displays graphs of voltage versus time, it
also can help you measure the displayed information. (See Figure 2-8.)
Measurement Classes
Automated
Measurements
C1 Freq
100 MHz
C1 Period
10 ns
Cursors
Graticule
Cursor
Readouts
D
Figure 2-8: Graticule, Cursor, and Automated Measurements
The logic scope provides three measurement classes. They are: graticules,
cursors, and automated measurements. Each of these classes, or tools, can
measure individual waveforms in any waveform group you select.
Graticule Measurements
TLS 216 User Manual
Graticule measurements provide you with quick, visual estimates. For example,
you might look at a waveform amplitude and say “it is a little more than
100 mV.”
You can perform simple measurements by counting the number of major and
minor graticule divisions involved and multiplying by the scale factor.
For example, if you counted five major vertical graticule divisions between a
minimum and maximum values of a waveform and knew you had a scale factor
of 100 mV/division, then you could easily calculate your peak-to-peak voltage:
5 divisions × 100 mV/division = 500 mV.
2–27
Page 79

Measurements
Cursor Measurements
Cursors are fast and easy-to-understand measurements. You take measurements
by moving the cursors and reading their numeric values from the on screen
readouts, which update as you adjust their positions.
Cursors appear in pairs. One part of the pair is active and the other inactive. You
move the active cursor (the solid line) using the general purpose knob. The
SELECT button lets you select (toggle) which cursor bar is active or inactive.
The inactive cursor is a dashed line on the display.
To display the cursor menu, press the CURSOR button. There are three kinds of
cursors available in that menu:
H Horizontal bar cursors measure vertical parameters (typically volts).
H Vertical bar cursors measure horizontal parameters (typically time or
frequency). They also measure the binary value at the selected cursor for the
selected group of waveforms. (See Measuring Waveforms with Cursors on
page 3–81 for more information on binary cursor measurements.)
H Paired cursors measure both vertical parameters (typically volts) and
horizontal parameters (typically time or frequency).
There are also two modes for cursor operation available in the cursor menu:
independent and tracking. (See Figure 2-9.)
Independent Mode
Only Selected Cursor Moves
Tracking Mode
Figure 2-9: Cursor Modes
Both Cursors Move
in Tandem
2–28
TLS 216 User Manual
Page 80

Measurements
H Independent mode cursors operate as was earlier described; that is, you move
one cursor at a time (the active cursor) using the general purpose knob, and
you use the SELECT button to toggle which cursor bar is active.
H Tracking mode cursors operate in tandem: you move both cursors at the
same time using the general purpose knob. To adjust the solid cursor relative
to the dashed cursor, you push the SELECT button to suspend cursor
tracking and use the general purpose knob to make the adjustment. A second
push toggles the cursors back to tracking.
You can read more detailed information about how to use cursors in Measuring
Waveforms with Cursors, beginning on page 3–81.
Automated Measurements
You make automated measurements merely by pressing a few buttons. The logic
scope does all the calculating for you. Because these measurements use the
waveform record points, they are more accurate than cursor or graticule
measurements.
Press the MEASURE button for the automated measurement menus. These
menus let you make amplitude (typically in volts; sometimes in %), time
(typically in seconds or hertz), and area (in volt-seconds) measurements.
Although the logic scope scales and positions waveforms in groups, it takes
automated measurements on or between individual waveforms. You can select
and display up to four measurements, each taken on an individual waveform
channel, at a time. (Some measurements, such as Setup, Hold, and Skew, are
taken on more than one waveform. See Table 3–3 on page 3–68 for a list of all
the automatic measurements and their definitions.)
You can make automated measurements on the entire waveform record or just on
a specific part. The gating selection in the Measurement menu lets you use the
vertical cursors to limit the measurement to a section of the waveform record.
The snapshot selection in the Measurement menu lets you display almost all of
the measurements at once. You can read about snapshot under To Take a
Snapshot of Measurements on page 3–78.
Automated measurements use readouts to show measurement status. These
readouts are updated as the logic scope acquires new data or if you change
settings.
To Find More Information
See Appendix B: Algorithms, for details on how the logic scope calculates each
automatic measurement.
See Example 3: Automated Measurements, on page 1–23, for a tutorial on
automatic measurements.
TLS 216 User Manual
2–29
Page 81

Measurements
See Measuring Waveforms Automatically, on page 3–67, to learn more detail
about taking automatic measurements.
See Measuring Waveforms with Cursors, on page 3–81, to learn how to take
cursor measurements.
2–30
TLS 216 User Manual
Page 82

Reference
Page 83

Overview
This section contains articles that describe the details of operating the logic
scope. Each article describes an operating task, such as adjusting the vertical
setup or measuring waveforms with cursors. Each article appears in the order
listed below. Use this section to answer specific questions about instrument
operation. The operating tasks include:
H Adjusting the Horizontal Setup
H Adjusting the Vertical Setup
H Autosetting the Logic Scope
H Choosing an Acquisition Mode
H Choosing a Group Display Mode
H Communicating with Remote Instruments
H Customizing the Display
H Customizing the Display Colors
H Doing a Probe Cal
H Doing a Signal Path Compensation
H Grouping Waveforms
H Managing the File System
H Measuring Waveforms Automatically
H Measuring Waveforms with Cursors
H Printing a Hardcopy
H Probing of Circuits
H Saving and Recalling Setups
H Saving and Recalling Waveforms
H Selecting Groups and Channels
H Triggering After Delay
H Triggering on Edges
H Triggering on Patterns
TLS 216 User Manual
3–1
Page 84

Overview
H Triggering on Pulses
H Triggering on a Sequence
H Triggering on Signals
H Triggering on States
H Viewing Help
H Viewing Status
H Zooming on Waveforms
NOTE. Many of these operating tasks list steps you perform to accomplish the
task. You should read Conventions in the Preface to this manual before reading
about these tasks.
3–2
TLS 216 User Manual
Page 85

Adjusting the Horizontal Setup
The TLS 216 Logic Scope lets you scale (change the time base) and position
waveform groups horizontally on the screen. To perform these basic operations,
you use the horizontal knobs and menu.
This article describes how to check the current horizontal setup and how to use
the horizontal controls to scale, position, select a main or delayed time base, set
the trigger position, set the group record length, and make other horizontal
settings.
To Scale and Position
You can adjust the horizontal scale and position of waveform groups in the
display from the front panel without accessing menus.
To horizontally scale (size) any waveform group displayed, turn the Horizontal
SCALE knob. (See Figure 3-1).
Changing the horizontal scale changes the time base, or time per division setting.
By changing the horizontal scale, you can horizontally spread the particular
portion of the waveform on which you wish to focus over more of the display
screen.
To horizontally position any waveform group displayed, turn the Horizontal
POSITION knob. (See Figure 3-1).
Figure 3-1: Horizontal Controls
TLS 216 User Manual
3–3
Page 86

Adjusting the Horizontal Setup
To adjust the horizontal position more quickly, press the SHIFT button. When
the label above the shift button lights and the display reads Coarse Knobs in the
upper right corner, the Horizontal POSITION knob speeds up significantly.
By adjusting the horizontal position, you can move the group right or left to see
different portions of it. For those waveform groups with record lengths longer
than the display, the Horizontal POSITION knob can bring any off-screen
portion on to the screen for viewing.
When you use either the Horizontal SCALE or POSITION knobs, you will affect
all the waveform records in all groups displayed, including those that have their
display mode set to off.
To Check Horizontal Settings
To quickly determine the horizontal scale, check the Time Base Readout at the
lower right corner of the display. It shows the time/division settings and the time
base — main (M), delayed (D), or both (M and D). (See Figure 3-2).
Record View
Trigger Point Indicator
Time Base Readout
To quickly determine the size and location of the waveform record, check the
Record View at the top of the display. The square bracketed area of this readout
represents the display. The Record View also shows the location of the trigger
point relative to the display. (See Figure 3-2.) (It also shows cursor location if
cursors are turned on.)
3–4
Figure 3-2: Record View and Time Base Readout
TLS 216 User Manual
Page 87

To Set Up from Menus
Adjusting the Horizontal Setup
To check on the overall horizontal setup, press the SHIFT ➞ STATUS ➞
System (main) ➞ System (side).
Use the horizontal menu to select either a main or delayed time base for viewing
acquisitions, to set the acquisition record length, and to set the trigger position in
the acquisition. You can also change horizontal position or scale from the
horizontal menu.
Choose the Main or
Delayed Time Base
Set the Trigger Position
Set the Record Length
and Fit To Screen
To select between the Main and Delayed views of the time base, press HORIZONTAL MENU ➞ Time Base (main) ➞ Main Only, Intensified, or Delayed
Only (side).
By pressing Intensified, you display a colored zone that shows where the delayed
trigger record length could occur relative to the main trigger. The start of the
intensified zone corresponds to the possible start point of the delayed trigger. The
end of the zone corresponds to the end of the waveform record.
You also can select Delayed Runs After Main or Delayed Triggerable. For more
information on how to use the these two menu items, see Triggering After Delay
on page 3–121.
To define how much of the record will be pretrigger and how much will be
posttrigger information,press HORIZONTAL MENU ➞ Trigger Position
(main) ➞ Set to 20%, Set to 50%, or Set to 80% (side), or press Pretrigger
(side) and use the general purpose knob or the keypad to set the amount of
pretrigger.
To set the waveform record length, press HORIZONTAL MENU ➞ Record
Length (main). Choose among the various record length choices appearing in
the side menu.
Set the Horizontal Scale
TLS 216 User Manual
To fit an acquired waveform to the visible screen, press HORIZONTAL MENU
➞ Record Length (main). Then toggle Fit to Screen to ON from the side menu.
To turn off this feature, toggle Fit to Screen to OFF.
Using Fit to Screen is similar to using Zoom mode and changing the Horizontal
Scale setting until the waveform fits the screen.
To change the horizontal scale (time per division) numerically in the menu
instead of using the Horizontal SCALE knob, press HORIZONTAL MENU ➞
Horiz Scale (main) ➞ Main Scale or Delayed Scale (side), and use the keypad
or the general purpose knob to change the scale values.
3–5
Page 88

Adjusting the Horizontal Setup
Set the Horizontal
Position
To set the horizontal position to specific values in the menu instead of using the
Horizontal POSITION knob, press HORIZONTAL MENU ➞ Horiz Pos
(main) ➞ Set to 10%, Set to 50% or Set to 90% (side). The percent you set
determines how much of the waveform will be displayed to the left of the display
center.
You can also control whether changing the horizontal position setting affects all
displayed waveforms, just the live waveforms, or only the selected waveform
group. The Horizontal Lock setting in the Zoom menu determines which
waveforms the horizontal position knob adjusts whether zoom is on or not.
Specifically, it acts as follows:
Group — only the waveform group currently selected can be zoomed and
positioned horizontally
Live — all groups except reference groups can be zoomed and positioned
horizontally at the same time. If a reference group is selected, only that reference
group will be positioned.
All — all groups including reference groups can be zoomed and positioned
horizontally at the same time
See Zooming on Waveforms, on page 3–175 for the steps to set the horizontal
lock feature.
To Find More Information
See Scaling and Positioning Waveforms, on page 2–23.
See Triggering After Delay, on page 3–121.
See Zooming on Waveforms, on page 3–175.
3–6
TLS 216 User Manual
Page 89

Adjusting the Vertical Setup
The TLS 216 Logic Scope allows you to scale (change the volts/division
setting), position, and otherwise control waveform groups vertically on the
screen. To perform these basic operations, you use the vertical knobs and the
Group menu.
This article describes how to check the current vertical setup and how to use the
vertical controls to scale, position, offset, and set the bandwidth limit of any
waveform group you select. (See Selecting a Group and Channel, on page 3–117
to learn how to select a group.)
To Understand the Vertical Controls
To effectively use the vertical controls, consider how they operate with regard to
the group display mode:
H The vertical position, bandwidth, and offset controls operate directly on the
selected group regardless of its display mode: Analog, BusForm, or Timing
Diagram.
Clipping
Vertical Scaling vs.
Display Mode
H A group displayed in Analog mode changes vertical size on screen directly
with the Vertical Scale knob. The Vertical Scale knob adjusts the vertical
scale of the acquisition hardware regardless of the group display mode.
H A group displayed in either BusForm or Timing Diagram mode has its
vertical display size set independently of the vertical scale. You set it directly
in divisions of difference between the logic HIGH and LOW values these
two modes display.
Vertical scale settings that result in input signal levels that drive the acquisition
hardware beyond +/–five divisions of its ground reference level (center screen,
with vertical position and offset set to zero) become clipped. Clipped waveform
groups cause the notice “Clipping” to appear above the Vertical Readout, in the
lower left corner of the display. In such a case, adjust the vertical scale (or offset)
until the notice disappears.
Just because the vertical scale setting does not directly control the size of
BusForm and Timing Diagram groups, does not mean you should ignore it.
Groups with waveforms clipped in Analog mode are clipped when delivered for
comparison against the display threshold levels in BusForm and Timing Diagram
modes. Clipped input signals may compare incorrectly and therefore result in an
incorrect digital representation of the input signals. (See Choosing a Group
TLS 216 User Manual
3–7
Page 90

Adjusting the Vertical Setup
Display Mode on page 3–23 for information on BusForm and Timing Diagram
mode groups.)
To Scale and Position Waveform Groups
You can adjust the vertical scale and position of the waveform groups in the
display from the front panel without accessing menus.
To vertically scale the selected waveform group, turn the Vertical SCALE knob.
This knob controls the vertical size of the selected group only if its group display
mode is Analog. (See Figure 3-3.)
Changing the vertical scale changes the volts per division setting. By changing
the vertical scale of a group displayed in analog format, you vertically expand or
contract all waveforms in the group.
To vertically position the selected group, turn the Vertical POSITION knob.
(See Figure 3-3.) This knob controls only the selected group and operates
independently of the display mode.
To adjust the vertical position more quickly, press the SHIFT button. When the
light above the SHIFT button is on and the display says Coarse Knobs in the
upper right corner, the Horizontal POSITION knob speeds up significantly.
Figure 3-3: Vertical Controls
3–8
TLS 216 User Manual
Page 91

NOTE. Vertical positioning is a display function. Changing position simply
moves the ground reference level of a group above or below the zero position
level (center screen). You also can adjust the group position by adjusting the
offset using the Vertical Controls menu (discussed later in this article). See
NOTE on page 3–10.
To Check Vertical Settings
To quickly determine the vertical scale for the selected group, check the Vertical
Readout at the bottom of the display. It lists each group by number and lists the
last and first channel of each group.
If the group display mode is Analog, the readout also shows the group volts/
division setting. If the group display mode is Off, BusForm, or Timing Diagram,
OFF, Bus, or Timing replaces its volts/division readout. (See Figure 3-4.)
Adjusting the Vertical Setup
NOTE. The Vertical Readout varies its display based on the logic scope setup.
See To Check Group Settings on page 3–56 for a complete description of the
Vertical Readout.
To check on overall vertical setup, press SHIFT ➞ STATUS ➞ Waveform
(main) ➞ Groups (side).
To Set Up from the Vertical Controls Menu
To access the Vertical Controls menu, press GROUP MENU ➞ Vertical
Controls (main). (See Figure 3-4.) Use this menu to set vertical offset and
bandwidth (full or limited) of the selected group. You can also change the
vertical position to a specific number of divisions from center screen from this
menu instead of using the Vertical POSITION knob.
Set the Bandwidth
To include or eliminate the higher frequency components, change the bandwidth
of the selected group.
1. Press GROUP MENU ➞ Vertical Controls (main).
2. Toggle Bandwidth (side) to Full or 20 MHz.
Adjust Position
TLS 216 User Manual
To set the vertical position, press GROUP MENU ➞ Vertical Controls
(main) ➞ Position (side) and use the general purpose knob or keypad to set
position in divisions. Press Set to Position 0 divs (side) if you want to reset the
position of the selected group to center screen.
3–9
Page 92

Adjusting the Vertical Setup
Adjust Offset
Group Reference Indicator
of the Selected Group
Group Reference Indicator
of an Unselected Group
Vertical Readout,
Group 1 Selected
To set the vertical offset, press GROUP MENU ➞ Vertical Controls (main) ➞
Offset (side) and use the general purpose knob or keypad. Press Set to Offset to
0 V (side) if you want to reset the offset to zero.
Figure 3-4: Vertical Readout and Vertical Controls Menu
Offset lets you subtract DC bias from the waveform. By subtracting the DC Bias,
you can ignore it and set the vertical scale to properly size the AC components.
For example, you might be trying to measure a small AC ripple on a power
supply output. It may be a 100 mV ripple on top of a 5 V supply. Using offset,
you can offset the DC bias and set the scale to best display the ripple.
NOTE. Unlike vertical position, vertical offset is not a function of the display
system. Changing offset adds an offset voltage to the acquisition system
hardware to compensate for DC bias. Changing position simply adjusts the
display. Positioning cannot compensate for DC bias.
To Find More Information
See Choosing a Group Display Mode, on page 3–23.
See Grouping Waveforms, on page 3–55.
3–10
TLS 216 User Manual
Page 93

Adjusting the Vertical Setup
See Selecting Groups and Channels, on page 3–117.
See Scaling and Positioning Waveforms, on page 2–23.
See Zooming on Waveforms, on page 3–175.
TLS 216 User Manual
3–11
Page 94

Adjusting the Vertical Setup
3–12
TLS 216 User Manual
Page 95

Autosetting the Logic Scope
The TLS 216 Logic Scope can autoset on waveform groups to quickly obtain a
stable display of a waveform of usable size. Once you select a group and its
channel, a single button press sets up the front-panel controls based on the signal
in that channel.
To use Autoset effectively, you need only learn a few rules that Autoset uses to
set up the display. This article describes those rules, describes how to execute an
Autoset, and lists the setup defaults in effect after an Autoset.
To Understand Autoset
To understand Autoset, consider the general procedure the logic scope uses when
autosetting on the selected group and its selected channel.
1. Autoset analyzes the currently selected channel in the currently selected
group (Group 1 through Group 8).
2. Autoset attempts to classify the logic family of the group based on the
minimum and maximum voltage levels it finds for the channel.
3. Autoset then sets the vertical scale, height, position, and offset, and the
display thresholds, Vhigh min and Vlow max, for all groups currently
defined, to match the logic family it classifies for the channel it analyzes.
4. Autoset modifies the vertical scale, height, and position that it sets to
accommodate the total number of channels it required to display.
5. Autoset then sets the display mode for all live groups to Timing Diagram.
6. Autoset sets horizontal scale and trigger threshold level based on the channel
it analyzes.
Consider the rules the logic scope uses when autosetting on the selected group
and its selected channel.
H Autoset only analyzes live groups, not reference groups.
H Autoset displays any reference group on screen at the time it executes;
however, it does not change any of its parameters.
H Autoset does not create new acquisition groups unless all of the live groups,
Group 1 through Group 8, have been deleted. In this case, the logic scope
defines Group 1 to include only Channel 1 and then autosets based on this
channel.
TLS 216 User Manual
3–13
Page 96

Autosetting the Logic Scope
H Autoset displays all the live groups currently defined because, as described
previously, it switches their display modes to Timing Diagram.
NOTE. Autoset may change vertical position in order to position the waveform
group appropriately. It always sets vertical offset based on the selected channel
in the selected group.
To Autoset the Logic Scope
To Autoset on the waveform of your choice, do the following steps to select the
group containing the waveform, select the waveform channel in that group, and
execute Autoset.
1. Press the group selection button (such as GROUP 1) that contains the
channel to make it active.
2. Press GROUP MENU ➞ Group Definition (main) ➞ Selected Channel
(side).
3. Use the keypad to set the selected channel for the selected group.
4. Press AUTOSET
Autoset always uses the selected channel in its selected group, no matter how
many other groups are displayed.
If you use Autoset when none of groups 1 through 8 are displayed (that is, they
have been deleted) the logic scope will create Group 1, define it to include only
Channel 1, and Autoset based on that channel.
NOTE. After Autoset executes, channels other than the selected channel may
appear as flat lines, have vertical and horizontal scale changes, and so on.
These nonselected channels appear as just described because their display
thresholds, vertical amplitude, frequency, and other characteristics differ greatly
from those chosen for the selected channel. This is normal operation.
Because nonselected channels can be improperly vertically scaled, the message
“Clipping” may appear. To tell if it is clipped, examine a channel after
switching the group containing it to Analog display mode. If it is clipped,
increase the volts/division setting.
.
3–14
TLS 216 User Manual
Page 97

Autoset Defaults
Autosetting the Logic Scope
Autoset makes adjustments in these categories of settings: Acquisition, Display,
Horizontal, Trigger, and Vertical. Table 3–1 lists the Autoset defaults.
T able 3–1: Autoset Defaults
Control Changed by Autoset to
Selected Group Currently selected live group; if no group is
defined, Group 1 is created and selected
Selected Channel Currently selected channel in the currently
selected group; if no group is defined, Group 1
is created and Ch 1 is selected
Acquire Mode Sample
Acquire Stop After RUN/STOP button only
Display Style Vectors
Display Intensity — Overall If less than 50%, set to 75%
Display Format YT
Group Display Format Timing Diagram
Group Display Height in Divs (8 – (0.2 × No. of Channels Displayed) divided
by the No. of Channels Displayed
Group Display Thresholds Determined based on the currently selected
channel in the currently selected group
Horizontal Position Centered within the graticule window
Horizontal Scale Determined based on the currently selected
channel in the currently selected group
Horizontal Time Base Main Only
Horizontal Record Length Unchanged
Trigger Position Unchanged
Trigger T ype Edge
Trigger Source Currently selected channel in the currently
selected group
Trigger Level Midpoint of data for the trigger source
Trigger Slope Positive
Trigger Holdoff 0
Vertical Scale Determined based on the peak-peak amplitude
of the currently selected channel in the
currently selected group
Vertical Bandwidth Full
TLS 216 User Manual
3–15
Page 98

Autosetting the Logic Scope
T able 3–1: Autoset Defaults (Cont.)
Control Changed by Autoset to
Vertical Offset Determined based on the currently selected
Zoom Of f
To Find More Information
See Adjusting the Vertical Scale on page 3–7.
See Choosing a Group Display Mode on page 3–23.
See Selecting Groups and Channels on page 3–117.
channel in the currently selected group
3–16
TLS 216 User Manual
Page 99

Choosing an Acquisition Mode
The TLS 216 Logic Scope provides three modes for acquiring signals, digitizing
them, and displaying them as waveforms on screen. To choose from these
modes, you need to understand how each mode acquires and processes the
signals you input to the logic scope.
This article briefly describes each mode: how each acquisition mode operates,
how to check acquisition mode and status, how to choose an acquisition mode,
and how to start and stop acquisitions.
To Understand the Acquisition Modes
To more effectively use the acquisition modes, take the following steps to
become familiar with all three modes the logic scope uses to acquire data:
Sample, Envelope, and Average.
1. Examine Figure 3-5 to get a quick overview of the different modes and lists
the benefits of each. It will help you select the appropriate mode for your
application.
Sample Mode
Envelope Mode
2. Read the following descriptions of how each mode works. Knowing how
each mode works helps you apply them properly to specific applications.
In Sample mode, the logic scope creates a record point by saving the first sample
(of perhaps many) during each acquisition interval. (An acquisition interval is
the time covered by the waveform record divided by the record length.) Sample
mode is the default mode.
Sample mode operates in real time on a single trigger event, provided the logic
scope can acquire enough samples for each trigger event.
Envelope mode allows you to acquire and display a waveform record that shows
the extremes in variation over several acquisitions. You specify the number of
acquisitions over which to accumulate the data. The logic scope saves the highest
and lowest values in two adjacent intervals. Envelope mode gathers peaks over
many trigger events.
After each trigger event, the logic scope acquires data and then compares the
min/max values from the current acquisition with those stored from previous
acquisitions. The final display shows the most extreme values for all the
acquisitions for each point in the waveform record.
TLS 216 User Manual
Envelope mode only operates on multiple acquisitions.
3–17
Page 100

Choosing an Acquisition Mode
Average Mode
Average mode allows you to acquire and display a waveform record that is the
averaged result of several acquisitions. This mode reduces random noise. The
logic scope acquires data after each trigger event using Sample mode. It then
averages the record point from the current acquisition with those stored from
previous acquisitions.
Average mode only operates on multiple acquisitions.
Waveform Drawn on CRTTakes One Acquisition per Trigger Acquisition Mode
Uses first sample in each
interval over
single acquisition
This is the default mode.
Waveform Drawn on CRTTakes a User-Specified Number of Acquisitions per Trigger Acquisition Mode
Acquisition 1 2 3
Uses Sample Mode for Each Acquisition
Multiple Waveform Acquisitions Single Waveform Acquisition
Uses Sample Mode for Each Acquisition
Figure 3-5: How the Acquisition Modes Work
Finds highest and
lowest record points over
many acquisitions
Use to reveal variations in the
signal across time.
Calculates average value for
each record point over many
acquisitions
Use to reduce apparent noise in a
repetitive signal.
3–18
TLS 216 User Manual
 Loading...