

Page 1

WVR6100, WVR7000, and WVR7100
Waveform Rasterizers
Quick Start User Manual
www.tektronix.com
071-1588-04
Page 2

Copyright © Tektronix. All rights reserved. Licensed software products are owned by Tektronix or its subsidiaries or suppliers, and are
protected by na
tional copyright laws and international treaty provisions.
Tektronix prod
previously published material. Specifications and price change privileges reserved.
TEKTRONIX and TEK are registered trademarks of Tektronix, Inc.
ucts are covered by U.S. and foreign patents, issued and pending. Information in this publication supersedes that in all
Contacting Tektronix
Tektronix, Inc.
14200 SW Karl Braun Drive
P.O. Box 500
Beaverton, OR 97077
USA
For product information, sales, service, and technical support:
In North America, call 1-800-833-9200.
Worldwide, visit www.tektronix.com to find contacts in your area.
Page 3

Warranty 2
Tektronix warrants that this product will be free from defects in materials and workmanship for a period of one (1) year from the date of
shipment. If any such product proves defective during this warranty period, Tektronix, at its option, either will repair the defective
product without charge for parts and labor, or will provide a replacement in exchange for the defective product. Parts, modules and
replacement products used by Tektronix for warranty work may be new or reconditioned to like new performance. All replaced
parts, modules and products become the property of Tektronix.
In order to obtain service under this warranty, Customer must notify Tektronix of the defect before the expiration of the warranty period
and make suitable arrangements for the performance of service. Customer shall be responsible for packaging and shipping the
defective product to the service center designated by Tektronix, with shipping charges prepaid. Tektronix shall pay for the return of the
product to Customer if the shipment is to a location within the country in which the Tektronix service center is located. Customer shall
be responsible for paying all shipping charges, duties, taxes, and any other charges for products returned to any other locations.
This warranty shall not apply to any defect, failure or damage caused by improper use or improper or inadequate maintenance and
care. Tektronix shall not be obligated to furnish service under this warranty a) to repair damage resulting from a ttempts by personnel
other than Tektronix representatives to install, repair or service the product; b) to repair damage resulting from improper use or
connection to incompatible equipment; c) to repair any damage or malfunction caused by the use of non-Tektronix supplies; or
d) to service a product that has been modified or integrated with other products when the effect of such modification or integration
increases the time or difficulty of servicing the product.
THIS WARRANTY IS GIVEN BY TEKTRONIX WITH RESPECT TO THE PRODUCT IN LIEU OF ANY OTHER WARRANTIES,
EXPRESS OR IMPLIED. TEKTRONIX AND ITS VENDORS DISCLAIM ANY IMPLIED WARRANTIES OF MERCHANTABILITY OR
FITNESS FOR A PARTICULAR PURPOSE. TEKTRONIX’ RESPONSIBILITY TO REPAIR OR REPLACE DEFECTIVE PRODUCTS
IS THE SOLE AND E XCLU S IVE REMEDY PROVIDED TO THE CUSTOMER FOR BREACH OF THIS WARRANTY. TEKTRONIX
AND ITS VENDORS WILL NOT BE LIABLE FOR ANY INDIRECT, SPECIAL, INCIDENTAL, OR CONSEQUENTIAL DAMAGES
IRRESPECTIVE OF WHETHER TEKTRONIX OR THE VENDOR HAS ADVANCE NOTICE OF THE POSSIBILITY OF SUCH
DAMAGES.
Page 4

Page 5

Table of Contents
General Safety Summary ...... . . . . . .... . . . . . . ... . . . . . . .... . . . . . .... . . . . . . ... . . . . . . .... . . . . . ..... . . . . . .... . . . . . . ... . . . . . . .... . . . . . .... v
Environmental Considerations ....................................................................................................... vii
Preface............................................................................................................................... viii
Key Features ................................................................................................................... viii
Documentation ...................................................................................................................x
Conventions Used in this Manual . . . . ... . . . . . . . ... . . . . . . .... . . . . . . . ... . . . . . . .... . . . . . . ... . . . . . . ..... . . . . . . ... . . . . . . .... . . . . . . ... x
Before Installation ..................................................................................................................... 1
Check Package Contents........................................................................................................ 1
Standard Accessories. . . .... . . . . . . .... . . . . . . .... . . . . . . ... . . . . . . .... . . . . . . .... . . . . . . ... . . . . . . .... . . . . . . .... . . . . . ..... . . . . . . ... . . . . 1
Optional Accessories .. . . . . . . ... . . . . . . ... . . . . . . .... . . . . . .... . . . . . .... . . . . . . ... . . . . . . ... . . . . . . ... . . . . . . .... . . . . . .... . . . . . .... . . . . . 1
Options ........................................................................................................................... 2
Operating Considerations ............................................................................................................. 3
Installation.............................................................................................................................. 4
Rackmount Installation. . ... . . . . . . ... . . . . . . .... . . . . . . .... . . . . . .... . . . . . . ... . . . . . . ... . . . . . . .... . . . . . .... . . . . . . ... . . . . . . ... . . . . . . ...4
Mounting the Slide Tracks....... . . . . . . .... . . . . . . ... . . . . . . ..... . . . . . . .... . . . . . . ... . . . . . . ..... . . . . . . .... . . . . . . ... . . . . . . ..... . 5
Rack Adjustments .......................................................................................................... 6
To Install the Instrument.................................................................................................... 7
To Remove theInstrument................................................................................................. 8
Rack Slide Maintenance....... . . . . . . ... . . . . . . .... . . . . . . .... . . . . . . .... . . . . . .... . . . . . . .... . . . . . . .... . . . . . . ... . . . . . . .... . . . . . . 8
To Connect a Display .. . . . . . . .... . . . . . . ..... . . . . . . .... . . . . . . ..... . . . . . . .... . . . . . . .... . . . . . . . ... . . . . . . .... . . . . . . ..... . . . . . . .... . . . 8
To Connect Power and Powering On/Off. . . . ... . . . . . . . .... . . . . . . .... . . . . . . ... . . . . . . . .... . . . . . . .... . . . . . . ... . . . . . . . .... . . . . . . .... 9
AC Power Requirements . . .... . . . . . . ... . . . . . . ..... . . . . . . ... . . . . . . .... . . . . . . .... . . . . . . .... . . . . . . .... . . . . . . ... . . . . . . ..... . . . . 9
To Install in a Video System ..................................................................................................... 9
To install for monitoring the video bitstream of a serial receiver......................................................... 9
To install monitoring serial digital signals around a routing switcher . . . . . . . ... . . . . . . .... . . . . . .... . . . . . .... . . . . . . ... . . . . . 10
Line Termination........................................................................................................... 10
Compatibility of BNC Center Pins......................................................................................... 11
Connecting to Monitors and Projectors Issues . .... . . . . . . .... . . . . . . .... . . . . . .... . . . . . . .... . . . . . . .... . . . . . . ... . . . . . . .... . . 11
Incoming Inspection............................................................................................................. 11
How to Operate Your Instrument..................................................................................................... 12
Getting Acquainted
To Control the Display ..................................................................................................... 12
To Determine Status At-a-Glance......................................................................................... 14
Status Bar Icons........................................................................................................... 15
Front-Panel Controls . . . . ... . . . . . . ... . . . . . . ... . . . . . .... . . . . . .... . . . . . .... . . . . . .... . . . . . .... . . . . . .... . . . . . .... . . . . . .... . . . . . ... . . . 15
Three Levels of Control ................................................................................................... 15
Scope ofControls.......................................................................................................... 16
Layout and Usage ......................................................................................................... 16
Rear-Panel Controls . . . . ... . . . . . . ... . . . . . . ... . . . . . . ... . . . . . . ... . . . . . . ... . . . . . . ... . . . . . . ... . . . . . . ... . . . . . . ... . . . . . . ... . . . . . .... . . 17
Power Requirements . . . . ..... . . . . . . .... . . . . . . ..... . . . . . . .... . . . . . . ... . . . . . . . .... . . . . . . .... . . . . . . ..... . . . . . . .... . . . . . . ..... 17
Video Input Connectors . . . . . . . ..... . . . . . . .... . . . . . . .... . . . . . . . ... . . . . . . . ... . . . . . . . .... . . . . . . .... . . . . . . ..... . . . . . . .... . . . . . 17
AES A/B Connectors .. . . . . . ..... . . . . . .... . . . . . . ... . . . . . . ... . . . . . . .... . . . . . .... . . . . . . ... . . . . . . ... . . . . . . ... . . . . . . .... . . . . . .. 18
.............................................................................................................. 12
Table of Content
s
WVR6100, WVR7000, and WVR7100 Waveform Rasterizers Quick Start User Manual i
Page 6

Table of Content
How to Time a Studio................................................................................................................. 38
How to Check Chroma/Luma Delay (Lightning Display)............................................................................ 44
How to Check Gamut.................................................................................................................46
How to Monitor the SDI Physical Layer.............................................................................................. 56
How to Use the ARIB Displays....................................................................................................... 73
How to Monitor Audio. . . . . . ... . . . . . .... . . . . . .... . . . . . .... . . . . . ... . . . . . . ... . . . . . . ... . . . . . . ... . . . . . . ... . . . . . .... . . . . . .... . . . . . ... . . . . ... 86
s
Analog Input/Output Connector . ... . . . . . . .... . . . . . . ... . . . . . . ... . . . . . . .... . . . . . . .... . . . . . . ... . . . . . . ... . . . . . . .... . . . . . . ... . . 19
XGA Connector and Pin Out .... . . . . . . . .... . . . . . . . .... . . . . . . ..... . . . . . . .... . . . . . . ..... . . . . . . .... . . . . . . ..... . . . . . . .... . . . . . 21
Remote Connector and Pin Out.... . . . . . . .... . . . . . . .... . . . . . ..... . . . . . . ... . . . . . . .... . . . . . . ... . . . . . . ..... . . . . . . ... . . . . . . ... 22
Ethernet Connector..... . . . . . . . ... . . . . . . . .... . . . . . . .... . . . . . . .... . . . . . . . ... . . . . . . .... . . . . . . ..... . . . . . . .... . . . . . . ... . . . . . . . . 22
To Select a Measurement....................................................................................................... 23
To Set Measurement Parameters .............................................................................................. 24
To Select Among Inputs . .... . . . . . . .... . . . . . . .... . . . . . . ..... . . . . . . ... . . . . . . . ... . . . . . . ..... . . . . . . .... . . . . . . .... . . . . . . .... . . . . . . ... 26
To Set Gain and/or Sweep . .... . . . . . .... . . . . . .... . . . . . . .... . . . . . .... . . . . . .... . . . . . . ... . . . . . . ... . . . . . . ... . . . . . . ... . . . . . . .... . . . . . 27
To Use Presets .................................................................................................................. 28
To Measure Waveforms with Cursors .......................................................................................... 29
To Freeze the Display........................................................................................................... 31
To Set Line Select Mode ........................................................................................................ 33
To Configure Your Instrument................................................................................................... 34
To Use Online Help ............................................................................................................. 35
To Use the Traditional Method...... . . . . . . ..... . . . . . . ... . . . . . . . ... . . . . . . . .... . . . . . . .... . . . . . . .... . . . . . . . ... . . . . . . .... . . . . . . ..... 38
To Use the Timing-Display Method............................................................................................. 39
To Use the Timing Display to Time a Signal to a Reference. . . . . . .... . . . . . . ... . . . . . . .... . . . . . . ... . . . . . . .... . . . . . . .... . . . 40
To Time Multiple Inputs to a Router . . . . . ... . . . . . . .... . . . . . . ... . . . . . . ... . . . . . . .... . . . . . . .... . . . . . . ... . . . . . . .... . . . . . .... . . . . . . .. 41
To Time the Inputs to a Router . . . ..... . . . . . . .... . . . . . . ..... . . . . . . .... . . . . . . ..... . . . . . . .... . . . . . . ..... . . . . . . .... . . . . . . ..... 42
To Set Up for Gamut Checks ................................................................................................... 47
To Check RGB Gamut .......................................................................................................... 48
To Check Composite Gamut.................................................................................................... 50
To Check Luma Gamut ......................................................................................................... 52
To Automate Gamut Checks.................................................................................................... 53
To Adjust Gamut Limits ......................................................................................................... 55
To Configure the Physical Layer Settings...................................................................................... 57
To Take Eye Measurements .................................................................................................... 63
To Take Manual Eye Measurements. . . . . . . .... . . . . . . ... . . . . . . .... . . . . . . .... . . . . . . .... . . . . . . ... . . . . . . .... . . . . . . ... . . . . . . .. 63
To Take Automatic Eye Measurements (Option PHY Only) ............................................................. 67
To Take Jitter Measurements ................................................................................................... 68
To Take Cable Loss Measurements............................................................................................ 71
ARIB Status ..................................................................................................................... 75
ARIB STD-B.39 Display......................................................................................................... 76
ARIB STD-B.37 Display and Status Screens ... . . . . . . .... . . . . . . ... . . . . . . .... . . . . . . .... . . . . . . .... . . . . . . ... . . . . . . .... . . . . . . ... . . 78
ARIB STD-B.35 Display and Status Screens ... . . . . . . .... . . . . . . ... . . . . . . .... . . . . . . .... . . . . . . .... . . . . . . ... . . . . . . .... . . . . . . ... . . 80
ARIB TR-B.23 (1) Display and Status Screens . . .... . . . . . .... . . . . . . ... . . . . . . ... . . . . . . .... . . . . . ..... . . . . . .... . . . . . . ... . . . . . . ... 81
ARIB TR-B.23 (2) Display and Status Screens . . .... . . . . . .... . . . . . . ... . . . . . . ... . . . . . . .... . . . . . ..... . . . . . .... . . . . . . ... . . . . . . ... 83
ARIB TR-B.22 Display and Status Screens.................................................................................... 84
To Configure Audio Inputs ... . . . . . . ... . . . . . . .... . . . . . . .... . . . . . . .... . . . . . . ... . . . . . . .... . . . . . . ... . . . . . . ..... . . . . . . ... . . . . . . .... . . 86
ii WVR6100, WVR7000, and WVR7100 Waveform Rasterizers Quick Start User Manual
Page 7

Table of Content
To Select the Audio Input . . . . . . .... . . . . . . ... . . . . . . . ... . . . . . . .... . . . . . . .... . . . . . . .... . . . . . . ... . . . . . . ..... . . . . . . ... . . . . . . .... . . . . . 88
To Check Audio L
To Check Surround Sound... . . . . . . .... . . . . . . .... . . . . . . .... . . . . . . .... . . . . . . ..... . . . . . . ... . . . . . . . ... . . . . . . . .... . . . . . . .... . . . . . . .. 91
How to M onitor Dolby-Based Surround Sound . . . .... . . . . . . . ... . . . . . . .... . . . . . . .... . . . . . . .... . . . . . . .... . . . . . . .... . . . . . . .... . . . . . . ... 95
To Configure Dol
To Display Dolby Inputs ... . . . . . . ... . . . . . . ... . . . . . . .... . . . . . . ... . . . . . . .... . . . . . ..... . . . . . .... . . . . . . ... . . . . . . .... . . . . . .... . . . . . . 101
To View Dolby Metadata . .... . . . . . . ... . . . . . . . ... . . . . . . .... . . . . . . . ... . . . . . . .... . . . . . . ... . . . . . . ..... . . . . . . ... . . . . . . .... . . . . . . ... 102
Usage Notes................................................................................................................... 103
Basic Listening Modes . .... . . . . . . .... . . . . . . .... . . . . . . .... . . . . . . ... . . . . . . . .... . . . . . . .... . . . . . . ... . . . . . . . .... . . . . . . .... . . . 103
Pro Logic Listening Modes . ... . . . . . . ..... . . . . . . ... . . . . . . .... . . . . . . .... . . . . . . .... . . . . . . .... . . . . . . ... . . . . . . ..... . . . . . . ... . 103
Audio Bar Mappin
How to Monitor Closed Captioning (CC) and Safe Area Compliance ............................................................ 107
To Monitor Closed Captioning ................................................................................................ 107
To Monitor for Sa
How to Use Alarms ................................................................................................................. 113
To Configure Alarms .......................................................................................................... 113
Possible Alarm R
To Monitor Alarms............................................................................................................. 118
Index
evel & Phase. . . . ... . . . . . . .... . . . . . . ... . . . . . . .... . . . . . . .... . . . . . . ... . . . . . . .... . . . . . . ... . . . . . . .... . . . . . . .... . . . 89
by Inputs . ... . . . . . . ... . . . . . . .... . . . . . . .... . . . . . . ... . . . . . . ... . . . . . . .... . . . . . . ... . . . . . . ... . . . . . . .... . . . . . . .... . . . 95
g vs. Dolby E Metadata Program Configuration.................................................... 106
fe Area Compliance ......................................................................................... 111
esponses. . . . . .... . . . . . . ... . . . . . . .... . . . . . . ... . . . . . . .... . . . . . . .... . . . . . . ... . . . . . . .... . . . . . . ... . . . . . . ... 115
s
WVR6100, WVR7000, and WVR7100 Waveform Rasterizers Quick Start User Manual iii
Page 8

Table of Content
s
iv WVR6100, WVR7000, and WVR7100 Waveform Rasterizers Quick Start User Manual
Page 9

General Safety S
ummary
General Safet
Review the following safety precautions to avoid injury and prevent damage to this product or any products connected to it.
To avoid potential hazards, use this product only as specified.
Only qualified personnel should perform service procedures.
While using this product, you may need to access other parts of a larger system. Read the safety sections of the other
component manuals for warnings and cautions related to operating the system.
To Avoid Fire or Personal Injury
Use Proper Power Cord. Use only the power cord specified for this product and certified for the country of use.
Connect and Disconnect Properly. Connect the probe output to the measurement instrument before connecting the
probe to the ci
input. Disconnect the probe input and the probe reference lead from the circuit under test before disconnecting the probe
from the measurement instrument.
Ground the Product. This product is grounded through the grounding conduc tor of the power cord. To avoid electric
shock, the gr
terminals of the product, ensure that the product is properly grounded.
Observe All Terminal Ratings. To avoid fire or shock hazard, observe all ratings and markings on the product. Consult
the product manual for further ratings information before making connections to the product.
rcuit under test. Connect the probe reference lead to the circuit under test before connecting the probe
ounding conductor must be connected to earth ground. Before making c onnections to the input or output
y Summary
Do not apply a potential to any terminal, including the common terminal, that exceeds the maximum rating of that terminal.
Power Disconnect. The power cord disconnects the product from the power source. Do not block the power cord; it
must remain
Do Not Opera
Do Not Opera
qualified service personnel.
accessible to the user at all times.
te Without Covers.
Do not operate this product with covers or panels removed.
te With Suspected Failures.
If you suspect that there is damage to this product, have it inspected by
Avoid Exposed Circuitry. Do not touch exposed connections and components when power is present.
Use Proper Fuse. Use only the fuse type and rating specified for this product.
Do Not Operate in Wet/Damp Conditions.
Do Not Operate in an Explosive Atmosphere.
Keep Product Surfaces Clean and Dry.
Provide Proper Ventilation.
proper ventilation.
Refer to the manual’s installation instructions for details on installing the product so it has
WVR6100, WVR7000, and WVR7100 Waveform Rasterizers Quick Start User Manual v
Page 10
General Safety S
TermsinthisManual
These terms may appear in this manual:
WARNING. Warning statements identify conditions or practices that could result in injury or loss of l ife.
CAUTION. Caution statements identify conditions or practices that could result in damage to this product or other property.
Symbols and Terms on the Product
These terms may appear on the product:
DANGER indicates an injury hazard immediately accessible as you read the marking.
WARNING indicates an injury hazard not immediately accessible as you read the m arking.
CAUTION indicates a hazard to property including the product.
The following symbol(s) may appear on the product:
ummary
vi WVR6100, WVR7000, and WVR7100 Waveform Rasterizers Quick Start User Manual
Page 11

Environmental C
onsiderations
Environmenta
This section provides information about the environmental impact of the product.
Product End-of-Life Handling
Observe the following guidelines when recycling an instrument or component:
Equipment Recycling. Production of this equipment required the extraction and use of natural resources. The
equipment may contain substances that could be harmful to the environment or human health if improperly handled at the
product’s end of life. In order to avoid release of such substances into the environment and to reduce the use of natural
resources, we encourage you to recycle this product in an appropriate system that will ensure that most of the m aterials are
reused or recycled appropriately.
The symbol shown below indicates that this product complies with the European Union’s requirements according to Directive
2002/96/EC on waste electrical and electronic equipment (WEEE). For information about recycling options, check the
Support/Service section of the Tektronix Web site (www.tektronix.com).
l Considerations
Battery Recycling. This product may contain a Nickel Cadmium (NiCd) or lithium ion (Li-ion) rechargeable battery, which
must be recycled or disposed of properly. Please properly dispose of or recycle the battery according to local government
regulatio
ns.
Restriction of Hazardous Substances
This product has been classified as Monitoring and Control equipment, and is outside the scope of the 2002/95/EC RoHS
Directive. This product is known to contain lead, cadmium, mercury, and hexavalent chromium.
WVR6100, WVR7000, and WVR7100 Waveform Rasterizers Quick Start User M anual vii
Page 12

Preface
Preface
This manual describes installation and operation of the WVR6100, WVR7000, and WVR7100 Waveform Rasterizers. These
instruments rasterize serial digital video and composite video signals (depending on installed options) for an XGA display,
providing a new standard of display quality and flexibility. Basic operations and concepts are presented in this manual. For
more detailed information, see the online help on your waveform rasterizer.
NOTE. This manual supports and describes the WVR7100 and WVR6100 rasterizers that were shipped with
System-software version 2 and later. For earlier rasterizers that shipped with version 1 of the audio hardware, you can
upgrade your instruments to the newer software v ersion. However, the new software version only supports the old audio
hardware with the original functionality with which it was shipped. You must upgrade to the new audio hardware to obtain
the new audio capabilities.
Yo u should use this manual with earlier rasterizers only if you have upgraded to version 2 o f the System software, and then
either upgraded to a new audio hardware or have no audio option installed. Otherwise, use the earlier version of the manual
that shipped with your rasterizer.
Key Features
The WVR6100, WVR7000, and WVR7100 use digital processing to ensure accurate, stable, and repeatable measurements,
and to provide a powerful monitoring solution for broadcasting, production, and post-production environments. The W VR7000
and WVR710
The instruments can be ordered with various options that enable additional monitoring capabilities. (See page 2, Options.)
0 base instruments monitor HD SDI inputs only; the WVR6100 base instrument monitors SD SDI inputs only.
Key WVR6100, WVR7000, and WVR7100 features include:
FlexVu, a four-tiled, high-resolution, XGA display that enables you to quickly check the integrity of the signal, can present
four views of the signal simultaneously to monitor many aspects of the signal at the same time.
A menu-driven user interface that requires fewer keystrokes for the most common operations and five instrument Presets
for save an
Support fo
Fully Digi
d quick recall of commonly used con figurations.
r digital and analog applications (the later when equipped with optional composite-analog monitoring).
tal Processing for accurate, repeatable, drift-free operation that surpasses traditional analog designs.
viii WVR6100, WVR7000, and WVR7100 Waveform Rasterizers Quick Start User Manual
Page 13

Measurements and displays that help check performance and solve problems faster, such as:
Traditional waveform displays, both overlay and parade, and Vector display, both traditional and Lightning, with
gain, sweep, an
d magnification controls.
Preface
Gamut monitori
Timing and LTC W
Audio support a
support is available with only the WVR6100 and WVR7100.)
Audio support includes viewing and monitoring of both levels of normal channel pairs or of surround channels and
of phase relationships of normal channel pairs or of a user-specified pairings of channel inputs in a Lissajous
display. Loud
scales are also supported.
Surround Sound display of audio s ignals.
Configurable alarms and error logging.
Exclusive Status screens for content status at a glance.
Support for decode and display of CC standards (EIA 608-Line 21, EIA-608-ANC, and EIA-608 (708), with caption
text and V-chip information overlaid on picture (monitor mode) or in Status, Alarm, or Error screens as appropriate.
Settings for missing (incorrectly inserted) closed captioning.
Support for standard and custom Safe Graticules for Picture displays for monitoring for incorrect placements of graphics,
logos. Two Sa
More ancilla
and EIA608 Extended Data Services (XDS).
ng, including Arrowhead, Diamond, and Split Diamond.
aveform Displays. LTC and VITC time code support.
nd options for viewing and monitoring AES, analog, and embedded audio and Dolby signals. (Dolby
ness measurement, audio control packet coding, and many popular audio scales including BBC
fe Area graticules and Safe Title graticules are supported.
ry data monitoring support, include support for monitoring ancillary data conforming to ARIB standards
Vector display with Composite and Component Compass Rose Graticules.
Verification of the electrical characteristics of the SDI physical layer when equipped with one of the following two options
(WVR6100 and WVR7100 only):
Option Eye. Provides an Eye display, which lets you use the graticule or voltage and time cursors to measure
the waveform
Option PHY. P
of the SDI physical layer.
Jitter thermometers, which provid e two independent measurements of jitter and one of cable loss, and relates the
measurements to defined alarm limits.
Full remote c ontrol for complete installation flexibility.
.
rovides the features of Option EYE and adds a Jitter waveform display and automatic measurements
WVR6100, WVR7000, and WVR7100 Waveform Rasterizers Quick Start User Manual ix
Page 14
Preface
Documentation
Item Purpose Location
Quick Start Use
(this manual)
User Technical R eference In-depth descriptions of
r Manual
Installation and
high-level ove
of instrument operation
instrument operation
rview
Online Help
Specificatio
Performance Verification
Technical Reference
WVR & WFM Series
Management Information
Base (MIB) Reference
Service Manual Optional manual
ns and
In-depth instrument
operation and
Specificatio
procedure for checking
instrument performance
SNMP comm and
reference for remotely
controlling the
instrument
supporting module-level
servicing of the
instrument
UI help
ns and
Conventions Used in this Manual
The follow
ing icons are used throughout this manual.
Sequence
Step
Connect p
ower
Network
XGA
x WVR6100, WVR7000, and WVR7100 Waveform Rasterizers Q uick Start User Manual
Page 15

Before Installa
tion
Before Instal
lation
Check Package Contents
Unpack the instrument, and check that you received all items listed as Standard Accessories. Recommended accessories,
instrument options, and upgrades are also listed in this section. Check the Tektronix Web site (www.tektronix.com) for the
most current information.
Standard Accessories
Documents
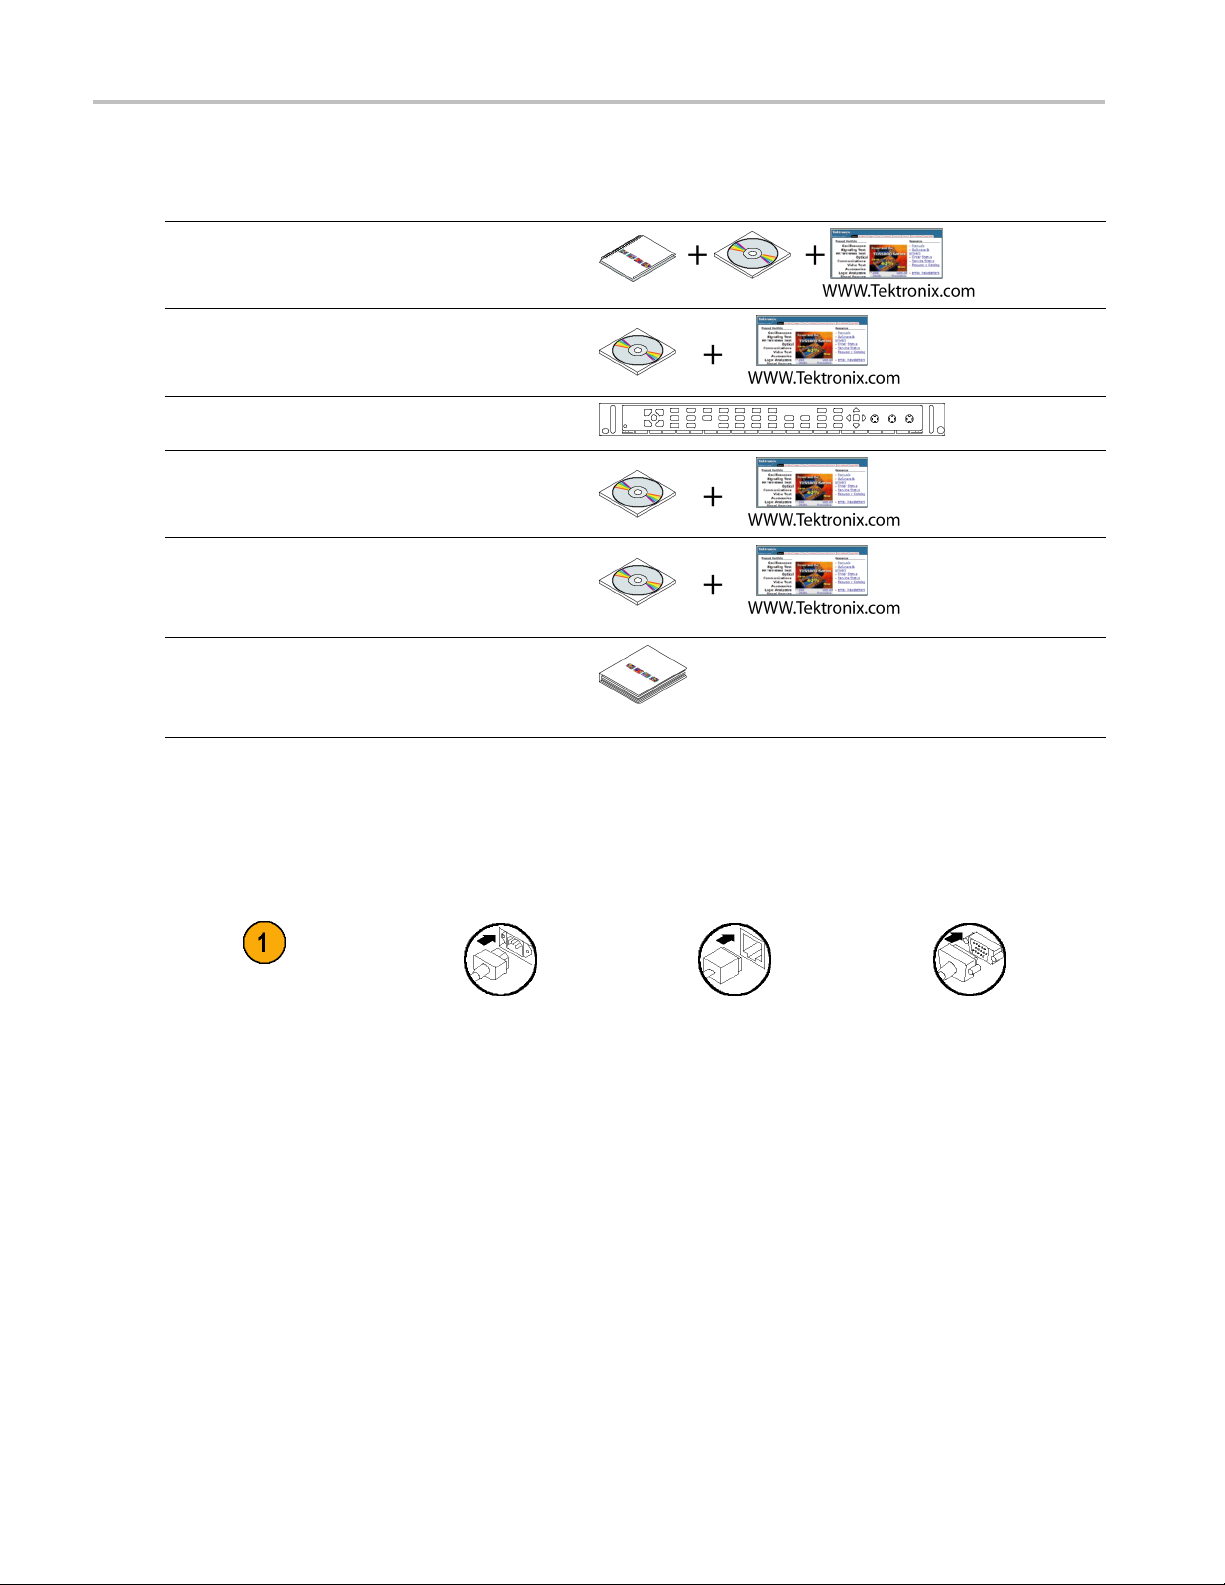
The following documents are standard accessories:
WVR6100, WVR7000, and WVR7100 Waveform Rasterizers Quick Start User Manual, Tektronix part number
071-1588-XX
WVR6100, WVR7000, and WVR7100 Waveform Rasterizers Release Notes, Tektronix part number 061-4295-XX
WVR6100, WVR7000, and WVR7100 Waveform Rasterizers User Documents CD, Tektronix part number 020-2612-XX
International Power Plugs
The instruments are shipped with one of the following power cord options. Power cords for use in North America are UL
listed and C
in the country to which the product is shipped.
SA certified. Cords for use in areas other than North America are approved by at least one authority acceptable
Opt. A0 – North America power.
Opt. A1 – Universal. EUR. power.
Opt. A2 – United Kingdom. power.
Opt. A3 – Australia power.
Opt. A5 – Switzerland power.
Opt. A6 – Japan power.
Opt. A10 – China power.
Optional Accessories
WVR6100, WVR7000, and WVR7100 Waveform Rasterizers Service Manual, Tektronix part number 071-1589-XX.
Analog/Audio Breakout Cable Assembly, Tektronix part number 012-1688-00.
WVR6100, WVR7000, and WVR7100 Waveform Rasterizers Quick Start User Manual 1
Page 16

Before Installa
Options
The WVR7000 and WVR7100 ship with support for monitoring high definition (HD) serial digital signals. You can add SD
support to either of these two instruments:
You can add any or all of the following support options to the WVR6100, WVR7000, or WVR7100 instruments:
You can add any or all of the following support options to the WVR6100 or WVR7100 instruments:
tion
Option SD. Adds support for monitoring standard de finition (SD) serial digital signals.
WVR7UP-SD or WVR70UP-SD. Adds Option SD to a previously purchased instrument.
Option CPS. Adds support for monitoring composite analog signals.
Option DS. Adds support for Digital audio monitoring in embedded and AES/EBU inputs.
WVR6UP-DS, WVR70UP-DS, or WVR7UP-DS. Adds Option DS to a previously purchased instrument.
Option AD. Adds support for Analog audio and Digital audio monitoring in embedded and AES/EBU inputs.
WVR6UP-AD, WVR70UP-AD, or WVR7UP-AD. Adds Option AD to a previously purchased instrument.
Option DD. Adds support for Dolby Digital (AC-3) decode and Analog and Digital audio m onitoring in embedded and
AES/EBU inputs.
WVR6UP-DD or WVR7UP-DD. Adds Option DD to a previously purchased instrument.
Option DDE. Adds support for Dolby E decode, Dolby Digital (AC-3) decode, and Analog/Digital audio monitoring in
embedded and AES/EBU inputs.
WVR6UP-DDE or WVR7UP-DDE. Adds Option DDE to a previously purchased instrument.
Option EYE. Adds support for monitoring the SDI physical layer using an Eye waveform display. WVR6100 instruments
monitor SD signals; WVR7100 instruments monitor HD signals.
WVR6UP-EYE or WVR7UP-EYE. Adds Option EYE to a previously purchased instrument.
Option PHY. Adds the capabilities of Option EYE and adds a Jitter waveform display and automatic measurements of the
SDI physical layer. WVR6100 monitor SD signals; WVR7100 instruments monitor HD signals.
WVR6UP-PHY or WVR7UP-PHY. Adds Option PHY to a previously purchased instrument.
You can add any or all of the following service options to any of the instruments:
Option C3. Adds 3 years of Calibration Service.
Option C5. Adds 5 years of Calibration Service.
Option D1. Adds a Calibration Data Report.
Option D3. Adds 3 years of Calibration Data Report (when ordered with option C3)
Option D5. Adds 5 years of Calibration Data Report (when ordered with option C5)
Option R3. Adds 3 years of Repair Service (including the period under warranty)
Option R5. Adds 5 years of Repair Service (including period under warranty)
2 WVR6100, WVR7000, and WVR7100 Waveform Rasterizers Quick Start User Manual
Page 17

Operating Consi
derations
Operating Con
Characterist
Input voltage
Input power fr
Power consumption 100 W maximum, 50 W typical
Analog Audio Output power
capability
Temperature
Humidity
Ventilation
Altitude
Pollution Degree 2, Indoor use only
ic
equency
siderations
Description
100 V to 240 V ±1
50 Hz to 60 Hz
Capable of continuously driving a -10 dBFS sine wave into 600 Ω or -13 dB into
300 Ω.
Operating: +
Nonoperatin
Operating:
Nonoperati
The intake a
exhaust vents requires at least 1 inch of clearance. No clearance is required above
or below the instrument.
Operating: 3,000 m (9,842 ft.)
Nonoperating: 12,192 m (40,000 ft.)
0%
0°Cto+50°C
g: -40°Cto+75°C
20% to 80% relative humidity (% RH) at up to +40 °C, non-condensing
ng: 5% to 90% relative humidity (% RH) at up to +60 °C, non-condensing
ir vents in the front of the instrument must not be blocked and the rear
WVR6100, WVR7000, and WVR7100 Waveform Rasterizers Quick Start User Manual 3
Page 18
Installation
Installation
This section provides instructions for installing the waveform rasterizer into a standard instrumentation rack for both the
standard configuration and when configured with the remote front panel option. At installation time, save the shipping carton
and packing materials (including the anti-static bag) in case you need to ship the instrument.
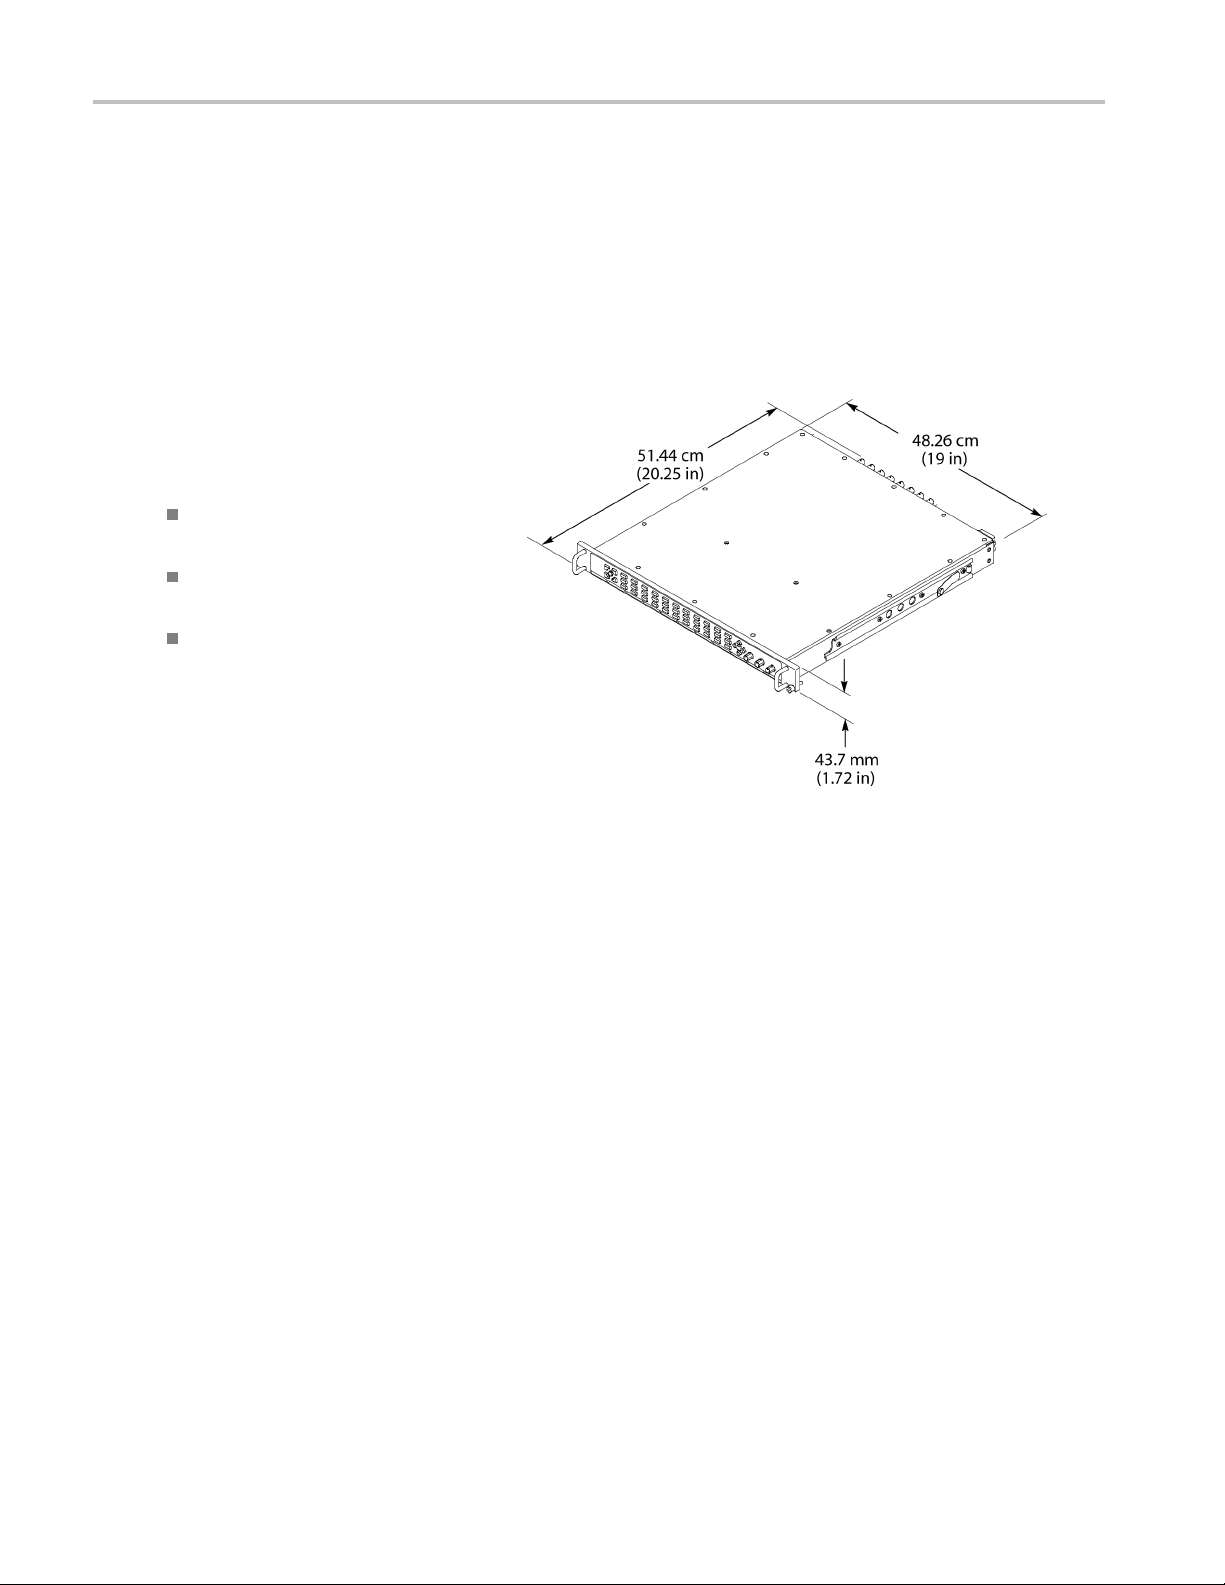
Rackmount Installation
The waveform rasterizer ships with hardware
for rackmounting and fits in a standard
19-inch rack. Requirements of the rack
follow:
Spacing between the front rails must be
at least 17-¾ inches.
Front-to-rear rail spacing must be
between 15-½ and 28 inches.
Six inches of clearance between the
instrument rear panel and any rear
cabinet panel for connector space and to
provide adequate air circulation.
Instrument dimensions are shown at
right.
4 WVR6100, WVR7000, and WVR7100 Waveform Rasterizers Quick Start User Manual
Page 19
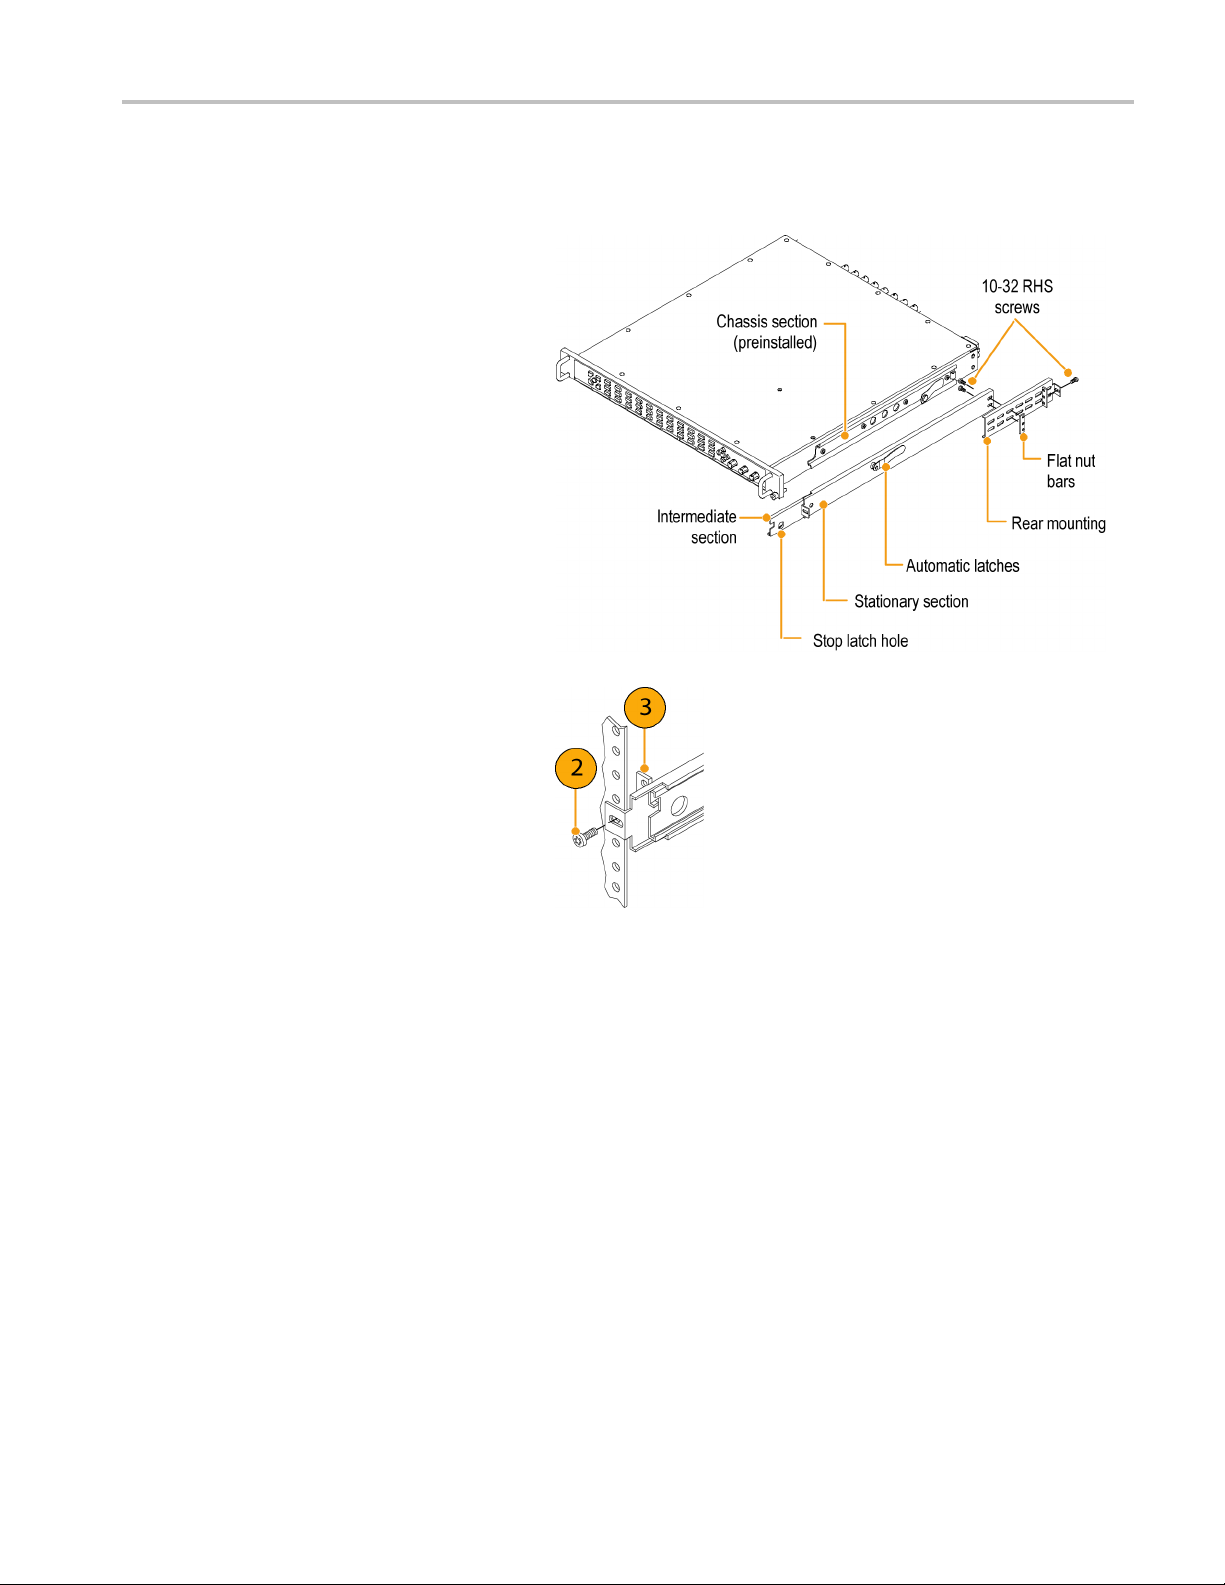
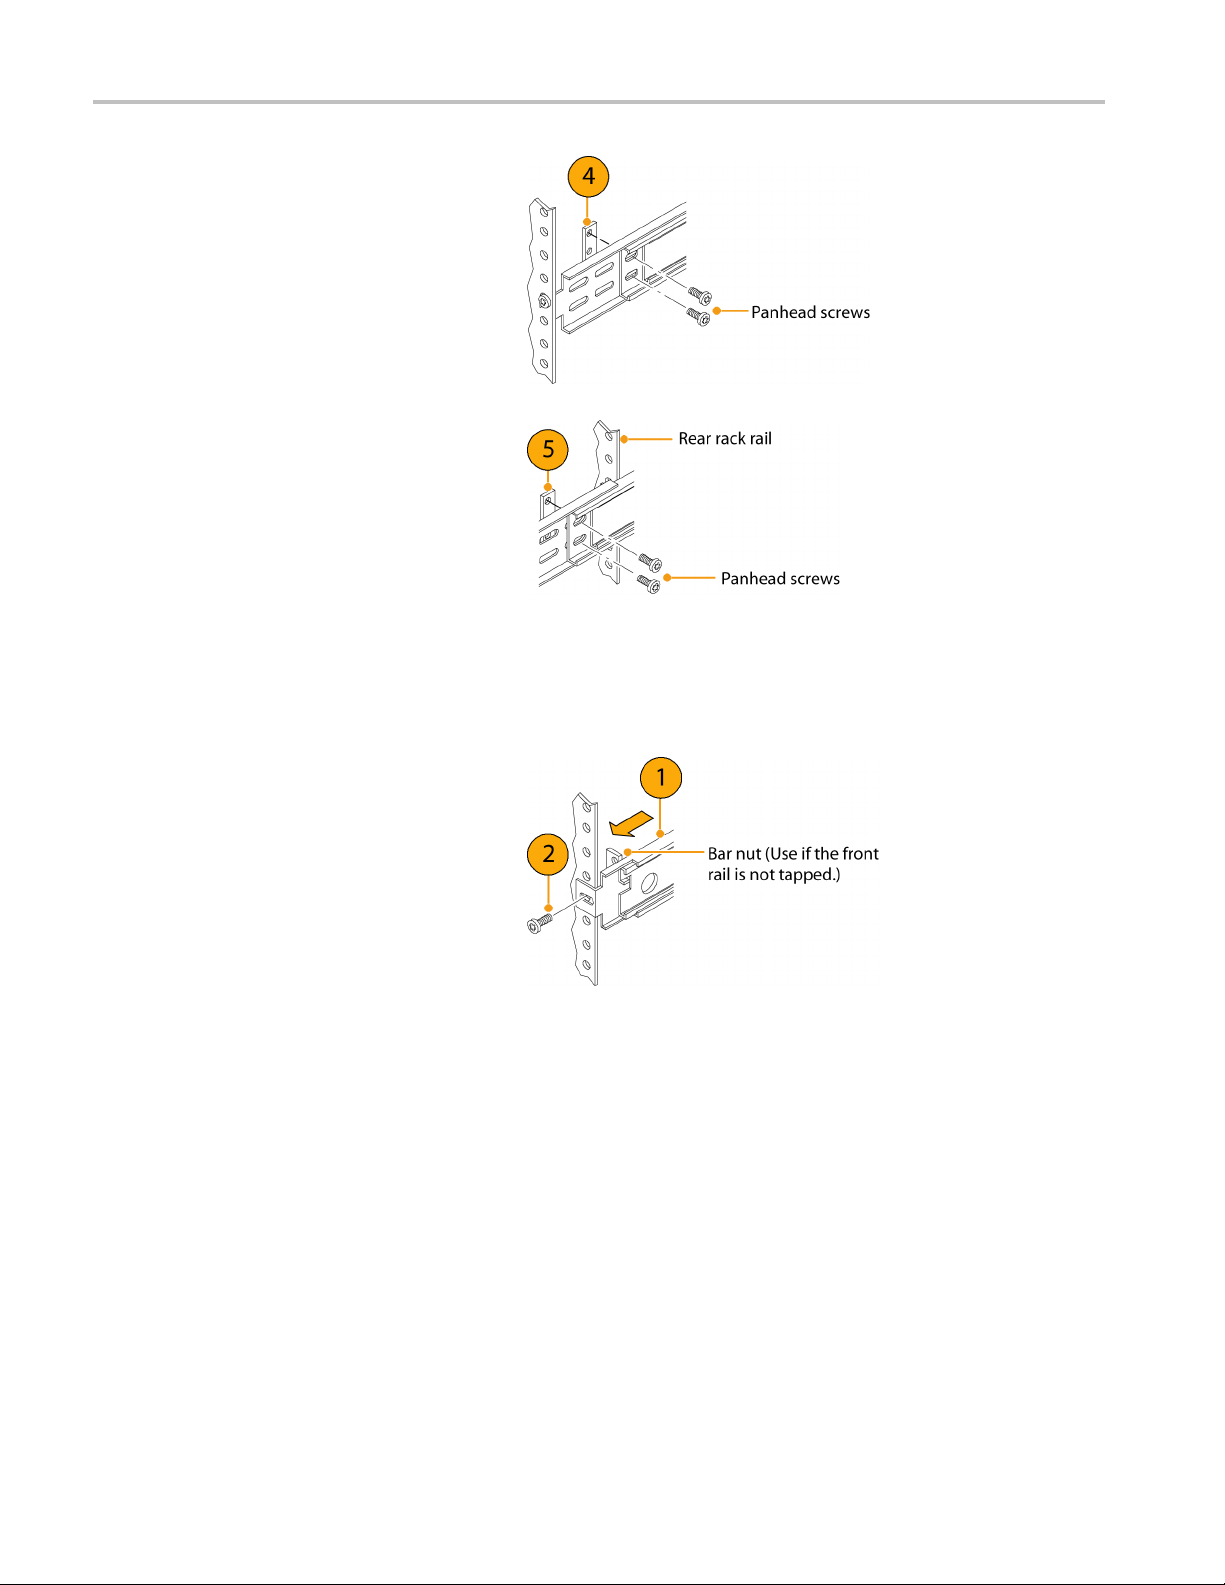
Mounting the Slide Tracks
The procedure covers rear rail mounting details for both deep and shallow racks.
1. Mount the rails using the enclosed
hardware as shown at right.
NOTE. Right hand and left hand stationary
section is designated by the RH and the LH
marked on the rails. Stop latch holes should
be towards the bottom when slides are in
place. (The right hand rail is shown.)
Installation
2. Screw-mount to the front rail as shown.
3. Install bar nut if the front rail mounting
hole is not tapped.
WVR6100, WVR7000, and WVR7100 Waveform Rasterizers Quick Start User Manual 5
Page 20
Installation
4. For a deep configuration, rear mount as
shown. Make sure that the stationary
sections are h
and parallel.
5. Alternately, for a shallow configuration,
rear mount as shown. Make sure that
the stationary sections are horizontally
aligned, level, and parallel.
orizontally aligned, level,
Rack Adjustments
If, after installation, the slide tracks bind, adjust the tracks as follows.
1. Slide the instrument out about 10 inches,
slightly loosen the screws holding the
tracks to the front rails, and allow the
tracks to seek an unbound position.
2. Retighten the screws and check the
tracks for smooth operation by sliding the
instrument in and out of the rack several
times.
6 WVR6100, WVR7000, and WVR7100 Waveform Rasterizers Quick Start User Manual
Page 21
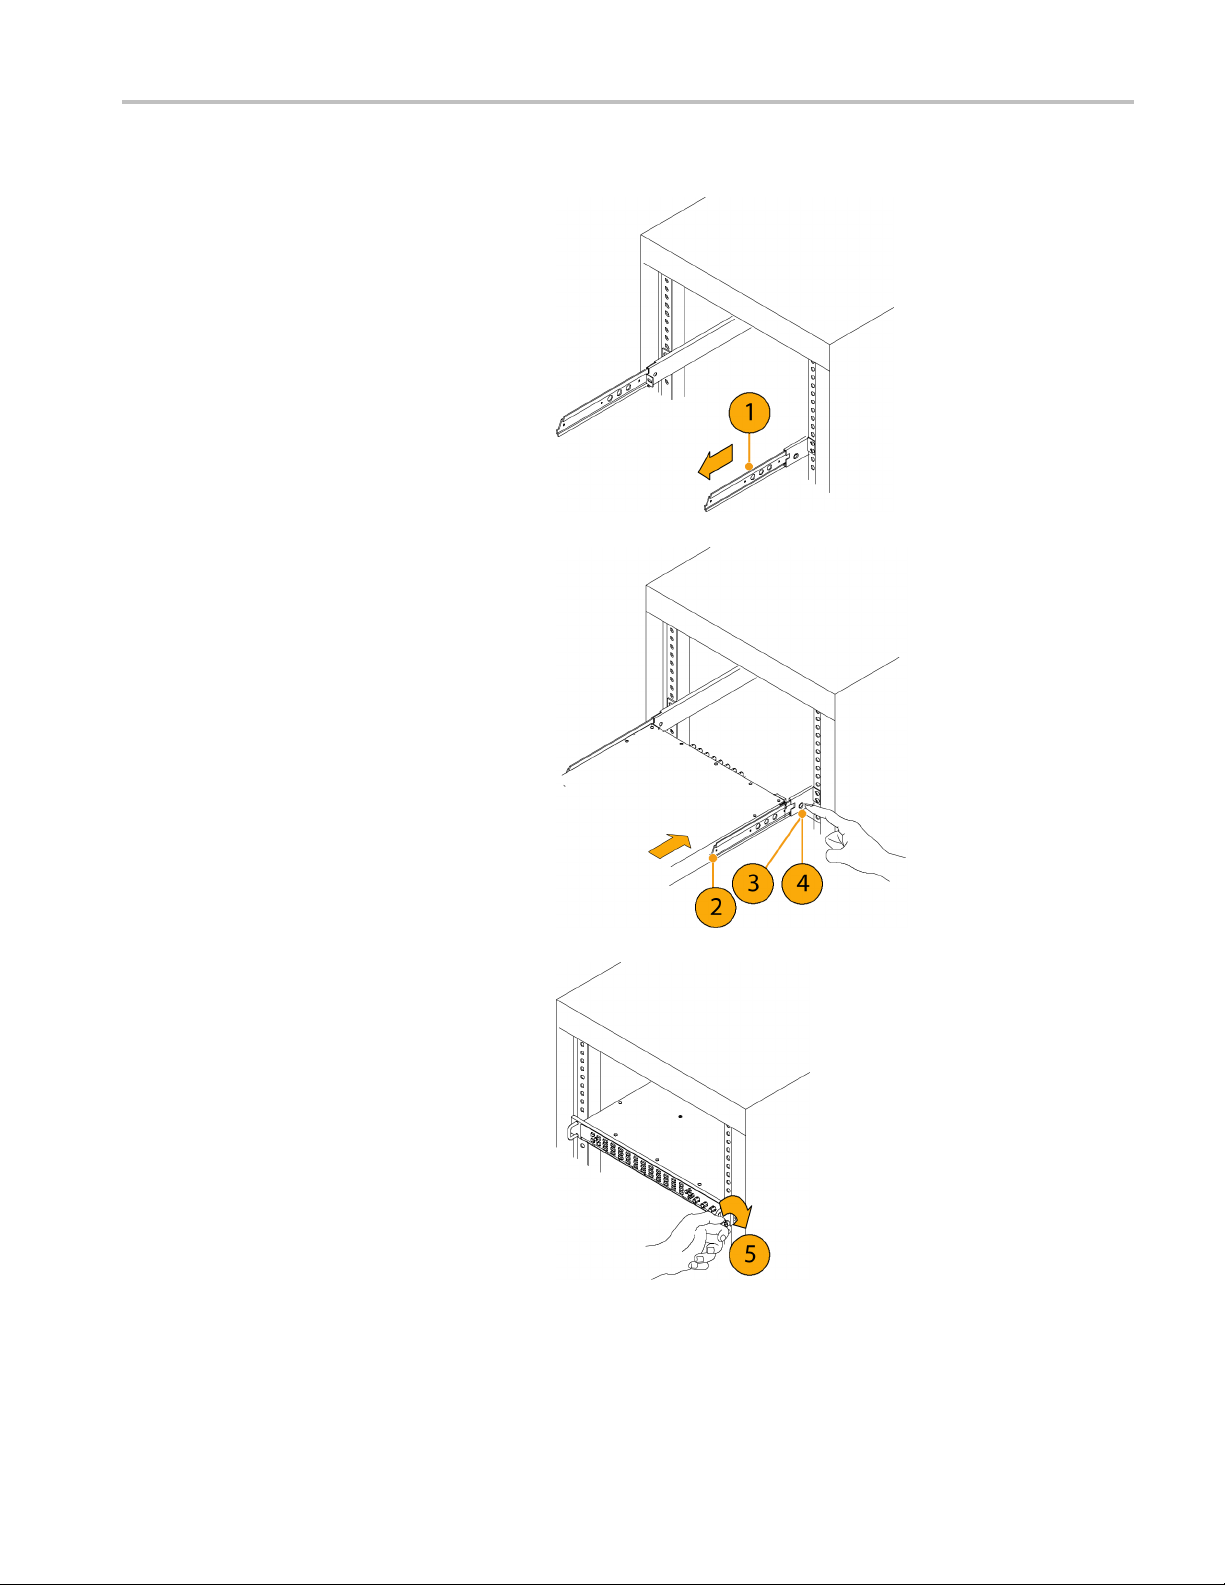
To Install the Instrument
Installation
1. Pull the slide
extended position.
2. Insert the instrument chassis sections
into the slide-out sections.
3. Press the stop latches, and push the
instrument toward the rack until the
latches snap into their holes.
4. Press the stop latches again, and push
the instrument fully into the rack.
-out track section to the fully
5. Tighten the front-panel retaining screws.
WVR6100, WVR7000, and WVR7100 Waveform Rasterizers Quick Start User Manual 7
Page 22
Installation
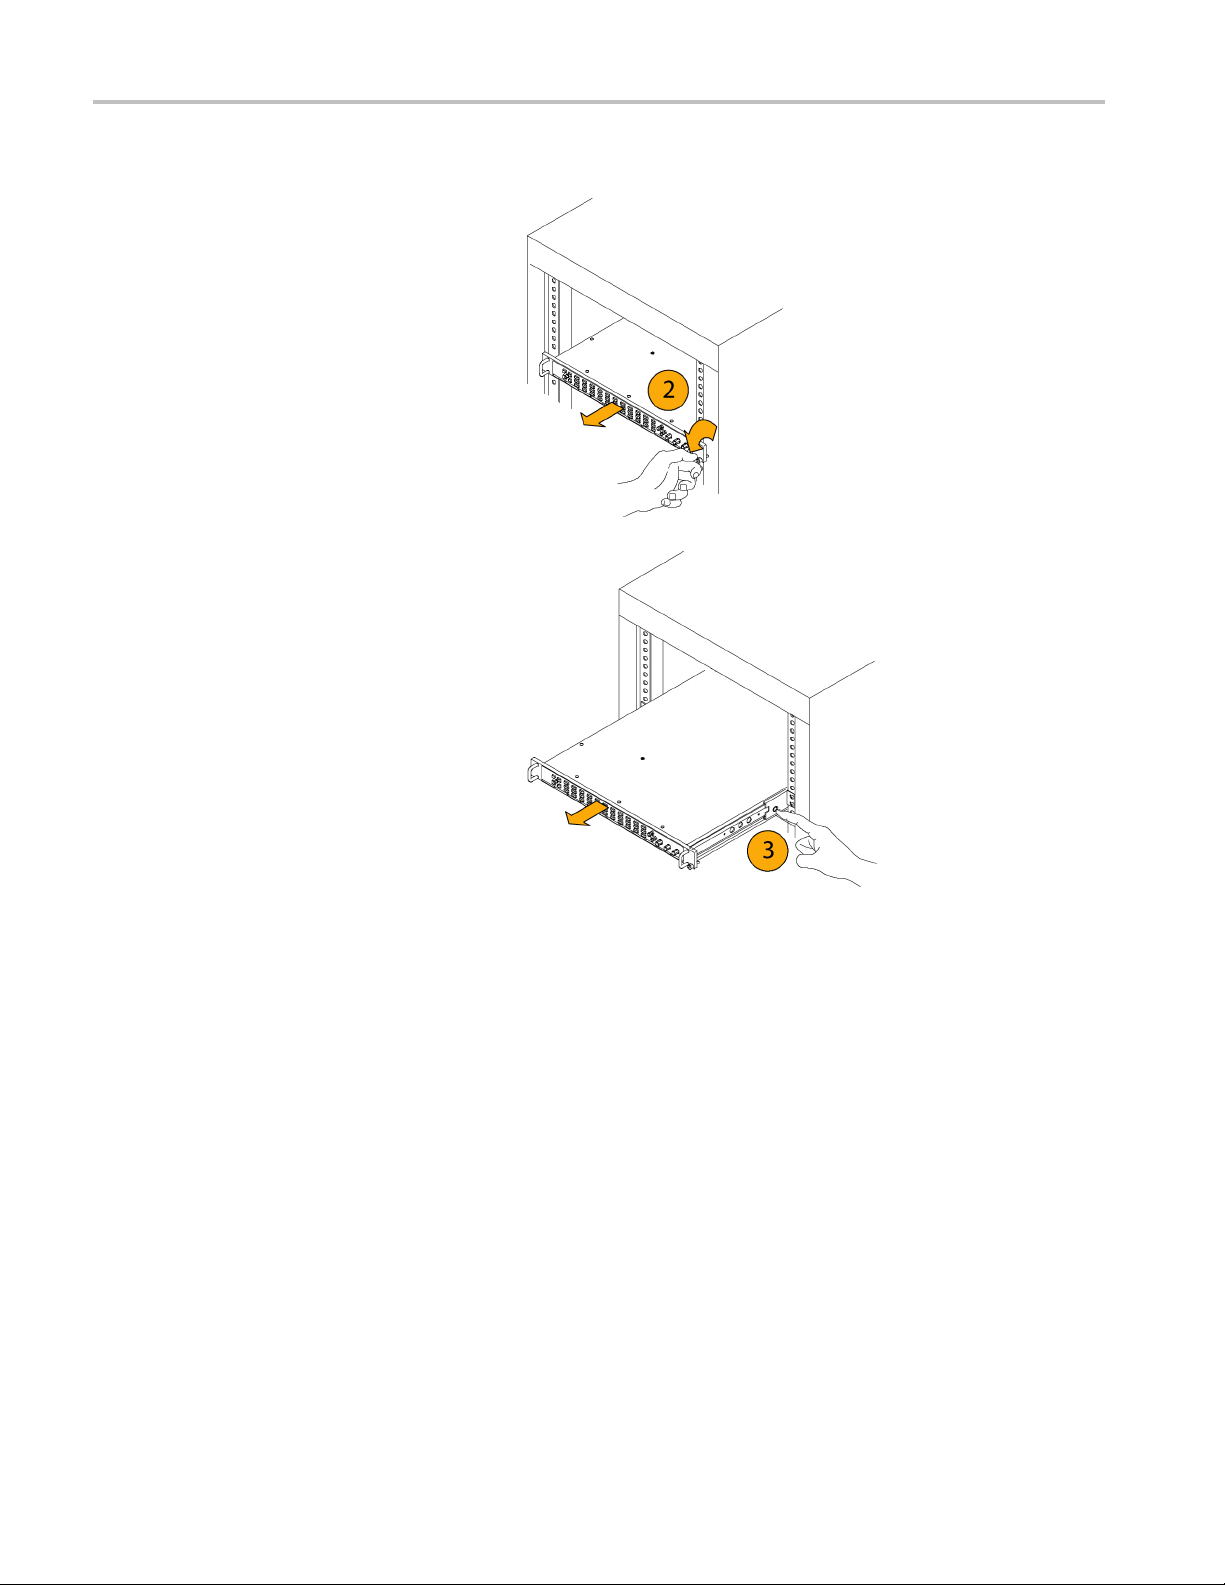
To Remove the Instrument
1. Before removi
to disconnect all cabling.
2. Loosen retaining screw and pull
instrument outward until the stop latches
snap into the h
3. Press stop latches (visible in the
stop-latch holes) and carefully slide the
instrument free from the tracks.
ng the instrument, be sure
oles.
Rack Slide Maintenance
The slide-out tracks do not require lubrication. The dark gray finish on the tracks is a permanent, lubricated coating.
To Connect a Display
First, loosen the front-panel knurled retaining screw. See To Remove the Instrument procedure, step 2. Grasp the front
handles, and pull the instrument out until all three slide sections latch. The instrument is firmly held in this position.
You are now ready to connect power and signal cables to the instrument.
The instruments support standard analog PC monitors, either CRT or LCD. The display resolution is 1024 × 768 (XGA).
ct the external display to the rear-panel XGA OUTPUT connector. The XGA OUTPUT connector is a standard 15-pin
Conne
D-type connector with socket contacts. To select the displa y type, display the CONFIG menu, select Display Setting, and
then Picture Refresh Mode. Select CRT or Interlaced for Monitors and LCD for LCD displays. Push the HELP button after
cting Picture Refresh Mode for information about these settings.
sele
8 WVR6100, WVR7000, and WVR7100 Waveform Rasterizers Quick Start User Manual
Page 23
To Connect Power and Powering On/Off
The waveform rasterizer operates from a single-phase power source with the neutral conductor at or near earth ground.
The line conductor is fused for over-current protection. A protective ground connection through the grounding conductor in
the power cord is essential for safe operation.
AC Power Requirements
The waveform rasterizer operates from an AC line frequency of 50 or 60 Hz, over the range of 100-240 Volts, without the
need for configuration, except the power cord. (See page 1, International Power Plugs.) The typical power draw is 50 W.
Refer to the S
and environmental requirements.
Connect the supplied power cord to the rear-panel power connector. There is no power switch on the waveform rasterizer, so
the instrument will turn on as soon as you apply power.
pecifications and Performance Verification on the User Documents CD for additional information on power
Installation
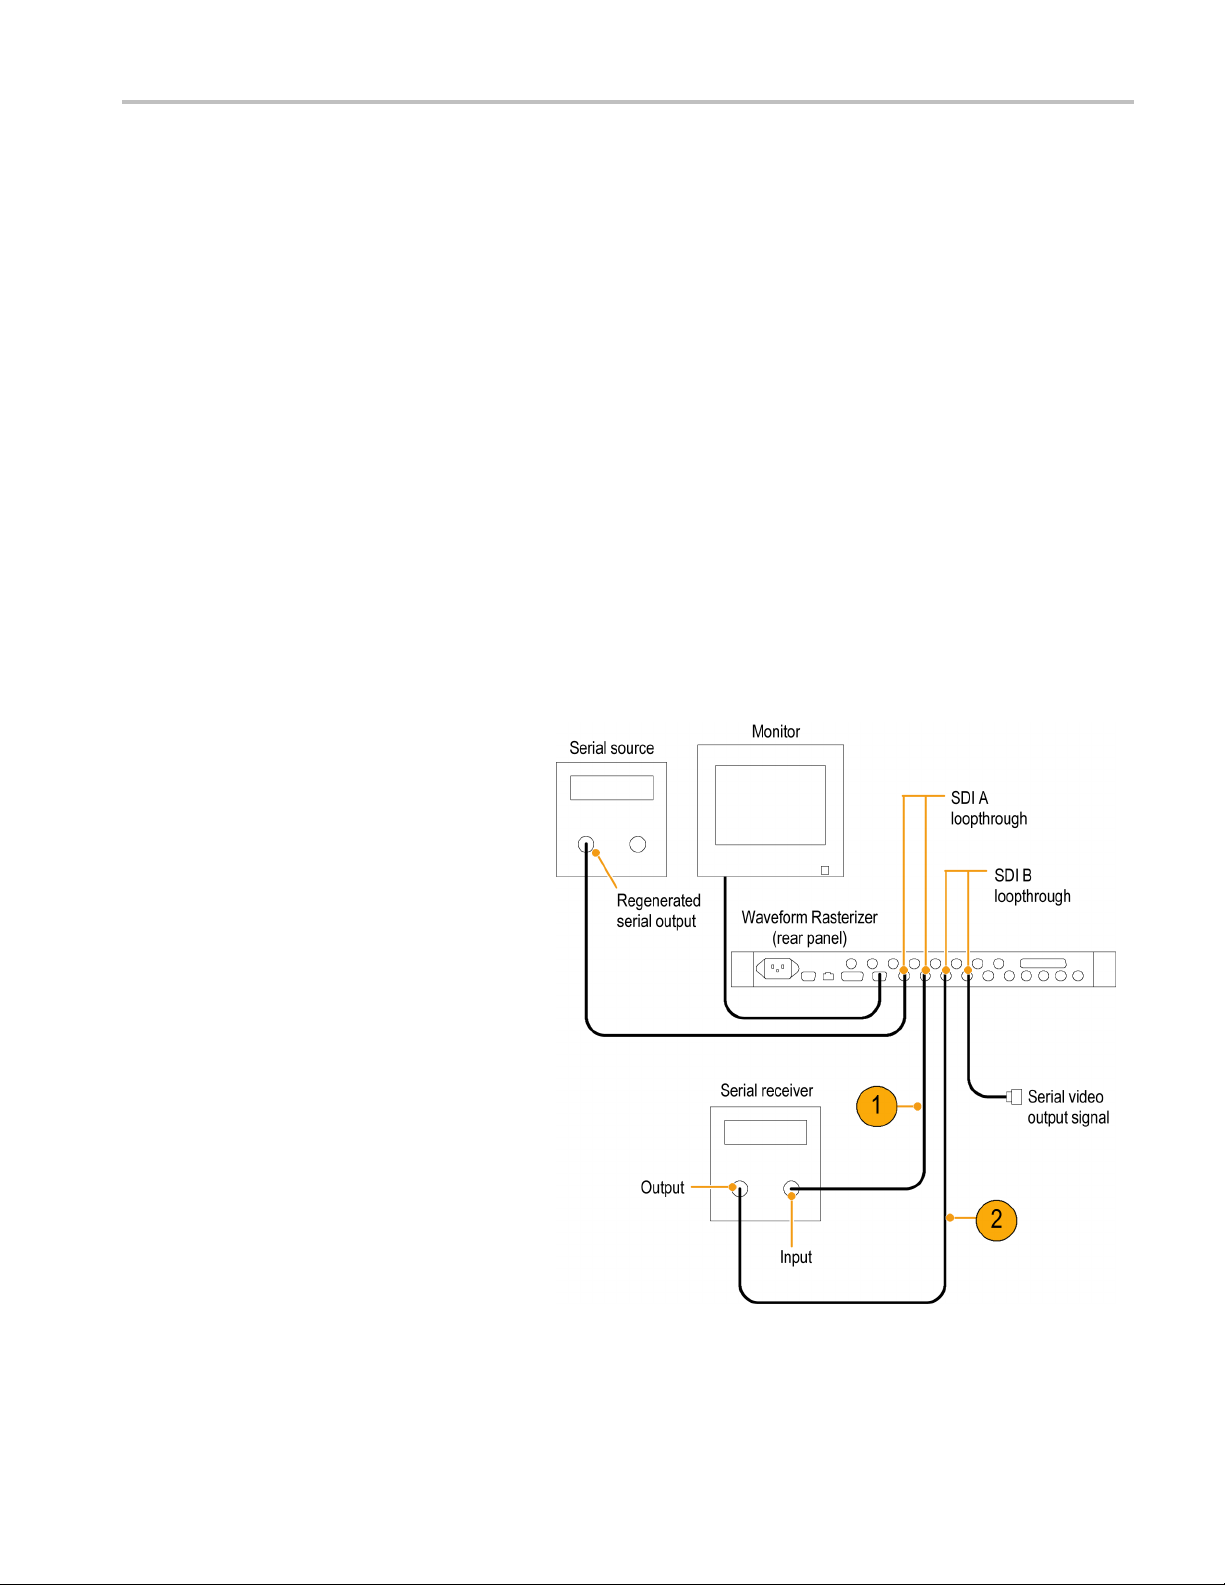
To Install i
The waveform rasterizer can operate almost anywhere in the distribution system due to its high impedance, bridging, and
loop-through inputs. This section describes two types of connections and presents information on line termination. The
following diagrams are for serial digital systems, but similar connections are common for the analog composite inputs
on the waveform rasterizer.
To install for monitoring the video
bit stream of a seria l receiver
1. Route the incoming serial signal
through one of the waveform rasterizer
loop-tho
2. Connect t
to the other loop-through input, so you
can compare the incoming signal and
the regen
NOTE. See the Specifications on the
WVR6100, WVR7000, and WVR7100 User
Documen
allowed.
naVideoSystem
ugh inputs.
he output of the serial receiver
erated output signal.
ts CD for maximum cable lengths
WVR6100, WVR7000, and WVR7100 Waveform Rasterizers Quick Start User Manual 9
Page 24
Installation
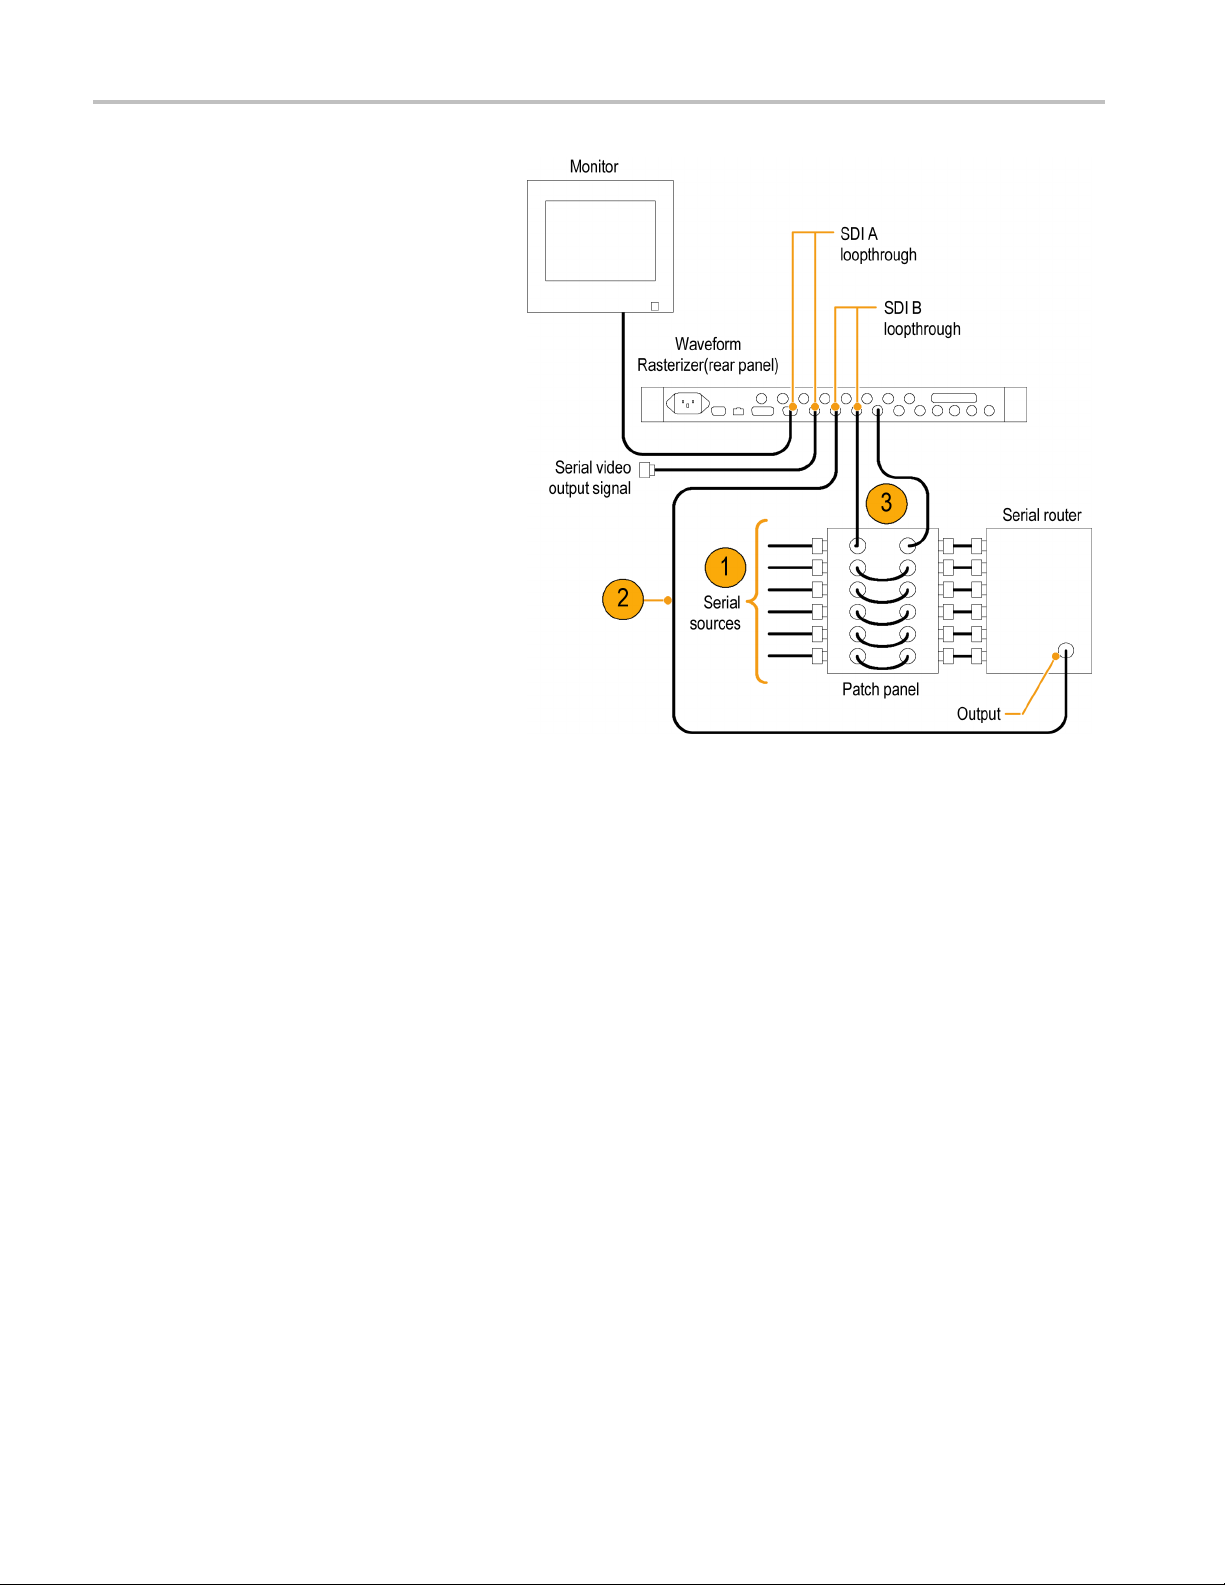
To install moni
toring serial digital
signals around a routing switcher
1. Connect your serial sources through a
patch panel to a serial router.
2. Connect the output of the serial router to
a SDI loop through input for comparison.
3. Connect the other SDI loop-through
input to the patch panel to jumper the
signal that you want to compare to signal
connected in step 2.
Line Termination
The waveform rasterizer uses passive loop-through, serial and analog video inputs. Accordingly, the loop-through input
must be terminated externally. The passive loop-through capability of the inputs provides the benefit of a signal path that
is uninterrupted by input selection, power interruption, and even most internal faults. In addition, the waveform rasterizer
directly monitors the actual signal traveling to downstream equipment rather than providing a retransmitted signal or
requiring a duplicate input signal.
The loop-through capability is especially useful with the EYE and PHY options because it allows inspection of the actual
signal on the cable. However, the signal received by the waveform rasterizer is also dependent on the quality of the
downstream cabling and termination. Terminations with poor high frequency characteristics, 50 Ω BNC barrels, patch panel
bulkhead feed-throughs, and other poor cabling practices cause reflections, which can result in excessive eye closure, jitter
above 100 kHz, data errors, and even loss of lock at the waveform rasterizer.
10 WVR6100, WVR7000, and WVR7100 Waveform Rasterizers Quick Start User Manual
Page 25

Installation
Termination Requirements. If the waveform rasterizer is installed to monitor an operating link, the destination receiver
and the connect
of the entire serial path. The return loss of the waveform rasterizer is sufficiently high that, in most cases, the destination
receiver sets the system return loss.
In cases where the waveform rasterizer is placed at the end of a link, a BNC terminator must be installed on one side of
the loop-thro
exceed the following requirements:
Standard definition (SD) signals: >25 dB from 10 kHz to 270 MHz.
High definition (HD) signals: >25 dB from 10 kHz to 1.5 GHz.
Composite signals: >40 dB from DC to 6 MHz.
Most terminators designed for analog video have poor characteristics in the 20 MHz to 2 GHz range needed for SDI
interconnection. One example of a terminator with good high-frequency characteristics is the Canare BCP-TA.
ing cable serve as the termination. This monitoring connection is best because it checks the performance
ugh input. The termination must be 75 Ω and DC coupled (good return loss extends to DC). Return loss must
Compatibili
Most video equipment BNC connectors, whether 50 or 75 Ω,usea50Ω standard center pin. Some laboratory 75 Ω BNC
connectors use a smaller diameter center pin. The BNC connectors on the waveform rasterizer are designed to work with the
50 Ω standard (large diameter) center pins.
Do not use connectors or terminators with the smaller center pins. They could cause intermittent connections.
ty of BNC Center Pins
Connecting to Monitors and Projectors Issues
Some monitors or projectors may have trouble adapting to the XGA output from the waveform rasterizer. This is because
there may no
area. To overcome this, select S tatus in all four tiles of the waveform rasterizer display, and then cycle the power on the
monitor to force it to reconfigure. If necessary, adjust the horizontal and vertical position and size to optimize the image, and
set the Pic
t be any significant signal in all four corners of the raster, so the monitor cannot find the edges of the active
ture Refresh Rate to match the monitor. (See page 8, To Connect a Display.)
Incoming Inspection
At your option, you can complete incoming inspection procedures. These procedures require no equipment aside from a
display, to check functionality. You will find the incoming inspection procedures in the WVR6100, WVR7000, and WVR7100
User Technical Reference that is included on the User Documents CD that shipped with your waveform rasterizer.
WVR6100, WVR7000, and WVR7100 Waveform Rasterizers Quick Start User Manual 11
Page 26
How to Operate Yo
ur Instrument
How to Operate
Getting Acquainted
The waveform rasterizer uses a flexible, tiled display. The waveform rasterizer can display four tiles at one time. Each tile
can display a different measurement, effectively creating four independent instruments. To enable the tiles to function
independently, most of the controls only affect one tile at a time.
To Control the Display
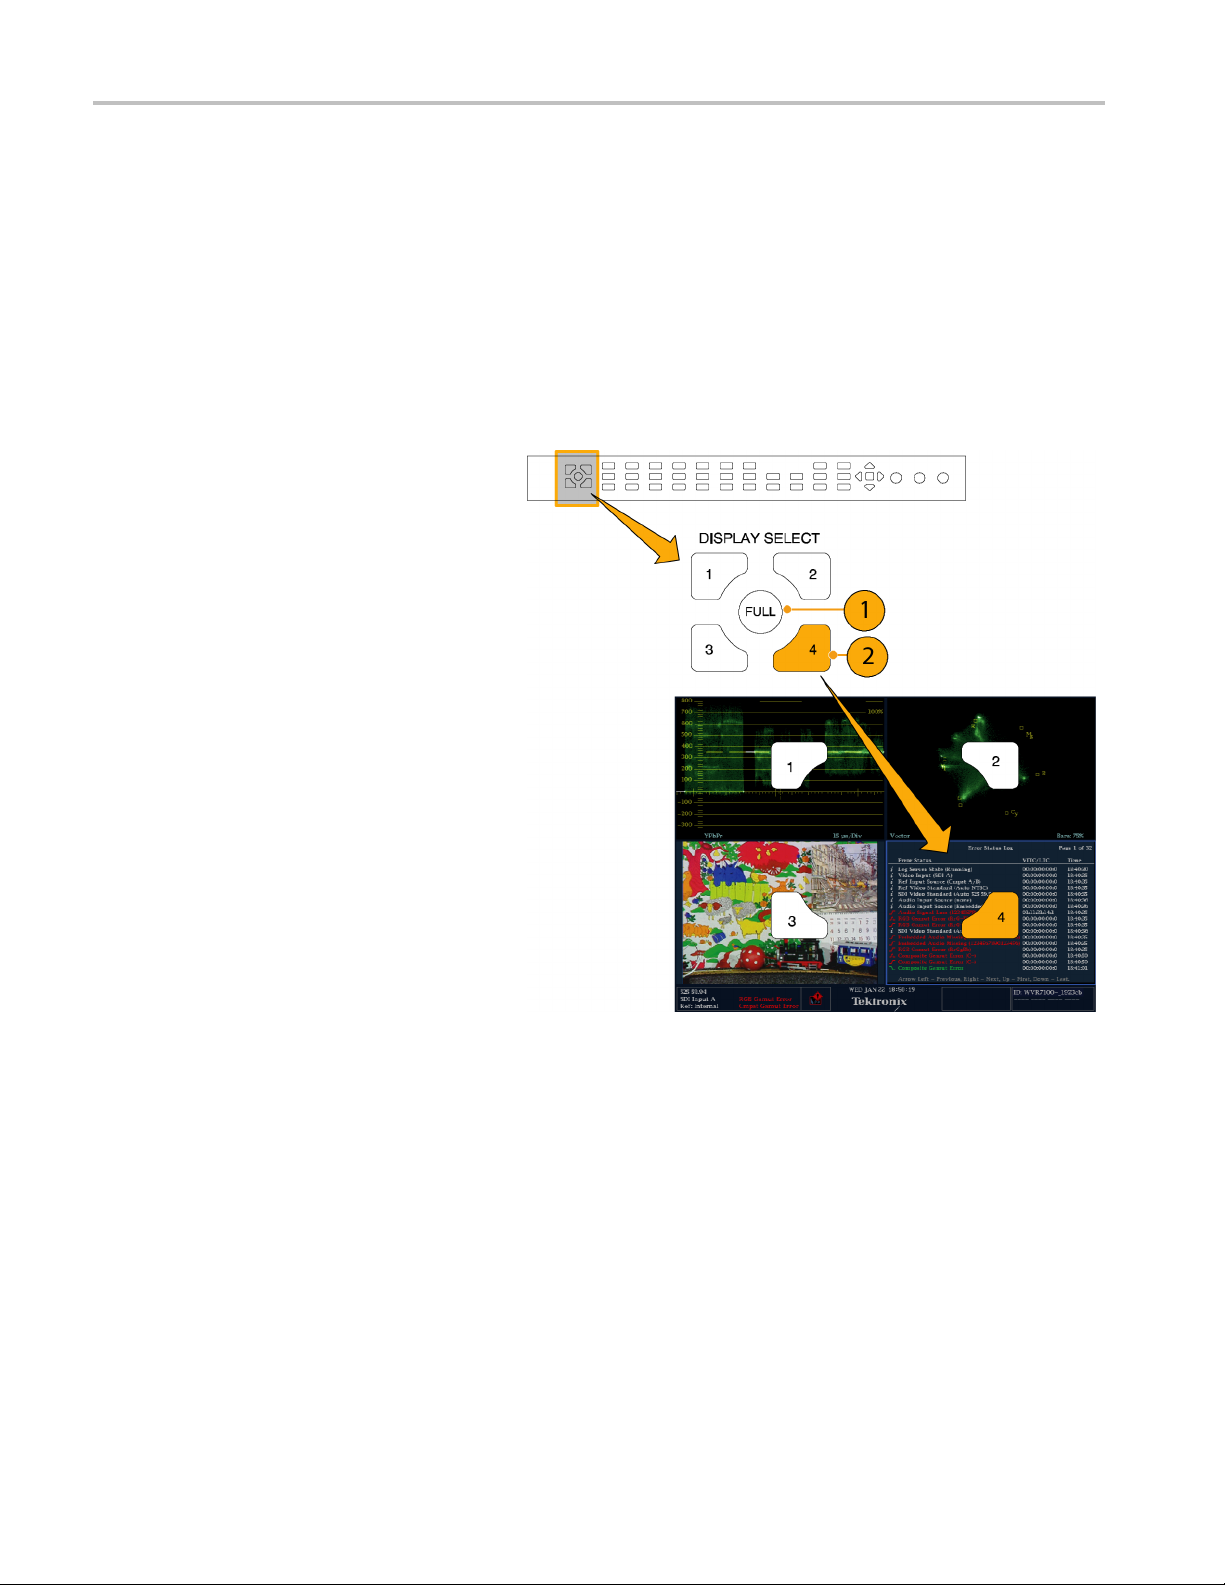
1. To switch to tiled mode, toggle the FULL
button until it is unlit and there are four
displays shown.
2. To select a tile to control, push one of the
numbered tile buttons.
Note that the button you select lights and
that a light-blue outline surrounds the
tile. Both the lit button and the light-blue
outline indicate the active, selected tile.
Tile 4 is shown selected here.
Your Instrument
12 WVR6100, WVR7000, and WVR7100 Waveform Rasterizers Quick Start User Manual
Page 27
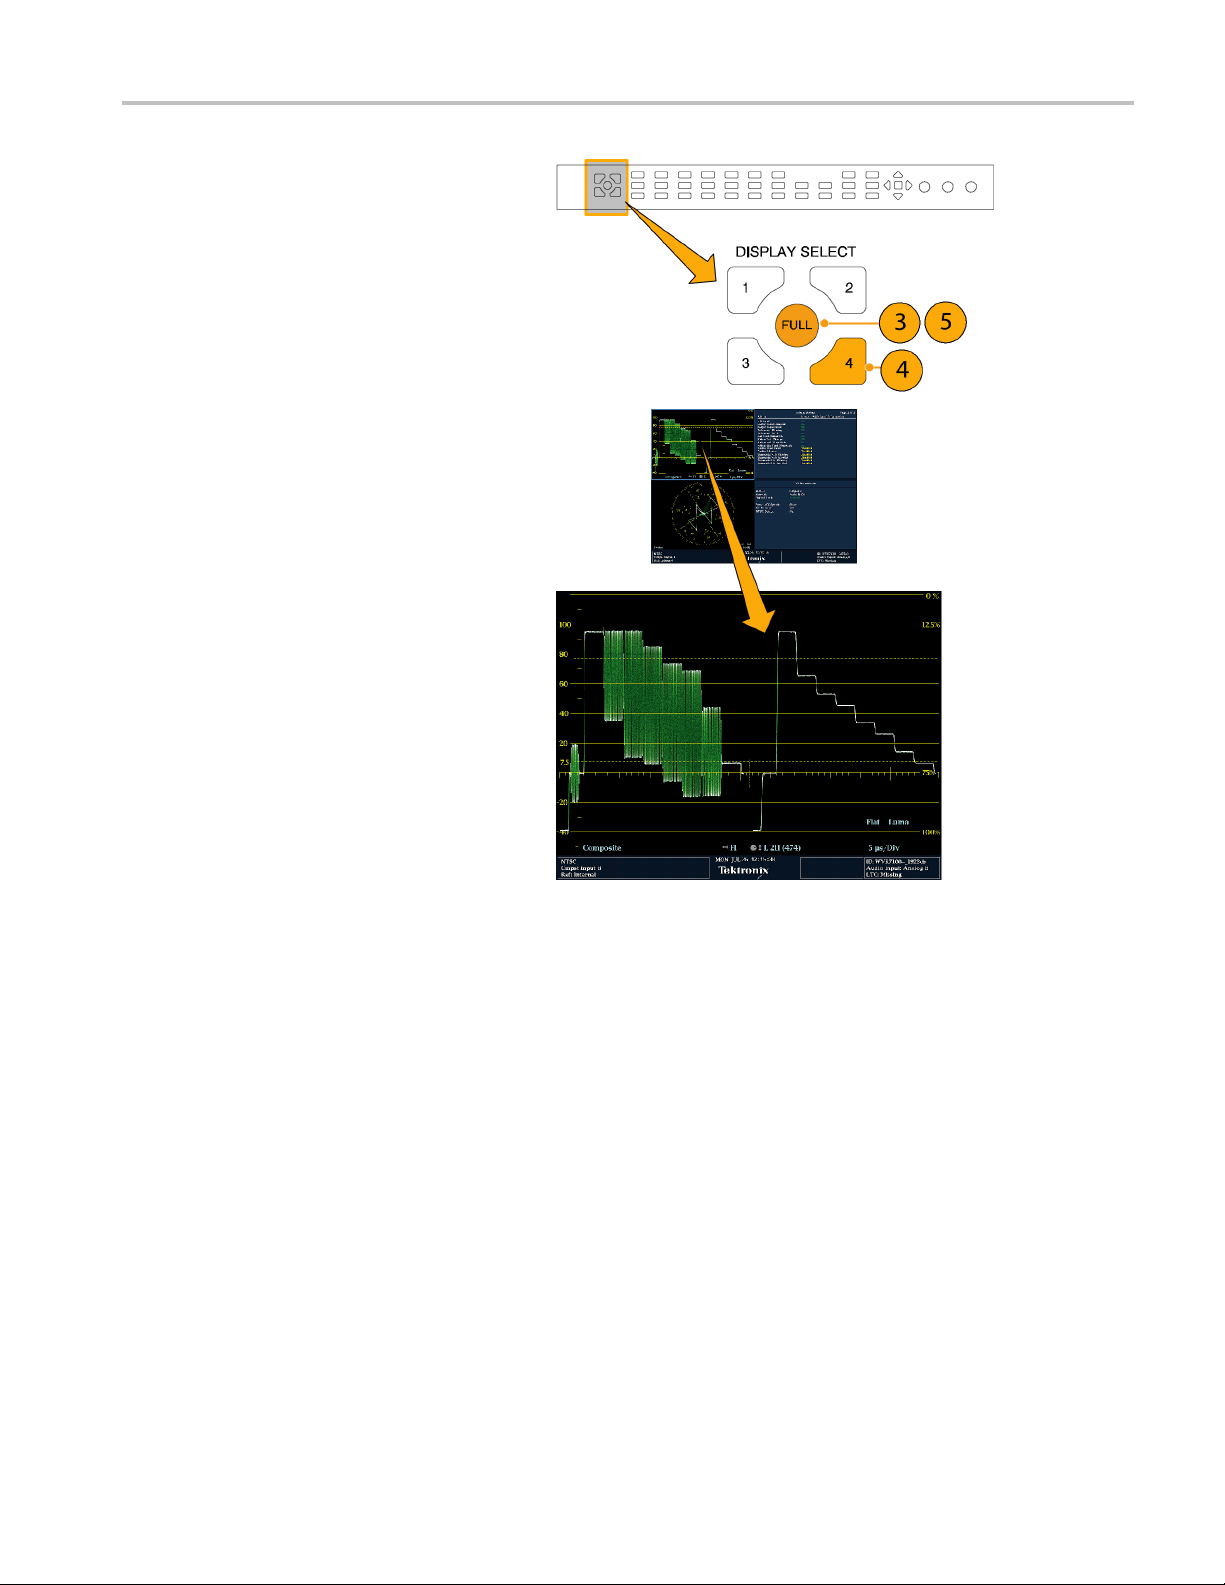
3. To display the selected tile full screen,
toggle the FULL button until it is lit and
the selected t
ile fills the screen.
In a full display, the displayed tile i s
always selected.
4. To select another tile, just push its
button. The ti
le you select will replace
the previously selected tile, displaying
full screen.
5. Push the FULL button again to toggle to
the four-tile
display.
How to Operate Yo
ur Instrument
WVR6100, WVR7000, and WVR7100 Waveform Rasterizers Quick Start User Manual 13
Page 28
How to Operate Yo
To Determine Status At-a-Glance
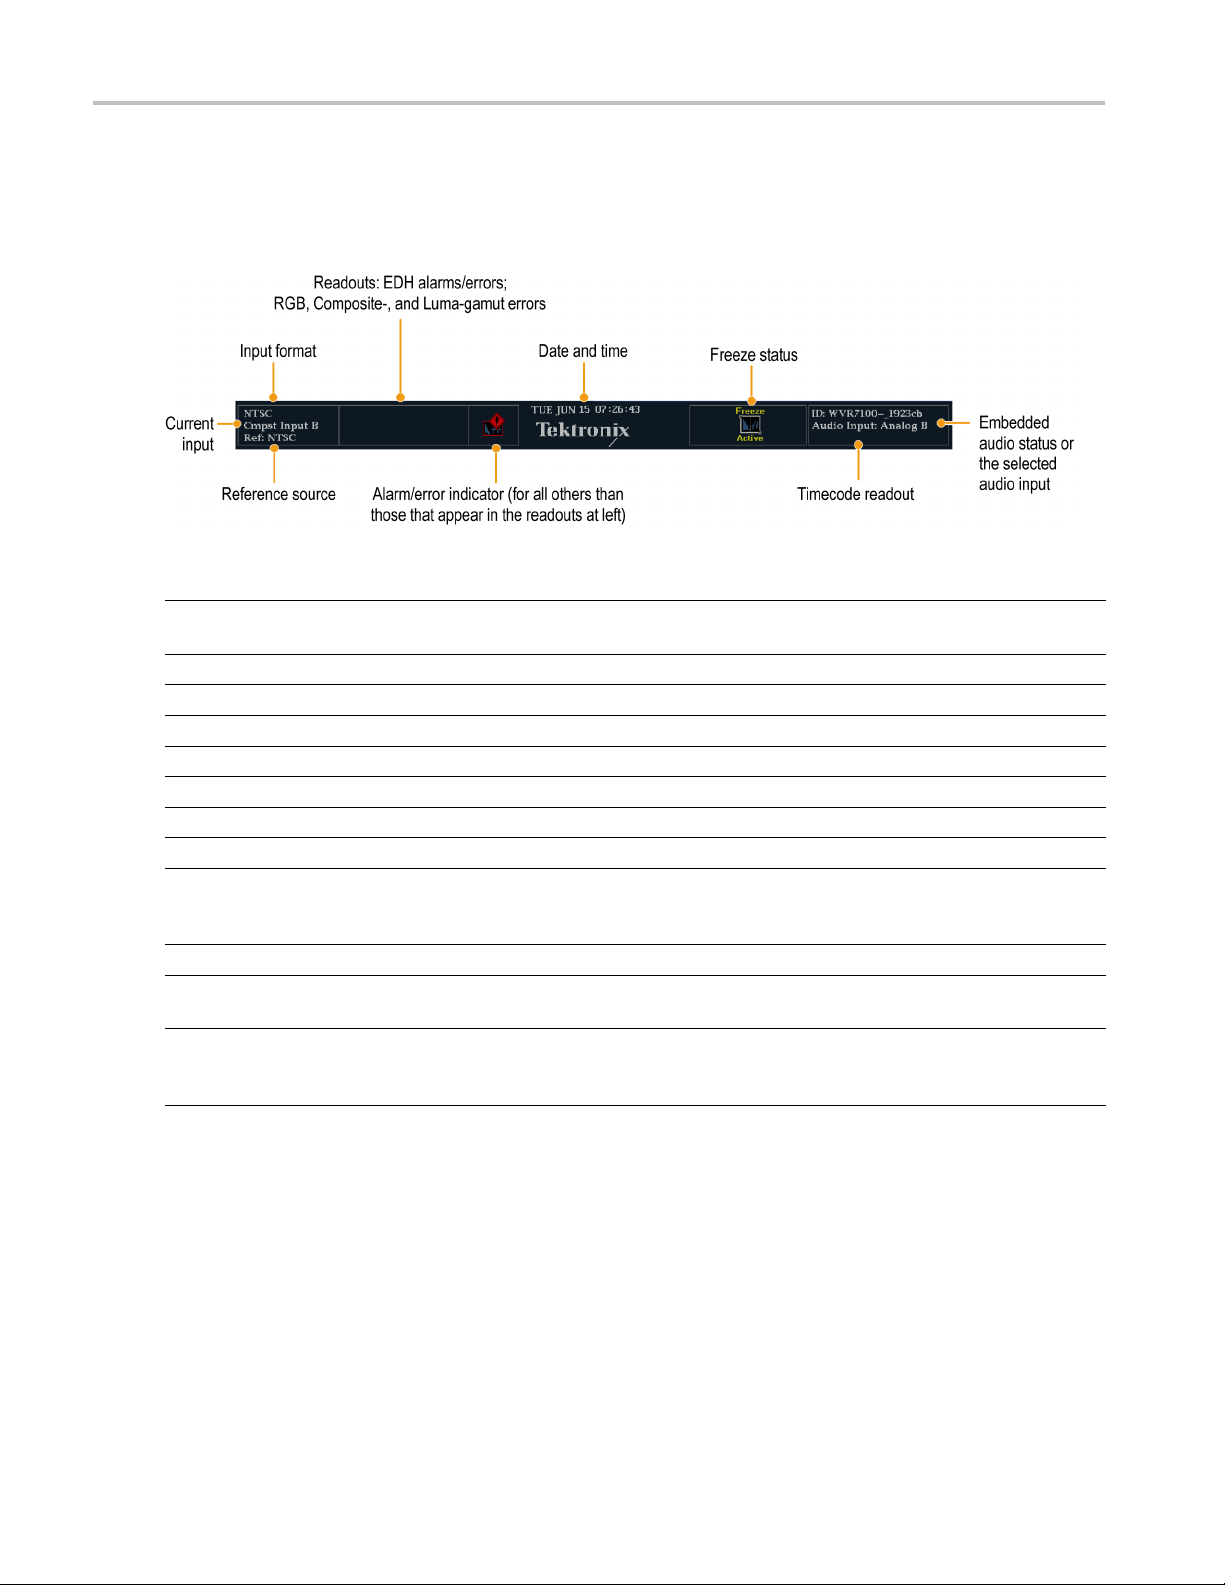
The Status Bar, located at the bottom of the waveform rasterizer display, shows information on the status of instrument
and of the monitored signal. The various elements detailed below describe the conditions that you can see at a glance in
the Status Bar.
Display element Description
Input Format
EDH Error
RGB Gamut E
Composite
Luma Gamut
Alarm/Er
Date and Time
Instrument Name
Audio Sta
Timecode
Referenc
Current Input Text indicating the selected input. Possible inputs are: SDI A, SDI B, Cmpst A, Cmpst B
1
Because RGB and Composite G amut messages appear on the same line in the display, if both RGB and Composite Gamut errors are present at
the same time, the message "RGB and Cmpst Gamut" will appear.
ur Instrument
1
rror
Gamut Error
Errors
ror Indicator
tus
Readout
e Source
Text indicating the format of the signal on the selected input or whether signal is missing or
unlocked.
area that is visible i f EDH errors are present.
area that is visible if RGB gamut errors are present.
area that is visible if Composite gamut (Arrowhead) errors are present.
area that is visible if Luma errors are present.
sible when alarms of types other than those in the four readouts just listed occur.
f the date and time (set in CONFIG > Utilities).
gned to the waveform rasterizer in the CONFIG > Utilities menu.
1
A one-line
A one-line
A one-line
A one-line
An icon vi
Readout o
Name assi
A 16-character string indicating the selected audio input or the embedded audio channel
status, w
hen embedded audio is the selected input, In the latter case, each character shows
the status of a specific channel: - for not present and P for present.
A readout
Text indi
showing the selected time-code value.
cating the source of the current reference. Possible r eferences are: Ext., Internal.
Also indicates format and whether the reference is missing or unlocked.
(depending on installed options). Also indicates if the current input is not in Auto mode and is
d.
unlocke
14 WVR6100, WVR7000, and WVR7100 Waveform Rasterizers Quick Start User Manual
Page 29
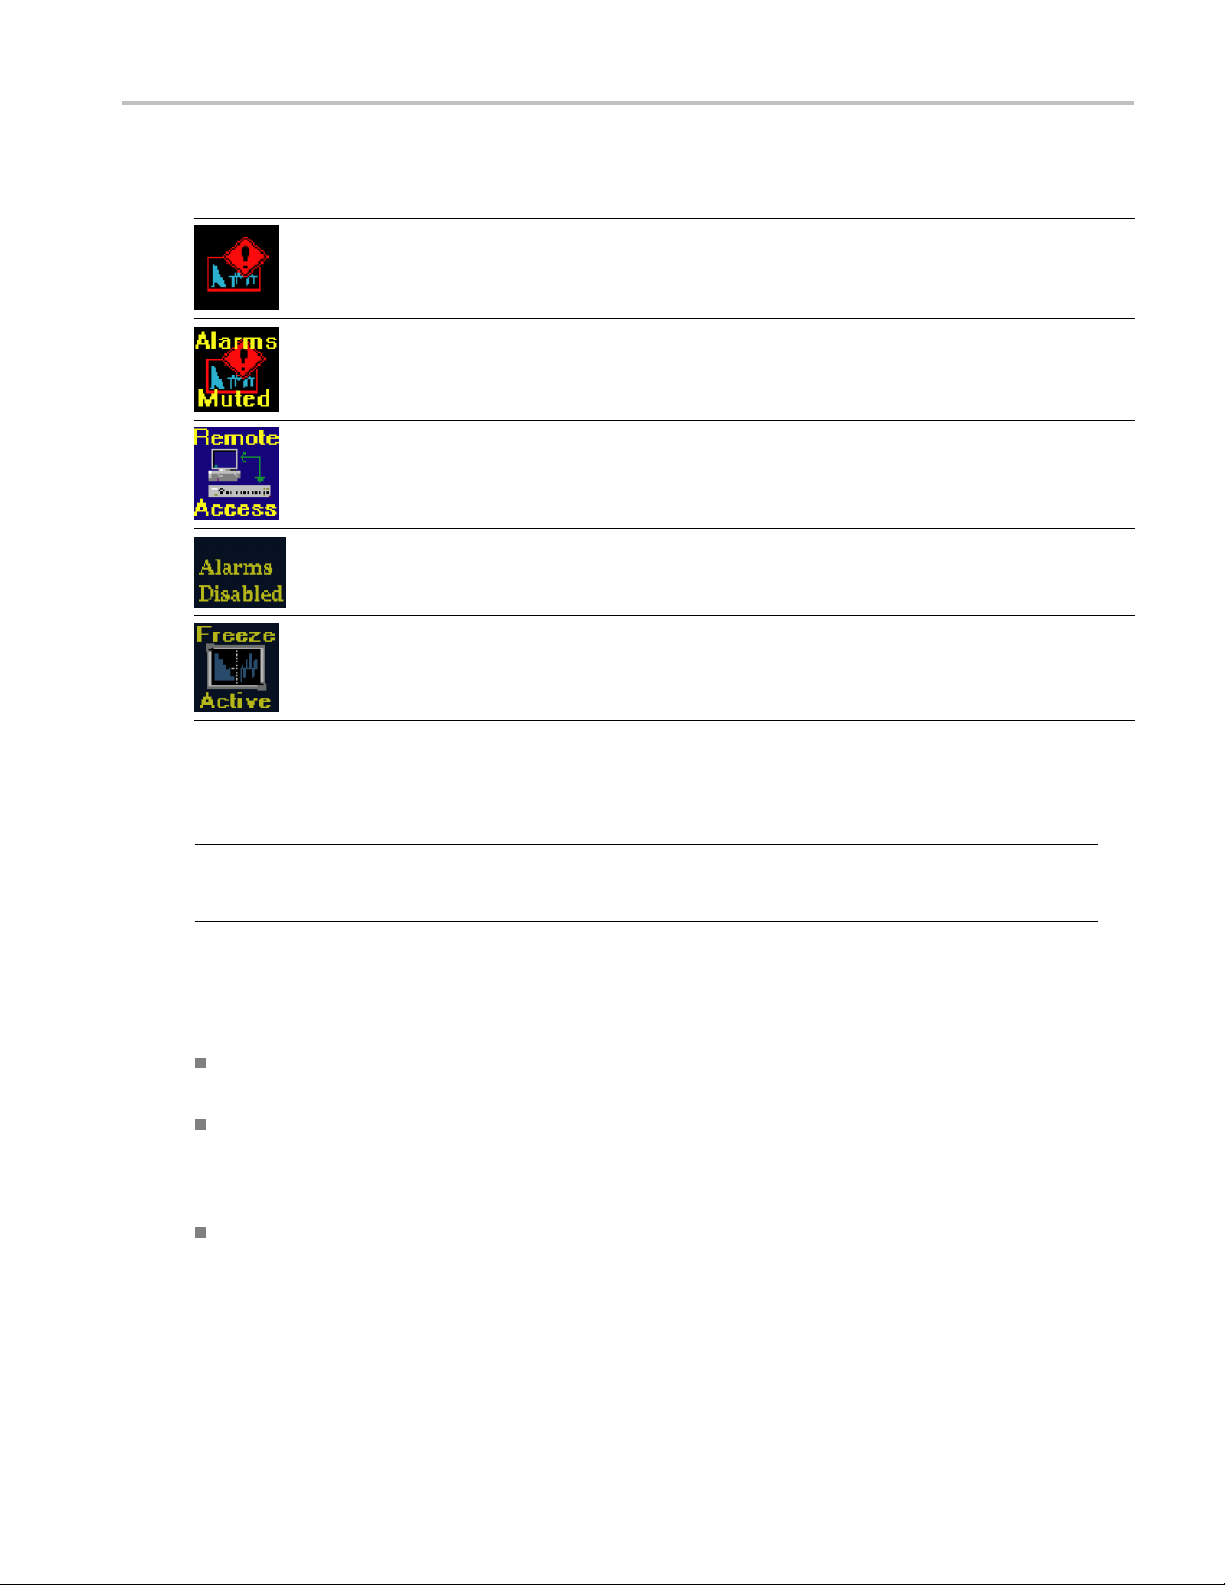
Status Bar Icons
Display Icons Description
Warning - Appears when an error or an a larm that is mapped to the user interface triggers.
Alarms Muted - Appears when the alarms are muted from the STATUS pop-up menu.
Remote Access - Appears when the waveform rasterizer is accessed from the network. For example,
when the sending commands to the waveform rasterizer from the remote interface.
Alarms Disabled - This text appears in the Status Bar when Alarms are disabled from the Configuration
menu.
Freeze Active - Appears when the tiles are frozen.
How to Operate Yo
ur Instrument
Front-Panel Controls
NOTE. Some of the controls that this section covers may not be present on your rasterizer, depending on which options are
installed. For a list of the options that are installed on your product, press the CONFIG button. In the C ONFIG menu, select
the Utilities submenu. The View Instruments Options entry lists the installed options for your instrument.
Three Levels of Control
You control the waveform rasterizer on three levels:
Frequently changed settings. The front-panel buttons control the most commonly changed parameters, such as which
measurem
Tile-spe
pop-up menus control less frequently changed parameters such as the waveform display mode (for example, changing
the waveform display mode from RGB to YPbPr). To display a pop-up menu, press and hold the desired MEASURE
SELECT o
Instrum
menu controls settings that are changed only occasionally, such as changing waveform color or s etting the network
address.
ent appears in each tile. The knobs are used to adjust levels and make selections.
cific settings. Pop-up menus control parameters that are specific to the tile in which they are displayed. The
r DISPLAY SELECT button for about a second.
ent-wide settings. The parameters in the Configuration menu are instrument-wide settings. The configuration
WVR6100, WVR7000, and WVR7100 Waveform Rasterizers Quick Start User Manual 15
Page 30
How to Operate Yo
Scope of Controls
Some controls are global and affect all tiles, while other controls only affect the active tile. Generally speaking, if a control is
configured by front-panel buttons or by a pop-up menu, it is tile specific. (Exceptions are the Input buttons, and all audio
features, both of which are global.) If control is configured by the CONFIG menu, selections are usually global.
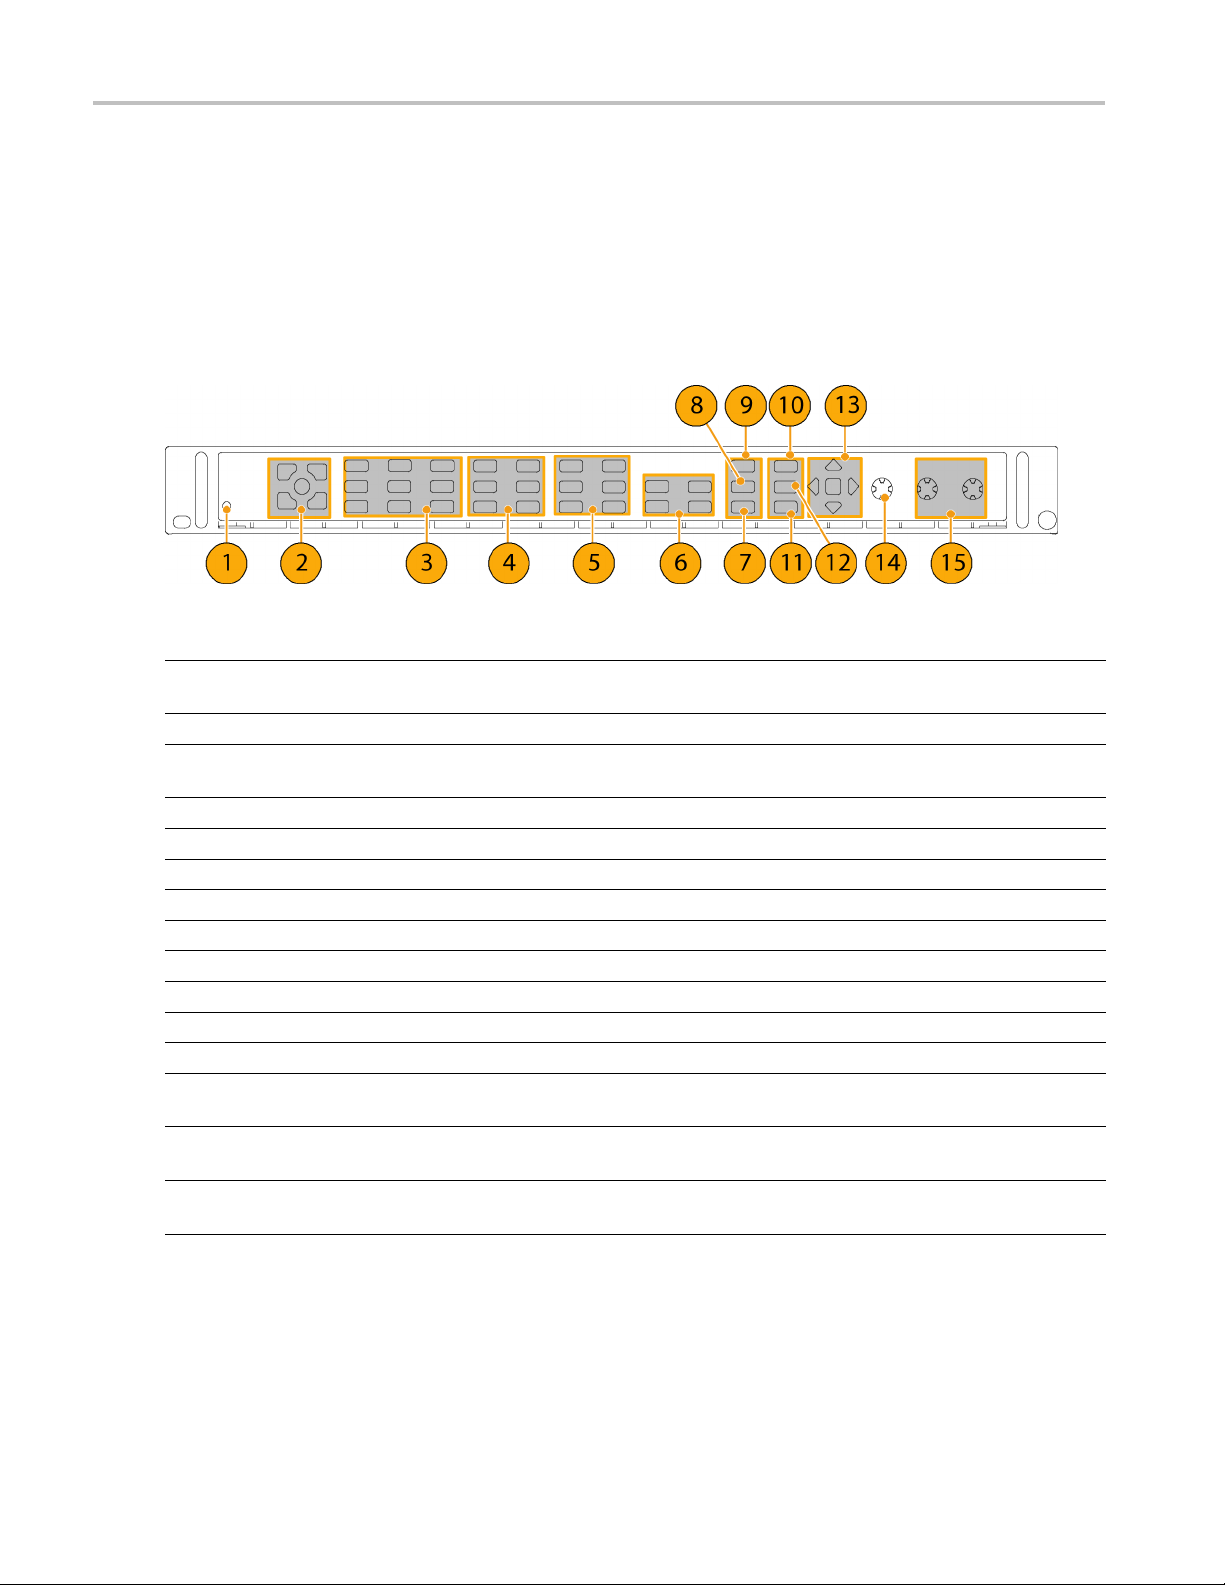
Layout and Usage
The front panel elements are shown below, referenced to the usage procedures that explain their operation.
Index Control Element or Group Usage Procedures
1
2 Tile-selector and tile buttons
3 Measurement buttons
4
5
6
7
8ExtREF
9 Freeze button
10 Help button
11
12
13
14
15 Vertical and Horizontal Knobs
1
Composite buttons present for Option CPS-equipped instruments only.
ur Instrument
FAULT (alarm) light
None. Indicates a hardware problem requiring
servicing
To Control the Display (See page 12.)
To Select a Measurement (See page 23.)
To Set Measurement Parameters (See page 24.)
Gain and Sweep Buttons To Set Gain and/or Sweep (See page 27.)
Preset Buttons
Input Selection Buttons
1
To U se Pr e s e t s (See page 28.)
To Select Among Inputs (See page 26.)
Line Select button To Set Line Select Mode (See page 33.)
HowToTimeaStudio(See page 38.)
To Freeze the Display (See page 31.)
To Use Online Help (See page 35.)
Cursors button To Measure Waveforms with Cursors (See page 29.)
Configuration menu button To C o n figure Your Instrument (See page 34.)
Up/Down/Left/Right Arrow keys and Sel Button Demonstrated in To Set Measurement Parameters
(See page 24.)
General Knob Demonstrated in To Select/Adjust a Parameter (See
page 35.)
None. Use to position waveforms when displayed in
tiles or full screen.
16 WVR6100, WVR7000, and WVR7100 Waveform Rasterizers Quick Start User Manual
Page 31

Rear-Panel Controls
Power Requirements
A single-phase power source with one
current-carrying conductor at or near
earth-ground (the neutral conductor).
A power source frequency is 50 or
60 Hz, and a operating voltage range is
from 100 to 240 VAC, continuous.
Systems with both current-carrying
conductors live with respect to ground
(such as phase-to-phase in multiphase
systems) are not recommended as
power sources.
NOTE. Only the line conductor is fused for
over-current protection. The fuse is internal.
Video Input Connectors
All are passive, loop-through inputs,
compensated for 75 Ω.
How to Operate Yo
ur Instrument
Index Connector Description
1
2
3
SDI A Loop-through
SDI B Loop-through
Ref Loop-through
The A component serial digital input
The B component serial digital input
A synchronization input. The input signal can be analog black
1
1
burst or analog composite video.
4
5
1
WVR7000 and WVR7100 instruments: Accept HD inputs only unless Option SD-equipped. Option SD-equipped instruments accept and
automatically detect both HD and SD signals.
WVR6100 instruments: Accept SD inputs only and cannot accept HD signals.
2
Input not present unless instrument is Option CPS-equipped.
Composite A Loop-through
Composite B Loop-through
The A composite analog input
The B composite analog input
2
2
WVR6100, WVR7000, and WVR7100 Waveform Rasterizers Quick Start User Manual 17
Page 32

How to Operate Yo
ur Instrument
AES A/B Connect
ors
These BNC connectors support AES audio
inputs based on the audio options installed.
(See page 2, Options.)
Index Connector Label Connector Label Key
1
2
3
4
5
6
7
8
1
The AES B connectors can output AES audio (from Analog, Digital, or Dolby) when configured from the Configuration menu.
AES A 1-2 In AES A
AES A 3-4 In AES B
AESA5-6In
AESA7-8In
AESB1-2I/O
AESB3-4I/O
AESB5-6I/O
AESB7-8I/O
1
1
1
1
AorB
1-2 In
3-4
5-6
7-8
Channels
supported
I/O
Input or
Input/Output
18 WVR6100, WVR7000, and WVR7100 Waveform Rasterizers Quick Start User Manual
Page 33

How to Operate Yo
ur Instrument
Analog Input/Output Connector
The Analog I/O connector is used to input and output analog signals. The Analog I/O connector is a 62-pin, D-subminiature
connector. Pin out and pin names follow.
CAUTION. Use care when connecting
the Analog Audio Output. Refer to the
instrument Specifications, to ensure Audio
Load and Output Power meet specifications.
Exceeding Analog Audio Output Power may
result in damage to the instrument.
Pin Name Key
ANALOG_INPUT
ANALOG_OUTPUT
_A 1 _N
_B 2 _P
3
4
2
4
6
8
10
12
14
16
18
20
22
24
26
N = Negative
P = Positive
ANALOG_INPUT_B1_P
ANALOG_INPUT_B2_P
ANALOG_INPUT_B3_P
ANALOG_INPUT_B4_P
ANALOG_INPUT_B5_P
ANALOG_INPUT_B6_P
ANALOG_OUTPUT_1_P
ANALOG_OUTPUT_3_P
ANALOG_OUTPUT_5_P
ANALOG_OUTPUT_7_P
ANALOG_INPUT_A1_N
ANALOG_INPUT_A2_N
ANALOG_INPUT_A3_N
Balanced differential analog
audio input or output
Pin Pin Name Pin Pin Name
1
3
5
7
9
11
13
15
17
19
21
23
25
ANALOG_INPUT_A1_P
ANALOG_INPUT_A2_P
ANALOG_INPUT_A3_P
ANALOG_INPUT_A4_P
ANALOG_INPUT_A5_P
ANALOG_INPUT_A6_P
GND (Ground)
ANALOG_OUTPUT_2_P
ANALOG_OUTPUT_4_P
ANALOG_OUTPUT_6_P
ANALOG_OUTPUT_8_P
ANALOG_INPUT_B1_N
ANALOG_INPUT_B2_N
Input A
Input B
Chan 1
Chan 2
Chan 3
Chan 4
WVR6100, WVR7000, and WVR7100 Waveform Rasterizers Quick Start User Manual 19
Page 34

How to Operate Yo
Pin Pin Name Pin Pin Name
27
29
31
33
35
37
39
41
43
45
47
49
51
53
55
57
59
61
ur Instrument
ANALOG_INPUT_B3_N
ANALOG_INPUT_B4_N
ANALOG_INPUT_B5_N
ANALOG_INPUT_B6_N
ANALOG_OUTPUT_1_N
ANALOG_OUTPUT_3_N
ANALOG_OUTPUT_5_N
ANALOG_OUTPUT_7_N
NC
NC
NC
NC
NC
NC
NC
NC
NC
NC
28
30
32
34
36
38
40
42
44
46
48
50
52
54
56
58
60
62
ANALOG_INPUT_A4_N
ANALOG_INPUT_A5_N
ANALOG_INPUT_A6_N
GND (Ground)
ANALOG_OUTPUT_2_N
ANALOG_OUTPUT_4_N
ANALOG_OUTPUT_6_N
ANALOG_OUTPUT_8_N
NC
NC
NC
NC
NC
NC
NC
NC
NC
NC
Connecting Signals. When connecting audio signals to the Analog Input connectors, you can use either balanced or
unbalanced signals. If you connect unbalanced signals to the inputs, you should connect the unbalanced output hot lead to
the balanced input positive pin and the unbalanced cold lead to the balanced input negative pin.
When connecting the Analog Output connectors, you can connect them as balanced or unbalanced. However, if you connect
the balanced outputs to an unbalanced input, you must ground the unused lead. You can ground either lead, but using the
negative output and grounding the positive output will effectively invert the phase.
NOTE. Note that grounding the unused lead does not attenuate the output but it does halve the clipping level. Therefore,
you must attenuate the output by at least 6 dB to avoid clipping. The output signal level in unbalanced mode is double
the signal level in balanced mode.
Units that have both analog and digital capability can have AES or embedded inputs converted to analog and then routed to
the eight balanced outputs.
20 WVR6100, WVR7000, and WVR7100 Waveform Rasterizers Quick Start User Manual
Page 35

How to Operate Yo
ur Instrument
XGA Connector and Pin Out
This is the display output. The display resolution is 1024 x 768, in 16–bit colors. The output is compatible with standard
analog PC monitors, either CRT or LCD-based. The REMOTE connector is a 15-pin D-type connector with socket contacts.
Pin Pin Name
1RedVideo
2
3 Blue Video
4
5
6
7
8
9
10
11
12
13
14
15
Green Video
NC
GND (Ground)
Red Ground
Green Ground
Blue Ground
+5 V (For monitor EEPROM)
NC
NC
2
ID Bit (I
C polling is not
supported)
Horizontal Sync
Vertical Sync
ID Clock
WVR6100, WVR7000, and WVR7100 Waveform Rasterizers Quick Start User Manual 21
Page 36

How to Operate Yo
Remote Connector and Pin Out
The REMOTE connector interface uses ground closures for remote control and indicating to external equipment when
alarms have occurred. The input of LTC is through the RE MOTE connector. The REMOTE connector is a 15-pin D-type
connector with socket contacts.
Pin Pin Name
1
2
3
4
5
6
7
8
9
10
11
12
13
14
15
ur Instrument
Reserved for future use
GND (Ground)
Reserved for future use
Reserved for future use
Recall Preset 1
GND (Ground)
+ Time Code (IN)
(Longitudinal Time Code
inputs)
–TimeCode(IN)
(Longitudinal Time Code
inputs)
Output (Goes to GND if alarm
asserted and if enabled)
Reserved for future use
Reserved for future use
Reserved for future use
Recall Preset 2 (IN)
Recall Preset 3 (IN)
Recall Preset 4 (IN)
Ethernet Connector
The waveform rasterizer provides a 10/100 BaseT Ethernet interface. The Ethernet connector is a standard RJ-45 connector.
n LED indicates connection is
Lit Gree
active
Lit Yellow LED indicates a 100 MB
transmission rate
Unlit Yellow LED indicates a 10 MB
ission rate
transm
22 WVR6100, WVR7000, and WVR7100 Waveform Rasterizers Quick Start User Manual
Page 37

To Select a Measurement
After you have selected a tile, you can choose what to display in it. The Measurement/Display type is independent
for each tile.
1. Select a tile as instructed in To Control
the Display. (See page 12.)
2. Push a button corresponding to the
measurement that you want to display
in the selected tile:
WFM - display of video waveform
PICT - display of the picture
generated by the video signal
GAMUT - display selectable for
three proprietary Tektronix views for
checking the gamut of an SDI signal
VECT - display of Vector or Lightning
plots of color signals
How to Operate Yo
ur Instrument
AUDIO - optional display of level
(meters) and of a phase (plot) for
monitoring audio signals If option DD
or DDE is present, you also display
Surround Sound
STATUS - extensive displays views
of signal status
MEAS - a Tektronix proprietary
display that simplifies timing
correction
OTHER - display for checking the
LTC amplitude and noise, and verify
LTC is locked to the video
EYE- display for checking the
transport layer of an SDI signal,
including jitter (not available on the
WVR7000)
NOTE. The EYE button is missing on earlier
versions of the WVR6100 and WVR7100
instruments. On those instruments, use the
MEAS button to access the Eye and Jitter
displays.
3. Repeat steps 1 and 2 until you have
selected measurement displays for all
tilesthatyouwishtodefine.
WVR6100, WVR7000, and WVR7100 Waveform Rasterizers Quick Start User Manual 23
Page 38

How to Operate Yo
ur Instrument
4. To display the s
more than one tile, select each tile in
sequence, and then choose the same
measurement fo
The display at right shows the display
with WFM selected for three tiles.
NOTE. Audio is
can be displayed in only one tile at a time.
To Set Meas
You can set up the measurements that you display using pop-up menus. Pop-up menus appear in the active tile. In general,
they control only settings specific to the active tile. For example, the pop-up menu for the Waveform display enables
you to s pecify the Display Mode.
The pop-up menu will appear when called (see the procedure that follows), unless it is not appropriate for the current setting
of the waveform rasterizer (for example, trying to display the Gamut menu when viewing a composite input signal).
ame measurements in
r each one.
the only measurement that
urement Parameters
1. Display the measurement in one of the
four tiles as explained in To Select a
Measurement. (See page 23.)
2. Push and hold the tile button for the
measurement that you displayed in
step 1.
3. When the menu pops up, navigate it and
make your selections as described in the
steps that follow.
24 WVR6100, WVR7000, and WVR7100 Waveform Rasterizers Quick Start User Manual
Page 39

4. Use the right and left keys to traverse
between menu panels. The instrument
surrounds the
panel selected with a blue
border.
5. Use the up and down arrow keys to
select parameters in a menu.
6. Press SEL to set the selected parameter.
The WFM pop-up menu with display mode
set to YPbPr is shown.
NOTE. The selections in a pop-up menu
can change depending on settings.
How to Operate Yo
ur Instrument
WVR6100, WVR7000, and WVR7100 Waveform Rasterizers Quick Start User Manual 25
Page 40

How to Operate Yo
ur Instrument
To Select Among Inputs
You can connect SDI (Serial Digital Interface) signals and select them for display. Depending on the rasterizer model and
options installed, you can also connect high-definition component, standard-definition component, and analog composite
signals.
To Select an SDI Input
1. Connect any d
signals to the A and B SDI inputs at the
rear panel:
WVR7000 and WVR7100: If Option
SD is install
automatically detects whether input
is HD or SD; otherwise connect HD
signals onl
WVR6100: Co
2. Connect any
to the A or B Composite inputs at the
rear panel. (On Option CPS equipped
instrumen
3. Terminate the loop through input properly
at the rear
connected.
4. Press the button corresponding to the
input that you want (SDI Input A shown).
igital component video
ed, the instrument
y.
nnect SD signal only.
analog composite signals
ts only.)
panel for any inputs that you
5. Select a tile and measurement in which
to display the input.
26 WVR6100, WVR7000, and WVR7100 Waveform Rasterizers Quick Start User Manual
Page 41

To Set Gain and/or Sweep
Each tile maintains its own settings independent of the other tiles. These settings include GAIN and SWEEP, and Display
Type (among others). For instance, when you switch a tile to a different measurement, the GAIN and SWEEP settings will
be changed to what they were the last time the selected measurement was displayed in the tile. As the procedure below
indicates, GAIN and SWEEP do not apply to all display types.
To Set Gain
1. Select a tile and a measurement as
explained in To Select a Measurement.
(See page 23.)
How to Operate Yo
ur Instrument
2. If GAIN is sel
buttons will be lit; otherwise select
a measurement that supports GAIN
selection,
for the GAIN setting that you want.
3. If you push VAR(iable), set the gain that
you want using the GENERAL knob.
ectable, one of the GAIN
such as WFM. Push the button
To Set Sweep
1. If SWEEP is selectable, one of the
SWEEP buttons will be lit; otherwise
select another measurement that
supports SWEEP selection, such as
WFM.
2. Push the button for the SWEEP setting
that you want.
LINE – Sets the active tile to the
current Line rate sweep or 2 Line
sweep
FIELD – Sets the active tile to the
current Field rate sweep or 2 Field
sweep
MAG – Sets the active tile to
Variable Gain. Gain is set using the
GENERAL knob.
3. Repeat steps 1 and 2 until you have
selected measurement displays for all
tilesthatyouwishtodefine.
WVR6100, WVR7000, and WVR7100 Waveform Rasterizers Quick Start User Manual 27
Page 42

How to Operate Yo
ur Instrument
To Use Presets
Presets let you save up to five custom setups for later recall. You can also recall a factory predefined setup.
To Recall the Factory Preset
1. Push the FACTO
The front panel setup will revert to default
factory settings.
To Save as Setu
2. Set up the instrument as you want it.
3. Push and hold the button of the numbered
preset in which to store the current
instrument setup. (Preset 1 shown.)
The setup will be stored for later recall.
RY button.
p to a Preset
To Recall an Existing Preset
4. Push the numb
youwishtorecall.
The front panel setup will switch to the
saved prese
pressed.
ered button for the preset
t corresponding to the button
To Clone a Setup Between
Rasterizers
You can store presets as filesonaPC
and upload them to any rasterizer. See
Cloning Setups (Presets) in the WVR6100,
WVR7000, and WVR7100 User Technical
Reference (found on the User Documents
CD) for more information.
28 WVR6100, WVR7000, and WVR7100 Waveform Rasterizers Quick Start User Manual
Page 43

To Measure Waveforms with Cursors
Cursors enable you to measure time or voltage on a waveform. Cursors appear only in a tile set to Waveform mode. If
the active tile is not in Waveform mode, then an error message is displayed.
To display and adjust cursors
1. Choose a tile that is currently displaying
a waveform.
2. Push the CURSOR button to display the
cursors on the selected tile. (Pushing
CURSOR again turns cursors off.)
3. Push the arrow keys to select the active
cursor:
If Voltage OR Time cursors are
displayed, press any arrow key to
select active cursor.
If Voltage AND Time cursors are
displayed for the voltage cursors,
press either the up or down arrow
key, and for time cursors, press
either the left or right arrow key to
change the active cursor.
How to Operate Yo
ur Instrument
4. Turn the general knob to adjust the
selected cursor on the waveform. Active
cursor readout appears in yellow with
knob icon.
NOTE. To quickly center the active cursor
on screen, press and hold the SEL button.
5. Repeat steps 3 and 4 to adjust the other
cursor.
6. Read the cursor m easurement in the
Cursors readout.
WVR6100, WVR7000, and WVR7100 Waveform Rasterizers Quick Start User Manual 29
Page 44

How to Operate Yo
ur Instrument
To Switch Among
1. Press and hold CURSOR to display the
Cursor pop-up menu.
2. Select Cursor Style, and press SEL to
change the focus to the submenu.
3. Select the desired cursor type using the
up/down arrow keys. The three styles of
cursors available are:
Voltage – display the voltage level
at each cursor and the voltage
difference between the two cursors.
Time – display the position of each
cursor relative to the start of the
sweep and the difference between
the two curs ors.
Voltage + Time – displays both the
Voltage and Time cursors.
Cursor Types
Usage Ti
If you use other functions, such as Line Select, while cursors are active, the knob will be assigned to those other functions.
Press CURSOR to transfer the knob control back to cursors.
You can display independent cursors in all four tiles at the same time.
Cursors track the live trace, so they may not be correctly registered on a frozen trace.
Cursors can be used with the Eye Display (Option EYE or PHY only) to measure electrical characteristics of an SDI signal.
(See page 56, How to Monitor the SDI Physical Layer.)
For cursor measurements, you can use any gain setting, including variable gain (the waveform and the cursors are equally
affected). Higher gain settings help match the cursor to the waveform.
ps
30 WVR6100, WVR7000, and WVR7100 Waveform Rasterizers Quick Start User Manual
Page 45

To Freeze the Display
Pushing the FREEZE button captures the current image for traces (waveform, gamut, and vector), picture, status, and audio
measurements, if selected. Freeze is useful for comparing sources or for capturing transient events. Press FREEZE to
capture a display you wish to keep or show to someone else. In this application, the Fr ozen Only display mode may be best.
For comparing sources, the Frozen + Live display mode is useful. To use this feature, select one source, press FREEZE to
capture an image, then select the second source and compare.
Not all displays react identically to freeze. WFM displays capture a trace. For text displays, such as Status, pressing
FREEZE halts updates to the display. T his allows you to view the different status displays without numbers or status readouts
changing. The waveform rasterizer continues to log error status in the background while the display is frozen.
FREEZE works in both tile and full-screen m odes, but frozen images do not change from tile to full or full to tile. That is, if
you freeze a trace in tile mode, the frozen image will not be shown if you go to full-screen mode. The frozen image will
still be available if you go back to tile mode. Likewise, if you freeze a Waveform image in a tile and then switch the tile to
another measurement such as Vector, the frozen wavefo rm image will be hidden. If you then change the tile back to
Waveform, the frozen image will reappear.
For waveform displays, the frozen image is shown in a different color to distinguish it from the live image.
To Halt Display Update
1. Push the FREEZE button. For most
displays, updates stop.
How to Operate Yo
ur Instrument
To Select the FREEZE Display
Mode
1. Push and hold FREEZE to display the
pop-up menu.
2. Use the navigation keys to select the
desired mode, and then press SEL to set
the FREEZE display mode:
Live Only allows you to keep a
frozen image, but not display it.
Frozen Only allows you to see
artifacts in the frozen trace more
easily.
Live + Frozen allows comparisons
and matching. (STATUS and AUDIO
displays do not support this mode.)
NOTE. The display mode chosen is
specific to the tile selected, and can be set
independently.
WVR6100, WVR7000, and WVR7100 Waveform Rasterizers Quick Start User Manual 31
Page 46

How to Operate Yo
ur Instrument
To Delete the FR
1. Select the display tile for the frozen
display that you want to delete.
2. Push and hold FREEZE to display the
pop-up menu. Delete Frozen Image will
be already selected.
EEZE Display
3. Press SEL to delete the frozen image.
The pop-up menu is automatically
removed from the display when the
frozen image is deleted.
32 WVR6100, WVR7000, and WVR7100 Waveform Rasterizers Quick Start User Manual
Page 47

Usage Tips
FREEZE can be configured to act on only the active tile or on all tiles. To change the FREEZE from Active Tile to All Tiles,
youmustgototheDisplay Settings Configuration menu.
Cursors track the live trace, so they may not be correctly registered on a frozen trace. If you change parameters such as
position, sweep rate, or gain, then the c ursors may not be accurate relative to a frozen trace.
ToSetLineSelectMode
To Toggle Line Select Mode
1. Select the tile containing the display for
which you want to set Line Select Mode.
How to Operate Yo
ur Instrument
NOTE. Line Se
on one tile at a time, but the line select
brightup cursor does appear in other tiles,
and moves as y
tile.
2. Push LINE SEL to toggle Line Select
Mode on or of
displays the selected line information
only. The Line selection menu appears
at the bott
3. Press the l
F1 (field 1), F2 (field 2), F3 (field3), F4
(field 4), or All.
4. Turn the GENERAL knob to select the
line you wa
lect Mode can only be active
ou select lines in the active
f. When on, the tile
om of the selected tile.
eft or right arrow key to select
nt to view.
WVR6100, WVR7000, and WVR7100 Waveform Rasterizers Quick Start User Manual 33
Page 48

How to Operate Yo
ur Instrument
To Confi gure Your Instrument
The Configuration menu is used to change the settings of the waveform rasterizer that are changed only occasionally or
settings that are not specific to a tile, such as printer settings. To change a setting, you must highlight the desired setting:
To Traverse the Menu Panes
1. Press the CONFIG button to display the
Configuratio
The Configuration menu is displayed
on the top or bottom half of the screen
opposite the
n menu.
active tile.
2. Use the left/
selection back and forth among panels.
The selected, active pane is boxed by
a blue line.
right arrow keys to move the
34 WVR6100, WVR7000, and WVR7100 Waveform Rasterizers Quick Start User Manual
Page 49

How to Operate Yo
ur Instrument
To Select/Adju
3. Use the up/down arrow keys (or the
General knob) to move the selection
up and down the menu entries in the
selected pane.
The selected, active menu item is
highlighted by a white menu bar; the
selected item in unselected menus
highlighted by a blue menu bar.
4. Push the SEL key (or right-arrow key)
to toggle between parameter settings.
For example, if Peak Held Segment was
highlighted at right, pushing SEL toggles
between On and Off settings.
5. If the menu item selected results in the
knob icon appearing in the menu, use
the General knob to adjust the selected
parameter.
st a Parameter
To Use Online Help
The online help is both a quick reference to instrument operation, and the exclusive reference for the details of instrument
operation. The online help is:
Context-sensitive, where the topic displayed depends on what is displayed in the active tile when the online help is
selected, or what control is operated after help is selected.
Navigable, with the C ontents and Topic Selector panes, along with Links within the topics, providing access to topics.
WVR6100, WVR7000, and WVR7100 Waveform Rasterizers Quick Start User Manual 35
Page 50

How to Operate Yo
ur Instrument
To Display and N
avigate Online
Help
1. Press HELP.
2. Use the GENERAL knob or the up /
down arrow keys to highlight a entry in
the Contents (entries never change).
3. Press SEL to select the highlighted
category.
4. Press the right-arrow key to move
selection to the Topic Selector pane
(entries change with the selection made
in steps 2 and 3).
5. Use the GENERAL knob and the up /
down arrow keys to select among the
topics listed for the heading selected in
step 2.
6. Press SEL to display the selected topic.
36 WVR6100, WVR7000, and WVR7100 Waveform Rasterizers Quick Start User Manual
Page 51

How to Operate Yo
ur Instrument
To Follow a Link
Within a Help
Topic
1. Press the right-arrow key to move
selection to the Topic pane.
2. Highlight a link using the GENERAL
knob or the up / down arrow key.
3. Press SEL to jump to the linked-to topic.
4. Press the left-arrow key to go back to the
previous topic.
To Get Context Sensitive Help
1. When you want help on the control or
setting y
If you displayed a menu in the active tile, and
select a menu setting, help on that setting
displays
ou are using now, press HELP.
.
2. Now opera
control that you need help with. The help
topic pane displays help on the control
you used.
To exit t
1. Press HE
NOTE. You can also access online help on a computer networked to the rasterizer. See Remote Communication in the
WVR6100, WVR7000, and WVR7100 User Technical Reference (located on the User Documents CD) for more information
on usin
te (press, select, turn) a
he online help:
LP to turn off the lighted button.
g the Web Browser from the remote Java Applet or Application.
WVR6100, WVR7000, and WVR7100 Waveform Rasterizers Quick Start User Manual 37
Page 52

HowtoTimeaStud
io
HowtoTimeaSt
Timing a studio involves adjusting the references going to different sources so that their output feeds have the same timing
when they arrive a common point, such as a production switcher. For digital systems, the timing typically only needs to be
close, because most switchers have some tolerance to timing errors. For analog composite systems, the timing may need to
be matched within a small part of a subcarrier cycle to prevent hue shifts when switching between sources.
The waveform rasterizer supports multiple methods and techniques of timing a studio. All of these methods require an
external reference to the waveform rasterizers. The methods and techniques follow.
udio
To Use the Traditional Method
This instrument makes the traditional method of comparing H orizontal and Vertical timing easier by providing flexible tiles
and the FREEZ
signals that you time against the baseline.
1. Selectatileinwhichtotimetheactive
input. Sele
2. Apply the fir
appropriate input, terminate it properly,
and select it. (See page 10, Line
Term i n a ti
3. Push and hol
mode from the Pop up menu that is
appropriate to the signal that you input.
E function. To time a studio using the traditional method, you store an input as a baseline and compare
ct WFM.
st input signal to the
on.)
d WFM. Select a display
4. Apply the house reference signal to the
external r
properly.
5. Press EX
mode. (Connected to the house
reference.)
6. Put the selected tile in line mode.
7. Use the HORIZONTAL knob to center
the sync
using the SAV pulse, turn off Stripping
EAV/SAV/ANC in the SDI Input settings
of the C
8. Press M
resolution.
eference input, terminating it
T to select External Reference
edge or the SAV pulse. (If
ONFIG Menu.)
AG to increase the timing
38 WVR6100, WVR7000, and WVR7100 Waveform Rasterizers Quick Start User Manual
Page 53

9. Select a second tile.
10. Press FIELD to put a second tile in field
mode, choose an appropriate waveform
mode.
HowtoTimeaStud
io
11. Use the HORIZON
the vertical interval.
12. Press MAG to increase the timing
resolution.
13. Press FREEZE save the waveform as
a baseline.
14. Apply an input that needs to match timing
of the first in
15. Adjust the ti
being timed to m atch the timing to the
saved baseline.
16. Repeat steps 14 and 15 for any other
required sig
NOTE. Use the Cursors as markers or to measure timing differences between sources.
In this procedure, other tiles can be used to set fine timing and check color frame alignment on composite signals.
vely, the other two tiles could be used for line and field rate displays without Mag active to show the location
Alternati
of significantly mis-timed signals.
TAL knob to center
put.
ming offset of the signal
nals.
To Use the Timing-Display Method
The Tektronix proprietary Timing Display (patent pending) provides a quicker, easier to use measure of the timing of an input
relative to the external reference:
The rectangular display automatically scales to match the input signal. For progressive signals the display represents
one field, for interlace signals the display represents one frame, and for composite inputs the display represents one
color frame.
The cross-hair in the center represents zero offset, and the circle represents the timing of the input signal. Lines of
advance or delay are shown as vertical displacement, while timing errors of less than one line are shown as horizontal
displacement. If the input is at the same time as the reference, then the circle will be centered on the cross-hair.
The timing offset is also shown numerically as lines and micro-seconds of advance or delay in the boxes at the right
side of the display.
For input and reference signals with closely related frame rates, there is only one timing relationship, so a single circle is
shown on the display to indicate the timing offset of the input signal.
WVR6100, WVR7000, and WVR7100 Waveform Rasterizers Quick Start User Manual 39
Page 54

HowtoTimeaStud
For input and reference combinations with more complex relationships, multiple circles are displayed to indicate all the
possible inter
readouts will correspond to the timing indicator circle with the emphasis.
The Relative to: box indicates the chosen zero point for the timing display. The default is Rear Panel. In this mode,
the offset is zero when the input and reference are at the same timing at the rear panel of the waveform rasterizer.
The other choi
relative to that saved offset.
To Use the Timing Display to Time a Signal to a Reference
1. Selectatileinwhichtotimetheactive
input.
2. Apply the input signal to be timed to the
appropriate input, terminate it properly,
and select it. (See page 10, Line
Term i n a ti o n .)
3. Apply the house reference signal to the
external reference input, terminating it
properly.
io
pretations of the timing offset, with the one that is closest to zero shown with emphasis. The numerical
ce is Saved Offset. In this mode, you can save the timing from one signal and then display the timing
4. Press EXT to select External Reference
mode.
5. Press MEAS to select the Timing display
for the tile selected in step 1.
6. If only one circle is displayed, adjust
the timing offset of the black generator
to m atch the timing to the external
reference. Adjust for a perfect
coincidence of the circle around the
reference target (circle turns green at
coincidence) and null values of the
vertical and horizontal timing readouts.
7. If multiple c ircles are displayed, the
timing is complex, and you must choose
the one you want. The measurement that
is closest to zero offset is displayed with
emphasis and appears in the readouts.
NOTE. See Timing Displays for Simple
Versus Complex Timing in the WVR6100,
WVR7000, and WVR7100 User Technical
Reference for more information about
complex timing displays and their elements.
8. Repeat step 6 or 7 for any other signals.
40 WVR6100, WVR7000, and WVR7100 Waveform Rasterizers Quick Start User Manual
Page 55

HowtoTimeaStud
NOTE. As you adjust timing, the circle representing the input timing may jump occasionally. This is because the color frame
detection circ
will settle back to the correct location in a second or so.
uit can be temporarily disrupted as the signal shifts. The jump is often a multiple of the field time. The circle
Usage Notes
The resolution of the timing display for Composite and SD signals is one 27 MHz clock cycle or 37 ns. For HD signals, it
is one clock at 74.25 MHz, which equates to about 13.5 ns. To get the greater accuracy needed for a composite
signal, first use the timing display to get close, then use a vector display for the final burst phase alignment. Since the
waveform rasterizer can display both the timing display and a vector display simultaneously (each in its own tile), this
process can still be easy and quick.
For composite signals the definition of time aligned is obvious but for an SDI input relative to a analog reference the
situation is more complex. For the timing display, the definition of zero offset on an SDI input uses the methodology
described in SMPTE RP168. This method speci fies the SDI signal will be converted to analog. The converted analog
signal is then compared to the analog reference. For the conversion, a D/A converter w ith delay of about three
microseconds is used.
In the relative to rear panel mode, this three microsecond c onversion delay is accounted for in the displayed offset.
In the Relative to Saved Offset mode, it has no effect.
io
To Time Multiple Inputs to a Router
You can also use the Relative to: function to set the offset between a master signal and a reference signal as the zero-point
reference for time-down applications. The Relative to: box indicates the chosen zero point for the timing display:
Rear Panel. In this mode (default), the offset is zero when the m easured signal input and reference are at the same
timing at t
Saved Offs
offset. Then route other inputs and measure relative to this saved offset.
he reference at the instrument rear panel. This setting was used in the Timing Display Method procedure.
et. In this mode, you can save the timing from a master signal relative to the reference as the zero point
WVR6100, WVR7000, and WVR7100 Waveform Rasterizers Quick Start User Manual 41
Page 56

HowtoTimeaStud
To Time the Inputs to a Router
1. Perform steps 1 through 5 of the previous
procedure. (See page 40, To Us e t h e
Timing Display to Time a Signal to a
Reference.)
2. Route the signal you want as the
master to the appropriate input, SDI or
Composite, and terminate properly.
3. Route the reference signal to the
reference input and terminate
appropriately.
4. Save1thetimingoffsetforthemaster
input ( MEAS > Save Offset > Press >
Select ) and select Relative to: Saved
Offset mode from the pop-up menu.
5. Now select other inputs to the router to
be connected to the waveform rasterizer.
For each input the relative timing will be
displayed.
io
6. Adjust the timing offset at the master
sync source to time down the inputs to
the router to match the master.
1
You cannot save the timing offset if either the input or reference is missing or unlocked. You also cannot save a reference when in internal mode.
Saving an offset in these conditions would lead to misleading results so it is not allowed by the instrument. A warning message will appear on
the screen if you attempt to save the offset when it is not allowed.
Usage Notes
The resolution of the timing display is one 27 MHz clock cycle or 37 ns, for Composite and SD video. To get the greater
accuracy needed for a composite signal, first use the timing display to get close, and then use a vector display for the
final burst phase alignment. Since these two displays can be present simultaneously in separate tiles, this process is
still easy and quick.
For composite signals, the definition of time aligned is straight forward, but for an SDI input relative to an analog
reference, the s ituation is more complex. For the timing display, the definition of zero offset on an SDI input assumes the
SDI signal will be converted to composite. The converted composite signal is then compared to the analog reference.
For the conversion, a half-band filter with a 33 clock-cycle delay and an analog reconstruction filter are assumed. This
conversion introduces a delay of about 3 µs.
In the Relative to: Rear Panel mode, this 3 µs conversion delay is removed from the measured offset before the display
is generated. In the Relative to: Saved Offset mode, it has no effect.
This timing relationship between input and reference is also compatible with the waveform mode. That is, if you have zero
timing on the Timing display and change from internal to external reference, the displayed waveform will not shift position.
When timing analog composite s ignals, adjust the system phase with the Vector display. The Vector display is described
in Timing Displays for Simple Versus Complex Timing in the Supplemental Operating Information chapter of the
WVR61000, WVR7000, and WVR7100 User Technical Reference.
42 WVR6100, WVR7000, and WVR7100 Waveform Rasterizers Quick Start User Manual
Page 57

HowtoTimeaStud
NOTE. If you have an input and reference combination that requires m ultiple timing indicator circles, then it can be
misleading to c
ompare timing offsets between multiple inputs. Because the timing display chooses the smallest of the
possible timing offsets, if a large timing difference exists between two inputs, then they may not be matched. This problem
will also occur using traditional timing methods unless one uses something similar to the SMPTE318 10 field flag to identify a
specific sub-m
ultiple of the reference.
io
WVR6100, WVR7000, and WVR7100 Waveform Rasterizers Quick Start User Manual 43
Page 58

How to Check Chro
ma/Luma Delay (Lightning Display)
How to Check Ch
The Lightning display can be used for interchannel timing measurement. If the color-difference signal is not coincident with
luma, the transitions between the color dots will deviate from the center mark of a delay scale. The amount deviated
represents the relative signal delay between luma and color-difference signal.
1. Connect a signal containing color
bar information, terminating the
signal properly. (See page 10, Line
Term i n a ti o n .)
2. Select the input corresponding to the
signal connected.
3. Select a tile.
4. Press and hold the VECT button to
display the signal in a tile and pop up the
Vector menu.
roma/Luma Delay (Lightning Display)
5. Use the Selection Keys and Button to set
the menu in the steps that follow.
6. If Display Type is Vector, select
Lightning in the menu.
7. Set BarTargets to match your input
signal.
8. Select Center Waveform, and press
SEL if you want center your waveform.
9. Press the VECT button to close the
menu.
44 WVR6100, WVR7000, and WVR7100 Waveform Rasterizers Quick Start User Manual
Page 59

How to Check Chro
ma/Luma Delay (Lightning Display)
10. Determine wher
e transitions intersect
the delay scales and derive the timing
error in nanoseconds, as deflected from
center mark:
The center mark
oftheninemarks
spanning each green-magenta
transition is the zero error point.
Alignment to a m ark towards black
means the colo
r-difference signal
lags with respect to luma.
Alignment to a m ark towards white
means the color-difference signal
leads the lum
The upper hal
a signal.
fofthedisplay
measures the Pb to Y timing; the
bottom half measures the Pr to Y
timing.
Deflectio
n
SD HD
0 marks 0 ns 0 ns
± 1 mark 20 ns 2 ns
±2marks 40ns
±3marks
±4marks
1
2
1
2
Luma sample
Chroma sam
74 ns 13.5 ns
148 ns 27 ns
ple
5ns
WVR6100, WVR7000, and WVR7100 Waveform Rasterizers Quick Start User Manual 45
Page 60

How to Check Gamu
t
How to Check Ga
Signals that are legal and valid in one signal representation may not be legal in another representation. Speci fi cally, signals
which are legal in the Digital YCbCr representation may not be legal if transcoded to RGB or encoded to NTSC / PAL.
Any signal that fails this test is considered out of gamut.
The waveform rasterizer supports multiple displays and alarms to allow detecting out of gamut signals. The flexible tile
display allows you to simultaneously view several of the gamut measurements to learn which is most appropriate for a
given application. The displays are:
Diamond for checking that SDI signals conform to legal RGB gamut space
Split Diamond separates the upper and lower diamonds to show excursions below black, otherwise it is identical to
the Diamond display
Arrowhead for checking if an SDI signal is legal for composite color space
Composite Waveform modes for checking both SDI and composite signals for legality in composite color space
mut
46 WVR6100, WVR7000, and WVR7100 Waveform Rasterizers Quick Start User Manual
Page 61

Diamond, Split Diamond, and Arrowhead have adjustable thresholds. If the signal goes outside the area defined by the
thresholds, th
configured to do so. For composite w aveforms, the legal limit is simply the maximum level allowed for the combination of
luma and chroma. This limit depends on the application. For example, a video tape machine may be able to record and
play out signa
e signal is out of gamut. If these limits are exceeded then the waveform rasterizer can generate alarms if
ls with higher luma and chroma components that a transmitter.
ToSetUpforGamutChecks
1. Connect a video signal and terminate it
properly.
How to Check Gamu
t
2. Select the in
signal connected.
3. Select a tile.
4. Press and hold the GAMUT button to
display the signal in a tile and pop up the
GAMUT men
put corresponding to the
u.
WVR6100, WVR7000, and WVR7100 Waveform Rasterizers Quick Start User Manual 47
Page 62

How to Check Gamu
5. Use the Arrow Keys and SEL Button to
set the menu to one of these three gamut
displays:
t
Diamond. Use to
and correct RGB component gamut
errors.
Split Diamond. Use to reveal
hard-to-find b
Arrowhead. Us
lack gamut errors.
e to detect c omposite
gamut errors, without employing a
composite encoder.
6. Press the GAMUT button to close the
menu.
To Check RGB Gamut
detect, isolate,
The Diamond display effectively shows how
the R, G, and B signals relate, making it a
good tool for detecting gamut errors. The
waveform rasterizer converts the Y, P
b,
and P
components recovered from the serial signal
to R, G, and B to form the Diamond display.
To predictably display all three components,
they must lie between peak white, 700 mV,
and black, 0 V.
For a signal to be in gamut, all signal vectors
must lie within the G-B and G-R diamonds.
Conversely, if a signal vector extends outside
the diamond, it is out of gamut. The direction
of an excursion out of gamut indicates
which signal is e xcessive. Errors in green
amplitude affect both diamonds equally,
while blue amplitude errors affect only the
top diamond and red errors affect only the
bottom diamond.
r
48 WVR6100, WVR7000, and WVR7100 Waveform Rasterizers Quick Start User Manual
Page 63

1. Perform the ToSetUpforGamutChecks
procedure. Select Diamond in step 5.
(See page 47.)
How to Check Gamu
t
2. Compare the sig
determine out of gamut components,
noting the following:
The intensity of a vector indicates its
duration.
A momentary ou
appears as a faint trace. Long
duration violations show as a bright
trace.
See the following step for some sample
out-of-gamut signals.
3. Consider the following examples when
evaluating for out of gamut components:
A. Example A:
R-Ok
G > 700 mV
B-Ok
B. Example B:
R-Ok
G-Ok
B > 700 mV
C. Example C:
R-Ok
G - Ok, 350 mV
B<0mV
nal to the display to
t-of-gamut condition
Usage Notes
h the lightning display, bending of the transitions indicates timing delays. When a color bar signal is applied, the
As wit
vertical axis becomes an indicator of delay errors.
On the Diamond Display, monochrome signals appear as vertical lines. Nonlinear component processing, such as from a
gamma corrector that alters white balance, can cause deviations along the vertical axis.
To isolate gamut bright-ups, try the following:
Use LINE SEL to select individual lines
WVR6100, WVR7000, and WVR7100 Waveform Rasterizers Quick Start User Manual 49
Page 64

How to Check Gamu
t
Use PICT to examine the signal (turn on gamut bright-ups in the Display Settings submenu of the CONFIG menu)
Use Arrowhead % setting (CONFIG menu, Gamut Thresholds submenu) to specify a percentage of the screen for
which to ignore
for gamut violations.
To Check Composite Gamut
The Arrowhead gamut display plots luminance (Y) against chrominance (C) to check if the composite signal adheres to
standard gamut. NTSC and PAL Arrowhead displays (75% Color bars) and indicates the values of the graticule lines. The
arrow-head shape of the graticule results from overlaying the standard limits for luminance and luminance plus peak
chrominance.
50 WVR6100, WVR7000, and WVR7100 Waveform Rasterizers Quick Start User Manual
Page 65

1. Perform the ToSetUpforGamutChecks
procedure. Select Arrowhead in step 5.
(See page 47.)
How to Check Gamu
t
2. Compare the sig
determine out of gamut composite
components, noting the following:
Signals exceeding the luminance
amplitude gam
top horizontal limit (top electronic
graticule line).
Signals exceeding the luminance
plus peak chr
gamut extend beyond the upper and
lower diagonal limits.
The bottom horizontal line shows the
minimum allo
7.5 IRE for NTSC and 0 mV for PAL.
nal to the display to
ut extend above the
ominance amplitude
wed luminance level of
Usage Notes
To adjust the IRE level limits, do the procedure To Adjust Gamut Limits. (See page 55.)
To automate this check, do the procedure To Automate Gamut Checks. (See page 53.)
WVR6100, WVR7000, and WVR7100 Waveform Rasterizers Quick Start User Manual 51
Page 66

How to Check Gamu
t
ToCheckLumaGamut
Luma limit thresholds can be configured for identifying luma exceeding threshold limits. They apply to both the incoming
SDI and to the arrowhead representation of the SDI input as a composite signal. By defining these levels in percent, they
automatically account for the presence or absence of setup.
The thresholds are affected by your choice of set-up or no set-up for the Arrowhead display.
1. Perform the To Set Up for Gamut Checks
procedure. Select Arrowhead in step 5.
(See page 47.)
2. Compare the signal to display to
determine out of gamut luminance. Note
the following:
The adjustable thresholds are
indicated by the dark blue horizontal
graticule lines.
The thresholds are defined in terms
of percent of full scale.
The range for the Upper limit is 90%
to 108%.
The range to the Lower Limit is -6%
to +5%.
Another useful Arrowhead function is a measure of how well the a ctive v ideo signal is using the dynamic range of the video
channel. A properly adjusted signal should be centered in the arrowhead graticule and have transitions that approach
all the limits.
52 WVR6100, WVR7000, and WVR7100 Waveform Rasterizers Quick Start User Manual
Page 67

To Automate Gamut Checks
You can use alarms to automatically monitor for out of gamut conditions:
1. Press the CONFIG button to display the
Configuration menu.
2. Use the left/right arrow keys and SEL
buttontoselectAlarms, and then Video
Content.
3. Use the up/down arrow keys to move
to each the alarm that you want to set.
Press SEL button to toggle the alarm on
(X)oroff.
How to Check Gamu
t
4. When you have configured the A larms
as you want them, move to the Select
here.. box and select it.
WVR6100, WVR7000, and WVR7100 Waveform Rasterizers Quick Start User Manual 53
Page 68

How to Check Gamu
5. Check that Enable Alarms is set to On
in the Alarms menu before leaving the
Alarms menu.
NOTE. For information on Alarms, press the
HELP button while Alarms is selected in the
CONFIG menu.
6. Press CONFIG to exit the menu.
t
54 WVR6100, WVR7000, and WVR7100 Waveform Rasterizers Quick Start User Manual
Page 69

To Adjust Gamut Limits
How to Check Gamu
t
1. Press the CONF
Configuration menu.
2. Use the left/right arrow keys and SEL
button to select Gamut Thresholds.
3. Press SEL button to enter the submenu,
and use arrow
General knob, when indicated) to select
and set the various thresholds as you
want them.
Note that you can also reset thresholds
to defaults.
IG button to display the
keys and SEL button (and
WVR6100, WVR7000, and WVR7100 Waveform Rasterizers Quick Start User Manual 55
Page 70

How to M onitor th
e SDI Physical Layer
How to Monitor
With Options EYE and PHY (WVR6100 and WVR7100), the waveform rasterizer supports monitoring and measurement of
the SDI physical layer in the following ways:
Option EYE. If present, this option adds support for eye pattern monitoring of the physical layer of video signals.
WVR6100 instruments display eye patterns for only SD signals. WVR7100 instruments display eye patterns for HD
signals, and also for SD signals when Option SD is installed.
Option PHY. If present, this option includes the Option EYE features and adds automatic eye measurements and a
jitter waveform display to aid the moni toring of the SDI physical layer. WVR6100 instruments display jitter waveforms
for only SD signals. WVR7100 instruments display jitter waveforms for HD signals, and also for SD signals when
Option SD is installed.
With Options Eye and PHY installed, you can use the following display modes to monitor the SDI physical layer:
Eye Display. On this display, you can use the voltage and time measurement cursors and their readouts to monitor
amplitude and timing measurements on the Eye waveform. A jitter thermometer and readout displays the jitter
magnitude. You can set the high-pass filter to allow measurement of different jitter types (timing and alignment). The jitter
thermometer graphically relates the jitter measurement to the alarm limits. With Option PHY installed, you can use the
Eye press-and-hold menu to access the Jitter waveform display.
You can c o nfigure the instrument to show multiple Eye displays, each of which is controlled by one of the two jitter engines
in the waveform rasterizer. The Jitter1 engine controls Eye displays in the top two tiles. The Jitter2 engine controls Eye
displays in the bottom two tiles. The two jitter engines allows you to set different filter bandwidths in the upper and lower
tiles so that you can monitor both timing and alignment jitter at the same time.
the SDI Physical Layer
Jitter Display. On this display, you can view additional time-domain information that is useful in separating sources of
jitter, whether they are w ithin a single circuit on a circuit board, or from various pieces of equipment in a system. The
additional information includes the following:
Jitter components that are synchronous or nearly synchronous to video line or frame. These appear as stationary or
near-stationary artifacts in line or field sweeps.
The wave shape of the jitter as modified by the high-pass filter setting.
SDI Status Display. This display shows both the Jitter1 and Jitter2 thermometers described above. Additionally, a Cable
Loss thermometer indicates the signal loss due to cable length. Use the CONFIG menu to con figure the instrument for
the cable type and length of your installation. With Option PHY installed, the SDI Status Display also shows the eye
amplitude, eye risetime, eye falltime, and eye rise-fall delta measurement values.
56 WVR6100, WVR7000, and WVR7100 Waveform Rasterizers Quick Start User Manual
Page 71

To Configure the Physical Layer Settings
Before you use Eye or S DI Status displays to monitor the SDI physical layer, you should configure the eye and physical layer
settings on the waveform rasterizer, as described on the following pages, for your monitoring needs. The eye and physical
layer settings are initially set to FACTORY defaults, which you can restore using the FACTORY front-panel button.
1. Press the CONFIG button to display the
CONFIG menu.
2. Use the selection (arrow) keys, the SEL
button, and the General knob to make
the menu selections in the steps that
follow.
3. Select Readouts.
4. Set Eye to On.
How to Monitor th
e SDI Physical Layer
5. Select Physical Layer Settings.
6. Select Cable Type, and select the
best match for the type of cable that
ecting the SDI signal to the
is conn
rasterizer.
WVR6100, WVR7000, and WVR7100 Waveform Rasterizers Quick Start User Manual 57
Page 72

How to M onitor th
7. Select Jitter1 HP Filter.
8. Select a high-pass filter value for the
Jitter1 engine controlling the top two tiles
of the waveform
e SDI Physical Layer
rasterizer display.
9. Select Jitter2
10. Repeat step 8 f
controlling the bottom two tiles.
NOTE. The Timing filter selection sets the
filter value to
sets the filtervalueto1kHzforSDor
100 kHz for HD.
11. Select Source Level Max.Usethe
General knob to increase or decrease
the setting.
12. Select Source Level Min.Usethe
General knob to increase or decrease
the setting.
NOTE. The maximum value you can select
is 1000 mV; the minimum value is 600 mV.
13. Select Eye Display M ode.
HP Filter.
or the Jitter2 engine
10 Hz. The Align filter selection
14. Select one of the following settings:
Normal. The Eye display shows the
SDI input signal directly.
Equalized. The Eye display shows
the SDI input signal after it has
passed through the internal cable
equalizer and comparator.
58 WVR6100, WVR7000, and WVR7100 Waveform Rasterizers Quick Start User Manual
Page 73

15. Select Equalizer Bypass.
16. Select one of the following settings:
On. Bypass the equalizer when the
waveform rasterizer is connected
to a signal with
cable. This setting minimizes the
jitter contributed by the internal
equalizer and
with signals containing very low jitter.
Off. Enables the equalizer, which
enables operation with typical cable
lengths and r
cable effects. Use this setting for
most signals.
a short length of
is generally used only
educes jitter due to
To Set SMPTE 259/292 Alarm
Thresholds
17. To reset both the SMPTE 259 (SD)
and SMPTE 292 (HD) alarm thresholds
back to the factory-default values, select
Reset SMPTE259/292 Defaults and
press SEL.
How to Monitor th
e SDI Physical Layer
NOTE. The following thresholds only appear
in the menu when Option PHY is installed:
Eye Amplitude Max/Min, Eye Risetime
Max/Min, Eye Falltime Max/Min, and Eye
Rise-Fall Delta.
18. To reset only the SD thresholds or the
HD thresholds back to the factory-default
values, select SMPTE 259 (SD)
Thresholds or SMPTE 292 (HD)
Thresholds, depending on which type of
video signal you are monitoring.
19. Select Reset Defaults and press SEL.
NOTE. The steps and illustrations that
follow show setting custom SD threshold
values. The HD threshold names are the
same as the SD thresholds, but the setting
values and ranges may be different.
WVR6100, WVR7000, and WVR7100 Waveform Rasterizers Quick Start User Manual 59
Page 74

How to M onitor th
e SDI Physical Layer
20. To set c u s tom t h
SMPTE 259 (SD) Thresholds or SMPTE
292 (HD) Thresholds, depending on
whichtypeofvi
monitoring.
21. Select Jitter1 Level.UsetheGeneral
knob to increase or decrease the
threshold lev
controlling the top two tiles of the
waveform rasterizer display.
The maximum le
4.00 UI; the minimum level is 0.10 UI.
22. Select Jitter2 Level.UsetheGeneral
knob to increase or decrease the
threshold le
controlling the bottom two tiles of the
waveform rasterizer display.
23. Select Cable Loss to specify the
threshold f
length of cable connecting the signal
source to the waveform rasterizer.
24. Use the General knob to increase or
decrease t
The maximum level you can enter is
30.0 dB; the minimum level is 0.0 dB.
reshold levels, select
deo signal you are
el for the Jitter1 engine
vel you can enter is
vel for the Jitter2 engine
or signal loss (in dB) due to
he threshold level.
25. Select Ca
threshold for the length of the cable (in
meters) connecting the signal source to
the wavef
26. Use the Ge
decrease the cable length setting.
The maximum length you can enter
is 300 me
0 meters.
ble Length to specify the
orm rasterizer.
neral knob to increase or
ters; the minimum length is
60 WVR6100, WVR7000, and WVR7100 Waveform Rasterizers Quick Start User Manual
Page 75

27. Option PHY Only. Select Eye
Amplitude Max.UsetheGeneral knob
to increase or
The maximum amplitude you c an enter
is 1010 mV ; the minimum amplitude is
700 mV.
decrease the setting.
How to Monitor th
e SDI Physical Layer
28. Option PHY Onl
Amplitude Min.UsetheGeneral knob
to increase or decrease the setting.
The maximum am
10 mV below the current Eye Amplitude
Max setting; the minimum amplitude is
530 mV.
29. Option PHY On
Max.UsetheGeneral knob to increase
or decrease the setting.
The maximum r
is 3000 ps (SD) or 1000 ps (HD); the
minimum risetime is 0 ps.
30. Option PHY Only. Select Eye Risetime
Min.Usethe
or decrease the setting.
31. Option PHY Only. Select Eye Falltime
Max.UsetheGeneral knob to increase
or decrease the setting.
The maximum falltime you can enter
is 3000 ps (SD) or 1000 ps (HD); the
minimum falltime is 0 ps.
y. Select Eye
plitude you can enter is
ly. Select Eye Risetime
isetime you can enter
General knob to increase
32. Option PHY Only. Select Eye Falltime
Min.UsetheGeneral knob to increase
or decrease the setting.
33. Option P
Delta.
34. Use the General knob to increase or
decrease the setting.
The max
1000 ps; the minimum value is 0 ps.
WVR6100, WVR7000, and WVR7100 Waveform Rasterizers Quick Start User Manual 61
HY Only. Select Eye Rise-Fall
imum value you can enter is
Page 76

How to M onitor th
e SDI Physical Layer
To Configure Phy
sical Layer
Alarms
35. Press the CONFIG button to display the
CONFIG menu.
36. U se the selection (arrow) keys, the SEL
button, and the General knob to make
the menu selections in the steps that
follow.
37. Select Alar
Layer.
38. Press SEL and set the response type for
each of the Physical Layer alarms. (See
page 113, How to
ms and then select Physical
Use Alarms.)
62 WVR6100, WVR7000, and WVR7100 Waveform Rasterizers Quick Start User Manual
Page 77

To Take Eye Measurements
After you have configured the instrument for Eye measurements, you can use the cursors for manual waveform
measurements or you can use the automatic eye measurements (Option PHY only).
NOTE. If present, use the EYE button to access the EYE display. If the Option EYE is installed on early instruments w ith
no EYE button (or on the WFP Remote Front Panel if used), use the MEAS button to access the Eye Display by selecting
Display Type > Eye Display in the Measure pop-up menu.
To Setup for Eye Measurements
How to Monitor th
e SDI Physical Layer
1. Configure the
monitor the SDI physical layer.(See
page 57, To C o n figure the Physical Layer
Settings.)
2. Connect a se
waveform rasterizer using a 75Ω cable
of two meters or less in length. Use
high-qual
as Belden8281.
3. Press the EYE button (or MEAS if no
EYE button).
4. Press the 1X vertical gain button.
To Take Ma
The procedures on the following pages describe how to take manual measurements of the Eye waveform. If Option PHY is
installed, the instrument can also take automatic eye measurements. (See page 67, To Take Automatic Eye Measurements
(Option PHY Only).)
NOTE. If you use the measurement cursors to measure the eye waveform, you may measure a different result than that
shown in the automatic eye measurements readout. This is because the automatic amplitude measurement uses histograms
in order to be minimally affected by oversh oot, ringing and noise on the signal. Similarly, the automatic risetime and falltime
measurements use histograms to find the centers of the distributions of 20% and 80% crossings. The difference between
manual and automatic measurements is usually insignificant for clean, symmetrical signals.
waveform rasterizer to
rial video-signal to the
ity, low-loss coaxial cable, such
nual Eye Measurements
Usage Notes
Use the LINE SWEEP button to change the s weep of the Eye display.
WVR6100, WVR7000, and WVR7100 Waveform Rasterizers Quick Start User Manual 63
Page 78

How to M onitor th
e SDI Physical Layer
To Manually Mea
sure Eye
Amplitude
1. Perform the initial setup for Eye
measurements. (See page 63, To Ta k e
Eye Measurements.)
2. Press the CURSOR button to display the
measurement cursors.
3. Position one voltage cursor at the top
part of the waveform, ignoring any
overshoot or undershoot on the rising or
falling edges. (See page 29, To Measure
Waveforms with Cursors.)
4. Position the second voltage cursor at the
bottom of the waveform, ignoring any
overshoot or undershoot on the rising or
falling edges.
5. The Voltage Cursor readout displays the
amplitude of the eye waveform.
NOTE. Signal-source amplitudes outside of
±10% of 800 mV p-p can degrade receiver
performance.
64 WVR6100, WVR7000, and WVR7100 Waveform Rasterizers Quick Start User Manual
Page 79

How to Monitor th
e SDI Physical Layer
To Manually Mea
1. Perform the initial setup for Eye
measurements. (See page 63, To Ta k e
Eye Measurements.)
2. Press the CURSOR button to display the
measurement cursors.
3. Position one voltage cursor at the peak
of the overshoot at the top horizontal part
of the waveform.
4. Position the second voltage cursor
at the bottom of the top line of the
waveform. Include any ringing (the
oscillation following overshoot) in the
measurement. Essentially, you are
measuring the thickness of the top line of
the waveform.
5. The Voltage Cursor readout provides the
amplitude of the aberration.
6. Perform the same voltage-cursor
measurement on the bottom line
thickness, including any undershoot and
ringing.
sure Aberrations
NOTE. Aberrations at the top or bottom line
of the waveform should not exceed 10% of
the signal amplitude. Automatic equalizer
circuits in receivers m ay be sensitive to
larger aberrations.
WVR6100, WVR7000, and WVR7100 Waveform Rasterizers Quick Start User Manual 65
Page 80

How to M onitor th
e SDI Physical Layer
To Manually Mea
sure Risetime
Using Variable Gain
1. Perform the initial setup for Eye
measurements. (See page 63, To Ta k e
Eye Measurements.)
2. Press the VAR button to turn on variable
gain.
3. Use the General knob to resize the
waveform to 10 major divisions. Position
the top and bottom of the waveform on
graticule lines.
4. Press the CURSOR button to display the
measurement cursors.
5. Position the first timing cursor at the
crossing of the rising edge of the Eye
waveform and the graticule line two
divisions above the bottom of the
waveform.
6. Position the second time cursor at the
crossing of the rising edge of the Eye
waveform and the graticule line two
divisions below the top of the waveform.
7. The Delta time readout displays the 20 –
80% rise time measurement.
66 WVR6100, WVR7000, and WVR7100 Waveform Rasterizers Quick Start User Manual
Page 81

How to Monitor th
e SDI Physical Layer
To Take Automatic Ey e Measurements (Option PHY Only)
The following procedure describes how to take automatic measurements of the Eye waveform when Option PHY is installed.
1. Perform the initial setup for Eye
measurements.(See page 63, To Ta ke
Eye Measurements.)
2. Press the STATUS button to select the
Status display mode.
3. Press and hold the STATUS button to
display the pop-up menu.
4. Select Display Type and then select SDI
Status.
5. The SDI Status display contains readouts
showing the automatic Eye waveform
measureme
nts.
NOTE. If you use the measurement cursors
to measure the eye waveform, you may
measure a d
the automatic eye measurements readout.
This is because the automatic amplitude
measurem
minimally affected by overshoot, ringing and
noise on the signal.
Similarly, the automatic risetime and falltime
measurem
centers of the distributions of 20% and 80%
crossings. The difference between manual
and auto
insignificant for clean, symmetrical signals.
ifferent result than that shown in
ent uses histograms in order to be
ents use histograms to find the
matic measurements is usually
WVR6100, WVR7000, and WVR7100 Waveform Rasterizers Quick Start User Manual 67
Page 82

How to M onitor th
e SDI Physical Layer
To Take Jitter Measurements
After you c onfigure the instrument for Eye measurements, you can take jitter measurements using one of the following:
Measurement cursors on the Eye display
SDI Status display
Jitter display (Option PHY only)
NOTE. Many jitter problems in systems have resulted from genlocking clocks to other references, such as the horizontal
synchronization pulse. Reference jitter transferred by genlocks into a serial system is typically between 20 and several
hundred Hertz. Also, the phase detection process used by the genlock can add noise, which results in jitter in the 10 Hz to
1 kHz range. Use the appropriate BW Limit filter selection to include or reject genlock jitter from a measurement.
Select the 10 Hz bandwidth filter to measure the total broadband jitter (use this setting if composite D/A conversion
is planned).
The simplest way is to measure jitter is to use the jitter readout. The jitter measurement readout and thermometer are
derived from the jitter waveform, even when displayed in an Eye display. Those same readouts are also shown in the
SDI Status display.
The Eye and Jitter waveform displays provide more qualitative jitter information. The Eye display shows the presence
and magnitude of the jitter, and its potential for causing data errors as the eye closes. The Jitter display provides added
time-domain information such as the following:
Whether there are jitter components that are synchronous or nearly synchronous to the video line or frame (these
components appear as stationary or near-stationary artifacts in line or field sweeps).
The wave shape of the jitter.
By looking at jitter in both displays, you can separate the sources of jitter, whether they are within a single circuit on a circuit
board, or from various pieces of equipment in a system.
The following example shows the display of a signal with a lot of jitter. (See Figure 1 on page 69.) In the top two tiles, the
high-pass filter is set for 10 Hz, so all jitter above 10 Hz is displayed. In the lower two tiles, the high-pass filter is set for
100 Hz, removing most of the 30 Hz jitter and leaving the spikes. Both Jitter displays are set for two-field sweep.
In the example, the upper Eye display shows a fairly even jitter spread, suggesting a moderately uniform statistical
distribution of jitter. This jitter is from a sine wave component; there is no indication of jitter spikes. In the lower Eye display,
the jitter is more of a low-density haze suggesting a less uniform jitter distribution (as indicated from the spikes).
68 WVR6100, WVR7000, and WVR7100 Waveform Rasterizers Quick Start User Manual
Page 83

How to Monitor th
e SDI Physical Layer
Figure 1: Measuring jitter
WVR6100, WVR7000, and WVR7100 Waveform Rasterizers Quick Start User Manual 69
Page 84

How to M onitor th
e SDI Physical Layer
To Manually Mea
sure Jitter Using
the Eye Display
NOTE. If you use the measurement cursors
to measure jitter, you may measure a
different result than that shown in the jitter
thermometer for the following reasons:
The internal peak detector does a better
job of measuring jitter excursions than
manually positioning the cursors.
The noise floor is removed from the jitter
measurement readout but not from the
cursor delta readout.
1. Perform the initial setup for Eye
measurements.(See page 63, To Ta ke
Eye Measurements.)
2. Use the LINE SWEEP button to select
the 3EYE mode, which shows peak jitter
at each eye crossing.
3. Use the Eye pop-up menu to set the jitter
high-pass filter to one of the following:
To measure tim ing jitter, select the
10 Hz filter for both SD and HD
signals, or select the Timing filter.
To measure alignment jitter, select
the 1 kHz filter for SD signals or
select the 100 kHz filter for HD
signals, or select the Align filter.
70 WVR6100, WVR7000, and WVR7100 Waveform Rasterizers Quick Start User Manual
Page 85

4. Press the CURSOR button to display the
measurement cursors.
5. Position the first timing cursor at the left
edge of the zero
Eye waveform.
NOTE. If necessary, use the Gain and
Sweep control
horizontal resolution.
6. Position the second timing cursor at the
right edge of t
the Eye waveform.
7. Check that the Delta readout is less than
the following:
SD Signals (p
-crossing point of the
s for better vertical and
he zero-crossing point of
er SMPTE 259M)
How to Monitor th
e SDI Physical Layer
Timing jitte
(0.2 unit intervals ).
Alignment jitter (1 kHz filter): 740 ps
(0.2 unit intervals ).
HD Signals (p
Timing jitte
(1.0 unit intervals ).
Alignment jitter (100 kHz filter):
134 ps (0.2 unit intervals).
To Take Cabl
After you have configured the instrument for Eye measurements, you can take cable-loss measurements using the SDI
Status display.
NOTE. The Approx Cable (length) and Source Level readouts of the SDI Status display are derived from the m easured
Cable Loss and the specified Cable Type. The Source Level readout indicates the calculated signal amplitude at the signal
source, even w hen the signal level is greatly reduced at the waveform rasterizer due to cable loss. Therefore, the automatic
Eye Amplitude measurement (Option PHY only) may be significantly less than the indicated Source Level. The accuracy
of the Approx Cable (length) and Source Level readouts depend strongly on correctly setting the Cable Type, and on the
quality of the cable and connections in the signal path.
r(10Hzfi lter): 740 ps
er SMPTE 292M)
r(10Hzfi lter): 673 ps
e Loss Measurements
WVR6100, WVR7000, and WVR7100 Waveform Rasterizers Quick Start User Manual 71
Page 86

How to M onitor th
1. Perform the initial setup for Eye
measurements. (See page 63, To Ta k e
Eye Measureme
e SDI Physical Layer
nts.)
2. Press the STATU
S button to select the
Status display.
3. Press and hold the STATUS button to
display the pop-up menu.
4. Use the arrow keys and the SEL button
to select the SDI Status display.
5. Use the Cable Loss thermometer and
readouts to monitor the cable loss.
72 WVR6100, WVR7000, and WVR7100 Waveform Rasterizers Quick Start User Manual
Page 87

How to Use the ARIB Displays
The waveform rasterizer supports conformance to ARIB data standards contained in the signal source. This information is
contained in the following screen displays:
ARIB Status
ARIB STD-B.39 Display
ARIB STD-B.37 Display
ARIB STD-B.35 Display
ARIB TR-B.23 (1) Display
ARIB TR-B.23 (2) Display
ARIB TR-B.22 Display
The following DID and SDID values are defined for common types of ARIB-compliant data.
DID and SDID values for common ARIB data types
Ancillary data type DID value SDID value
ARIB TR-B.22, Sub Information of transmitting materials
ARIB TR-B.23, Line 20 User Data - 1 0x5F
ARIB TR-B.23, Line 20 User Data - 2 0x5F 0xFB
ARIB STD-B.35 Trigger Signal for Data Broadcasting
ARIB STD-B.37 Closed Captioning
Analog signal
SD signal
HD signal
ARIB STD-B.39 Inter Stationary Control Data
ARIB specification
ITU specification
HowtoUsetheARI
0x5F 0xE0
0xFC
0x5F 0xFD
0x5F
0x5F
0x5F
0x5F
0x43
0xDD
0xDE
0xDF
0xFE
0x01
B Displays
WVR6100, WVR7000, and WVR7100 Waveform Rasterizers Quick Start User Manual 73
Page 88

How to Use the ARI
B Displays
To Enable the AR
IB Conten t
Displays
1. Press the CONFIG button to display the
CONFIG menu.
2. Use the Arrow keys and SEL Button to
set the menu in the steps that follow.
3. Select Aux Data Settings.
4. Select ARIB Content Display.
5. Select Enable to access the ARIB
displays and alarms; or Disable to block
access.
74 WVR6100, WVR7000, and WVR7100 Waveform Rasterizers Quick Start User Manual
Page 89

ARIB Status
The ARIB Status display is a status summary screen for the signal. (See Figure 2.)
HowtoUsetheARI
B Displays
Figure 2: ARIB Status display, showing no data present
Use the ARIB Status display in conjunction with the other specific ARIB Display screens to quickly determine if the data
you are interested in is present in the signal. If the data is present, use the STATUS > ARIB Display menu to select the
specific ARIB data packet type to view.
The ARIB Status display shows the presence (or absence) of each of the following supported standards (STD) or technical
reports (TR):
Transmitting station code (unique identification code of the transmitting station)
Transmitting station time (time of broadcast from the transmitting station)
ARIB STD-B.39 (inter-stationary control data)
ARIB STD-B.37 (closed caption data)
ARIB STD-B.35 (trigger signal data)
ARIB TR-B.23 (1) (guidelines for inter-stationary control data transport, group 1)
ARIB TR-B.23 (2) (guidelines for inter-stationary control data transport, group 2)
ARIB TR-B.22 (guidelines for ancillary data transport)
Additionally, the status of the following ITU standard is shown:
ITU.R BT-1685 (inter-stationary Control Data conveyed by ancillary data packets)
WVR6100, WVR7000, and WVR7100 Waveform Rasterizers Quick Start User Manual 75
Page 90

How to Use the ARI
B Displays
ARIB STD-B.39 Display
The ARIB STD-B.39 display shows the decoded data for video signals using ancillary data compliant with ARIB STD-B.39.
(See Figure 3.) When this display is selected, the instrument searches the signal for ARIB STD-B.39 packets using the
DID/SDID combinations defined by either the ITU or ARIB standards organizations.
Figure 3: ARIB STD-B.39 display (with the associated ARIB Status display)
The decoded ancillary data includes the following:
DID - Data Identifier of the requested inter-stationary control packet; can be any of the following:
ARIB specification - 0x5F
ITU Specification - 0x43
Type - Type of the ANC Data packet. For ARIB B.39, this is always a Type 2 packet (DID less than 0x80), as defined by
SMPTE 291M. The actual value (with parity bits added) is displayed in parentheses.
SDID - Secondary Data Identifier of the requested in
ARIB specification - 0xFE
ITU Specification - 0x01
Line - The line of the video (within the field) from which the packet was acquired.
76 WVR6100, WVR7000, and WVR7100 Waveform Rasterizers Quick Start User Manual
terstationary control packet; can be any of the following:
Page 91

HowtoUsetheARI
Stream - For HD (SMPTE 292M), indicates whether the ancillary packet was acquired from the Y or C data streams.
For SD, N/A is di
splayed.
B Displays
Status - Indica
Checksum - Indi
Should be - Indi
Format - Indica
Inter-Station
code.
Transmitting Station Code - The name of the transmitting station. The instrument supports the display of Japanese
characters.
Transmitting Station Time - The broadcast time at the transmitting station.
Current Video Mode - The video format of the current program.
Next Video Mode - The video format of the next scheduled programming.
Video Mode Countdown - A countdown timer indicating an upcoming change in video mode, which counts down from
254 (0xFE). A v
Current Downm
Next Downmix/
Audio Mode Cou
254 (0xFE). A value of 0xFF indicates that no format change is pending within the next several seconds.
tes whether packet(s) of the desired type are present in the video; also indicates Checksum or CRC errors.
cates the checksum word that was recovered from the acquired packet.
cates the checksum word computed by the instrument, based on the packet’s data.
tes the name of the ancillary data type or standard.
Ctrl Header - A header byte indicating packet continuity, and the presence or absence of the error correcting
alue of 0xFF indicates that no format change is pending within the next several seconds.
ix/Audio Mode - Indicates the audio downmix and soundstage configuration of the current program.
Audio Mode - Indicates the audio downmix and soundstage configuration of the next scheduled program.
ntdown - A countdown timer indicating an upcoming change in audio m ode, which counts down from
Trigger Bits (Q8..Q1 Q16..Q9) - Together with trigger bits Q24..Q17 Q32..Q25, 32 bits that can be used to indicate
changes in the program; usage is user-defined.
Trigger Bits (Q24..Q17 Q32..Q25) - Together with trigger bits Q8..Q1 Q16..Q9; 32 bits that can be used to indicate
changes in th
Trigger Coun
the trigger counter is not used.
Trigger Countdown - A countdown timer indicating an upcoming change in trigger bits Q1-Q4, which counts down from
254 (0xFE). A value of 0xFF indicates that no format change is pending within the next several seconds.
Status Bits (S8..S1 S16..S9) - 16 user-defined status bits.
Error C orrecting Code - A six-word, Reed-Solomon error correcting code, which is used to verify the integrity of the ARIB
B.39 or ITU-R
e program; usage is user-defined.
ter - Increments when bits Q1-Q4 go from 0 to 1. Wraps from 254 (0xFE) to zero. Value of 0xFF indicates
BT.1685 packet.
WVR6100, WVR7000, and WVR7100 Waveform Rasterizers Quick Start User Manual 77
Page 92

How to Use the ARI
B Displays
ARIB STD-B.37 Display and Status Screens
The ARIB STD-B.37 display shows the decoded data for video signals using ancillary data compliant with ARIB STD-B.37.
(See Figure 4.) When this display is selected, the instrument searches the signal for ARIB STD-B.37 packets using the
DID/SDID combinations defined by ARIB.
Figure 4: ARIB STD-B.37 display (with the associated ARIB Status display)
The decoded ancillary data includes the following:
DID - Data Identifier of the requested c losed captioning packet; can be any of the following:
Analog signal - 0x5F
SD Signal - 0x5
HD Signal - 0x5F
78 WVR6100, WVR7000, and WVR7100 Waveform Rasterizers Quick Start User Manual
Page 93

HowtoUsetheARI
SDID - Secondary Data Identifier of the requested packet; can be any of the following:
Analog signal - 0xDD
SD Signal - 0xDE
HD Signal - 0xDF
Mobile signal - 0xDC
Field/Line - The field or line of the video from which the packet was acquired. For progressive formats, 1 is displayed.
B Displays
NOTE. The Line fi
Format - Indicates the name of the ancillary data type or standard.
Header 1st - Displays the first of four User Data Words of the corresponding packet, in binary.
Header 2nd - Displays the second of four User Data Words of the corresponding packet, in binary.
Header 3rd - Displays the third of four User Data Words of the corresponding packet, in binary.
Header 4th - Displays the last of four User Data Words of the corresponding packet, in binary.
ECC Status - Indicates the presence or absence of the Error Correcting Code information in the payload.
Format ID - Indicate whether the packet is for HD, SD, Analog, or Mobile captions.
Language - Indicates the language code (1st through 8th) of the packet.
CC Data ID - Indicates the CC Data ID of the packet. Can be one of the following:
Exchange Format CC
Exchange Format PMI
Exchange Format Page 1
Exchange Format Page 2
eld turns red if the ARIB B.37 packets are not on the line as defined by ARIB TR-B.23.
Short Form Management Data
Short Form Text
Undefined or Dummy Data
Set Mode - Mode can be either Sequential or Buffer.
Packet Flags - Indicates whether the packet is Leading, End, Intermediate, or Single.
Checksum - Indicates the checksum word that was recovered from the acquired packet.
Placement - Can display either OK or ERROR, indicating whether the ARIB B.37 packets are present in the allowable
configuration(s) specified in ARIB TR-B.23.
WVR6100, WVR7000, and WVR7100 Waveform Rasterizers Quick Start User Manual 79
Page 94

How to Use the ARI
B Displays
ARIB STD-B.35 Display and Status Screens
The ARIB STD-B.35 display shows the decoded data for video signals using ancillary data compliant with ARIB STD-B.35.
(See Figure 5.) When this display is selected, the instrument searches the signal for ARIB STD-B.35 packets using the
DID/SDID combinations defined by ARIB.
Figure 5: ARIB STD-B.35 display (with the associated ARIB Status display)
The decoded ancillary data includes the following:
DID - Data Identifier of the requested packet; permissible values range from 1 to 0xFF (255) inclusive.
Type - Type of the ANC Data packet. For ARIB B.35, this is always a Type 2 packet (DID less than 0x80), as defined by
SMPTE 291M. The actual value (with parity bits added) is displayed in parentheses.
SDID - Secondary D ata Identifier of the requested packet; permissible values
This field only appears when a Type 2 packet is selected (see above). The actual value (with parity bits added) is
displayed in parentheses.
DC - Data Count word of the acquired packet. The number of User Data words is displayed in decimal. The actual value
(with parity bits added) is displayed in parenthesis, in hexadecimal.
Field - The field of the video from which the packet was acquired. For progressive formats, 1 is displayed.
80 WVR6100, WVR7000, and WVR7100 Waveform Rasterizers Quick Start User Manual
range from 0 through 0xFF (255) inclusive.
Page 95

Line - The line of the video (within the field) from which the packet was acquired.
HowtoUsetheARI
B Displays
Stream - For HD (SMPTE 292M), indicates whether the ancillary pack
For SD, N/A is displayed.
Status - Indicates whether packet(s) of the desired type are present in the video; also indicates Checksum or CRC errors.
Checksum - Indicates the checksum word that was recovered from the acquired packet.
Should be - Indicates the checksum word computed by the instrument, based on the packet’s data.
Format - Indicates the name of the ancillary data type or standard.
User Data Words - Contains the payload of the ancillary packet, displayed in hexadecimal. All 10 bits are displayed.
ARIB TR-B.23 (1) Display and Status Screens
The ARIB TR-B.23 (1) display shows the decoded data for video signals using ancillary data compliant with ARIB TR-B.23
(1). (See Figure 6.) When this display is selected, the instrument searches the signal for ARIB TR-B.23 (1) packets using
the DID/SDID combinations defined by ARIB.
et was acquired from the Y or C data streams.
Figure 6: ARIB TR-B.23 (1) display (with the associated ARIB Status display)
WVR6100, WVR7000, and WVR7100 Waveform Rasterizers Quick Start User Manual 81
Page 96

How to Use the ARI
The decoded ancillary data includes the following:
DID - Data Identifier of the requested packet; permissible values range from 1 to 0xFF (255) inclusive.
Type - Type of the ANC Data packet. For ARIB TR-B.23-1, this is always a Type 2 packet (DID less than 0x80), as
defined by SMPTE
B Displays
291M. The actual value (with parity bits added) is displayed in parentheses.
SDID - Secondar
This field only appears when a Type 2 packet is selected (see above). The actual value (with parity bits added) is
displayed in parentheses.
DC - Data Count word of the acquired packet. The number of User Data words is displayed in decimal. The actual value
(with parity b
Field - The fiel
Line - The line
Stream - For HD
For SD, N/A is displayed.
Status - Indicates whether packet(s) of the desired type are present in the video; also indicates Checksum or CRC errors.
Checksum - Indicates the checksum word that was recovered from the acquired packet.
Should be - Indicates the checksum work computed by the instrument, based on the packet’s data.
Format - Indicates the name of the ancillary data type or standard.
User Data Words - Contains the payload of the ancillary packet, displayed in hexadecimal. All 10 bits are displayed.
y Data Identifier of the requested packet; permissible values range from 0 through 0xFF (255) inclusive.
its added) is displayed in parenthesis, in hexadecimal.
d of the video from which the packet was acquired. For progressive formats, 1 is displayed.
of the video (within the field) from which the packet was acquired.
(SMPTE 292M), indicates whether the ancillary packet was acquired from the Y or C data streams.
82 WVR6100, WVR7000, and WVR7100 Waveform Rasterizers Quick Start User Manual
Page 97

ARIB TR-B.23 (2) Display and Status Screens
The ARIB TR-B.23 (2) display shows the decoded data for video signals using ancillary data compliant with ARIB TR-B.23
(2). (See Figure 7.) When this display is selected, the instrument searches the signal for ARIB TR-B.23 (2) packets using
the DID/SDID combinations defined by ARIB.
HowtoUsetheARI
B Displays
Figure 7: ARIB TR-B.23 (2) display (with the associated ARIB Status display)
The decoded ancillary data includes the following:
DID - Data Identifier of the requested packet; permissible values range from 1 to 0xFF (255) inclusive.
Type - Type of the ANC Data packet. For ARIB TR-B.23-2, this is always a Type 2 packet (DID less than 0x80), as
defined by SMPTE 291M. The actual value (with parity bits added) is displayed in parentheses.
SDID - Secondary Data Identifier of the requested packet; permissible values range fr
This field only appears when a Type 2 packet is selected (see above). The actual value (with parity bits added) is
displayed in parentheses.
DC - Data Count word of the acquired packet. The number of User Data words is displayed in decimal. The actual value
(with parity bits added) is displayed in parenthesis, in hexadecimal.
Field - The field of the video from which the packet was acquired. For progressive formats, 1 is displayed.
WVR6100, WVR7000, and WVR7100 Waveform Rasterizers Quick Start User Manual 83
om 0 through 0xFF (255) inclusive.
Page 98

How to Use the ARI
B Displays
Line - The line of the video (within the field) from which the packet was acquired.
Stream - For HD (SMPTE 292M), indicates whether the ancillary packet was acquired from the Y or C data streams.
For SD, N/A is displayed.
Status - Indicates whether packet(s) of the desired type are present in the video; also indicates Checksum or CRC errors.
Checksum - Indicates the checksum word that was recovered from the acquired packet.
Should be - Indicates the checksum work computed by the instrument, based on the packet’s data.
Format - Indicates the name of the ancillary data type or standard.
User Data Words - Contains the payload of the ancillary packet, displayed in hexadecimal. All 10 bits are displayed.
ARIB TR-B.22 Display and Status Screens
The ARIB TR-B.22 display shows the decoded data for video signals using ancillary data compliant with ARIB TR-B.22.
(See Figure 8.) When this display is selected, the instrument searches the signal for ARIB TR-B.22 packets using the
DID/SDID combinations defined by ARIB.
Figure 8: ARIB TR-B.22 display (with the associated ARIB Status display)
84 WVR6100, WVR7000, and WVR7100 Waveform Rasterizers Quick Start User Manual
Page 99

HowtoUsetheARI
The decoded ancillary data includes the following:
DID - Data Identifier of the requested packet; permissible values range from 1 to 0xFF (255) inclusive.
Type - Type of the ANC Data packet. For ARIB TR-B.22, this is always a Type 2 packet (DID less than 0x80), as defined
by SMPTE 291M. T
he actual value (with parity bits added) is displayed in parentheses.
B Displays
SDID - Secondar
This field only appears when a Type 2 packet is selected (see above). The actual value (with parity bits added) is
displayed in parentheses.
DC - Data Count word of the acquired packet. The number of User Data words is displayed in decimal. The actual value
(with parity b
Field - The fiel
Line - The line
Stream - For HD
For SD, N/A is displayed.
Status - Indicates whether packet(s) of the desired type are present in the video; also indicates Checksum or CRC errors.
Checksum - Indicates the checksum word that was recovered from the acquired packet.
Should be - Indicates the checksum work computed by the instrument, based on the packet’s data.
Format - Indicates the name of the ancillary data type or standard.
User Data Words - Contains the payload of the ancillary packet, displayed in hexadecimal. All 10 bits are displayed.
y Data Identifier of the requested packet; permissible values range from 0 through 0xFF (255) inclusive.
its added) is displayed in parenthesis, in hexadecimal.
d of the video from which the packet was acquired. For progressive formats, 1 is displayed.
of the video (within the field) from which the packet was acquired.
(SMPTE 292M), indicates whether the ancillary packet was acquired from the Y or C data streams.
WVR6100, WVR7000, and WVR7100 Waveform Rasterizers Quick Start User Manual 85
Page 100

How to Monitor Au
dio
How to Monitor Audio
The waveform rasterizer provides several methods to monitor audio signals. You can measure levels, monitor phase, display
phase correlation, and monitor surround-sound audio. You can specify meter ballistics and scales, set the Test and Peak
Program indicator levels, and specify how phase is displayed.
NOTE. The audio monitoring features described in this chapter require that appropriate audio options are installed. (See
page 2, Options.) For example, Option DS adds support for only Digital audio monitoring in embedded and AES/EBU inputs,
while a Option AD equipped instrument can monitor both Analog and Digital audio in these inputs. Note that the options
listed with a prefix W VR6UP -- (for the WVR6100 options), WVR70UP-- (for the WVR7000 options), or WVR7UP-- (for the
WVR7100 options) support upgrades to previously purchased instruments.
For a list of the options that are installed on your product, press the CONFIG button. In the C ONFIG menu, select the Utilities
submenu. The View Instruments Options entry lists the installed options for your instrument.
To Confi gure Audio Inputs
The rasteri
FACTORY defaults, which you can restore using the FACTORY front-panel button). Do this procedure (or at least check that
the alarms are configured as you want them) before doing the audio monitoring procedures. (See page 86, How to Monitor
Audio.) Yo
To s e t u p a n
1. Press the C
2. Use the Arrow keys and SEL Button to
3. Select Audio Inputs/Outputs.
4. Select the input to be configured.
5. Select from Srnd (Surround) for a 5.1 or
zer audio inputs may need to be configured in the CONFIG menu before you use them (they come set to
ur setup here determines, in part, which audio-signal characteristics a re displayed.
Audio Input
ONFIG button to display the
CONFIG menu.
set the menu in the steps that follow.
5.1+2 type
with SAP and discrete channels type
installation.
display or Pairs for a stereo
86 WVR6100, WVR7000, and WVR7100 Waveform Rasterizers Quick Start User Manual
 Loading...