

Page 1

User Manual
WSTRO & WSTROU
WaveStart Software
for Oscilloscopes
071-0220-07
This document supports firmware version 2.6 and
above.
www.tektronix.com
Page 2

Copyright © Tektronix, Inc. All rights reserved. Lice nsed software products
are owned by Tektronix or its suppliers and are protected by United States
copyright laws and international treaty provisions.
Use, duplication, or disclosure by the Government is subject to restrictions as
set forth in subparagraph (c)(1)(ii) of the Rights in Technical Data and
Computer Software clause at DFARS 252.227-7013, or subparagraphs (c)(1)
and (2) of the Commercial Computer Software -- Restricted Rights clause at
FAR 52.227-19, as appl icable.
Tektronix products are covered by U.S. and foreign patents, issued and
pending. Information in this publication supercedes that in all previously
published material. Specifications and price change privileges reserved.
Tektronix, Inc., P.O. Box 500, Beaverton, OR 97077
TEKTRONIX, TEK, and WaveStar are registered trademarks of Tektronix, Inc.
Page 3

Table of Contents
Preface vii............................................
Contacting Tektronix ix.................................
Getting Started
Product Description 1--1.................................
Capture 1--1.........................................
Analyze 1--1........................................
Control 1--2.........................................
Document 1--2.......................................
Create Masks 1--2....................................
Distribute 1--2.......................................
System Requirements 1--3...............................
Supported Instruments 1--4..............................
Installation and Uninstallation 1--5........................
Installing WaveStar Software 1--5..........................
Setting Up PC to Instrument Communications 1--7.............
TekVISA Configuration 1--7............................
Instrument Manager Service (IMS) 1--8...................
Running WaveStar 1--10...................................
Uninstallation 1--10.......................................
Tutorials 1--10...........................................
VISA and TekVISA 1--10..................................
Instrument Manager Service (IMS)
Main Screen 2--1........................................
Menu Bar 2--2..........................................
Toolbar 2--4............................................
Instrument List (Main Screen) 2--5..........................
Add Instrument: Ethernet Connected 2--5....................
Add Instrument: GPIB or RS-232 Connected 2--6..............
Remove an Instrument 2--9................................
Switching an Instrument Online or Offline 2--10................
Shutting Down Service 2 --10...............................
WaveStar Software User Manual
i
Page 4

Table of Contents
Display and Print the IMS Activity Log 2--11..................
Display the Activity Log 2--11...........................
Print the Activity Log 2--11.............................
Set Instrument Permissions 2--12............................
Operating Basics
Main Screen Overview 3--1...............................
Menu Bar 3--2.......................................
Toolbar 3--2.........................................
Explorer View 3--2...................................
Data Sheet Pane 3--2..................................
The WaveStar Menu Bar 3--4..............................
The WaveStar Toolbar 3--10................................
The Explorer View 3--12...................................
Using The Explorer View 3--14..........................
Copying Data from the Explorer View 3--15................
Linking Data from the Explorer View 3--16.................
Explorer View Links, Selections, and Propert ies 3--18........
The WaveStar Reader 3--19................................
Data Sheet Overview
Data Sheet Pane 4--1.....................................
Common Sheet Functions 4--1.............................
Creating, Opening, Saving, and Closing Data Sheets 4--2.....
Start/Stop Data Acquisition 4--2.........................
Zooming 4--3........................................
Sizing, Tiling and Cascading Windows 4--4................
Previewing and Printing 4--4............................
Copy and Linking 4--4................................
Copying into Microsoft Office Applications 4--5............
Setting Properties 4 -- 5.................................
Shortcut Menu 4--5...................................
Data Sheets and Compatible Data Types 4--6.................
ii
WaveStar Software User Manual
Page 5

Table of Contents
Datalog Measurements Data Sheet 4--7......................
Datalog Tabular Data Sheet 4--9............................
Instrument Explorer Sheet 4--11.............................
Accessing Drives and Directories 4--12....................
Manipulating File s 4--12................................
System Functions 4--13.................................
Notes Sheet 4--14........................................
Supported Applications 4--15............................
Saving and Recalling Instrument Settings 4--16..............
Power Harmonics Data Sheet 4--17..........................
Power Harmonics Sheet Fields 4--19......................
Scalar-Viewer Data Sheet 4--21.............................
StripChart Data Sheet 4--22................................
Copying vs. Linking 4--24...............................
Starting and Stopping 4--24..............................
Property Sheet 4--25...................................
Cursors 4--25.........................................
Waveform Measurement Data Sheet 4--25.....................
Property Sheet 4--27...................................
Gates 4--27...........................................
Waveform Tabular Data Sheet 4--27..........................
I/O Operations 4--28...................................
Property Sheet 4--29...................................
Gates 4--29...........................................
XY Data Sheet 4--30......................................
I/O Operations 4--30...................................
Property Sheet 4--31...................................
Cursors 4--31.........................................
YT Data Sheet 4--32......................................
Waveform Operations 4--32.............................
Print Banner 4--34.....................................
Mask Editing 4 --34....................................
WaveStar Software User Manual
iii
Page 6

Table of Contents
Procedures
Display Waveforms in the YT Data Sheet 5--1................
Tips 5--1............................................
Display Two Waveforms in the XY Data Sheet 5--2............
Tips 5--2............................................
Dynamically Position Waveforms 5--3.......................
Zoom the YT, XY, or StripChart Data Sheets 5--3..............
To Zoom in Increments or by % 5--3.....................
To Zoom to Full Screen (YT and XY sheets only) 5--3.......
To Zoom On a Waveform Feature
Change the YT or XY Waveform Display (Properties) 5--4......
To Position a Waveform 5--4............................
To Scale a Waveform 5--4..............................
To Change Waveform Col or 5--4........................
To Lock the Trigger Points or Horizontal Scales
To Display the Trigger Point on YT Waveforms 5--5.........
To Change the Graticule for XY and YT Data Sheets 5--5....
To Change the Plot Style of XY Waveforms 5--6............
Creating a New Mask 5--6................................
Measure Waveforms using the Waveform Measurement
Data Sheet 5--7......................................
Gate and drag/drop from Waveform Tabular Sheet 5--8......
Measure StripChart Plots using Cursors 5--8..................
Set Up Instrument (Data Source) 5 --8.......................
Copy the Instrument Screen 5--9...........................
Copy the Screen Image to a PC Application 5--9...............
Restore a Waveform to an Instrument 5--10....................
Install/Uninstall 5 --10.....................................
Connect to Instrument (GPIB & RS-232) 5--11.................
Saving and Restoring Data Sheets 5--12.......................
SaveaDataSheet 5--12................................
RestoreaDataSheet 5--13..............................
Saving and Restoring Workbooks 5--14.......................
Save a Workbook 5--14.................................
Restore a Workbook 5--14...............................
(YT and XY sheets only) 5--4.......................
of YT Waveforms 5--5..............................
iv
WaveStar Software User Manual
Page 7

Converting WSTR31 Notebook (*.nbk) Files 5--15..............
Differences in Converted File s 5--15......................
Saving and Printing Repetitive Snapshots of Data
(“Babysitting” or Untended Monitoring Mode) 5--16.........
Viewing Long Record Lengths 5--17.........................
Exporting Data 5--17......................................
Importing Data 5--18......................................
CSV Format 5--19.....................................
User Proxy Table Utility
Proxy File Overview 6--1.................................
Records 6--1...........................................
Initialization Commands 6--2..............................
Main Screen 6--3........................................
File Menu 6--4.......................................
Record Menu 6--5....................................
Help Menu 6--6......................................
Toolbar 6--6.........................................
Toolbar Buttons 6--6..................................
Control Settings 6--6..................................
Initialization Screen 6-- 8..................................
Registry Screen 6--9.....................................
Table of Contents
RS-232
Setting RS-232 Default Values 7-- 1.........................
TDS 200, TDS 300, TDS 3000, and THS 700 Series 7--1.....
TDS 400, 500, 600, 700, or 800 Series 7--3................
RS-232 General Hints 7--4................................
RS-232 Cable Issues 7--5.................................
RS-232 Cable Examples 7--6..............................
GPIB
GPIB Overview 8--1....................................
Index
WaveStar Software User Manual
v
Page 8

Table of Contents
vi
WaveStar Software User Manual
Page 9

Preface
This manual supports the following Windows 98, ME, 2000, and
NT 4.0 versions of WaveStart software products:
H WaveStar Software for Oscilloscopes (WSTRO) lets you control,
H Upgrade to WaveStar Software for Oscilloscopes (WSTROU),
H WaveStar Software DEMO, a free, fully-functional version of
H WaveStar Software Reader, a free application that lets you view
capture, display, analyze, measure, and document oscilloscope
signal waveforms on your PC.
upgrades owners of WaveStar for Windows 3.1 software to
WaveStar Software for Oscilloscopes.
WaveStar with a 30-day use limit.
data sheet and notebook files creat ed by WaveStar Software for
Oscilloscopes. You can load WaveStar Reader on any number of
PCs.
This manual is organized to cover all common information about
WaveStar Software, and also includes specific information for each
product where applicable.
This manual describes system requirements, installation, operating
basics, data sheet overview and procedures, RS-232 and GPIB
reference information, the WaveStar Instrument Manager Service,
and the WaveStar User Table Proxy a pplication. Refer to the online
help for further information on the topics in this manual and for
information on the user interface and advanced procedures.
WaveStar Software User Manual
vii
Page 10

Preface
The following table lists all of the documents included with your
purchase and the purpose of each document.
Documentation Set
Document Purpose and description
User Manual Instructional manual that details the application,
procedures, contacting Tektronix, and many other
aspects of the product. Use this manual together
with the online help.
Software License
Agreement Envelope
Software Key Label, located on the back of the CD-ROM software
CD-ROM booklet Contains product overview and installation
Business Reply Card Complete and return the business reply card to
Envelope that contains the CD-RO M and software
key. The Tektronix Software License Agreement is
printed on this envelope. Breaking the envelope seal
means that you agree with the terms outlined in the
agreement.
isntallation instruction booklet, that contains a
14-character software installation key that you are
required to enter when you install this software. You
will be asked to enter this key each time you install
this software. You will not be able to install the
software without it. Do not lose the label.
information for each product on the CD-ROM disc.
register your product.
viii
WaveStar Software User Manual
Page 11

Contacting Tektronix
Phone 1-800-833-9200*
Address Tektronix, Inc.
Department or name (if known)
14200 SW Karl Braun Drive
P.O. Box 500
Beaverton, OR 97077
USA
Web site www.tektronix.com
Preface
Sales support
Service
support
Technical
support
* This phone number is toll free in North America. After office
hours, please leave a voice mail message.
Outside North America, contact a Tektronix sales office or
distributor; see the Tektronix web site for a list of offices.
1-800-833-9200, select option 1*
1-800-833-9200, select option 2*
Email: support@tektronix.com
1-800-833-9200, select option 3*
6:00 a.m. -- 5:00 p.m. Pacific time
WaveStar Software User Manual
ix
Page 12

Preface
x
WaveStar Software User Manual
Page 13

Getting Started
Page 14

Page 15

Product Description
WaveStar Software introduces a family of Windows 98, ME, 2000,
and NT 4.0 applications that connect your Tektronix TDS/THS and
CSA oscilloscopes to your PC desktop.
Capture
The WaveStar software provides the following features for setting up
and capturing data:
H Set up communication to instruments through the WaveStar
Connection Wizard.
H Use the WaveStar Explorer view to display connected instru-
ments and capture measurement waveforms and data easily
without the need for programming.
H Drag and drop instrument data into an active data sheet.
Analyze
The WaveStar software provides the following features for data
analysis:
H Analyze, annotate, and record information in a variety of data
sheets.
H Capture and graphically view multiple waveforms on a graticule
with the same scale and position as on the oscilloscope.
H Take measurements easily using cursors, gates, and zoom.
WaveStar Software User Manual
1- 1
Page 16

Product Description
Control
The WaveStar software provides the following control fe atures:
H Step away from your desk and have WaveStar automatically
capture data changes.
H Establish instrument links to automatically update new
measurements.
H Control waveform information locally or over the network.
Document
The WaveStar software provides the following documentation and
print features:
H Archive information in Microsoft Office or other Microsoft
Windows applications.
H Print banner function allows printing of long record length
waveforms.
Create Masks
The WaveStar software provides the following mask creation
features:
H Copy and load instrument test masks to or from YT data sheets.
H Edit masks in an intuitive, easy-to-use graphical editor.
H Load test masks from the WaveStar Mask Library .
H Create masks from scratch.
Distribute
The WaveStar Reader software provides the following features:
H Open, view, and manipulate existi ng WaveStar notebook and data
sheet files.
H You can load WaveStar Reader onto as many PC’sasyoulike.
1- 2
H You cannot create new data sheets. You can save existing data
sheets and notebooks to new file names.
H You cannot link WaveStar Reader to an instrument.
WaveStar Software User Manual
Page 17

System Requirements
To install and run WaveStar software, you must ha ve an IBM-compatible PC with the following installed:
H Windows 98, ME, 2000, or NT4.0 operating system PC
H 16 MB RAM or greater recommended
H CD-ROM drive, 4X or better
H Super VGA monitor or better
H 20 MB disk space
H Appropriate interface hardware to connect your PC to an
oscilloscope:
H National Instruments IEEE 488.2 GPIB Interface Card and
driver software
H RS-232 serial communications port and RS-232 cable
H 10/100BaseT compatible Ethernet c ard
When using the Tektronix AD007 GPIB-LAN Adapter, you can
connect directly to the 10/100BaseT L AN (local are a network)
connector with a RJ-45 UTP cable (provided with your AD007
GPIB-LAN Adapter). For a complete list of the system requirements
for the AD007 Adapter, refer to your AD007 GPIB-LAN Adapter
User Manual.
WaveStar Software User Manual
1- 3
Page 18

Supported Instruments
For a list of supported products, please see the installation instruction
booklet included with the CD-ROM.
1- 4
WaveStar Software User Manual
Page 19

Installation and Uninstallation
This section describes how to install all WaveStar software products.
Installing WaveStar Software
NOTE. To install the purchased WaveStar software, you must have the
14-character software key code. The code is on a label on the back
of the installation manual packaged with the Software Solutions
CD-ROM disc.
If you are installing the WSTROU (WaveStar Software Upgrade from
WSTR31 (WaveStar for Windows 3.1), you also need the serial
number from your WSTR31 WaveStar Software. The serial number is
on the WSTR31 floppy disks and on the label on the WSTR31
Software License Agreement Envelope.
Follow the steps below to install the WaveStar Software. Refer to the
WaveStar for Oscilloscopes User Manual (printed manual or PDF
file version included on the CD-ROM disc) for more detailed
installation information.
NOTE. The installation program deletes any installed VISA file
(visa32.dll) from the Window’s System directory and installs the
Tektronix version of VISA in its place. If you need to retain the
currently-installed visa32.dll file, refer to the VISA sectioninthe
Installation and Uninstallation chapter of the WaveStar user manual
before installing WaveStar.
WaveStar Software User Manual
1- 5
Page 20

Installation and Uninstallation
If you are reinstalling WaveStar, or are installing over an older
version, the installation program deletes the installed WaveStar
software and then prompts you to reboot your PC. After your PC
reboots, run the installation program again to install the new
WaveStar software.
1. Insert the CD-ROM disc into the CD-ROM drive. Typically, the
PC automatically runs the installer program. If it does not, run
the install.exe file located in the CD-ROM drive root directory.
The computer displays the main installation window, which
contains tabs along the top of the window.
2. Select the Wa veS tar for Oscilloscop es tab. The installer opens the
W aveStar information window with a menu bar at the top of the
installer window .
3. Select Install in the menu bar. The installation wizard appears
next and guides you through the rest of the installation process.
Follow the instructions in the wizard.
4. When prompted, select the appropriate button to install the
relevant WaveStar software:
H WaveStar Software for Oscilloscopes-Purchase required to
install the purchased WaveStar software (WaveStar Software
for Oscilloscopes (WSTRO) or Upgrade to WaveStar
Software for Oscilloscopes (WSTROU)).
H WaveStar Software DEMO to install the free fully-function-
al 30-day demo version of WaveStar.
H WaveStar Software for Reader to install the free WaveStar
Software Reader application.
5. When prompted, enter the WaveStar key code. If you are
installing the purchased WaveStar Software for Oscilloscopes,
the key code label is on the back cover of this manual. Make sure
that you keep the key code for future reference or reinstallation.
1- 6
WaveStar Software User Manual
Page 21

Installation and Uninstallation
If you are installing the Upgrade to WaveStar Software for
Oscilloscopes (WSTROU), you will also need to enter the serial
number from your WSTR31 WaveStar Software. This number is
on the seal of the software license agreement envelope in which
you received the WSTR31 installation di sks, or on the WSTR31
floppy disk label.
6. Continue with the installation process, supplying required
information when prompted.
7. You must restart your PC when the installation is completed to
finish the install process.
Setting Up PC to Instrument Communications
You must establish a communication link from your PC to an
instrument prior to running WaveStar. If you are connecting your PC
to an instrument via Ethernet, you must first run the TekVISA
Configuration program to register and locate the instrument, and
then run Instrument Manager Service (IMS) program to open the
connection to the instrument.
If you are connecting your PC to an instrument using RS-232 or
GPIB, you do not need to run the TekVISA Configuration program,
but you do need to run the Instrument Manager Service program
(page 1--8).
Refer to the Instrument Manager Service section for more information on instrument communication setup.
TekVISA Configuration
Do the following to configure TekVISA for Ethernet
communications:
1. Run the T ekVISA Configuration program:
Start > Programs > Te kV IS A > T ekVIS A Configuration
The TekVISA Configuration program opens and searches for
GPIB and defined Ethernet addresses. If this is the first time
running the TekVISA Configuration program, there will not be
any defined Ethernet connections, and the program window lists
only GPIB instruments attached to the PC.
WaveStar Software User Manual
1- 7
Page 22

Installation and Uninstallation
2. Select the Add button to open the Add Remote Host dialog.
3. In the Host Name field, enter the Ethernet IP address of the
instrument (for example, 128.121.119.29) in the Host Name field.
4. Select OK. The program closes the dialog box, returns to the
main TekVISA Configuration window, and a dds the GPIB or
Ethernet address to the Remote Host field.
5. Select the Find button. The configuration program attempts to
locate the specified host address and list it in the TekVISA
Resources field.
NOTE. The TekVISA Configuration program must be able to find an
Ethernet instrument before you can continue with this procedure and
run the Instrument Manager Service (IMS) program. If TekVISA
cannot find an instrument, check that your instrument is connected to
the PC or network using the correct cables, and that the PC and
instrument Ethernet IP address information is correct.
6. Repeat steps 2 through 5 to add and find other instrument IP
addresses.
7. Select Quit to exit the TekVISA Configuration program.
Instrument Manager Service (IMS)
Do the following to open a communications connection to the
instrument:
1. Run the IMS program:
Start > Programs > Wa veS tar for Oscilloscop es > Instrument
Manager
The program opens the IMS window and then opens the Instrument
Connect wizard if there are no defined instru ments .
2. Select the instrument family to which you want to connect.
1- 8
WaveStar Software User Manual
Page 23

Installation and Uninstallation
3. Select Next. The program searches the TekVISA configuration
information, as well as the PC RS-232 and GPIB ports, for
instrument addresses, and lists them in the instrument field. If
IMS does not find an RS-232 or GPIB instrument conne cted to
your PC, verify that the instrument and PC communication
settings (such as baud rate, stop bits, and so on) are the same.
4. Select the instrument address to which you want WaveStar to
connect.
5. Select Next. The connection wizard displays an alias field in
which you can enter a name or label for the instrument. This alias
appears in the WaveStar instrument explorer view. If you do not
enter an alias, IMS and WaveStar uses the instrument series as
the alias.
6. Select Next. The connection wizard displays a Configure button
that lets you change PC communication settings for the selected
instrument communication protocol, restore default settings, or
test new settings.
7. Select Next. The connection wizard displays a Test button that
lets you test the selected instrument communication connection,
and returns a pass or fail message.
8. Select Next. The connection wizard displays a connection
verification message.
9. Select Finish to close the connection wizard and return to the
IMS window.
10. To add more instruments, select Edit > Add Instrument... from
the IMS menu and repeat steps 2 through 9.
11. Minimize the IMS window. You are now ready to run WaveStar.
WaveStar Software User Manual
1- 9
Page 24

Installation and Uninstallation
Running WaveStar
To start WaveStar, select Start > Programs > WaveStar for
Oscillos cop es > Wa veS tar for Oscilloscop es.
Refer to the rest of this manual, as well as the WaveStar online help,
for information on running WaveStar Software for Oscilloscopes or
the WaveStar Reader.
Uninstallation
To uninstall WaveStar for Oscilloscopes software, use the
Add/Remove program in the Microsoft Windows Control Panel to
activate the Uninstall wizard, which takes you through the uninstall
process for the selected software.
Tutorials
The CD-ROM installation disc contains tutorials for WaveStar for
Oscilloscopes. The tutorials introduce you to key features and
functionality of the WaveStar software. To run the tutorial, insert the
WaveStar CD into the CD drive and then select Start > Programs >
WaveStar for Oscilloscopes > Tutorial.
VISA and T ekVISA
TekVISA is t he Tektronix version of VISA software. Typical ly, only
one version of VISA runs on your computer at a time, so you must
choose between TekVISA and a VISA from another company. If you
choose to overwrite the existing visa32.dll file, the installer deletes
any other Visa32.dll file in the System directory of Windows and
replaces it with TekVisa’s visa32.dll file.
To use two di fferent visa32.dll files, simply rename the Visa32.dll
file you want to replace, and copy the visa32.dll file you want to use
to the same location. For example, you have two VISA files (one
from National Instruments, one from Tektronix), and the current
VISA file is the National Instruments (NI). To replace the NI VISA
file, rename it visa32_ni.dll, and copy the TekVisa visa32.dll file
1- 10
WaveStar Software User Manual
Page 25

Installation and Uninstallation
into the Window’s System directory. A copy of TekVisa’s visa32.dll
is located in the directory where TekVISA was stored.
Note the following information when choosing between TekVISA
and another company’sVISA:
H The WaveStar software may work with a VISA from another
company, provided their VISA software supports the interface
types with which you are working. If you choose to use a VISA
from another company and find it doesn’t work with the
WaveStar software, you can i nstall TekVISA later using the
WaveStar installer.
H TekVISA does not support VXI Mainframe communication.
WaveStar Software User Manual
1- 11
Page 26

Installation and Uninstallation
1- 12
WaveStar Software User Manual
Page 27

Instrument Manager Service (IMS)
Page 28

Page 29

Instrument Manager Service (IMS)
The Instrument Manager Service (IMS) application connects your
PC to an instrument. Any connections you make will be saved when
you exit the Instrument Manager.
T o run the IMS program, select Start > Programs > WaveStar for
Oscillos cop es > Instrument Manager
The program opens the IMS window. If there are no defined instruments, IMS also opens the Instrument Connect wizard.
Main Screen
The illustration below shows the Instrument Manager Service main
screen.
WaveStar Software User Manual
2- 1
Page 30

Instrument Manager Service
Menu Bar
The menu bar contains five menus, each wit h submenu commands to
control the application.
Control
Refresh Lists Refreshes the instrument list and updates the
Auto Shutdown Configures the application to automatically shut
Connect Service Configures the connection to the Instrument
Shutdown Service Shuts down the Instrument Server.
connection status of all instruments.
down the Instrument Server.
Server.
Exit User Interface Exits the Instrument Manager.
Edit
Add Instrument Adds an instrument to the Instrument Manager list.
Instrument
Properties
Delete Instrument Deletes the selected instrument from the
Switch Instrument Toggles the selected instrument connection
Displays the connection properties of the selected
instrument.
connection list.
between online and offline. You select the
instrument in the IMS main window.
2- 2
WaveStar Software User Manual
Page 31

Instrument Manager Service
View
Toolbar Turns the toolbar on and off.
Status Bar Turns the status bar on and off.
Activity Log Turns the activity log display on and off. The
activity log lists the date, time, and results of
communication between the PC and the
instrument.
Print
Activity Log Prints the activity log.
Help
Contents and Index Displays the table of contents and index for the
online help.
What’s This Displays What’s This help on toolbar buttons and
menu items. Select this menu item, and then click
the button or menu item for which you want help.
InstMgr Overview Displays the IMS Window Overview online help
topic.
Technical Support Shows information about contacting Tektronix for
technical help.
About InstMgr Shows the version information for the Instrument
Manager.
WaveStar Software User Manual
2- 3
Page 32
Instrument Manager Service
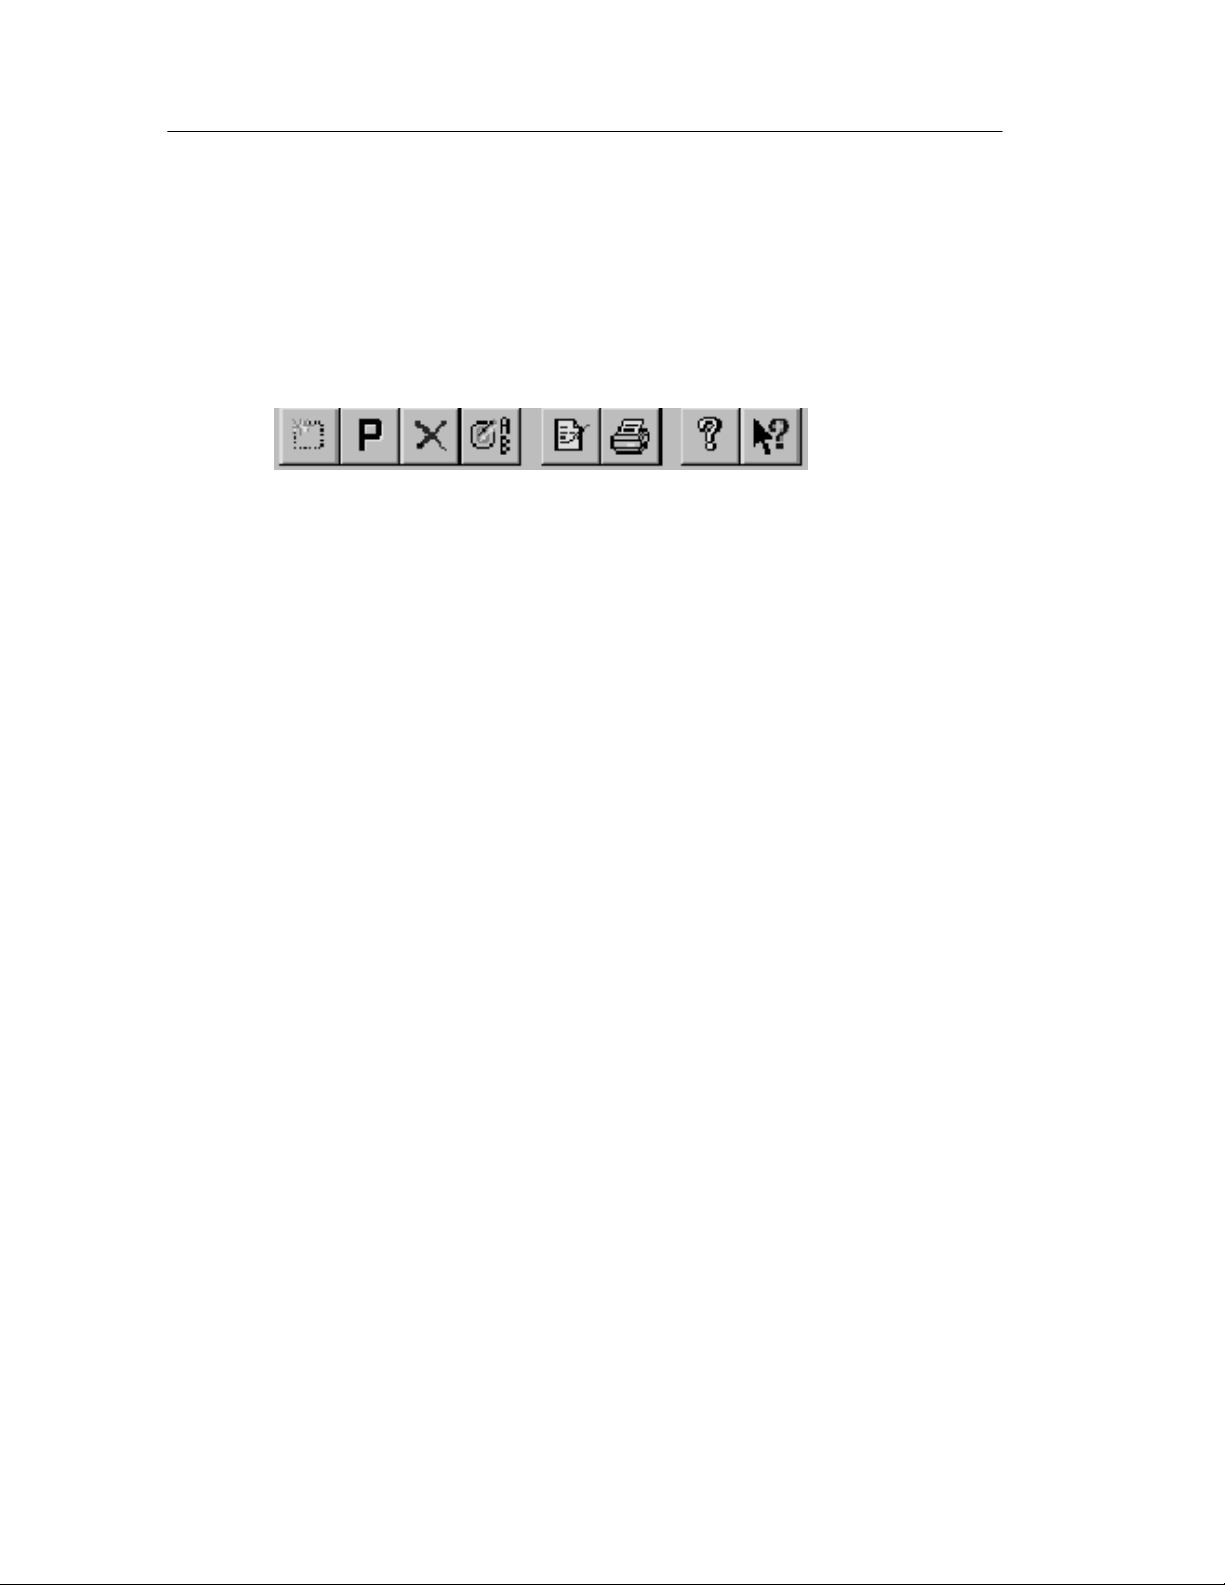
Toolbar
The Instrument Manager toolbar contains buttons that operate as
shortcuts to certain menu commands. Shown below is each button
with a description of what the button controls.
1234 56 7
Connect to a new instrument.
1
View the instrument properties of the instrument selected
2
from the list.
Delete the connection to the instrument selected from the list.
3
Toggles the selected instrument connection between online and
4
offline. You select the instrument in the IMS main window.
Display the Instrument Manager activity log. The activity log lists
5
communications, including communication errors, between your
PC and your instrument.
6
Print the Instrument Manager activity log.
Access the online help.
7
Display What’s This help on toolbar buttons and menu items.
8
Click this button, and then click the button or menu item for
which you want help.
8
2- 4
WaveStar Software User Manual
Page 33

Instrument List (Main Screen)
The main screen of the Instrument Manager (see page 2--1) shows
all the instruments available for connection and the following
information (from left to right):
H The alias you have assigned each instrument (if available)
H The connection type (RS-232, ASRL, or GPIB ports)
H The permissions set for each connection
H Software status (running, not running) and hardware status
(responding, not responding)
Add Instrument: Ethernet Connected
Instrument Manager Service
Refer to your AD007 GPIB-LAN Adapter User Manual to configure
the AD007 Adapter for your network installation. Refer to the
TDS3000 & TDS3000B Series Programmer Manual for connecting
the TDS3000 Series oscilloscope to a 10/100BaseT Ethernet LAN
using the TDS3EM Ethernet Communications Module (TDS3000) or
the built-in Ethernet connection (TDS3000B).
Once you have connected the new instrument to the your 10/100BaseT LAN using the appropriate RJ-45 UTP cable, do the following
steps to use the TekVisa Configuration Utility to enable the IMS to
locate the instrument:
1. Select Start > Programs > TekVisa > Visa Configuration to run
the TekVisa configuration program. The program will take a few
moments to locate current resources.
2. Select the Add button in the Remote Hosts field to open the Add
Remote Host dialog box.
3. Enter the IP address of your instrument. For example,
128.23.304.45. Do not enter or change the values in the other
fields.
4. Select the OK button. The configuration program closes the Add
Remote Host dialog box and searches the LAN for the specified
address.
WaveStar Software User Manual
2- 5
Page 34

Instrument Manager Service
5. The configuration program updates the TekVisa Configuration
dialog box with the Visa resource for the newly-added instrument. You use the resource name when you add the instrument to
the IMS list. Note that the Visa Configuration program and IMS
both label Ethernet resources as GPIBx::x::xxx; this is OK.
6. If the Visa Configuration program does not locate your
instrument, check the following:
H The instrument has been assigned an IP address.
H The instrument IP address is loaded into t he i nstrument.
H The instrument is powered on and connected to the LAN.
If none of the above fix the problem, work with your network
administrator to resolve the problem.
NOTE. You cannot run WaveStar sofware until the TekVISA program
recognizes the instrument connection.
7. Follow the steps in Add Instrument: GPIB or RS-232 Connected
(next) to use the Instrument Manager Service (IMS) to set up
communications between the instrument and the PC.
Add Instrument: GPIB or RS-232 Connected
Once you have connected the new instrument to the PC using the
appropriate RS-232 cable, follow the steps below to use the
Instrument Manager Service (IMS) to set up communications
between the instrument and the PC.
1. Power on the instrument.
2. Open the IMS program:
Start > Programs > Wa veS tar for Oscilloscop es > Instrument
Manager
2- 6
The IMS program searches for any RS-232-connected instruments and lists them in the Instrument List.
WaveStar Software User Manual
Page 35

Instrument Manager Service
NOTE. If there are no listings, there are no RS-232 or GPIB
connections available. You should recheck your instrument-to-PC
communication cable, make sure the instrument power is on, and
verify that both the instrument and PC communication settings are
the same.
3. If the IMS does not find any instruments, it opens the Instrument
Connection wizard. The first screen show a list of supported
instrument series.
4. Select the instrument series to which you want to connect and
then select Next.
5. Step 2 lists all available GPIB connections between your PC and
your instrument. Select the desired connection, and click Next.
6. Step 3 lets you enter an alias for your i nstrument. This will be the
name that appears in the IMS Alias list and in the WaveStar
Software instrument explorer view. If you do not enter a name,
the product family name is used by default. Enter an alias or
leave the field blank, and click Next.
7. In Step 4, click Configure to change your connection settings. If
you click Configure, a dialog appears showing the following
settings (click Next to use the current RS-232 or GPIB settings):
RS-232 Settings
Baud. The Baud rate is the speed of communication between
your PC and instrument. The baud rate selected here must mat ch
the baud rate of the instrument to which you are connecting.
NOTE. Check your instrument’s user manual to determine the
maximum Baud rate. If you have RS-232 communication problems,
select a lower Baud rate.
Stop bits. Stop bits are the number of bits sent with each
character to identify the end of data for that character.
Data bits. Data bits a re the num ber of bits sent for each
character.
WaveStar Software User Manual
2- 7
Page 36

Instrument Manager Service
Flow control. Flow control is the type of handshaking used to
guarantee accurate transmission of data from one device to
another. This handshaking prevents buffers from overflowing in
the receiving device.
Parity. Parity is the data bit added to each character to validate
its correct transmission.
Terminator. Terminator is the character added to the end of each
command or query to indicate the end of the command or query.
Timeout. Timeout is the length of time the application will try to
communicate with the instrument before aborting the communication. The default setting is None, which each instrument
interprets differently.
Restore Factory Settings. Uses the RS-232 settings originally
shipped with the selected instrument.
Restore Default Settings. Uses the predefined default settings
for the selected instrument.
GPIB Settings
Terminator. Terminator is the character added to the end of each
command or query to indicate the end of the command or query.
Timeout. Timeout is the length of time the application will try to
communicate with the instrument before aborting the communication. The default setting is None, which each instrument
interprets differently.
Restore Factory Settings. Restores the GPIB settings originally
shipped with the selected instrument.
Restore Default Settings. Restores the predefined default
settings for the selected instrument.
If you want to make your new selections the default settings for
GPIB connections, click the Update GPIB settings button.
When you are finished configuring the settings, click Test New
Settings. If the settings are accepted, a dialog appears telling you
that the device proxy is running and the attached hardware is
responding. Click OK.
2- 8
WaveStar Software User Manual
Page 37

Instrument Manager Service
8. The Step 4 dialog appears again. Click Next.
9. In Step 5, click Test to test your connection. If the connection is
established, the following message appears:
“Device proxy (<Instrument Name>) is running and t he
attached hardware is responding.”
If the connection is not established the following message
appears:
“Device proxy (<Instrument Name>) is running but the
attached hardware is not responding. Response string is: ().”
If you get the above message, check the following items:
H The cable connection between your instrument and PC
H You are connected to an available COM port on the PC
H The instrument power is on, and that you are using the correct
cable. Refer to System Requi rements on page 1--3 for a list of
system and equipment requirements.
Use the Back button to check your settings and rec onfigure the
connection.
When you establish a good connection, click Next.
10. Click Finish in Step 6 to add this instrument and connection to
the IMS list.
Remove an Instrument
Follow the steps below to re move an instrument from the IMS
application:
1. Open the IMS application.
2. In the Alias list, select the instrument you to remove.
3. Click the delete button in the tool bar or select Edit | Delete
Instrument.
WaveStar Software User Manual
2- 9
Page 38

Instrument Manager Service
Switching an Instrument Online or Offline
You can have more than one instrument listed in the IMS with the
same connection (see the Main Screen illustration on page 2 --1).
However, only one of these instruments can be online at any given
time.
To switch an instrument online or offline, follow these steps:
1. Select the instrument you want to switch online or offline in the
IMS main screen.
2. Select Switch Instrument from the Edit menu in the IMS
application. One of the following dialogs will appear:
H If the connection is currently in use with another instrument,
a dialog will appear asking you to verify that you want to
switch that instrument offline before switching the selected
instrument online.
H If the connection for the selected instrument is not in use, a
dialog will appear asking you to verify that you want to
switch the selected instrument online.
NOTE. You can also use the toolbar to switch an instrument online or
offline. Refer to item 4 in the toolbar shown on page 2--4.
Shutting Down Service
The Instrument Server continues to occupy a COM port, even when
the IMS application is closed. To release the COM port, select
Shutdown Service from the Control menu before you close the IMS
application. Select Auto Shutdown from the Control menu to shut
down both the Instrument Server and the IMS application when you
exit the application.
2- 10
WaveStar Software User Manual
Page 39

Display and Print the IMS Activity Log
The IMS Activity Log shows the time, date, and description of all
communications between WaveStar Software and the instrument.
Display the Activity Log
Follow the steps below to display the IMS activity log:
1. Open the IMS application.
2. Click the View Log button in the IMS toolbar. When the activity
log appears, you can select the following elements:
H Local service activity. Logs communication between the
instrument and WaveStar Software.
H Internal program logic. Logs WaveStar Software operations.
Instrument Manager Service
H Refresh button. Updates the activity log.
3. Click OK to dismiss the activity log.
Print the Activity Log
1. From the activity log, click Print; use the print dialog to print the
log.
2. From the IMS window, click Print in the toolbar or select Print |
Activity Log.
WaveStar Software User Manual
2- 11
Page 40

Instrument Manager Service
Set Instrument Permissions
1. Open the IMS application and select the instrument whose
permissions you wish to change.
2. Click the Properties button in the toolbar or select Edit |
Instrument Properties to display the Instrument Properties dialog
box.
3. Click the following items to toggle the permissions on or off:
H Read Only
H Read/Write
H Visible
H Activity Logging
4. Click OK to apply your selections; press Cancel to discard them.
Both buttons dismiss the Instrument Properties dialog box.
2- 12
WaveStar Software User Manual
Page 41

Operating Basics
Page 42

Page 43

Operating Basics
This section outlines WaveStar Software features common to
WaveStar for Oscilloscopes and WaveStar Reader.
Main Screen Overview
The WaveStar window consists of a me nu bar, a toolbar, and two
panes: the Explorer View and the Data Sheet Pane. The following
illustration labels each area of the WaveStar window.
Menu bar Toolbar
Explorer View Data Sheet Pane
WaveStar Software User Manual
3- 1
Page 44

Operating Basics
Menu Bar
The menu bar contains all commands available in WaveStar. You
access the menu bar commands using standard Window menu
processes. The menu bar is described in more detail on page 3--4.
Toolbar
The toolbar contains shortcuts to the most commonly-used WaveStar
commands. The toolbar is described in more detail on page 3--10.
Explorer View
The Explorer view lists all available i nstruments and their data,
settings, and controls, in a Windows Explorer-like tree diagram. You
copy and/or link data from an instrument in the Explorer vie w to a
data sheet in the Data Sheet pane. The Explore r view is described in
more detail on page 3--12.
NOTE. WaveStar Reader does not have the Explorer view.
Data Sheet Pane
The Data Sheet pane contains data sheets that provide an assortment
of ways to display instrument da ta. In the data sheet pane, you can
do the following tasks:
H Create data sheets for displaying waveforms graphically, such as
strip recordings, as tables, as statistics, or as measurements.
H Transfer data to and display it in the data sheets, using Windows-
standard drag and drop operations.
H Document and analyze data, dragging and dropping it from data
sheets to Microsoft Office applications.
H Display waveforms from one channel or from many i n the same
data sheet or in individual data sheets.
H Display the same waveform data graphicall y, as a table, or both
ways at the same time.
3- 2
WaveStar Software User Manual
Page 45

Operating Basics
H Compare waveforms in various views simultaneously, in one or
more data sheets or in a single document (if you drag da ta from a
data sheet into an MS Word document or Excel spreadsheet).
H Print a monochrome or color hardcopy of your data (depending
on printer abilities).
There are four types of data sheets:
1. Waveform data sheets display instrument waveforms. These data
sheets let you view, record, or analyze waveform data. Available
waveform data sheets are YT, XY, and Power Harmonics.
2. Scalar data sheets display instrument scalar data, such as
measurements and waveform sample points. Available Scalar
data sheets are DatalogMeasurement, DatalogTabular, ScalarViewer, StripChart, WaveformMeasurement, and WaveformTabular.
3. The Notes data sheet displays graphical copies of waveform or
tabular data, instrument screen copies, instrument settings, and
notes that you add to the sheet.
4. The Instrument Explorer data sheet displays the contents of
instrument hard and floppy drives in an Explorer-like window.
All data sheets in a data sheet pane are part of the current workbook
(.wk file extension). The workbook allows you to organize and save
your data sheets as a single collection. You ca n also save individual
sheets as files (.sht file extension) and add saved sheets to the current
workbook.
All of these data sheets are described in detail in Section 4,
Data Sheet Overview.
WaveStar Software User Manual
3- 3
Page 46

Operating Basics
The WaveStar Menu Bar
The menu bar contains menus and associated submenus that give you
access to all WaveStar command functions. The menu bar is
dynamic; the menus shown, along with their contents, change
depending on which data sheet is active. The following table briefly
describes all possible contents of each menu.
File
New Datasheet... Opens a dialog box that lets you select a data
Open... Opens a dialog box that lets you open a workbook
sheet to add to the data sheet pane.
or data sheet file.
Close Datasheet Deletes the selected data sheet from the
workbook.
Close Workbook Closes the current workbook and clears the data
sheet pane.
Save Datasheet
As...
Save Workbook Saves the workbook to its current directory and file
Save Workbook
As...
Start Workbook... Starts data acquisition of linked signals for the
Opens a dialog box that lets you save the selected
data sheet to a specified directory and file name.
Note that changing the file name will change the
name of the data sheet as displayed in that sheet’s
title bar.
name.
Opens a dialog box that lets you save the
workbook to a specified directory and file name.
workbook. You can select which data sheets will
acquire data. This command does not refresh
copied data or relink unlinked signals.
3- 4
Stop Workbook... Stops data acquisition of linked signals for the
workbook. You can select which data sheets will
stop acquiring data. This command does not
unlink linked signals.
WaveStar Software User Manual
Page 47

Operating Basics
File
Auto Versioning Automatically appends date and time information
to data sheet or workbook file names when the file
is saved. This lets you create time-stamped files.
Rename
Datasheet...
Opens a dialog box that lets you rename the
selected data sheet title that appears in the sheet’s
title bar. Note that changing the name will change
the file name of the data sheet, as the data sheet
uses the file name for the title bar label.
Import... Imports the specified file-format contents into the
selected data sheet. Available formats are .CSV,
.WFM, .ISF, and .MSK.
Export
Datasheet
"
Exports the selected data sheet’s contents in the
specified data format. Available formats are .CSV,
text, .RTF, and .MSK.
Print Setup... Sets printer parameters including current printer,
page format, number of copies to print, and so on.
Print Preview
Datasheet
Previews the printer output for the selected data
sheet.
Print Datasheet... Prints the selected data sheet to the current
printer.
Print Preview
Workbook
Print Workbook... Prints all data sheets in the workbook to the
Print Banner... Prints long waveforms in banner format.
Recent File List Displays a list of the most-recent workbooks you
Exit Exits the WaveStar program.
WaveStar Software User Manual
Previews the printer output of all the data sheets in
the workbook.
current printer.
have created or opened. Select to open.
3- 5
Page 48

Operating Basics
Edit
Undo Undoes the last Wavestar task action.
Redo Redoes the last Wavestar task action.
Cut Cuts the selected data sheet information to the
Copy Copies the selected data sheet information to the
Paste Copies the Clipboard information into the selected
Delete Deletes the selected information from the data
Clipboard.
Clipboard.
data sheet.
sheet.
Unlink Disconnects the selected data sheet data from its
source. Unlinked data can be relinked using the
Relink command, or refreshed by using the
Refresh Datasheet or Refresh Workbook
commands.
Relink Reconnects the selected data sheet data to its
source. Relink will not create a link to a data
source.
Select All Selects all waveform or data on the selected data
sheet.
New Annotation Opens a dialog box that lets you add notes to the
selected YT, XY, or StripChart data sheet. You can
then select the note text in the data sheet and
move it to the desired location.
Edit Annotation Lets you edit existing annotation text on a YT, XY,
or StripChart data sheet. Select the text to edit,
then select Edit -Edit Annotation. You can also just
double-click on the annotation text to open the edit
dialog box.
3- 6
Clipboard
Formats...
Selects data formats that can be saved to the
Clipboard. Formats include Comma Separated
Values (CSV), Simple text (ASCII), DIB (Bitmap),
Rich Text Format (RTF), and Enhanced Metafile.
WaveStar Software User Manual
Page 49

Operating Basics
Edit
Swap XY Swaps the signal sources assigned to the XY
inputs of the XY data sheet.
Find... Opens a dialog box to search the Notes sheet for
a specified text string.
Replace... Opens a dialog box to search the Notes sheet for
a specified text string and replace with another
specified text string.
Copy Voltage
Waveform
Copy Current
Waveform
Copy Power
Waveform
View
Toolbar Turns the WaveStar toolbar on or off.
Status Bar Turns the WaveStar status bar on or off.
Explorer View Turns the Explorer view on or off.
Datasheet Toolbar Turns the selected data sheet toolbar on or off.
Mask Editing
Toolbar
Datasheet Status
Bar
Copies the voltage waveform from the Power
Harmonics data sheet.
Copies the current waveform from the Power
Harmonics data sheet.
Copies the calculated power waveform from the
Power Harmonics data sheet.
Turns the mask editing toolbar on or off.
Turns the selected data sheet status bar on or off.
Refresh Datasheet Updates copied and unlinked data on the selected
Refresh Workbook Updates copied and unlinked data in all data
Properties... Opens a dialog box to display and set properties of
WaveStar Software User Manual
data sheet.
sheets of the workbook.
the selected data sheet.
3- 7
Page 50

Operating Basics
View
Show Links... Shows links associated with the selected data
sheet.
Centered
(XY &YT only)
Transfer Full Graticule (XY &YT only)
Masks (YT sheet only)
New Mask Creates a new mask for a specified oscilloscope
New Segment Creates a small rectangular mask segment in the
Duplicate Segment Copies the active mask segment. You can undo
Centers the graticule in the XY or YT sheet
windows. This command is only available when
the graticule is larger than the data sheet window.
Copies the entire graticule when doing drag and
drop operations to other applications such as
Microsoft Word. If this command is not enabled,
WaveStar copies just the graticule area displayed
in the data sheet window.
family. You create the mask segments and then
define the mask parameters.
upper-left corner of an existing mask. You can
then move the segment, add points, and reshape it
as needed.
Duplicate Segment.
3- 8
Add Point Adds a point (vertex) halfway between a selected
point and the next counterclockwise point. You can
undo Add Point.
Delete Point Deletes the selected mask segment point. You can
undo Delete Point to restore a deleted line point.
Delete Segment Deletes the selected mask segment. You can undo
Delete Segment to restore a deleted segment.
Delete Mask Deletes all mask segments from the YT sheet. You
can undo Delete Mask.
Change Size Changes overall size of a segment using specified
values.
WaveStar Software User Manual
Page 51

Operating Basics
Masks (YT sheet only)
Set Units Sets amplitude/time or Divisions as the mask
segment position units.
Tabular View Displays the active mask segment coordinates in
tabular form. You can edit the table entries for
more precise control of the segment coordinates.
You can also enter mask parameters by selecting
the Edit Parameters button
Format (Notes sheet only)
Fonts... Selects the font typeface and size to use when
adding text to the Notes sheet.
Color... Selects the font color to use when adding text to
the Notes sheet.
Alignment Selects the font word-wrap and text alignment
characteristics to use when adding text to the
Notes sheet.
Window
Cascade Stacks open data sheets in a diagonal overlap,
starting from the upper left corner of the data
sheet pane.
Tile Resizes data sheets in the data sheet pane so that
all sheets are visible and do not overlap.
New Window Opens a new Instrument Explorer data sheet in
the sheet pane.
Arrange Icons Lines up minimized data sheet icons along the
bottom of the data sheet pane.
Help
Contents and Index Displays the table of contents and index for the
online help.
What’s This Displays What’s This help on toolbar buttons and
WaveStar Software User Manual
menu items. Select this menu item, and then click
the button or menu item for which you want help.
3- 9
Page 52

Operating Basics
Help
WaveStar
Introduction
WaveStar Overview Displays the WaveStar Overview online help topic.
Technical Support Shows information about contacting Tektronix for
About WaveStar... Shows WaveStar version information.
The WaveStar Toolbar
The following figure and table describe the function of each toolbar
button.
1234 567
Opens a window that displays WaveStar
introductory information.
technical help.
89
3- 10
10 11 12
Item Button name Description
1 New Datasheet Opens a dialog box that lists available data
2 Open Opens a dialog box to let you load saved data
3 Save Datasheet Opens a dialog box to let you save the selected
13
14 15 16 17
sheets. Select a data sheet and click OK to load
into the data sheet pane.
sheet (*.sht), workbook (*.wbk), or WSTR31
notebook (*.nbk) files.
data sheet to a specified location and file name.
WaveStar Software User Manual
Page 53

Operating Basics
Item DescriptionButton name
4 Save Workbook Opens a dialog box to let you save the workbook
to a specified location and file name. A workbook
consists of all data sheets loaded into the data
sheet pane.
5 Cut Cuts the contents of the selected data sheet to
the Clipboard.
6 Copy Copies the contents of the selected data sheet to
the Clipboard.
7 Paste Copies the contents of the Clipboard to the
selected data sheet.
8 Unlink Disconnects the link between the selected data
target on a data sheet and its source signal or
measurement.
9 Relink Reconnects a link between the source signal or
measurement and the selected data target on a
data sheet.
10 Print Datasheet Prints the selected data sheet to the current
printer as set in the File | Print Setup... menu.
11 Print Workbook Prints all data sheets in the workbook to the
current printer as set in the File | Print Setup...
menu.
12 Refresh
Datasheet
13 Refresh
Workbook
14 Start Workbook Starts data acquisition of all linked signal and
15 Stop Workbook Stops data acquisition of all linked signal and
16 Online Help Opens a dialog box to access WaveStar online
Updates all copied and unlinked data on the
selected data sheet.
Updates all copied and unlinked data on all data
sheets in the workbook.
measurement sources for the entire workbook.
measurement sources for the entire workbook.
help files.
17 What’sThisHelp Lets you use the mouse & cursor to point at items
WaveStar Software User Manual
in the WaveStar window on which you want help.
3- 11
Page 54

Operating Basics
The Explorer View
The Explorer view graphically lists all connected instruments and
their associated parameters. There are three Explorer view categories
for each oscilloscope; Data, Setup, and Functions. The following
table describes these categories for a typical oscilloscope. However,
the actual instrument category contents depe nd on the connect edinstrument capabilities.
Data Instrument data sources to copy or link to data sheets.
Display Copy instrument screen to Notes data sheet or
Waveforms Instrument waveforms (such as channels and
Windows application (for example, Word).
math waveforms) to copy or link to data sheets.
Masks Instrument mask data to copy or link to data
sheets. You must copy a mask to a YT sheet to
edit the mask.
Measurements Instrument measurements (immediate, instrument-
specified measurements) to copy or link to data
sheets.
Settings Instrument settings (such as channel, time base,
display, and so on) to copy to or from the Notes
data sheet or other windows text processor. This
feature lets you save and recall instrument settings
as part of a workbook file. Refer to page 4--16 for
more information.
System System firmware and options information to copy
to a notes sheet.
3- 12
WaveStar Software User Manual
Page 55

Operating Basics
Setup Instrument control commands
Screen Copy Set screen copy parameters for the Data - Display
command.
Display Set display parameters such as format (XY, YT),
image persistence, image style (dots, vector), and
so on.
Acquire Set acquisition parameters such as mode (sample,
average, ...), sample average value, acquisition on
or off, and so on.
Vertical Set channel and math waveform vertical
parameters such as bandwidth, coupling, scale,
probe multiplier, and so on.
Horizontal Set horizontal time base parameters such as main
and delay time settings, sample record length, and
so on.
Trigger Set vertical trigger parameters such as level,
holdoff times, trigger type, and so on.
Masks Set mask source, type, enable mask display, mask
violations, pass/fail test parameters, and so on.
Measurements Set instrument measurement parameters such as
source and type of measurement.
Functions General instrument controls including run/stop, set 50%
trigger level, Autoset, and so on.
WaveStar Software User Manual
3- 13
Page 56

Operating Basics
Using The Explorer View
To display the contents of an Explorer view subtree, click on the plus
icon next to an item you want to explore. Continue clicking on plus
icons to open further subtrees. To close a subtree, click on the mi nus
icon next to the subtree. The lowest-level subtrees generally
represent the data or scope control that you can copy, link, or
execute.
3- 14
WaveStar Software User Manual
Page 57

Operating Basics
Copying Data from the Explorer View
Copying data results in a static snapshot of the data. The data does
not update in the application as it updates on the instrument. You can
manually refresh the data sheet by selecting the Refresh Datasheet
command in the View menu.
To copy a waveform or a scalar value into a data sheet, do these
steps:
1. Left click on the data object in the Explorer view, and hold down
the mouse button. Refer to
2. Drag the data object into the data sheet and release the mouse
button. Refer to
➁ in the illustration.
➀ in the following illustration.
WaveStar Software User Manual
3- 15
Page 58

Operating Basics
Linking Data from the Explorer View
Linking data results in dynamic data that updates in the application
as it updates on the instrument. A GPIB interface allows for faster
WaveStar data sheet updates than does the RS-232 interface: RS-232
data transfer rates are much slower than GPIB.
There are two methods of linking data to a data sheet or toolbar
button.
Linking Method 1.
1. Right click on the selected data object in the Explorer view, and
hold down the mouse button. Refer to
illustration.
2. Drag the data object to target into the dat a sheet and rel ease the
mouse button. Refer t o
➀ in the following
➁.
3. Click Link in the shortcut menu that pops up. Refer to
➂.
3- 16
WaveStar Software User Manual
Page 59
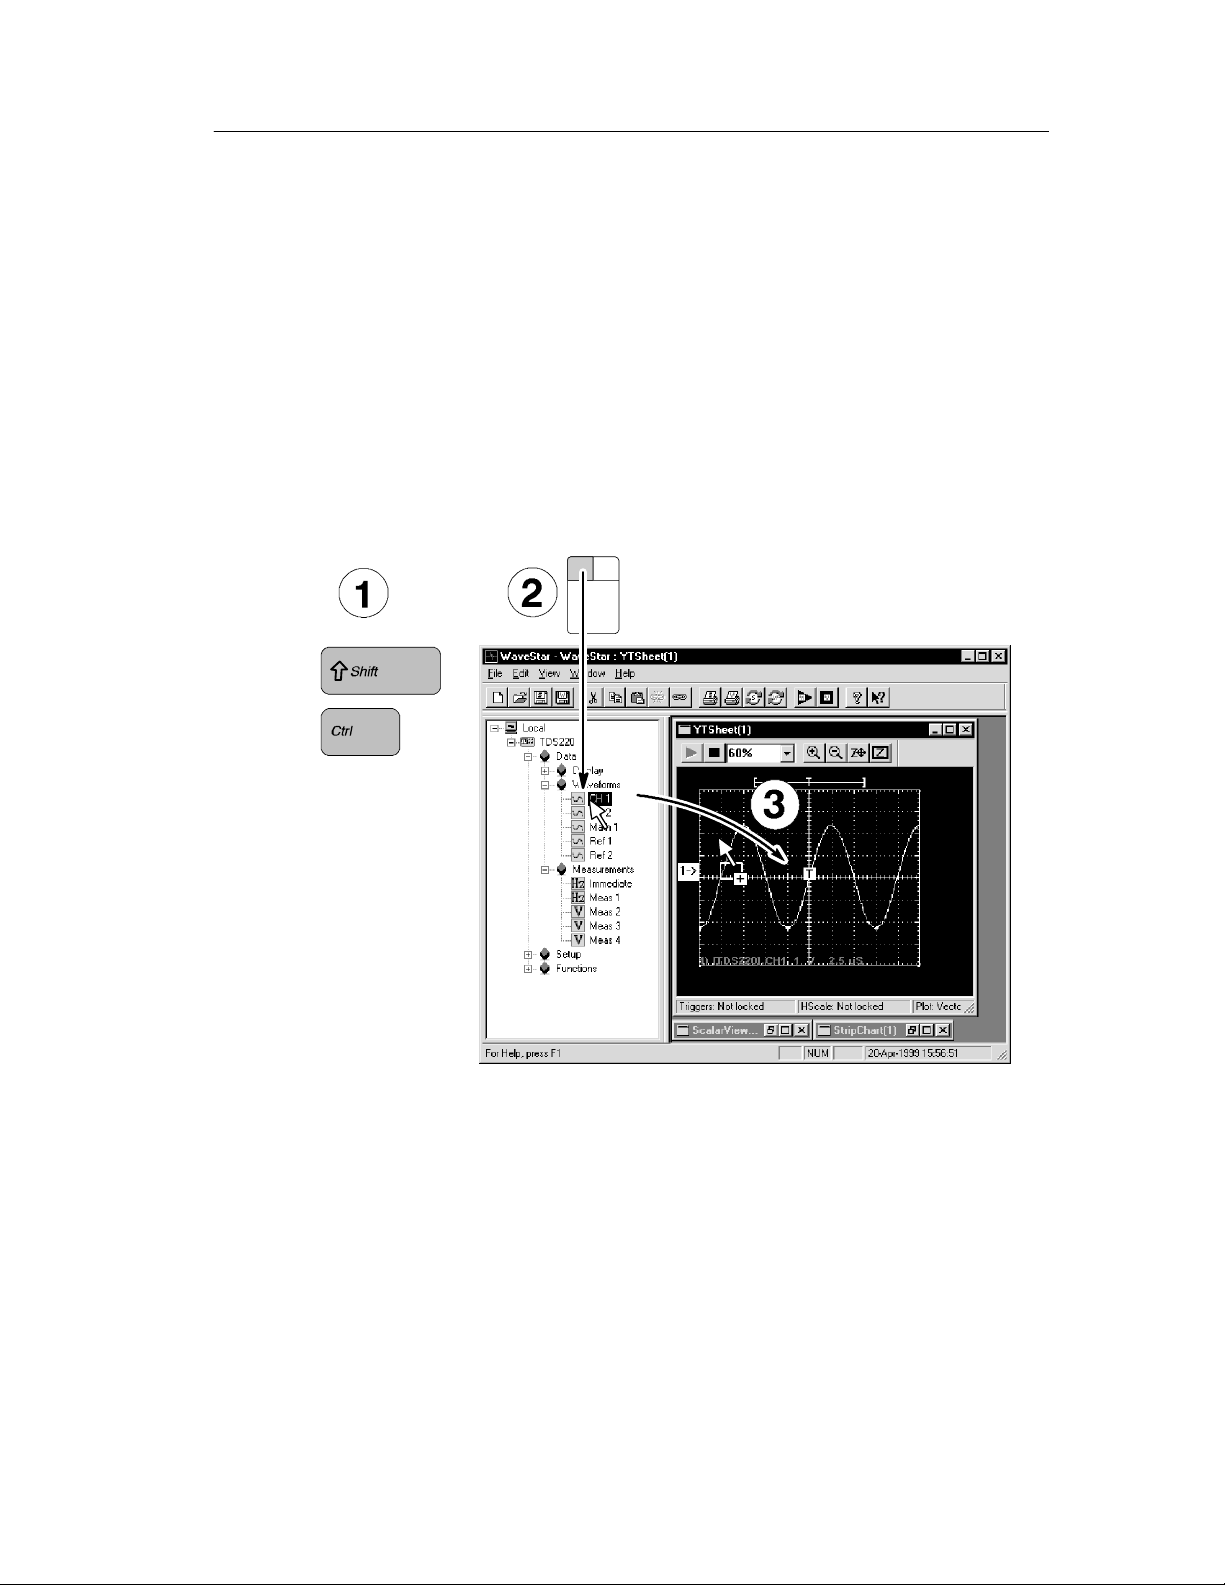
Linking Method 2.
Operating Basics
1. Press and hold the Ctrl+Shift keys. Refe r to
illustration.
2. Left click on the data object in the Explorer view, and hold down
the mouse button. Refer to
3. Drag the data object to the target. Re lease the mouse button and
the Ctrl+Shift keys. Refer to
➁.
➂.
➀ in the following
WaveStar Software User Manual
3- 17
Page 60
Operating Basics
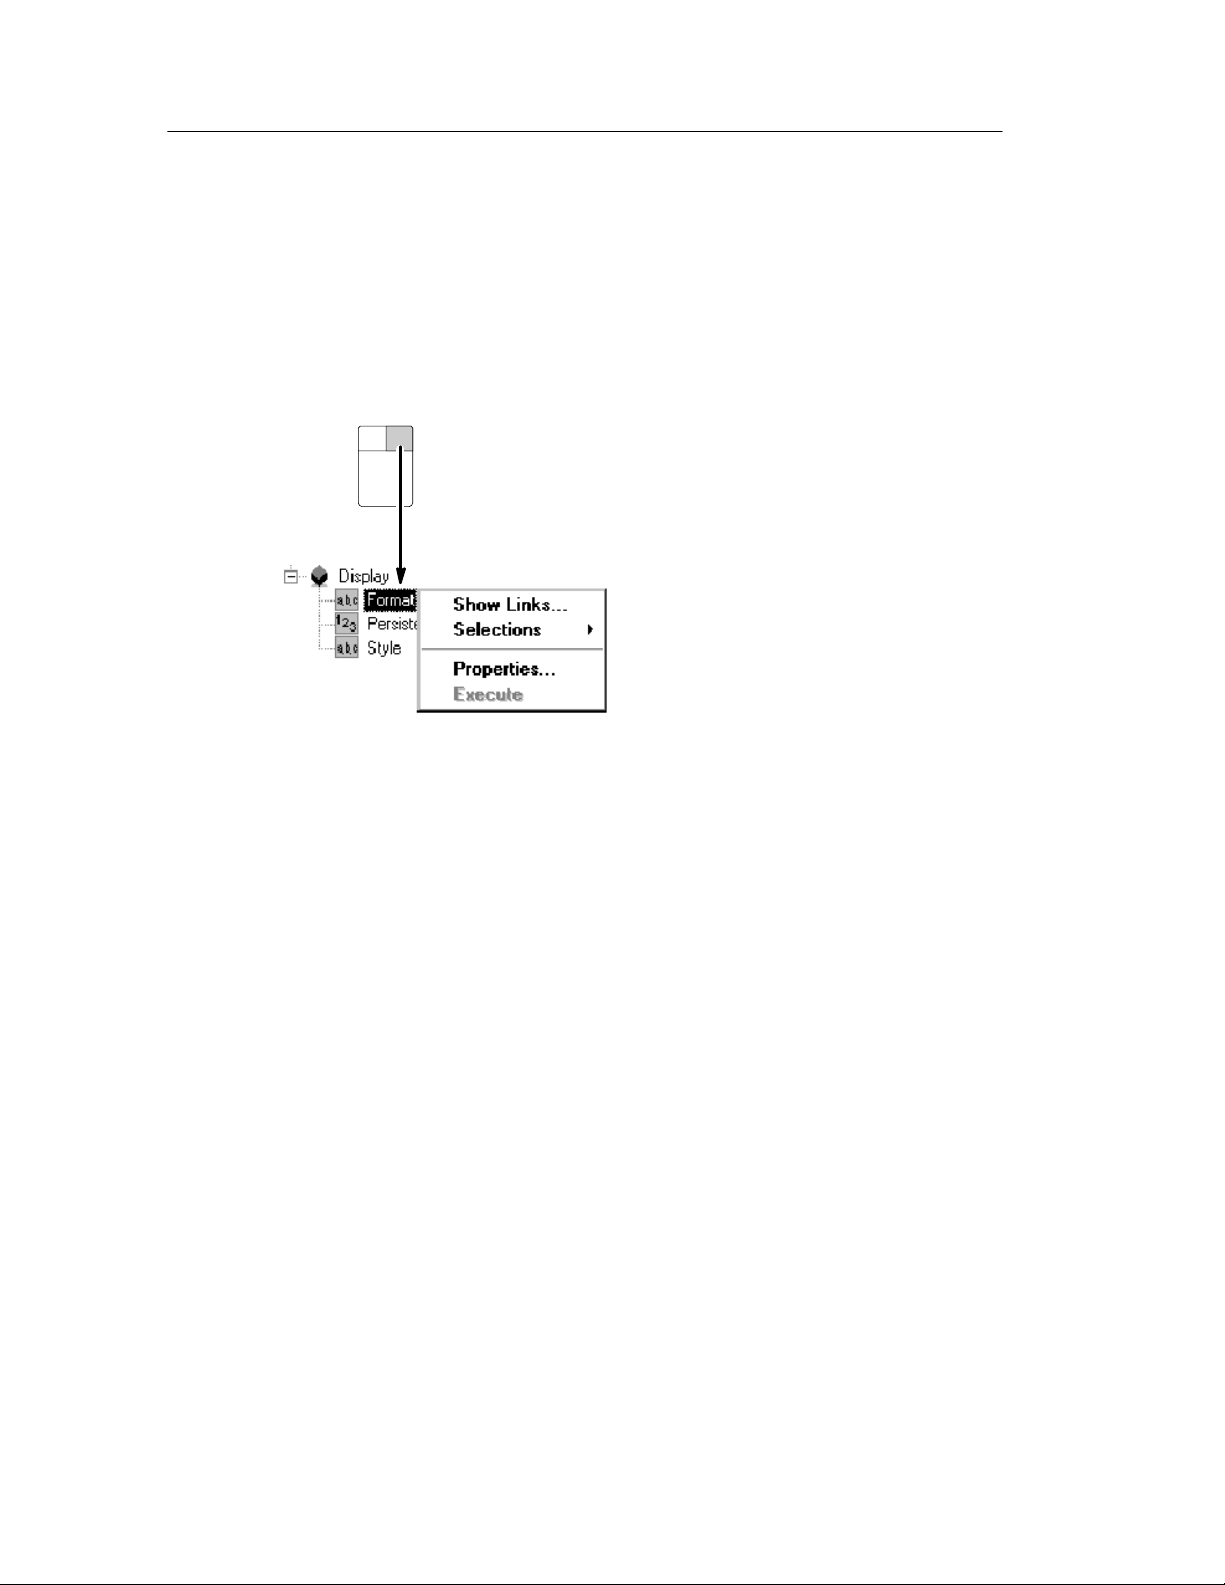
Explorer View Links, Selections, and Properties
The data and command icons also let you access further settings and
information by using a popup menu. Right-click on an icon to
display the menu.
H Show Links opens a dialog box that lists the data sheets that are
linked to this data item.
H Selections lets you sel ect from a pop-up list of possible val ues.
Selecting a value sets the instrument to use that value.
H Properties opens a dialog box with a single field. The field lets
you enter parameter values directly. This field generally
duplicates the current value of the Selec tions menu.
H Execute causes WaveStar to execute the selected Explorer view
command.
3- 18
WaveStar Software User Manual
Page 61

The WaveStar Reader
The WaveStar Reader lets you share data sheets and workbooks with
other users who do not have WaveStar for Oscilloscopes. Each user
must install the WaveStar Reader in order to open and work with
data sheets or workbooks.
You can install the WaveStar Reader from the WaveStar Software for
Oscilloscopes CD, or by downloading WaveStar Reader from the
Tektronix website (www.tektronix.com).
The WaveStar Reader operates exactly the same as WaveStar, with
the following caveats:
H Non-available commands are greyed out.
H There is no Explorer view in WaveStar Reader, as you cannot
connect or link to an instrument.
Operating Basics
H You cannot create new data sheets in WaveStar Reader
H You can open existing data sheet and workbooks, add comments
or manipulate data, and save existing data shee ts or workbooks to
the same file name or to new file names.
H You can save data sheets that were part of a workbook to
individual files. You can also save individual data sheets into a
new workbook file.
H Data sheets that were linked in WaveStar for Oscilloscopes will
not relink to the instrument. Linked data sheet s show their
last-acquired data.
WaveStar Software User Manual
3- 19
Page 62

Operating Basics
3- 20
WaveStar Software User Manual
Page 63

Data Sheet Overview
Page 64

Page 65

Data Sheet Overview
This section of the manual describes each type of data sheet, how
and when to use them, and explains behavior common to all data
sheets.
Data Sheet Pane
The Data Sheet pane (refer to illustration on page 3--1) represents the
WaveStar workbook; the data pane is an open WaveStar workbook
that contains all data sheets that are part of the workbook file. You
can save individual data sheets without saving the workbook, or save
the workbook, which saves all data sheets within it.
Dragging a new workbook from Windows Explorer into the data
pane closes the currently open workbook and opens the workbook
you dropped onto the data pane. You are prompted to save the
currently open workbook file before it closes.
Dragging a data sheet to the data pane adds it to the open workbook.
Common Sheet Functions
All data sheets share some common characteristics. Data sheets
receive your da ta, waveforms, screen capture s, and text, and then
display it according to the type of data sheet receiving the data. Data
sheets are used to:
H Receive data and update i t i f that data is linked to its source.
H Store data when saved as individual sheets or workbooks.
H Source and receive data from other data sheets.
WaveStar Software User Manual
4- 1
Page 66

Data Sheet Overview
Creating, Opening, Saving, and Closing Data Sheets
H To create a new sheet in the open workbook, sele ct File | New
and choose a sheet type.
H To open an existing data sheet into a workbook, drag and drop a
*.sht file from the Windows Explorer into the data sheet pane.
(Or open it from the File menu or toolbar.)
H To save a data sheet, click on its title bar in the data sheet pane,
andthenclickthe
data sheet by selecting File | Save Data Sheet.
H To close a data sheet, select File | Close Datasheet.
Start/Stop Data Acquisition
All data sheets contain Start and Stop acquisition tool bar buttons.
The Start button (triangle) starts data acquisition of all linked signal
and measurement sources to the selected data sheet. The Stop button
(square) stops data acquisition to the selected sheet.
H The Start and Stop acquisition buttons do not update copied or
unlinked signal or measurement data.
H If you stop a measurement that is linked to a datalog or strip
chart sheet, and then start the same measurement, WaveStar
displays a message box stating that it will discard previously-recorded measurements if you start recording again. You can select
to start data acquisition again, or cancel start. If you need to
continue recording data for the stopped measurement, just ope n a
new data sheet and link the data to the new sheet.
button in the toolbar. You can also save a
4- 2
WaveStar Software User Manual
Page 67

Data Sheet Overview
Zooming
The YT, XY, and Strip Chart data sheet tool bars contain controls for
zooming the contents of the data sheet window. Zoom Full Screen
and Drag Zoom buttons are not available in the Strip Chart data
sheet.
H The percent zoom field displays the current data sheet m agnifica-
tion setting, where 100% is the system-default zoom value. You
can also enter numeric values into this field by moving the cursor
into the field, clicking the right mouse button, and typing in a
new value.
Clicking on the drop-down menu arrow displays a list of
magnification values from which you can select.
H The Zoom In button (magnifying glass with a plus symbol)
zooms into the data sheet.
H The Zoom Out button (magnifying glass with a minus symbol)
zooms out from the data sheet.
H The Zoom Full Screen button is the Z with the 4-way arrow. This
button fits the graticule to the current data sheet window size,
allowing you to view the entire graticule.
H The Drag Zoom button is the Z enclosed in a box. This button
lets you select a specific sheet area to enlarge. To use, select the
Drag Zoom button, then, in the graticule, click and drag the
mouse to draw a box around the part of the wave form you want
to enlarge.
WaveStar Software User Manual
4- 3
Page 68

Data Sheet Overview
Sizing, Tiling and Cascading Windows
H To scroll data or size the data sheet, use normal windows
procedures.
H To auto arrange or otherwise manipulate windows or icons, select
the appropriate menu items in the WaveStar Window menu.
Previewing and Printing
H To set up and preview or print data sheets, select the data sheet,
and then select File | Print. You can also print all the data sheets
that are open by selecting File | Print Workbook, and then
selecting the data sheets you want printed in the Print Workbook
dialog.
H To print the full record le ngth of all waveforms in the YT data
sheet, select the data sheet and choose Print Banner... in the
WaveStar File menu. The Print Banner option is useful when
your YT data sheet contains waveforms that are longer than the
width of the graticule.
Copy and Linking
You can either copy or link waveform and scalar data onto a data
sheet. Copying takes a one-time snapshot of the waveform or scalar
data and places that data on a data sheet. Li nking samples the
waveform or scalar data on a regular bases, constantly updating the
data sheet with the latest data.
H To copy a waveform or a scalar value into a data sheet, left click
the data object in the Explorer view and drag it into the data
sheet.
H To link, right click the data object and drag it to the target. When
you release it, choose Link from the shortcut menu that pops up.
For more detailed information, refer to page 3--15.
4- 4
WaveStar Software User Manual
Page 69

Data Sheet Overview
Copying into Microsoft Office Applications
You can copy (but not link) a waveform from a data sheet into a
Microsoft Word document or Excel spreadsheet by left clicking the
data object and dragging it into an Microsoft Office application.
To copy numerical data (text) to the Windows clipboard, select
simple text or rich text in the Clipboard Formats dialog (in the Edit
menu). If you would rather copy a bit-mapped image of the data
sheet, uncheck both simple and rich text in that dialog. Then click
any measurement value and drag it to the Windows application to
which you want to copy the image.
Setting Properties
Property page settings det ermine the appearance and function of
each data sheet in the open workbook.
H To access the Property page for a data sheet, click in its title bar
to select it, and then choose Properties from the View menu.
You can also access Property Pages by right clicking in an active
data sheet and selecting properties from the displayed submenu.
All right-clic k me nus for data sheets contain a Properties option,
which provides access to individual property pages.
H To navigate to individual tabbed sheets (if the property page has
multiple tabs), left click on the tab to bring it into the foreground
as needed. Click OK when you are finished entering property
settings to save the property settings, and close the dialog.
Shortcut Menu
Right click in the data sheet data area to display a pop-up menu for
performing the following tasks:
H Save, close, or print the data sheet.
H Display the property sheet for this data sheet.
H Show the data source links to the selected data sheet.
H Access the online help for the selected data sheet.
WaveStar Software User Manual
4- 5
Page 70

Data Sheet Overview
Data Sheets and Compatible Data Types
WaveStar data sheets can handle two types of data: wave forms, such
as those displayed from an oscilloscope channel, and scalar values,
such as a volts per division or a waveform measurement.
Each sheet can accept one or more data types and will display data
differently depending on the data sheet format and source data type.
Data Compatibility Between Data Sheets
Observe the following caveats when copying or linking data between
data sheet:
H YT and XY data sheets can only accept data from YT, XY,
WaveformMeasurement, or WaveformTabular dat a shee ts (you
must drag a complete column of data from the WaveformMeasurement or Waveform Tabular sheet to an YT or XY sheet).
H The WaveformMeasurement sheet can source either waveform
data (if you drag a complete column of data from the WaveformMeasurement sheet to an YT or XY sheet) or scalar data (if you
drag a single cell of data to a scalar sheet).
H Scalar-value data sheets can only accept scalar data.
H If you drag a wave form plot from the XY sheet to a YT sheet, the
plot is separated into its X and Y waveform components and
displayed as two individual waveforms.
H If you drop data onto the XY sheet, the first two avail able
waveforms are copied to the X and Y components. If you drop
data onto a specific component box, the data is copied to that
specific box.
4- 6
WaveStar Software User Manual
Page 71

Datalog Measurements Data Sheet
A Datalog Measurement sheet periodically captures and evaluates
the value of a single scalar data item, such as a waveform measurement. After evaluation, this data sheet updates its table with these
elements:
H Current Value: The current time, value, and units of the variable.
H Maximum, Minimum: The maximum and minimum values, and
the time at which each occurred.
H Average, Max-Min, Standard Deviation: Statistical values
calculated on the entire data stream. Time stamping is not
applicable.
Data Sheet Overview
The Datalog Measurement sheet displays each new data value as the
current value and uses each new value to continually recompute
these measurements. It does not keep previous data values (compare
with the Datalog Tabular data sheet described on page 4--9).
WaveStar Software User Manual
4- 7
Page 72

Data Sheet Overview
I/O Operations
You use drag and drop mouse operations to copy and l ink scalar
values, such as a TDS oscilloscope automatic measurement, from the
Explorer View to the data logging measurement data sheet, dropping
the measurement anywhere in the data sheet table. Subsequent
copies or links to the same data sheet create separate charts (two
variables cannot be recorded in the same table).
You use drag and drop mouse operations to copy a data table from
data sheets to Microsoft Word or Excel. Two columns of scalar
values are transferred with measurement values appearing along
recording times.
You can get a screen image by dragging the entire sheet to Microsoft
Word. You can drag selected va riables to Excel or another datalog
measurement sheet. Refer to page 3 --15 and page 4--4.
Copying vs. Linking
You should link your data (right click and drag it), rather than
copying because copying creates a value that doesn’t update. This
data sheet monitors data, recording its variations.
Whenever the linked data changes, E xplorer View notifies the sheet,
although measurements are not computed immediately. The sheet
stores the data until its display interval has elapsed, at which time
the new value is used to recompute the measurements. If no new
data has been received during the interval, the same value is used.
Starting and Stopping
The recording can be started with one of three selections: Automatic,
Manual, and Time. The default is Automatic, with a recording time
of one second. Recording can be stopped with one of three
selections: Manual, Time, or Duration. The default is Manual. You
can set the recording methods from the Recording tab of the property
page. The minimum rate is 1 second.
Property Sheet
4- 8
The property sheet can set table layout and how the recording occurs
(start and stops). Refer to Setting Properties on page 4--5. Refer to
the online help for detailed information on the datalog measurement
property dialog and each control field in the dialog.
WaveStar Software User Manual
Page 73

Datalog Tabular Data Sheet
A Datalog Tabular Sheet periodically captures and ente rs the value
of a single scalar data item, such as a waveform measurement, in a
table.
Data Sheet Overview
The table displays each data point one row at a time as an entry
under the Value column. Time and Units columns record the time
stamp and the units for each data value at fixed time intervals. As
each new value is recorded, any values outside the alarm limits are
drawn in the over- or under-limit colors, and a color-coded text label
is inserted in the Out Of Limit column so that you can quickly
identify out-of-limit measurements.
Starting and Stopping
The recording can be started with one of three selections: Automatic,
Manual, and Time. The defaul t is Automat ic, with a data refresh rate
of every two seconds. Recording can be stopped with one of three
selections: Manual, Time, Duration. The default is Manual. You can
WaveStar Software User Manual
4- 9
Page 74

Data Sheet Overview
set the recording methods from the Recording tab of the property
page (refer to Setting Properties on page 4--5). The minimum rate
you can set is 1 second.
I/O Operations
You use drag and drop mouse operations to copy and l ink scalar
values, such as a TDS oscilloscope automatic measurement, from the
Explorer View to the datalogging-tabul ar data sheet, dropping the
measurement anywhere in the data sheet table. Subsequent copies or
links to the same data sheet create separate charts (two variables
cannot be recorded in the same table).
You use drag and drop mouse operations to copy a data table from
data sheets to Microsoft Word or Excel. Two columns of scalar
values are transferred with measurement values appearing along
recording times.
You can transfer the tabular data as a screen image by dragging the
entire sheet to Microsoft Word. You can also drag selected variables
to Excel or another Datalog Tabular sheet. Refer to page 3--15 and
Copy and Linking on page 4--4.
Copying vs. Linking
You should link your data (right click and drag it), rather than
copying because copying creates values that do not update. The
Datalog Tabular data sheet monitors data, recording its variations.
When you link a scalar value to a tabular sheet, the source sends an
update whenever data changes, possibly at irregular intervals. The
data sheet collects all the data, but only enters the new row
containing a data point at the data-logging rate specified in the
data-sheet property sheet. If no new data has been received during a
data-logging interval, the data sheet ret ains the last value logged.
Property Sheet
The property sheet can set table layout, how recording occurs (start,
stops), and alarm limits on the recorded data. You can set these
properties from the Datalog Tabular property pages (refer to Setting
Properties on page 4--5). Refer to the online help for detailed
information on the datalogging tabular sheet property dialog box.
4- 10
WaveStar Software User Manual
Page 75

Instrument Explorer Sheet
The Instrument Explorer data sheet lets you view and manipulate the
contents of instrument hard and floppy drives in an Explorer-like
window. You can also:
H Do file utility tasks (copy, delete and paste files; create and
delete directories).
H Drag and drop files from the instrument drive to a Windows
directory.
H Drag and drop instrument setups within the same instrument or to
another instrument. Some instrum ents do not have accessible
system settings, and so will not display thi s infomation in the
sheet.
Data Sheet Overview
H Drag and drop channel waveforms to reference waveform storage
within the same instrument or in another instrument.
H Do remote screen hardcopy operations and save the hardcopy file
to a selected location.
Tree view File view
WaveStar Software User Manual
4- 11
Page 76

Data Sheet Overview
The Instrument Explorer sheet consists of a tree view and a file view.
The tree view (left side) shows drive directories and subdirectories in
a hierarchical tree layout, as well as instrument system files such as
saved setups and waveforms. The files view (right side) shows the
contents of a selected tree view directory.
NOTE. When you open the Instrument Explorer sheet, each
instrument activel y c onnected to WaveStar is polled to obtain that
instrument’s drive and system information. Therefore, the more
instruments connected to WaveStar, the longer it takes to open the
Instrument Explorer sheet.
Accessing Drives and Directories
Instrument drives (hard disks or floppy drives) are represented by a
drive icon. To view the contents of a drive, select the + icon next to
that drive. The tree view displays any subdirectories that are within
the drive.
To view the files within a drive, select the drive folder icon. The file
view displays all files and directories located within the selected
folder.
Manipulating Files
To quickly copy a file to another location on the same instrument, to
a drive on another instrument, or to a Windows directory, just drag
and drop the file to the desired destination.
NOTE. You cannot drag and drop folders.
WaveStar changes the cursor icon from its default shape to a ’not’
icon (
current location.
) if a selected file or directory cannot be moved to the
4- 12
You cannot copy a reference waveform onto a waveform channel or
math source file.
WaveStar Software User Manual
Page 77

Data Sheet Overview
You can also right-click on a file or folder to display a pop-up menu
that contains commands to copy, delete, and paste files, as well as
directory commands that let you delete and create directories. The
pop-up menu is context-sensitive, only displaying or enabling the
commands that are available for the selected obje ct.
The pop-up menu also contains a properties item. Sel ecting
properties displays a message box that contains information such as
instrument name and the path to the selected object.
System Functions
Many instruments contain internal memory locations for instrument
setups, reference waveforms, and so on. WaveStar displays these
types of memory locations under the System icon in the tree view,
and handles them like files. System categories include Hardcopies,
Setups, and Waveforms.
Hardcopies. Hardcopies lets you save the selected instrument’s screen
to a specified file. The Hardcopies file view lists the image file
formats available to your instrument. This function is a remote
screen hard copy function. To save the instrument screen image to a
file, select the Hardcopies folder in the tree view, then drag and drop
the file format type icon in the file view to the target instrument
drive or Windows directory.
Setups. Setups lists the available instrument setup locations. You use
these setup ’files’ to save the current setup to a user setup, or load a
user setup into the current instrument. To copy a current setup to a
user setup, select the current setup in the file view and drag and drop
it onto the user setup icon in the same instrument. To copy a user
setup to a current setup, select the user setup icon and drag and drop
it onto the current setup icon of the same instrument.
Waveforms. Waveforms lists the instrument waveform storage
locations, as well as the waveform sources (channels, math
operations, and so on). To copy a channel or math waveform to
waveform storage, just drag and drop the waveform source onto a
reference (Ref1, Ref2 and so on) icon.
WaveStar Software User Manual
4- 13
Page 78

Data Sheet Overview
Notes Sheet
The Notes data sheet lets you enter and save textual notes and
graphical images that you want to record for the open workbook file.
Specifically, you can do the following:
H Type textual notes.
H Copy and paste notes and bitmapped images between the
clipboard and the notes sheet.
H Drag and drop instrument screens from the Explorer View to the
notes sheet.
H Drag and drop (or cut, copy, and paste, depending on applic ation)
between the notes sheet and other Windows applications.
H Save, recall, and edit instrument setup information in a Notes
sheet or other ASCII text editor.
H Right click in the data sheet area to pop-up a menu that lets you
save, close, or print your data sheet or access online help about
thedatasheet.
H Format the text font, color, and alignment using the toolbar
buttons. (If the toolbar buttons for the Note s Sheet are not
displayed, go to the View menu for the WaveStar application and
check Datasheet Toolbar.)
H Use toolbar buttons and WaveStar menu commands to Save, Cut,
Copy, Paste, and Print notes sheet contents.
4- 14
WaveStar Software User Manual
Page 79

Data Sheet Overview
Supported Applications
Use your mouse to drag and drop text or bitmapped images between
the notes sheet and Windows applications such as Microsoft Office
applications and the Windows Notepad.
When copying an XY or YT graticule to another application, you
have the choice of copying the graticule as it is displayed on screen
(which may be a partial graticule) or copying the entire graticule.
Copying a partial graticule is useful if, for example, you want t o
zoom in the display and copy a particular are a of a waveform. To
always copy the entire graticule whethe r or not it is fully displayed,
select the View menu and check the Transfer Full Graticule menu
item.
WaveStar Software User Manual
4- 15
Page 80

Data Sheet Overview
Saving and Recalling Instrument Settings
WaveStar lets you save, recall, and edit instrument settings in the
Notes data sheet. You can save settings for the entire instrument or
specify a category of settings such as trigger or horizontal. The
settings are stored as one long ASCII string of instrument-specific
programming commands.
To save the current instrument settings, select Data | Settings in the
Explorer view. Then use the mouse to drag and drop the setting
information to save from the Explorer view to the Notes sheet.
To recall settings to load into an instrument, open the Notes sheet
that contains the settings to load. Next, select the instrument setting
text with the mouse. Make sure you do not forget any te xt critical to
command syntax, such as colons or semicolons. Finally, drag and
drop the selected text onto the appropriate Data | Settings icon in the
Explorer view.
If you are familiar with the programming commands for your
instrument, you can edit the commands in the Notes sheet to change
your instrument settings. Use the standard windows commands and
methods to enter, copy, cut, and paste text in the Notes sheet.
4- 16
WaveStar Software User Manual
Page 81

Power Harmonics Data Sheet
The Power Harmonics data sheet displays power and harmonic
information based on signal voltage and current waveforms. You can
display the power and harmonic information in either table or
graphical bar chart format. The following figures show the same
power harmonics data in tabular and graphical format.
Data Sheet Overview
WaveStar Software User Manual
4- 17
Page 82

Data Sheet Overview
4- 18
Power Harmonics Conventions. The following conventions a pply to the
Power Harmonics data sheet:
H You need to provide both a voltage and current waveform.
H You can copy or link voltage and current information from an
instrument in the Explorer view or from another data sheet.
H For optimum harmonics calculations, use four signal cycles.
Fewer cycles will result in less accurate calculations, and more
cycles does not improve calculation a ccuracy. The status bar at
the bottom of the sheet displays an error message when fewer
than four cycles are used for calculations.
WaveStar Software User Manual
Page 83

Data Sheet Overview
Once both waveforms are copied or linked, the Power Harmonics
sheet calculates the power waveform by multiplying the voltage and
current waveforms. You can copy or link the calculated power
waveform to another data sheet. WaveStar recalculat es and updates
power and harmonic information whenever the data changes (when
linked) or a refresh action occurs.
Power Harmonics Sheet Fields
The following text describes the purpose of each Power Harmonics
sheet field.
View. Selects betwee n viewing data i n graphical mode or tabular
mode.
Nmbr Harmonics. Selects the number of harmonics t o use for
calculating harmonic information. The range of values is from
2to51.
Type (graph view mode). Selects which data type to display in the bar
graph area. Available type s are volta ge RMS, voltage % of
fundamental, voltage phase, current RMS, current % of fundamental,
and current phase.
WaveStar Software User Manual
4- 19
Page 84

Data Sheet Overview
Waveform fields. Location where you drag source voltage and current
waveforms, and location of calculated power waveform that you can
drop onto another data sheet or instrument. The highlighted portions
of waveforms in the fields are the cycle s used for calculating power
harmonics information.
Trigger Adjustments. Aligns the voltage and curre nt wave form t rigger
points. The Power Harmonics sheet calculates power by aligning the
voltage and current waveforms trigger points. Because you can use
different instruments to measure voltage and current values, you may
need to align waveform trigger points. You ca n let WaveStar use the
waveform trigger points as is (automatic mode), or adjust the trigger
point for either or both the voltage or current waveforms (manual
mode).
Cycle Width. Sets the mimimum cycle width over which the sheet
calculates power harmonic information. You can let WaveStar
automatically determine the mimimum cycle width, or set this field
to manual and adjust the minimum cycle width to meet your
requirements. Noisy signals may require you to manually select a
longer cycle width.
The Power Harmonics sheet shows which cycles are used for
calculations by highlighting the waveform cycle s in the Waveform
fields.
4- 20
WaveStar Software User Manual
Page 85
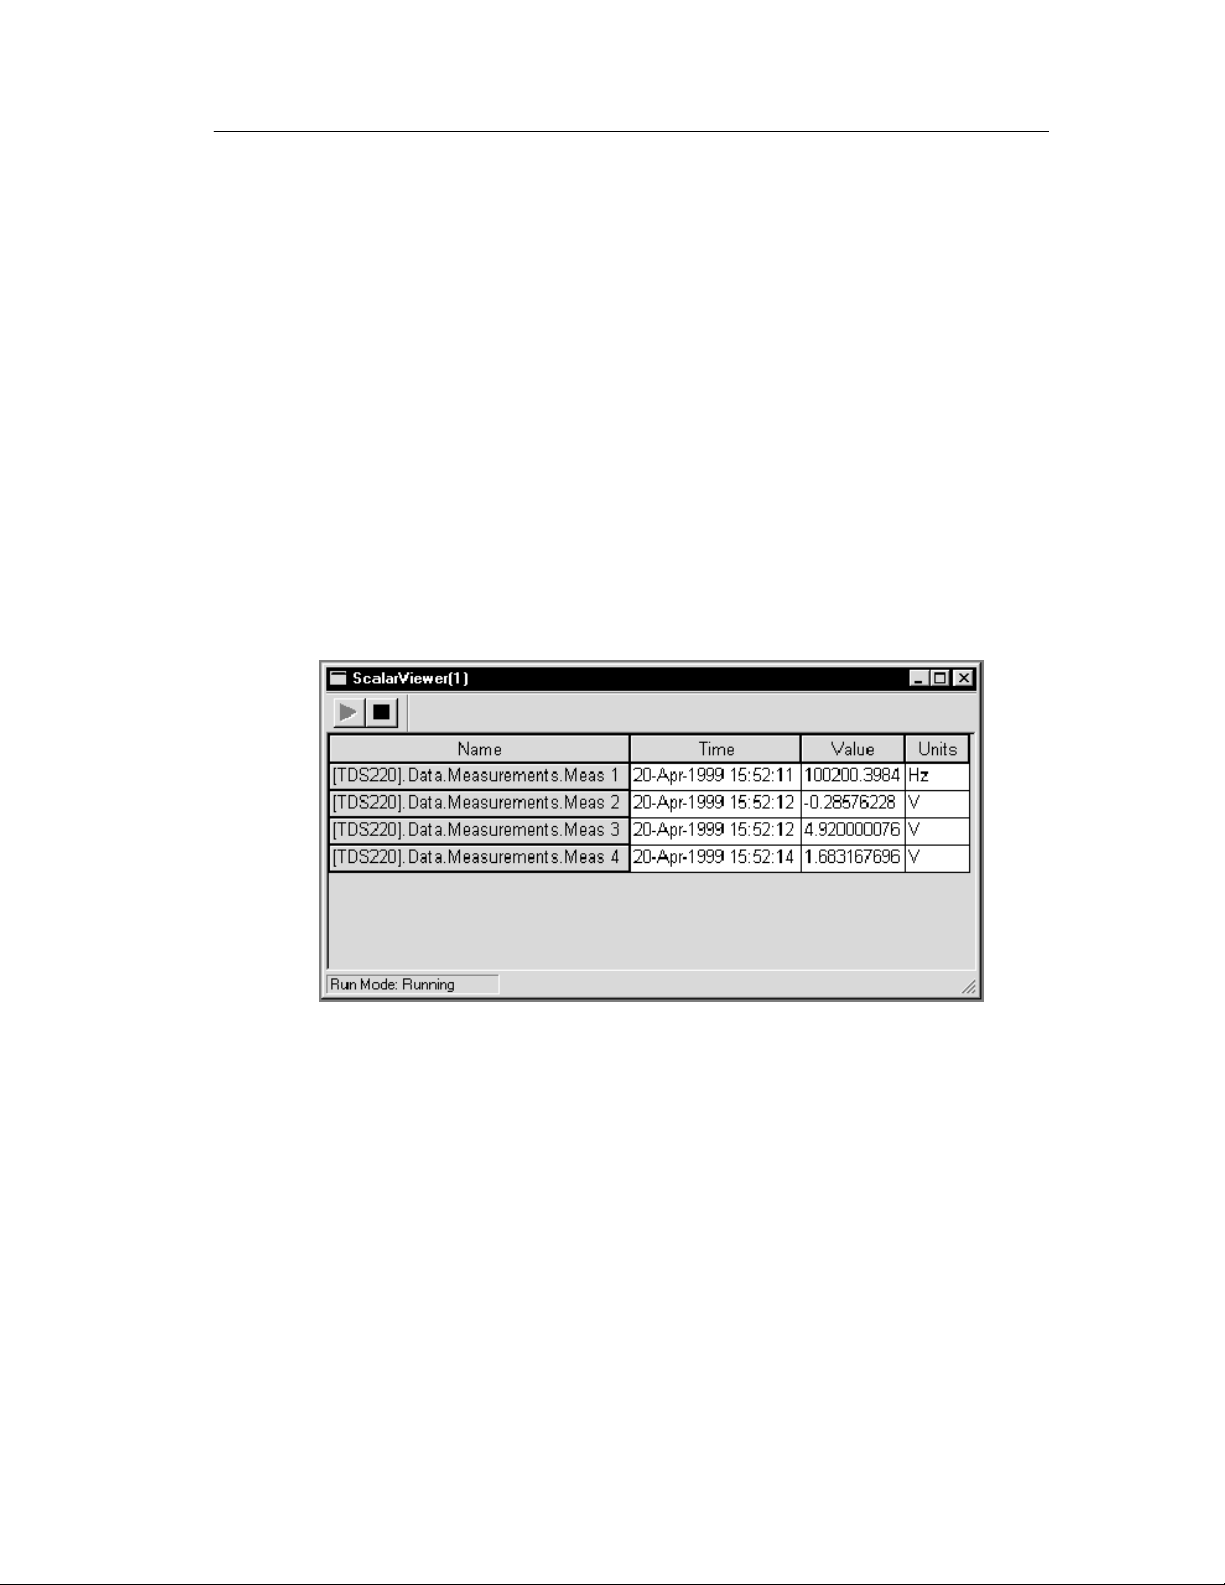
Scalar-Viewer Data Sheet
If you want to view one or more scalar values, copy or link them
from the Explorer view to this data sheet. Such values display with
time stamp, data value, and data units.
When you want to compile a custom view of measurements (or any
set of scalar data) or download your TX-DMM stored memory
(WSTRM), use the Scalar-Viewer. For example, if you want to
continuously monitor measurements taken by different instruments,
connect those instruments to WaveStar and drag those measurements
from the Explorer View to a common Scalar-Viewer sheet. Or drag
scalars from other data sheets to the Scalar-Viewer sheet.
Data Sheet Overview
I/O Operations
You use drag-and-drop mouse operations to copy and li nk scal ar
values, such as a TDS oscilloscope automatic measurement, from the
WaveStar Explorer View to the Scal ar-Viewer sheet, dropping the
waveform anywhere in the data sheet table. Subsequent copies to the
same Scalar-Viewer sheet create separate rows in its table.
Copy your data if you want to just get the current value ; l ink it (right
click and drag it), if you want the data to update.
You use the same operations to copy and link scalar values from
Scalar-Viewer data sheets to other data sheets that accept scalar
values. Refer to page 3--15 and Copy and Linking on page 4--4.
WaveStar Software User Manual
4- 21
Page 86

Data Sheet Overview
Supported Applications
You use drag-and-drop mouse operations to copy a Scalar-Viewer
table to data sheets or to Microsoft Word or Excel. Scalar values are
transferred with measurement values appearing alongside recording
times.
To copy a bitmapped image of the data sheet instead of numerical
values, uncheck both simple and rich text in Clipboard Formats
dialog box, accessed from the Edit menu, before copying.
Property Sheet
The property sheet can set various attributes of the table layout. You
can set these attributes from the Scalar-Viewer properties page (refer
to Setting Properties on page 4--5). Refer to the online help for a
detailed description of the Scalar-Viewer data sheet property page
and each entry field in the property sheet.
StripChart Data Sheet
A StripChart data sheet plots the value of from 1 to 16 single scalar
data items, such as a waveform measurement, on a scrolling
horizontal graticule. Although you can monitor up to 16 values in a
StripChart data sheet, for practical reasons you will probably not
want to measure more than two or three variables per data sheet.
The StripChart data sheet contains two windows; the current data
window, and the history data window. The current data window
shows the current data for the last n time periods, where n is defined
by the acquisition sample rate. New data ’pushes’ olddatatotheleft
edge of the graticule, and data at the left e dge of the current data
window is erased from the graticule. You can choose to have points
on the graph connected by lines or displayed as levels (dots).
4- 22
WaveStar Software User Manual
Page 87

Data Sheet Overview
History data
window
The history data window displays all data points acquired from the
start of the current acquisition. To view the history window, move
the cursor onto the vertical window separator bar at the left of the
current data window, press and hold the left mouse button, and drag
the separator bar to the right. You can then use the scroll bar controls
to view entries in the entire history data window. By default, the
history data window is minimized when you first open a StripChart
data sheet.
WaveStar Software User Manual
Current data
window
4- 23
Page 88

Data Sheet Overview
I/O Operations
You use drag and drop mouse operations to copy and l ink scalar
values, such as a TDS oscilloscope automatic measurement, from the
Explorer View to the StripChart data sheet, droppi ng the me asurement anywhere in the graticule area. Subsequent copies to the same
StripChart sheet create separate strip chart graticules within the
StripChart window (two measurements cannot be plotted on the
same StripChart graticule). You cannot drag waveforms from a YT
or XY sheet to a StripChart sheet.
You use drag and drop mouse operations to copy a Stri pChart
recording to data sheets or Microsoft Word or Excel. Two columns
of scalar values are transferred with measurement values appearing
along recording times. Refer to page 3 --15 and Copy and Linking on
page 4--4.
Copying vs. Linking
Strip charts monitor data, recording its variations. Because of this,
you should link your data rather than copying it, since copying
creates a value that does not update. To link data, right clic k on the
data and hold down the mouse button; drag the data to the Strip chart
sheet. Then select Link from the shortcut menu that pops up.
When you link a scalar value to a Strip chart sheet, the data source
sends updated data whenever data changes, possibly at irregul ar
intervals. The data sheet collects all the data, but only plots a data
point at the plot rate specified in the strip-chart property sheet. If no
new data has been received during a data-logging interval, the data
sheet plots the last val ue l ogged.
Starting and Stopping
The recording can be started with one of three selections: Automatic,
Manual, and Time. The default is Automatic, with a recording
sample time of one second. Recording can be stopped with one of
three selections: Manual, Time, or Duration. The default is Manual.
You can set the recording methods from the Recording tab of the
property page (refer to Setting Properties on page 4--5). The
minimum data sample rate you can set in the properties page is
1 second.
4- 24
WaveStar Software User Manual
Page 89

Data Sheet Overview
NOTE. If you restart recording on a stopped sheet, all data in that
data sheet is lost. To save data, open a new data sheet and link to the
same sources as the stopped sheet.
Property Sheet
The property sheet can set a variety of display characteristics, turn
on various types of measurement cursors, and more. You can set
these properties from the Strip Chart properties pages (refer to
Setting Properties on page 4--5). Refer to the online hel p for
detailed information on the StripChart property dialog and each
control field in the dialog.
Cursors
Cursors are used to measure the waveform plot. You can put cursors
on the strip-chart sheet using the Cursor Property Page. Cursor
readout values indicate the vertical or horizontal value at the cursor
location. Vertical cursor position values appear as dX and X.
Horizontal cursor position values appear as dY and Y.
Vertical and horizontal are the only permitted cursor types on the
Stripchart sheet.
Waveform Measurement Data Sheet
The waveform measurement data sheet displays a table of standard
waveform measurements. When you drag a waveform to this sheet,
the application automatically calculates and displays the measurement values as shown below in the following figure.
Each waveform is presented as a column of measurements. Each
time a new waveform is dropped onto this sheet, a new column of
measurements is created immediately to the right of any existing
columns.
I/O Operations
You use drag and drop mouse operations to copy and link waveforms
(not scalar data) from the Explorer View to the waveform measurement data sheet.
WaveStar Software User Manual
4- 25
Page 90

Data Sheet Overview
You use the same operations to copy and link waveforms from this
data sheet to other data sheets. You can also copy or link a single
measurement from this data sheet to any other sheet that accepts
scalar values. Refer to page 3--15 and Copy and Linking on
page 4--4.
4- 26
WaveStar Software User Manual
Page 91

Data Sheet Overview
Supported Applications
You use drag and drop mouse operations to copy measurements from
this sheet to Microsoft Word or Excel. Specifically, you can do the
following:
H Click a single measurement and drag it to Microsoft Word or
Excel.
H Shift click to select more than one measurement for dragging as a
group.
H Click in the title bar to select all of the measurements; shift click
to select additional columns as desired. After selecting the last
column, hold shift to drag all the columns to Word or Excel.
Property Sheet
Use this property sheet to control table layout c haracteristics and the
measurement method (refer to Setting Properties on page 4--5).
Refer to the online help for detailed information on the waveform
measurement property dialog and each control field in the dialog.
Gates
You can use gates in YT and waveform tabular data sheets to define
a segment of a waveform for copying or linking to the waveform
measurement sheet. Such operations let you dete rmine the part of the
waveform measured by using the gates to isolate a portion of the
waveform.
Waveform Tabular Data Sheet
A Waveform Tabular Sheet creates a table of values for each
waveform that you copy or link to it. It periodically updat es the
values if you link them from the data source.
The Waveform Tabular Sheet shows the waveform as sequential
values in a table column with each value accompanied by a time
value. The time value is the time of the waveform sample relative to
the waveform record trigger.
WaveStar Software User Manual
4- 27
Page 92
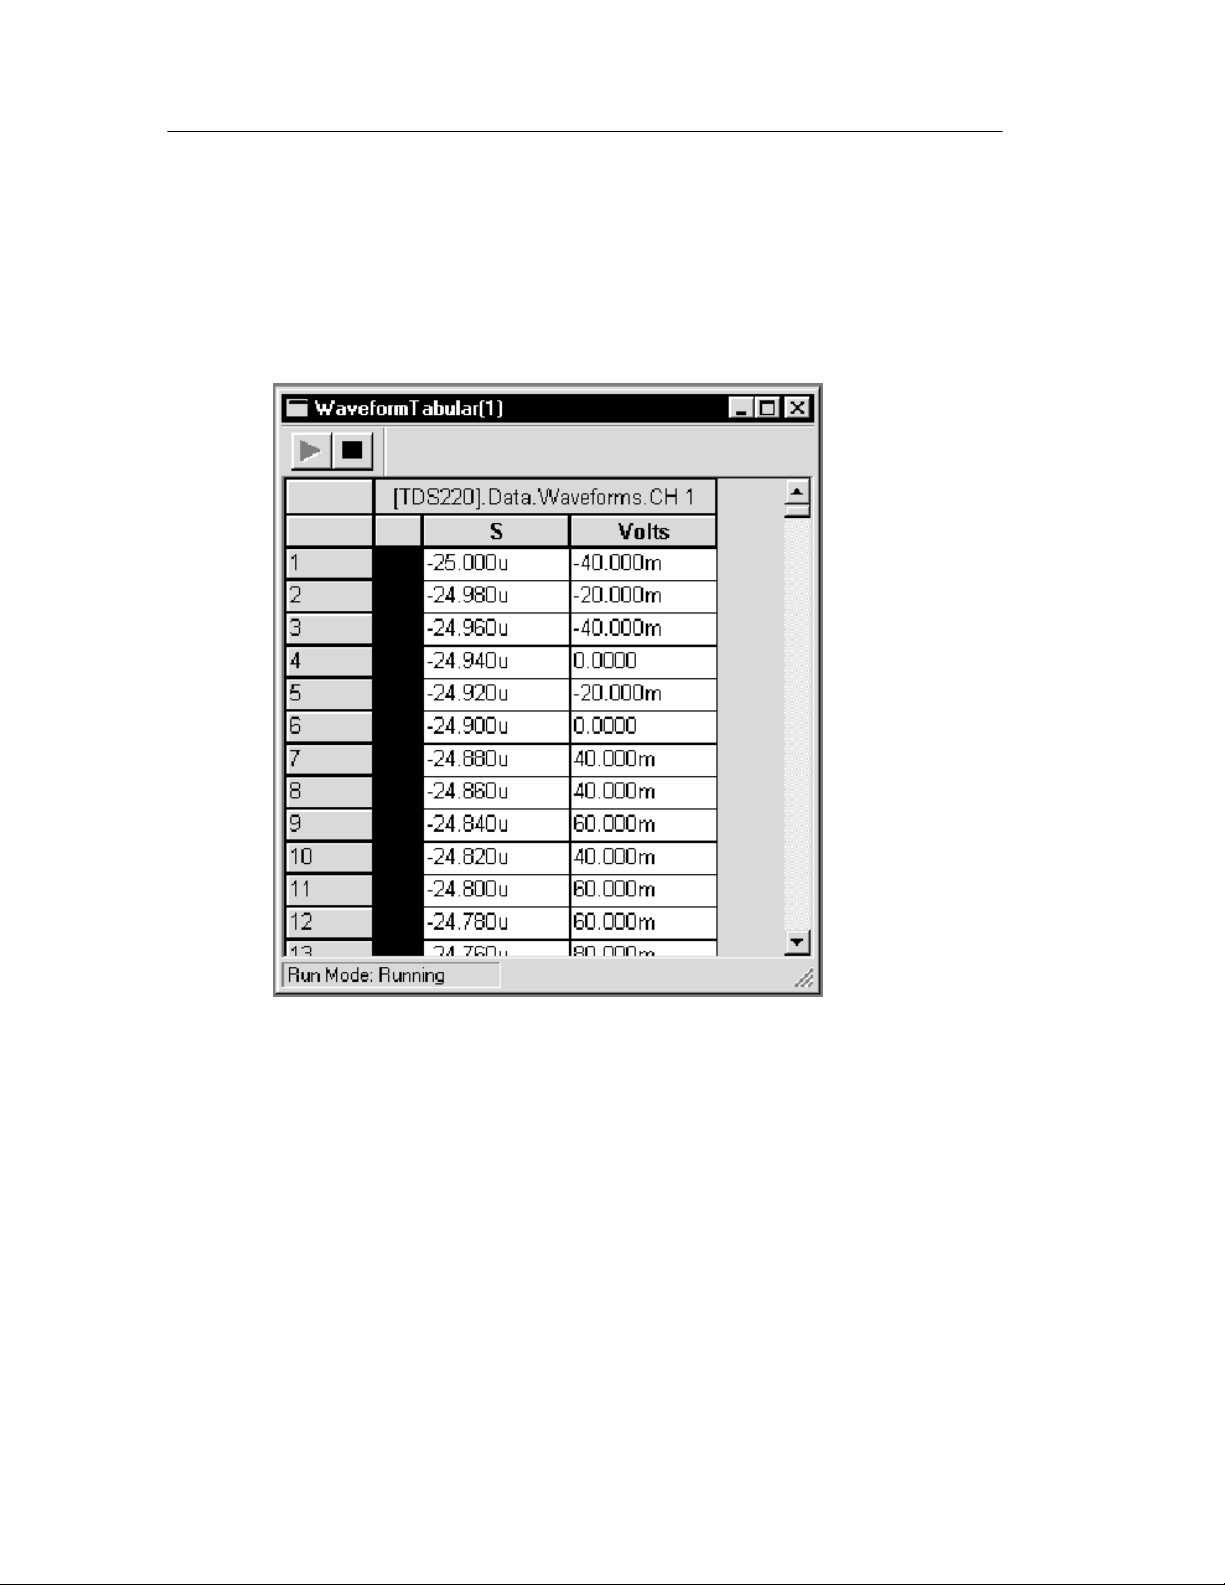
Data Sheet Overview
You can modify the waveform by editing the table cells, but you can
not change the length of the waveform by adding or deleting cells,
nor can you change the units.
4- 28
I/O Operations
You use drag and drop mouse operations to copy and l ink waveforms, such as channel waveforms from a TDS oscilloscope, from
the Explorer View to the waveform-tabular data sheet, dropping the
waveform anywhere in the data sheet table. Subsequent copies or
links to the same data sheet create separate table charts (two
waveforms cannot be recorded in the same table). You must drag a
complete waveform (a column) to an XY or YT data sheet (or
another Waveform Tabular data sheet).
WaveStar Software User Manual
Page 93

Data Sheet Overview
Use drag and drop mouse operations to copy a table from a data
sheet to a Microsoft Office application. Two columns of scalar
values are transferred with measurement values appearing along
recording times.
You can transfer the tabular data as a screen image by dragging the
entire sheet to Microsoft Word. You can also drag selected variables
to Excel or another Datalog Tabular sheet. Refer to page 3--15 and
Copy and Linking on page 4--4.
Property Sheet
Use this property sheet to control table layout c haracteristics (refer to
Setting Properties on page 4--5). Refer to the online hel p for
detailed information on the waveform tabular property dialog and
each control field in the dialog.
Gates
Gates define the range over which measurements a re computed when
waveform data is moved from this sheet to a Waveform Measurement sheet. Set gate location by moving the gate icon to the desired
location. Gate location is represented by highlighting the corresponding row of data.
WaveStar Software User Manual
4- 29
Page 94

Data Sheet Overview
XY Data Sheet
The XY sheet displays waveforms in pairs as XY plots, with one
waveform plotted on the X (horizontal) axis against the other on the
Y (vertical) axis. The XY plot uses the same scale and position as
the oscilloscope channels from which the XY components are
obtained.
The XY sheet presents the XY plot as a pair of X and Y component
boxes, which appear along the bottom of the graticule.
4- 30
I/O Operations
Using the mouse to copy and link waveforms from the Explorer
View to the XY data sheet, you can do the following I/O operations:
H Drag individual channel waveforms from the Explorer View and
other data sheets to the individual X or Y component boxes
(located just below the bottom graticule) that comprise each XY
waveform.
WaveStar Software User Manual
Page 95

Data Sheet Overview
H Drag two instrument waveforms simultaneously to an XY sheet
by dragging the instrument i con from the Explorer View and
dropping the icon anywhere on the XY graticule. The first
waveform in the hierarchy is plotted as X, the second as Y.
H Drag from each X and Y component individually, to the Explorer
View or another data sheet. To restore the waveform as a saved
waveform for an instrument, display the instrument reference
memories, and drag the waveform to the memory that is to store
the waveform. You cannot undo this operation.
H Drag and drop X and Y components individually or as an XY
waveform into Microsoft Office applications.
When copying an XY graticule to another application, you have the
choice of copying the graticule as it is displayed on screen (which
may be a partial graticule display) or copying the enti re gra ticule.
Copying a partial graticule is useful if, for example, you want t o
zoom in the display and copy a particular are a of a waveform. To
always copy the entire graticule, select the View menu and check the
Transfer Full Graticule menu item.
You can drop data onto either the XY sheet or to a specific
waveform component box. Data dropped onto the XY sheet uses the
first two waveforms as the X and Y components. Data dropped onto
a specific waveform box overwrites existing data. The XY plot is
drawn when both the X and Y component boxe s are filled in.
Property Sheet
The property sheet can set various display and measurement
characteristics. You can set these properties from the XY Properties
page (refer to Setting Properties on page 4--5). Refer to the online
help for detailed information on the XY sheet property dialog and
each control field in the dialog.
Cursors
Cursors are used to measure the waveform plot. You display cursors
using the Cursor tab on the Property Page. Cursor readout values
indicate the vertical or horizontal value at the cursor location.
Vertical cursor position values appear as dX and X. Horizontal cursor
position values appear as dY and Y.
WaveStar Software User Manual
4- 31
Page 96

Data Sheet Overview
YT Data Sheet
The YT data sheet lets you capture and graphically view multiple
waveforms on a graticule with the same scale and position as on the
oscilloscope. You also use the YT sheet to copy and edit waveform
test masks. The YT sheet can display waveform and mask data
simultaneously, enabling you to create a mask to fit a particular
waveform.
Waveform Operations
The YT sheet displays one or more waveforms as a graphical view.
This sheet displays ampl itude on the Y-axis and the sampling index
(for example, time) on the X-axis. The YT sheet displays waveforms
and a graticule at the same scale and position as they appear on the
oscilloscope screen. The number of waveforms that can be displayed
is limited only by available memory. Some of the features of this
sheet include cursor measurements, gates, zoom function, and
annotation.
4- 32
WaveStar Software User Manual
Page 97

Data Sheet Overview
Copying Waveforms To and From an Instrument.
You use drag and drop mouse operations to copy and link waveforms
from the Explorer View to the YT data sheet, droppi ng the waveform
anywhere in the graticule area. You al so use drag and drop mouse
operations to copy data from data sheets to other Microsoft Windows
applications. When copying a YT graticule to another application,
you have the choice of copying the graticule as it is displayed on
screen (which may be a partial graticule) or copying the entire
graticule.
Copying a partial graticule is useful if, for example, you want t o
zoom in the display and copy a particular are a of a waveform. To
always copy the entire graticule whethe r or not it is fully displayed,
select the View menu and check the Transfer Full Graticule menu
item.
To restore the waveform to a specific channel, expand the instrument
data channels in Explorer View, and drag the waveform to the
desired channel. You cannot undo this operation. Refer to page 3--15
and Copy and Linking on page 4--4 for more information.
Changing the Waveform Scale. The Scale pulldown lists (located to the
left of the Waveform button) in the sheet toolbar let you change the
voltage or time scale of the selected waveform. To change a
waveform’s scale, select a waveform, then select the arrow button
adjacent to the scale value to change. Select a new scale value from
the pulldown list. The YT sheet redraws the selected waveform using
thenewscalevalue.
Selecting the Waveform Color. The Waveform button in the sheet
toolbar lets you change the color of the selected wave form. To
change a waveform color, select a waveform, then select the
Waveform button. Select a new waveform color, then select OK.
Property Sheet. The property sheet can set various display and
measurement characteristics. You can set these properties from the
YT Properties page (refer to Setting Properties on page 4--5). Refer
to the online help for detailed information on the YT sheet property
dialog and each control field in the dialog.
WaveStar Software User Manual
4- 33
Page 98

Data Sheet Overview
Cursors. Cursors are used to measure the waveform plot. You can put
cursors on the selected sheet using the Cursor tab on t he Propert y
Page. Cursor readout values indicate the vertical or horiz ontal value
at the cursor location. Vertical cursor position values appear as dX
and X. Horizontal cursor position values appear as dY and Y.
Gates. Gates define the range over which measurements are
computed when waveform data is moved from thi s sheet to a
waveform measurement sheet. Turn on gates by choosing vertical
cursors in the Cursor Property dialo g and checking the Gate with
Vertical Bar Cursors checkbox; then, set gate location by using the
mouse to move the cursors.
Print Banner
To print the full record le ngth of all waveforms in the YT data sheet,
select the data sheet and choose Print Banner... in the WaveStar File
menu. The Print Banner option is useful when your YT data sheet
contains waveforms that are longer than the width of the graticule.
Mask Editing
The YT sheet mask editing features allow you to create new test
masks for an instrument family by modifying existing masks or
defining mask parameters from scratch. The copied mask retains the
instrument settings that were part of the original mask.
To edit an existing mask, or create a new mask based on an existing
mask, simply drag and drop a mask from the Explorer view onto the
YT sheet. WaveStar draws the mask on the graticule and shows
existing line vertexes (points) as sma ll squares, as shown in the
following figure.
NOTE. If a mask is visible on your YT shee t, and you copy or li nk t he
YT sheet to another data sheet, the mask data is copied along with
the waveform data. To prevent this, clear the Show Mask ch eckbox in
the toolbar before copying or linking the YT sheet data to other
sheets.
4- 34
WaveStar Software User Manual
Page 99

Data Sheet Overview
Mask Editing Conventions. The following conventions apply to the YT
mask editing functions:
H Copying a new mask onto a YT sheet with an existing mask
deletes the existing mask and replaces it with the new mask.
H This documentation refers to each polygon in a mask as a
segment, and a collection of segments as a mask. However, some
instrument documentation calls each segment a mask, as well as
the collection of segments.
H Each CSA-Series mask can contain a maximum of ten segments:
Each TDS-Series mask can contain a maximum of eight
segments.
H Each mask segment can have a maximum of 50 points.
H The YT sheet connects mask points in the same order that the
mask source instrument connects those points. As di fferent
instruments use different algorithms to store and connect mask
segment points, copying a mask from one instrument series to
another may change the mask point order, and therefore change
the mask segment shape.
H To select a mask point or segment, position the cursor on the
point or in the segment and double--click the left mouse button.
WaveStar Software User Manual
4- 35
Page 100
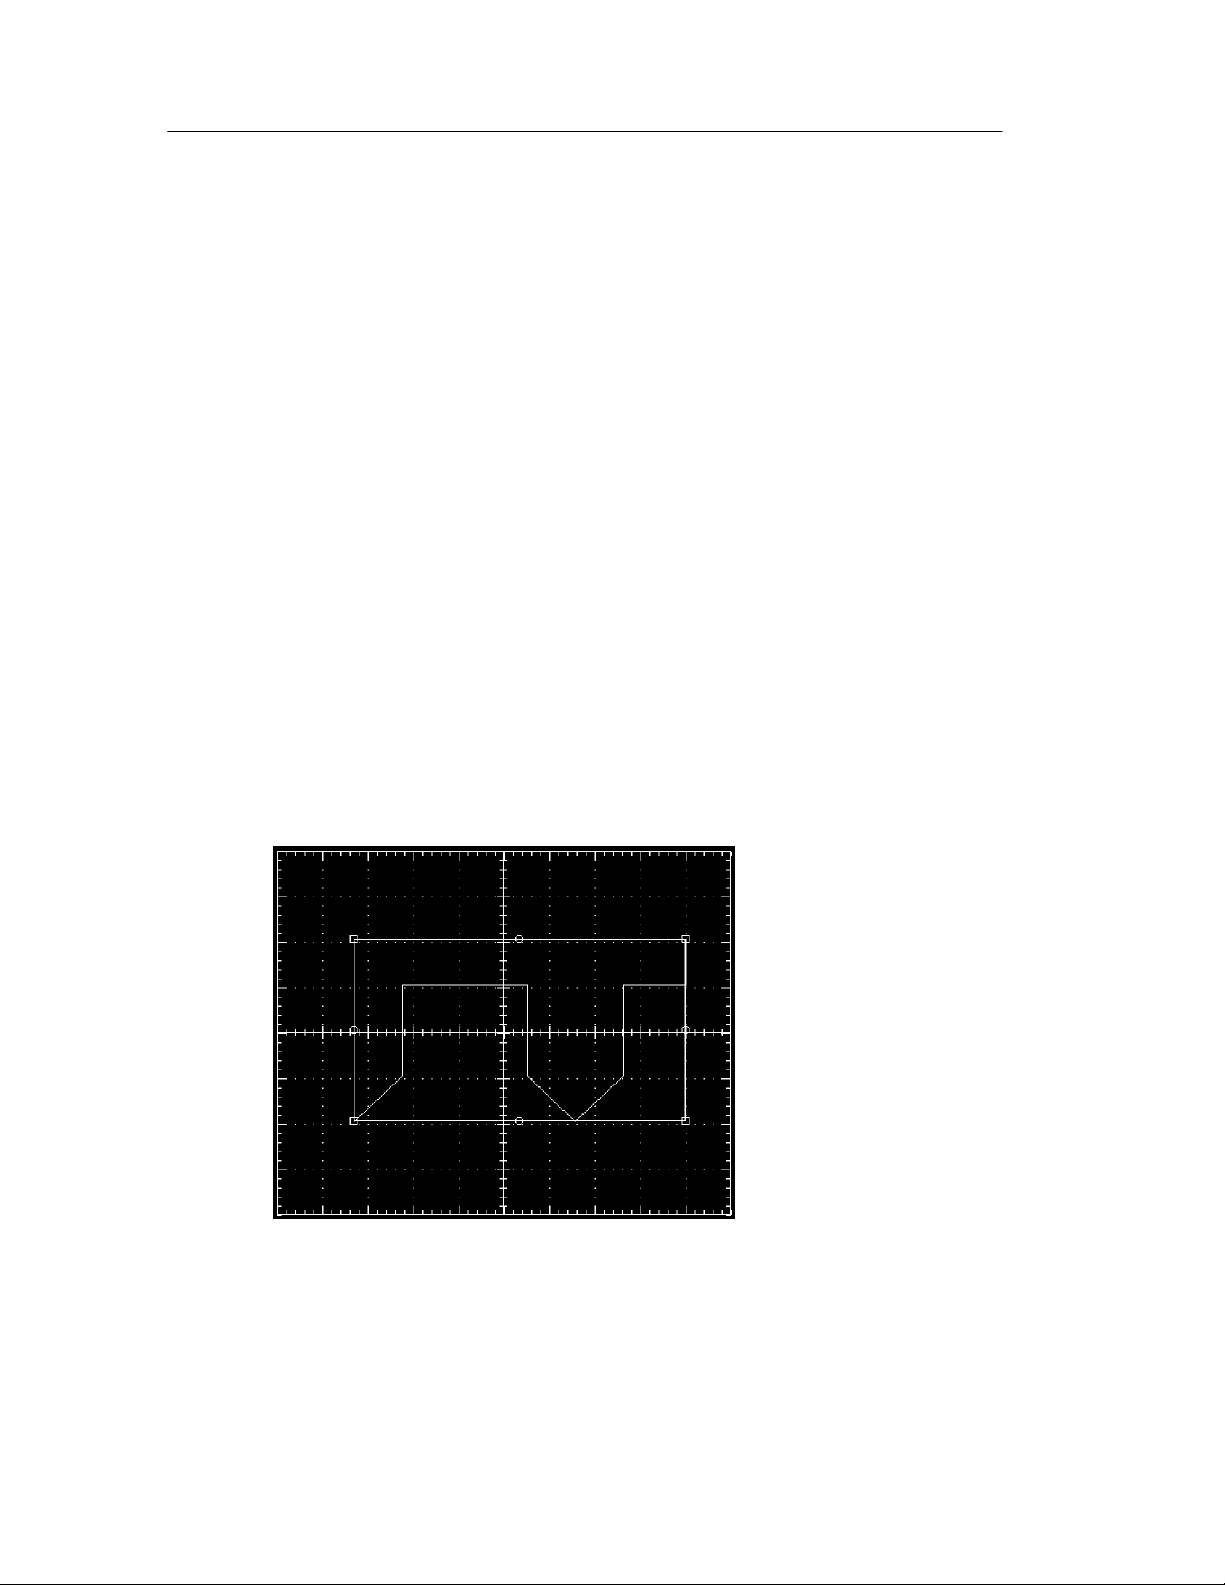
Data Sheet Overview
Selecting Mask Color. The Mask button in t he shee t toolbar lets you
change the color of the mask outline. To change the mask outline
color, select the Mask button, select a new mask color, then select
OK. The new mask color is stored and automatically used for all new
YT sheets you open.
The mask color only affects the YT sheet mask color; the instrument
will use its default mask color when you copy the YT mask to an
instrument.
Show Mask. You use the Show Mask check box to toggle viewing of
the maskontheYTsheet.
Show Bounding Box. You use the bounding box mode to quickly resize
a mask segment. Bounding box mode displays a box around each
segment that includes resizing points on the corners and sides of the
bounding box. When you select and drag a resizing point, the
bounding box redraws the mask segment proportionally to fill the
resized bounding box. You ca nnot move a ny individual segment
points while you are in bounding box mode.
4- 36
WaveStar Software User Manual
 Loading...