

Page 1

xx
TBS1000 Series
ZZZ
Digital Storage Oscilloscopes
User Manual
*P077076000*
077-0760-00
Page 2

Page 3

xx
TBS1000 Series
ZZZ
Digital Storage Oscilloscopes
User Manual
Revision A
www.tektronix.com
077-0760-00
Page 4

Copyright © Tektronix. All rights reserved. Licensed software products are owned by Tektronix or its subsidiaries
or suppliers, and are protected by national copyright laws and international treaty provisions.
Tektronix products are c overed by U.S. and foreign patents, issued and pending. Information in this publication
supersedes that in all previously published material. Specifications and price change privileges reserved.
TEKTRONIX and TEK are registered trademarks of Tektronix, Inc.
OpenChoice™ is a registered trademark of Tektronix, Inc.
PictBridge is a registered trademark of the Standard of Camera & Imaging Products Association CIPA
DC-001-2003 Digital Photo Solutions for Imaging Devices.
Contacting Tektronix
Tektronix, Inc.
14150 SW Karl Braun Drive
P.O . Bo x 500
Beaverton, OR 97077
USA
For product information, sales, service, and technical support:
In North America, call 1-800-833-9200.
Worl d wide , vi s it www.tektronix.com to find contacts in your area.
Page 5

TBS1000 Oscilloscopes
Warranty
Tektronix war
years from the date of original purchase from an authorized Tektronix distributor. If the product proves defective
during this warranty period, Tektronix, at its option, either will repair the defective product without charge for
parts and labor, or will provide a replacement in exchange for the defective product. Batteries are excluded from
this warranty. Parts, modules and replacement products used by Tektronix for warranty work may be new or
reconditioned to like new performance. All replaced parts, modules and products become the property of Tektronix.
In order to obtain service under this warranty, Customer must notify Tektronix of the defect before the expiration
of the warranty period and make suitable arrangements for the performance of service. Customer shall be
responsib
shipping charges prepaid, and with a copy of customer proof of purchase. Tektronix shall pay for the return of the
product to Customer if the shipment is to a location within the country in which the Tektronix service center is
located. Customer shall be responsible for paying all shipping charges, duties, taxes, and any other charges for
products returned to any other locations.
This warranty shall not apply to any defect, failure or damage caused by improper use or improper or inadequate
maintenance and care. Tektronix shall not be obligated to furnish service under this warranty a) to repair damage
resulting from attempts by personnel other than Tektronix representatives to install, repair or service the product;
epair damage resulting from improper use or connection to incompatible equipment; c) to repair any damage
b) to r
or malfunction caused by the use of non-Tektronix supplies; or d) to service a product that has been modified or
integrated with other products when the effect of such modification or integration increases the time or difficulty
of servicing the product.
THIS WARRANTY IS GIVEN BY TEKTRONIX WITH RESPECT TO THE PRODUCT IN LIEU OF ANY
OTHER WARRANTIES, EXPRESS OR IMPLIED. TEKTRONIX AND ITS VENDORS DISCLAIM ANY
IMPLIED WARRANTIES OF MERCHANTABILITY OR FITNESS FOR A PARTICULAR PURPOSE.
TEKTRONIX' RESPONSIBILITY TO REPAIR OR REPLACE DEFECTIVE PRODUCTS IS THE SOLE
D EXCLUSIVE REMEDY PROVIDED TO THE CUSTOMER FOR BREACH OF THIS WARRANTY.
AN
TEKTRONIX AND ITS VENDORS WILL NOT BE LIABLE FOR ANY INDIRECT, SPECIAL, INCIDENTAL,
OR CONSEQUENTIAL DAMAGES IRRESPECTIVE OF WHETHER TEKTRONIX OR THE VENDOR HAS
ADVANCE NOTICE OF THE POSSIBILITY OF SUCH DAMAGES.
rants that the product will be free from defects in materials and workmanship for a period of five (5)
le for packaging and shipping the defective product to the service center designated by Tektronix,
[W19 – 03AUG12]
Page 6

TPP0101 and TPP0201 Probes
Warranty
Tektronix war
year from the date of shipment. If any such product proves defective during this warranty period, Tektronix, at its
option, either will repair the defective product without charge for parts and labor, or will provide a replacement
in exchange for the defective product. Parts, modules and replacement products used by Tektronix for warranty
work may be new or reconditioned to like new performance. All replaced parts, modules and products become
the property of Tektronix.
In order to obtain service under this warranty, Customer must notify Tektronix of the defect before the expiration of
the warranty period and make suitable arrangements for the performance of service. Customer shall be responsible
for packag
charges p repaid. Tektronix shall pay for the return of the product to Customer if the shipment is to a location within
the country in which the Tektronix service center is located. Customer shall be responsible for paying all shipping
charges, duties, taxe s, and any other charges for products returned to any other locations.
This warranty shall not apply to any defect, failure or damage caused by improper use or improper or inadequate
maintenance and care. Tektronix shall not be obligated to furnish service under this warranty a) to repair damage
resulting from attempts by personnel other than Tektronix representatives to install, repair or service the product;
b) to repair damage resulting from improper use or connection to incompatible equipment; c) to repair any damage
function caused by the use of non-Tektronix supplies; or d) to service a product that has been modified or
or mal
integrated with other products when the effect of such modification or integration increases the time or difficulty
of servicing the product.
THIS WARRANTY IS GIVEN BY TEKTRONIX WITH RESPECT TO THE PRODUCT IN LIEU OF ANY
OTHER WARRANTIES, EXPRESS OR IMPLIED. TEKTRONIX AND ITS VENDORS DISCLAIM ANY
IMPLIED WARRANTIES OF MERCHANTABILITY OR FITNESS FOR A PARTICULAR PURPOSE.
TEKTRONIX' RESPONSIBILITY TO REPAIR OR REPLACE DEFECTIVE PRODUCTS IS THE SOLE
AND EXCLUSIVE REMEDY PROVIDED TO THE CUSTOMER FOR BREACH OF THIS WARRANTY.
KTRONIX AND ITS VENDORS WILL NOT BE LIABLE FOR ANY INDIRECT, SPECIAL, INCIDENTAL,
TE
OR CONSEQUENTIAL DAMAGES IRRESPECTIVE OF WHETHER TEKTRONIX OR THE VENDOR HAS
ADVANCE NOTICE OF THE POSSIBILITY OF SUCH DAMAGES.
rants that this product will be free from defects in materials and workmanship for a period of one (1)
ing and shipping the defective product to the service center designated by Tektronix, with shipping
[W2 – 15AUG04]
Page 7

Table of Contents
General Safety Summary ......................................................................................... iv
Compliance Information ......................................................................................... vii
EMC Compliance......................................... ................................ ................... vii
Safety Compliance............................................................................................ ix
Environmental Considerations ................ ................................ .............................. xi
Preface............................................................................................................. xiii
Help System.................................................................................................. xiii
Firmware Updates Through the Internet ....... .................................. ......................... xiv
Conventions ................................................................................................... xv
Getting Started . .. .. . ... ... ... . ... ... ... .. .. . ... ... ... .. .. . ... ... ... . ... ... ... .. .. . ... ... ... .. .. . ... ... ... . ... ... ... . 1
General Features .............................. ................................ ................................. 1
Installation............. .................................. ................................ ....................... 2
Functional Check .............................................................................................. 4
Probe Safety. ................................ .................................. ................................ . 5
Voltage Probe Check Wizard ................................................................................. 5
Manual Probe Compensation................................................................................. 7
Probe Attenuation Setting. ... ... ... ... . .. . ... ... ... ... . . .. . ... ... ... ... .. .. . ... ... ... ... . .. . ... ... ... ... . .. . .. 7
Current Probe Scaling ......................................................................................... 8
Self Calibration ......................... ................................ ................................ ....... 8
Operating Basics.................................................................................................... 9
Display Area ................................................................................................... 9
Using the Menu System........................................ ................................ .............. 12
Vertical Controls ........................ ................................ ................................ ...... 13
Horizontal Controls........................................................................................... 14
Trigger Controls............................................................................................... 15
Menu and Control Buttons................................................................................... 15
Input Connectors.............................................................................................. 18
Other Front-Panel Items...................................................................................... 18
Understanding Oscilloscope Functions . .. .. . ... ... ... .. .. . ... ... ... ... . .. . ... ... ... .. .. . ... ... ... ... . .. . ... ... . 19
Setting Up the Oscilloscope . ... . .. . ... ... ... .. .. . ... ... ... .. .. . ... ... ... . ... ... ... . . .. . ... ... ... .. .. . ... ... . 19
Triggering................ ................................ .................................. .................... 20
Acquiring Signals....................... .................................. ................................ .... 22
Scaling and Positioning Waveforms . ... ... ... .. .. . ... ... ... . ... ... ... .. .. . ... ... ... . ... ... ... .. .. . ... ... ... 23
Taking Measurements ........................................................................................ 25
Application Examples............................. .................................. .............................. 29
Taking Simple Measurements ............................................................................... 30
Using Autorange to Examine a Series of Test Points. ................................ .................... 35
Taking Cursor Measurements ............................................................................... 36
Analyzing Signal Detail...................................................................................... 40
TBS1000 Series Oscilloscopes User Manual i
Page 8

Table of Contents
Capturing a Sin
Measuring Propagation Delay............................... ................................ ................ 43
Triggering on a Specific Pulse Width................. ................................ ...................... 44
Triggering on a Video Signal...... .................................. ................................ ........ 45
Analyzing a Differential Communication Signal.......................................................... 49
Viewing Impedance Changes in a Network................................................................ 50
Data Logging.................. ................................ .................................. .............. 52
Limit Testing .................................................................................................. 53
Math FFT......................... ................................ ................................ .................. 55
Setting Up the Time-Domain Waveform. ... ... .. .. . ... ... ... .. .. . ... ... ... . . .. . ... ... ... . . .. . ... ... ... . . .. 55
Displaying the FFT Spectrum ............................................................................... 57
Selecting an FFT Window ................................................................................... 58
Magnifying and Positioning an FFT Spectrum . ... ... ... .. .. . ... ... ... .. .. . ... ... ... . . .. . ... ... ... .. .. . ... 61
Measuring an FFT Spectrum Using Cursors............................................................... 62
USB Flash Drive and Device Ports .............................................................................. 63
USB Flash Drive Port ........................................................................................ 63
File Management Conventions............................ .................................. ................ 64
Saving and Recalling Files With a USB Flash Drive . . ... ... ... .. .. . ... ... ... . . .. . ... ... ... .. .. . ... ... ... 65
Using the Save Function of the Print Front Panel Button ................................................ 67
USB Device Port.............................................................................................. 69
Installing the PC Communications Software on a PC .. ... . .. . ... ... ... .. .. . ... ... ... .. .. . ... ... ... . ... .. 70
Connecting to a PC ........................................................................................... 70
Connecting to a GPIB System............................................................................... 72
Command Entry............................................................................................... 72
Connecting to a Printer............. ................................ ................................ .......... 73
Printing a Screen Image...................................................................................... 73
Reference ........................... ................................ .................................. .............. 75
Acquire. .................................. ................................ ................................ ...... 75
Autorange...................................................................................................... 77
Autoset......... ................................ ................................ ................................ 79
Cursor...... ................................ ................................ .................................. .. 82
Default Setup.......................... .................................. ................................ ...... 83
Display......... ................................ ................................ ................................ 83
Help .......... ................................ ................................ .................................. 85
Horizontal................ ................................ .................................. .................... 85
Math.............. ................................ ................................ .............................. 87
Measure........................................................................................................ 88
Print ............................................................................................................ 89
Probe Check ................................................................................................... 90
Reference Menu........................................... ................................ .................... 90
Save/Recall.................................................................................................... 90
gle-Shot Signal ............................................................................. 41
ii TBS1000 Series Oscilloscopes User Manual
Page 9

Table of Contents
Trigger Contro
Utility .. . ... ... ... ... . .. . ... ... ... ... . .. . ... ... ... ... ... . ... ... ... ... ... . ... ... ... ... ... .. .. . ... ... ... . . .. . ... 100
Vertical Controls ........................ ................................ ................................ .... 103
Appendix A: Specifications .......................... ................................ .......................... 107
Oscilloscope Specifications............................ ................................ .................... 107
Appendix B: TPP0101 and TPP0201 Series 10X Passive Probes Information................... ........ 115
Connecting
Compensating the Probe .................................................................................. 115
Connecting the Probe to the Circuit ...................................................................... 116
Standard Accessories....................................................................................... 117
Optional Accessories ....................................................................................... 118
Specifications.. ................................ .................................. ............................ 118
Perform
Safety Summary ............................................................................................ 120
Appendix C: Accessories ... ................................ .................................. .................. 123
Appendix D: Cleaning ................ ................................ .................................. ........ 125
General Care ................................................................................................ 125
Cleaning ..................................................................................................... 125
ndix E: Default Setup ..................................................................................... 127
Appe
Appendix F: Font Licenses ..................................................................................... 129
Index
ls............................................................................................... 95
the Probe to the Oscilloscope .. . .. . ... ... ... . . .. . ... ... ... ... ... . .. . ... ... ... ... .. .. . ... ... . 115
ance Graphs............................ .................................. .......................... 119
TBS1000 Series Oscilloscopes User Manual iii
Page 10

General Safety Summary
General Safet
To Avoid Fi
re or Personal
Injury
ySummary
Review the fo
this product or any products connected to it.
To avoid pot
Only qualified personnel should perform service procedures.
Use proper
certified for the country of use.
Connect a
instrument before connecting the probe to the circuit under test. Connect the
probe reference lead to the circuit under test before connecting the probe input.
Disconnect the probe input and the probe reference lead from the circuit under test
before disconnecting the probe from the measurement instrument.
Ground the product. This product is grounded through the grounding conductor
of the power cord. To avoid electric shock, the grounding conductor must be
connected to earth ground. Before making connections to the input or output
nals of the product, ensure that the product is properly grounded.
termi
Observe all terminal ratings. To a vo i d fire or shock hazard, observe all ratings
arkings on the product. Consult the product manual for further ratings
and m
information before making connections to the product.
llowing safety precautions to avoid injury and prevent damage to
ential hazards, use this product o nly as specified.
power cord. Use only the power cord specified for this product and
nd disconnect properly. Connect the probe output to the measurement
nect the probe reference lead to earth ground only.
Con
Do not apply a potential to any terminal, including the common terminal, that
ceeds the maximum ratingofthatterminal.
ex
Power disconnect. The power switch disconnects the product from the power
urce. See instructions for the location. Do not block the power switch; it must
so
remain accessible to the user at all times.
o not operate without covers. Do not operate this product with covers or panels
D
removed.
Do not operate with suspected failures. If you suspect that there is damage to this
product, have it inspected by qualified service per sonnel.
Avoid exposed circuitry. Do not touch exposed connections and components when
power is present.
iv TBS1000 Series Oscilloscopes User Manual
Page 11

General Safety Summary
Do not operate i
Do not operate in an explosive atmosphere.
Keep product surfaces clean and dry.
Provide prop
on installing the product so it has proper ventilation.
n wet/damp conditions.
er ventilation. Refer to the manual's installation instructions for details
TBS1000 Series Oscilloscopes User Manual v
Page 12
General Safety Summary
TermsinThisManual
Symbols and Terms o n the
Product
These terms may
WARNING. Warning statements identify conditions or practices that could result
in injury or loss of life.
CAUTION. Caution statements identify conditions or practices that could result in
damage to this product or other property.
These terms may appear on the product:
DANGER in
the marking.
WAR NI NG
read the marking.
CAUTIO
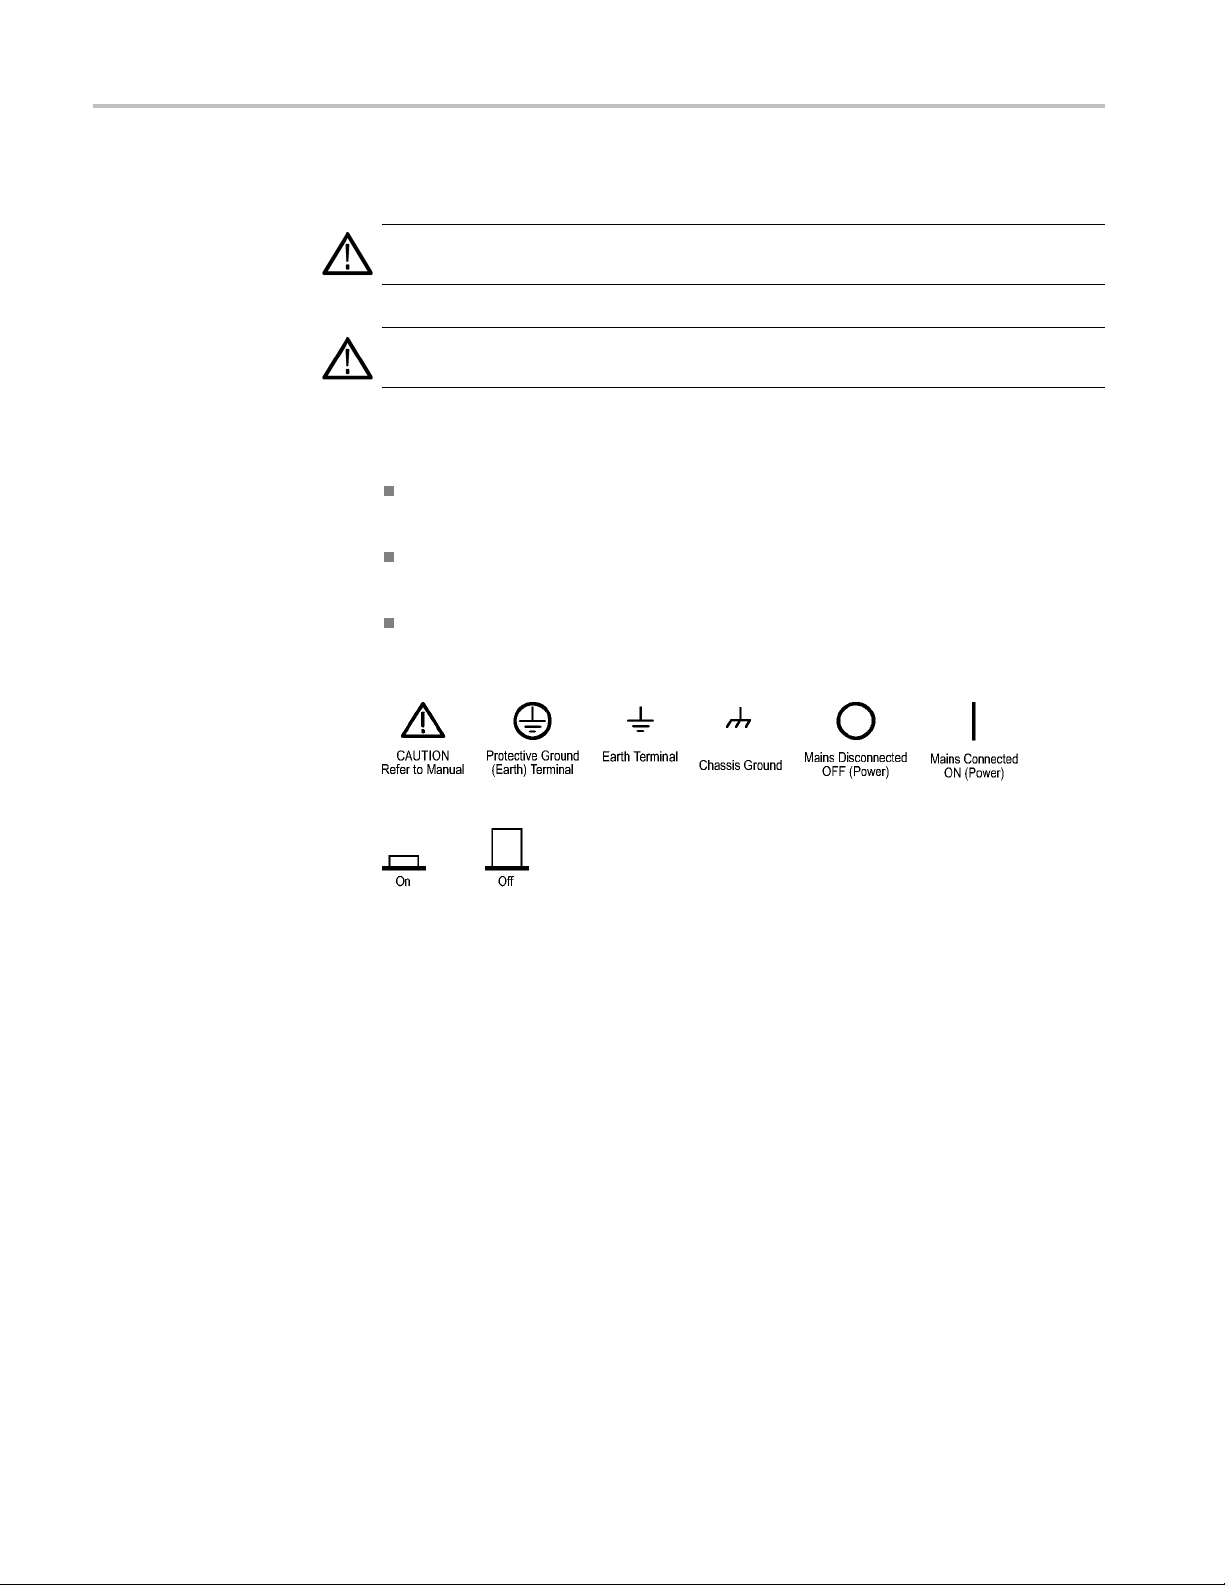
The following symbol(s) may appear on the product:
appear in this manual:
dicates an injury hazard immediately accessible as you read
indicates an injury hazard not immediately a ccessible as you
N indicates a hazard to property including the product.
vi TBS1000 Series Oscilloscopes User Manual
Page 13

Compliance Information
This section lists the EMC (electromagnetic compliance), safety, and
environmental standards with which the instrument complies.
EMC Compliance
EC Declaration of
Conformity – EMC
Meets intent of Directive 2004/108/EC for Electromagnetic Compatibility.
Compliance was demonstrated to the following specifications as listed in the
Official Journal of the European Communities:
EN 61326-1:2006, EN 61326-2-1:2006. EMC requirements for electrical equipment
for measurement, control, and laboratory use.
123
CISPR 11:2003. Radiated and conducted emissions, Group 1, Class A
IEC 61000-4-2:2001. Electrostatic discharge immunity
IEC 61000-4-3:2002. RF electromagnetic field immunity
4
IEC 61000-4-4:2004. Electrical fast transient/burst immunity
IEC 61000-4-5:2001. Power line surge immunity
IEC 61000-4-6:2003. Conducted RF immunity
IEC 61000-4-11:2004. Voltage dips and interruptions immunity
5
6
EN 61000-3-2:2006. AC power line harmonic emissions
EN 61000-3-3:1995. Voltage changes, fluctuations, and flicker
European Contact.
Tektronix UK, Ltd.
Western Peninsula
Weste r n R o ad
Bracknell, RG12 1RF
United Kingdom
1
This product is intended for use in nonresidential areas only. Use in residential areas may cause electromagnetic
interference.
2
Emissions which exceed the levels required by this standard may occur when this equipment is connected to a
test object.
3
To ensure compliance with the EMC standards listed here, high quality shielded interface cables should be used.
4
The instrument will exhibit ≤ 1.0 division waveform displacement and ≤ 2.0divisionincreaseinpeak-to-peak
noise when subjected to radiated interference per IEC 61000-4-3.
5
The instrument will exhibit ≤ 0.5 division waveform displacement and ≤ 1.0divisionincreaseinpeak-to-peak
noise when subjected to conducted interference per IEC 61000-4-6.
6
Performance Criterion C applied at the 70%/25 cycle Voltage-Dip and the 0%/250 cycle Voltage-Interruption test
levels (IEC 61000-4-11). If the instrument powers down upon a voltage dip or interruption, it will take longer than
ten seconds to return to the previous operating state.
TBS1000 Series Oscilloscopes User Manual vii
Page 14

Compliance Information
Australia / New Zealand
Declaration of
Conformity – EMC
Complies with t
following standard, in accordance with ACMA:
CISPR 11:2003
accordance with EN 61326-1:2006 and EN 61326-2-1:2006.
he EMC provision of the Radiocommunications Act per the
. Radiated and Conducted Emissions, Group 1, Class A, in
viii TBS1000 Series Oscilloscopes User Manual
Page 15

Compliance Information
Safety Compli
ance
EC Declaration of
Conformity – Low Voltage
U.S. Natio
nally Recognized
Testing Laboratory Listing
Canadian Certification
Additional Compliances
Equipment Type
Compliance was demonstrated to the following specification as listed in the
Official Journal of the European Communities:
Low Voltage Directive 2006/95/EC.
EN 61010-1: 2001. Safety requirements for electrical equipment for
measurement control and laboratory use.
UL 61010-1:2004, 2ndEdition. Standard for electrical measuring and test
equipment.
CAN/CSA-C22.2 No. 61010-1:2004. Safety requirements for electrical
equipment for measurement, control, and laboratory use. Part 1.
IEC 61010-1: 2001. Safety requirements for electrical equipment for
measurement, control, and laboratory use.
nd measuring equipment.
Test a
Safety Class
Pollution Degree
Description
Class1–groundedproduct.
A measure of the contaminants that could occur in the environment around
and within a product. Typically the internal environment inside a product is
considered to be the same as the external. Products should be used only in the
environment for which they are rated.
Pollution Degree 1. No pollution or only dry, nonconductive pollution occurs.
Products in this category are generally encapsulated, hermetically sealed, or
cated in clean rooms.
lo
Pollution Degree 2. Normally only dry, nonconductive pollution occurs.
ccasionally a temporary conductivity that is caused by condensation must
O
be expected. This location is a typical office/home environment. Temporary
condensation occurs only when the product is out of service.
Pollution Degree 3. Conductive pollution, or dry, nonconductive pollution
that becomes conductive due to condensation. These are sheltered locations
where neither temperature nor humidity is controlled. The area is protected
from direct sunshine, rain, or direct wind.
Pollution Degree 4. Pollution that generates persistent conductivity through
conductive dust, rain, or snow. Typical outdoor locations.
TBS1000 Series Oscilloscopes User Manual ix
Page 16

Compliance Information
Installation (Overvoltage)
Category Descriptions
Overvoltage Category
Terminals on th
designations. The installation categories are:
Measurement C
low-voltage installation.
Measuremen
installation.
Measuremen
connected to the low-voltage installation.
Measureme
directly connected to MAINS.
Overvoltage Category II (as defined in IEC 61010-1).
is product may have different installation (overvoltage) category
ategory IV. For measurements performed at the source of
t Category III. For measurements performed in the building
t Category II. For measurements performed on circuits directly
nt Category I. For measurements p erformed on circuits not
x TBS1000 Series Oscilloscopes User Manual
Page 17

Compliance Information
Environmenta
l Considerations
Product End-of-Life
Handling
Restriction of Hazardous
Substances
This section provides information about the environmental impact of the product.
Observe the following guidelines when recycling an instrument or component:
Equipment Recycling. Production of this equipment required the extraction and
use of natural resources. The equipment may contain substances that could be
harmful to
end of life. In order to avoid release of such substances into the environment and
to reduce the use of natural resources, we encourage you to recycle this product
in an appropriate system that will ensure that most of the materials are reused or
recycled appropriately.
This product is classified as an industrial monitoring and control instrument,
and is not required to comply with the substance restrictions of the recast RoHS
Directive 2011/65/EU until July 22, 2017.
the environment or human health if improperly handled at the product’s
This sym
Union requirements according to Directives 2002/96/EC and 2006/66/EC
on waste electrical and electronic equipment (WEEE) and batteries. For
informa
Tektronix Web site (www.tektronix.com).
bol indicates that this product complies with the applicable European
tion about recycling options, check the Support/Service section of the
TBS1000 Series Oscilloscopes User Manual xi
Page 18

Compliance Information
xii TBS1000 Series Oscilloscopes User Manual
Page 19

Preface
Preface
Help System
Context-Sensitive Help
This manual c
Storage Oscilloscopes.
The oscilloscope has a Help system with topics that cover all the features of the
oscilloscope. You can use the Help system to display several kinds of information:
General information about understanding and using the oscilloscope, such
as Using the Menu System.
Information about specific menus and controls, such as the Vertical Position
Control.
Advice about problems you may face while using an oscilloscope, such as
Reducing Noise.
The Help system provides several ways to find the information you need:
context-sensitive help, hyperlinks, and an index.
The os
screen when you push the Help front-panel button. When viewing help topics,
an LED lights next to the multipurpose knob to indicate that the knob is active.
If the topic uses more than one page, turn the multipurpose knob to move from
page to page within the topic.
cilloscope displays information about the last menu displayed on the
ontains operating information for the TBS1000 Series Digital
Hyperlinks
Index
TBS1000 Series Oscilloscopes User Manual xiii
Most of the help topics contain phrases marked with angle brackets, such as
<Autoset>. These are links to other topics. Turn the multipurpose knob to move
the highlight from one link to another. Push the Show Topic option button to
display the topic corresponding to the highlighted link. Push the Back option
utton to return to the previous topic.
b
Push the front-panel Help button, then push the Index option button. Push the
Page Up or Page Down option buttons until you find the index page that contains
the topic you want to view. Turn the multipurpose knob to highlight a help topic.
Push the Show Topic option button to display the topic.
NOTE. Push the Exit option button or any menu button to remove the Help text
from the screen and return to displaying waveforms.
Page 20

Preface
Firmware Updates Through the Internet
If a newer version of firmware becomes available, you can use the Internet and
aUSBflash drive to update your oscilloscope. If you do not have access to the
Internet, contact Tektronix for information on update procedures.
To update the firmware from the Internet, follow these steps:
1. Push the Utility ► System Status option, and write down the firmware
version number of the oscilloscope.
2. From your computer, access the www.tektronix.com web site and check if a
newer version of oscilloscope firmware is available.
3. Ifthereisanewerversionoffirmware, download the firmware file from the
web page.
You may need to unzip the downloaded file.
4. Copy the firmware file to the root folder of a USB flash drive.
5. Insert
6. From y
It ta
Your oscilloscope will prompt you to press a button when the firmware update is
com
until the firmware update is complete.
the USB flash drive into the USB Flash Drive port on the front of the
oscilloscope.
our oscilloscope, push the Utility ► File Utilities ► -more-page2
of 2 ► Update Firmware option button.
kes several minutes to update the fi rmware.
plete. You must not remove the USB flash drive, or power off the oscilloscope
xiv TBS1000 Series Oscilloscopes User Manual
Page 21
Conventions
Preface
This manual uses the following conventions:
Menu options appear with the first letter of each word in upper case. For
example: Peak Detect, Window Zone.
Front-pane
Multipurpose knob
\
\
buttons — First letter of each word on screen is upper case
Option
l buttons and knob labels — First
letter of each word in upper case
NOTE. Option buttons may also be called screen buttons, side-menu buttons,
bezel buttons, or soft keys.
The ► delimiter separates a series of button pushes. For example, Utility ►
Options ► Set Date and Time means that you push the Utility front-panel
button, then push the Options option button, and then push the Set Date and
e option button. Multiple pushes of an option button may be required
Tim
to select the desired option.
TBS1000 Series Oscilloscopes User Manual xv
Page 22

Preface
xvi TBS1000 Series Oscilloscopes User Manual
Page 23

Getting Started
TBS1000 Series Digital Storage Oscilloscopes are small, lightweight, benchtop
instruments, which you can use to take ground-referenced measurements.
This chapter describes how to do the following tasks:
Install your product
Perform a brief functional check
General Features
Perform a p
robe check and compensate probes
Match your probe attenuation factor
Use the self calibration routine
NOTE. You can select a language to display on the screen when you power on the
oscilloscope. At any time, you can also access the Utility ► Language option to
select a language.
The next table and list describe the general features.
Model Channels Bandwidth Sample rate Display
TBS1022
TBS1042
TBS1062
TBS1102
TBS1152
225MHz
240MHz
260MHz
2 100 MHz
2 150 MHz
500 MS/s Color
500 MS/s Color
1 GS/s Color
1 GS/s Color
1 GS/s Color
Context-sensitive help system
Color LCD display
Selectable 20 MHz bandwidth limit
2500 point record length for each channel
Autoset
Autoranging
Probe Check Wizard
Setup and waveform storage
USB Flash Drive port for file storage
Direct printing to any PictBridge compatible printer
TBS1000 Series Oscilloscopes User Manual 1
Page 24

Getting Started
PC communicati
ons through the USB Device port with OpenChoice PC
Communications software
Connect to a GP
IB controller through an optional TEK-USB-488 adapter
Cursors with readouts
Trigger frequency readout
Sixteen automatic measurements
Waveform averaging and peak detection
Dual time base
Math func
tions: +, -, and × operations
Math Fast Fourier Transform (FFT)
Pulse Width trigger capability
Video trigger capability with line-selectable triggering
External trigger
Variable persistence display
nterface and help topics in ten languages
User i
Installation
Power Source
Security Loop
Power Cord
nly the power c ord provided with your oscilloscope. Appendix B:
Use o
Accessories lists the standard and the optional accessories.
Use a power source that delivers 90 to 264 VAC
0 Hz power source, it must deliver 90 to 132 VAC
40
,45to66Hz. Ifyouhavea
RMS
, 360 to 440 Hz.
RMS
Use a standard laptop computer security lock, or thread a security cable through
the built-in cable channel to secure your oscilloscope to your location.
2 TBS1000 Series Oscilloscopes User Manual
Page 25
Getting Started
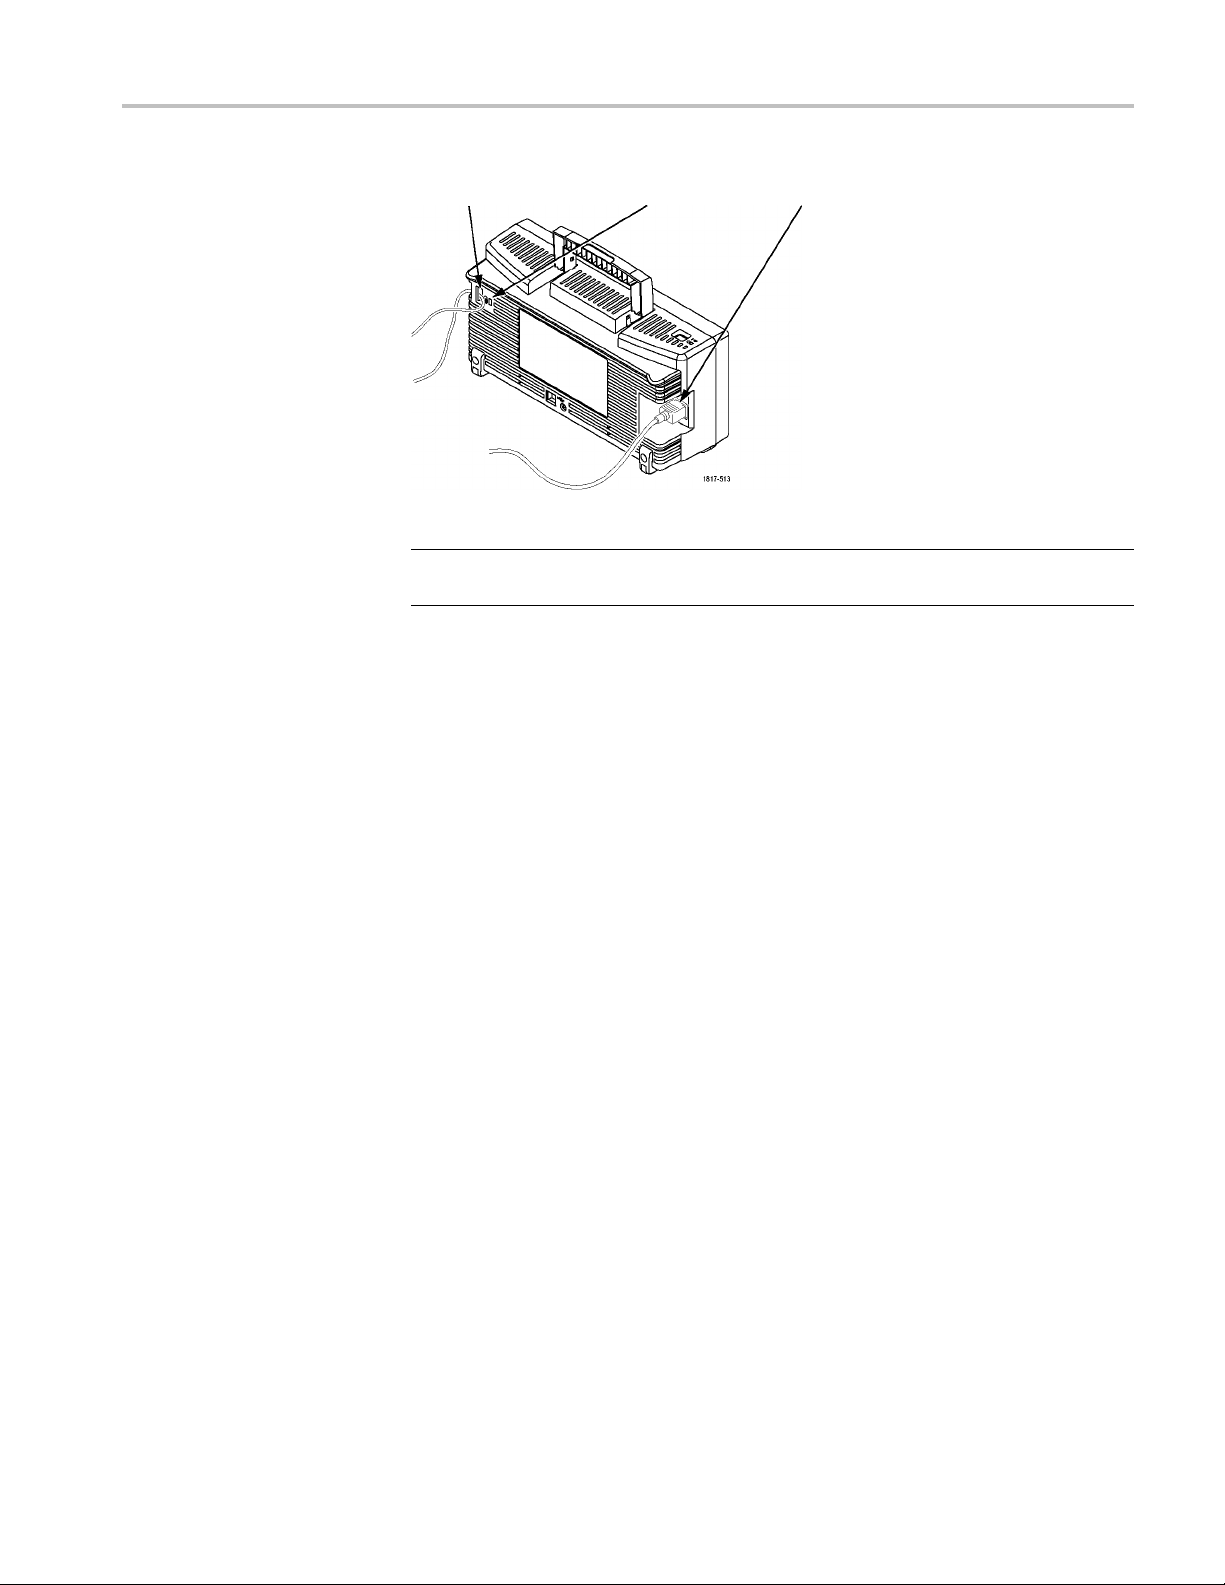
Ventilation
Security c able channel Security lock hole
Power cord
NOTE. The oscilloscope cools by convection. Keep two inches clear on the sides
and top of the product to allow adequate air flow.
TBS1000 Series Oscilloscopes User Manual 3
Page 26
Getting Started
Functional Ch
eck
Perform this functional check to verify that your oscilloscope is operating
correctly.
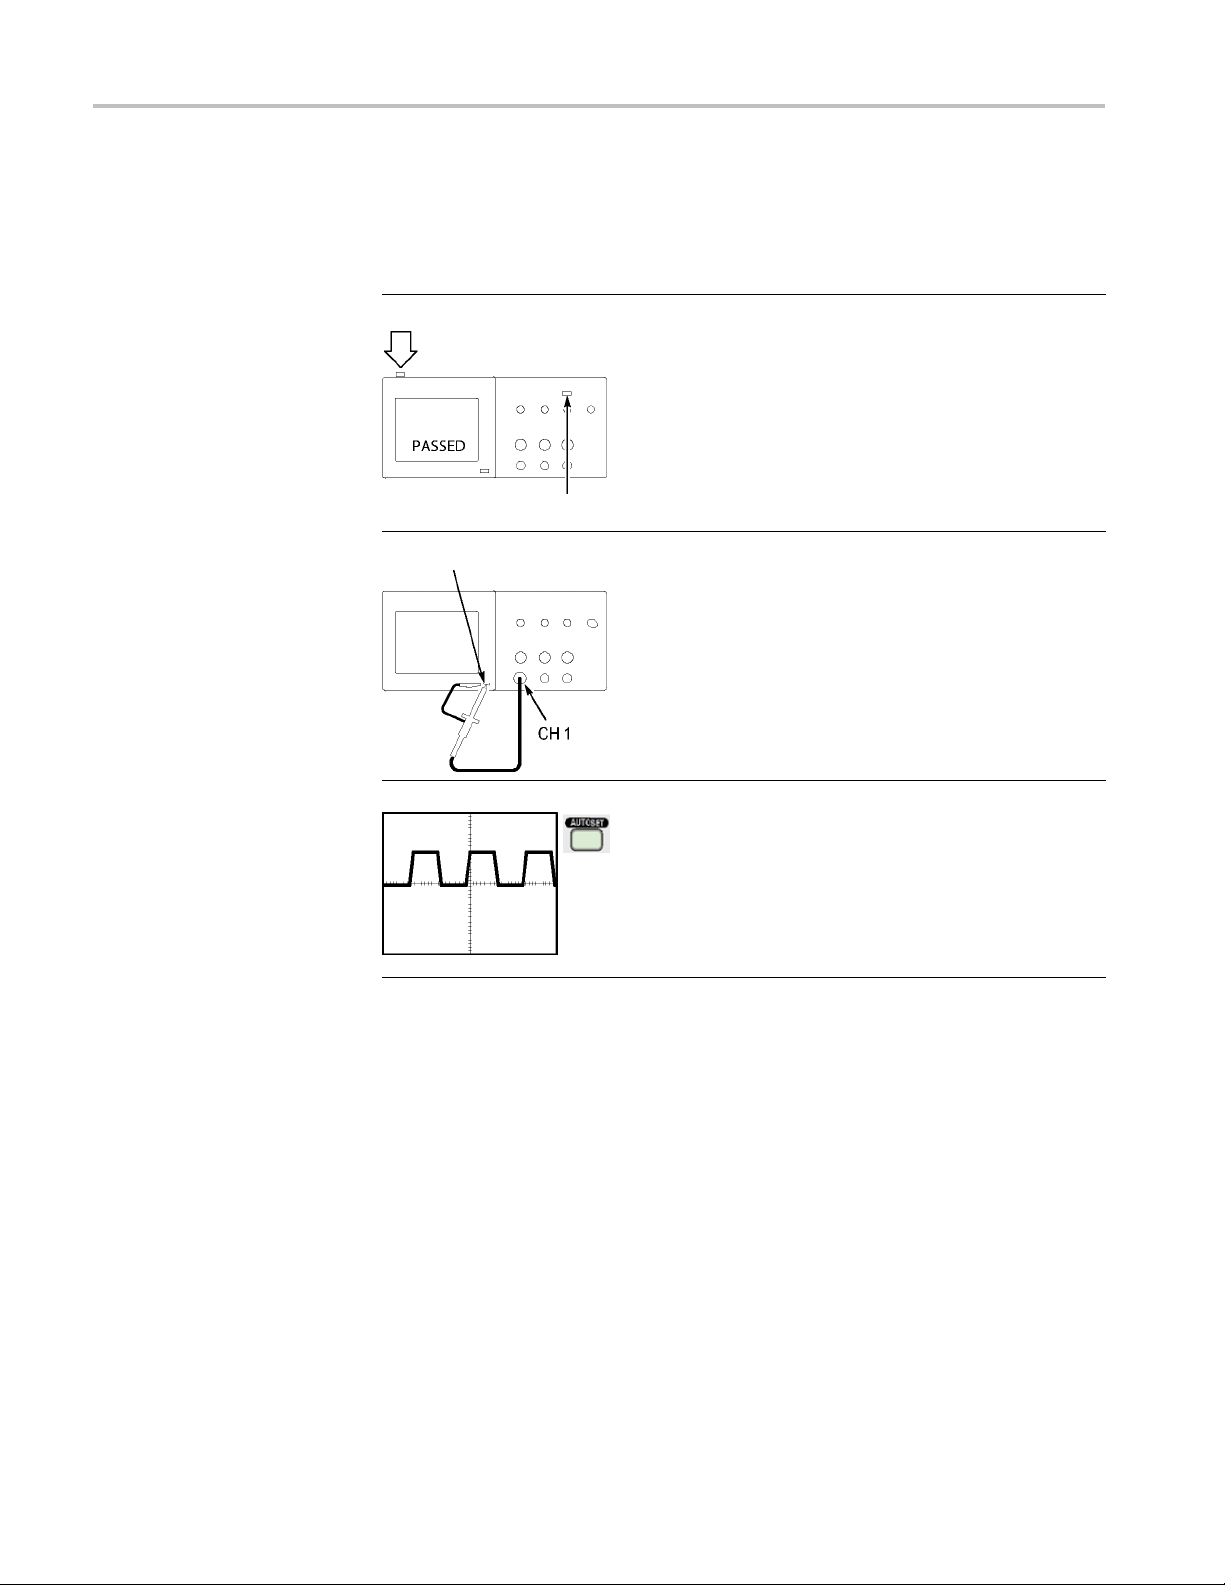
ON/OFF button
1. Power on the oscilloscope.
Push the Default Setup button.
The default
10X.
Default Setup button
PROBE COMP
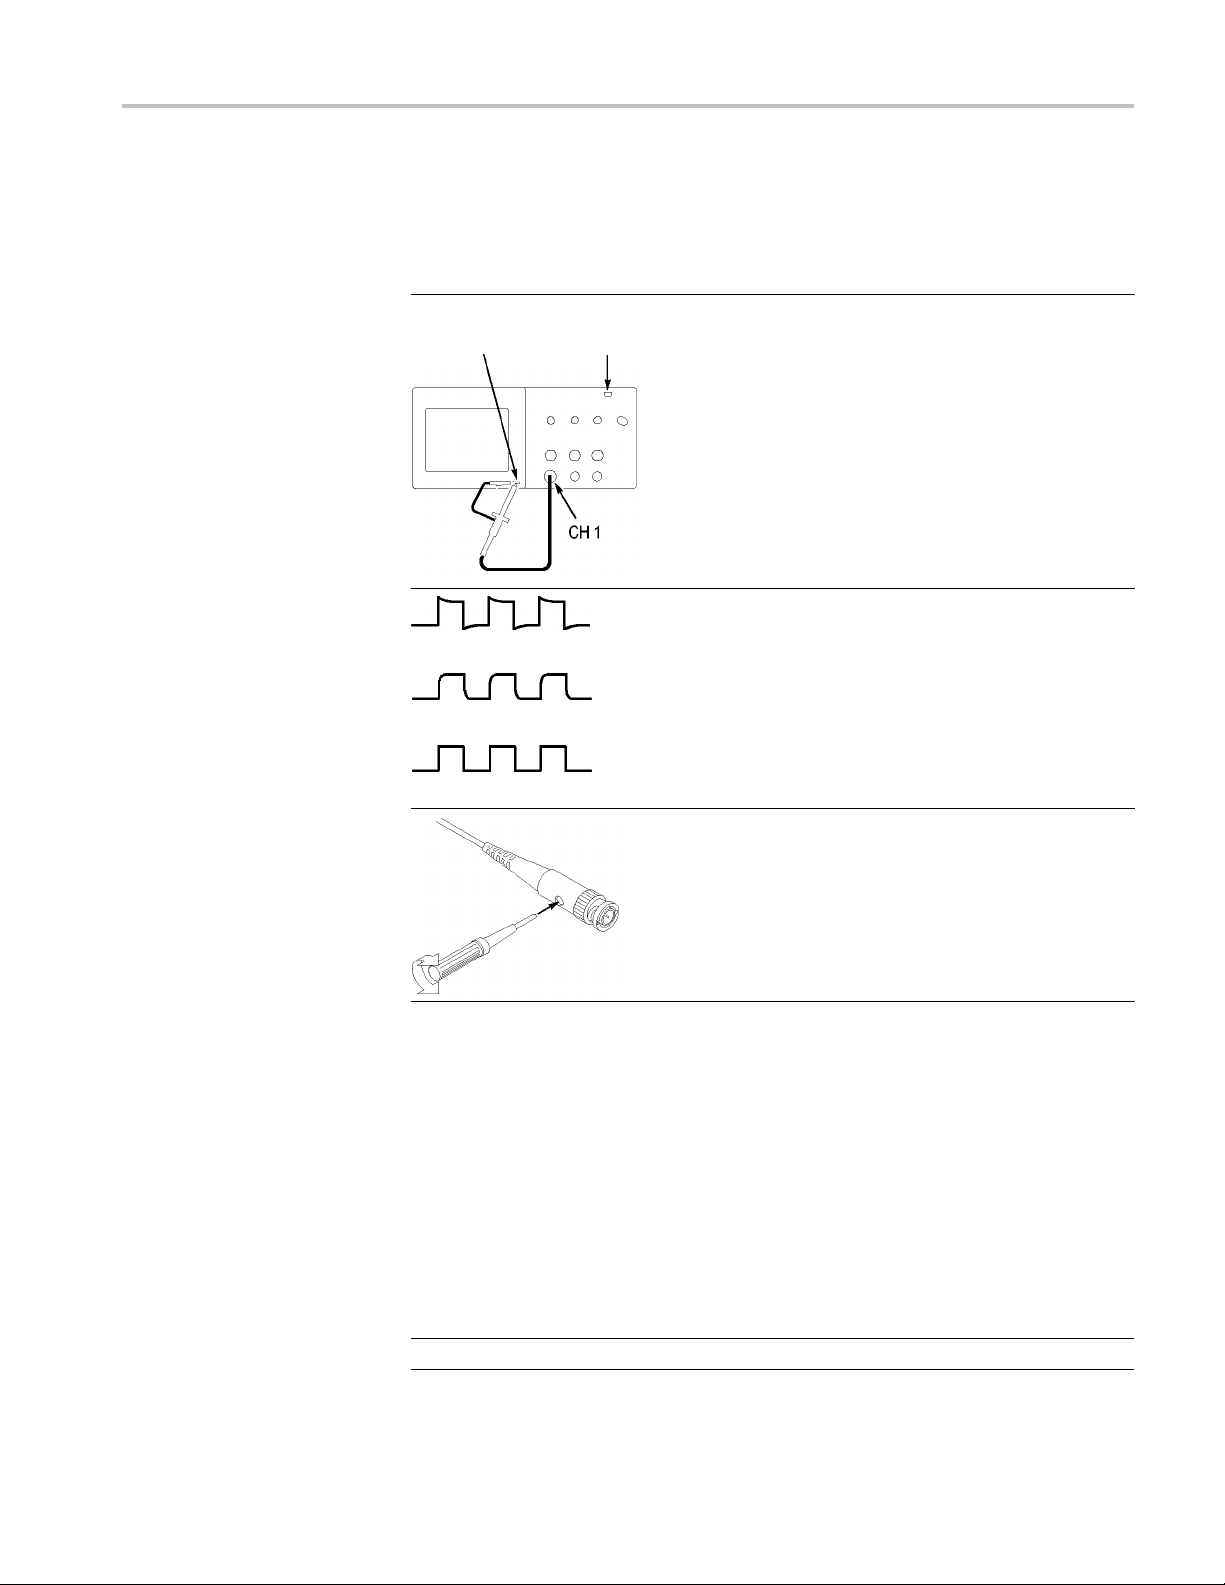
2. Connect the TPP0101/TP0201 probe to channel
1ontheo
in the probe connector with the key on the CH 1
BNC, push to connect, and twist to the right to
lock th
Connect the probe tip and reference lead to the
PROBE COMP terminals.
Probe option attenuation setting is
scilloscope. To do this, align the slot
e probe in place.
3. Push t
he AutoSet button. Within a few seconds,
you should see a square wave in the display of
about 5V peak-to-peak at 1 kHz.
he 1 channel 1 menu button on the front
Push t
panel twice to remove channel 1, push the 2
channel 2 menu button to display channel 2, and
at steps 2 and 3. For 4-channel models,
repe
repeat for 3 and 4.
4 TBS1000 Series Oscilloscopes User Manual
Page 27
Probe Safety
Getting Started
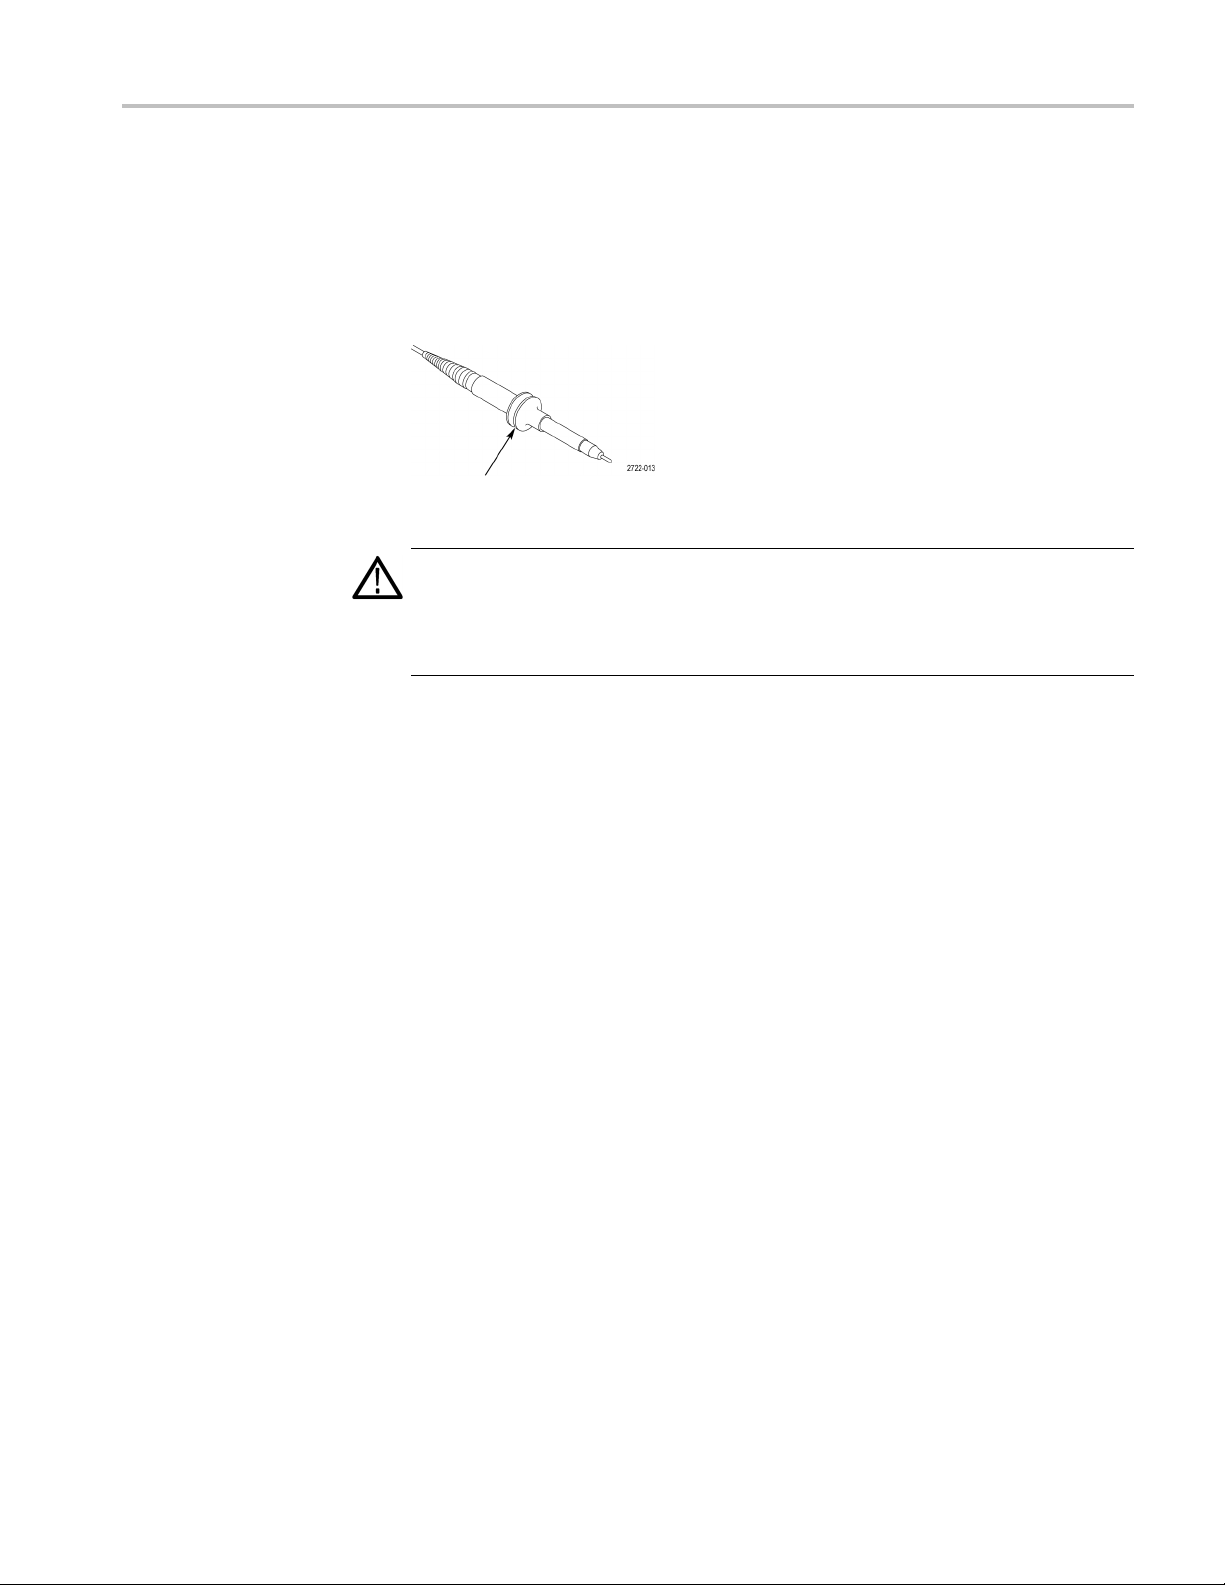
Check and observe probe ratings before using probes.
A guard around the TPP0101/TPP0201 probe body provides a finger b arrier for
protection from electric shock.
Finger guard
WARNING. To avoid electric shock when using the probe, keep fingers behind
the guard on the probe body.
To avoid electric shock while using the probe, do not touch metallic portions of
the probe head while it is connected to a voltage source.
Volta
Connect the probe to the oscilloscope, and connect the ground terminal to ground
before you take any measurements.
ge Probe Check Wizard
You can use the Probe Check Wizard to verify that a voltage probe is operating
properly. The wizard does not s upport current probes.
The wizard helps you adjust the compensation for voltage probes (usually with a
screw on the probe body or probe connector) and set the factor for the Attenuation
ion for each channel, such as in the 1 ► Probe ► Voltage ► Attenuation
opt
option.
TBS1000 Series Oscilloscopes User Manual 5
Page 28

Getting Started
You should use t
an input channel.
T o use the Prob
probe is connected properly, compensated properly, and the Attenuation option in
the oscilloscope Vertical menu is set to match the probe, the oscilloscope displays
a PASSED message at the bottom of the screen. Otherwise, the oscilloscope
displays directions on the screen to guide you in correcting these problems.
NOTE. The Probe Check Wizard is useful for 1X, 10X, 20X, 50X, and 100X
probes. It
the Ext Trig BNC.
NOTE. Wh
oscilloscope settings (other than the Probe option) to what they were before you
pushed the PROBE CHECK button.
To comp
steps:
1. Conne
ensate a probe that you plan to use with the Ext Trig input, follow these
he Probe Check Wizard each time you connect a voltage probe to
e Check Wizard, push the PROBE CHECK button. If the voltage
is not useful for 500X or 1000X probes, or for probes connected to
en the process is complete, the Probe C heck Wizard restores the
ct the probe to any input channel BNC, such as to c hannel 1.
2. Push the PROBE CHECK button and follow the directions on the screen.
3. After you verify that the probe functions and is compensated properly, connect
the probe to the Ext Trig BNC.
6 TBS1000 Series Oscilloscopes User Manual
Page 29
Getting Started
Manual Probe C
ompensation
As an alternative method to the Probe Check Wizard, you can manually perform
this adjustment to match your probe to the input channel.
PROBE COMP AutoSet
button
1. Push the 1 ► Probe ► Voltage ►
Attenuation option and select 10X. Connect
the TPP0101/TPP0201 probe to channel 1 on
the oscilloscope. If you use the probe hook-tip,
ensure a proper connection by firmly inserting the
tip onto the probe.
2. AttachtheprobetiptothePROBECOMP
~5V@1kHz terminal and the reference lead to
the PROBE COMP chassis terminal. Display the
channel, and then push the AutoSet button.
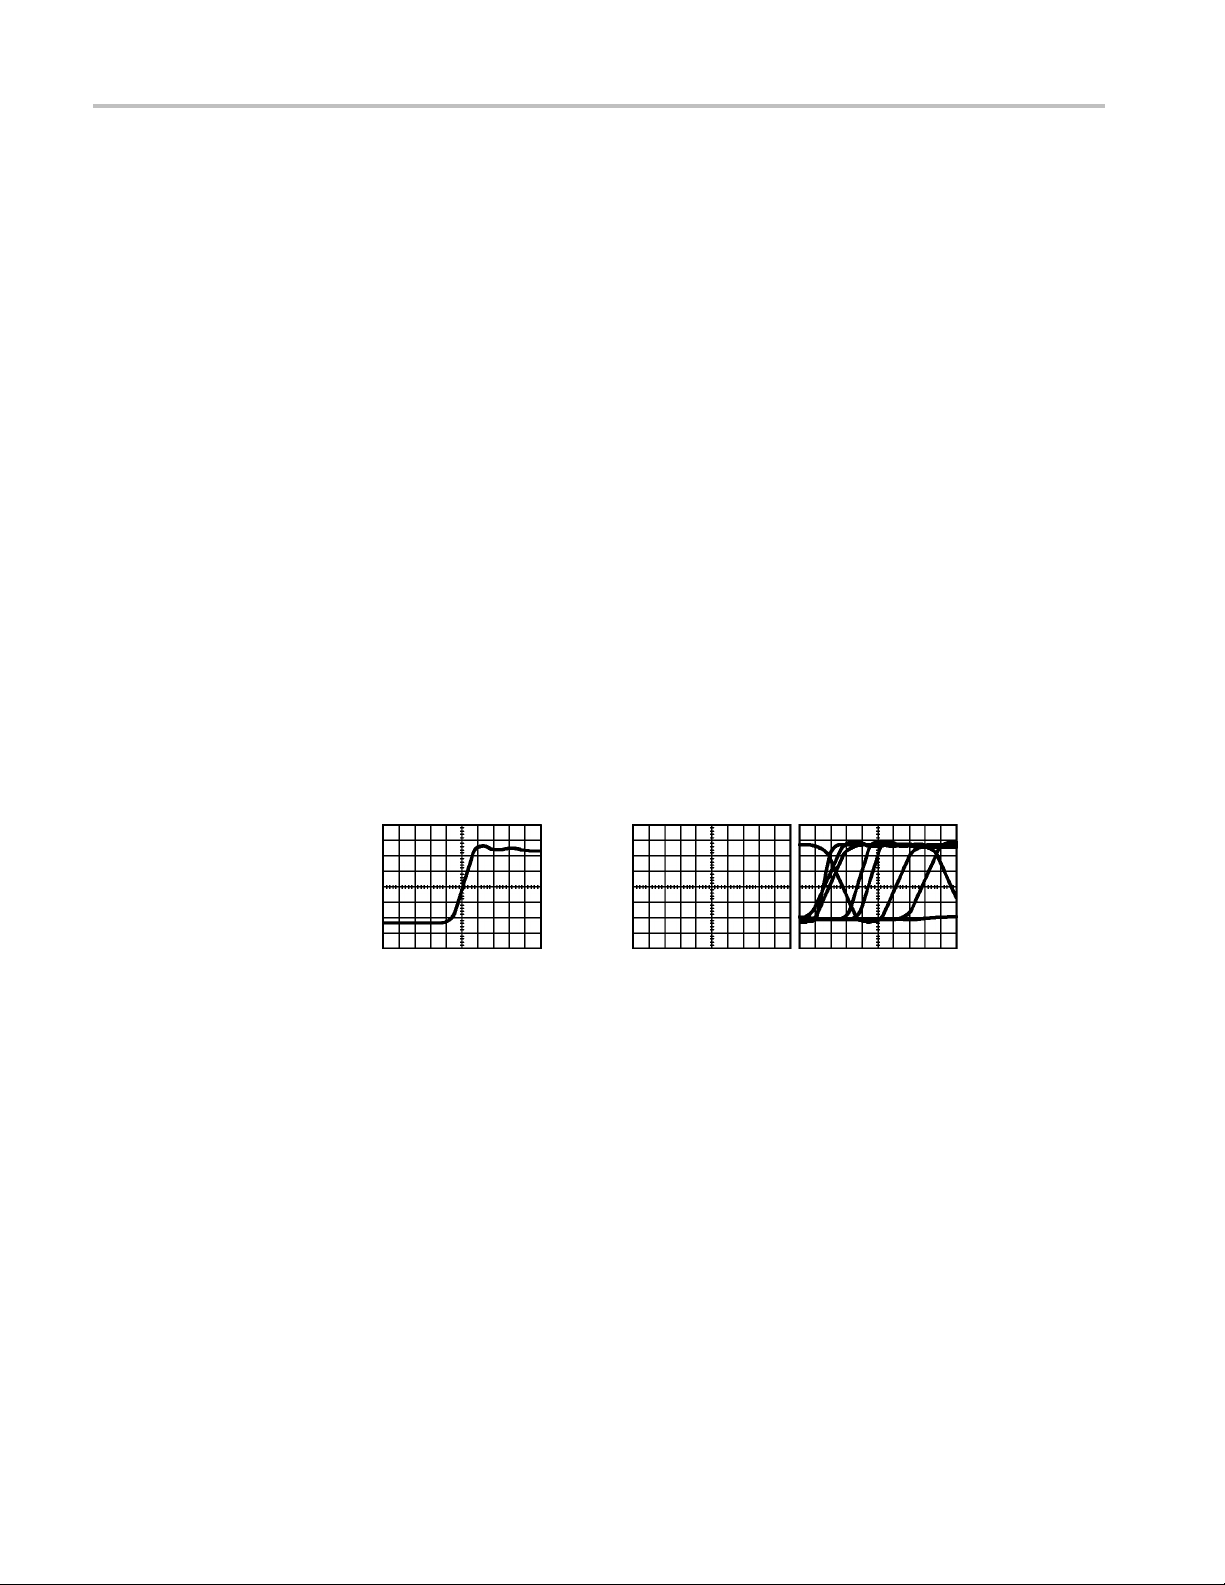
3. Check the shape of the displayed waveform.
Overcompensated
Undercompensated
e Attenuation Setting
Prob
Compensated correctly
4. If necessary, adjust your probe.
Repeat as necessary.
Probes are available with various attenuation factors which affect the vertical
scale of the signal. The Probe Check Wizard verifies that the attenuation factor
the oscilloscope matches the probe.
in
As an alternative method to Probe Check, you can manually select the factor
at matches the attenuation of your probe. For example, to match a probe set
th
to10XconnectedtoCH1,pushthe1 ► Probe ► Vol t ag e ► Attenuation
option, and select 10X.
NOTE. The default setting for the Attenuation option is 10X.
TBS1000 Series Oscilloscopes User Manual 7
Page 30

Getting Started
Current P
robe Scaling
If you change th
the oscilloscope Attenuation option to match. Switch settings are 1X and 10X.
NOTE. When the Attenuation switch is set to 1X, the P2220 probe limits the
bandwidth of the oscilloscope to 6 MHz. To use the full bandwidth of the
oscilloscope, be sure to set the switch to 10X.
Current probes provide a voltage signal proportional to the current. You need to
set the oscilloscope to match the scale of your current probe. The default scale is
10 A/V.
For example, to set the scale for a current probe connected to CH 1, push the 1 ►
Probe ►
e Attenuation switch on a P2220 probe, you also need to change
Attenuation switch
Current ► Scale option, and select an appropriate value.
Self Calibration
elf calibration routine lets you optimize the oscilloscope signal path for
The s
maximum measurement accuracy. You can run the routine at any time but you
should always run the routine if the ambient temperature changes by 5 °C (9 °F)
or more. The routine takes about two minutes.
For accurate calibration, power on the oscilloscope and wait twenty minutes to
ensure it is warmed up.
To compensate the signal path, disconnect any probes or cables from the input
connectors. Then, access the Utility ► Do Self Cal option, and follow the
directions on the screen.
8 TBS1000 Series Oscilloscopes User Manual
Page 31

Operating Basics
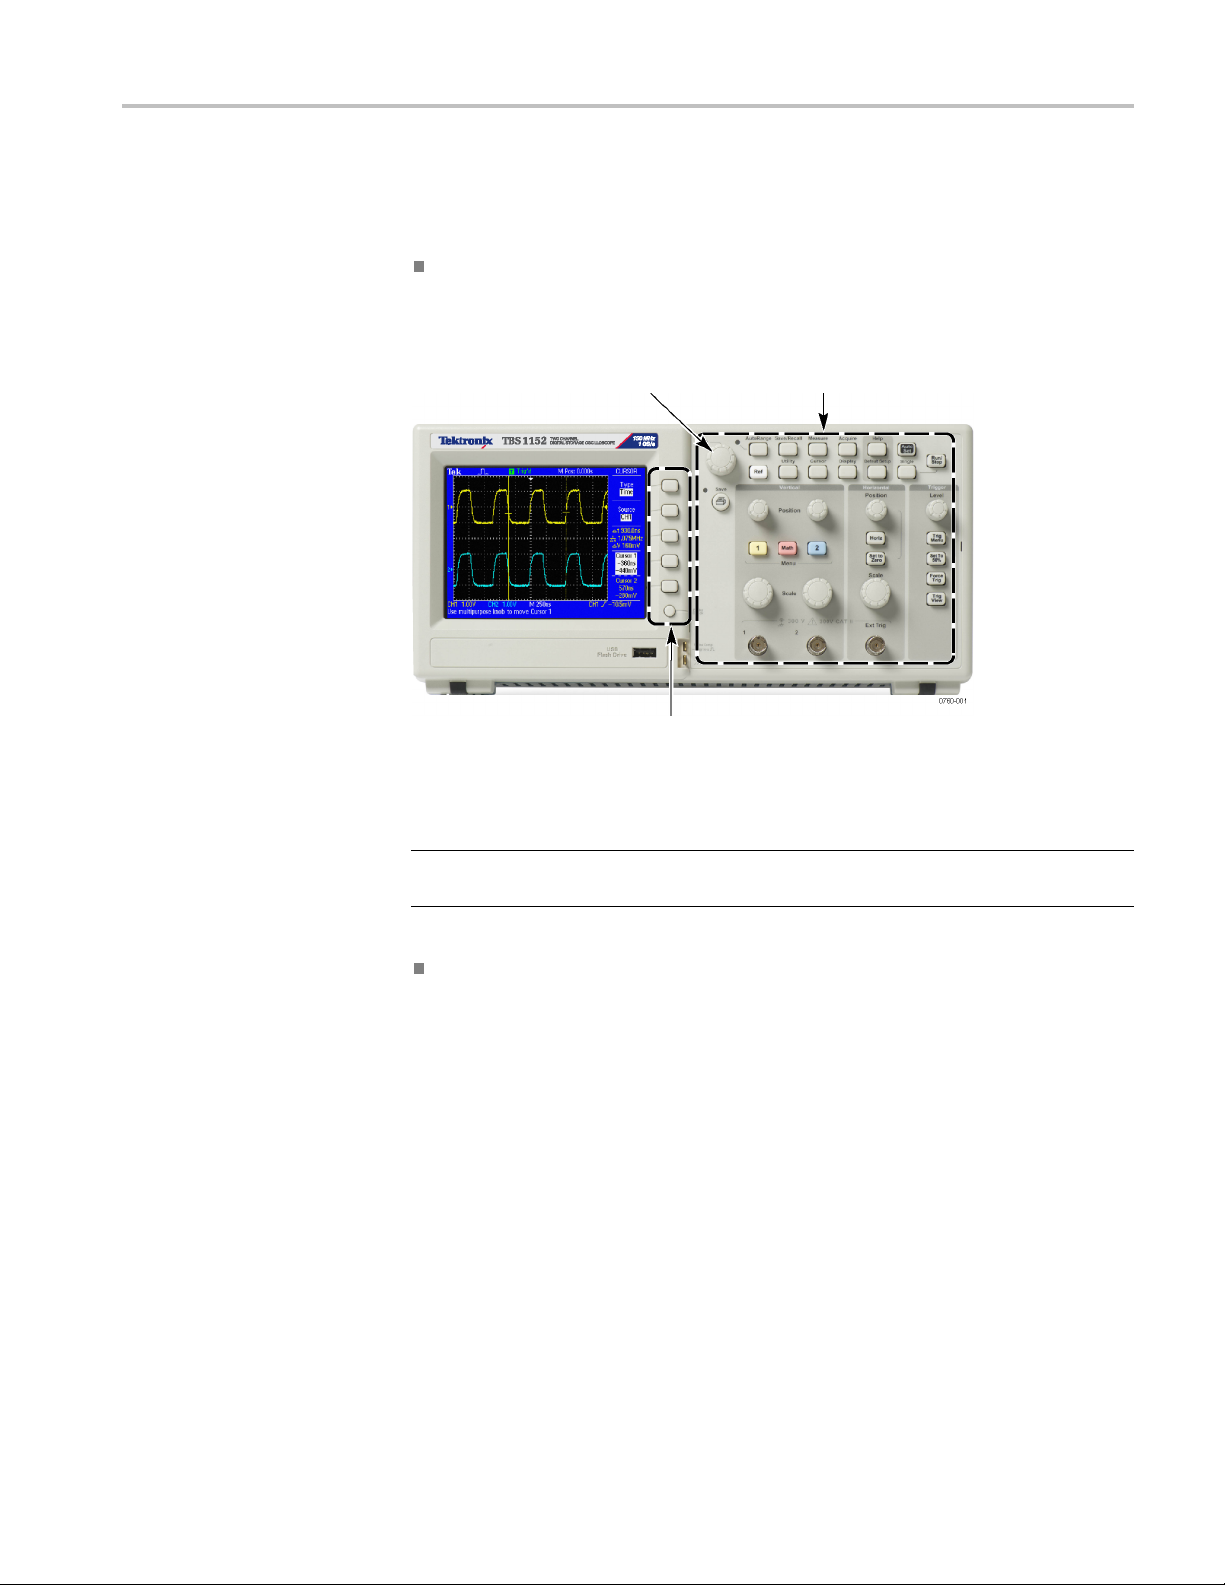
The front panel is divided into easy-to-use functional areas. This chapter provides
you with a quick overview of the controls and the information displayed on the
screen.
Display Area
In addition to displaying waveforms, the display is filled with many details about
the waveform and the oscilloscope control settings.
NOTE. For details on displaying the FFT function, (See page 57, Displaying
the FFT Spectrum.)
TBS1000 Series Oscilloscopes User Manual 9
Page 32
Operating Basics
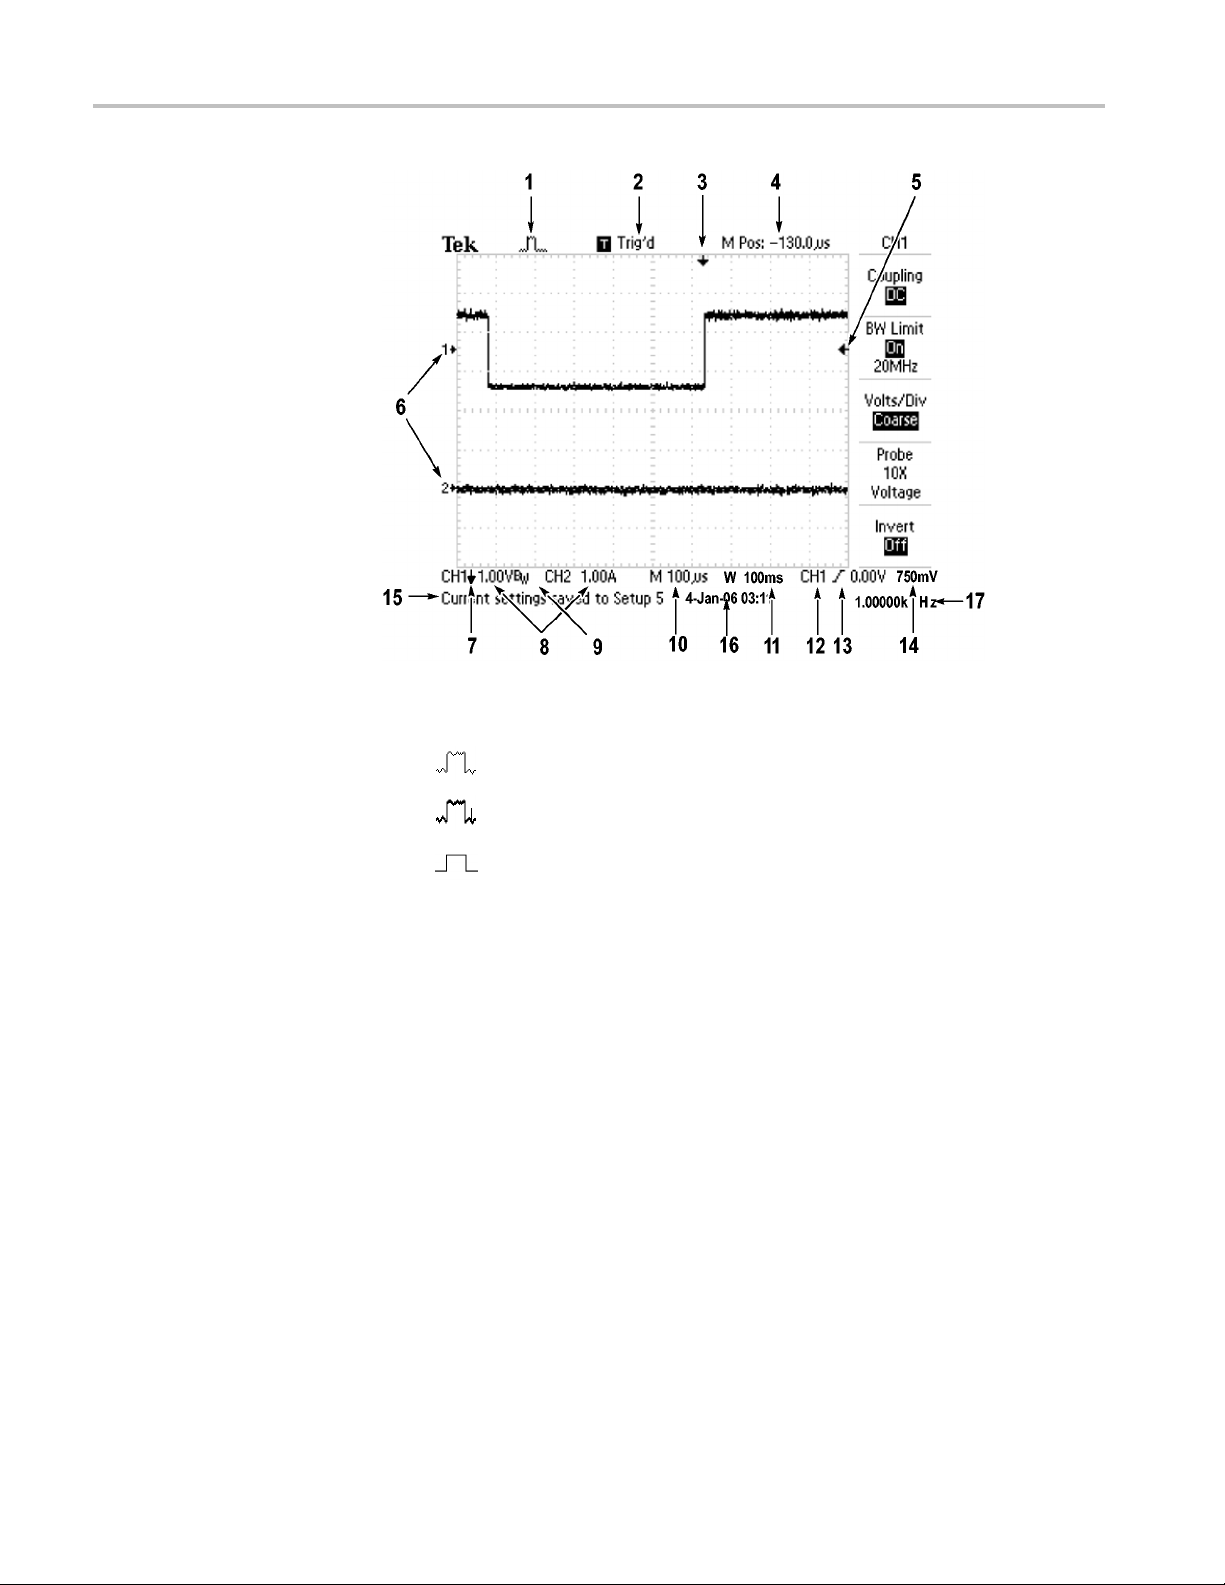
1. Icon display shows acquisition mode.
Sample m
Peak detect mode
Averag
ode
e mode
10 TBS1000 Series Oscilloscopes User Manual
Page 33

Operating Basics
2. Trigger status
indicates the following:
The oscilloscope is acquiring pretrigger data. All triggers are
ignored in this state.
All pretrigger data has been acquired and the oscilloscope is
ready to accept a trigger.
The oscilloscope has seen a trigger and is acquiring the
posttrigger data.
The oscilloscope has stopped acquiring waveform data.
The oscilloscope has completed a Single Sequence acquisition.
The oscilloscope is in auto mode and is acquiring waveforms in
the absence of triggers.
The oscilloscope is acquiring and displaying waveform data
continuo
usly in scan mode.
3. Marker shows horizontal trigger position. Turn the Horizontal Position knob
to adjust the position of the marker.
4. Readout shows the time at the center graticule. The trigger time is zero.
5. Marker
shows Edge or Pulse Width trigger level.
6. On-screen markers show the ground reference points of the displayed
orms. If there is no marker, the channel is not displayed.
wavef
7. An arrow icon indicates that the waveform is inverted.
8. Readouts show the vertical scale factors of the channels.
9. AB
icon indicates that the channel is bandwidth limited.
W
10. Readout shows main time base setting.
11. Readout shows window time base setting if it is in use.
12.Re
adout shows trigger source used for triggering.
13. Icon shows selected trigger type as follows:
Edge trigger for the rising edge.
Edge trigger for the falling edge.
Video trigger for line sync.
ideo trigger for field sync.
V
Pulse Width trigger, positive polarity.
Pulse Width trigger, negative polarity.
TBS1000 Series Oscilloscopes User Manual 11
Page 34

Operating Basics
Message Area
14. Readout shows E
15. Display area shows helpful messages; some messages display for only three
seconds.
If you recall a saved waveform, readout shows information about the reference
waveform, such as RefA 1.00V 500µs.
16. Readout shows date and time.
17. Readout shows trigger frequency.
The oscilloscope displays a message area (item number 15 in the previous figure)
at the bottom of the screen that conveys the following types of helpful information:
Directions to access another menu, such as when you push the Trig Menu
button:
For TRIGGER HOLDOFF, go to HORIZONTAL MENU
Suggestion of what you might want to do next, such as when you push the
Measure button:
Push an option button to change its measurement
Information about the action the oscilloscope performed, such as when you
push the Default Setup button:
dge or Pulse Width trigger level.
Using the Menu System
Default setup recalled
Information about the waveform, such as when you push the AutoSet button:
Square wave or pulse detected on CH1
The user interface of the oscilloscopes was designed for easy access to specialized
functions through the menu structure.
When you push a front-panel button, the oscilloscope displays the corresponding
menu on the right side of the screen. The menu shows the options that are available
when you push the unlabeled option buttons directly to the right of the screen.
The oscilloscope uses several methods to display menu options:
Page (Submenu) Selection: For some menus, you can use the top option
button to choose two or three submenus. Each time you push the top button,
the options change. For example, when you push the top button in the Trigger
Menu, the oscilloscope cycles through the Edge, Video, and Pulse Width
trigger submenus.
Circular List: The oscilloscope sets the parameter to a different value each
time you push the option button. For example, you can push the 1 (channel
12 TBS1000 Series Oscilloscopes User Manual
Page 35

Operating Basics
lection
Page Se
TRIGGER CH1
Type
Edge
or or
TRIGGER CH1
Type
Video
or or
TRIGGER CH1
Type
Pulse
Circul
ar List
Coupling
DC
Coupling
AC
Coupling
Ground
1menu)buttona
nd then push the top option button to cycle through the
Vertical (channel) Coupling options.
In some lists,
you can use the multipurpose knob to select an option. A hint
line tells you when the multipurpose knob can be used, and an LED by the
multipurpose knob lights when the knob is active. (See page 15, Menu and
Control Buttons.)
Action: The oscilloscope displays the type of action that will immediately
occurwhenyoupushanActionoptionbutton. For example, when the Help
Index is visible, and you push the Page Down option button, the oscilloscope
immediately displays the next page of index e ntries.
Radio: The oscilloscope uses a different button for each option. The
currently-selected option is highlighted. For example, the oscilloscope
display
s various acquisition mode options when you push the Acquire Menu
button. To select an option, push the corresponding button.
Action Radio
HELP
Page
Up
Page
Down
ACQUIRE
Sample
Peak Detect
Average
Vertical Controls
TBS1000 Series Oscilloscopes User Manual 13
Page 36

Operating Basics
Horizontal Controls
Position (1 and
1&2Menu. Displays the Vertical menu selections and toggles the display of the
channel waveform on and off.
Scale (1 & 2). Selects vertical scale factors.
Math. Displays waveform math operations menu and toggles the display of the
math waveform on and off.
2). Positions a waveform vertically.
ion. Adjusts the horizontal position of all channel and math waveforms.
Posit
The resolution of this control varies with the time base setting. (See page 86,
Window Zone.)
NOTE. To make a large adjustment to the horizontal position, turn the Horizontal
Scale knob to a larger value, change the horizontal position, and then turn the
Horizontal Scale knob back to the previous value.
Horiz. Displays the Horizontal Menu.
Set to Zero. Sets the h orizontal position to zero.
Scale. Selects the horizontal time/division (scale factor) for the main or the
window time base. When Window Zone is enabled, it changes the width of the
window zone by changing the window time base. (See page 86, Window Zone.)
14 TBS1000 Series Oscilloscopes User Manual
Page 37

Operating Basics
Trigger Contr
ols
Level. When you use an Edge or Pulse trigger, the Level knob sets the amplitude
level that the signal must cross to acquire a waveform.
Trig Menu
Set To 50%. The trigger level is set to the vertical midpoint between the peaks of
the trigger signal.
. Displays the Trigger Menu.
u and Control Buttons
Men
Force Trig. Completes an acquisition regardless of an adequate trigger signal.
utton has no effect if the acquisition is already stopped.
This b
Trig View. Displays the trigger waveform in place of the channel waveform while
you hold down the Trig Vi e w button. Use this to see how the trigger settings
affect the trigger signal, such as trigger coupling.
Multipurpose knob
TBS1000 Series Oscilloscopes User Manual 15
Page 38

Operating Basics
Refer to the Ref
erence chapter for detailed information on the menu and button
controls.
Multipurpose Knob. Thefunctionisdeterminedbythedisplayedmenuorselected
menu option. When active, the adjacent LED lights. The next table lists the
functions.
Active menu or option Knob function Description
Cursor Cursor 1 or Cursor 2
Help
Horizontal
Math
Measure Type
Save/Recall
Trigger
Utility ► File Utilities
Utility ► Options ►
GPIB Setup ► Address
Utility ► Options ► Set
Date and Time
Scroll Selects entries in the Index; selects
Holdoff Sets the amount of time before another
Position
Vertical Scale Changes the scale of the Math
Action
File selection
Source Selects the source when the Trigger
Video line number
Pulse width
File selection
Name entry
Value entry
Value entry
Positions the selected cursor
links in a topic; displays the next or
previous page for a topic
trigger event can be accepted; (See
page 100, Holdoff.)
Positions the Math waveform
waveform
Selects the type of automatic
measurement for each source
Sets the transaction as save or recall
for setup files, waveform files, and
screen images
Selects setup, waveform, or image files
to save, or selects setup or waveform
files to recall
Type option is set to Edge
Sets the oscilloscope to a specificline
number when the Trigger Type option
is set to Video and the Sync option is
set to Line Number
Sets the width of the puls e when the
Trigger Type option is set to Pulse
Selects files to rename or delete; (See
page 102, File Utilities for the USB
Flash Drive.)
Renames the file or folder; (See
page 103, Rename File or Folder.)
Sets the GPIB address for the
TEK-USB-488 adapter
Sets the value for the date and time;
(See page 101, Setting the Date and
Time.)
16 TBS1000 Series Oscilloscopes User Manual
Page 39

Operating Basics
Active menu or option Knob function Description
Vertical ► Pro
Voltage ► Attenuation
Vertical ► Probe ►
Current ► Sca
be ►
le
Value entry
Value entry
For a channel menu (such as the CH
1 menu), sets the attenuation factor in
the oscillosc
For a of chann
CH 1 menu), sets the scale in the
oscilloscope
ope
el menu (such as the
AutoRange. Displays the Autorange Menu, and activates or deactivates the
autoranging function. When autoranging is active, the adjacent LED lights.
Save/Recall. Displays the Save/Recall Menu for setups and waveforms.
Measure. Displays the automated measurements menu.
Acquire. Displays the Acquire Menu.
Ref. Displays the Reference Menu to quickly display and hide reference
wavefo
rms stored in the oscilloscope non-volatile memory.
Utility. Displays the Utility Menu.
Cursor. Displays the Cursor Menu. Cursors remain visible (unless the Type
option is set to Off) after you leave the Cursor Menu but are not adjustable.
Display. Displays the Display Menu.
Help. Displays the Help Menu.
Default Setup. Recalls the factory setup.
AutoSet. Automatically sets the oscilloscope controls to produce a usable display
of the input signals.
Single. (Single sequence) Acquires a single waveform and then stops.
Run/Stop. Continuously acquires waveforms or stops the acquisition.
Starts the print operation to a PictBridge compatible printer, or performs the
Save function to the USB flash drive.
Save. An LED indicates when the print button is configuredtosavedatatothe
USB flash drive.
TBS1000 Series Oscilloscopes User Manual 17
Page 40
Operating Basics
Input Connect
ors
Other Front-Panel Items
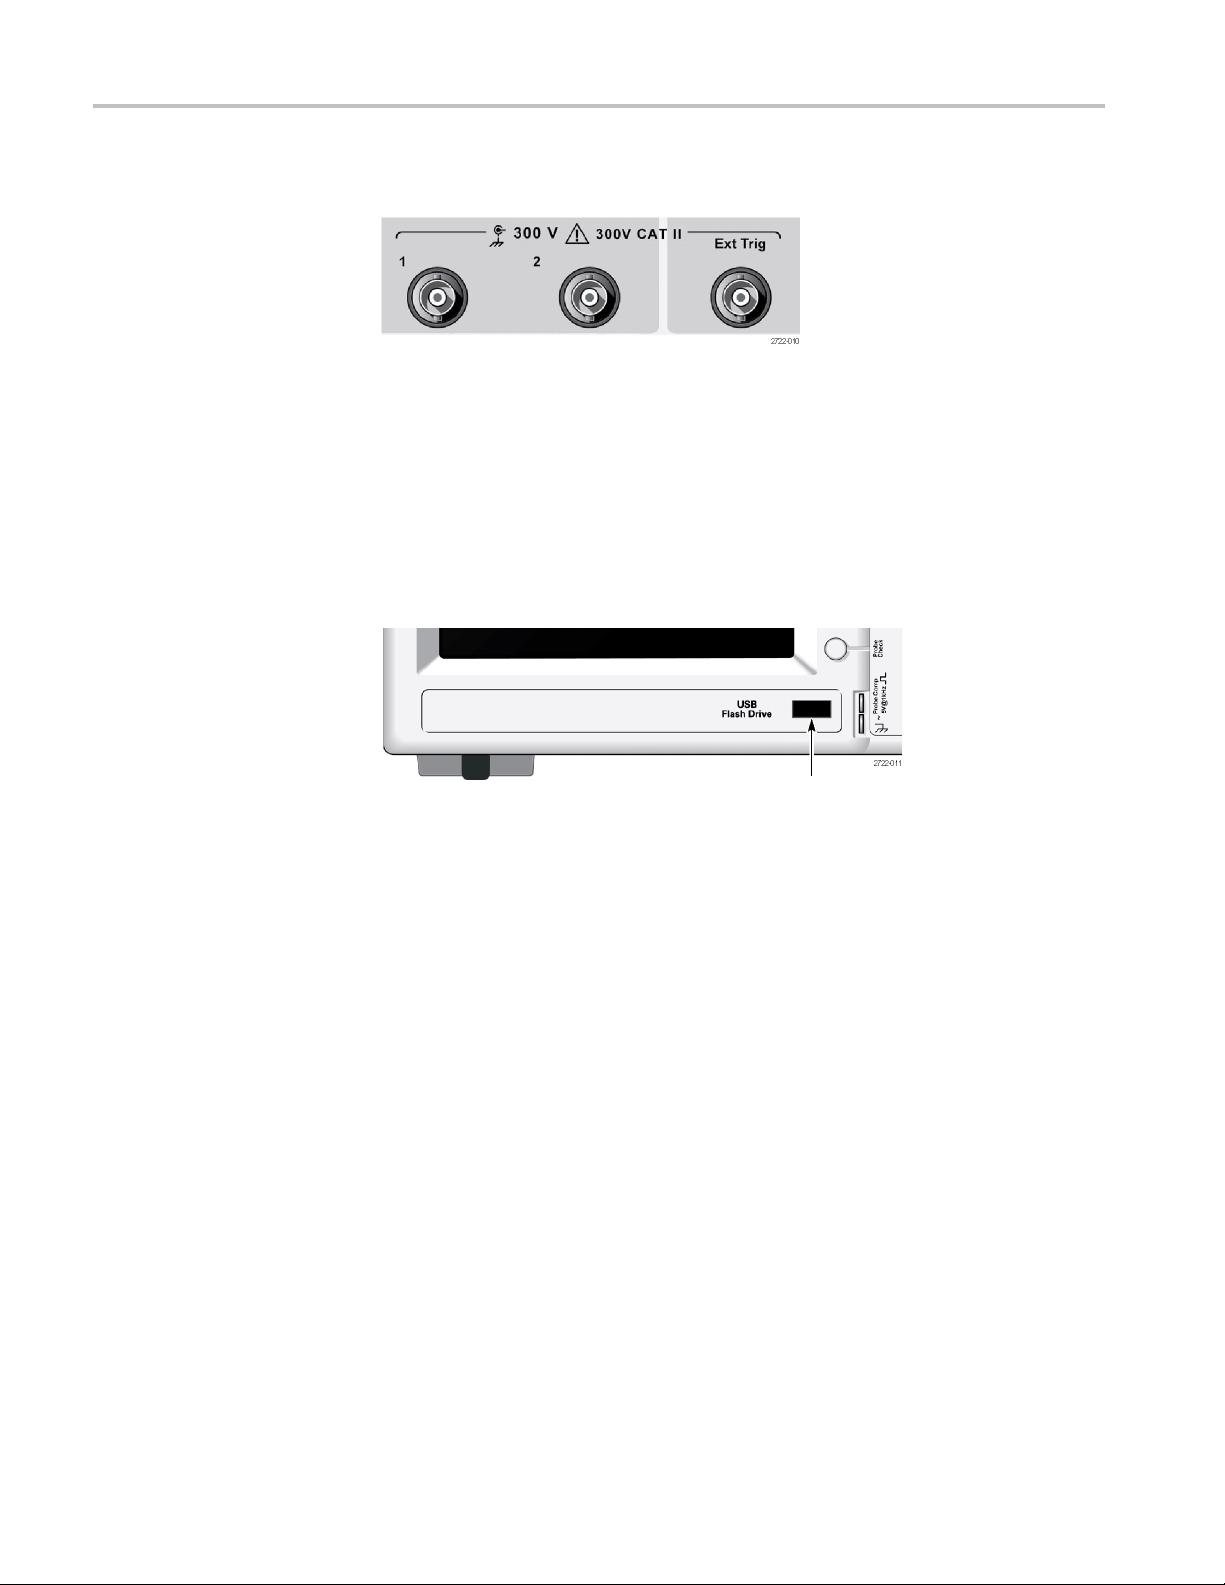
1&2. Input connectors for waveform display.
Ext Trig. Input connector for an external trigger source. Use the Trigger Menu to
select the
how the trigger settings affect the trigger signal, such as trigger coupling.
Ext, or Ext/5 trigger source. Push and hold the Trig Vie w button to see
USB Flash Drive port
USB Flash Drive Port. Insert a USB flash drive for data storage or retrieval. The
oscilloscope displays a clock symbol to indicate when the flash drive is active.
After a file is saved or retrieved, the oscilloscope removes the clock, and displays
a hint line to notify you that the save or recall operation is complete.
For flash drives with an LED, the LED blinks when saving data to or retrieving
data from the drive. Wait until the LED stops to remove the drive.
PROBE COMP. Probe compensation output and chassis reference. Use to
electrically match a voltage probe to the oscilloscope input circuit. (See page 5,
Voltage Probe Check Wizard.) (See page 7, Manual Probe Compensation.)
18 TBS1000 Series Oscilloscopes User Manual
Page 41

Understanding Oscilloscope Functions
This chapter contains general information that you need to understand before
you use an oscilloscope. To use your oscilloscope effectively, you need to learn
about the fol
Setting up the oscilloscope
Triggering
Acquiring signals (waveforms)
Scaling and positioning waveforms
Measuring waveforms
lowing functions:
The next
and their relationships to each other.
Setting Up the Oscilloscope
You should become familiar with several functions that you may use often when
operating your oscilloscope: Autoset, Autorange, saving a setup, and recalling
a setup.
figure shows a block diagram of the various functions of the oscilloscope
Using Autoset
Using Autorange
TBS1000 Series Oscilloscopes User Manual 19
Each time you push the AutoSet button, the Autoset function obtains a stable
waveform display for you. It automatically adjusts the vertical scale, horizontal
scale and trigger settings. Autoset also displays several automatic measurements
in the graticule area, depending on the signal type.
Autorange is a continuous function that you can enable or disable. The function
adjusts setup values to track a signal when the signal exhibits large changes or
when you physically move the probe to a different point.
Page 42
Understanding Oscilloscope Functions
Saving a Setup
Recalling a Setup
Triggering
Default Setup
The oscillosco
change before you power off the oscilloscope. The oscilloscope recalls this setup
the next time you apply power.
You can use the Save/Recall Menu to save up to ten different setups.
You can also
aUSBflash drive for removable data storage and retrieval. (See page 63, USB
Flash Drive Port.)
The oscill
any saved setups, or the default setup. (See page 90, Save/Recall.)
The oscilloscope is set up for normal operation when it is shipped from the
factory
button. To view the default settings, refer to Appendix D: Default Setup.
The trigger determines when the oscilloscope starts to acquire data and to display
a waveform. When a trigger is set up properly, the oscilloscope converts unstable
displays or blank screens into meaningful waveforms.
. This is the default setup. To recall this setup, push the Default Setup
pe saves the current setup if you wait five seconds after the last
save setups to a USB flash drive. The oscilloscope accommodates
oscope can recall the last setup before the oscilloscope was powered off,
Triggered waveform Untriggered waveforms
For oscilloscope-specific descriptions, refer to the Operating Basics chapter. (See
page 15, Trigger Controls.) Refer also to the Reference chapter. (See page 95,
Trigger Controls.)
When you push the Run/Stop or Single button to start an acquisition, the
oscilloscope goes through the following steps:
1. Acquires enough data to fill the portion of the waveform record to the left of
the trigger point. This is called the pretrigger.
2. Continues to acquire data while waiting for the trigger condition to occur.
3. Detects the trigger condition.
20 TBS1000 Series Oscilloscopes User Manual
Page 43

Understanding Oscilloscope Functions
Source
Types
Modes
4. Continues to ac
5. Displays the newly-acquired waveform.
NOTE. ForEdgeandPulsetriggers,theoscilloscope counts the rate at which
trigger events occur to determine trigger frequency. The oscilloscope displays
the frequency in the lower right corner of the screen.
You can use the Trigger Source options to select the signal that the oscilloscope
uses as a trigger. The source can be the AC power line (available only with Edge
triggers), or any signal connected to a channel BNC or to the Ext Trig BNC.
The oscilloscope provides three types of triggers: Edge, Video, and Pulse Width.
You can select the Auto or the Normal trigger mode to define how the oscilloscope
acquires data when it does not detect a trigger condition. (See page 95, Mode
Options.)
To perform a single sequence acquisition, push the Single button.
quire data until the waveform record is full.
Coupling
Position
Slope and Level
You can use the Trigger Coupling option to determine which part of the signal
will pass to the trigger circuit. This can help you attain a stable display of the
waveform.
To use trigger coupling, push the Trig Menu button, select an Edge or Pulse
trigger, and select a Coupling option.
NOTE. Trigger coupling affects only the signal passed to the trigger system. It
does not affect the bandwidth or coupling of the signal displayed on the screen.
To view the conditioned signal being passed to the trigger circuit, push and hold
down the Trig View button.
The horizontal position control establishes the time between the trigger and the
screen center. Refer to Horizontal Scale and Position; Pretrigger Information
for information on how to use this control to position the trigger. (See page 23,
Horizontal Scale and Position; Pretrigger Information.)
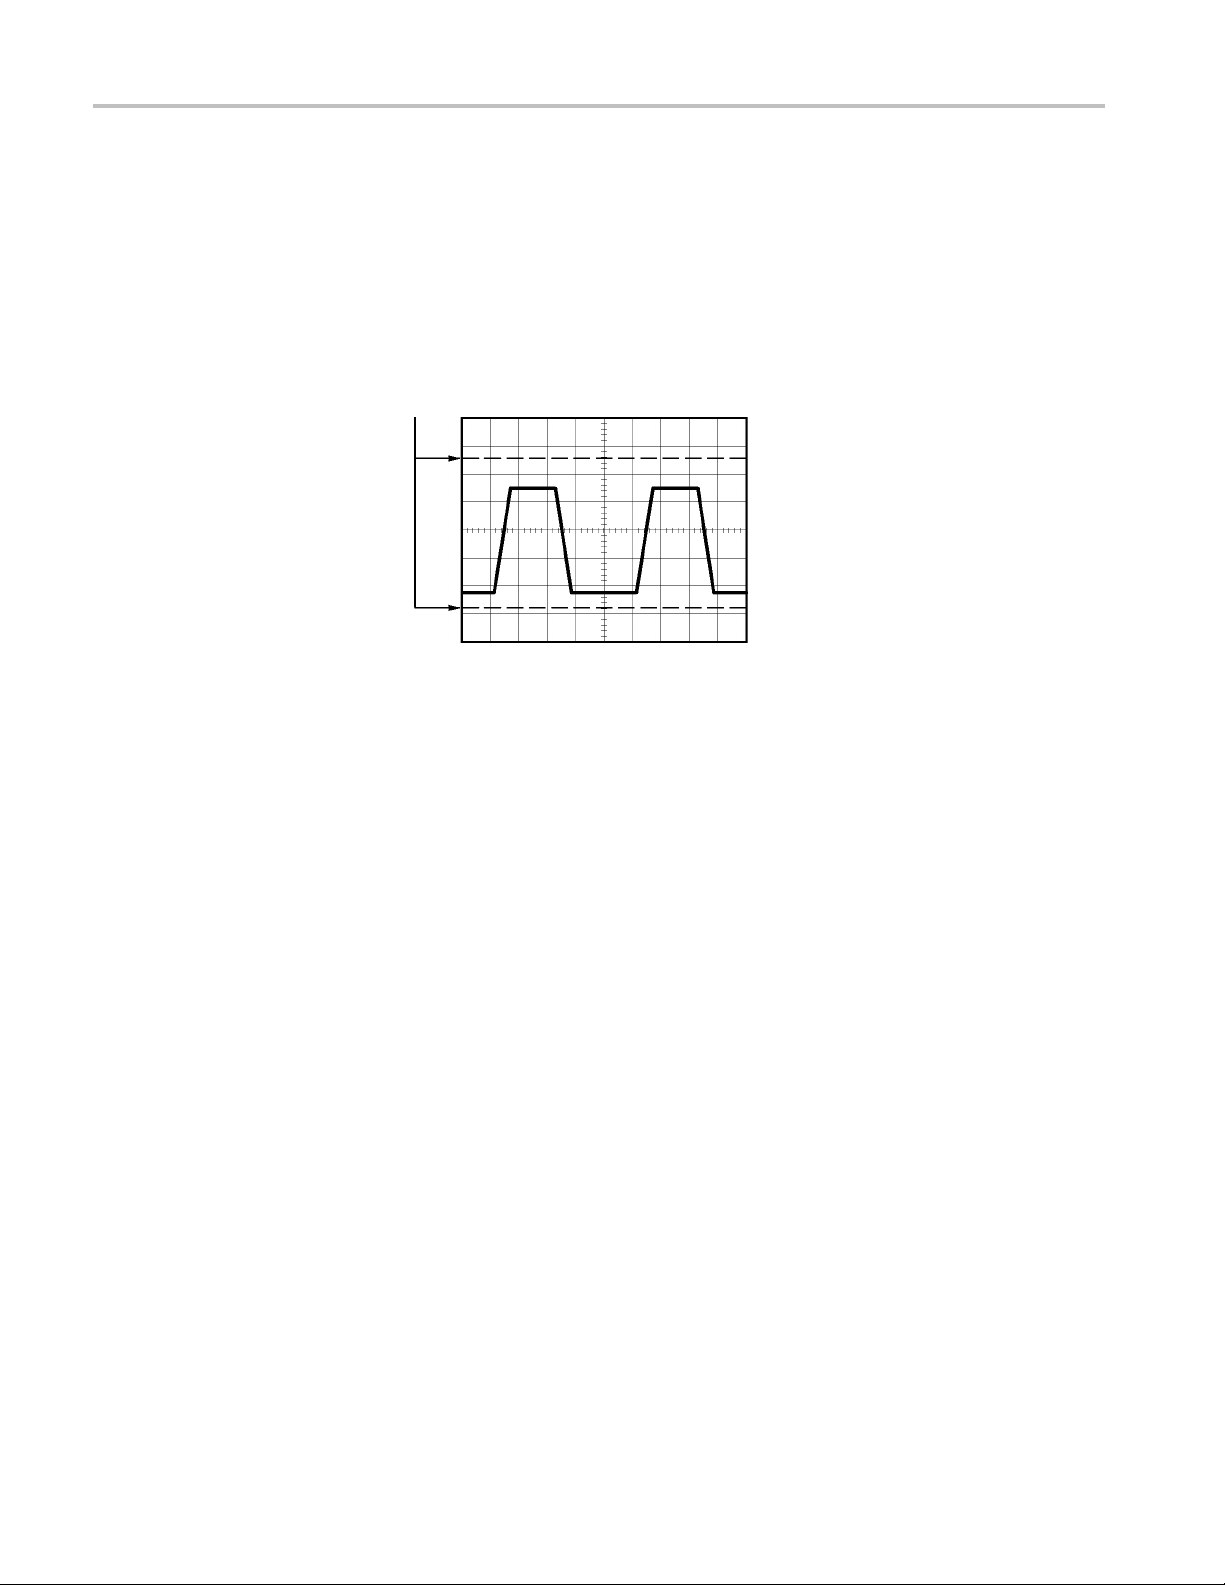
The Slope and Level controls help to define the trigger. The Slope option (Edge
trigger type only) determines whether the oscilloscope finds the trigger point on
the rising or the falling edge of a signal. The Trigger Level knob controls where
on the edge the trigger point occurs.
TBS1000 Series Oscilloscopes User Manual 21
Page 44

Understanding Oscilloscope Functions
Trigger level can be adjusted
Acquiring Signals
When you acquire a signal, the oscilloscope converts it into a digital form and
displays a waveform. The acquisition mode defines how the signal is digitized,
and the time base setting affects the time span and level of detail in the acquisition.
Rising edge Falling edge
vertically
Trigger can be rising or falling
Acquisition Modes
ime Base
T
There are three acquisition modes: Sample, Peak Detect, and Average.
Sample. In this acquisition mode, the oscilloscope samples the signal in evenly
spaced intervals to construct the waveform. This mode accurately represents
signals most of the time.
However, this mode does not acquire rapid variations in the signal that may occur
between samples. This can result in alia sing, and may cause narrow pulses to be
d. In these cases, you should use the Peak Detect mode to acquire data.
misse
(See page 23, Time Domain Aliasing.)
Peak Detect. In this acquisition mode, the oscilloscope finds the highest and
lowest values of the input signal over each sample interval and uses these values
to display the waveform. In this way, the oscilloscope can acquire and display
row pulses, which may have otherwise been missed in Sample mode. Noise
nar
will appear to be higher in this mode.
Average. In this acquisition mode, the oscilloscope acquires several waveforms,
averages them, and displays the resulting waveform. You can use this mode to
reduce random noise.
The oscilloscope digitizes waveforms by acquiring the value of an input signal
at discrete points. The time base allows you to control how often the values are
digitized.
To adjust the time b ase to a horizontal scale that suits your purpose, use the
Horizontal Scale knob.
22 TBS1000 Series Oscilloscopes User Manual
Page 45

Understanding Oscilloscope Functions
Scaling and Po
sitioning Waveforms
Vertical Scale and Position
You can change the display of waveforms by adjusting the scale and position.
When you change the scale, the waveform display will increase or decrease in size.
When you chan
The channel indicator (located on the left of the graticule) identifies each
waveform on the display. The indicator points to the ground reference level of
the waveform record.
You can view the display area and readouts. (See page 9, Display Area.)
You can change the vertical position of waveforms by moving them up or down in
the display. To compare data, you can align a waveform above another or you can
align waveforms on top of each other.
You can change the vertical scale of a wav
contract or expand relative to the ground reference level.
For oscilloscope-specific descriptions, refer to the Operating Basics chapter. (See
page 13, Vertical Controls.) ReferalsototheReference chapter. (See page 103,
Vertical Controls.)
ge the position, the waveform will move up, down, right, or left.
eform. The waveform display will
Horizontal Scale and
Position; Pretrigger
Information
You can adjust the Horizontal Position control to view waveform data before
the trigger, after the trigger, or some of each. When you change the horizontal
position of a waveform, you are actually changing the time between the trigger
and the center of the display. (This appears to move the waveform to the right
or left on the display.)
Forexample,ifyouwanttofind the cause of a glitch in your test circuit, you
might trigger on the glitch and make the pretrigger period large enough to capture
data before the glitch. You c an then analyze the pretrigger data and perhaps find
the cause of the glitch.
You change the horizontal scale of all the waveforms by turning the Horizontal
Scale knob. For example, you might want to see just one cycle of a waveform to
measure the overshoot on its rising edge.
The oscilloscope shows the horizontal scale as time per division in the s cale
readout. Since all active waveforms use the same time base, the oscilloscope only
displays one value for all the active channels, except when you use Window
Zone. Ref
(See page 86, Window Zone.)
For oscilloscope-specific descriptions, refer to the Operating Basics chapter. (See
page 14, Position.)ReferalsototheReference chapter. (See page 85, Horizontal.)
Time Domain Aliasing. Aliasing occurs when the oscilloscope does not sample the
signal fast enough to construct an accurate waveform record. When this happens,
er to Window Zone for information on how to use the window function.
TBS1000 Series Oscilloscopes User Manual 23
Page 46
Understanding Oscilloscope Functions
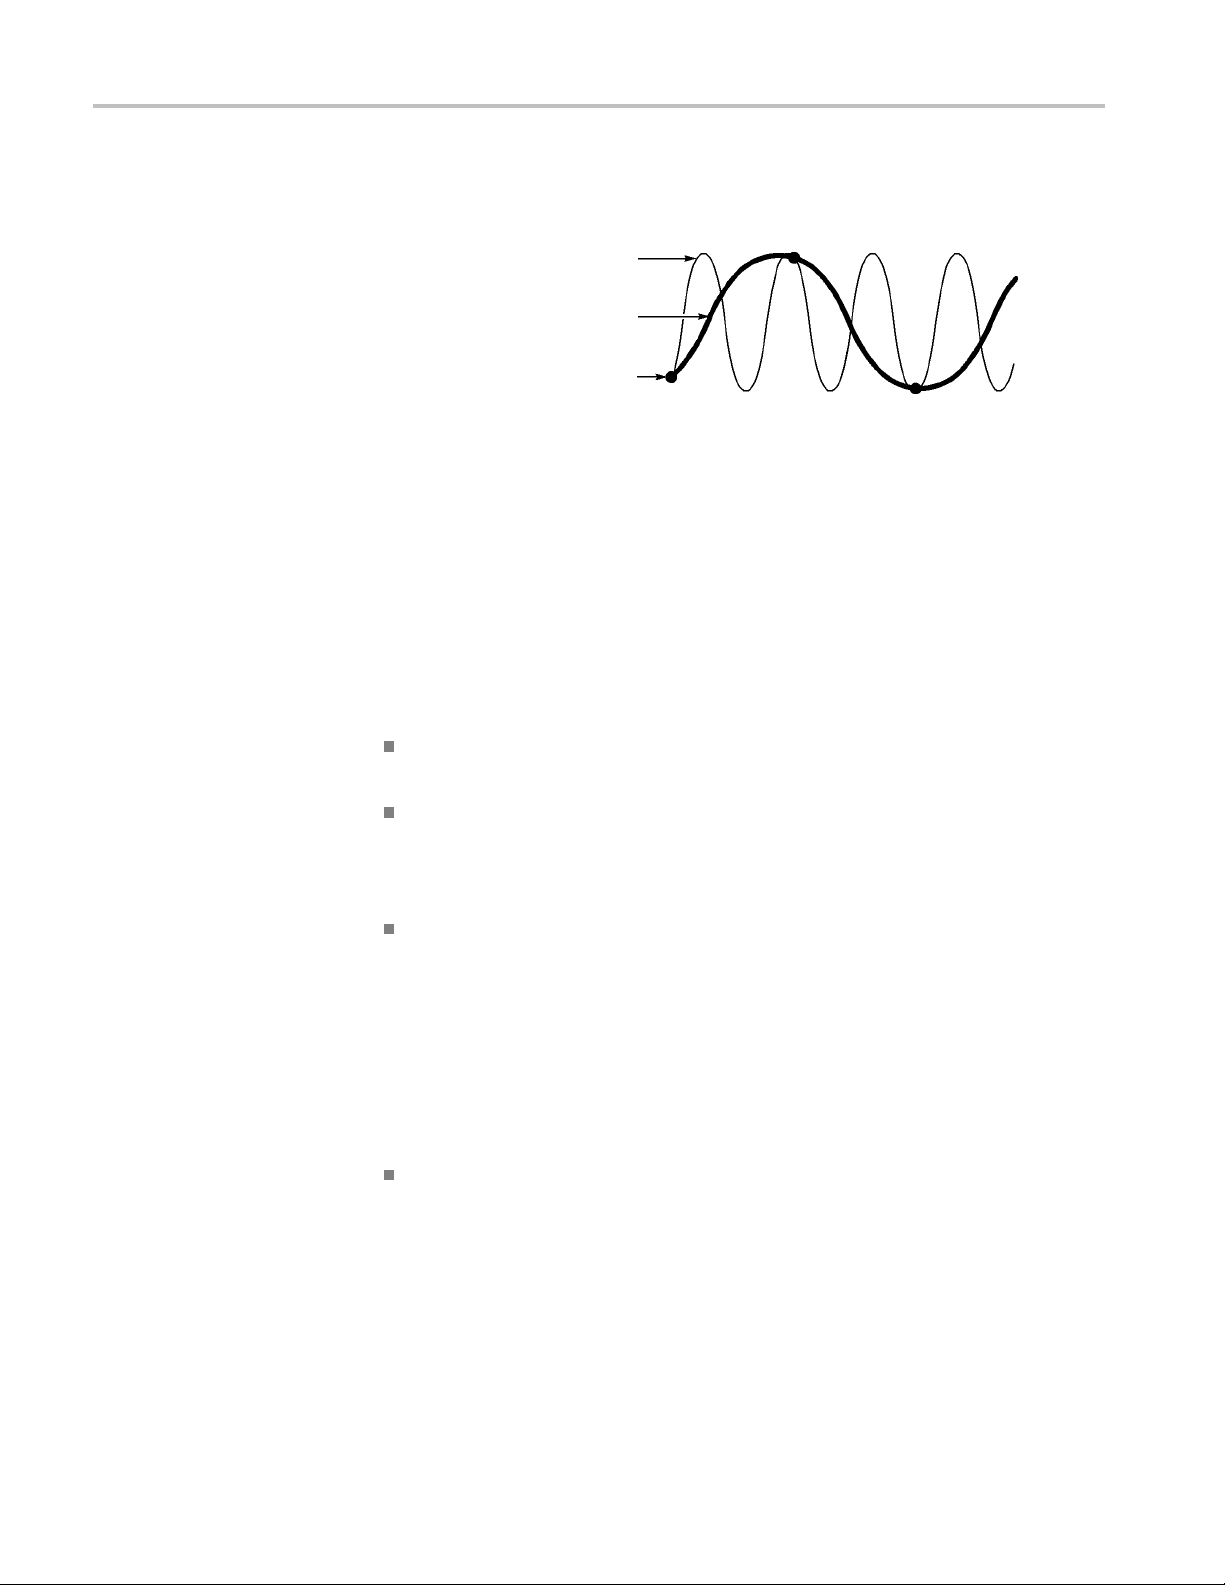
the oscillosco
pe displays a waveform with a frequency lower than the actual input
waveform, or triggers and displays an unstable waveform.
Actual high-frequ ency waveform
Apparent low-frequency
waveformduetoaliasing
Sample points
The oscilloscope accurately represents signals, but is limited by the probe
bandwidth, the oscilloscope bandwidth, and the sample rate. To avoid aliasing,
the oscilloscope must sample the signal more than twice as fast as the highest
frequency component of the signal.
The highest frequency that the oscilloscope sampling rate can theoretically
represent is the Nyquist frequency. The sample rate is called the Nyquist rate, and
is twice the Nyquist frequency.
The oscilloscope maximum sample rates are at least ten times the bandwidth.
These high sample rates help reduce the possibility of aliasing.
There are several ways to check for aliasing:
Turn the horizontal Scale knob to change the horizontal scale. If the shape of
the waveform changes drastically, you may have aliasing.
Select the Peak Detect acquisition mode. (See page 22, Peak Detect.) This
mode samples the highest and lowest values so that the oscilloscope can
detect faster signals. If the shape of the waveform changes drastically, you
may have aliasing.
If the trigger frequency is faster than the display information, you may have
aliasing or a waveform that crosses the trigger level multiple times. Examining
the waveform allows you to identify whether the shape of the signa
lisgoing
to allow a single trigger crossing per cycle at the selected trigger level.
If multiple triggers are likely to occur, select a trigger level that will generate
only a single trigger per cycle. If the trigger frequency is still faster than the
display indicates, you may have aliasing.
If the trigger frequency is slower, this test is not useful.
If the signal you are viewing is also the trigger source, use the graticule or the
cursors to estimate the frequency of the displayed waveform. Compare this to
the Trigger Frequency readout in the lower right corner of the screen. If they
differ by a large amount, you may have aliasing.
The next table lists the time base settings that you can use to avoid aliasing at
various frequencies and the respective sample rate. At the fastest horizontal scale
setting, aliasing is not likely to occur due to the bandwidth limitations of the
oscilloscope input amplifiers.
24 TBS1000 Series Oscilloscopes User Manual
Page 47

Understanding Oscilloscope Functions
Settings to avo
id aliasing in Sample mode
Time base Samples per second Maximum
5.0 to 250.0 ns
500.0 ns
1.0 μs
2.5 μs
5.0 μs
10.0 μs
25.0 μs
50.0 μs
100.0 μs
s
250.0 μ
s
500.0 μ
1.0 ms
s
2.5 m
s
5.0 m
0ms
10.
0ms
25.
.0 ms
50
0.0 ms
10
50.0 ms
2
00.0 ms
5
1.0 s
2.5 s
5.0 s
10.0 s
25.0 s
50.0 s
†
Bandwidthreducedto6MHzwithaP2220probesetto1X.
1GS/s
500.0 MS/s
250.0 MS/s
100.0 MS/s
50.0 MS/s
25.0 MS/s
10.0 MS/s
5.0 MS/s
2.5 MS/s
1.0 MS/s
500.0 kS/s
250.0 kS/s
100.0 kS/s
50.0 kS/s
25.0 kS/s
10.0 kS/s
5.0 kS/s
2.5 kS/s
1.0 kS/s
500.0 S/s
250.0 S/s
100.0 S/s
50.0 S/s
25.0 S/s
10.0 S/s
5.0 S/s
150.0 MHz
150.0 MHz
125.0 MHz
50.0 MHz
25.0 MHz
12.5 MHz
5.0 MHz
2.5 MHz
1.25 MHz
Hz
500.0 k
Hz
250.0 k
kHz
125.0
kHz
50.0
kHz
25.0
5kHz
12.
kHz
5.0
5kHz
2.
25 kHz
1.
00.0 Hz
5
50.0 Hz
2
125.0 Hz
50.0 Hz
25.0 Hz
12.5 Hz
5.0 Hz
2.5 Hz
†
†
†
†
†
†
Taking Measurements
The oscilloscope displays graphs of voltage versus time and can help you to
measure the displayed waveform.
There are several ways to take measurements. You can use the graticule, the
cursors, or an automated measurement.
Graticule
TBS1000 Series Oscilloscopes User Manual 25
This method allows you to make a quick, visual estimate. For example, you might
look at a waveform amplitude and determine that it is a little more than 100 mV.
Page 48
Understanding Oscilloscope Functions
Cursors
You c an ta ke si m
ple measurements by counting the major and minor graticule
divisions involved and multiplying by the scale factor.
Forexample,ifyoucountedfive major vertical graticule divisions between the
minimum and maximum values of a waveform and knew you had a scale factor of
100 mV/division, then you could calculate your peak-to-peak voltage as follows:
5 divisions x 100 mV/division = 500 mV
Cursor
This method allows you to take measurements by moving the cursors, which
always appear in pairs, and reading their numeric values from the display readouts.
There are two types of cursors: Amplitude and Time.
Automatic
When you use cursors, be sure to set the Source to the waveform on the display
that you want to measure.
To use cursors, push the Cursor button.
Amplitude Cursors. Amplitude cursors appear as horizontal lines on the display
and measure the vertical parameters. Amplitudes are referenced to the reference
level. For the Math FFT function, these cursors measure magnitude.
Time Cursors. Time cursors appear as vertical lines on the display and measure
both horizontal and vertical parameters. Times are referenced to the trigger point.
For the Math FFT function, these cursors measure frequency.
Time cursors also include a readout of the waveform amplitude at the point the
waveform crosses the cursor.
The Measure Menu can take up to five automatic measurements. When you
take automatic measurements, the oscilloscope does all the calculating for you.
Because the measurements use the waveform record points, they are more
accurate than the graticule or cursor measurements.
Automatic measurements use readouts to show measurement results. These
readouts are updated periodically as the oscilloscope acquires new data.
26 TBS1000 Series Oscilloscopes User Manual
Page 49

Understanding Oscilloscope Functions
For measuremen
Taking Measurements.)
t descriptions, refer to the Reference chapter. (See page 88,
TBS1000 Series Oscilloscopes User Manual 27
Page 50

Understanding Oscilloscope Functions
28 TBS1000 Series Oscilloscopes User Manual
Page 51

Application Examples
This section presents a series of application examples. These simplified examples
highlight the features of the oscilloscope and give you ideas for using it to solve
your own test problems.
Taking simple measurements
Using Autoset
Using the Measure Menu to take automatic measurements
Measuring
Using Autorange to examine a series of test points
Taking cursor measurements
Measuring ring frequency and ring amplitude
Measuring pulse width
Measuring rise time
Analyz
Looking at a noisy signal
Using the average function to separate a signal from noise
Capturing a single-shot signal
Optimizing the acquisition
Measuring propagation delay
ggering on a pulse width
Tri
Triggering on a video signal
Triggering on video fields and video lines
two signals and calculating gain
ing signal detail
Using the window function to see waveform details
Analyzing a differential communication signal using Math functions
Viewing impedance changes in a network using XY mode and persistence
Data logging
Limit testing
TBS1000 Series Oscilloscopes User Manual 29
Page 52

Application Examples
Taking Simple
Using Autoset
Measurements
You need to see a signal in a circuit, but you do not know the amplitude or
frequency of the signal. You want to quickly display the signal and measure the
frequency, p
To quickly display a signal, follow these steps:
1. Push the 1 (channel 1 menu) button.
eriod, and peak-to-peak amplitude.
2. Push Probe ► Vol t ag e ►Attenuation ► 10X.
3. If using P2220 probes, set their switches to 10X.
4. Conn
5. Push
The oscilloscope sets the vertical, horizontal, and trigger controls automatically.
If y
these controls.
NOTE. The oscilloscope displays relevant automatic measurements in the
waveform area of the screen based on the signal type that is detected.
For oscilloscope-specific descriptions, refer to the Reference chapter. (See
page 79, Autoset.)
ect the channel 1 probe tip to the s ignal. Connect the reference lead to
the circuit reference point.
the AutoSet button.
ou want to optimize the display of the waveform, you can manually adjust
30 TBS1000 Series Oscilloscopes User Manual
Page 53

Application Examples
Taking Automatic
Measurements
The oscillosco
NOTE. If a question mark (?) appears in the Value readout, the signal is outside
the measurement range. Adjust the Vertical Scale knob (volts/division) of the
appropriate channel to decrease the sensitivity or change the horizontal Scale
setting (seconds/division).
To measure signal frequency, period, and peak-to-peak amplitude, rise time, and
positive w
1. Push the Measure button to see the Measure Menu.
2. Push the top option button; the Measure 1 Menu appears.
3. Push Ty pe ► Freq.
The Val ue readout displays the m easurement and updates.
4. Push the Back option button.
5. Push th
6. Push Ty pe ► Period.
The Val ue readout displays the m easurement and updates.
pe can take automatic measurements of most displayed signals.
idth, follow these steps:
e second option button from the top; the Measure 2 Menu appears.
7. Push the Back option button.
8. Push the middle option button; the Measure 3 Menu appears.
9. Push Ty pe ► Pk-Pk.
Val u e readout displays the measurement and updates.
The
10. Push the Back option button.
11. Push the second option button from the bottom; the Measure 4 Menu appears.
12. Push Type ► Rise Time.
The Val ue readout displays the m easurement and updates.
13. Push the Back option button.
14. Push the bottom option button; the Measure 5 Menu appears.
15. Push Type ► Pos Width.
The Val ue readout displays the m easurement and updates.
16. Push the Back option button.
TBS1000 Series Oscilloscopes User Manual 31
Page 54

Application Examples
CH1
Freq
1.000kHz
CH1
Period
1.000ms
CH1
Pk-Pk
5.04V
CH1
Rise Time
2.611µs?
CH1
Pos Width
500.0µs
32 TBS1000 Series Oscilloscopes User Manual
Page 55

Application Examples
Measuring Two Signals
If you are testi
ng a piece of equipment and need to measure the gain of the audio
amplifier, you will need an audio generator that can inject a test signal at the
amplifier input. Connect two oscilloscope channels to the amplifier input and
output as shown next. Measure both signal levels and use the measurements to
calculate the gain.
CH1
Pk-Pk
2.04V
CH2
Pk-Pk
206mV
CH1
None
CH1
None
CH1
None
To activate and display the signals connected to channel 1 and to channel 2, and
select measurements for the two channels, follow these steps:
1. Push the AutoSet button.
2. Push the Measure button to see the Measure Menu.
3. Push the top option button; the Measure 1 Menu appear
s.
4. Push Source ► CH1.
5. Push Ty pe ► Pk-Pk.
6. Push the Back option button.
TBS1000 Series Oscilloscopes User Manual 33
Page 56

Application Examples
7. Push the second
option button from the top; the Measure 2 Menu appears.
8. Push Source ► CH2.
9. Push Ty p e ► Pk-Pk.
10. Push the Back option button.
Read the displayed peak-to-peak amplitudes for both channels.
11. To calculate the amplifier voltage gain, use these equations:
VoltageGa
VoltageGain (dB) = 20 × log
in = output amplitude/input amplitude
(VoltageGain)
10
34 TBS1000 Series Oscilloscopes User Manual
Page 57

Application Examples
Using Autoran
ge to Examine a Series of Test Points
If you have a machine that is malfunctioning, you may need to find the frequency
and RMS voltage of several test points, and compare these values to ideal va l ues.
You ar e n ot ab
when probing test points that are difficult to physically reach.
1. Push the 1 (c
2. Push Probe ► Vo lta g e ► Attenuation and set to match the attenuation
of the prob
3. Push the AutoRange button to activate autoranging, and select the Ver tic a l
and Horiz
4. Push the Measure button to see the Measure Menu.
5. Push the top option button; the Measure 1 Menu appears.
6. Push Source ► CH1.
7. Push Ty p e ► Frequency.
8. Push the Back option button.
9. Push t
le to access front-panel controls since you need to use both hands
hannel 1 menu) button.
e attached to channel 1.
ontal option.
he second option button from the top; the Measure 2 Menu appears.
10. Push Source ► CH1.
11. Push Type ► Cyc RMS.
12. Push the Back option button.
13. Attach the probe tip and reference lead to the first test point. Read the
frequency and cycle RMS measurements from the oscilloscope display and
compare these to the ideal values.
14. Repeat step 13 for each test point, until you find the m alfunctioning
component.
NOTE. When Autorange is active, each time you move the probe to another test
point, the oscilloscope readjusts the horizontal scale, the vertical scale, and the
trigger level, to give you a useful display.
TBS1000 Series Oscilloscopes User Manual 35
Page 58

Application Examples
Taking Cursor
Measuring Ri
ng Frequency
and Amplitude
Measurements
You can use the cursors to quickly take time and amplitude measurements on
a w aveform.
To measure the ring frequency at the rising edge of a signal, follow these steps:
1. Push the Cursor button to see the Cursor Menu.
2. Push Ty pe ► Time.
3. Push Sourc
4. Push the Cursor 1 option button.
5. Turn the multipurpose knob to place a cursor on the first peak of the ring.
6. Push the Cursor 2 option button.
7. Turn the multipurpose knob to place a cursor on the second peak of the ring.
You can see the Δ (delta) time and frequency (the measured ring frequency)
in the Cursor Menu.
e ► CH1.
Type
Time
Source
CH1
Δt 540.0ns
1/Δt 1.852MHz
ΔV0.44V
Cursor1
180ns
1.40V
Cursor2
720ns
0.96V
8. Push Ty p e ► Amplitude.
9. Push the Cursor 1 option button.
urn the multipurpose knob to place a cursor on the first peak of the ring.
10.T
11. Push the Cursor 2 option button.
12. Turn the multipurpose knob to place Cursor 2 on the lowest part of the ring.
You can see the amplitude of the ring in the Cursor Menu.
36 TBS1000 Series Oscilloscopes User Manual
Page 59

Type
Amplitude
Source
CH1
ΔV 640mV
Cursor 1
1.46V
Cursor 2
820mV
Application Examples
Measuring Pulse Width
If you are analyzing a pulse waveform and you want to know the width of the
pulse, follow these steps:
1. Push the Cursor button to see the Cursor Menu.
2. Push Ty pe ► Time.
3. Push Sou
rce ► CH1.
4. Push the Cursor 1 option button.
5. Turn the multipurpose knob to place a cursor on the rising edge of the pulse.
6. Push the Cursor 2 option button.
7. Turn the multipurpose knob to place a cursor on the falling edge of the pulse.
You can see the following measurements in the Cursor Menu:
ime at Cursor 1, relative to the trigger.
The t
The time at Cursor 2, relative to the trigger.
The Δ (delta) time, which is the pulse width measurement.
TBS1000 Series Oscilloscopes User Manual 37
Page 60
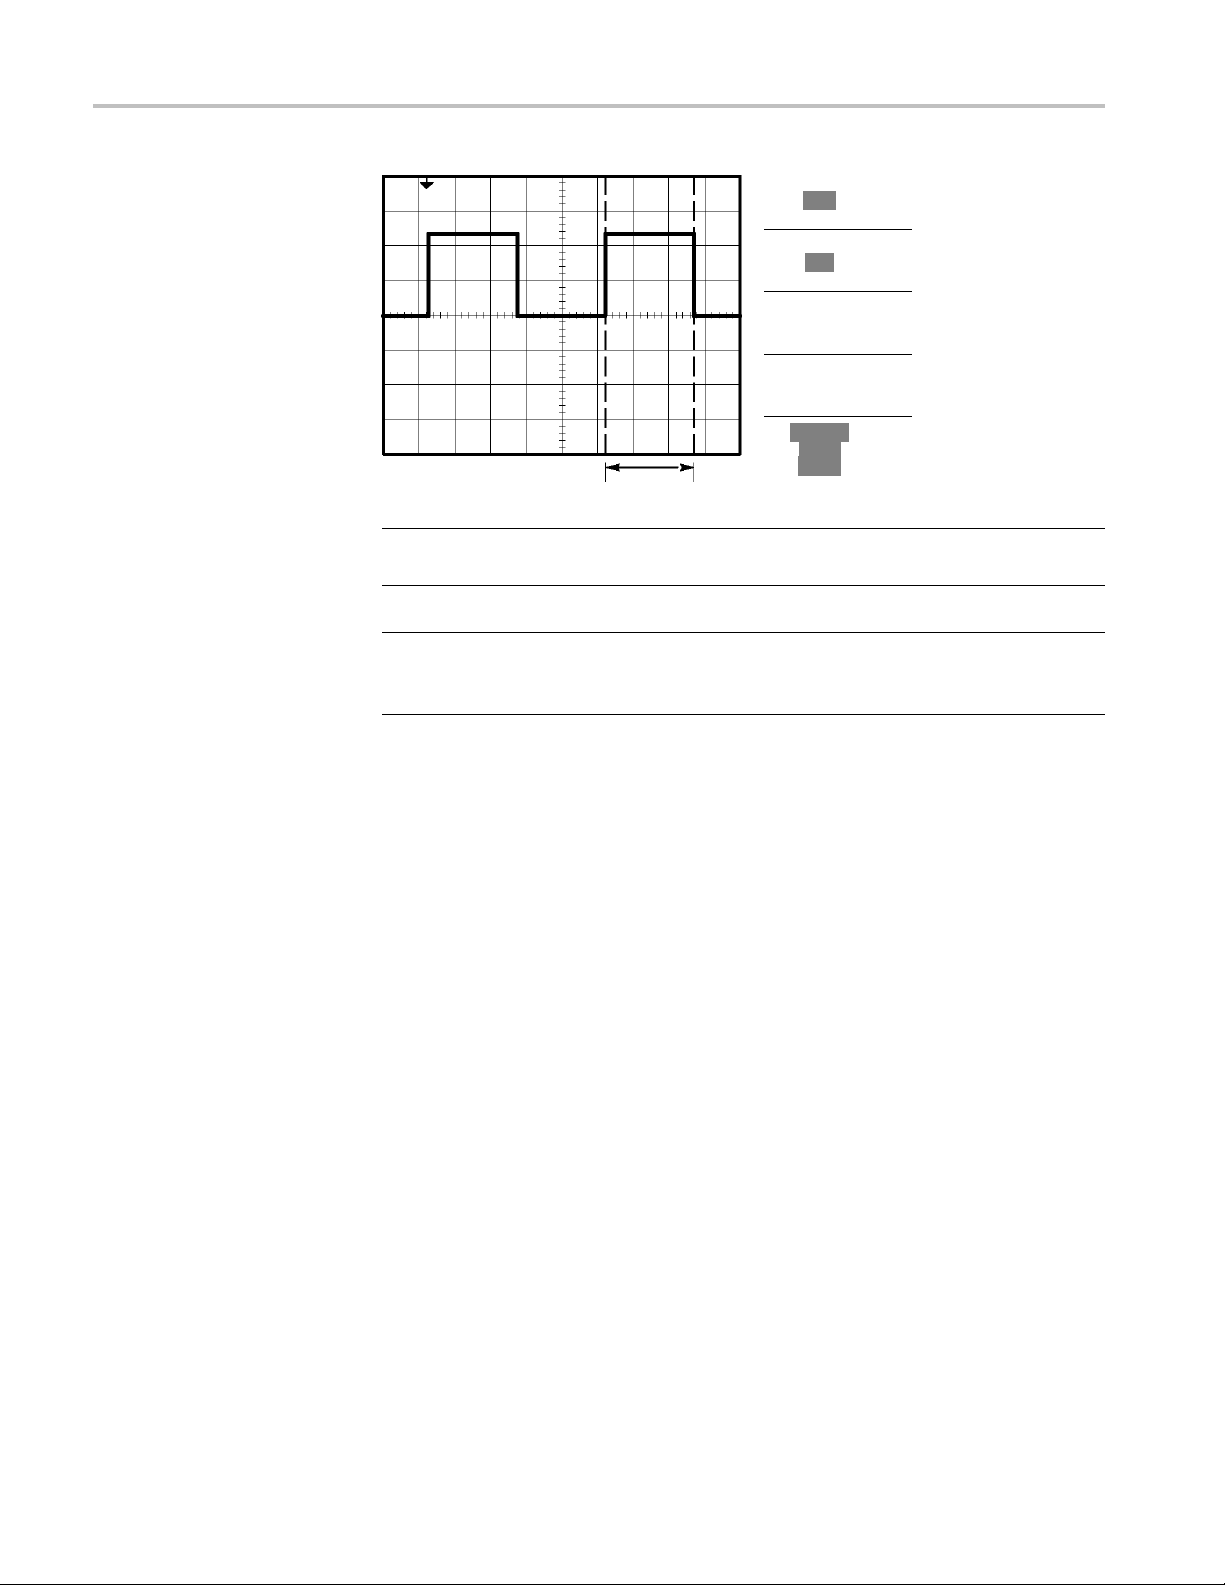
Application Examples
Type
Time
Source
CH1
Δt 500.0µs
1/Δt 2.000kHz
ΔV1.38V
Cursor 1
0.00s
0.98V
Cursor 2
500µs
-1.00V
Measuring Rise Time
NOTE. The P
ositive Width measurement is available as an automatic measurement
in the Measure Menu. (See page 88, Taking Measurements.)
NOTE. The
Positive Width measurement also displays when you select the
Single-Cycle Square option in the AutoSet Menu. (See page 81, Square Wave
or Pulse.)
After m
easuring the pulse width, you decide that you need to check the rise time
of the pulse. Typically, you measure rise time between the 10% and 90% levels of
the waveform. To measure the rise time, follow these steps:
1. Turn the Horizontal Scale (seconds/division) knob to display the rising edge
of the waveform.
2. Turn the Ve r tic al S cal e (volts/division) and Vertical Position knobs to set
the waveform amplitude to about five divisions.
3. Push the 1 (channel 1 menu) button.
4. Pus
h Vo lts /D iv ► Fine.
5. Turn the Ver tic a l S c ale (volts/division) knob to set the waveform amplitude
exactly five divisions.
to
6. Turn the Vertical Position knob to center the waveform; position the baseline
f the waveform 2.5 divisions below the center graticule.
o
7. Push the Cursor button to see the Cursor Menu.
8. Push Ty pe ► Time.
9. Push Source ► CH1.
10. Push the Cursor 1 option button.
38 TBS1000 Series Oscilloscopes User Manual
Page 61
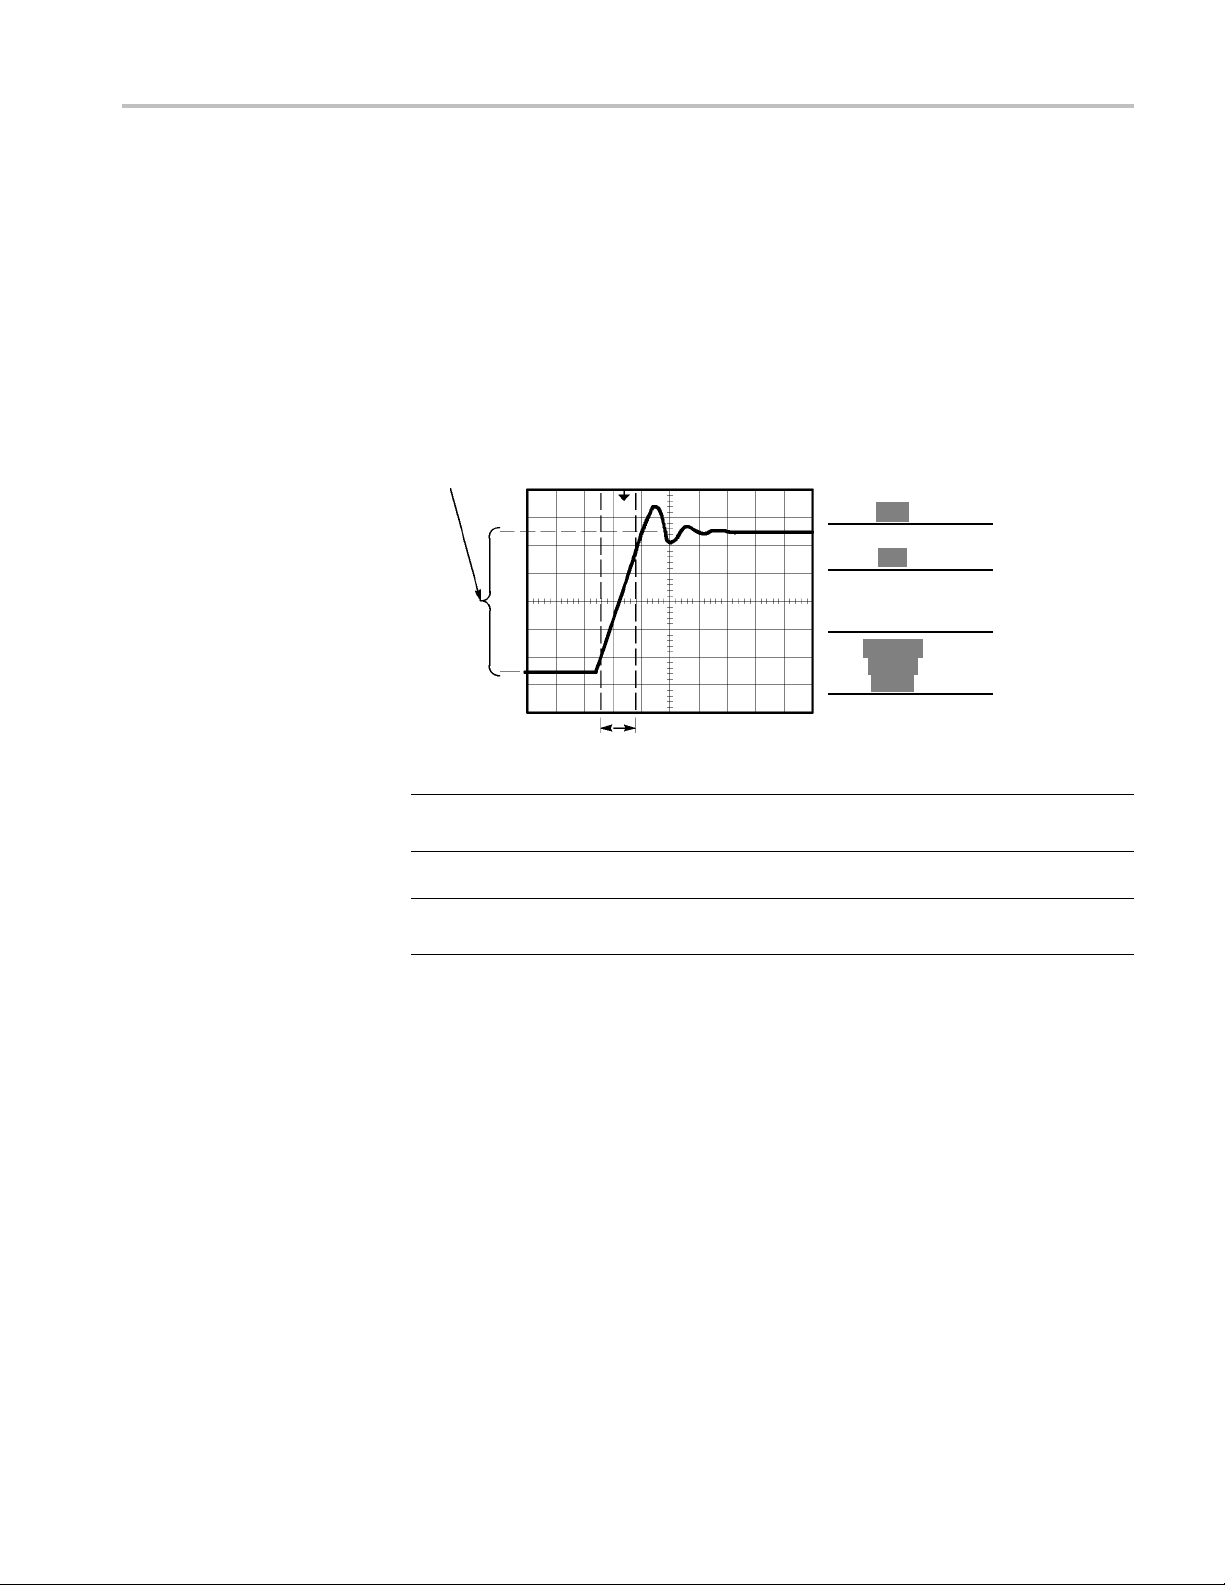
Application Examples
11. Turn the multip
urpose knob to place a cursor at the point where the waveform
crosses the se cond graticule line below center screen. This is the 10% level
of the waveform.
12. Push the Cursor 2 option button.
13. Turn the mul
tipurpose knob to place a cursor at the point where the waveform
crosses the second graticule line above center screen. This is the 90% level
of the waveform.
The Δt readout in the Cursor Menu is the rise time of the waveform.
5 divisions
Type
Time
Source
CH1
Δt 140.0ns
1/Δt 7.143MHz
ΔV 2.08V
Cursor 1
-80.0ns
-1.02V
Cursor 2
60.0ns
1.06V
NOTE. The Rise Time measurement is available as an automatic measurement in
the Measure Menu. (See page 88, Taking M easurements.)
NOTE. The Rise Time measurement also displays when you select the Rising Edge
option in the AutoSet Menu. (See page 81, Square Wave or Pulse.)
TBS1000 Series Oscilloscopes User Manual 39
Page 62

Application Examples
Analyzing Sig
nal Detail
Looking at a Noisy S ignal
You have a noisy signal displayed on the oscilloscope and you need to know more
about it. You suspect that the signal contains much more detail than you can
now see in the
The signal appears noisy and you suspect that noise is causing problems in y our
circuit. To better analyze the noise, follow these steps:
1. Push the Acquire button to see the Acquire Menu.
2. Push the Peak Detect option button.
display.
Separating the Signal f rom
Noise
Peak detect emphasizes noise spikes and glitches in your signal, especially when
the time base is set to a slow setting.
Now you want to analyze the signal shape and ignore the noise. To reduce random
noise in the oscilloscope display, follow these steps:
1. Push the Acquire button to see the Acquire Menu.
2. Push the Average option button.
3. Push the Averages option button to see the effects of varying the number of
running averages on the waveform display.
40 TBS1000 Series Oscilloscopes User Manual
Page 63

Application Examples
Avera ging redu
the example below, a ring shows on the rising and falling edges of the signal when
the noise is removed.
Capturing a Single-Shot Signal
The reli
to investigate the problem. You suspect that the relay contacts arc when the relay
opens. The fastest that you can open and close the relay is about once per minute,
so you need to capture the voltage across the relay as a single-shot acquisition.
ability of a reed relay in a piece of equipment has been poor and you need
ces random noise and makes it easier to see detail in a signal. In
To set up for a single-shot acquisition, follow these steps:
1. Turn the Vertical Scale (volts/division) and Horizontal Scale
(seconds/division) knobs to the appropriate ranges for the signal you expect to
see.
2. Push the Acquire button to see the Acquire Menu.
3. Push the Peak De tect option button.
4. Pus
5. Push Slope ► Rising.
6. Turn the Level knob to adjust the trigger level to a voltage midway between
7. Push the Single button to start the acquisition.
When the relay opens, the oscilloscope triggers and captures the event.
htheTrig Menu button to see the Trigger Menu.
the open and closed voltages of the relay.
TBS1000 Series Oscilloscopes User Manual 41
Page 64
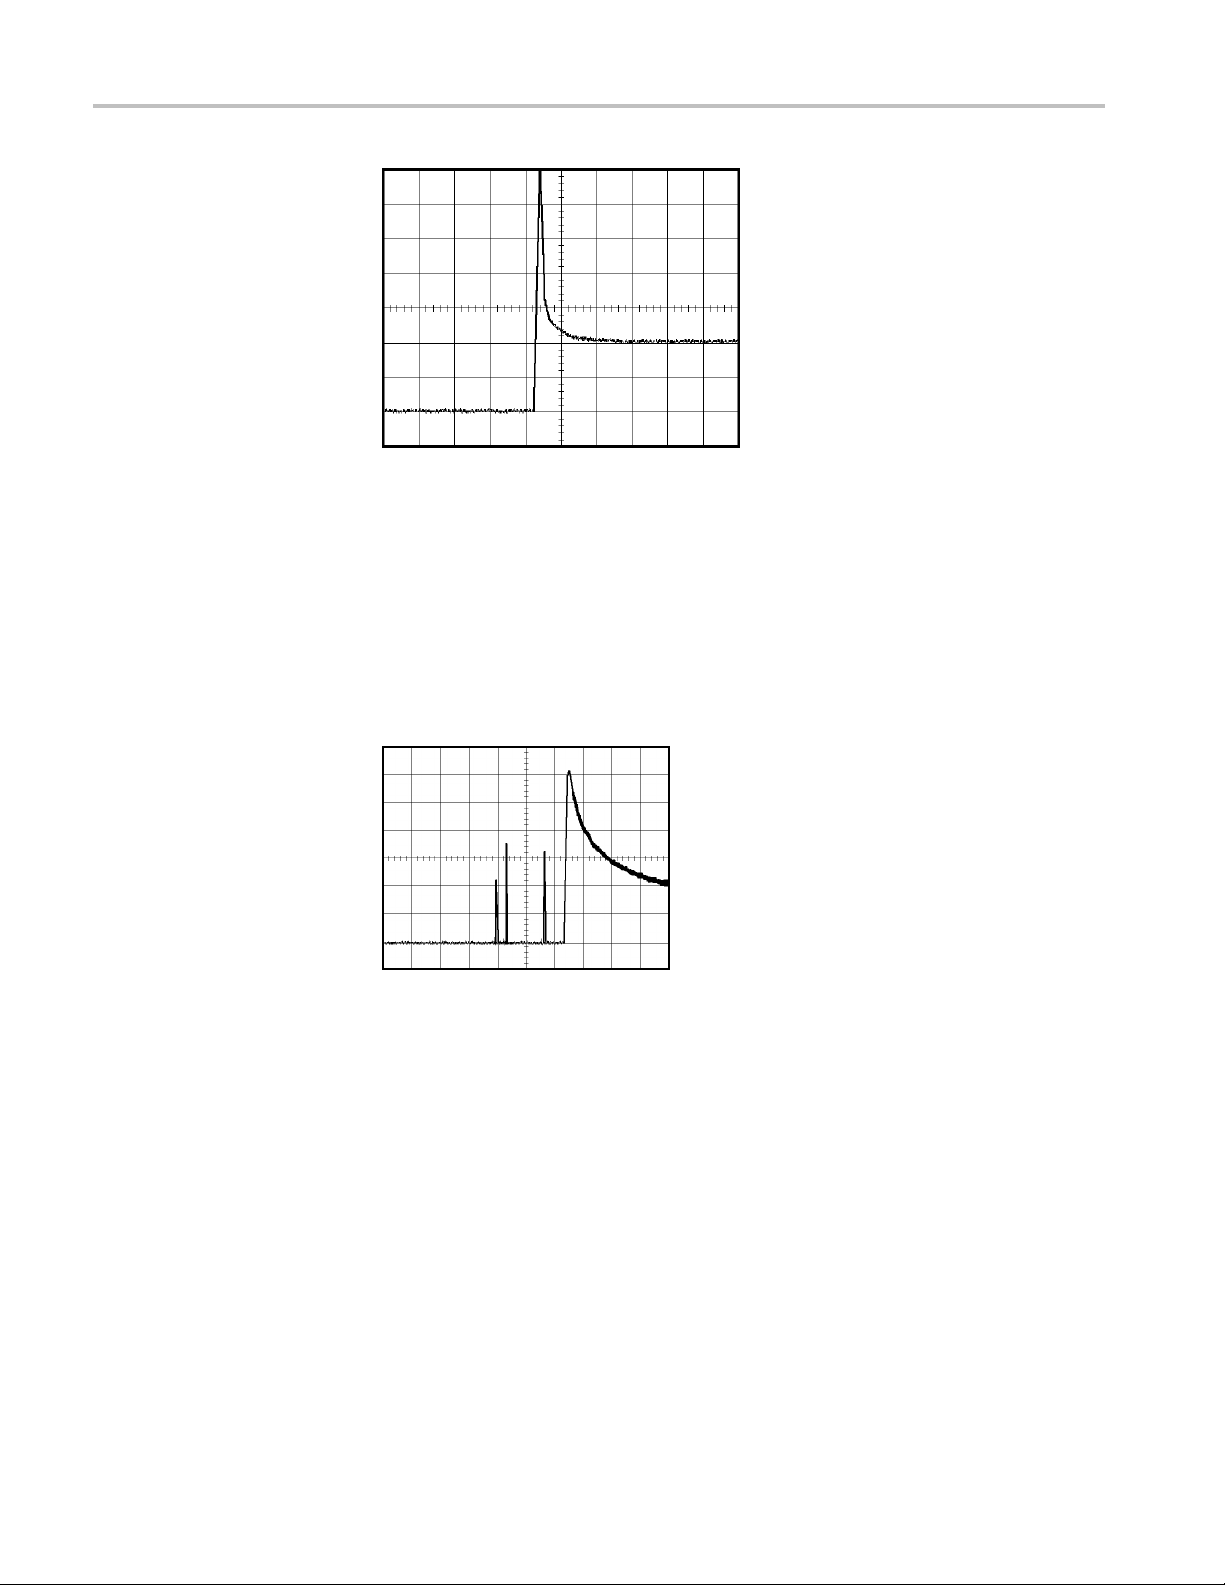
Application Examples
Optimizing the Acquisition
The initial acquisition shows the relay contact beginning to open at the trigger
point. Thi
inductance in the c ircuit. The inductance can cause contac t arcing and premature
relay failure.
You can use the vertical, horizontal, and trigger controls to optimize the settings
before the next single-shot event is captured. When the next acquisition is
captured with the new settings (push the Single button again), you can see that the
contact bounces several times as it opens.
s is followed by a large spike that indicates contact bounce and
42 TBS1000 Series Oscilloscopes User Manual
Page 65

Measuring Propagation Delay
You suspect that the memory timing in a microprocessor circuit is marginal. Set
up the oscilloscope to measure the propagation delay between the chip-select
signal and the data output of the memory device.
Application Examples
Type
Time
Source
CH1
Δt 20.00ns
1/Δt50.00MHz
ΔV 0.28V
Cursor 1
50.0ns
-0.20V
Cursor 2
70.0ns
0.08V
To set up to measure propagation delay, follow these steps:
1. Push the AutoSet button to trigger a stable display.
2. Adjust the horizontal and vertical controls to optimize the display.
3. Push the Cursor button to see the Cursor Menu.
4. Push Ty pe ► Time.
5. Push Source ► CH1.
6. Push the Cursor 1 option button.
7. Turn the multipurpose knob to place a cursor on the active edge of the
chip-select signal.
TBS1000 Series Oscilloscopes User Manual 43
Page 66
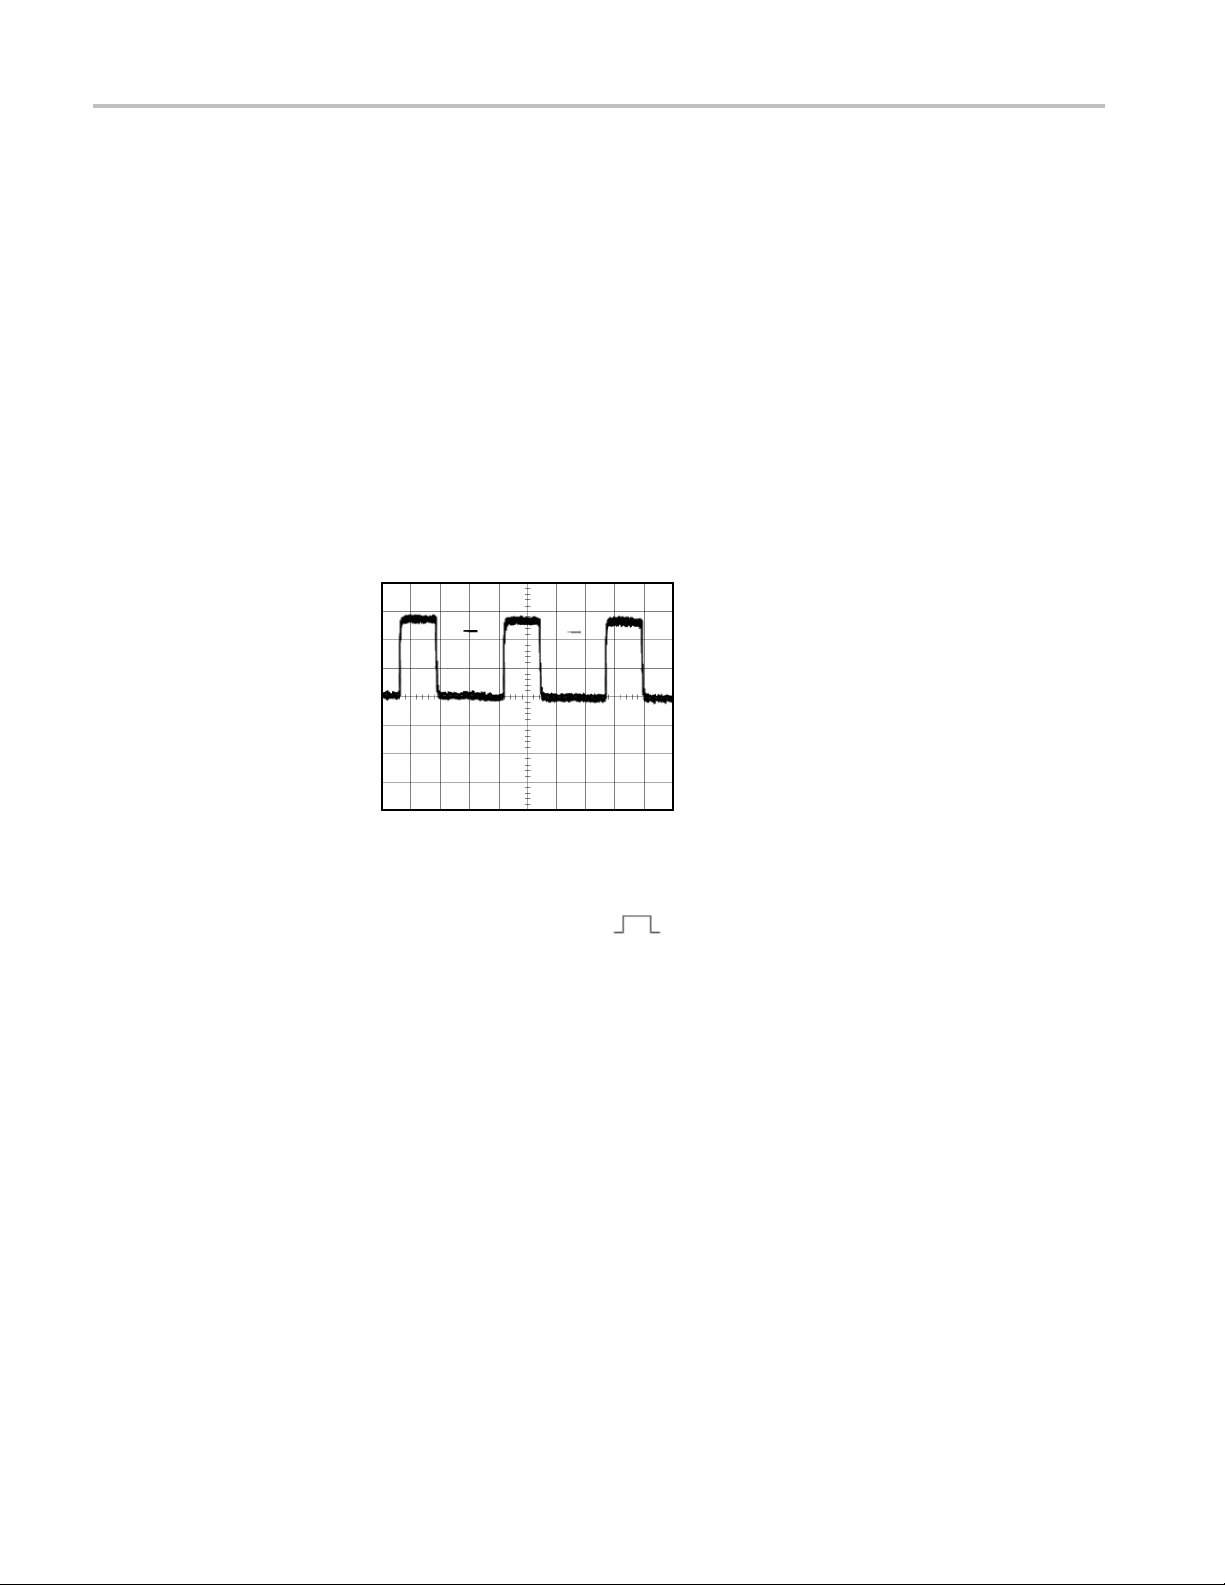
Application Examples
8. Push the Cursor
9. Turn the multipurpose knob to place the second cursor on the data output
transition.
The Δt readout in the Cursor Menu is the p ropagation delay between the
waveforms.
horizontal scale (seconds/division) setting.
The readout is valid because the two waveforms have the same
Triggering on a Specific Pulse Width
You are testing the pulse widths of a signal in a circuit. It is critical that the pulses
all be a specific width, and you need to verify that they are. Edge triggering shows
that your signal is as specified, and the pulse width measurement does not vary
from the specification. However, you think there might be a problem.
2 option button.
To set up a test for pulse width aberrations, follow these steps:
1. Push
2. Push the single cycle
3. Push the Tr ig Menu button to see the Trigger Menu.
4. Push Ty pe ► Pulse.
5. Push Source ► CH1.
6. Turn the trigger Level knob to set the trigger level near the bottom of the
7. Push When ► = (equals).
8. Turn the multipurpose knob to set the pulse width to the value reported by the
9. Push More ► Mode ► Normal.
You can achieve a stable display with the oscilloscope triggering on normal pulses.
the AutoSet button to trigger a stable display.
option button in the AutoSet Menu to view a
single cycle of the signal, and to quickly take a Pulse Width measurement.
signal.
Pulse Width measurement in step 2.
44 TBS1000 Series Oscilloscopes User Manual
Page 67

Application Examples
1. Push the When op
pulses that meet the specified When condition, the oscilloscope triggers.
NOTE. The trigger frequency readout shows the frequency of events that the
oscilloscope might consider to be a trigger, and may be less than the frequency of
the input signal in Pulse Width trigger mode.
Triggering on a Video Signal
You are testing the video circuit in a piece of medical equipment and need to
y the video output signal. The video output is an NTSC standard signal. Use
displa
the video trigger to obtain a stable display.
tion button to select ≠, <,or>. If there are any aberrant
TBS1000 Series Oscilloscopes User Manual 45
Page 68

Application Examples
Trigger
ingonVideoFields
NOTE. Most v
properly terminate low impedance cabling. To avoid amplitude inaccuracy
from improper loading and reflections, place a 75 ohm feedthrough terminator
(Tektronix part number 011-0055-02 or equivalent) between the 75 ohm coaxial
cable from the signal source and the oscilloscope BNC input.
Automat
1. Push the AutoSet button. When Autoset is complete, the oscilloscope
displa
The oscilloscope sets the Standard option when you use the Autoset function.
1. Push the Odd Field or Even Field option buttons from the AutoSet Menu
to sync on odd or even fields only.
Manual. An alternative method requires more steps, but may be necessary
depending on the video signal. To use the manual method, follow these steps:
1. Push the 1 (channel 1 menu) button.
2. Pus
3. Push the Tr ig Menu button to see the Trigger Menu.
ideo systems use 75 ohm cabling. The oscilloscope inputs do not
ic. To trigger on the video fields, follow these steps:
ys the video signal with sync on All Fields.
h Coupling ► AC.
4. Push the top option button and select Video.
5. Push Source ► CH1.
6. Push the Sync option button and select All Fields, Odd Field,orEven Field.
7. Push Standard ► NTSC.
8. Turn the Horizontal Scale (seconds/division) knob to see a complete field
across the screen.
9. Turn the Ve r ti cal S cal e (volts/division) knob to ensure that the entire video
signal is visible on the screen.
46 TBS1000 Series Oscilloscopes User Manual
Page 69

Application Examples
Triggering on V
ideo Lines
Automatic. You
can also look at the video lines in the fi eld. To trigger on the
video lines, follow these steps:
1. Push the AutoS
et button.
2. Push the top option button to select Line to sync on all lines. (The AutoSet
Menu includ
es All Lines and Line Number options.)
Manual. An alterna tive method requires more steps, but may be necessary
depending on the video signal. To use this method, follow these steps:
1. Push the Tr ig Men u button to see the Trigger Menu.
2. Push the top option button and select Video.
3. Push the S
ync option button and select All Lines or Line Number and turn
the multipurpose knob to set a specific line number.
4. Push Sta
ndard ► NTSC.
5. Turn the Horizontal Scale (seconds/division) knob to see a complete video
ross the screen.
line ac
6. Turn the Ve rt i ca l S ca l e (volts/division) knob to ensure that the entire video
l is visible on the screen.
signa
Incoming video signal
TBS1000 Series Oscilloscopes User Manual 47
Page 70

Application Examples
Using the Window
Function to See Waveform
Details
You c an u se th e w
waveform without changing the main display.
Ifyouwanttov
without changing the main display, follow these steps:
1. Push the Hor
2. Push the Window Zone option button.
3. Turn the horizontal Scale (seconds/division) knob and select 500 ns. This will
be the seconds/division setting of the expanded view.
4. Turn the horizontal Position knob to position the window around the portion
of the waveform that you want to expand.
indow (zoom) function to examine a specific portion of a
iew the color burst in the previous waveform in more detail
iz button to see the Horizontal Menu and select the Main option.
1. Push the Window option button to see the expanded portion of the waveform.
2. Turn the horizontal Scale (seconds/division) knob to optimize viewing the
expanded waveform.
To switch between the Main and Window views, push the Main or Window
option button in the Horizontal Menu.
48 TBS1000 Series Oscilloscopes User Manual
Page 71

Application Examples
Analyzing a Di
fferential Communication Signal
You are having intermittent problems with a serial data communication link, and
you suspect poor signal quality. Set up the oscilloscope to show you a snapshot of
the serial da
Because this is a differential signal, you use the Math function of the oscilloscope
to view a bet
ta stream so you can verify the signal levels and transition times.
ter representation of the waveform.
NOTE. Be sure to first compensate both probes. Differences in probe
compensation appear as errors in the d ifferential signal.
To activate the differential signals connected to channel 1 and to channel 2,
follow the se steps:
1. Push the 1 (channel 1 menu) button and set the Probe ► Vo lta ge ►
Attenuation option to 10X.
2. Push the 2 (channel 2 menu) button and set the Probe ► Vo lta ge ►
Attenuation option to 10X.
3. If using P2220 probes, set their switches to 10X.
4. Push the AutoSet button.
5. Push the Math button to see the Math Menu.
TBS1000 Series Oscilloscopes User Manual 49
Page 72

Application Examples
6. Push the Operat
7. Push the CH1-CH2 option button to display a new waveform that is the
difference be
8. To adjust the vertical scale and position of the Math waveform, follow these
steps:
a. Remove the channel 1 and channel 2 waveforms from the display.
b. Turn the channel 1 and channel 2 Vertical Scale and Vertical Position
knobs to adjust the vertical scale and position of the Math waveform.
For a more stable display, push the Single button to control the acquisition of
the waveform. Each time you push the Single button, the oscilloscope acquires
a snapsho
measurements to analyze the waveform, or you can store the waveform to analyze
later.
t of the digital data s tream. You can use the cursors or automatic
ion option button and select -.
tween the displayed waveforms.
Viewing Impedance Changes in a Network
You have designed a circuit that needs to operate over a wide temperature range.
You need to evaluate the change in impedance of the circuit as the ambient
temperature is changed.
Connect the oscilloscope to monitor the input and output of the circuit and capture
the changes that occur as you vary the temperature.
50 TBS1000 Series Oscilloscopes User Manual
Page 73

Application Examples
To view the input and output of the circuit in an XY display, follow th
1. Push the 1 (channel 1 menu) button.
2. Push Probe ► Voltage ►Attenuation ► 10X.
3. Push the 2 (channel 2 menu) button.
4. Push Probe ► Vol ta g e ► Attenuation ► 10X.
5. If using P2220 probes, set their switches to 10X.
6. Connect the c hannel 1 probe to the input of the network, and connect the
channel 2 probe to the output.
7. Push the AutoSet button.
8. Turn the Vertical Scale (volts/division) knobs to display a pproximately the
same amplitude signals on each channel.
9. Push the Display but
10. Push Format ► XY.
The oscilloscope displays a Lissajous pattern representing the input and
output characteristics of the circuit.
ton to see the Display Menu.
ese steps:
TBS1000 Series Oscilloscopes User Manual 51
Page 74

Application Examples
Data Logging
11. Turn the vertic
12. Push Persist ► Infinite.
As you adjus t the ambient temperature, the display persistence captures the
changes in the characteristics of the circuit.
You want to use the oscilloscope to record data from a source over time. You
can configu
triggered waveform together with timing information over a defined time duration
to a USB memory device.
1. Configure the oscilloscope to use the desired trigger conditions to collect the
data. Also, insert a USB memory device in the front-panel USB port.
2. Push the front-panel Utility button.
3. Select
logging menu.
4. Push Da
logging feature. When the feature is enabled but not yet triggering, the
oscilloscope will display a “Data Logging – Waiting for trigger” message.
re the trigger conditions and direct the oscilloscope to save all the
Data Logging from the resulting side menu to bring up the data
al Scale and vertical Position knobs to optimize the display.
ta Logging from the side menu to select On. This enables the data
Before turning on the data logging feature, you must first select the source, the
time duration, and the folder.
5. Push the Source button to select the signal source to log data from. You can
use either one of the input channels or the Math waveform.
6. Push the Duration button as many times as needed or use the multipurpose
knob to select the duration for data logging. The selections range from 0.5
hour to 8 hours in 30 minute increments and from 8 hours to 24 hours in
60 minute increments. You can select Infinite to run data logging with no
set time limit.
7. Push the Select Folder buttontodefine where to store the collected
information. The resulting menu choices will let you either select an existing
folder or define a new folder. When done, push Back to return to the main
data logging menu
8. Start the data acquisition, such as by pushing either the front-panel Single
or Run/Stop button.
9. When the oscilloscope finishes the requested data logging operation, it
displays a “Data logging completed” messageandturnsoffthedatalogging
feature.
52 TBS1000 Series Oscilloscopes User Manual
Page 75

Limit Testing
Application Examples
You want to use the oscilloscope to monitor an active input signal against a
template and to output pass or fail results by judging whether the input signal
is within the bounds of the template.
1. Push the front-panel Utility button.
2. Select Limit Test from the resulting side menu to bring up the limit testing
menu.
3. Select Source from the side menu to define the source of the waveform to
compare against the limit test template.
4. Select Compare To to specify the limit test template against which to
compare test signals sectioned with the Source menu item.
5. Push Template Setup from the side menu to define the boundary to compare
with the input source signals. You can create the template from internal or
external waveforms with specifi c horizontal and vertical tolerances. You can
also create them from previously saved template settings.
On the resulting side menu,
Push Source to set the location of the signal source used to create the limit
test template.
Push V Limit and turn the multipurpose knob to set the vertical limitation
value, in vertical divisions, by which you can vary the source waveform
vertically when you create the test template.
Push H Limit and turn the multipurpose knob to set the horizontal limitation
value, in horizontal divisions, by which you can vary the source waveform
rizontally when you create the test template.
ho
Push Apply Template to store the template waveform to the reference channel
elected in the Destination menu.
s
Push Destination to set the location of the reference memory location used to
tore the limit test template.
s
Push Display Template and toggle between On and Off to display or not a
stored template.
6. Push the Action on Violation button and select an action from the resulting
menu to describe what the oscilloscope will do after it detects a violation. You
can select between Save Waveform and Save Image.
7. Push the Stop After button and toggle the resulting button with the same
name to define the conditions that will stop limit testing. Select Waveforms,
Violations,orTime and use the multipurpose knob to set the desired number
TBS1000 Series Oscilloscopes User Manual 53
Page 76

Application Examples
of waveforms, n
You can also choose to stop the testing manually.
8. Push the Run/S
test. After you end the test, the oscilloscope will display the test statistics on
the screen. This includes the number of cases tested, the number of cases
passed, and the number of cases failed.
umber of violations, or the time in seconds at which to stop.
top Test button to toggle between starting and ending the limit
54 TBS1000 Series Oscilloscopes User Manual
Page 77

Math FFT
This chapter contains detailed information o n how to use the Math FFT (Fast
Fourier Transform). You can use the FFT Math mode to convert a time-domain
(YT) signal into its frequency components (spectrum). You can use the Math FFT
mode for the following types of analysis:
Analyze harmonics in power lines
Measure harmonic content and d istortion in systems
Characterize noise in DC power supplies
Test impulse response of filters and s ystems
Analyze v
To use the Math FFT mode, you need to perform the following tasks:
Set up the source (time-domain) waveform
Display the FFT spectrum
Select a type of FFT window
Adjust the sample rate to display the fundamental frequency and harmonics
without aliasing
Use zoom controls to magnify the spectrum
Use c
ibration
ursors to measure the spectrum
SettingUptheTime-DomainWaveform
ore you use FFT mode, you need to set up the time-domain (YT) waveform.
Bef
To do so, follow these steps:
sh AutoSet to display a YT waveform.
1. Pu
2. Turn the vertical Position knob to move the YT waveform to the center
ertically (zero divisions).
v
This ensures that the FFT will show a true DC value.
3. Turn the Horizontal Position knob to position the part of the YT waveform
that you want to analyze in the center eight divisions of the screen.
The oscilloscope calculates the FFT spectrum using the center 2048 points of
the time-domain waveform.
TBS1000 Series Oscilloscopes User Manual 55
Page 78

Math FFT
4. Turn the Ve r tic
waveform remains on the screen. The oscilloscope may display erroneous
FFT results (by adding high frequency components) if the entire waveform is
not visible.
5. Turn the Horizontal Scale (seconds/division) knob to provide the resolution
youwantintheFFTspectrum.
6. If possible, set the oscilloscope to display many signal cycles.
If you turn the horizontal Scale knob to select a faster setting (fewer cycles),
the FFT spectrum shows a larger frequency range, and reduces the possibility
of FFT aliasing. (See page 59, FFT Aliasing.) However, the oscilloscope a lso
displays less frequency resolution.
To set up the FFT display, follow these steps:
1. Push the Math button to see the Math Menu.
2. Push Operation ► FFT.
3. Select
In many cases, the oscilloscope can produce a useful FFT spectrum even if the
YT wav
or random (noisy).
the Math FFT Source channel.
eform is not triggered. This is especially true if your signal is periodic
al Scale (volts/division) knob to ensure that the entire
Nyquist Frequency
NOTE. Trigger and position any transient or burst waveforms as closely as
possible to the center of the screen.
The highest frequency that any real-time digitizing oscilloscope can measure
without errors is one-half the sample rate. This frequency is called the Nyquist
frequency. Frequency information above the Nyquist frequency is undersampled,
which causes FFT aliasing. (See page 59, FFT Aliasing.)
The math function transforms the center 2048 points of the time-domain
waveform into an FFT spectrum. The resulting FFT spectrum contains 1024
points that go from DC (0 Hz) to the Nyquist frequency.
Normally, the display compresses the FFT spectrum horizontally into 250 points,
but you can use the FFT Zoom function to expand the FFT spectrum to more
clearly see the frequency components at each of the 1024 data points in the FFT
spectrum.
NOTE. The oscilloscope vertical response rolls off slowly above its bandwidth
(40 MHz, 60 MHz, 100 MHz or 200 MHz, depending on the model, or 20 MHz
when the Bandwidth Limit option is ON). Therefore, the FFT spectrum can show
valid frequency information higher than the oscilloscope bandwidth. However, the
magnitude information near or above the bandwidth will not be accurate.
56 TBS1000 Series Oscilloscopes User Manual
Page 79

Math FFT
Displaying th
e FFT Spectrum
Push the Math button to display the Math Menu. Use the options to select the
Source channel, Window algorithm, and FFT Zoom factor. You can display only
one FFT spect
Math FFT option Settings Comments
Source CH1, CH2 Selects the channel used as the FFT source
Window Hanning, Flattop, Rectangular
FFT Zoom X1, X2, X5, X10
rum at a time.
Selects the FFT window type; (See page 58, Selecting
an FFT Wind
Changes t
(See page 61, Magnifying and Positioning an FFT
Spectrum.)
ow.)
he horizontal magnification of the FFT display;
Fundamental
frequency
component
1. Frequency at the center graticule line.
2. Ver
tical scale in dB per division (0 dB = 1 V
3. Horizontal scale in frequency per division.
4. Sample rate in number of samples per second.
5. FFT window type.
RMS
ency
Frequ
component
).
TBS1000 Series Oscilloscopes User Manual 57
Page 80

Math FFT
Selecting an F
FT Window
Windows reduce spectral leakage in the FFT spectrum. The FFT ass umes that
the YT waveform repeats forever. With an integral number of cycles (1, 2, 3,
...), the YT w
discontinuities in the signal shape.
A non-integ
end points to be at different amplitudes. The transitions between the start and end
points cause discontinuities in the signal that introduce high-frequency transients.
aveform starts and ends at the same amplitude and there are no
ral number of cycles in the YT waveform causes the signal start and
Applying a window to the YT waveform changes the waveform so that the start
and stop values are close to each other, reducing the discontinuities.
58 TBS1000 Series Oscilloscopes User Manual
Page 81
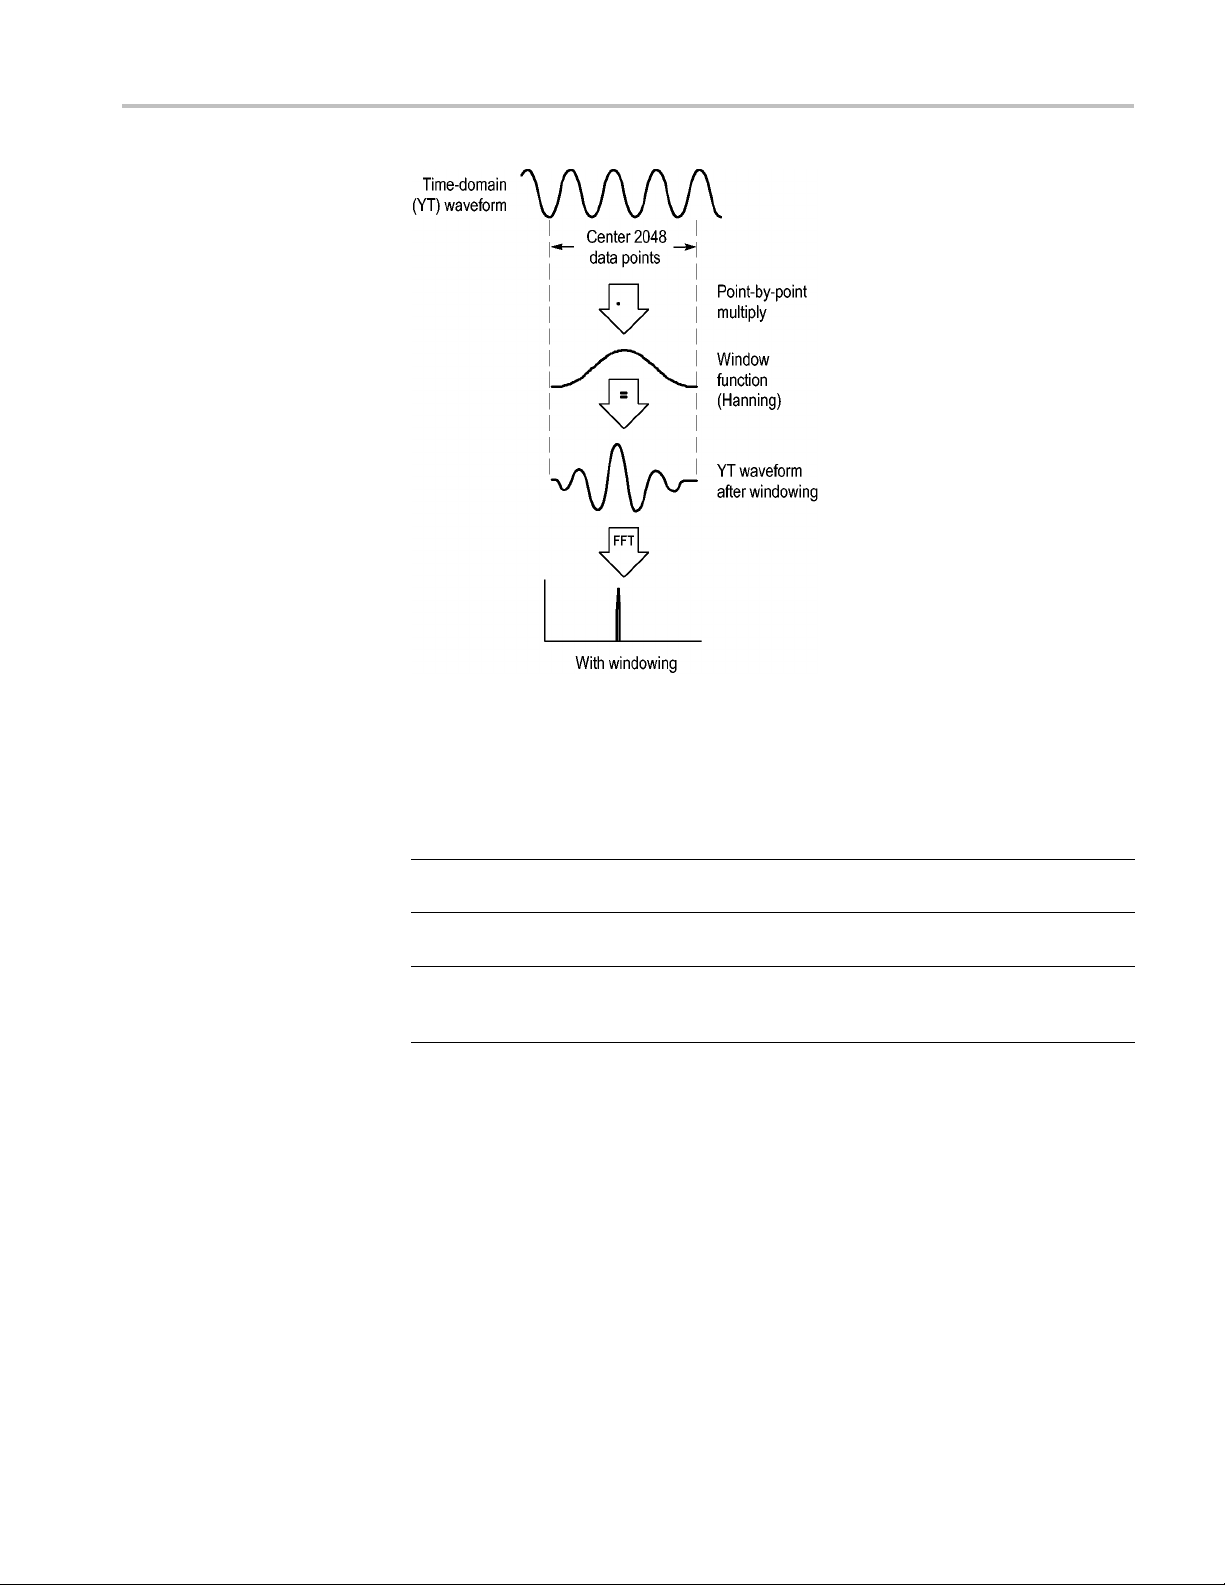
Math FFT
FFT Aliasing
The Math FFT function includes three FFT Window options. There is a trade-off
between
frequency resolution and amplitude accuracy with each type of window.
What you want to measure and your source signal characteristics will help you to
determine which window to use.
Window Measur
Hanning
op
Flatt
Rectangular Pulses or transients
e
dic waveforms
Perio
Periodic waveforms Better magnitude, poorer frequency
teristics
Charac
r frequency, poorer magnitude
Bette
accuracy than Flattop
accuracy than Hanning
Special-purpose window for waveforms
t do not have discontinuities. This is
tha
essentially the same as no window
Problems occur when the oscilloscope acquires a time-domain waveform
containing frequency components that are greater than the Nyquist frequency.
(See page 56, Nyquist Frequency.) The frequency components that are above the
Nyquist frequency are undersampled, appearing as lower frequency components
hat "fold back" around the Nyquist frequency. These incorrect components are
t
called aliases.
TBS1000 Series Oscilloscopes User Manual 59
Page 82

Math FFT
60 TBS1000 Series Oscilloscopes User Manual
Page 83

Math FFT
Eliminating Aliases
To eliminate al
Turn the Horizontal Scale (seconds/division) knob to set the sample rate to
a faster setti
the sample rate, the aliased frequency components appear at their proper
frequency. If too many frequency components are shown on the screen, you
can use the FFT Zoom option to magnify the FFT spectrum.
If you do not need to view frequency components above 20 MHz, set the
Bandwidth Limit option to On.
Put an external filter on the source signal to bandwidth limit the source
waveform to frequencies below that of the Nyquist frequency.
Recognize and ignore the aliased frequencies.
Use zoom controls and the cursors to magnify and measure the FFT spectrum.
iases, try the following remedies:
ng. Since you increase the Nyquist frequency as you increase
Magnifying and Positioning an FFT Spectrum
You can magnify and use cursors to take measurements on the FFT spectrum. The
oscilloscope includes an FFT Zoom option to magnify horizontally. To magnify
vertically, you can use the v ertical controls.
Horizontal Zoom and
Position
Vertical Zoom and Position
The FFT Zoom option lets you horizontally magnify the FFT spectrum without
changing the sample rate. Zoom factors are X1 (default), X2, X5, and X10. At
zoom factor X1, and with the waveform centered in the graticule, the left graticule
line is at 0 Hz and the right graticule line is at the Nyquist frequency.
When you change the zoom factor, the FFT spectrum is magnified about the
center graticule line. In other words, the axis of horizontal magnification is the
center graticule line.
Turn the Horizontal Position knob clockwise to move the FFT spectrum to the
right. Push the Set To Zero button to position the center of the spectrum at the
enter of the graticule.
c
The channel vertical knobs become vertical zoom and p osition controls for their
respective channels when displaying the FFT spectrum. The Vertical Scale
knob provides zoom factors of X0.5, X1 (default), X2, X5, and X10. The FFT
spectrum is vertically magnified about the M marker (math waveform reference
point on the left edge of the screen).
Turn the Vertical Position knob clockwise to move the spectrum up for the
source channel.
TBS1000 Series Oscilloscopes User Manual 61
Page 84

Math FFT
Measuring an F
FT Spectrum Using Cursors
You can ta ke two measurements on FFT spectrums: magnitude (in dB), and
frequency (in Hz). Magnitude is referenced to 0 dB, where 0 dB equals 1 V
You can use the cursors to take measurements at any zoom factor. To do so,
follow these steps:
1. Push the Cursor button to see the Cursor Menu.
2. Push Source ► MATH.
3. Push the Ty p e option button to select Magnitude or Frequency.
4. Use the multipurpose knob to move cursors 1 and 2.
Use hori
frequency. The options display the delta between the two cursors, the value at
cursor 1 position, and the value at cursor 2 position. Delta is the absolute value of
cursor 1 minus cursor 2.
zontal cursors to measure magnitude and vertical cursors to measure
RMS
.
Magnitude cursors Frequency cursors
You can also take a frequency measurement without using the cursors. To do so,
the Horizontal Position knob to position a frequency component on the center
turn
graticule line and read the frequency at the top right of the display.
62 TBS1000 Series Oscilloscopes User Manual
Page 85

USB Flash Drive and Device Ports
This chapter describes how to use the Universal Serial Bus (USB) ports on the
oscilloscope to do the following tasks:
Save and recall waveform data or setup data, or save a screen image
Print a screen image
Transfer waveform data, setup data, or a screen image to a PC
Control the oscilloscope with remote commands
To use the PC Communications software, launch and refer to the online help
from the software.
USB Flash Drive Port
The front of
flash drive for file storage. The o scilloscope can save data to and retrieve data
from the flash drive.
NOTE. The oscilloscope can only support flash drives with a storage capacity
of 64 GB or less.
To connect a USB flash drive, follow these steps:
1. Align the USB flash drive with the USB Flash Drive port on the oscilloscope.
Flash drives are shaped for proper installation.
2. Insert the flash drive into the port until the drive is fully inserted.
theoscilloscopehasaUSBFlashDriveporttoaccommodateaUSB
USB Flash Drive port
For flash drives with an LED, the drive "blinks" while the oscilloscope writes
data to or reads data from the drive. The oscilloscope also displays a clock
symbol to indicate when the flash drive is active.
After a file is saved or retrieved, the LED on the drive (if any) stops blinking,
and the oscilloscope removes the clock. A hint line also displays to notify you
that the save or recall operation is complete.
TBS1000 Series Oscilloscopes User Manual 63
Page 86

USB Flash Drive and Device Ports
Flash Drive Initial Read
Time
Formatting a Flash Drive
To rem o v e a USB fl
blinking or until the hint line appears that says the operation is complete, grab the
edge of the drive, and extract the drive from the port.
The oscilloscope reads the internal structure of a USB flash drive each time you
install a drive. The time to complete the read depends on the size of the flash
drive, how the drive is formatted, and the number of files stored on the drive.
NOTE. To si gni ficantly shorten the initial read time of 64 MB and larger USB
flash drives, format the drive on your PC.
The Format function deletes all data on the USB flash drive. To format a flash
drive, follow these steps:
1. Insert a USB flash drive into the Flash Drive port on the front of the
oscilloscope.
2. Push the Utility button to see the Utility Menu.
3. Push File Utilities ► More ► Format.
4. Select Ye s to format the flash drive.
ash drive, wait until the LED on the drive (if any) stops
Flash Drive Capacities
The oscilloscope can store the following types and number of files per 1 MB
of USB flash drive memory:
5 Save All operations; (See page 67, Saves All to Files.) (See page 91, Save
All.)
16 screen image files (capacity depends on the image format); (See page 68,
Saves Image to File.) (See page 91, Save Image.)
250 oscilloscope setting (.SET) files; (See page 92, Save Setup.)
18 waveform (.CSV) files; (See page 93, Save Waveform.)
File Management Conventions
The oscilloscope uses the following file management conventions for data storage:
The oscilloscope checks for a vailable space on the USB flash drive before
writing files, and displays a warning message if there is not enough memory
available.
Theterm“folder”referstoadirectorylocationontheUSBflash drive.
The default location for the file save or file recall functions is the current
folder.
64 TBS1000 Series Oscilloscopes User Manual
Page 87

USB Flash Drive and Device Ports
A:\ is the root f
The oscilloscope resets the current folder to A:\ when you power on the
oscilloscope
powered on.
File names c
followed with an extension of one to three characters.
The oscillo
with the shortened file name from the operating system.
File names
You c an use the File Utilities m enu to do the following tasks:
List the contents of the current folder
Select a file or folder
Navigate to other folders
Create, rename, and delete files and folders
ttheUSBflash drive
Forma
(See page 102, File Utilities for the USB Flash Drive.)
older.
, or w hen you insert a USB flash drive after the oscilloscope is
an have one to eight characters, followed by a period, and then
scope displays long file names created on PC operating systems
are case insensitive and are displayed in upper case.
Saving and Recalling Files With a USB Flash Drive
There are two ways to operate the USB flash drive for file storage:
through the Save/Recall m enu
through the alternative Save function of the Print button
You can use the following Save/Recall menu options to write data to or retrieve
data from a USB flash drive:
Save Image
Save Setup
ave Waveform
S
Recall Setup
Recall Waveform
NOTE. The
to a flash drive. For information on how to save many files at once, or images one
after another, refer to Using the Save Functions of the Print Button. (See page 67,
Using the Save Function of the Print Front Panel Button.)
print button can be used as a save button for quick storage of files
TBS1000 Series Oscilloscopes User Manual 65
Page 88

USB Flash Drive and Device Ports
Save Image , Save Setup,
and Save Waveform
Options
Recall Setup, and Recall
Waveform Options
You can save a sc
on the USB flash drive through the Save/Recall menu.
Each save option operates in a similar way. As an example, to save a screen image
file to a flash drive, follow these steps:
1. Insert a USB flash drive into the USB Flash Drive port.
2. Push Utility ► Options ► Printer Setup and set the following options:
Ink Saver On, Off
Layout Portrait, Landscape Printer output orientation
3. Access the screen you want to save.
4. Push the Save/Recall front panel button.
5. Select the Action ► Save Image ► Save option.
The oscilloscope saves the screen image in the current folder and
automatically generates the filename.(Seepage90,Save/Recall.)
You can recall the oscilloscope settings or waveform data from a file on the USB
flash drive through the Save/Recall menu.
reen image, the oscilloscope settings, or waveform data to a file
Prints the screen image on a white
background when you select On
Each recall option operates in a similar way. As an example, to recall a waveform
file from a USB flash drive, follow these steps:
1. Insert the USB flash drive that contains the desired waveform file into the
USB Flash Drive port on the front of the oscilloscope.
2. Push the Save/Recall front panel button.
3. Select the Action ► Recall Waveform ► Select File option.
You can use the Change Folder option to navigate to a nother folder on the
flash drive.
4. Turn the multipurpose knob to select the waveform file to recall.
The name of the file in the Recall option changes as you scroll.
5. Select the To option and specify which reference memory location to recall
the waveform to (RefA or RefB).
6. Push the Recall FnnnnCHx.CSV option button, where FnnnnCHx.CSV is
thenameofthewaveformfile.
NOTE. For folders on the flash drive that contain one waveform file, select the
Save/Recall ► Action ►Recall Waveform ► To option and specify the refere nce
memory location to recall the waveform to. The name of the file appears in the
Recall option.(See page 90, Save/Recall.)
66 TBS1000 Series Oscilloscopes User Manual
Page 89

USB Flash Drive and Device Ports
Using the Save
Saves All t o Files
Function of the Print Front Panel Button
You ca n s et th e (print) front panel button to write data to the USB flash drive
as an alterna
one of the following options:
Save/Recal
Utility ►Options ► Printer Setup
NOTE. An LE
that writes data to the USB flash drive.
The Save
to files on the USB flash drive. A single Saves All to Files action uses less than
700 kB of space on the flash drive.
Before you can save data to the USB flash drive, you need to change the
print f
Save/Recall ► Save All ► PRINT Button ► Saves All to Files option.
To sav
1. Insert a USB flash drive into the USB Flash Drive p ort.
tive function. To set the function of the button to save data, access
l ► Save All ► PRINT Button
D by the print button lights to indicate the alternative Save function
s All to Files option lets you save the current oscilloscope information
ront panel button to the alternative Save function. To do so, select the
e all the oscilloscope files to a USB flash drive, follow these steps:
2. To change the folder d esignated as the current folder, push the Select Folder
option button.
The oscilloscope creates a new folder within the current folder each time you
push the PRINT front panel button, and automatically generates the folder
me.
na
3. Set up the oscilloscope to capture your data.
4. Push the
The oscilloscope creates a new folder on the flash drive and saves the screen
image, waveform data, and setup data in separate files in that new folder,
using the current oscilloscope and file format settings. The oscilloscope
names the folder ALLnnnn. (See page 90, Save/Recall.)
To see a list of the files created by the Saves All To Files function, access the
Utility ►File Utilities menu.
Source File name
CH(x) FnnnnCHx.CSV, where nnnn is an automatically-generated
MATH
Ref(x) FnnnnRFx.CSV, where x is the reference memory letter
print (Save) button.
number, and x is the channel number
FnnnnMTH.CSV
TBS1000 Series Oscilloscopes User Manual 67
Page 90

USB Flash Drive and Device Ports
Source File name
Screen Image FnnnnTEK.???, where ??? is the current file format
Settings FnnnnTEK.SET
File type Contents and uses
.CSV Contains ASCII text strings that list the time (relative to the
.SET Contains an ASCII text string listing of the oscilloscope settings;
Screen im
NOTE. The oscilloscope stores these settings until you change them, even if you
push the
trigger) and amplitude values for each of the 2500 waveform
data points
and math analysis applications.
refer to the TBS1000, TDS2000C and TPS2000 Series Digital
Oscillosc
ages
Import fil
type of image file depends on the application.
Default Setup button.
; you can import .CSV files into many spreadsheet
opes Programmer Manual to decode strings.
es into spreadsheet and word processing applications;
Saves Image to File
This option lets you save the oscilloscope screen image to a file named
TEKnn
nn.???, where the .??? is the current Saves Image to File format. The
next table lists the file formats.
File format Extension Comments
BMP BMP
EPSIMAGE EPS Postscript format
JPEG JPG This bitmap format uses a lossy compression
PCX PCX DOS Paintbrush format
RLE RLE
TIFF TIF Tagged Image File Format
This bitmap format uses a lossless algorithm,
and is compatible with most word processing
and spreadsheet programs; this is the
default.
algorithm, and is commonly used by digital
cameras and by other digital photographic
applications.
Run-length encoding; this format uses a
lossless compression algorithm.
Before you can save data to the USB flash drive, you must change the print button
to the alternative Save function. To do so, select the Save/Recall ► Save All ►
PRINT Button ► Saves Image to File option. The Save LED adjacent to the
print button lights to indicate the alternative function.
68 TBS1000 Series Oscilloscopes User Manual
Page 91
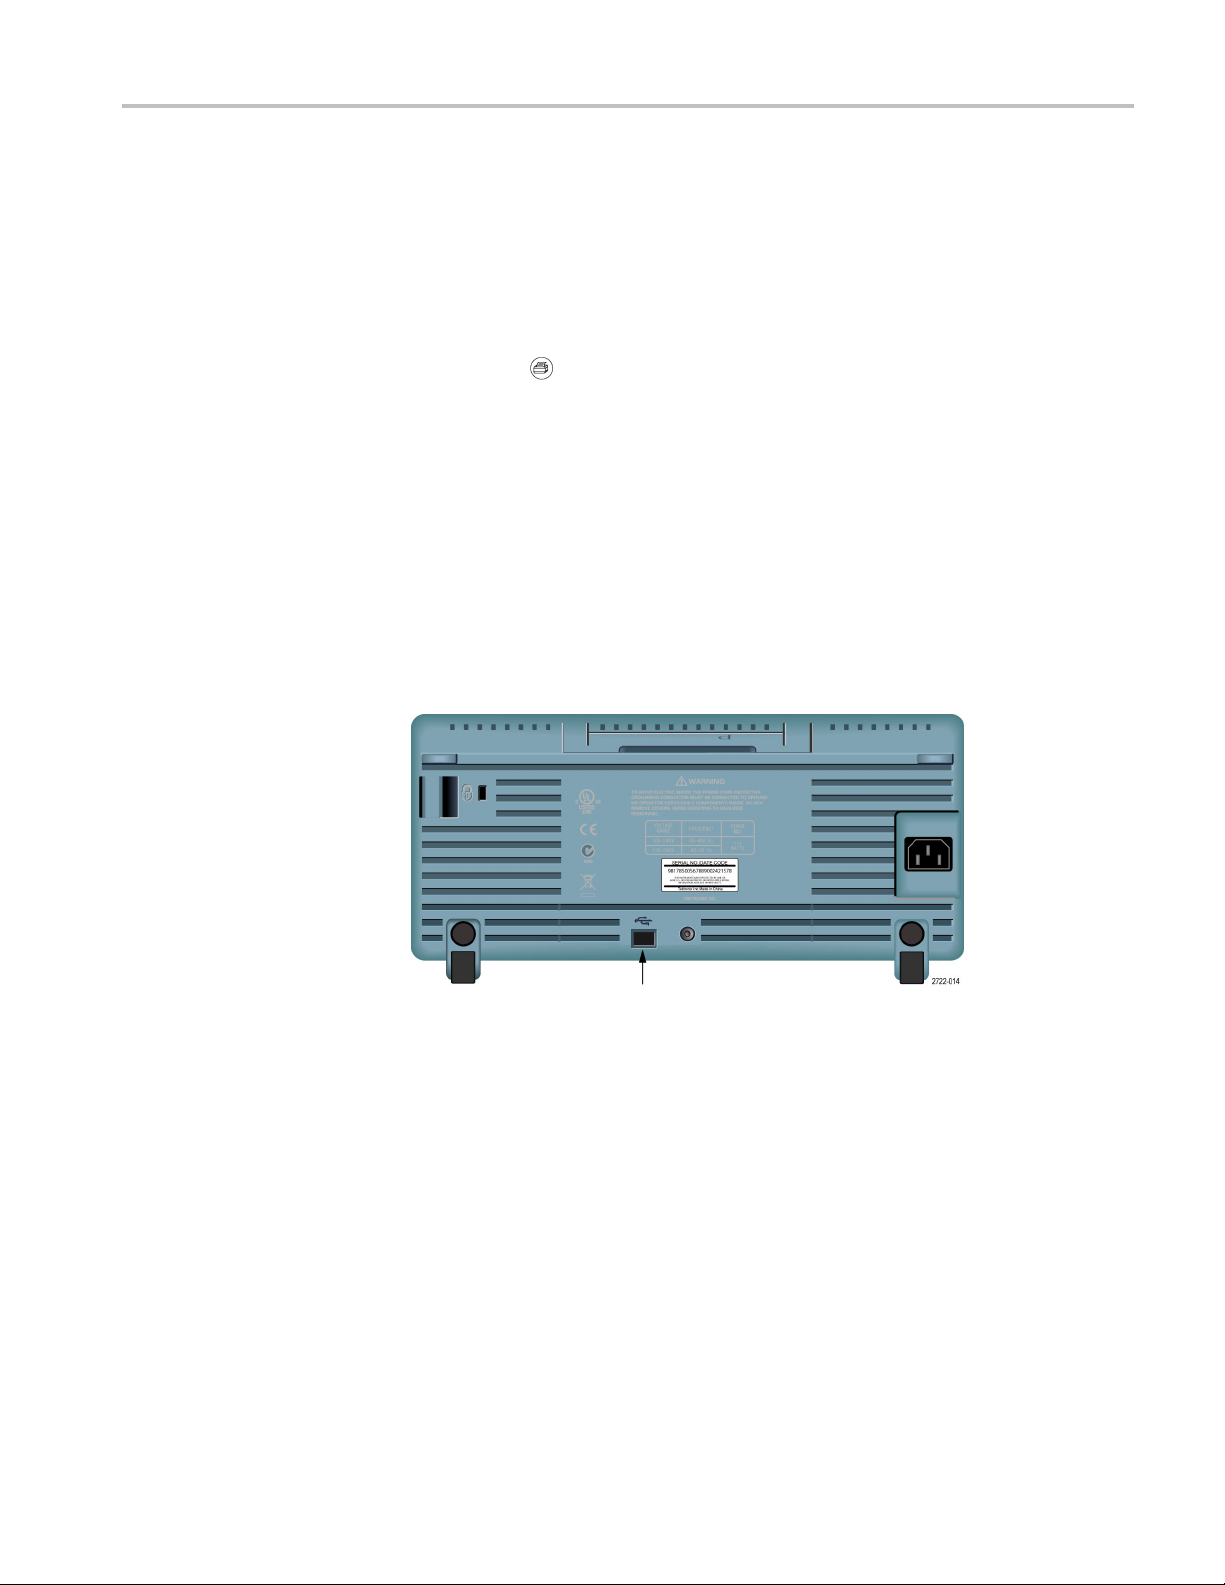
USB Flash Drive and Device Ports
USB Device Port
To save a screen
1. Insert a USB flash drive into the USB Flash Drive p ort.
2. To change the folder d esignated as the current folder, push the Select Folder
option button.
3. Access the screen you want to save.
4. Push the
The oscilloscope saves the screen image and automatically generates the
file name.
To see a list of the files created by the Save Image To File function, you can
access the Utility ► File Utilities menu.
You can use a USB cable to connect the oscilloscope to a PC, or to a PictBridge
compatible printer. The USB Device port is on the rear o f the oscilloscope.
image to a USB flash drive, follow these steps:
print (Save) button.
USB Device port
TBS1000 Series Oscilloscopes User Manual 69
Page 92

USB Flash Drive and Device Ports
Installing th
e PC Com munications Software on a PC
Before you connect the oscilloscope to a PC with Tektronix OpenChoice
PC Communications Software, you must download that software from
www.tektron
CAUTION. If you connect the oscilloscope to your PC before you install the
software, the PC will not recognize the oscilloscope. The PC will label the
oscilloscope as an Unknown Device and not communicate with the oscilloscope.
To avoid this, install the software o n your PC before you connect the oscilloscope
to your PC.
NOTE. Be sure you have installed the latest version of PC Communications
software.
Software for your oscilloscope is available through the Software finder on the
Tektronix web site.
To install the PC Communications software, follow these steps:
1. Run th
appears on the screen.
ix.com/software and install it on your PC.
e OpenChoice Desktop software on the PC. The InstallShield wizard
Connecting to a PC
2. Foll
3. Exit the InstallShield wizard.
After you install the software on your PC, you can connect the oscilloscope to
th
NOTE. You must install the software before you connect the oscilloscope to the
PC. (See page 70, Installing the PC Communications Software on a PC.)
To connect the oscilloscope to the PC, follow these steps:
1. Power on the oscilloscope.
2. Insert one end of a USB cable into the USB Device port on the back of the
3. Power on the PC.
4. Insert the other end of the cable into the desired USB port on a PC.
ow the on-screen directions.
ePC.
oscilloscope.
70 TBS1000 Series Oscilloscopes User Manual
Page 93

USB Flash Drive and Device Ports
5. If a Found New Ha
for the Found New Hardware wizard.
Do NOT search for the hardware to install on the web.
6. For a Windows XP systems, follow these steps:
a. If you see the Tektroni
b. When prompted, select the option that tells Windows NOT to connect to
Windows Update, and click Next.
c. In the next window, you should see that you are installing software for
a USB Test and Measurement Device. If you do not see USB Test and
Measurement Device software, the OpenChoice Desktop software is not
properly installed.
d. Select the option that installs the software automatically (the recommended
option) and click Next.
Windows will install the driver for y our oscilloscope.
e. If you do not see the USB Test and Measurement Device in s tep c, or
if Windows cannot find the software driver, the OpenChoice Desktop
software is not properly installed.
In these situations, click Cancel to exit the Found New Hardware wizard.
Do NOT allow the wizard to finish.
rdware message appears, follow the on-screen directions
x PictBridge Device dialog box, click Cancel.
Unplug the USB cable from your oscilloscope and install the OpenChoice
Desktop software.
Reconnect your oscilloscope to the PC and follow s teps 6a, 6b, 6c, and 6d.
f. Click Finish.
g. If a dialog labeled Test and Measurement Device appears, select what you
would like Windows to do, and click OK.
7. For Windows 2000 systems:
a. When prompted, select the option that tells W
ofknowndriversandclickNext.
b. In the next window, select USB Test and Measurement Device. If you do
not see a USB Test and Measurement Device selection, the OpenChoice
Desktop software is not properly installed.
c. In the next window, click Next to allow Windows to install the driver
for your oscilloscope.
Windows will install the driver for y our oscilloscope.
d. If you do not see the USB Test and Measurement Device in step b, or if
Windows cannot find the software driver, the software is not properly
installed.
indows to display a list
TBS1000 Series Oscilloscopes User Manual 71
Page 94

USB Flash Drive and Device Ports
In these situat
Do NOT allow the wizard to fi nish.
Unplug the USB
Reconnect your oscilloscope to the PC and follow steps 7a, 7b, and 7c.
8. When prompted, click Finish.
9. If Windows asks you to insert a CD, click Cancel.
10. Run the PC Communications software on your PC.
11. If the oscilloscope and PC do not communicate, refer to the PC
Communications online help and documentation.
Connecting to a GPIB System
If you want to communicate between the oscilloscope and a GPIB system, use a
TEK-USB-488 adapter and follow these steps:
1. Connect the oscilloscope to a TEK-USB-488 adapter with a USB cable.
The Accessories appendix has information on how to order an adapter. (See
page 123, Accessories.)
ions, click Cancel to exit the Found New Hardware wizard.
cable from your oscilloscope, and install the software.
Command Entry
2. Connect the TEK-USB-488 adapter to your GPIB system with a GPIB cable.
3. Push
4. Run your GPIB software on your GPIB system.
5. If t
NOTE. For complete command information, refer to the TBS1000, TDS2000C and
TPS2000 Series Digital Oscilloscopes Programmer Manual, 077-0444-XX.
the Utility ► Option ► GPIB Setup ► Address option button to
select the appropriate address for the adapter, or use the multipurpose knob.
The default GPIB address is 1.
he oscilloscope and your GPIB system do not communicate, refer to the
information on the software for your GPIB system, and to the user manual for
the TEK-USB-488 adapter to resolve the problem.
72 TBS1000 Series Oscilloscopes User Manual
Page 95

USB Flash Drive and Device Ports
Connecting to
aPrinter
Printing a Screen Image
When you connect the oscilloscope to a PictBridge compatible printer, the
oscilloscope and printer can be powered on or off. To connect the oscilloscope to
a PictBridge
1. Insert one end of a USB cable into the USB Device port on the oscilloscope.
2. Insert the other end of the cable into the PictBridge port on a PictBridge
compatible printer. Refer to the product documentation for your printer
to locate t
3. To test the connection, set up the oscilloscope to print as described in the
next proc
NOTE. The printer recognizes the oscilloscope only when the printer is powered
on.
If the oscilloscope asks you to connect to a printer and a printer is connected, you
need to power on the printer.
compatible printer, follow these steps:
he port.
edure.
To set up a PictBridge compatible printer, follow these steps:
1. Power on the oscilloscope and the printer.
2. Push the Utility ► Options ► Printer Setup ► PRINT Button and select
the Prints option.
3. Set the Ink Saver option to On, the default setting.
4. Push the - more - page 2 of 3 and - more - page 3 o f 3 option buttons to set
up the printer. The oscilloscope queries the printer, and only displays options
and values that the printer supports.
If you are not sure which setting to choose, select Default for each option.
5. To print a screen image, push the
The oscilloscope takes a few seconds to capture the screen image. The
settings of your printer and print speed determine how long it takes to print
the data. Additional time may be required according to the format selected.
NOTE. You can use the oscilloscope while the printer prints.
print front panel button.
TBS1000 Series Oscilloscopes User Manual 73
Page 96

USB Flash Drive and Device Ports
6. If printing fai
on the printer, and try again.
NOTE. The oscilloscope stores these settings until you change them, even if you
push the Default Setup button, or you power off the oscilloscope.
NOTE. To stop sending the screen image to the printer, push Abort Printing.
ls, check that the USB cable is connected to the PictBridge port
74 TBS1000 Series Oscilloscopes User Manual
Page 97

Reference
Acquire
This chapter describes the menus and operating details associated with each
front-panel menu button or control.
Push the Acquire button to set acquisition parameters.
Options Settings Comments
Sample
Peak Detect Use to detect glitches and reduce the
Average Use to reduce random or uncorrelated noise
Averages 4, 16, 64, 128
Use to acquire and accurately display most
waveforms; this is the default mode
possibility of aliasing
in the signal display; the number of averages
is selectable
Select number of averages
Key Points
If you probe a noisy square wave signal that contains intermittent, narrow glitches,
the waveform displayed will vary depending on the acquisition mode you choose.
Sample
Sample. Use Sample acquisition mode to acqu
Peak Detect Average
ire 2500 points and display them at
the horizontal scale (seconds/division) setting. Sample mode is the default mode.
Sample acquisition intervals (2500)
• Sample points
Sample mode acquires a single sample point in each interval.
The oscilloscope samples at the following rates:
TBS1000 Series Oscilloscopes User Manual 75
Page 98

Reference
Maximum of 500 M
S/s for 25 MHz and 40 MHz models
Maximum of 1 GS/s for 60 MHz, 100 MHz or 150 MHz m odels
At 100 ns and faster settings, this sample rate does not acquire 2500 points. In this
case, a Digital Signal Processor interpolates points between the sampled points to
make a 2500 point waveform record.
Peak Detect. Use Peak Detect acquisition mode to detect glitches as narrow as
10 ns and to limit the possibility of aliasing. This mode is effective when at the
horizontal scale setting of 5 ms/division or slower.
Peak Detect acquisition intervals (1250)
• Sample points displayed
Peak Detect mode displays the highest and lowest acquired voltage in each interval.
NOTE. If you set the horizontal scale (seconds/division) setting to 2.5 ms/div or
faster, the acquisition mode changes to Sample because the sample rate is fast
enough that Peak Detect is not necessary. The oscilloscop
edoesnotdisplaya
message to tell you that the mode was changed to Sample.
When there is enough waveform noise, a typical peak dete
ct display shows large
black areas. The oscilloscope displays this area with diagonal lines to improve
display performance.
Typical peak detect display
TBS1000 peak detect display
Average. Use Average acquisition mode to reduce random or uncorrelated noise
in the signal you want to display. Data is acquired in sample mode, then a number
of waveforms are averaged together.
Select the number of acquisitions (4, 16, 64, or 128) to average for the waveform.
Run/Stop Button. Push the Run/Stop button when you want the oscilloscope to
continuously acquire waveforms. Push the button again to stop the acquisition.
76 TBS1000 Series Oscilloscopes User Manual
Page 99

Reference
Single Button.
Push the Single (single sequence) button when you want the
oscilloscope to acquire a single waveform and then stop. Each time you push the
Single button, the oscilloscope begins to acquire another waveform. After the
oscilloscope detects a trigger it completes the acquisition and stops.
Acquisition mode Single button
Sample, Peak Detect Sequence is complete when one acquisition is acquired
Average
Sequence is complete when the defined number of
acquisitions is reached; (See page 75, Acquire .)
Scan Mode Display. You can use the Horizontal Scan acquisition mode (also
called Roll mode) to continuously monitor signals that change slowly. The
oscilloscope displays wavefo
rm updates from the left to the right of the screen and
erasesoldpointsasitdisplaysnewpoints. A moving, one-division-wide blank
section of the screen separates the new w aveform points from the old.
The oscilloscope changes to the Scan acq
uisition mode when you turn the
Horizontal Scale knob to 100 ms/div or slower, and select the Auto Mode option
in the Trigger Menu.
To disable Scan mode, push the Tr i g Menu button and
set the Mode option to
Normal.
topping the Acquisition. While the acquisition is running, the waveform display
S
is live. Stopping the acquisition (when you push the Run/Stop button) freezes
the display. In either mode, the waveform display can be scaled or positioned
with the vertical and horizontal controls.
Autorange
WhenyoupushtheAutoRange button, the oscilloscope activates or deactivates
the Autorange function. An LED light turns on adjacent to the AutoRange button
that indicates when the function is active.
This function automatically adjusts setup values to track a signal. If the signal
changes, the setup continues to track the signal. When you power on the
oscilloscope, autoranging is always inactive.
Options Comment
Autoranging
Vertical and Horizontal Tracks and adjusts both axes
Vertical Only
Horizontal Only
Undo Autoranging
Activates or deactivates the Autorange function; when activated
the adjacent LED light turns on
Tracks and adjusts the Vertical scale;
horizontal settings
Tracks and adjusts the Horizontal scal
vertical settings
Causes the oscilloscope to recall the previous setup
does not change the
e; does not change the
TBS1000 Series Oscilloscopes User Manual 77
Page 100

Reference
The following c
onditions cause autorange to adjust settings:
Too many or too few waveform periods for a clear display of the trigger
source (excep
t when in Vertical Only)
Waveform amplitude too large or too small (except w hen in Horizontal Only)
Ideal trigger level changes
When you push the AutoRange button, the oscilloscope adjusts controls to
produce a usable display of the input signal.
Function Setting
Acquire m
Display format
Display
Horizon
Horizontal view Main
Run/Stop
Horizontal scale (seconds/division)
Trigger coupling
Trigger holdoff
Trigger level Adjusted
Tri
Vertical bandwidth Full
Vertical BW lim it
Vertical coupling
Vertical invert
Vertical scale (volts/division)
ode
persist
tal position
gger mode
Sample
YT
Off
Adjuste
RUN
Adjusted
DC
Minimum
e
Edg
Off
DC
Off
Adjusted
d
The following changes to the setup of the oscilloscope deactivate autorange:
Vertical s cale deactivates vertical autoranging
Horizontal scale deactivates horizontal autoranging
Display or remove a channel waveform
Trigger settings
Single sequence acquisition mode
Recall a setup
XY Display format
Persistence
78 TBS1000 Series Oscilloscopes User Manual
 Loading...