

Page 1

xx
TBS1000B and TBS1000B-EDU Series
Digital Storage Oscilloscopes
ZZZ
User Manual
*P077088600*
077-0886-00
Page 2

Page 3

TBS1000B and TBS1000B-EDU Series
Digital Storage Oscilloscopes
ZZZ
User Manual
xx
Revision A
www.tektronix.com
077-0886-00
Page 4

Copyright © Tektronix. All rights reserved. Licensed software products are owned by Tektronix or its subsidiaries
or suppliers, and are protected by national copyright laws and international treaty provisions.
Tektronix products are covered by U.S. and foreign patents, issued and pending. Information in this publication
supersedes that in all previously published material. Specications and price change privileges reserved.
TEKTRONIX and TEK are registered trademarks of Tektronix, Inc.
OpenChoice™ is a registered trademark of Tektronix, Inc.
PictBridge is a registered trademark of the Standard of Camera & Imaging Products Association CIPA
DC-001-2003 Digital Photo Solutions for Imaging Devices.
Contacting Tektronix
Tektronix, Inc.
14150 SW Karl Braun Drive
P.O . Bo x 50 0
Beaverton, OR 97077
USA
For product information, sales, service, and technical support:
In North America, call 1-800-833-9200.
World w i de, v i sit www.tektronix.com to nd contacts in your area.
Page 5

TBS1000B and TBS1000B-EDU Oscilloscopes
Warranty
Tektronix war
rants that the product will be free from defects in materials and workmanship for a period of ve (5)
years from the date of original purchase from an authorized Tektronix distributor. If the product proves defective
during this warranty period, Tektronix, at its option, either will repair the defective product without charge for
parts and labor, or will provide a replacement in exchange for the defective product. Batteries are excluded from
this warranty. Parts, modules and replacement products used by Tektronix for warranty work may be new or
reconditioned to like new performance. All replaced parts, modules and products become the property of Tektronix.
In order to obtain service under this warranty, Customer must notify Tektronix of the defect before the expiration
of the warranty period and make suitable arrangements for the performance of service. Customer shall be
responsib
le for packaging and shipping the defective product to the service center designated by Tektronix,
shipping charges prepaid, and with a copy of customer proof of purchase. Tektronix shall pay for the return of the
product to Customer if the shipment is to a location within the country in which the Tektronix service center is
located. Customer shall be responsible for paying all shipping charges, duties, taxes, and any other charges for
products returned to any other locations.
This warranty shall not apply to any defect, failure or damage caused by improper use or improper or inadequate
maintenance and care. Tektronix shall not be obligated to furnish service under this warranty a) to repair damage
resulting from attempts by personnel other than Tektronix representatives to install, repair or service the product;
b) to r
epair damage resulting from improper use or connection to incompatible equipment; c) to repair any damage
or malfunction caused by the use of non-Tektronix supplies; or d) to service a product that has been modied or
integrated with other products when the effect of such modication or integration increases the time or difculty
of servicing the product.
THIS WARRANTY IS GIVEN BY TEKTRONIX WITH RESPECT TO THE PRODUCT IN LIEU OF ANY
OTHER WARRANTIES, EXPRESS OR IMPLIED. TEKTRONIX AND ITS VENDORS DISCLAIM ANY
IMPLIED WARRANTIES OF MERCHANTABILITY OR FITNESS FOR A PARTICULAR PURPOSE.
TEKTRONIX' RESPONSIBILITY TO REPAIR OR REPLACE DEFECTIVE PRODUCTS IS THE SOLE
AN
D EXCLUSIVE REMEDY PROVIDED TO THE CUSTOMER FOR BREACH OF THIS WARRANTY.
TEKTRONIX AND ITS VENDORS WILL NOT BE LIABLE FOR ANY INDIRECT, SPECIAL, INCIDENTAL,
OR CONSEQUENTIAL DAMAGES IRRESPECTIVE OF WHETHER TEKTRONIX OR THE VENDOR HAS
ADVANCE NOTICE OF THE POSSIBILITY OF SUCH DAMAGES.
[W19 – 03AUG12]
Page 6

TPP0051, TPP0101, TPP0201, and P2220 Probes
Warranty
Tek t r o n ix war
rants that the product will be free from defects in materials and workmanship for a period of one (1)
year from the date of original purchase from an authorized Tektronix distributor. If the product proves defective
during this warranty period, Tektronix, at its option, either will repair the defective product without charge for
parts and labor, or will provide a replacement in exchange for the defective product. Batteries are excluded from
this warranty. Parts, modules and replacement products used by Tektronix for warranty work may be new or
reconditioned to like new performance. All replaced parts, modules and products become the property of Tektronix.
In order to obtain service under this warranty, Customer must notify Tektronix of the defect before the expiration
of the warranty period and make suitable arrangements for the performance of service. Customer shall be
responsib
le for packaging and shipping the defective product to the service center designated by Tektronix,
shipping charges prepaid, and with a copy of customer proof of purchase. Tektronix shall pay for the return of the
product to Customer if the shipment is to a location within the country in which the Tektronix service center is
located. Customer shall be responsible for paying all shipping charges, duties, taxes, and any other charges for
products returned to any other locations.
This warranty shall not apply to any defect, failure or damage caused by improper use or improper or inadequate
maintenance and care. Tektronix shall not be obligated to furnish service under this warranty a) to repair damage
resulting from attempts by personnel other than Tektronix representatives to install, repair or service the product;
b) to r
epair damage resulting from improper use or connection to incompatible equipment; c) to repair any damage
or malfunction caused by the use of non-Tektronix supplies; or d) to service a product that has been modied or
integrated with other products when the effect of such modication or integration increases the time or difculty
of servicing the product.
THIS WARRANTY IS GIVEN BY TEKTRONIX WITH RESPECT TO THE PRODUCT IN LIEU OF ANY
OTHER WARRANTIES, EXPRESS OR IMPLIED. TEKTRONIX AND ITS VENDORS DISCLAIM ANY
IMPLIED WARRANTIES OF MERCHANTABILITY OR FITNESS FOR A PARTICULAR PURPOSE.
TEKTRONIX' RESPONSIBILITY TO REPAIR OR REPLACE DEFECTIVE PRODUCTS IS THE SOLE
AN
D EXCLUSIVE REMEDY PROVIDED TO THE CUSTOMER FOR BREACH OF THIS WARRANTY.
TEKTRONIX AND ITS VENDORS WILL NOT BE LIABLE FOR ANY INDIRECT, SPECIAL, INCIDENTAL,
OR CONSEQUENTIAL DAMAGES IRRESPECTIVE OF WHETHER TEKTRONIX OR THE VENDOR HAS
ADVANCE NOTICE OF THE POSSIBILITY OF SUCH DAMAGES.
[W15 – 15AUG04]
Page 7

Table of Contents
Important safety information..................................................................................... iv
Generalsafety summary ..................................................................................... iv
Service safety summary..................................................................................... vii
Terms in this manual ........................................................................................ viii
Symbolsand terms on theproduct......................................................................... viii
Compliance information.......................................................................................... ix
EMC compliance ............................................................................................. ix
Safety compliance ............................................................................................ xi
Environmental considerations.............................................................................. xiv
Getting Started . . ... . ... . .. . ... . ... . .. . ... . ... ... . ... . .. . . .. . ... . .. . ... . ... . .. . ... . ... . .. . ... . ... . .. . ... . ... ... . ... . . 1
General Features............................................................................................... 1
Installation...................................................................................................... 2
Functional Check .............................................................................................. 4
ProbeSafety.................................................................................................... 5
Manual Probe Compensation................................................................................. 6
Probe Attenuation Setting.. ... . ... . .. . ... . .. . ... . .. . . .. . ... . .. . ... . .. . ... . ... . .. . ... . .. . ... . ... ... . ... . .. . ... . 6
CurrentProbe Scaling......................................................................................... 7
Self Calibration ................................................................................................ 7
Firmware Updates Through theInternet .................................................................... 8
Operating Basics.................................................................................................... 9
DisplayArea ................................................................................................... 9
Usingthe Menu System...................................................................................... 11
VerticalControls .............................................................................................. 11
Horizontal Controls........................................................................................... 12
Trigger Controls............................................................................................... 13
Menu and ControlButtons................................................................................... 13
Input Connectors.............................................................................................. 15
Other Front-Panel Items...................................................................................... 16
Understanding Oscilloscope Functions . .. . ... . ... ... . ... . .. . ... . ... ... . ... . .. . ... . .. . ... . .. . . .. . ... . .. . ... . .. . . 17
Setting Up the Oscilloscope ... . ... ... . ... . .. . ... . ... ... . ... . .. . ... . ... ... . ... . .. . ... . ... ... . ... . .. . ... . ... .. 17
Triggering...................................................................................................... 18
Acquiring Signals............................................................................................. 20
Scaling and Positioning Waveforms .. .. . ... . ... . ... ... . ... . .. . . .. . ... . ... . .. . ... . ... . .. . ... . ... . ... ... . ... . 21
Taking Measurements........................................................................................ 23
ApplicationExamples............................................................................................. 25
Taking Simple Measurements ............................................................................... 26
UsingAutorange to Examine a Series of TestPoints ..................................................... 30
Taking Cursor Measurements ............................................................................... 30
Analyzing Signal Detail...................................................................................... 34
TBS1000B and TBS1000B-EDU Series Oscilloscopes User Manual i
Page 8

Table of Contents
Capturing a Sin
gle-Shot Signal ............................................................................. 36
Measuring Propagation Delay............................................................................... 38
Triggering on a Specic Pulse Width... . .. . ... . .. . ... . .. . ... . .. . ... . .. . ... . .. . ... . ... ... . .. . ... . ... ... . .. . . 39
Triggering on a Video Signal ................................................................................ 41
Analyzing a Differential Communication Signal.......................................................... 44
Viewing Impedance Changes in a Network................................................................ 46
Data Logging (non-EDUmodels only)..................................................................... 48
LimitTesting (non-EDU models only) ..................................................................... 49
FFT.................................................................................................................. 51
Setting Up the Time-Domain Waveform.. . .. . . .. . ... . .. . ... . ... . .. . ... . ... ... . ... . .. . ... . ... . .. . ... . .. . . .. 51
Displaying the FFT Spectrum ............................................................................... 53
Selecting an FFT Window ................................................................................... 54
Magnifying and Positioning an FFT Spectrum . . .. . ... . .. . ... . .. . . .. . ... . .. . ... . ... . .. . ... . ... ... . ... . .. . . 57
Measuring an FFT Spectrum Using Cursors............................................................... 58
USB Flash Drive and Device Ports.............................................................................. 59
USB Flash Drive Port ........................................................................................ 59
File Management Conventions.............................................................................. 60
Saving and Recalling Files With a USB Flash Drive ... ... . ... . .. . ... . .. . ... . ... . .. . ... . .. . ... . .. . . .. . ... 61
Using the Save Functionof the Front-PanelSave Button................................................ 63
USB DevicePort.............................................................................................. 65
Installing the PC Communications Software on a PC .. .. . ... . .. . ... . ... . .. . ... . ... ... . ... . .. . ... . ... . .. . 65
Connecting to a PC........................................................................................... 66
Connecting to a GPIB System............................................................................... 67
CommandEntry............................................................................................... 68
Reference........................................................................................................... 69
Acquire......................................................................................................... 69
Autorange...................................................................................................... 71
Autoset ......................................................................................................... 73
Counter......................................................................................................... 76
Course (EDU models only).................................................................................. 77
Cursor.......................................................................................................... 79
Default Setup.................................................................................................. 81
Display......................................................................................................... 81
FFT............................................................................................................. 83
Function........................................................................................................ 83
Help ............................................................................................................ 85
Horizontal...................................................................................................... 85
Math............................................................................................................ 85
Measure........................................................................................................ 86
MeasurementGating ......................................................................................... 90
Menu Off ...................................................................................................... 91
ii TBS1000B and TBS1000B-EDU Series Oscilloscopes User Manual
Page 9

Table of Contents
Print-Ready Sc
reenshots ..................................................................................... 91
Reference Menu............................................................................................... 91
Save/Recall .................................................................................................... 92
TrendPlot (non-EDU modelsonly) ........................................................................ 96
Trigger Controls............................................................................................... 96
Utility . ... . .. . ... . .. . ... . ... ... . ... . .. . ... . .. . ... . .. . ... . ... ... . ... . .. . ... . .. . ... . .. . ... . .. . ... . .. . . .. . ... . .. . 102
Vertical Co
ntrols ............................................................................................ 106
Zoom Controls.............................................................................................. 108
Appendix A: Specications .................................................................................... 109
Oscilloscope Specications.. . ... . ... ... . ... . .. . ... . .. . ... . .. . ... . ... ... . ... . .. . ... . .. . ... . .. . . .. . ... . .. . .. 109
Appendix B: TPP0051, TPP0101 and TPP0201 Series 10X Passive Probes Information . . .. . . .. . ... . . 113
Connecting the Probe to the Oscilloscope ... . ... . .. . ... . .. . ... . .. . ... . .. . ... . .. . ... . .. . ... . .. . ... . .. . ... 113
Compens
ating the Probe .................................................................................. 113
Connecting the Probetothe Circuit ...................................................................... 114
Standard Accessories....................................................................................... 115
Optional Accessories....................................................................................... 116
Specications. . ... . .. . ... . ... ... . ... . .. . ... . ... ... . ... . .. . ... . ... ... . ... . .. . ... . ... ... . ... . .. . ... . ... ... . ... . 116
Performance Graphs........................................................................................ 117
Safe
ty Summary ............................................................................................ 118
Appendix C: Accessories and Options ........................................................................ 121
Appendix D: Cleaning .......................................................................................... 125
GeneralCare ................................................................................................ 125
Cleaning ..................................................................................................... 125
Appendix E: DefaultSetup..................................................................................... 127
Ap
pendix F: Font Licenses ..................................................................................... 129
Index
TBS1000B and TBS1000B-EDU Series Oscilloscopes User Manual iii
Page 10

Important safety information
Important saf
ety information
This manual c
ontains information and warnings that must be followed by the user
for safe operation and to keep the product in a safe condition.
To safely perform service on this product, additional information is provided at
the end of this section. (See page vii, Service safety summary.)
General safety summary
Use the product only as specied. Review the following safety precautions to
avoid injury and prevent damage to this product or any products connected to it.
Carefully read all instructions. Retain these instructions for future reference.
Comply with local and national safety codes.
For correct and safe operation of the product, it is essential that you follow
generally accepted safety procedures in addition to the safety precautions specied
in this manual.
The product is designed to be used by trained personnel only.
Only qualied personnel who are aware of the hazards involved should remove
the cover for repair, maintenance, or adjustment.
Before use, always check the product with a known source to be sure it is
operating correctly.
This product is not intended for detection of hazardous voltages.
Use personal protective equipment to prevent shock and arc blast injury where
hazardous live conductors are exposed.
While using this product, you may need to access other parts of a larger system.
Read the safety sections of the other component manuals for warnings and
cautions related to operating the system.
When incorporating this equipment into a system, the safety of that system is the
responsibility of the assembler of the system.
To avoid re or personal
injury
Use proper power cord. Use only the power cord specied for this product and
certied for the country of use.
Do not use the provided power cord for other products.
Ground the product. This product is grounded through the grounding conductor
of the power cord. To avoid electric shock, the grounding conductor must be
connected to earth ground. Before making connections to the input or output
terminals of the product, make sure that the product is properly grounded.
iv TBS1000B and TBS1000B-EDU Series Oscilloscopes User Manual
Page 11

Important safety information
Do not disable t
he power cord grounding connection.
Power disconnect. The power switch disconnects the product from the power
source. See instructions for the location. Do not position the equipment so that it
is difcult to disconnect the power switch; it must remain accessible to the user at
all times to allow for quick disconnection if needed.
Connect and disconnect properly. Do not connect or disconnect probes or test
leads while they are connected to a voltage source.
Use only insulated voltage probes, test leads, and adapters supplied with the
product, or indicated by Tektronix to be suitable for the product.
Observe all terminal ratings. To avoid re or shock hazard, observe all ratings
and markings on the product. Consult the product manual for further ratings
information before making connections to the product. Do not exceed the
Measurement Category (CAT) rating and voltage or current rating of the lowest
rated individual component of a product, probe, or accessory. Use caution when
using 1:1 test leads because the probe tip voltage is directly transmitted to the
product.
Do not apply a potential to any terminal, including the common terminal, that
exceeds the maximum rating of that terminal.
Do not oat the common terminal above the rated voltage for that terminal.
Do not operate without covers. Do not operate this product with covers or panels
removed, or with the case open. Hazardous voltage exposure is possible.
Avoid exposed circuitry. Do not touch exposed connections and components
when power is present.
Do not operate with suspected failures. If you suspect that there is damage to this
product, have it inspected by qualied service personnel.
Disable the product if it is damaged. Do not use the product if it is damaged
or operates incorrectly. If in doubt about safety of the product, turn it off and
disconnect the power cord. Clearly mark the product to prevent its further
operation.
Before use, inspect voltage probes, test leads, and accessories for mechanical
damage and replace when damaged. Do not use probes or test leads if they are
damaged, if there is exposed metal, or if a wear indicator shows.
Examine the exterior of the product before you use it. Look for cracks or missing
pieces.
Use only specied replacement parts.
Use proper fuse. Use only the fuse type and rating specied for this product.
TBS1000B and TBS1000B-EDU Series Oscilloscopes User Manual v
Page 12

Important safety information
Wear eye protec
tion. Wear eye protection if exposure to high-intensity rays or
laser radiation exists.
Do not operate in wet/damp conditions. Be aware that condensation may occur if
a unit is moved from a cold to a warm environment.
Do not operate in an explosive atmosphere.
Keep product surfaces clean and dry. Remove the input signals before you clean
the product.
Provide proper ventilation. Refer to the installation instructions in the manual for
details on installing the product so it has proper ventilation.
Slots and openings are provided for ventilation and should never be covered or
otherwise obstructed. Do not push objects into any of the openings.
Provide a safe working environment. Always place the product in a location
convenient for viewing the display and indicators.
Avoid improper or prolonged use of keyboards, pointers, and button pads.
Improper or prolonged keyboard or pointer use may result in serious injury.
Be sure your work area meets applicable ergonomic standards. Consult with an
ergonomics professional to avoid stress injuries.
Probes and test leads
Before connecting probes or test leads, connect the p
ower cord from the power
connector to a properly grounded power outlet.
Keep ngers behind the nger guards on the probes.
Remove all probes, test leads and accessories that are not in use.
Use only correct Measurement Category (CAT), voltage, temperature, altitude,
and amperage rated probes, test leads, and adapters for any measurement.
Beware of high voltages. Understand the voltage ratings for the probe you are
using and do not exceed those ratings. Two ratings are important to know and
understand:
The maximum measurement voltage from the probe tip to the probe reference
lead.
The maximum oating voltage from the probe reference lead to earth
ground
These two voltage ratings depend on the probe and your application. Refer to the
Specications section of the manual for more information.
WARNING. To prevent electrical shock, do not exceed the maximum measurement
or maximum oating voltage for the oscilloscope input BNC connector, probe
tip, or probe reference lead.
vi TBS1000B and TBS1000B-EDU Series Oscilloscopes User Manual
Page 13

Important safety information
Connect and dis
connect properly. Connect the probe output to the measurement
product before connecting the probe to the circuit under test. Connect the
probe reference lead to the circuit under test before connecting the probe input.
Disconnect the probe input and the probe reference lead from the circuit under test
before disconnecting the probe from the measurement product.
Connect and
disconnect properly. De-energize the circuit under test before
connecting or disconnecting the current probe.
Connect th
e probe reference lead to earth ground only.
Do not connect a current probe to any wire that carries voltages above the current
probe vol
tage rating.
Inspect the probe and accessories. Before each use, inspect probe and accessories
for damage (cuts, tears, or defects in the probe body, accessories, or cable jacket).
Do not use if damaged.
Ground
-referenced oscilloscope use. Do not oat the reference lead of this probe
when using with ground-referenced oscilloscopes. The reference lead must be
connected to earth potential (0 V).
Servicesafetysummary
The Service safety summary section contains additional information required to
safely perform service on the product. Only qualied personnel should perform
service procedures. Read this Service safety summary and the General safety
summary before performing any service procedures.
To avoid electric shock. Do not touch exposed connections.
Do not service alone. Do not perform internal service or adjustments of this
product unless another person capable of rendering rst aid and resuscitation is
present.
Disconnect power. To avoid electric shock, switch off the product power and
disconnect the power cord from the mains power before removing any covers or
panels, or opening the case for servicing.
Use care when servicing with power on. Dangerous voltages or currents may exist
in this product. Disconnect power, remove battery (if applicable), and disconnect
test leads before removing protective panels, soldering, or replacing components.
Verify safety after repair. Always recheck ground continuity and mains dielectric
strength after performing a repair.
TBS1000B and TBS1000B-EDU Series Oscilloscopes User Manual vii
Page 14
Important safety information
Termsinthismanual
These terms may appear in this manual:
WARNING. Warning statements identify conditions or practices that could result
in injury or loss of life.
CAUTION. Caution statements identify conditions or practices that could result in
damage to this product or other property.
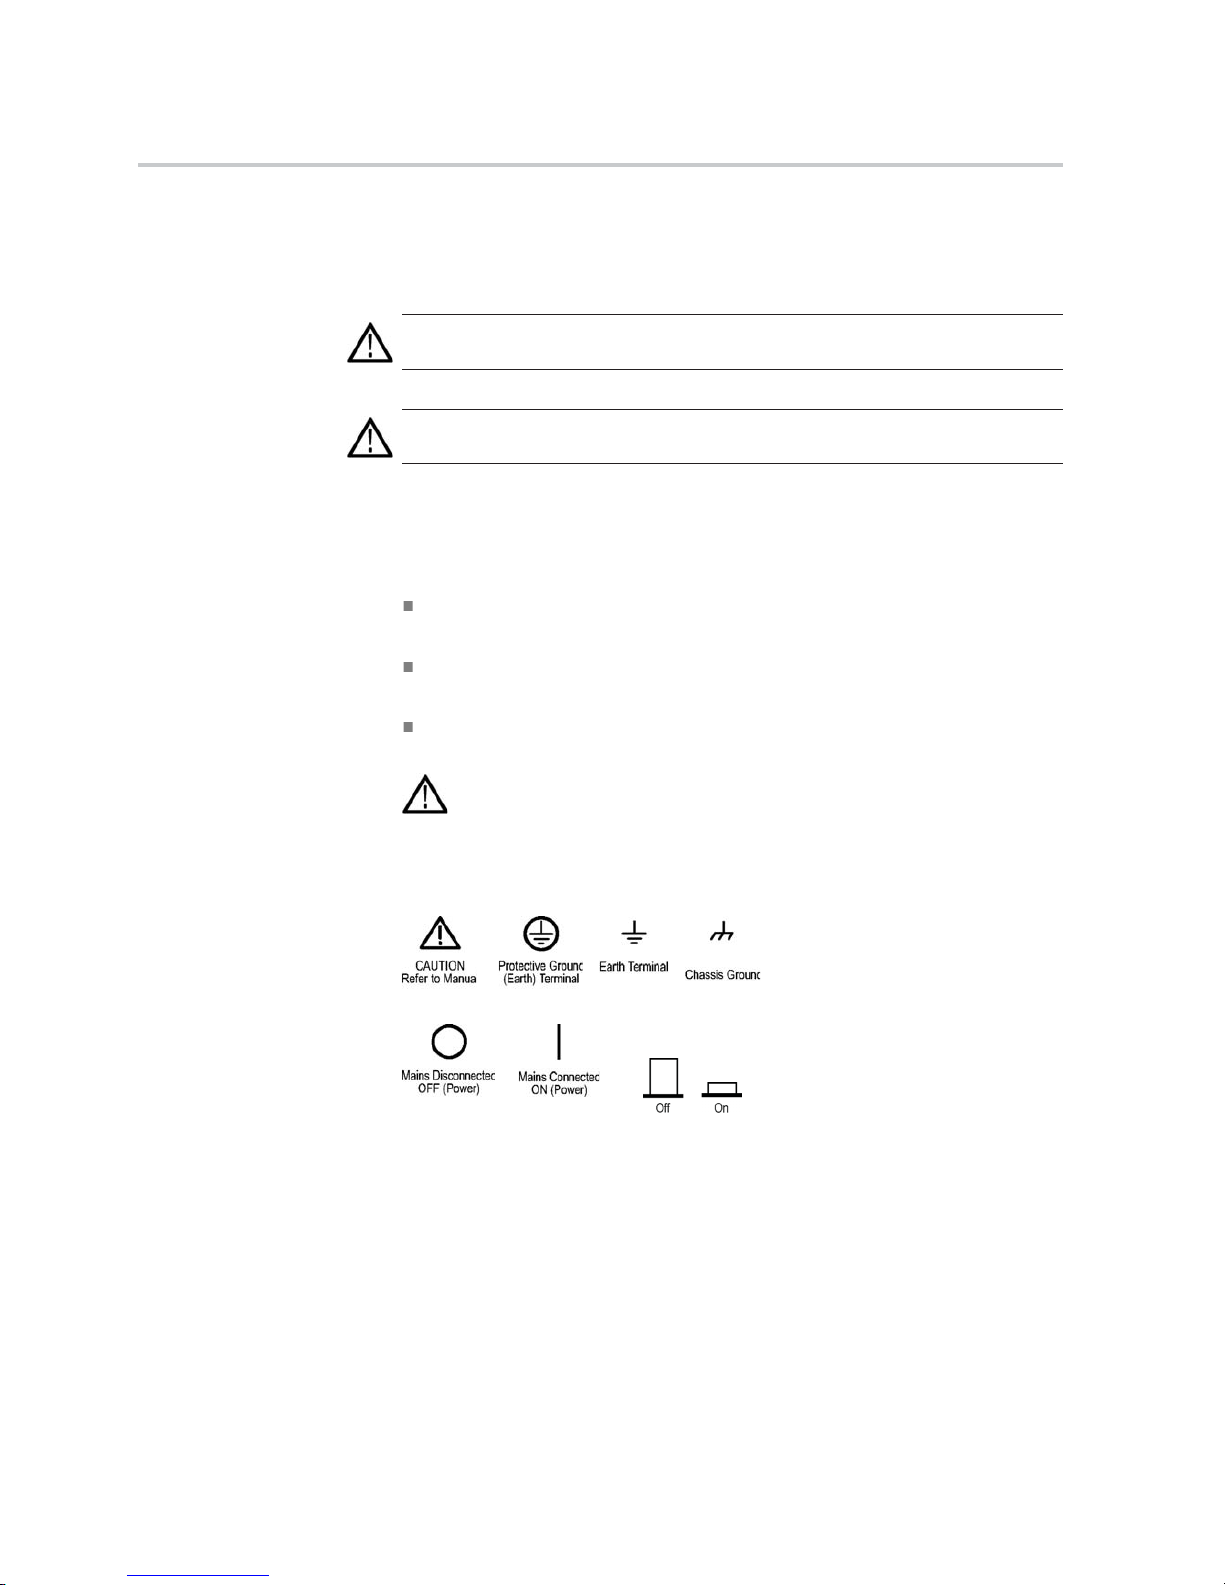
Symbols and terms on the product
These ter
ms may appear on the product:
DANGER indicates an injury hazard immediately accessible as you read
the mark
ing.
WARNING indicates an injury hazard not immediately accessible as you
read th
e marking.
CAUTION indicates a hazard to property including the product.
When this symbol is marked on the product, be sure to consult the manual
to nd out the nature of the potential hazards and any actions which have to
betakentoavoidthem.(Thissymbolmayalsobeusedtorefertheuserto
ratings in the manual.)
The following symbol(s) may appear on the product:
viii TBS1000B and TBS1000B-EDU Series Oscilloscopes User Manual
Page 15

Compliance information
This section lists the EMC (electromagnetic compliance), safety, and
environmental standards with which the instrument complies.
EMC compliance
EC Declaration of
Conformity – EMC
Meets intent of Directive 2004/108/EC for Electromagnetic Compatibility.
Compliance was demonstrated to the following specications as listed in the
Ofcial Journal of the European Communities:
EN 61326-1:2006, EN 61326-2-1:2006. EMC requirements for electrical equipment
for measurement, control, and laboratory use.
123
CISPR 11:2003. Radiated and conducted emissions, Group 1, Class A
IEC 61000-4-2:2001. Electrostatic discharge immunity
IEC 61000-4-3:2002. RF electromagnetic eld immunity
4
IEC 61000-4-4:2004. Electrical fast transient/burst immunity
IEC 61000-4-5:2001. Power line surge immunity
IEC 61000-4-6:2003. Conducted RF immunity
5
IEC 61000-4-11:2004. Voltage dips and interruptions immunity
6
EN 61000-3-2:A1/A2 2009. AC power line harmonic emissions
EN 61000-3-3:2008. Voltage changes, uctuations, and icker
European contact.
Tektronix UK, Ltd.
Western Peninsula
Western Road
Bra
cknell, RG12 1RF
United Kingdom
EMC compliance
Meets the intent of Directive 2004/108/EC for Electromagnetic Compatibility
when it is used with the product(s) stated in the specications table. Refer to the
EMC specication published for the stated products. May not meet the intent of
the directive if u
sed with other products.
European contact.
Tektronix UK, Ltd.
Western Peninsula
Western Road
Bracknell, RG12 1RF
TBS1000B and TBS1000B-EDU Series Oscilloscopes User Manual ix
Page 16

Compliance information
United Kingdom
1
This product is intended for use in nonresidential areas only. Use in residential areas may cause electromagnetic
interference
.
2
Emissions which exceed the levels required by this standard may occur when this equipment is connected to a
test object.
3
To ensure compliance with the EMC standards listed here, high quality shielded interface cables should be used.
4
The instrument will exhibit 3.0 division waveform displacement and
6.0 division increase in peak-to-peak noise when subjected to radiated
interference
per IEC 61000-4-3.
5
The instrument will exhibit 2.0 division waveform displacement and
4.0 division
increase in peak-to-peak noise when subjected to conducted
interference per IEC 61000-4-6.
6
Performance
Criterion C applied at the 70%/25 cycle Voltage-Dip and the 0%/250 cycle Voltage-Interruption test
levels (IEC 61000-4-11). If the instrument powers down upon a voltage dip or interruption, it will take longer than
ten seconds to return to the previous operating state.
Australia / New Zealand
Declaration of
Conformity – EMC
Complies wi
th the EMC provision of the Radiocommunications Act per the:
CISPR 11:2003. Radiated and Conducted Emissions, Group 1, Class A, in
accordanc
e with EN 61326-1:2006 and EN 61326-2-1:2006.
Australia / New Zealand contact.
Baker & McKenzie
Level 27, AMP Centre
50 Bridge Street
Sydney NSW 2000, Australia
FCC–EMC
Exempt from FCC 47 CFR, Part 15.
Russian Federation
This p
roduct is approved by the Russian government to carry the GOST mark.
x TBS1000B and TBS1000B-EDU Series Oscilloscopes User Manual
Page 17

Compliance information
Safety compli
ance
This section lists the safety standards with which the product complies and other
safety compliance information.
EU declarati
on of
conformity – low voltage
Compliance was demonstrated to the following specication as listed in the
Ofcial Journal of the European Union:
Low Voltage Directive 2006/95/EC.
EN 61010-1. Safety Requirements for Electrical Equipment for Measurement,
Control, and Laboratory Use – Part 1: General Requirements.
EN 61010-2-030. Safety Requirements for Electrical Equipment for
Measurement, Control, and Laboratory Use – Part 2-030: Particular
requirements for testing and measuring circuits.
EN 61010-031. Particular requirements for handheld probe assemblies for
electrical measurement and test equipment.
U.S. na
tionally recognized
testing laboratory listing
UL 61010-1. Safety Requirements for Electrical Equipment for Measurement,
Control, and Laboratory Use – Part 1: General Requirements.
UL 61010-2-030. Safety Requirements for Electrical Equipment for
Measurement, Control, and Laboratory Use – Part 2-030: Particular
requirements for testing and measuring circuits.
UL 61010-031. Particular requirements for handheld probe assemblies for
electrical measurement and test equipment.
Ca
nadian certication
CAN/CSA-C22.2 No. 61010-1. Safety Requirements for Electrical
Equipment for Measurement, Control, and Laboratory Use – Part 1: General
Requirements.
CAN/CSA-C22.2 No. 61010-2-030. Safety Requirements for Electrical
Equipment for Measurement, Control, and Laboratory Use – Part 2-030:
Particular requirements for testing and measuring circuits.
CAN/CSA-C22.2 No. 61010-031. Particular requirements for handheld
probe assemblies for electrical measurement and test equipment.
TBS1000B and TBS1000B-EDU Series Oscilloscopes User Manual xi
Page 18

Compliance information
Additional compliances
IEC 61010-1. Sa
fety Requirements for Electrical Equipment for
Measurement, Control, and Laboratory Use – Part 1: General Requirements.
IEC 61010-2-0
30. Safety Requirements for Electrical Equipment for
Measurement, Control, and Laboratory Use – Part 2-030: Particular
requirements for testing and measuring circuits.
IEC 61010-031. Particular requirements for handheld probe assemblies for
electrical measurement and test equipment.
Equipment type
Tes t and me
asuring equipment.
Safety class
Class 1 – grounded product.
Pollution degree
descriptions
A measure of the contaminants that could occur in the environment around
and within a product. Typically the internal environment inside a product is
considered to be the same as the external. Products should be used only in the
environment for which they are rated.
Pollution degree 1. No pollution or only dry, nonconductive pollution occurs.
Products in this category are generally encapsulated, hermetically sealed, or
locat
ed in clean rooms.
Pollution degree 2. Normally only dry, nonconductive pollution occurs.
Occa
sionally a temporary conductivity that is caused by condensation must
be expected. This location is a typical ofce/home environment. Temporary
condensation occurs only when the product is out of service.
Pollution degree 3. Conductive pollution, or dry, nonconductive pollution
that becomes conductive due to condensation. These are sheltered locations
where neither temperature nor humidity is controlled. The area is protected
from direct sunshine, rain, or direct wind.
Pollution degree 4. Pollution that generates persistent conductivity through
conductive dust, rain, or snow. Typical outdoor locations.
Pollution degree rating
Pollution degree 2 (as dened in IEC 61010-1). Rated for indoor, dry location
use only.
xii TBS1000B and TBS1000B-EDU Series Oscilloscopes User Manual
Page 19

Compliance information
Measurement and
overvoltage category
descriptions
Measurement te
rminals on this product may be rated for measuring mains voltages
from one or more of the following categories (see specic ratings marked on
the product and in the manual).
Category II. Circuits directly connected to the building wiring at utilization
points (socket outlets and similar points).
Category III. In the building wiring and distribution system.
Category IV
. At the source of the electrical supply to the building.
NOTE. Only mains power supply circuits have an overvoltage category rating.
Only measurement circuits have a measurement category rating. Other circuits
within the product do not have either rating.
Mains overvoltage
category rating
Overvoltage category II (as dened in IEC 61010-1).
TBS1000B and TBS1000B-EDU Series Oscilloscopes User Manual xiii
Page 20

Compliance information
Environmental considerations
This section provides information about the environmental impact of the product.
Product end-of-life
handling
Observe the f
ollowing guidelines when recycling an instrument or component:
Equipment recycling. Production of this equipment required the extraction and
use of natural resources. The equipment may contain substances that could be
harmful to the environment or human health if improperly handled at the product’s
end of life. To avoid release of such substances into the environment and to
reduce the
use of natural resources, we encourage you to recycle this product in
an appropriate system that will ensure that most of the materials are reused or
recycled appropriately.
This symbol indicates that this product complies with the applicable European
Union re
quirements according to Directives 2002/96/EC and 2006/66/EC
on waste electrical and electronic equipment (WEEE) and batteries. For
information about recycling options, check the Support/Service section of the
Te kt r on
ixWebsite(www.tektronix.com).
Restriction of hazardous
substances
This pr
oduct is classied as an industrial monitoring and control instrument,
and is not required to comply with the substance restrictions of the recast RoHS
Directive 2011/65/EU until July 22, 2017.
xiv TBS1000B and TBS1000B-EDU Series Oscilloscopes User Manual
Page 21

Getting Started
TBS1000B and TBS1000B-EDU Series Digital Storage Oscilloscopes are small,
lightweight, benchtop instruments, which you can use to take ground-referenced
measurement
s.
This chapter describes how to do the following tasks:
Install your product
Perform a brief functional check
Perform a probe check and compensate probes
Match your probe attenuation factor
Use the self calibration routine
NOTE. You can select a language to display on the screen after you power on
the oscilloscope. At any time, you can access the Utility Language option to
select a language.
General Features
Model Channels Bandwidth Sample rate Display
TBS1052B-EDU
250MHz
1 GS/s Color
TBS1052B
250MHz
1 GS/s Color
TBS1072B-EDU
270MHz
1 GS/s Color
TBS1072B
270MHz
1 GS/s Color
TBS1102B-EDU
2 100 MHz
2 GS/s Color
TBS1102B
2 100 MHz
2 GS/s Color
TBS1152B-EDU
2 150 MHz
2 GS/s Color
TBS1152B
2 150 MHz
2 GS/s Color
TBS1202B-EDU
2 200 MHz
2 GS/s Color
TBS1202B
2 200 MHz
2 GS/s Color
Context-sensitive help system
7-inch color LCD display
Educational courseware integrated in the instrument (EDU models only)
Limit tests, data logging, and trend plots (non-EDU models only)
Dual-channel independent counters
Selectable 20 MHz bandwidth limit
2,500 point record length for each channel
TBS1000B and TBS1000B-EDU Series Oscilloscopes User Manual 1
Page 22

Getting Started
Autoset
Autoranging
Setup and waveform storage
USB Flash Drive port for le storage
PC communications through the USB Device port with OpenChoice PC
Communications software
Connect to a GPIB controller through an optional TEK-USB-488 adapter
Cursors with readouts
Trigger f
requency readout
34 automatic measurements — and measurement gating
Waveform averaging and peak detection
Math functions: +, -, and × operations
Fast Fourier Transform (FFT)
Pulse Width trigger capability
Vid e o
trigger capability with line-selectable triggering
External trigger
Variable persistence display
User interface and help topics in 11 languages
Zoom feature
Installation
Power Cord
Use only the power cord provided with your oscilloscope. Appendix C:
Accessories lists the standard and the optional accessories.
Power Source
Use a power source that delivers 90 to 264 VAC
RMS
,45to66Hz. Ifyouhavea
400 Hz power source, it must deliver 90 to 132 VAC
RMS
, 360 to 440 Hz.
The product's maximum power consumption is 30 W.
Security Loop
Use a standard laptop computer security lock, or thread a security cable through
the built-in cable channel to secure your oscilloscope to your location.
2 TBS1000B and TBS1000B-EDU Series Oscilloscopes User Manual
Page 23
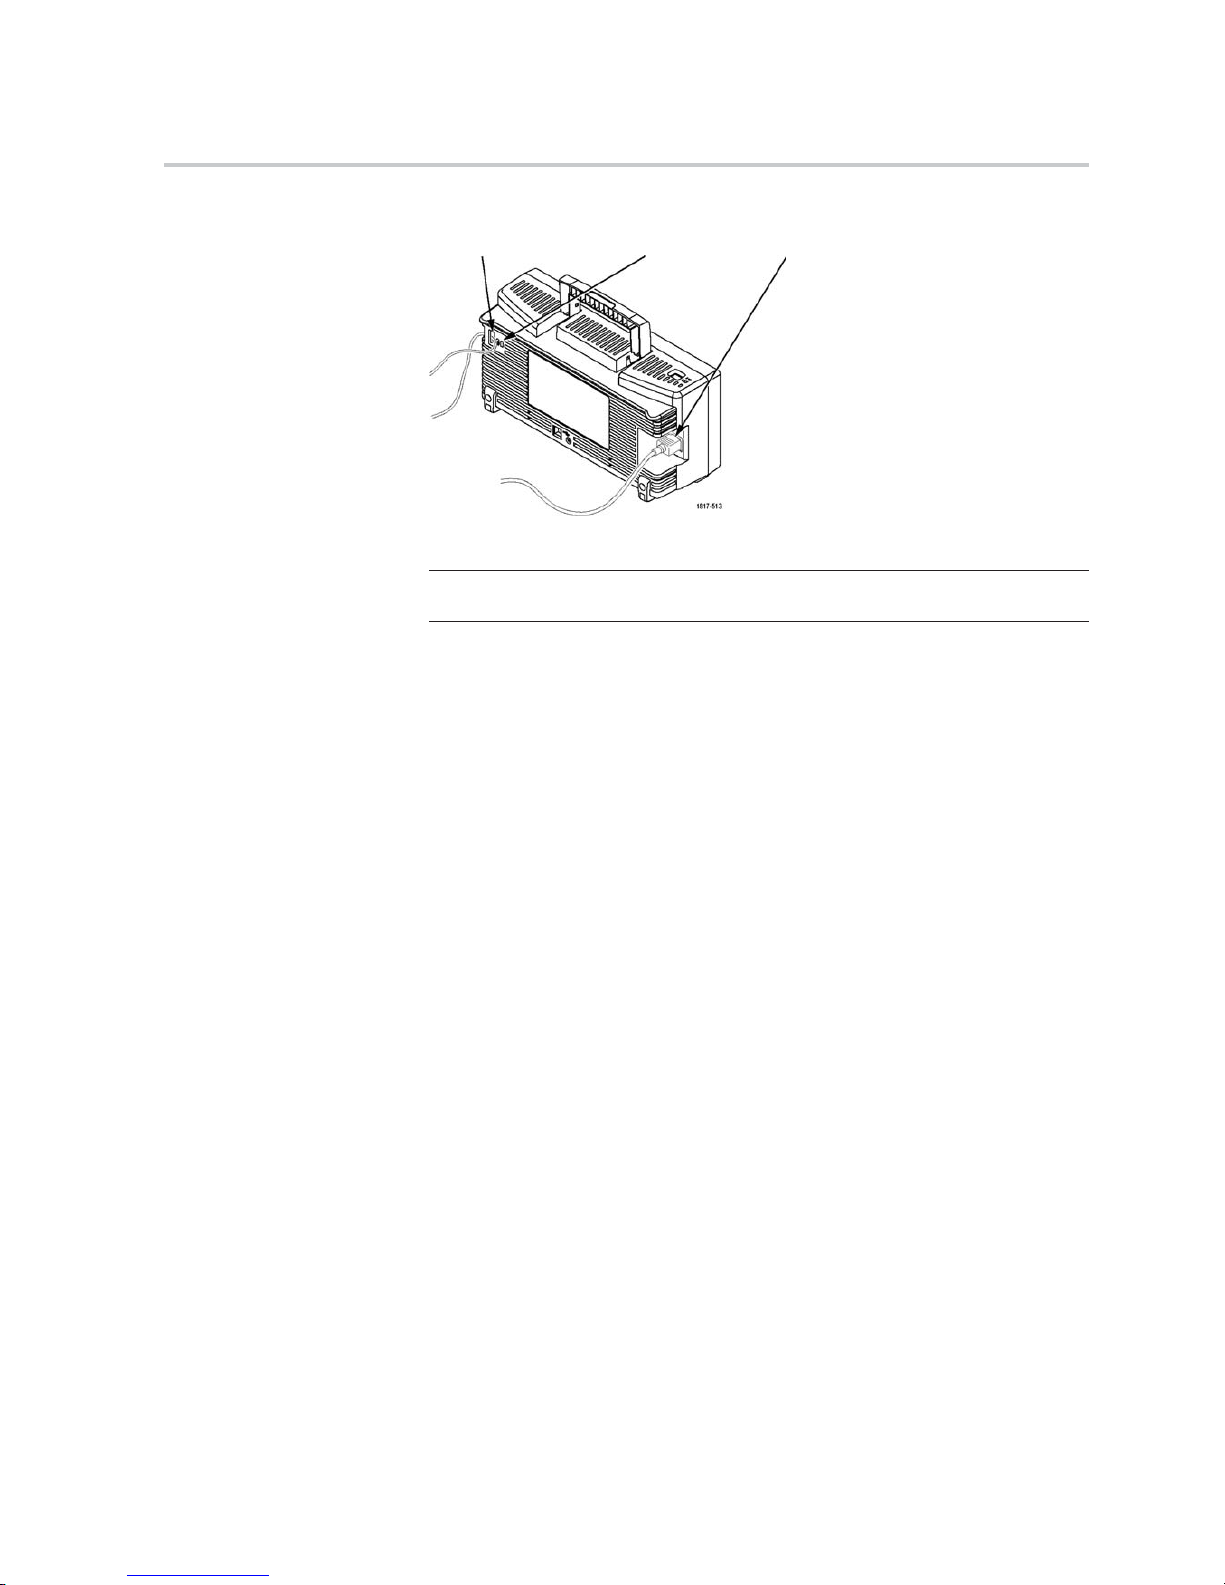
Getting Started
Security cable channel Security lock hole
Power cord
Ventilation
NOTE. The oscilloscope cools by convection. Keep two inches clear on the sides
and top of the product to allow adequate air ow.
TBS1000B and TBS1000B-EDU Series Oscilloscopes User Manual 3
Page 24
Getting Started
Functional Ch
eck
Perform this functional check to verify that your oscilloscope is operating
correctly.
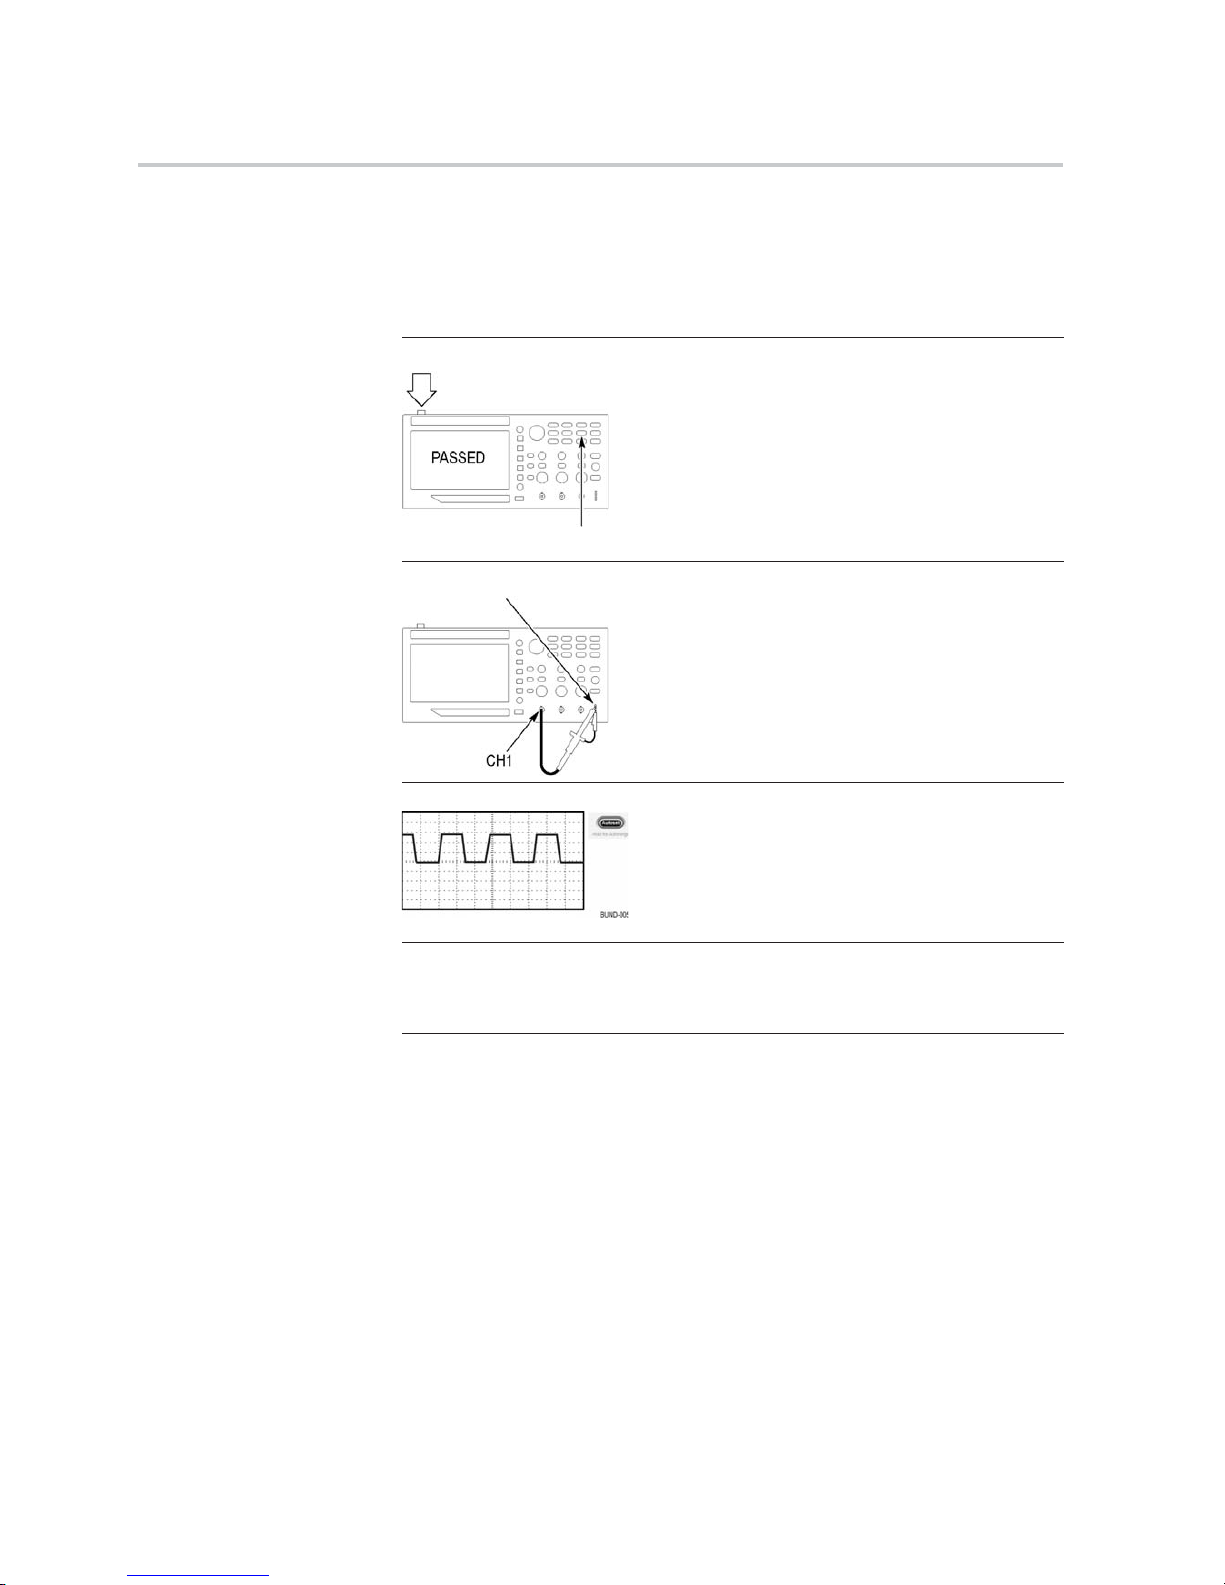
ON/OFF button
1. Power on the oscilloscope.
Push the Default Setup button.
The default
Probe option attenuation setting is
10X.
Default Setup button
PROBE COMP
2. Connect the TPP0051, TPP0101, or TP0201
probe to channel 1 on the oscilloscope. To do this,
align th
e slot in the probe connector with the key
on the channel 1 BNC, push to connect, and twist
to the right to lock the probe in place.
Connec
t the probe tip and reference lead to the
PROBE COMP terminals.
3. Push the Autoset button. Within a few seconds,
you should see a square wave in the display of
about 5 V peak-to-peak at 1 kHz.
Push the channel 1 menu button on the front panel
twice to remove channel 1, push the channel
2 menu button to display channel 2, and repeat
steps 2 and 3.
Calibration: PASSED
4. Check that the instruction passed the calibration
tests. Push Utility - more - page 1 of 2 (push
more again on EDU models) System Status
Misc.. Look for Calibration PASSED
4 TBS1000B and TBS1000B-EDU Series Oscilloscopes User Manual
Page 25
Getting Started
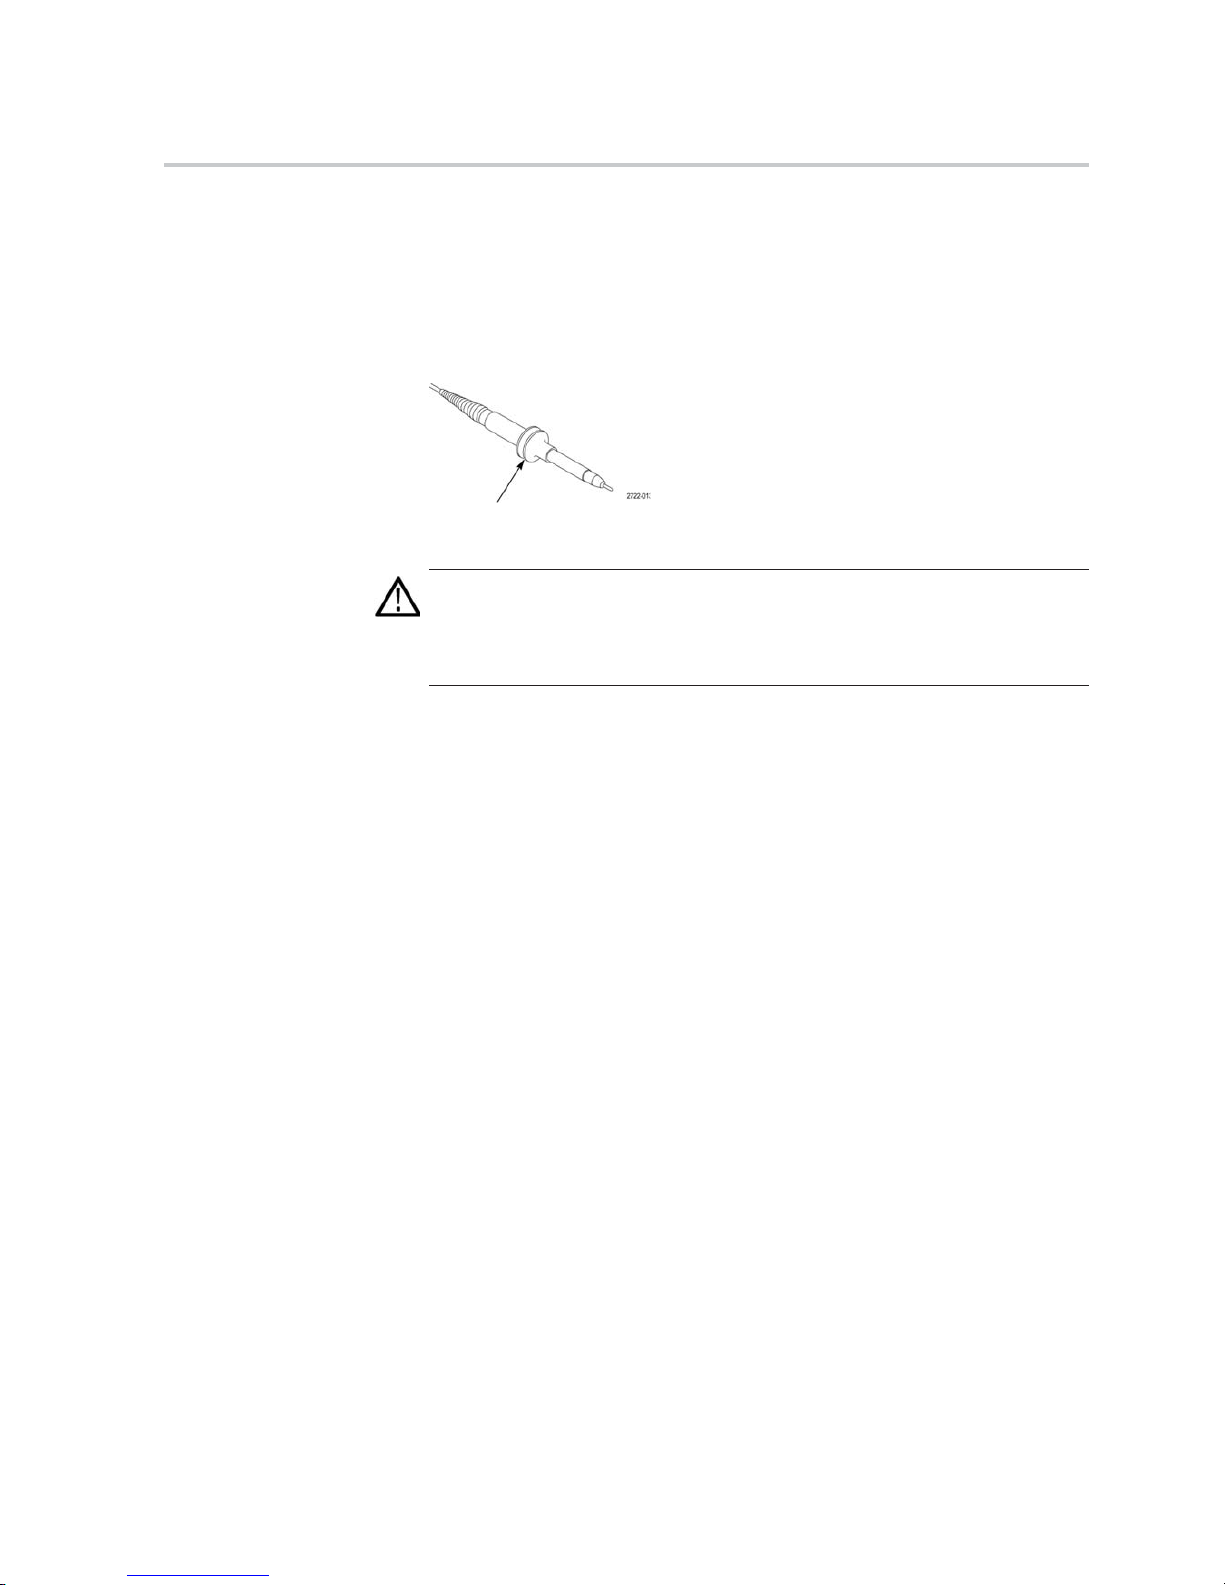
Probe Safety
Check and observe probe ratings before using probes.
A guard around the TPP0051, TPP0101, or TPP0201 probe body provides a nger
barrier for protection from electric shock.
Finger guard
WARNING. To avoid electric shock when using the probe, keep ngers behind
the guard on the probe body.
To avoid electric shock while using the probe, do not touch metallic portions of
the probe head while it is connected to a voltage source.
Connect the probe to the oscilloscope, and connect the ground terminal to ground
before you take any measurements.
TBS1000B and TBS1000B-EDU Series Oscilloscopes User Manual 5
Page 26
Getting Started
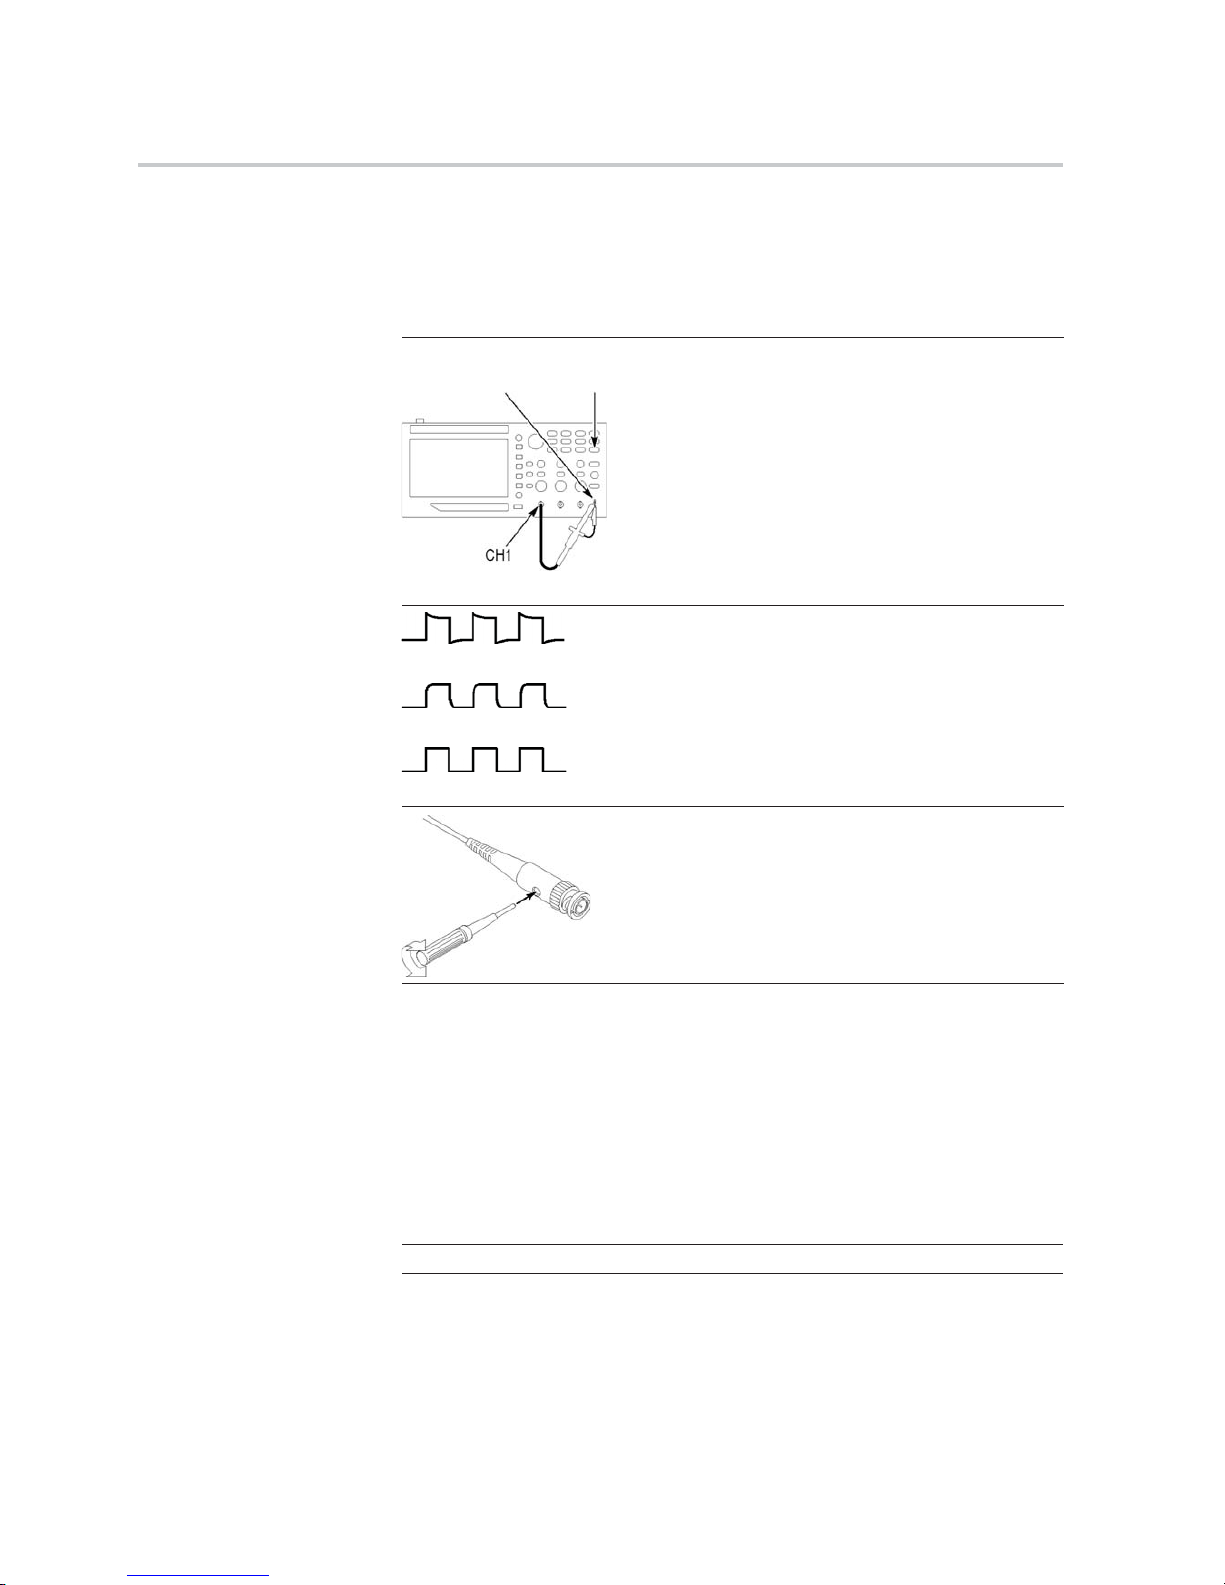
Manual Probe C
ompensation
You can manually perform this adjustment to match your probe to the input
channel.
PROBE COMP
Autoset
button
1. Push the 1 Probe Vo ltag e Attenuation
option and select 10X. Connect the appropriate
TPP0051, TP
P0101, or TPP0201 probe to
channel 1 on the oscilloscope. If you use the
probe hook-tip, ensure a proper connection by
rmly inse
rting the tip onto the probe.
2. Attach the probe tip to the PROBE COMP
~5V@1kHz terminal and the reference lead to
the PROBE C
OMP chassis terminal. Display the
channel, and then push the Autoset button.
Overcompensated
Undercompensated
Compensated correctly
3. Check the shape of the displayed waveform.
4. If necessary, adjust your probe.
Repea
t as necessary.
Probe Attenuation Setting
Probes are available with various attenuation factors which affect the vertical
scale of the signal.
Select the factor that matches the attenuation of your probe. For example, to
match a probe set to 10X connected to CH 1, push the 1 Probe Volt age
Attenuation option, and select 10X.
NOTE. The default setting for the Attenuation option is 10X.
6 TBS1000B and TBS1000B-EDU Series Oscilloscopes User Manual
Page 27

Getting Started
If you change th
e Attenuation switch on a P2220 probe, you also need to change
the oscilloscope Attenuation option to match. Switch settings are 1X and 10X.
Attenuation switch
NOTE. When the Attenuation switch is set to 1X, the P2220 probe limits the
bandwidth of the oscilloscope to 6 MHz. To use the full bandwidth of the
oscilloscope, be sure to set the switch to 10X.
Current P
robe Scaling
Current probes provide a voltage signal proportional to the current. You need to
set the oscilloscope to match the scale of your current probe. The default scale is
10 A/V.
For example, to set the scale for a current probe connected to channel 1, push the
1 Prob
e Current Scale option, and select an appropriate value.
Self Calibration
The s
elf calibration routine lets you optimize the oscilloscope signal path for
maximum measurement accuracy. You can run the routine at any time but you
should always run the routine if the ambient temperature changes by 5 °C (9 °F)
or more. The routine takes about two minutes.
For accurate calibration, power on the oscilloscope and wait twenty minutes to
ensure it is warmed up.
To compensate the signal path, disconnect any probes or cables from the input
connectors. Then, access the Utility Do Self Cal option, and follow the
directions on the screen.
TBS1000B and TBS1000B-EDU Series Oscilloscopes User Manual 7
Page 28

Getting Started
Firmware Updates Through the Internet
Update your TBS1000B’s rmware to take advantage of new features and bug
xes. You can use the Internet and a USB ash drive to update your oscilloscope.
If you do not have access to the Internet, contact Tektronix for information on
update procedures.
Check the ve
rsion of your
current rmware
1. Power on the oscilloscope.
2. For the TBDS1000B: Push Utility - more - page 1 of 2 System Status
Misc..
For the TBDS1000B-EDU: Push Utility - more - page 1 of 3 - more page 2 of 3 System Status Misc..
3. The oscilloscope displays the rmware version number.
Check the version of the
latest available rmware
1. Open up a
Webbrowserandgotowww.tektronix.com/software.
2. Enter “TBS1000B” in the search box.
3. Scan the list of available software for the latest TBS1000B rmware. Check
the version number.
If the
latest available
rmware Is newer than that
on your TBS1000B, update
your
product’s rmware
1. Download the latest rmware from www.tektronix.com/software to your PC.
Unzip the les, if needed, and copy the designated rmware le into the root
folder of a USB ash drive.
2. Insert the USB ash drive into the front-panel USB port on your oscilloscope.
3. Push Utility - more - page 1 of 2 File Utilities - more - page 1 of 2
Update Firmware Update Firmware
It takes several minutes to update the rmware. Your oscilloscope will prompt
you when the update is complete. Do not remove the USB ash drive or power
off the oscilloscope until the rmware update is complete.
8 TBS1000B and TBS1000B-EDU Series Oscilloscopes User Manual
Page 29
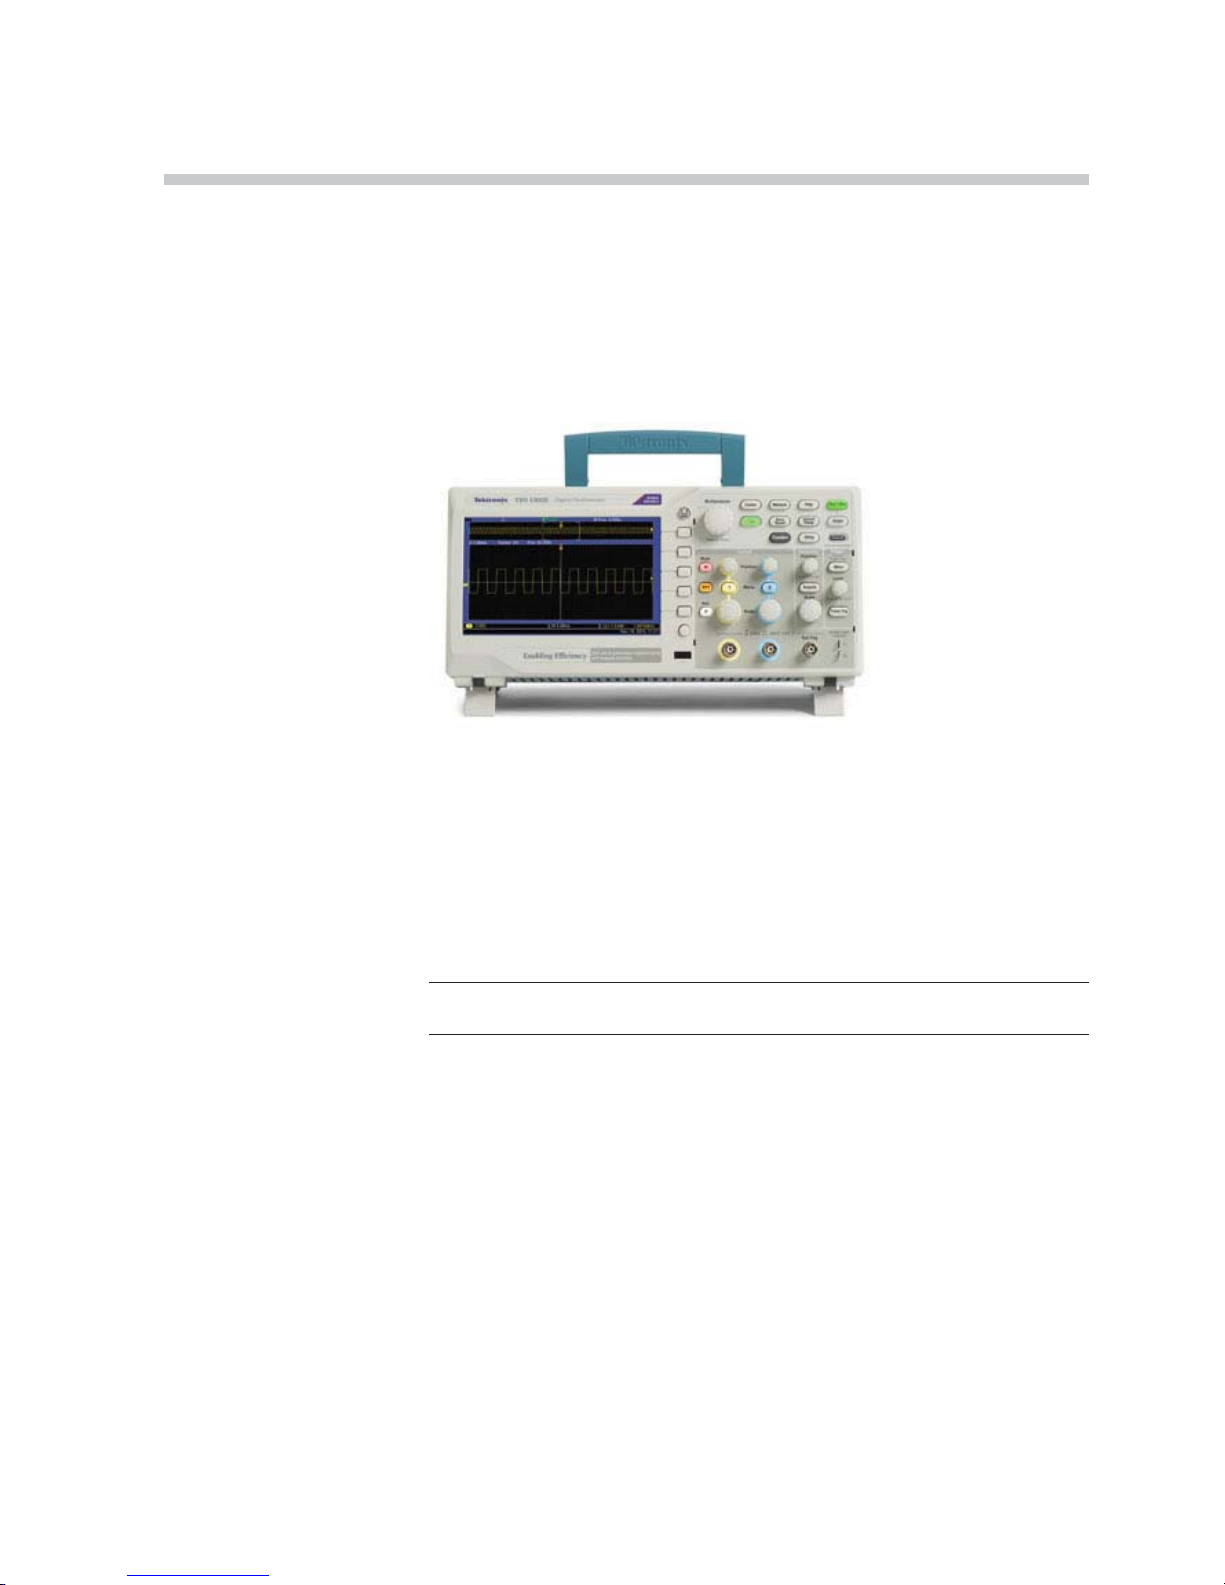
Operating Basics
The front panel is divided into easy-to-use functional areas. This chapter provides
you with a quick overview of the controls and the information displayed on the
screen.
Display Area
In add
ition to displaying waveforms, the display provides details about the
waveform and the oscilloscope control settings.
NOTE. For details on displaying the FFT function, (See page 53, Displaying
the FFT Spectrum.)
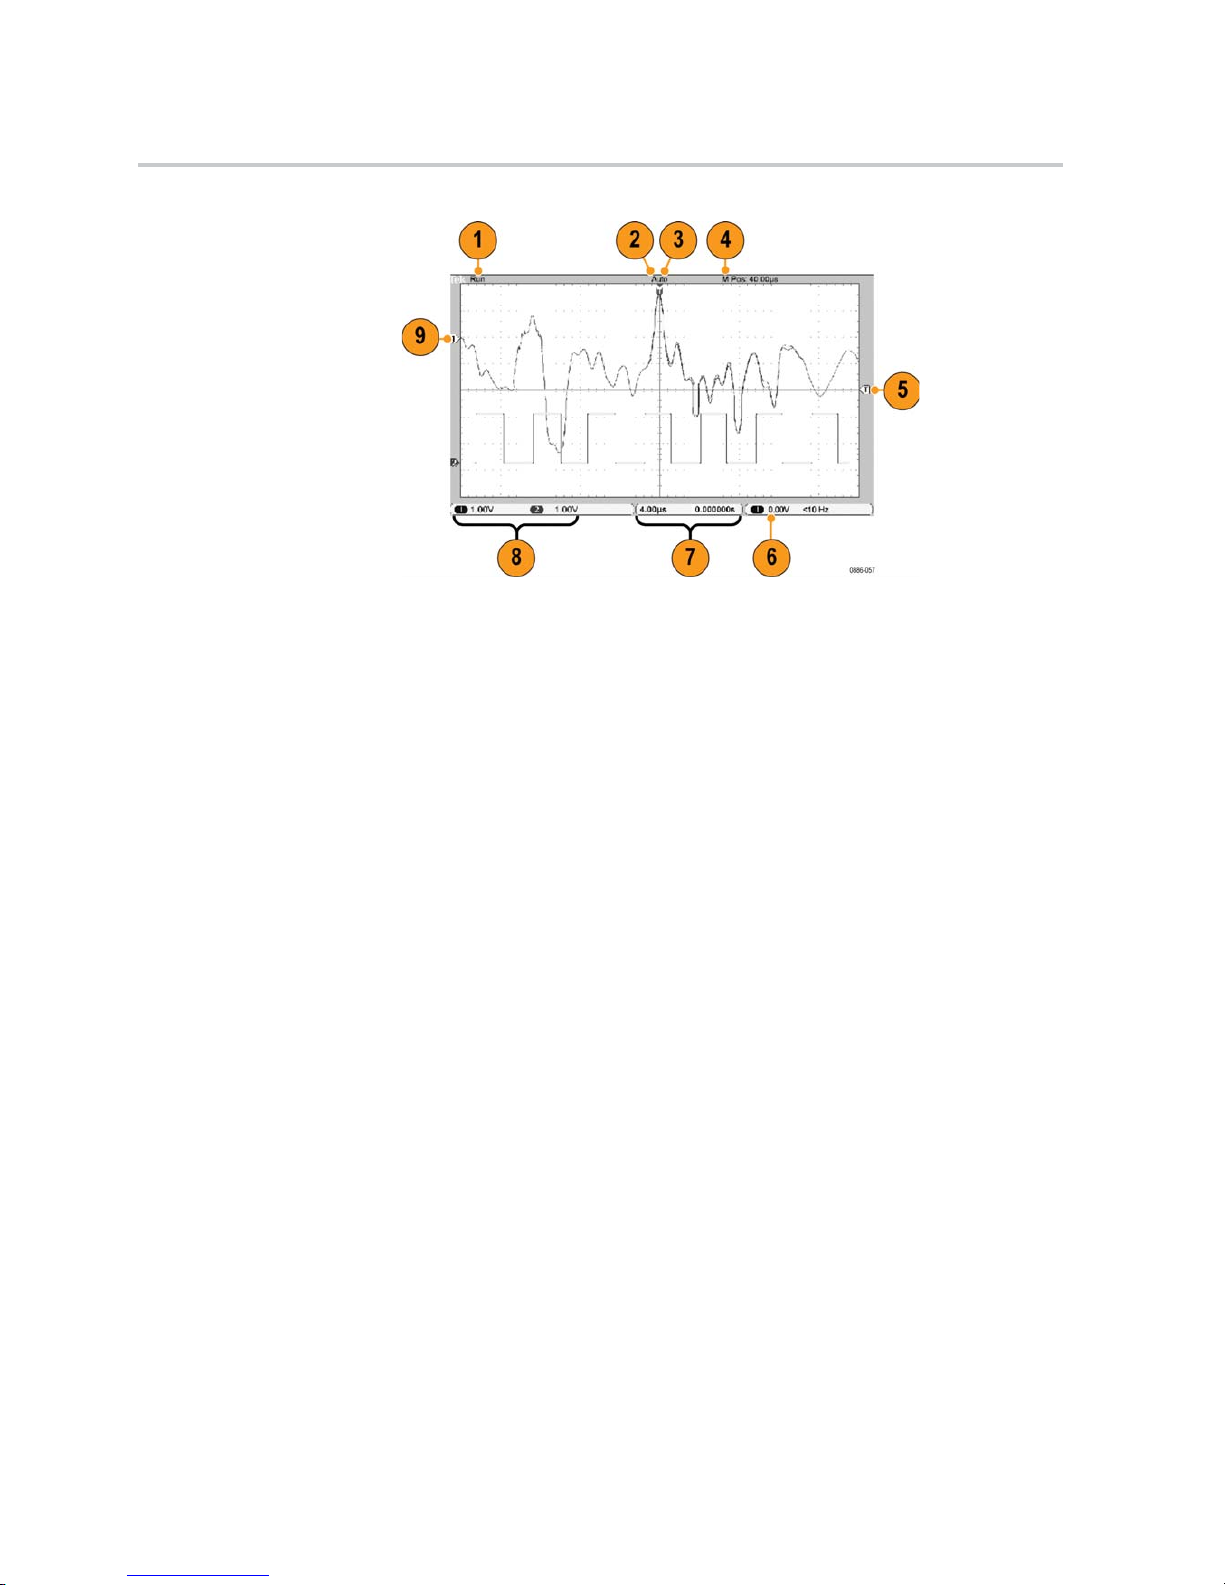
The items shown below may appear in the display. Not all of these items are
visible at any given time. Some readouts move outside the graticule area when
menus are turned off.
TBS1000B and TBS1000B-EDU Series Oscilloscopes User Manual 9
Page 30
Operating Basics
1. The acquisition readout shows when an acquisition is running or stopped.
Icons are:
Run: Acquisition enabled
Stop: Acquisitions not enabled.
2. The trigger position icon shows the trigger position in the acquisition. Turn
the Horizontal Posit
ion knob to adjust the position of the marker.
3. The trigger status readout shows:
Armed: The oscilloscope is acquiring pretrigger data. All triggers are ignored
in this state.
Ready: All pretrigger data has been acquired and the oscilloscope is ready to
accept a trigger.
Trig’d: The oscilloscope has seen a trigger and is acquiring the posttrigger
data.
Stop: The oscilloscope has stopped acquiring waveform data.
Acq. Complete: The oscilloscope ha
s completed a Single Sequence
acquisition.
Auto: The oscilloscope is in auto mode and is acquiring waveforms in the
absence of trigger.
Scan: The oscilloscope is acquiring and displaying waveform data
continuously in scan mode.
4. The center graticule readout shows the time at the center graticule. The
trigger time is zero.
5. The trigger level icon shows the Edge or Pulse Width trigger level on the
waveform. The icon color corresponds to the trigger source color.
10 TBS1000B and TBS1000B-EDU Series Oscilloscopes User Manual
Page 31

Operating Basics
6. The trigger rea
dout shows the trigger source, level, and frequency. Trigger
readouts for other trigger types show other parameters.
7. The horizonta
l position/scale readout shows the main time base setting (adjust
with the Horizontal Scale knob).
8. The channel
readout shows the vertical scale factor (per division) for each
channel. Adjust with the Vertical Scale knob for each channel.
9. The wavefor
m baseline indicator shows the ground reference points (the
zero-volt level) of a waveform (ignoring the effect of offset). The icon colors
correspond to the waveform colors. If there is no marker, the channel is not
displayed.
Message Area
The oscilloscope displays a message area at the bottom of the screen that conveys
the following types of helpful information:
Suggestion of what you might want to do next, such as when you push the
Measure button and then the Ch1 button:
Use multipurpose purpose knob to select measurement type
Infor
mation about the action the oscilloscope performed, such as when you
push the Default Setup button:
Defa
ult setup recalled
Using the Menu System
Whe
n you push a front-panel button, the oscilloscope displays the corresponding
menu on the right side of the screen. The menu shows the options that are available
when you push the unlabeled option buttons directly to the right of the screen.
Vertical Controls
TBS1000B and TBS1000B-EDU Series Oscilloscopes User Manual 11
Page 32

Operating Basics
Position (1 and
2). Positions a waveform vertically.
1&2Menu. Displays the Vertical menu selections and toggles the display of the
channel waveform on and off.
Scale (1 & 2). Selects vertical scale factors.
Horizontal Controls
Position. Adjusts the horizontal position of all channel and math waveforms. The
resolution of this control varies with the time base setting.
NOTE.
To make a large adjustment to the horizontal position, turn the Horizontal
Scale knob to a larger value, change the horizontal position, and then turn the
Horizontal Scale knob back to the previous value.
NOTE
. To set the horizontal position to zero, push the horizontal position knob.
Acquire. Displays the acquisition modes — Sample, Peak Detect, and Average.
Sc
ale. Selects the horizontal time/division (scale factor).
12 TBS1000B and TBS1000B-EDU Series Oscilloscopes User Manual
Page 33

Operating Basics
Trigger Contr
ols
Trigger Menu. When it is pressed once, it displays the Trigger Menu. When it is
kept pressed for more than 1.5 seconds, it will show the trigger view, meaning
it will di
splay the trigger waveform in place of the channel waveform. Use the
trigger view to see how the trigger settings, such as coupling, affect the trigger
signal. Releasing the button will stop the trigger view.
Level. When you use an Edge or Pulse trigger, the Level knob sets the amplitude
level that the signal must cross to acquire a waveform. Push this knob to set
the tri
gger level to the vertical midpoint between the peaks of the trigger signal
(set to 50%).
Force Trig. Use this to complete the waveform acquisition whether or not the
oscilloscope detects a trigger. This is useful for single sequence acquisitions
and Normal trigger mode. (In Auto trigger mode, the oscilloscope automatically
forc
es triggers periodically if it does not detect a trigger.)
Menu and Control Buttons
TBS1000B and TBS1000B-EDU Series Oscilloscopes User Manual 13
Page 34

Operating Basics
Refer to the Ref
erence chapter for detailed information on the menu and button
controls.
Multipurpose Knob. Thefunctionisdeterminedbythedisplayedmenuorselected
menu option. When active, the adjacent LED lights. The next table lists the
functions.
Active menu or option Knob operation Description
Cursor
Turn
Scroll to position the selected cursor
Help Turn, push Highlights entries in the Index.
Highlights links in a topic. Push to
select the highlighted item.
Math Turn, push
Scroll to position and scale the Math
waveform. Scroll and push to select
the operation.
FFT Turn, push
Scroll and push to select source,
window type and zoom values
Turn, push
Scroll to highlight and push to select
the type of automatic measurement for
each source
Measure
Turn
Scroll to position the selected gating
cursors
Save/Recall
Turn, push
Scroll to highlight and push toselect the
action and le format. Scroll through
the list of les.
Trigger Turn, push
Scroll to highlight and push to select
the trigger type, source, slope, mode,
coupling, polarity, sync, video standard,
trigger when operation. Turn to set the
trigger holdoff and pulse width values .
Utility
Scroll, push Scroll to highlight and push to select
miscellaneous menu items. Turn to set
the backlight value.
Vertical
Scroll, push Scroll to highlight and push to select
miscellaneous menu items.
Zoom
Scroll Scroll to change the scale and position
of the zoom window.
Save/Recall. Displays the Save/Recall Menu for setups and waveforms.
Measure. Displays the automated measurements menu.
Acquire. Displays the Acquire Menu.
Ref. Displays the Reference Menu to quickly display and hide reference
waveforms stored in the oscilloscope non-volatile memory.
14 TBS1000B and TBS1000B-EDU Series Oscilloscopes User Manual
Page 35

Operating Basics
Utility. Displ
ays the Utility Menu.
Cursor. Displays the Cursor Menu. Cursors remain visible (unless the Type
option is set to Off) after you leave the Cursor Menu but are not adjustable.
Help. Displays the Help Menu.
Default Setup. Recalls the factory setup.
Autoset. Automatically sets the oscilloscope controls to produce a usable display
of the input signals. When held for more than 1.5 seconds, displays the Autorange
Menu, and activates or deactivates the autoranging function.
Single. (Single sequence) Acquires a single waveform and then stops.
Run/Stop. Continuously acquires waveforms or stops the acquisition.
Save.
By default, performs the Save function to the USB ash drive.
Input Connectors
1&2.
Input connectors for waveform display.
Ext Trig. Input connector for an external trigger source. Use the Trigger Menu to
select the Ext, or Ext/5 trigger source. Push and hold the Trigger Menu button
to see trigger view, which will show how the trigger settings affect the trigger
signal, such as trigger coupling.
PROBE COMP. Probe compensation output and chassis reference. Use to
electrically match a voltage probe to the oscilloscope input circuit. (See page 6,
Manual Probe Compensation.)
TBS1000B and TBS1000B-EDU Series Oscilloscopes User Manual 15
Page 36

Operating Basics
Other Front-P
anel Items
USB Flash Drive port
USB Flash Drive Port. Insert a USB ash drive for data storage or retrieval.
For ash dr
ives with an LED, the LED blinks when saving data to or retrieving
data from the drive. Wait until the LED stops blinking before you remove the
drive.
16 TBS1000B and TBS1000B-EDU Series Oscilloscopes User Manual
Page 37

Understanding Oscilloscope Functions
This chapter contains general information that you need to understand before
you use an oscilloscope. To use your oscilloscope effectively, you need to learn
about the fol
lowing functions:
Setting up the oscilloscope
Triggering
Acquiring signals (waveforms)
Scaling and positioning waveforms
Measuring waveforms
The next gure shows a block diagram of the various functions of the oscilloscope
and their relationships to each other.
Setting Up the Oscilloscope
You should become familiar with several functions that you may use often when
operating your oscilloscope: Autoset, Autorange, saving a setup, and recalling
a setup.
Using Autoset
Each time you push the Autoset button, the Autoset function obtains a stable
waveform display for you. It automatically adjusts the vertical scale, horizontal
scale and trigger settings. Autoset also displays several automatic measurements
in the graticule area, depending on the signal type.
Using Autorange
Autorange is a continuous function that you can enable or disable. The function
adjusts setup values to track a signal when the signal exhibits large changes or
when you physically move the probe to a different point. To use autorange, push
the Autoset button for more than 1.5 seconds.
TBS1000B and TBS1000B-EDU Series Oscilloscopes User Manual 17
Page 38

Understanding Oscilloscope Functions
Saving a Setup
The oscillosco
pe saves the current setup if you wait ve seconds after the last
change before you power off the oscilloscope. The oscilloscope recalls this setup
the next time you apply power.
You can use the Save/Recall Menu to save up to ten different setups.
You can also
save setups to a USB ash drive. The oscilloscope accommodates
a USB ash drive for removable data storage and retrieval. (See page 59, USB
Flash Drive Port.)
Recalling a Setup
The oscill
oscope can recall the last setup before the oscilloscope was powered off,
any saved setups, or the default setup. (See page 92, Save/Recall.)
Default Setup
The oscilloscope is set up for normal operation when it is shipped from the
factory
. This is the default setup. To recall this setup, push the Default Setup
button. To view the default settings, refer to Appendix D: Default Setup.
Triggering
The trigger determines when the oscilloscope starts to acquire data and to display
a waveform. When a trigger is set up properly, the oscilloscope converts unstable
displays or blank screens into meaningful waveforms.
Triggered waveform Untriggered waveforms
For oscilloscope-specic descriptions, refer to the Operating Basics chapter. (See
page 13, Trigger Controls.) Refer also to the Reference chapter. (See page 96,
Trigger Controls.)
When you push the Run/Stop or Single button to start an acquisition, the
oscilloscope goes through the following steps:
1. Acquires enough data to ll the portion of the waveform record to the left of
the trigger point. This is called the pretrigger.
2. Continues to acquire data while waiting for the trigger condition to occur.
3. Detects the trigger condition.
18 TBS1000B and TBS1000B-EDU Series Oscilloscopes User Manual
Page 39

Understanding Oscilloscope Functions
4. Continues to ac
quire data until the waveform record is full.
5. Displays the newly-acquired waveform.
NOTE. For Edg
e and Pulse triggers, the oscilloscope counts the rate at which
trigger events occur to determine trigger frequency. The oscilloscope displays
the frequency in the lower right corner of the screen.
Source
You can use the Trigger Source options to select the signal that the oscilloscope
uses as a trigger. The source can be the AC power line (available only with Edge
triggers), or any signal connected to a channel BNC or to the Ext Trig BNC.
Types
The oscilloscope provides three types of triggers: Edge, Video, and Pulse Width.
Modes
You can select the Auto or the Normal trigger mode to dene how the oscilloscope
acquires data when it does not detect a trigger condition. (See page 97, Mode
Options.)
To perform a single sequence acquisition, push the Single button.
Coupling
You can use the Trigger Coupling option to determine which part of the signal
will pass to the trigger circuit. This can help you attain a stable display of the
waveform.
To use trigger coupling, push the Trigg e r Me nu button, select an Edge or Pulse
trigger, and select a Coupling option.
NOTE. Trigger coupling affects only the signal passed to the trigger system. It
does not affect the bandwidth or coupling of the signal displayed on the screen.
To view the conditioned signal being passed to the trigger circuit, enable trigger
view by pushing and holding down the Tr i g ge r Menu button for more than
1
.5 seconds.
Position
The horizontal position control establishes the time between the trigger and the
screen center. Refer to Horizontal Scale and Position; Pretrigger Information
for information on how to use this control to position the trigger. (See page 21,
Horizontal Scale and Position; Pretrigger Information.)
TBS1000B and TBS1000B-EDU Series Oscilloscopes User Manual 19
Page 40

Understanding Oscilloscope Functions
Slope and Level
The Slope and Le
vel controls help to dene the trigger. The Slope option (Edge
trigger type only) determines whether the oscilloscope nds the trigger point on
the rising or the falling edge of a signal. The Trigger Level knob controls where
on the edge the trigger point occurs.
Rising edge Falling edge
Trigger level can be adjusted
vertically
Trigger can be rising or falling
Acquiring Signals
When you a
cquire a signal, the oscilloscope converts it into a digital form and
displays a waveform. The acquisition mode denes how the signal is digitized,
and the time base setting affects the time span and level of detail in the acquisition.
Acquisition Modes
There a
re three acquisition modes: Sample, Peak Detect, and Average.
Sample. In this acquisition mode, the oscilloscope samples the signal in evenly
spaced intervals to construct the waveform. This mode accurately represents
signals most of the time.
However, this mode does not acquire rapid variations in the signal that may occur
between samples. This can result in aliasing, and may cause narrow pulses to be
missed. In these cases, you should use the Peak Detect mode to acquire data.
(Se
epage22,Time Domain Aliasing.)
Peak Detect. In this acquisition mode, the oscilloscope nds the highest and
lowest values of the input signal over each sample interval and uses these values
to display the waveform. In this way, the oscilloscope can acquire and display
narrow pulses, which may have otherwise been missed in Sample mode. Noise
w
ill appear to be higher in this mode.
Average. In this acquisition mode, the oscilloscope acquires several waveforms,
averages them, and displays the resulting waveform. You can use this mode to
reduce random noise.
Time Base
The oscilloscope digitizes waveforms by acquiring the value of an input signal
at discrete points. The time base allows you to control how often the values are
digitized.
20 TBS1000B and TBS1000B-EDU Series Oscilloscopes User Manual
Page 41

Understanding Oscilloscope Functions
To adjust the ti
me base to a horizontal scale that suits your purpose, use the
Horizontal Scale knob.
Scaling and Positioning Waveforms
You can change the display of waveforms by adjusting the scale and position.
When you change the scale, the waveform display will increase or decrease in size.
When you change the position, the waveform will move up, down, right, or left.
The channel indicator (located on the left of the graticule) identies each
waveform on the display. The indicator points to the ground reference level of
the waveform record.
You can view the display area and readouts. (See page 9, Display Area.)
Vertical Scale and Position
You can change the vertical position of waveforms by moving them up or down in
the display. To compare data, you can align a waveform above another or you can
align waveforms on top of each other.
You can change the vertical scale of a waveform. The waveform display will
contract or expand relative to the ground reference level.
For oscilloscope-specic descriptions, refer to the Operating Basics chapter. (See
page 11, Vertical Controls.) ReferalsototheReference chapter. (See page 106,
Vertical Controls.)
Horizontal Scale and
Position; Pretrigger
Information
You can adjust the Horizontal Position control to view waveform data before
the trigger, after the trigger, or some of each. When you change the horizontal
position of a waveform, you are actually changing the time between the trigger
and
the center of the display. (This appears to move the waveform to the right
or left on the display.)
Fo
r example, if you want to nd the cause of a glitch in your test circuit, you
might trigger on the glitch and make the pretrigger period large enough to capture
data before the glitch. You can then analyze the pretrigger data and perhaps nd
the cause of the glitch.
You change the horizontal scale of all the waveforms by turning the Horizontal
Scale knob. For example, you might want to see just one cycle of a waveform to
measure the overshoot on its rising edge.
The oscilloscope shows the horizontal scale as time per division in the scale
readout. Since all active waveforms use the same time base, the oscilloscope only
displays one value for all the active channels, except when you use zoom feature.
For oscilloscope-specic descriptions, refer to the Operating Basics chapter. (See
page 12, Position.) ReferalsototheReference chapter. (See page 85, Horizontal.)
TBS1000B and TBS1000B-EDU Series Oscilloscopes User Manual 21
Page 42

Understanding Oscilloscope Functions
Time Domain Ali
asing. Aliasing occurs when the oscilloscope does not sample the
signal fast enough to construct an accurate waveform record. When this happens,
the oscilloscope displays a waveform with a frequency lower than the actual input
waveform, or triggers and displays an unstable waveform.
Actual high-frequency waveform
Apparent low-frequency
waveform du
etoaliasing
Sample points
The oscilloscope accurately represents signals, but is limited by the probe
bandwidth, the oscilloscope bandwidth, and the sample rate. To avoid aliasing,
the oscilloscope must sample the signal more than twice as fast as the highest
frequenc
y component of the signal.
The highest frequency that the oscilloscope sampling rate can theoretically
represe
nt is the Nyquist frequency. The sample rate is called the Nyquist rate, and
is twice the Nyquist frequency.
The osc
illoscope maximum sample rates are at least ten times the bandwidth.
These high sample rates help reduce the possibility of aliasing.
There
are several ways to check for aliasing:
Turn the horizontal Scale knob to change the horizontal scale. If the shape of
the w
aveform changes drastically, you may have aliasing.
Select the Peak Detect acquisition mode. (See page 20, Peak Detect.) This
mode
samples the highest and lowest values so that the oscilloscope can
detect faster signals. If the shape of the waveform changes drastically, you
may have aliasing.
If the trigger frequency is faster than the display information, you may have
aliasing or a waveform that crosses the trigger level multiple times. Examining
the waveform allows you to identify whether the shape of the signal is going
to allow a single trigger crossing per cycle at the selected trigger level.
If multiple triggers are likely to occur, select a trigger level that will generate
only a single trigger per cycle. If the trigger frequency is still faster than the
display indicates, you may have aliasing.
If the trigger frequency is slower, this test is not useful.
22 TBS1000B and TBS1000B-EDU Series Oscilloscopes User Manual
Page 43

Understanding Oscilloscope Functions
If the signal yo
u are viewing is also the trigger source, use the graticule or the
cursors to estimate the frequency of the displayed waveform. Compare this to
the Trigger Frequency readout in the lower right corner of the screen. If they
differ by a large amount, you may have aliasing.
Taking Measurements
The oscilloscope displays graphs of voltage versus time and can help you to
measure the displayed waveform.
There are several ways to take measurements. You can use the graticule, the
cursors, or an automated measurement.
Graticule
This method allows you to make a quick, visual estimate. For example, you might
look at a waveform amplitude and determine that it is a little more than 100 mV.
You can take simpl
e measurements by counting the major and minor graticule
divisions involved and multiplying by the scale factor.
For example, if you counted ve major vertical graticule divisions between the
minimum and maximum values of a waveform and knew you had a scale factor of
100 mV/division, then you could calculate your peak-to-peak voltage as follows:
5 divisions x 100 mV/division = 500 mV
Cursor
Cursors
This method allows you to take measurements by moving the cursors, which
always appear in pairs, and reading their numeric values from the display readouts.
There are two types of cursors: Amplitude and Time.
When you use cursors, be sure to set Source to the waveform on the display that
you want to measure.
You can use the cursors to dene the measurement gating area, after you have
turned on Measure Gating in the Measure menu. The oscilloscope will restrict
the gated measurement you take to the data between the two cursors.
To use cursors, push the Cursor button.
TBS1000B and TBS1000B-EDU Series Oscilloscopes User Manual 23
Page 44

Understanding Oscilloscope Functions
Amplitude Curs
ors. Amplitude cursors appear as horizontal lines on the display
and measure the vertical parameters. Amplitudes are referenced to the reference
level. For the FFT function, these cursors measure magnitude.
Time Cursors. Time cursors appear as vertical lines on the display and measure
both horizontal and vertical parameters. Times are referenced to the trigger point.
For the FFT f
unction, these cursors measure frequency.
Time cursors also include a readout of the waveform amplitude at the point the
waveform c
rosses the cursor.
Automatic
The Measure Menu can take up to six automatic measurements. When you
take automatic measurements, the oscilloscope does all the calculating for you.
Because
the measurements use the waveform record points, they are more
accurate than the graticule or cursor measurements.
Automa
tic measurements use readouts to show measurement results. These
readouts are updated periodically as the oscilloscope acquires new data.
For me
asurement descriptions, refer to the Reference chapter. (See page 86,
Taking Measurements.)
24 TBS1000B and TBS1000B-EDU Series Oscilloscopes User Manual
Page 45

Application Examples
This section presents a series of application examples. These simplied examples
highlight the features of the oscilloscope and give you ideas for using it to solve
your own test problems.
Taking simple measurements
Using Autoset
Using the Measure Menu to take automatic measurements
Measuring
two signals and calculating gain
Using Autorange to examine a series of test points
Taking cursor measurements
Measuring ring frequency and ring amplitude
Measuring pulse width
Measuring rise time
Analyz
ing signal detail
Looking at a noisy signal
Using the average function to separate a signal from noise
Capturing a single-shot signal
Optimizing the acquisition
Measuring propagation delay
Tri
ggering on a pulse width
Triggering on a video signal
Triggering on video elds and video lines
Using the window function to see waveform details
Analyzing a differential communication signal using Math functions
Viewing impedance changes in a network using XY mode and persistence
Data logging (non-EDU models only)
Limit testing (non-EDU models only)
TBS1000B and TBS1000B-EDU Series Oscilloscopes User Manual 25
Page 46

Application Examples
Taking Simple
Measurements
You need to see a signal in a circuit, but you do not know the amplitude or
frequency of the signal. You want to quickly display the signal and measure the
frequency, p
eriod, and peak-to-peak amplitude.
Using Autoset
To quickly display a signal, follow these steps:
1. Push the 1 (channel 1 menu) button.
2. Push Probe Volta g e Attenuation 10X.
3. If usi
ng P2220 probes, set their switches to 10X.
4. Connect the channel 1 probe tip to the signal. Connect the reference lead to
the c
ircuit reference point.
5. Push the Autoset button.
The oscilloscope sets the vertical, horizontal, and trigger controls automatically.
If you want to optimize the display of the waveform, you can manually adjust
th
ese controls.
NOTE. The oscilloscope displays relevant automatic measurements in the
waveform area of the screen based on the signal type that is detected.
For oscilloscope-specic descriptions, refer to the Reference chapter. (See
page 73, Autoset.)
26 TBS1000B and TBS1000B-EDU Series Oscilloscopes User Manual
Page 47

Application Examples
Taking Automatic
Measurements
The oscillosco
pe can take automatic measurements of most displayed signals.
NOTE. If a question mark (?) appears in the Value readout, the signal is outside
the measurement range. Adjust the Vertical Scale knob (volts/division) of the
appropriate channel to decrease the sensitivity or change the horizontal Scale
setting (seconds/division).
To measure signal frequency, period, and peak-to-peak amplitude, rise time, and
positive w
idth, follow these steps:
1. Push the Measure button to see the Measure Menu.
2. Push the channel 1 or the 2 button. The measure menu appears to the left.
3. Turn the Multipurpose knob to highlight the desired measurement. Push the
knob to select the desired measurement. .
The Val u e readout displays the measurement and updates.
4. Push the channel 1 or 2 button to select another measurement. You can
display up to six measurements on the screen at a time.
Measure
Gating
On / Off
Ch1
Ch2
Math
Measurements
Period
Frequency
Peak-Peak
Minimum
Maximum
Mean
Cycle
Mean
Cursor
Mean
RMS
Cycle RMS
Cycle RMS
Rise Time
TBS1000B and TBS1000B-EDU Series Oscilloscopes User Manual 27
Page 48

Application Examples
Measuring Two Signals
If you are testi
ng a piece of equipment and need to measure the gain of the audio
amplier, you will need an audio generator that can inject a test signal at the
amplier input. Connect two oscilloscope channels to the amplier input and
output as shown next. Measure both signal levels and use the measurements to
calculate the gain.
Measure
Gating
On-Off
Ch1
Ch2
Math
To activate and display the signals connected to channel 1 and to channel 2, and
select measurements for the two channels, follow these steps:
1. Push the Autoset button.
2. Push the Measure button to see the Measure Menu.
3. Push the Ch1 side menu. The pop-up menu of measurement types appears to
the left.
4. Turn the Multipurpose knob to highlight Peak-Peak.
5. Push the Multipurpose knob to select Peak-Peak. A check should appear
next to the menu item and the Peak-to-Peak measurement for channel 1 should
appear towards the bottom of the display.
28 TBS1000B and TBS1000B-EDU Series Oscilloscopes User Manual
Page 49

Application Examples
6. Push the Ch1 sid
e menu. The pop-up menu of measurement types appears
to the left. .
7. Turn the Multi
purpose knob to highlight Peak-Peak.
8. Push the Multipurpose knobtoselectPeak-Peak. A check should appear
next to the m
enu item and the peak-to-peak for channel 2 should appear
towards the bottom of the display.
9. Read the dis
played peak-to-peak amplitudes for both channels.
10. To calculate the amplier voltage gain, use these equations:
VoltageGain = output amplitude/input amplitude
VoltageGain (dB) = 20 × log
10
(VoltageGain)
TBS1000B and TBS1000B-EDU Series Oscilloscopes User Manual 29
Page 50

Application Examples
Using Autoran
ge to Examine a Series of Test Points
If you have a machine that is malfunctioning, you may need to nd the frequency
and RMS voltage of several test points, and compare these values to ideal values.
You a r e n o t a b
le to access front-panel controls since you need to use both hands
when probing test points that are difcult to physically reach.
1. Push the 1 (channel 1 menu) button.
2. Push Probe Voltage Attenuation. Chose the attenuation of the probe
attached to channel 1 from the pop-out selectable list of values by turning
and pushing the Multipurpose knob.
3. Push the Autoset button for more than 1.5 seconds to activate autoranging,
and select the Vertical and Horizontal option.
4. Push the Measure button to see the Measure Menu.
5. Push Ch1.
6. Turn the Multipurpose knob to select Frequency.
7. Push Ch2.
8. Turn the Multipurpose knob to select Cycle RMS.
9. Attach the probe tip and reference lead to the rst test point. Read the
frequency and cycle RMS measurements from the oscilloscope display and
compare these to the ideal values.
10. Repeat the preceding step for each test point, until you nd the malfunctioning
component.
NOTE. When Autorange is active, each time you move the probe to another test
point, the oscilloscope readjusts the horizontal scale, the vertical scale, and the
trigger level, to give you a useful display.
Taking Cursor Measurements
You can use the cursors to quickly take time and amplitude measurements on
a waveform.
Measuring Ring Frequency
and Amplitude
To measure the ring frequency at the rising edge of a signal, follow these steps:
1. Push the Cursor front-panel button to see the Cursor Menu.
2. Push the Ty p e side-menu button. A pop-out menu should appear showing a
scroll-able list of the available cursor types.
3. Turn the Multipurpose knob to highlight Time.
4. Push the Multipurpose knob to select Time.
30 TBS1000B and TBS1000B-EDU Series Oscilloscopes User Manual
Page 51

Application Examples
5. Push the Source
side-menu button. A pop-out menu should appear showing a
scroll-able list of the available sources.
6. Turn the Multi
purpose knob to highlight Ch1.
7. Push the Multipurpose knobtoselectCh1.
8. Push the Cursor 1 option button.
9. Turn the Multipurpose knob to place a cursor on the rst peak of the ring.
10. Push the Cursor 2 option button.
11. Turn the Multipurpose knob to place a cursor on the second peak of the ring.
You c a n s e
e the (delta) time and frequency (the measured ring frequency)
in the Cursor Menu.
Type
Time
Source
Ch1
t 540.0ns
1/t
1.852MHz
V 0.44V
Cursor1
180ns
1.40V
Cursor2
720ns
0.96V
12. Push the Typ e side-menu button. A pop-out menu should appear showing a
scroll-able list of the available cursor types.
13. Turn the Multipurpose knob to highlight Amplitude.
14. Push the Multipurpose knob to select Amplitude.
15. Push the Cursor 1 option button.
16. Turn the Multipurpose knob to place a cursor on the rst peak of the ring.
17. Push the Cursor 2 option button.
18. Turn the Multipurpose knob to place Cursor 2 on the lowest part of the ring.
You can see the amplitude of the ring in the Cursor Menu.
TBS1000B and TBS1000B-EDU Series Oscilloscopes User Manual 31
Page 52

Application Examples
Type
Amplitude
Source
Ch1
V 640mV
Cursor 1
1.46V
Cursor 2
820mV
Measuring Pulse Width
If you are analyzing a pulse waveform and you want to know the width of the
pulse, fol
low these steps:
1. Push the Cursor button to see the Cursor Menu.
2. Push the Ty p e side-menu button. A pop-out menu should appear showing a
scroll-able list of the available cursor types.
3. Turn the Multipurpose knob to highlight Time.
4. Push the Multipurpose knob to select Time.
5. Push the Cursor 1 option button.
6. Turn the Multipurpose knob to place a cursor on the rising edge of the pulse.
7. Push t
he Cursor 2 option button.
8. Turn the Multipurpose knob to place a cursor on the falling edge of the pulse.
You can see the following measurements in the Cursor Menu:
The time at Cursor 1, relative to the trigger.
The time at Cursor 2, relative to the trigger.
The (delta) time, which is the pulse width measurement.
32 TBS1000B and TBS1000B-EDU Series Oscilloscopes User Manual
Page 53

Application Examples
Type
Time
Source
Ch1
t 500.0μs
1/t 2.000kHz
V 1.38V
Cursor 1
0.00s
0.98V
Cursor 2
500μs
-1.00V
NOTE. The Positive Width measurement is available as an automatic measurement
in the Measure Menu. (See page 86, Taking Measurements.)
Measuring Rise Time
After measuring the pulse width, you decide that you need to check the rise time
of the pulse. Typically, you measure rise time between the 10% and 90% levels of
the waveform. To measure the rise time, follow these steps:
1. Turn the Horizontal Scale (seconds/division) knob to display the rising edge
of the waveform.
2. Turn the Vertical Scale (volts/division) and Vertical Position knobs to set
the waveform amplitude to about ve divisions.
3. Push the 1 (channel 1 menu) button.
4. Push Volts / Div Fine.
5. Turn the Ver t ica l Sc a le (volts/division) knob to set the waveform amplitude
to exactly ve divisions.
6. Turn the Vertical Position knob to center the waveform; position the baseline
of the waveform 2.5 divisions below the center graticule.
7. Push the Cursor button to see the Cursor Menu.
8. Push the Ty p e side-menu button. A pop-out menu should appear showing a
scroll-able list of the available cursor types.
9. Turn the Multipurpose knob to highlight Time.
10. Push the Multipurpose knob to select Time.
11. Push the Source side-menu button. A pop-out menu should appear showing a
scroll-able list of the available sources.
12. Turn the Multipurpose knob to highlight Ch1.
13. Push the Multipurpose knobtoselectCh1.
TBS1000B and TBS1000B-EDU Series Oscilloscopes User Manual 33
Page 54

Application Examples
14. Push the Cursor
1 option button.
15. Turn the Multipurpose knob to place a cursor at the point where the
waveform crosses the second graticule line below center screen. This is the
10% level of the waveform.
16. Push the Cursor 2 option button.
17. Turn the Multipurpose knob to place a cursor at the point where the
waveform crosses the second graticule line above center screen. This is the
90% level of the waveform.
The t readout in the Cursor Menu is the rise time of the waveform.
5 divisions
Type
Time
Source
Ch1
t 140.0ns
1/t
7.143MHz
V 2.08V
Cursor 1
-80.0ns
-1.02V
Cursor 2
60.0ns
1.06V
NOTE. The Rise Time measurement is available as an automatic measurement in
the Measure Menu. (See page 86, Taking Measurements.)
Analyzing Signal Detail
You have a noisy signal displayed on the oscilloscope and you need to know more
about it. You suspect that the signal contains much more detail than you can
now see in the display.
34 TBS1000B and TBS1000B-EDU Series Oscilloscopes User Manual
Page 55

Application Examples
Looking at a Noisy Signal
The signal appe
ars noisy and you suspect that noise is causing problems in your
circuit. To better analyze the noise, follow these steps:
1. Push the Acqui
re button to see the Acquire Menu.
2. Push the Peak Detect option button.
Peak detect emphasizes noise spikes and glitches in your signal, especially when
the time base is set to a slow setting.
Separating the Signal from
Noise
Now you want to analyze the signal shape and ignore the noise. To reduce random
noise in the oscilloscope display, follow these steps:
1. Push the Acquire button to see the Acquire Menu.
2. Push the Average option button.
3. Turn the Multipurpose knob to highlight different numbers of averages from
the pop-up menu. As you push the knob to select a different number, you can
see the effects of varying the number of running averages on the waveform
display.
Averaging reduces random noise and makes it easier to see detail in a signal. In
the example below, a ring shows on the rising and falling edges of the signal when
the noise is removed.
TBS1000B and TBS1000B-EDU Series Oscilloscopes User Manual 35
Page 56

Application Examples
Capturing a Si
ngle-Shot Signal
The reliability of a reed relay in a piece of equipment has been poor and you need
to investigate the problem. You suspect that the relay contacts arc when the relay
opens. The fa
stest that you can open and close the relay is about once per minute,
so you need to capture the voltage across the relay as a single-shot acquisition.
To set up for a single-shot acquisition, follow these steps:
1. Turn the Ver t ica l S c ale (volts/division) and Horizontal Scale
(seconds/division) knobs to the appropriate ranges for the signal you expect to
see.
2. Push the Acquire button to see the Acquire Menu.
3. Push the Peak Detect option button.
4. Push the Tr igger Me n u button to see the Trigger Menu.
5. Push Slope.
6. Turn the Multipurpose knob to highlight Rising from the pop-out menu.
Push the knob to select the choice
7. Turn the front-panel Level knob to adjust the trigger level to a voltage midway
between the open and closed voltages of the relay.
8. Push the Single button to start the acquisition.
When the relay opens, the oscilloscope triggers and captures the event.
Optimizing the Acquisition
The initial acquisition shows the relay contact beginning to open at the trigger
point. This is followed by a large spike that indicates contact bounce and
inductance in the circuit. The inductance can cause contact arcing and premature
relay failure.
You can use the vertical, h
orizontal, and trigger controls to optimize the settings
before the next single-shot event is captured. When the next acquisition is
captured with the new settings (push the Single button again), you can see that the
contact bounces several times as it opens.
36 TBS1000B and TBS1000B-EDU Series Oscilloscopes User Manual
Page 57

Application Examples
TBS1000B and TBS1000B-EDU Series Oscilloscopes User Manual 37
Page 58

Application Examples
Measuring Propagation Delay
You suspect that the memory timing in a microprocessor circuit is marginal. Set
up the oscilloscope to measure the propagation delay between the chip-select
signal and the data output of the memory device.
Type
Time
Source
Ch1
t 20.00ns
1/t
50.00MHz
V 0.28V
Cursor 1
50.0ns
-0.20V
Cursor 2
70.0ns
0.08V
To set up to measure propagation delay, follow these steps:
1. Push the Autoset button to trigger a stable display.
2. Adjust the horizontal and vertical controls to optimize the display.
3. Push the Cursor button to see the Cursor Menu.
4. Push the Ty p e side-menu button. A pop-out menu should appear showing a
scroll-able list of the available cursor types.
5. Turn the Multipurpose knob to highlight Time.
6. Push the Multipurpose knob to select Time.
7. Push the Source side-menu button. A pop-out menu should appear showing a
scroll-able list of the available sources.
38 TBS1000B and TBS1000B-EDU Series Oscilloscopes User Manual
Page 59

Application Examples
8. Turn the Multip
urpose knob to highlight Ch1.
9. Push the Multipurpose knobtoselectCh1.
10. Push the Cursor 1 option button.
11. Push the Cursor 1 option button.
12. Turn the Multipurpose knob to place a cursor on the active edge of the
chip-select signal.
13. Push the Cursor 2 option button.
14. Turn the Multipurpose knob to place the second cursor on the data output
transition.
The t readout in the Cursor Menu is the propagation delay between the
waveforms. The readout is valid because the two waveforms have the same
horizontal scale (seconds/division) setting.
Triggering on a Specic Pulse Width
To set up a test for pulse width aberrations, follow these steps:
1. Pus
htheAutoset button to trigger a stable display.
2. Push the single cycle
option button in the Autoset Menu to view a
single cycle of the signal, and to quickly take a Pulse Width measurement.
3. Push the Tr ig g er M e nu button to see the Trigger Menu.
4. Push Type.
5. Turn the Multipurpose knob to highlight Pulse from the pop-out menu. Push
the knob to select the choice
6. Push Source.
7. Turn the Multipurpose knob to highlight Ch1 from the pop-out menu. Push
the knob to select the choice
TBS1000B and TBS1000B-EDU Series Oscilloscopes User Manual 39
Page 60

Application Examples
8. Turn the trigge
r Level knob to set the trigger level near the bottom of the
signal.
9. Push When = (e
quals).
10. Push Pulse Width.
11. Turn the Multipurpose knob to set the pulse width to the value reported by
the Pulse Width measurement in step 2.
12. Push More Mode Normal.
You can achieve a stable display with the oscilloscope triggering on normal pulses.
1. Push the When option button to select , <,or>. If there are any aberrant
pulses that meet the specied When condition, the oscilloscope triggers.
NOTE. The trigger frequency readout shows the frequency of events that the
oscilloscope might consider to be a trigger, and may be less than the frequency of
the input signal in Pulse Width trigger mode.
40 TBS1000B and TBS1000B-EDU Series Oscilloscopes User Manual
Page 61

Application Examples
Triggering on
a Video Signal
You are testing the video circuit in a piece of medical equipment and need to
display the video output signal. The video output is an NTSC standard signal. Use
the video tri
gger to obtain a stable display.
NOTE. Most video systems use 75 ohm cabling. The oscilloscope inputs do not
properly terminate low impedance cabling. To avoid amplitude inaccuracy
from improper loading and reections, place a 75 ohm feedthrough terminator
(Tektronix part number 011-0055-02 or equivalent) between the 75 ohm coaxial
cable from the signal source and the oscilloscope BNC input.
Triggering on Video Fields
Automatic. To trigger on the video elds, follow these steps:
1. Push the Autoset button. When Autoset is complete, the oscilloscope displays
the video signal with sync on All Fields.
The oscilloscope sets the Standard option when you use the Autoset function.
1. Push the Odd Field or Even Field option buttons from the Autoset Menu
to sync on odd or even elds only.
Manual. An alternative method requires more steps, but may be necessary
depending on the video signal. To use the manual method, follow these steps:
TBS1000B and TBS1000B-EDU Series Oscilloscopes User Manual 41
Page 62

Application Examples
1. Push the 1 (chan
nel 1 menu) button.
2. Push Coupling AC.
3. Push the Tr igger Me n u button to see the Trigger Menu.
4. Push the top option button and select Video.
5. Push Source Ch1.
6. Push the Sync option button and select All Fields, Odd Field,orEven Field.
7. On page 2 of
the side menu, push Standard NTSC.
8. Turn the Horizontal Scale (seconds/division) knob to see a complete eld
across th
e screen.
9. Turn the Ve rt i ca l Sc al e (volts/division) knob to ensure that the entire video
signal i
s visible on the screen.
42 TBS1000B and TBS1000B-EDU Series Oscilloscopes User Manual
Page 63

Application Examples
Triggering on V
ideo Lines
Automatic. Yo u
can also look at the video lines in the eld. To trigger on the
video lines, follow these steps:
1. Push the Autos
et button.
2. Push the top option button to select Line to sync on all lines. (The Autoset
Menu includ
es All Lines and Line Number options.)
Manual. An alternative method requires more steps, but may be necessary
depending on the video signal. To use this method, follow these steps:
1. Push the Tr ig g er M e nu button to see the Trigger Menu.
2. Push the top option button and select Video.
3. Push the S
ync option button and select All Lines or Line Number and turn
the Multipurpose knob to set a specic line number.
4. Push Sta
ndard NTSC.
5. Turn the Horizontal Scale (seconds/division) knob to see a complete video
line ac
ross the screen.
6. Turn the Ver t ic a l S c al e (volts/division) knob to ensure that the entire video
signa
l is visible on the screen.
Incoming video signal
TBS1000B and TBS1000B-EDU Series Oscilloscopes User Manual 43
Page 64

Application Examples
Using the Zoom Function
to See Waveform Details
You can use the z
oom function to examine a specic portion of a waveform
without changing the main display.
Ifyouwanttov
iew the color burst in the previous waveform in more detail
without changing the main display, follow these steps:
1. Push the Zoo
m front-panel button.
When pressing the Zoom button, the waveform display area will show original
waveform (a
bout ¼) and zoom in waveform (about ¾). And the menu area
will keep the original menu. If both channels are turned on at the same time,
there will be two zoom in waveforms at the top window.
2. Push the Scale side-menu button and turn the Multipurpose knobtochange
the zoom scale.
3. Push the Position side-menu button and turn the Multipurpose knob to
change the zoom position.
4. Turn the horizontal Scale (seconds/division) knob and select 500 ns. This will
be the seconds/division setting of the expanded view.
5. Turn the Horizontal Position knob to position the zoom window around the
portion of the waveform that you want to expand.
Analyzing a Differential Communication Signal
You are having intermittent problems with a serial data communication link, and
you suspect poor signal quality. Set up the oscilloscope to show you a snapshot of
the serial data stream so you can verify the signal levels and transition times.
Because this is a differential signal, you use the Math function of the oscilloscope
to view a better representation of the waveform.
44 TBS1000B and TBS1000B-EDU Series Oscilloscopes User Manual
Page 65

Application Examples
NOTE. B
e sure to rst compensate both probes. Differences in probe
compensation appear as errors in the differential signal.
To ac
tivate the differential signals connected to channel 1 and to channel 2,
follow these steps:
1. Push
the 1 (channel 1 menu) button and set the Probe Vol t age
Attenuation option to 10X.
2. Pus
hthe2 (channel 2 menu) button and set the Probe Vo lta g e
Attenuation option to 10X.
3. If
using P2220 probes, set their switches to 10X.
4. Push the Autoset button.
5. Push the Math button to see the Math Menu.
6. Push the Operation option button and select -.
TBS1000B and TBS1000B-EDU Series Oscilloscopes User Manual 45
Page 66

Application Examples
7. Push the Source
s Ch1-Ch2 option button to display a new waveform that is
the difference between the displayed waveforms.
8. To adjust the v
ertical scale and position of the Math waveform, follow these
steps:
a. Remove the c
hannel 1 and channel 2 waveforms from the display.
b. Turn the channel 1 and channel 2 Vertical Scale and Vertical Position
knobs to adj
ust the vertical scale and position of the Math waveform.
For a more stable display, push the Single button to control the acquisition of
the wavefo
rm. Each time you push the Single button, the oscilloscope acquires
a snapshot of the digital data stream. You can use the cursors or automatic
measurements to analyze the waveform, or you can store the waveform to analyze
later.
Viewing Impedance Changes in a Network
You have designed a circuit that needs to operate over a wide temperature range.
You need to evaluate the change in impedance of the circuit as the ambient
temperature is changed.
Connect the oscilloscope to monitor the input and output of the circuit and capture
the changes that occur as you vary the temperature.
46 TBS1000B and TBS1000B-EDU Series Oscilloscopes User Manual
Page 67

Application Examples
To view
the input and output of the circuit in an XY display, follow these steps:
1. Push the 1 (channel 1 menu) button.
2. Push Probe Voltage Attenuation 10X.
3. Push the 2 (channel 2 menu) button.
4. Push Probe Volt a ge Attenuation 10X.
5. If using P2220 probes, set their switches to 10X.
6. Con
nect the channel 1 probe to the input of the network, and connect the
channel 2 probe to the output.
7. Pu
sh the Autoset button.
8. Turn the Vertical Scale (volts/division) knobs to display approximately the
s
ame amplitude signals on each channel.
9. Push the Utility Display button to see the Display Menu.
10. Push Format XY.
TBS1000B and TBS1000B-EDU Series Oscilloscopes User Manual 47
Page 68

Application Examples
The oscillosco
pe displays a Lissajous pattern representing the input and
output characteristics of the circuit.
11. Turn the Verti
cal Scale and Vertical Position knobs to optimize the display.
12. Push Persist Innite.
As you adjust the ambient temperature, the display persistence captures the
changes in the characteristics of the circuit.
Data Logging (non-EDU models only)
You can use the oscilloscope to record data from a source over time. You can
congure
the trigger conditions and direct the oscilloscope to save all the triggered
waveform together with timing information over a dened time duration to a
USB memory device.
The USB host port on the front panel supports data logging. You can set up the
oscilloscope to save user- specied triggered waveforms to a USB device for up
to 24 hours. You can also select the "Innite" option for continuous waveform
monitoring. In the innite mode you can save your triggered waveforms to an
external USB memory device without a duration limitation until the memory
devic
e is full. The oscilloscope will then guide you to insert another USB memory
device to continue saving waveforms.
1. Con
gure the oscilloscope to use the desired trigger conditions to collect the
data. Also, insert a USB memory device in the front-panel USB port.
2. Pus
h the front-panel Function button.
3. Select Data Logging from the resulting side menu to bring up the data
lo
gging menu.
4. Push the Source button to select the signal source to log data from. You can
us
e either one of the input channels or the Math waveform.
5. Push the Duration button and turn and push the Multipurpose knob to select
t
he duration for data logging. The selections range from 0.5 hour to 8 hours in
30 minute increments and from 8 hours to 24 hours in 60 minute increments.
You can select Innite to run data logging with no set time limit.
6. Push the Select Folder button to dene where to store the collected
information. The resulting menu choices will let you either select an existing
folder or dene a new folder. When done, push Back to return to the main
data logging menu
7. Start the data acquisition, such as by pushing either the front-panel Single
or Run/Stop button.
8. Push Data Logging from the side menu to select On. This enables the data
logging feature. Before turning on the data logging feature, you must rst
48 TBS1000B and TBS1000B-EDU Series Oscilloscopes User Manual
Page 69

Application Examples
select the sour
ce, the time duration, and the folder, as dened in the steps
above.
9. When the oscilloscope nishes the requested data logging operation, it
displays a “Data logging completed” message and turns off the data logging
feature.
Limit Testing (non-EDU models only)
You can use the oscilloscope to monitor an active input signal against a template
and to output pass or fail results by judging whether the input signal is within the
bounds of the template.
Use the limit test if you need a Pass/Fail test to determine if a signal is good. Set
up the oscilloscope to automatically monitor a source signals and output Pass
or Fail results by evaluating whether or not the acquired waveform falls within
predened boundaries. The limit test feature allows you to create templates based
on one or two independent reference waveforms. If a failure is detected, a series
of specic actions can be triggered.
1. Push the front-panel Function button.
2. Select Limit Test from the resulting side menu to bring up the limit testing
menu.
3. Select Source from the side menu to dene the source of the waveform to
compare against the limit test template.
4. Select Compare To to specify the limit test template against which to
compare test signals sectioned with the Source menu item.
5. Push Template Setup from the side menu to dene the boundary to compare
with the input source signals.
If you pushed Template Setup, you can create the template with specic
horizontal and vertical tolerances. You can create them from channel 1,
channel 2, or the Math waveform. On page 2 of the resulting menu you can
push Display Template and toggle between On and Off to display or not
a stored template. Push Back from page 2 to return to the top level of the
limit test menu.
6. Push - more - page 1 of 2 to see the Action on Violation side-menu button.
Select it and then select an action from the resulting side menu to describe
what the oscilloscope will do after it detects a violation. You can select
between Save Waveform and Save Image.PushBack to return to the top
level of the limit test menu.
7. Push the Stop After butt
on from page 2 of the top level of the limit test menu.
Push the button with the same name on the resulting side menu. On the
resulting pop-out menu, turn and push the Multipurpose knob to dene the
conditions that will stop limit testing. If you select Waveforms, Violations,
TBS1000B and TBS1000B-EDU Series Oscilloscopes User Manual 49
Page 70

Application Examples
or Time,pushth
e resulting side menu items and turn the Multipurpose
knob to set the desired number of waveforms, number of violations, or the
time in seconds at which to stop. You can also choose Manual to stop the
testing manually.
8. Push the Run/Stop Test side-menu button from page 1 of the top level of the
limit test menu to toggle between starting and ending the limit test. After the
test ends, the oscilloscope will display the test statistics on the lower-level
corner of the screen. This includes the total number of cases tested, the
number of c
ases passed, and the number of cases failed.
50 TBS1000B and TBS1000B-EDU Series Oscilloscopes User Manual
Page 71

FFT
FFT converts a time-domain (YT) signal into its frequency components
(spectrum). The oscilloscope can optionally display the source waveform at the
same time as the FFT waveform. Use FFT for the following types of analysis:
Analyze harmonics in power lines
Measure harmonic content and distortion in systems
Characterize noise in DC power supplies
Test impul
se response of lters and systems
Analyze vibration
To use FFT, you need to perform the following tasks:
Set up the source (time-domain) waveform
Display the FFT spectrum
Select a type of FFT window
Adjust
the sample rate to display the fundamental frequency and harmonics
without aliasing
Use cu
rsors to measure the spectrum
SettingUptheTime-DomainWaveform
Befo
re you use FFT, you need to set up the time-domain (YT) waveform. To do
so, follow these steps:
1. Pus
h Autoset to display a YT waveform.
2. Turn the Vertical Position knob to move the YT waveform to the center
ve
rtically (zero divisions).
This ensures that the FFT will show a true DC value.
3. Turn the Horizontal Position knob to position the part of the YT waveform
that you want to analyze in the center eight divisions of the screen.
The oscilloscope calculates the FFT spectrum using the center 2048 points of
the time-domain waveform.
TBS1000B and TBS1000B-EDU Series Oscilloscopes User Manual 51
Page 72

FFT
4. Turn the Ve r ti c
al Scale (volts/division) knob to ensure that the entire
waveform remains on the screen. The oscilloscope may display erroneous
FFT results (by adding high frequency components) if the entire waveform is
not visible.
5. Turn the Horizontal Scale (seconds/division) knob to provide the resolution
youwantintheFFTspectrum.
6. If possible, set the oscilloscope to display many signal cycles.
If you turn the Horizontal Scale knob to select a faster setting (fewer cycles),
the FFT spectrum shows a larger frequency range, and reduces the possibility
of FFT aliasing. (See page 55, FFT Aliasing.) However, the oscilloscope also
displays less frequency resolution.
To set up the FFT display, follow these steps:
1. Push the FFT front-panel button to see the FFT side menu.
2. Push Source from the side menu.
3. Turn th
e Multipurpose knob to highlight the source channel. Push the knob
to select the channel.
NOTE. Trigger and position any transient or burst waveforms as closely as
possible to the center of the screen.
Nyquist Frequency
The highest frequency that any real-time digitizing oscilloscope can measure
without errors is one-half the sample rate. This frequency is called the Nyquist
frequency. Frequency information above the Nyquist frequency is undersampled,
which causes FFT aliasing. (See page 55, FFT Aliasing.)
The math function transforms the center 2048 points of the time-domain
waveform into an FFT spectrum. The resulting FFT spectrum contains 1024
p
oints that go from DC (0 Hz) to the Nyquist frequency.
Normally, the display compresses the FFT spectrum horizontally into 250 points,
but you can use the FFT Zoom function to expand the FFT spectrum to more
clearly see the frequency components at each of the 1024 data points in the FFT
spectrum.
NOTE. The oscilloscope vertical response rolls off slowly above its bandwidth
(50 MHz, 70 MHz, 100 MHz, 150 MHz or 200 MHz, depending on the model, or
20 MHz when the Bandwidth Limit option is ON). Therefore, the FFT spectrum
can show valid frequency information higher than the oscilloscope bandwidth.
However, the magnitude information near or above the bandwidth will not be
accurate.
52 TBS1000B and TBS1000B-EDU Series Oscilloscopes User Manual
Page 73

FFT
Displaying th
e FFT Spectrum
Push the FFT button to display the FFT side menu. Use the options to select the
Source channel, Window algorithm, and FFT Zoom factor. You can display only
one FFT spect
rum at a time.
FFT option Settings Comments
Source On/Off On, Off Selects whether the screen displays the source waveform
at the same
time as it displays the FFT waveform
Source Ch1, Ch2 Selects th
e channel used as the FFT source
Window Hanning, Flattop, Rectangular
Selects t
he FFT window type; (See page 54, Selecting
an FFT Window.)
FFT Zoom X1, X2, X5
, X10
Changes the horizontal magnication of the FFT display;
(See page 57, Magnifying and Positioning an FFT
Spectru
m.)
1. Frequency at the center graticule line.
2. Ve
rtical scale in dB per division (0 dB = 1 V
RMS
).
3. Horizontal scale in frequency per division.
4. Sample rate in number of samples per second.
5. FFT window type.
TBS1000B and TBS1000B-EDU Series Oscilloscopes User Manual 53
Page 74

FFT
Selecting an F
FT Window
Windows reduce spectral leakage in the FFT spectrum. The FFT assumes that
the YT waveform repeats forever. With an integral number of cycles (1, 2, 3,
...), the YT w
aveform starts and ends at the same amplitude and there are no
discontinuities in the signal shape.
A non-integ
ral number of cycles in the YT waveform causes the signal start and
end points to be at different amplitudes. The transitions between the start and end
points cause discontinuities in the signal that introduce high-frequency transients.
Applying a window to the YT waveform changes the waveform so that the start
and stop values are close to each other, reducing the discontinuities.
54 TBS1000B and TBS1000B-EDU Series Oscilloscopes User Manual
Page 75

FFT
The FFT function includes three FFT Window options. There is a trade-off
between
frequency resolution and amplitude accuracy with each type of window.
What you want to measure and your source signal characteristics will help you to
determine which window to use.
Window Measur
e
Charac
teristics
Hanning
Perio
dic waveforms
Bette
r frequency, poorer magnitude
accuracy than Flattop
Flatt
op
Periodic waveforms Better magnitude, poorer frequency
accuracy than Hanning
Rectangular Pulses or transients
Special-purpose window for waveforms
tha
t do not have discontinuities. This is
essentially the same as no window
FFT Aliasing
Problems occur when the oscilloscope acquires a time-domain waveform
containing frequency components that are greater than the Nyquist frequency.
(See page 52, Nyquist Frequency.) The frequency components that are above the
Nyquist frequency are undersampled, appearing as lower frequency components
t
hat "fold back" around the Nyquist frequency. These incorrect components are
called aliases.
TBS1000B and TBS1000B-EDU Series Oscilloscopes User Manual 55
Page 76

FFT
56 TBS1000B and TBS1000B-EDU Series Oscilloscopes User Manual
Page 77

FFT
Eliminating Aliases
To eliminate al
iases, try the following remedies:
Turn the Horizontal Scale (seconds/division) knob to set the sample rate to
a faster setti
ng. Since you increase the Nyquist frequency as you increase
the sample rate, the aliased frequency components appear at their proper
frequency. If too many frequency components are shown on the screen, you
can use the FFT Zoom option to magnify the FFT spectrum.
If you do not need to view frequency components above 20 MHz, set the
Bandwidth Limit option to On.
Put an external lter on the source signal to bandwidth limit the source
waveform to frequencies below that of the Nyquist frequency.
Recognize and ignore the aliased frequencies.
Use zoom controls and the cursors to magnify and measure the FFT spectrum.
Magnifying and Positioning an FFT Spectrum
You can magnify and use cursors to take measurements on the FFT spectrum. The
oscilloscope includes an FFT Zoom option to magnify horizontally. To magnify
vertically, you can use the vertical controls.
Horizontal Zoom and
Position
The FFT Zoom option lets you horizontally magnify the FFT spectrum without
changing the sample rate. Zoom factors are X1 (default), X2, X5, and X10. At
zoom factor X1, and with the waveform centered in the graticule, the left graticule
line is at 0 Hz and the right graticule line is at the Nyquist frequency.
When you change the zoom factor, the FFT spectrum is magnied about the
center graticule line. In other words, the axis of horizontal magnication is the
center graticule line.
Turn the Horizontal Position knob clockwise to move the FFT spectrum to the
right. Push the knob to position the center of the spectrum at the center of the
g
raticule.
Vertical Zoom and Position
The channel vertical knobs become vertical zoom and position controls for their
respective channels when displaying the FFT spectrum.
Turn the Vertical Position knob clockwise to move the spectrum up for the
source channel.
TBS1000B and TBS1000B-EDU Series Oscilloscopes User Manual 57
Page 78

FFT
Measuring an F
FT Spectrum Using Cursors
You can take two measurements on FFT spectrums: magnitude (in dB), and
frequency (in Hz). Magnitude is referenced to 0 dB, where 0 dB equals 1 V
RMS
.
You can use the cursors to take measurements at any zoom factor. To do so,
follow these steps:
1. Push the Cursor button to see the cursor side menu.
2. Push Source FFT.
3. Push the Type option button and use the Multipurpose knob to select
Magnitude or Frequency.
4. Select Cursor 1 or Cursor 2.
5. Use the Multipurpose knob to move the selected cursor.
Use hori
zontal cursors to measure magnitude and vertical cursors to measure
frequency. The options display the delta between the two cursors, the value at
cursor 1 position, and the value at cursor 2 position. Delta is the absolute value of
cursor 1 minus cursor 2.
Magnitude cursors Frequency cursors
You can also take a frequency measurement without using the cursors. To do so,
tur
ntheHorizontal Position knob to position a frequency component on the
center graticule line and read the frequency at the top right of the display.
58 TBS1000B and TBS1000B-EDU Series Oscilloscopes User Manual
Page 79

USB Flash Drive and Device Ports
This chapter describes how to use the Universal Serial Bus (USB) ports on the
oscilloscope to do the following tasks:
Save and recall waveform data or setup data, or save a screen image
Transfer waveform data, setup data, or a screen image to a PC
Control the oscilloscope with remote commands
To use the PC Communications software, launch and refer to the online help
from the software.
USB Flash Drive Port
ThefrontoftheoscilloscopehasaUSBFlashDriveporttoaccommodateaUSB
ash drive for le storage. The oscilloscope can save data to and retrieve data
from the ash drive.
USB Flash Drive port
NOTE. The oscilloscope can only support ash drives with a storage capacity
of 64 GB or less.
To connect a USB ash drive, follow these steps:
1. Align the USB ash drive with the USB Flash Drive port on the oscilloscope.
Flash drives are shaped for proper installation.
2. Insert the ash drive into the port until the drive is fully inserted.
For ash drives with an LED, the drive "blinks" while the oscilloscope writes
data to or reads data from the drive. The oscilloscope also displays a clock
symbol to indicate when the ash drive is active.
After a le i
s saved or retrieved, the LED on the drive (if any) stops blinking,
and the oscilloscope removes the clock. A hint line also displays to notify you
that the save or recall operation is complete.
To remove a USB ash drive, wait until the LED on the drive (if any) stops
blinking or until the hint line appears that says the operation is complete, grab the
edge of the drive, and extract the drive from the port.
TBS1000B and TBS1000B-EDU Series Oscilloscopes User Manual 59
Page 80

USB Flash Drive and Device Ports
Flash Drive Initial Read
Time
The oscillosco
pe reads the internal structure of a USB ash drive each time you
install a drive. The time to complete the read depends on the size of the ash
drive, how the drive is formatted, and the number of les stored on the drive.
NOTE. To signicantly shorten the initial read time of 64 MB and larger USB
ash drives, format the drive on your PC.
Formatting
a Flash Drive
The Format function deletes all data on the USB ash drive. To format a ash
drive, follow these steps:
1. Insert a USB ash drive into the Flash Drive port on the front of the
oscilloscope.
2. Push the Utility button to see the Utility Menu.
3. Push File Utilities More Format.
4. Select Ye s to format the ash drive.
Flash Drive Capacities
The oscilloscope can store the following types and number of les per 1 MB
of USB ash drive memory:
5 Save All operations; (See page 63, Saves All to Files.) (See page 92, Save
All.)
16 screen image les (capacity depends on the image format
); (See page 64,
Saves Image to File.) (See page 92, Save Image.)
250 oscilloscope setting (.SET) les; (See page 93, Save Setup.)
18 waveform (.CSV) les; (See page 94, Save Waveform.)
File Management Conventions
The oscilloscope uses the following le management conventions for data storage:
The oscilloscope checks for available space on the USB ash drive before
writing les, and displays a warning message if there is not enough memory
available.
The term “folder” refers to a directory location on the USB ash drive.
The default location for the le save or le recall functions is the current
folder.
/usb0/ is the root folder.
The oscilloscope resets the current folder to /usb0/ when you power on the
oscilloscope, or when you insert a USB ash drive after the oscilloscope is
powered on.
60 TBS1000B and TBS1000B-EDU Series Oscilloscopes User Manual
Page 81

USB Flash Drive and Device Ports
File names can h
ave one to eight characters, followed by a period, and then
followed with an extension of one to three characters.
The oscillosc
ope displays long le names created on PC operating systems
with the shortened le name from the operating system.
File names a
re case insensitive and are displayed in upper case.
You can use the File Utilities menu to do the following tasks:
List the contents of the current folder
Select a le or folder
Navigate to other folders
Create, rename, and delete les and folders
Format t
he USB ash drive
(See page 105, File Utilities for the USB Flash Drive.)
Saving and Recalling Files With a USB Flash Drive
There are two ways to operate the USB ash drive for le storage:
through the Save/Recall menu
through the alternative Save function of the front-panel Save button
You can use the following Save/Recall menu options to write data to or retrieve
data from a USB ash drive:
Save Image
Save Setup
Save Waveform
Recall Setup
R
ecall Waveform
NOTE. The front-panel Save button
can be used as a save button for quick
storage of les to a ash drive. For information on how to save many les at once,
or images one after another, refer to Using the Save Functions of the Front-Panel
Save button. (See page 63, Using the Save Function of the Front-Panel Save
Button.)
TBS1000B and TBS1000B-EDU Series Oscilloscopes User Manual 61
Page 82

USB Flash Drive and Device Ports
Save Image, Save Setup,
and Save Waveform
Options
You can save a sc
reen image, the oscilloscope settings, or waveform data to a le
on the USB ash drive through the Save/Recall menu.
Each save option operates in a similar way. As an example, to save a screen image
le to a ash drive, follow these steps:
1. Insert a USB ash drive into the USB Flash Drive port.
2. Push Utility Options Printer Setup and set the following options:
Ink Saver On, Off Saves the screen image on a white
background when you select On
Layout Portrait, Landscape
Orients the screen shot
3. Access the screen you want to save.
4. Push the Save/Recall front-panel button.
5. Select the Action Save Image Save option.
The oscilloscope saves the screen image in the current folder and
automatically generates the le name. (See page 92, Save/Recall.)
Recall Setup, and Recall
Waveform Options
You can recall the oscilloscope settings or wavefor
mdatafromaleontheUSB
ash drive through the Save/Recall menu.
Each recall option operates in a similar way. As an example, to recall a waveform
le from a USB ash drive, follow these steps:
1. Insert the USB ash drive that contains the desired waveform le into the
USB Flash Drive port on the front of the oscilloscope.
2. Push the Save/Recall front panel button.
3. Select the Action Recall Waveform Select File option.
You can use the Change Folder option to navigate to another folder on the
ash drive.
4. Turn the Multipu
rpose knob to select the waveform le to recall.
The name of the le in the Recall option changes as you scroll.
5. Select the To option and specify which reference memory location to recall
the waveform to (RefA or RefB).
6. Push the Recall FnnnnCHx.CSV option button, where FnnnnCHx.CSV is
thenameofthewaveformle.
NOTE. For folders on the ash drive that contain one waveform le, select the
Save/Recall Action Recall Waveform To option and specify the reference
memory location to recall the waveform to. The name of the le appears in the
Recall option.(See page 92, Save/Recall.)
62 TBS1000B and TBS1000B-EDU Series Oscilloscopes User Manual
Page 83

USB Flash Drive and Device Ports
Using the Save
Function of the Front-Panel Save Button
You can set the front-panel save button to write data to the USB ash drive
as an alternative function. To set the function of the button to save data, access
the following options:
Save/Recall Action - Save All
Utility - more - page 1 of 2 Options Printer Setup
Saves All to Files
The Saves A
ll to Files option lets you save the current oscilloscope information
to les on the USB ash drive. A single Saves All to Files action uses less than
700 kB of space on the ash drive.
Before you can save data to the USB ash drive, you need to change the
front-panel Save button
to the alternative Save function. To do so, select the
Save/Recall Save All Print Button Saves All to Files option.
To save all the oscilloscope les to a USB ash drive, follow these steps:
1. Insert a USB ash drive into the USB Flash Drive port.
2. To change the folder designated as the current folder, push the Select Folder
option button.
The oscilloscope creates a new folder within the current folder each time you
push the front panel Save button, and automatically generates the folder name.
3. Set up the oscilloscope to capture your data.
4. Push the Save button.
The oscilloscope creates a new folder on the ash drive and saves the screen
image, waveform data, and setup data in separate les in that new folder,
using the current oscilloscope and le format settings. The oscilloscope
names the folder ALLnnnn. (See page 92, Save/Recall.)
To see a list of the les created by the Saves All To Files function, access the
Utility File Utilities menu.
Source File name
Ch(x) FnnnnCHx.CSV, where nnnn is an automatically-generated
number, and x is the channel number
Math
FnnnnMTH.CSV
Ref(x) FnnnnRFx.CSV, where x is the reference memory letter
Screen Image FnnnnTEK.???, where ??? is the current le format
Settings FnnnnTEK.SET
TBS1000B and TBS1000B-EDU Series Oscilloscopes User Manual 63
Page 84

USB Flash Drive and Device Ports
File type Contents and uses
.CSV Contains ASCII text strings that list the time (relative to the
trigger) and amplitude values for each of the 2500 waveform
data points; y
ou can import .CSV les into many spreadsheet
and math analysis applications.
.SET Contains an ASCII text string listing of the oscilloscope settings;
refer to the TBS1000B, TDS2000C and TPS2000 Series Digital
Oscillosco
pes Programmer Manual to decode strings.
Screen imag
es
Import les
into spreadsheet and word processing applications;
type of image le depends on the application.
NOTE. The oscilloscope stores these settings until you change them, even if you
push the D
efault Setup button.
Saves Image to File
This option lets you save the oscilloscope screen image to a le named
TEKnnnn
.???, where the .??? is the current Saves Image to File format. The
next table lists the le formats.
File format Extension Comments
BMP BMP
This bitmap format uses a lossless algorithm,
and is compatible with most word processing
and spreadsheet programs; this is the
default.
JPEG JPG This bitmap format uses a lossy compression
algorithm, and is commonly used by digital
cameras and by other digital photographic
applications.
Bef
ore you can save data to the USB ash drive, you must change the Save button
to the alternative Save function. To do so, select the Save/Recall Save All
Print Button Saves Image to File option.
To save a screen image to a USB ash drive, follow these steps:
1.I
nsert a USB ash drive into the USB Flash Drive port.
2. To change the folder designated as the current folder, push the Select Folder
option button.
3. Access the screen you want to save.
4. Push the front-panel Save button.
The oscilloscope saves the screen image and automatically generates the
le name.
To see a list of the les created by the Save Image To File function, you can
access the Utility File Utilities menu.
64 TBS1000B and TBS1000B-EDU Series Oscilloscopes User Manual
Page 85

USB Flash Drive and Device Ports
USB Device Por
t
You can use a USB cable to connect the oscilloscope to a PC. The USB Device
port is on the rear of the oscilloscope.
USB Device port
Installing the PC Communications Software on a PC
Before y
ou connect the oscilloscope to a PC with Tektronix OpenChoice
PC Communications Software, you must download that software from
www.tektronix.com/software and install it on your PC.
CAUTION. If you connect the oscilloscope to your PC before you install the
software, the PC will not recognize the oscilloscope. The PC will label the
oscilloscope as an Unknown Device and not communicate with the oscilloscope.
To av
oid this, install the software on your PC before you connect the oscilloscope
to your PC.
NOT
E. Be sure you have installed the latest version of PC Communications
software.
So
ftware for your oscilloscope is available through the Software nder on the
Tektronix web site.
To install the PC Communications software, follow these steps:
1. Run the OpenChoice Desktop software on the PC. The InstallShield wizard
appears on the screen.
2. Follow the on-screen directions.
3. Exit the InstallShield wizard.
TBS1000B and TBS1000B-EDU Series Oscilloscopes User Manual 65
Page 86

USB Flash Drive and Device Ports
Connecting to
aPC
After you install the software on your PC, you can connect the oscilloscope to
the PC.
NOTE. Yo u mu
st install the software before you connect the oscilloscope to the
PC. (See page 65, Installing the PC Communications Software on a PC.)
To connect
the oscilloscope to the PC, follow these steps:
1. Power on the oscilloscope.
2. Insert one end of a USB cable into the USB Device port on the back of the
oscilloscope.
3. Power on the PC.
4. Insert the other end of the cable into the desired USB port on a PC.
5. If a Found New Hardware message appears, follow the on-screen directions
for the Found New Hardware wizard.
Do NOT search for the hardware to install on the web.
6. For a Windows XP systems, follow these steps:
a. If yo
u see the Tektronix PictBridge Device dialog box, click Cancel.
b. When prompted, select the option that tells Windows NOT to connect to
Win
dows Update, and click Next.
c. In the next window, you should see that you are installing software for
aU
SB Test and Measurement Device. If you do not see USB Test and
Measurement Device software, the OpenChoice Desktop software is not
properly installed.
d. Select the option that installs the software automatically (the recommended
option) and click Next.
Windows will install the driver for your oscilloscope.
e. If you do not see the USB Test and Measurement Device in step c, or
if Windows cannot nd the software driver, the OpenChoice Desktop
software is not properly installed.
In these situations, click Cancel to exit the Found New Hardware wizard.
Do NOT allow the wizard to nish.
Unplug the USB cable from your oscilloscope and install the OpenChoice
Desktop software.
Reconnect your oscilloscope to the PC and follow steps 6a, 6b, 6c, and 6d.
66 TBS1000B and TBS1000B-EDU Series Oscilloscopes User Manual
Page 87

USB Flash Drive and Device Ports
f. Click Finish.
g. If a dialog labeled Test and Measurement Device appears, select what you
would like Windows to do, and click OK.
7. For Windows 2000 systems:
a. When prompted, select the option that tells Windows to display a list
ofknowndriversandclickNext.
b. In the next window, select USB Test and Measurement Device. If you do
not see a USB Test and Measurement Device selection, the OpenChoice
Desktop software is not properly installed.
c. In the next window, click Next to allow Windows to install the driver
for your oscilloscope.
Windows will install the driver for your oscilloscope.
d. If you do not see the USB Test and Measurement Device in step b, or if
Windows cannot nd the software driver, the software is not properly
installed.
In these situations, click Cancel to exit the Found New Hardware wizard.
Do NOT allow the wizard to nish.
Unplug the USB cable from your oscilloscope, and install the software.
Reconnect your oscilloscope to the PC and follow steps 7a, 7b, and 7c.
8. When prompted, click Finish.
9. If Windows asks you to insert a CD, click Cancel.
10. Run the PC Communi
cations software on your PC.
11. If the oscilloscope and PC do not communicate, refer to the PC
Communications online help and documentation.
Connecting to a GPIB System
If you want to communicate between the oscilloscope and a GPIB system, use a
TEK-USB-488 adapter and follow these steps:
1. Connect the oscilloscope to a TEK-USB-488 adapter with a USB cable.
The Accessories appendix has information on how to order an adapter. (See
page 121, Accessories and Options.)
2. Connect the TEK-USB-488 adapter to your GPIB system with a GPIB cable.
3. Push the Utility Options GPIB Setup Address option button to
select the appropriate address for the adapter, or use the multipurpose knob.
The default GPIB address is 1.
TBS1000B and TBS1000B-EDU Series Oscilloscopes User Manual 67
Page 88

USB Flash Drive and Device Ports
4. Run your GPIB so
ftware on your GPIB system.
5. If the oscilloscope and your GPIB system do not communicate, refer to the
information o
n the software for your GPIB system, and to the user manual for
the TEK-USB-488 adapter to resolve the problem.
Command Entry
NOTE. For command information, refer to the TBS1000B, TDS2000C and
TPS2000 Series Digital Oscilloscopes Programmer Manual, 077-0444-XX. You
can downlo
ad manuals at www.tektronix.com/manuals.
68 TBS1000B and TBS1000B-EDU Series Oscilloscopes User Manual
Page 89

Reference
This chapter describes the menus and operating details associated with each
front-panel menu button or control.
Acquire
Push the Acquire button to set acquisition parameters.
Options Settings Comments
Sample
Use to acquire and accurately display most
waveforms; this is the default mode
Peak Detect Use to detect glitches and reduce the
possibility of aliasing
Average Use to reduce random or uncorrelated noise
in the signal display; the number of averages
is selectable
Averages 4, 16, 64, 128
Select number of averages
Key Points
If you probe a noisy square wave signal that contains intermittent, narrow glitches,
the waveform displayed will vary depending on the acquisition mode you choose.
Sample
Peak Detect Average
Sample. Use Sample acquisition mode to acqu
ire 2500 points and display them at
the horizontal scale (seconds/division) setting. Sample mode is the default mode.
Sample acquisition intervals (2500)
• Sample points
Sample mode acquires a single sample point in each interval.
The oscilloscope samples at the following rates:
TBS1000B and TBS1000B-EDU Series Oscilloscopes User Manual 69
Page 90

Reference
Maximum of 2 GS/
s for 100 MHz, 150, and 200 MHz models
Maximum of 1 GS/s for 50 MHz and 70 MHz models
At 100 ns and faster settings, this sample rate does not acquire 2500 points. In this
case, a Digital Signal Processor interpolates points between the sampled points to
make a 2500 point waveform record.
Peak Detect. Use Peak Detect acquisition mode to detect glitches as narrow as
10 ns and to limit the possibility of aliasing. This mode is effective when at the
horizontal scale setting of 5 ms/division or slower.
Peak Detect acquisition intervals (1250)
• Sample points displayed
Peak Detect mode displays the highest and lowest acquired voltage in each interval.
NOTE. If you set the horizontal scale (seconds/division) setting to 2.5 ms/div or
faster, the acquisition mode changes to Sample because the sample rate is fast
enough that Peak Detect is not necessary. The oscilloscop
edoesnotdisplaya
message to tell you that the mode was changed to Sample.
When there is enough waveform noise, a typical peak dete
ct display shows large
black areas. The oscilloscope displays this area with diagonal lines to improve
display performance.
Typical peak detect display
TBS1000B peak detect display
Average. Use Average acquisition mode to reduce random or uncorrelated noise
in the signal you want to display. Data is acquired in sample mode, then a number
of waveforms are averaged together.
Select the number of acquisitions (4, 16, 64, or 128) to average for the waveform.
Run/Stop Button. Push the Run/Stop button when you want the oscilloscope to
continuously acquire waveforms. Push the button again to stop the acquisition.
70 TBS1000B and TBS1000B-EDU Series Oscilloscopes User Manual
Page 91

Reference
Single Button.
Push the Single (single sequence) button when you want the
oscilloscope to acquire a single waveform and then stop. Each time you push the
Single button, the oscilloscope begins to acquire another waveform. After the
oscilloscope detects a trigger it completes the acquisition and stops.
Acquisition mode Single button
Sample, Peak Detect Sequence is complete when one acquisition is acquired
Average
Sequence is complete when the dened number of
acquisitions is reached; (See page 69, Acquire .)
Scan Mode Display. You can use the Horizontal Scan acquisition mode (also
called Roll mode) to continuously monitor signals that change slowly. The
oscilloscope displays waveform updates from the left to the right of the screen and
erases old points as it displays new points. A moving, one-division-wide blank
section of the screen separates the new waveform points from the old.
The oscilloscope changes to the Scan acquisition mode when you turn the
Horizontal Scale knob to 100 ms/div or slower, and select the Auto Mode option
in the T
rigger Menu.
To disable Scan mode, push the Trigger Menu button and set the Mode option to
Norma
l.
Stopping the Acquisition. While the acquisition is running, the waveform display
is live. Stopping the acquisition (when you push the Run/Stop button) freezes
the display. In either mode, the waveform display can be scaled or positioned
with the vertical and horizontal controls.
Autorange
WhenyouholdtheAutoset button for more than 1.5 seconds, the oscilloscope
a
ctivates or deactivates the Autorange function.
This function automatically adjusts setup values to track a signal. If the signal
c
hanges, the setup continues to track the signal. When you power on the
oscilloscope, autoranging is always inactive.
Options Comment
Autoranging
Activates or deactivates the Autorange function
Vertical and Horizontal Tracks and adjusts both axes
Vertical Only
Tracks and adjusts the Vertical scale; does not change the
horizontal settings
Horizontal Only
Tracks and adjusts the Horizontal scale; does not change the
vertical settings
Undo Autoranging
Causes the oscilloscope to recall the previous setup
TBS1000B and TBS1000B-EDU Series Oscilloscopes User Manual 71
Page 92

Reference
The following c
onditions cause autorange to adjust settings:
Too many or too few waveform periods for a clear display of the trigger
source (excep
t when in Vertical Only)
Waveform amplitude too large or too small (except when in Horizontal Only)
Ideal trigger level changes
When you push the Autoset button for more than 1.5 seconds, the oscilloscope
enters the autorange mode and adjusts controls to produce a usable display of
the input signal.
Function Setting
Acquire mode
Sample
Display format
YT
Display persist
Off
Horizontal position Adjusted
Horizontal view Main
Run/Stop
RUN
Horizontal scale (seconds/division)
Adjusted
Trigger coupling
DC
Trigger holdoff
Minimum
Trigger level Adjusted
Trigger mode Edge
Vertical bandwidth Full
Vertical BW limit
Off
Vertical coupling
DC
Vertical invert
Off
Vertical scale (volts/division)
Adjusted
The following changes to the setup of the oscilloscope deactivate autorange:
Vertical scale deactivates vertical autoranging
Horizontal scale deactivates horizontal autoranging
Display or remove a channel waveform
Trigger settings
Single sequence acquisition mode
Recall a setup
XY Display format
Persistence
72 TBS1000B and TBS1000B-EDU Series Oscilloscopes User Manual
Page 93

Reference
The Autorange f
unction is usually more useful than Autoset in the following
situations:
Analyzing a dynamically changing signal
Quickly comparing a sequence of several signals without adjusting the
oscilloscope. This is very useful if you need to use two probes at the same
time, or if you need to use a probe in one hand and are holding something
else in the other.
Controlling which settings the oscilloscope automatically adjusts
If your signals vary in frequency, but have similar amplitudes, you can use
Horizontal Only autoranging. The oscilloscope will adjust the horizontal settings,
but leave the vertical settings unchanged. This way, you can visually estimate
the amplitude of the signal without worrying about the vertical scale changing.
Vertical Only autoranging works similarly, adjusting vertical parameters and
leaving the horizontal settings unchanged.
Autoset
When you push the Autoset button once, the oscilloscope identies the type of
waveform and adjusts controls to produce a usable display of the input signal.
When you press the button for more than 1.5 seconds, it will perform the
Autorange function. It will displays the Autorange Menu and activate or
deactivate the autoranging function.
Function Setting
Acquire mode
Adjusted to Sample or Peak Detect
Cursors Off
Display format Set to YT
Display type
Set to Dots for a video signal, set to Vectors for an FFT
spectrum; otherwise, unchanged
Horizontal position Adjusted
Horizontal scale
(seconds/division)
Adjusted
Trigger coupling
Adjusted to DC, Noise Reject, or HF Reject
Trigger holdoff
Minimum
Trigger level
Set to 50%
Trigger mode Auto
Trigger source
Adjusted; refer to the information after this table; cannot
use Autoset on the Ext Trig signal
Trigger slope Adjusted
Trigger type Edge or Video
Trigger Video Polarity Normal
TBS1000B and TBS1000B-EDU Series Oscilloscopes User Manual 73
Page 94

Reference
Function Setting
Trigger Video Sync
Adjusted
Trigger Video Standard
Adjusted
Vertical ban
dwidth
Full
Vertical coupling
DC (if Groun
d was previously selected); AC for a video
signal; otherwise, unchanged
Volts/Div
Adjusted
The Autoset function examines all channels for signals and displays corresponding
waveforms. Autoset also determines the trigger source based on the following
conditions:
If multiple channels have signals, the oscilloscope displays the channel with
the lowest frequency signal.
If no signals are found, then the oscilloscope displays the lowest-numbered
channel when Autoset was invoked.
If no signals are found and no channels are displayed, then the oscilloscope
displays and uses channel 1.
When you use Autoset and the oscilloscope cannot determine the signal type, the
oscilloscope adjusts the horizontal and the vertical scales, then takes the Mean
and P
k-to-Pk automatic measurements.
The Autoset function is usually more useful than Autorange in the following
sit
uations:
Troubleshooting one stable signal
Automatically seeing measurements of your signal
Easily changing how the signal is presented. For example, viewing only one
cycle of the waveform, or the rising edge of the waveform
Viewing video signals or FFT signals
Sine Wave
When you use the Autoset function and the oscilloscope determines that the signal
is similar to a sine wave, the oscilloscope displays the following options:
Sine wave Details
Multi-cycle sine
Displays several cycles with appropriate vertical and
horizontal scaling; the oscilloscope displays Cycle
RMS, Frequency, Period, and Peak-to-Peak automatic
measurements
Single-cycle sine
Sets the horizontal scale to display about one cycle
of the waveform; the oscilloscope displays Mean, and
Peak-to-Peak automatic measurements
74 TBS1000B and TBS1000B-EDU Series Oscilloscopes User Manual
Page 95

Reference
Sine wave Details
FFT
Converts the input time-domain signal into its frequency
components and displays the result as a graph of frequency
versus magnit
ude (spectrum). Refer to the FF T chapter
for more information
(See page 51, FFT.)
Undo Autoset
Causes the oscilloscope to recall the previous setup
Square Wave or Pulse
When you use the Autoset function and the oscilloscope determines that the signal
is similar to a square wave or pulse, the oscilloscope displays the following
options:
Square wave or Details
Multi-cycle square
Displays several cycles with appropriate vertical and
horizontal scaling; the oscilloscope displays Pk-Pk, Mean,
Period,
and Frequency automatic measurements
Single-cycle square
Sets the
horizontal scale to display about one cycle of the
waveform; the oscilloscope displays Min, Max, Mean, and
Positive Width automatic measurements
Rising edge
Displays the edge, and the Rise Time and Peak-to-Peak
automatic measurements
Falling edge
Displays the edge, and the Fall Time and Peak-to-Peak
automatic measurements
Undo Autoset
Causes the oscilloscope to recall the previous setup
Video Signal
When you use the Autoset function and the oscilloscope determines that the signal
is a video signal, the oscilloscope displays the following options:
Video signal options Details
Fields All Fields
Displays several elds and the oscilloscope triggers on any
eld
Lines All Lines
Displays one complete line with parts of the previous and
ne
xt line; the oscilloscope triggers on any line
Lines Number
Displays one complete line with parts of the previous and
next line; use the multipurpose knob to select a specic line
number for the oscilloscope to use as a trigger
Odd Fields
Displays several elds and the oscilloscope triggers only on
odd numbered elds
TBS1000B and TBS1000B-EDU Series Oscilloscopes User Manual 75
Page 96

Reference
Video signal op
tions
Details
Even Fields
Displays seve
ral elds and the oscilloscope triggers only on
even numbered elds
Undo Autoset
Causes the oscilloscope to recall the previous setup
NOTE. Vi d e o
autoset sets the Display Type option to Dot Mode.
Enable (EDU models only)
To further enhance the EDU models’ value in your educational environment,
you can dis
able the EDU oscilloscope Autoset function. For example, in
beginning labs where it is important for a student to learn the basic operation of
the oscilloscope, disabling Autoset will help them apply their knowledge of an
oscilloscope's operation instead of taking shortcuts with the Autoset button.
This feature is password controlled so Autoset can be disabled or enabled by
pushing the front-panel Utility on the side menu page 1 - more - page 1 of 3
on the side menu page 2 Autoset Enable Setting. Then on the side menu push
either Autoset Enable or Autoset Disable and enter the appropriate password.
The factory default password is “1946”. The oscilloscope accepts passwords
with four characters or digits. You can change the password with the Change
Passw
ord item in the autoset side menu.
Counter
Use t
he counter function from the Function button menu to simultaneously
monitor two different signal frequencies. This feature provides a more accurate
reading than is available with the oscilloscope’s frequency measurement.
Op
tions
Se
ttings
Co
mments
Ch
1
On
,Off
C
h2
O
n, Off
C
h1 Trigger
Use the multipurpose knob to set the
t
rigger level.
Ch2 Trigger
Use the multipurpose knob to set the
trigger level.
76 TBS1000B and TBS1000B-EDU Series Oscilloscopes User Manual
Page 97

Reference
Course (EDU models only)
Run labs r
ight on your oscilloscope. Also, read theory and procedures, and
capture your lab results right there as well.
Create your course on a
PC:
Create new course materials on a PC with separate PC-based software, which
you can
download from www.tektronix.com/software or nd on a CD that
accompanied your oscilloscope. After you create the materials, you can distribute
them to TBS1000B-EDU oscilloscopes using a USB ash memory device.
You can also check at www.tektronix.com for a separate Courseware Web page,
where you can nd copies of labs that others have created and uploaded to share.
TBS1000B and TBS1000B-EDU Series Oscilloscopes User Manual 77
Page 98

Reference
Load your course on your
TBS1000B-EDU:
To load a new cou
rse on a TBS1000B-EDU oscilloscope,
1. Insert the USB memory device that contains your course into the front-panel
USB slot of you
r TBS1000B-EDU.
2. Push Utility - more - page 1 of 3 Update Course.
3. Use the Multipurpose knob to scroll through the resulting le list and to
highlight the desired course folder. Course folders have an .xpkg sufx.
4. Push Upload Course to load the course into your oscilloscope.
Runlabsonyour
TBS1000B-EDU:
You can access the lab content via the dedicated Course button located on the
on the front panel. Use the oscilloscope’s soft keys and the multipurpose knob to
access up to 8 courses, which can have up to 30 labs each. Store up to 100 MB of
course material on the oscilloscope. Once you choose a lab, you can review the
overvie
w section, perform the lab using the step-by-step procedure, collect data,
check and save the data results and generate reports that show the waveforms
created for each step in the procedure.
To run your desired lab:
1. Push t
he Course front-panel button to enable operation of courseware directly
on the oscilloscope.
2. Push
a side-bezel menu item to choose the desired course from those listed.
3. Turn the Multipurpose knob to highlight the lab to run. Push the knob to
sel
ect the desired lab.
4. On the resulting screen, select the desired content from the side-bezel menu.
Rea
dtheOverview and the step-by-step Procedure.PushData Collection
and save results to a USB memory device.
5. Wh
en done running the lab, select Report from the side-bezel menu. Use the
resulting side-bezel menu to enter your student identication number.
6.P
ush OK from the side-bezel menu.
7. On the resulting course report, push Save on the side-bezel menu. This will
save the report onto an attached USB memory device.
78 TBS1000B and TBS1000B-EDU Series Oscilloscopes User Manual
Page 99

Reference
Course
Overview
Procedure
Data
Collection
Reports
Back
Cursor
Push the Cursor button to display the measurement cursors and Cursor Menu,
andthenturntheMultipurpose knob to change the position of a cursor.
Options Settings Comments
Type
1
Time, Amplitude, Off Select and display the measurement
cursors; Time measures time, frequency,
and amplitude; Amplitude measures
amplitude, such as current or voltage
Source Ch1, Ch2, FFT, Math, Ref
A, Ref B
Choose the waveform on which to take
the cursor measurements
Cursor readouts display the measurement
Displays the absolute value of the
difference (delta) between the cursors
TBS1000B and TBS1000B-EDU Series Oscilloscopes User Manual 79
Page 100

Reference
Options Settings Comments
Cursor 1
Cursor 2
Displays selected cursor location (time
is referenced to the trigger position, and
amplitude to t
he reference connection)
1
For an FFT source, measures Frequency and Magnitude.
Delta () values vary with the following types of cursors:
Time cursors display t, 1/ t and V (or I, VV, and so on)
Amplitude c
ursors, and Magnitude cursors (FFT source) display V, I,
VV, and so on
Frequency
cursors (FFT source) display 1/Hz and dB
NOTE. The oscilloscope must display a waveform for the cursors and cursor
readouts to appear.
NOTE. Th
e oscilloscope displays the time and amplitude values for each
waveform when you use Time cursors.
Key Points
Cursor Movement. Use the multipurpose knob to move Cursor 1 or Cursor 2.
You can move the cursors only while the Cursor Menu is displayed. The active
curs
or is represented by a solid line.
Amplitude cursors Time cursors
80 TBS1000B and TBS1000B-EDU Series Oscilloscopes User Manual
 Loading...