

Page 1

User Manual
TARGET1
Trace Analysis, Report Generation and
Emulation Tool
071-0870-02
This document applies to firmware version 3.00
and above.
www.tektronix.com
Page 2

Copyright © Tektronix, Inc. All rights reserved. Licensed software products are owned by Tektronix or its suppliers and
are protected by United States copyright laws and international treaty provisions.
Use, duplication, or disclosure by the Government is subject to restrictions as set forth in subparagraph (c)(1)(ii) of the
Rights in Technical Data and Computer Software clause at DFARS 252.227-7013, or subparagraphs (c)(1) and (2) of the
Commercial Computer Software -- Restricted Rights clause at FAR 52.227-19, as applicable.
Tektronix products are covered by U.S. and foreign patents, issued and pending. Information in this publication supercedes
that in all previously published material. Specifications and price change privileges reserved.
Tektronix, Inc., P.O. Box 500, Beaverton, OR 97077
TEKTRONIX, TEK, TARGET1, and NETTEK are registered trademarks of Tektronix, Inc.
Page 3

WARRANTY
Tektronix warrants that the media on which this software product is furnished and the encoding of the programs on
the media will be free from defects in materials and workmanship for a period of three (3) months from the date of
shipment. If a medium or encoding proves defective during the warranty period, Tektronix will provide a
replacement in exchange for the defective medium. Except as to the media on which this software product is
furnished, this software product is provided “as is” without warranty of any kind, either express or implied.
Tektronix does not warrant that the functions contained in this software product will meet Customer’s
requirements or that the operation of the programs will be uninterrupted or error-free.
In order to obtain service under this warranty, Customer must notify Tektronix of the defect before the expiration
of the warranty period. If Tektronix is unable to provide a replacement that is free from defects in materials and
workmanship within a reasonable time thereafter, Customer may terminate the license for this software product
and return this software product and any associated materials for credit or refund.
THIS W ARRANTY IS GIVEN BY TEKTRONIX IN LIEU OF ANY OTHER W ARRANTIES, EXPRESS
OR IMPLIED. TEKTRONIX AND ITS VENDORS DISCLAIM ANY IMPLIED WARRANTIES OF
MERCHANTABILITY OR FITNESS FOR A PARTICULAR PURPOSE. TEKTRONIX’
RESPONSIBILITY TO REPLACE DEFECTIVE MEDIA OR REFUND CUSTOMER’S PAYMENT IS
THE SOLE AND EXCLUSIVE REMEDY PROVIDED TO THE CUSTOMER FOR BREACH OF THIS
WARRANTY. TEKTRONIX AND ITS VENDORS WILL NOT BE LIABLE FOR ANY INDIRECT,
SPECIAL, INCIDENTAL, OR CONSEQUENTIAL DAMAGES IRRESPECTIVE OF WHETHER
TEKTRONIX OR THE VENDOR HAS ADVANCE NOTICE OF THE POSSIBILITY OF SUCH
DAMAGES.
Page 4

Page 5

Table of Contents
Preface v...................................................
Related Documentation v...........................................
Manual Conventions v..............................................
Contacting Tektronix vi.............................................
Getting Started
Getting Started 1--1............................................
Product Description 1--1..............................................
WhatYouNeedtoKnow 1--3..........................................
Recommended Minimum Operating Requirements 1-- 4.....................
Printers 1-- 4........................................................
Installation 1-- 5.....................................................
After Installation 1-- 6.................................................
IfYouNeedHelp 1--6................................................
Starting the TARGET1 Application 1-- 7..................................
TARGET1 Application Packages 1--8....................................
OTDR Software Package
OTDR Trace Analysis Mode 2--1.................................
Open a Trace File 2-- 1................................................
Functional Overview of Trace Analysis Mode 2--3.........................
View Options 2--4...................................................
Trace Area 2-- 4.....................................................
Event Table 2-- 9.....................................................
Test Settings Panel 2--11...............................................
Control Panel 2--12...................................................
Menu Selection and Toolbar Button Descriptions 2--13.......................
OTDR Trace Analysis Mode Measurements 2--32...........................
Distance Measurements 2-- 32...........................................
Event Loss Measurements 2-- 33.........................................
Two-Point Measurements 2--37..........................................
Reflectance Measurements 2--39.........................................
ORL Measurements 2--42..............................................
Bidirectional Measurements 2--43........................................
Difference Measurements 2-- 45..........................................
Editing the Event Table 2 --46...........................................
OTDR Report Generator Mode 2--49..............................
Functional Overview 2--49.............................................
Using the Report Wizard 2--56..........................................
Report Formats 2--74..................................................
TARGET1 Trace Analysis, Report Generation and Emulation Tool User Manual
i
Page 6

Table of Contents
Virtual CE for NetTek
Glossary
Index
Virtual CE for NetTek 3--1......................................
Requirements 3--1...................................................
Installation 3-- 1.....................................................
ii
TARGET1 Trace Analysis, Report Generation and Emulation Tool User Manual
Page 7

List of Figures
Table of Contents
Figure 1--1: Application startup dialog box 1--7.....................
Figure 2--1: Open file selection dialog box 2--2.....................
Figure 2--2: OTDR trace analysis display 2--3......................
Figure 2--3: Event and landmark indicators on the OTDR trace 2--6...
Figure 2--4: Trace with zoom box 2-- 7.............................
Figure 2--5: Zoomed trace with overview window 2--8...............
Figure 2--6: Event table 2--9.....................................
Figure 2--7: Test settings panel 2--1 1...............................
Figure 2--8: Control panel 2--12...................................
Figure 2--9: Customize toolbar selection window 2--17................
Figure 2--10: About Trace(s) dialog box (shows original OTDR
acquisition settings) 2--18.....................................
Figure 2--11: Changing or displaying the current test settings
and limits 2--20.............................................
Figure 2--12: Refractive Index dialog box 2--21......................
Figure 2--13: Export Data File dialog box 2--25......................
Figure 2--14: Add Event dialog box controls 2--28....................
Figure 2--15: Move Event dialog box controls 2--29...................
Figure 2--16: Event Loss Measurement dialog box 2--33...............
Figure 2--17: Advanced controls for Event Loss Measurement 2--33.....
Figure 2--18: Manual event loss cursor around active cursor 2--34......
Figure 2--19: Loss cursor position controls 2--35.....................
Figure 2--20: Two Point Measurement dialog box 2--37...............
Figure 2--21: Two Point Measurement advanced controls 2--38.........
Figure 2--22: Two-point measurement display 2--39..................
Figure 2--23: Reflectance measurement advanced controls 2--40........
Figure 2--24: Manual Reflectance measurement 2--41.................
Figure 2--25: ORL measurement 2--42.............................
Figure 2--26: Bidirectional average trace display 2--44................
Figure 2--27: Report Generator display with both trace and
event table showing 2--49.....................................
Figure 2--28: OTDR report summary and cable information boxes 2--50.
Figure 2--29: Report date selection calendar 2--55....................
Figure 2--30: Report Wizard Files dialog box, part 1 2--57.............
Figure 2--31: Report Wizard Files dialog box, part 2 2--59.............
TARGET1 Trace Analysis, Report Generation and Emulation Tool User Manual
iii
Page 8

Table of Contents
Figure 2--32: Select file navigation screen 2--60......................
Figure 2--33: Report Wizard File Selected dialog box 2--61............
Figure 2--34: Search File dialog box 2--64...........................
Figure 2--35: Search by date option 2--64...........................
Figure 2--36: Search by parameter option 2--65......................
Figure 2--37: Template events info tab 2--66.........................
Figure 2--38: Template general information dialog box 2--67...........
Figure 2--39: Add event or landmark to template dialog box 2--68......
Figure 2--40: Template Options dialog box 2--69.....................
Figure 2--41: Report Wizard analysis dialog box 2--71................
Figure 2--42: Analysis Auto Two-Point Measurement options 2--71.....
Figure 2--43: Analysis Auto Zoom options 2--72.....................
Figure 2--44: Test Settings and Limits 2--73.........................
Figure 2--45: Summary Report component selection 2--74.............
Figure 2 --46: Summary table element selections 2--76.................
Figure 2--47: Report Summary element selections 2--77...............
Figure 2 --48: Summary Cable element selections 2--78................
Figure 2--49: Report Header and Footer element selections 2--79.......
Figure 2--50: Batch report component selections 2--81................
Figure 2--51: Batch Report Event Table Options dialog box 2--82.......
Figure 2--52: Selecting the report page layout 2--82...................
List of Tables
iv
Table 2--1: Event Table column definitions 2--10....................
Table 2-- 2: TARGET1 menu selections 2--13........................
Table 2--3: Default values for Refractive Index by wavelength 2--22....
Table 2--4: Default values for Backscatter by wavelength 2--23........
Table 2-- 5: Report Generator control panel 2--52...................
T able 2--6: TARGET1 Report Generator menu selections 2--53........
T able 2--7: Header/Footer Page Element shortcut icons 2--80..........
TARGET1 Trace Analysis, Report Generation and Emulation Tool User Manual
Page 9

Preface
Related Documentation
The Target1 application allows you to work with files produced by the Optical
Time Domain Reflectometer (OTDR).
The OTDR Trace Analysis Package has two modes:
H Trace Analysis mode. Use this mode to view individual files or pairs of files
(bidirectional and difference pairs) and manipulate them in the same ways
that you can with the OTDR. You cannot collect new data, but you can
manually adjust events, perform tests, add landmarks, and add notes about
the fiber or about events. See OTDR Trace Analysis Mode on page 2--1.
H Report Generation mode. Use this mode to view and manipulate data from
multiple OTDR files at once. You can generate reports using a wizard that
walks you through selecting the files, applying a template, doing additional
tests, changing settings, setting limits, and formatting the information for
printing. See OTDR Report Generator Mode on page 2--49.
Manual Conventions
Refer to the manuals and online help of your optical test equipment for detailed
information about collecting data.
This book uses the following convention to represent menus:
H To open a file, you would be instructed to select File > Op en . To accomplish
this, click File in the menubar at the top of the window; then click Open in
the drop down window.
H Words in italics, such as event loss, indicate a glossary term.
TARGET1 Trace Analysis, Report Generation and Emulation Tool User Manual
v
Page 10

Preface
Contacting Tektronix
Phone 1-800-833-9200*
Address Tektronix, Inc.
Department or name (if known)
14200 SW Karl Braun Drive
P.O. Box 500
Beaverton, OR 97077
USA
Web site www.tektronix.com
Sales support 1-800-833-9200, select option 1*
Service support 1-800-833-9200, select option 2*
Technical support Email: techsupport@tektronix.com
1-800-833-9200, select option 3*
6:00 a.m. -- 5:00 p.m. Pacific time
* This phone number is toll free in North America. After office hours, please leave a
voice mail message.
Outside North America, contact a Tektronix sales office or distributor; see the
Tektronix web site for a list of offices.
vi
TARGET1 Trace Analysis, Report Generation and Emulation Tool User Manual
Page 11

Getting Started
Page 12

Page 13

Getting Started
Product Description
Use the information in this section to install and become familiar with the
TARGET1 software.
You receive the following items when you order the TARGET1 trace analysis
application:
H TARGET1 CD
H TARGET1 User Manual
When you open the package, check to see that each of these items is included.
The software CD is sealed inside an envelope printed with the license agreement.
Breaking the seal on the envelope indicates acceptance of the terms of the
agreement.
The Tektronix TARGET1 Trace Analysis, Report Generation and Emulation
Tool allows you to use an IBM-compatible PC Windows platform and color
monitor to display and analyze waveforms acquired by a Tektronix optical
time-domain reflectometer (OTDR). You can also convert waveform files from
some other industry-compatible OTDR manufacturers for analysis using
TARGET1.
The TARGET1 software saves time by automating the documentation and
analysis tasks for large count fiber bundles. The application delivers a summary
report of the fiber data showing parameters that most concern the network
engineer or maintenance technician. It also provides a report file that can be
saved and printed for record keeping and proof-of-performance documentation.
What Can TARGET1 Do?
TARGET1 Trace Analysis, Report Generation and Emulation Tool User Manual
Use your OTDR to take measurements on your fiber system and save them on a
floppy-disk file or other electronic file server. Copy the files to the PC, and then
use the TARGET1 application to manipulate and analyze the measurement data.
Where practical, the PC software reproduces the OTDR functions, including:
H Tektronix OTDR display elements, including the waveform with event and
landmark indicators, distance and loss axes, and distance cursors.
H Reads fiber trace files from a floppy disk or a PC hard disk.
H Reads OTDR and mini-OTDR traces.
H All measurement capabilities of an OTDR.
1- 1
Page 14

Getting Started
H Two Point loss/distance, Event Loss, Optical Return Loss (ORL), and
Reflectance measurement modes, with automatic and manual measurements
available.
H Distance cursor readouts provide distance from front panel and A to B
distance difference on screen.
Analysis and documentation tools include the following:
H Dual-trace mode to compare waveforms and events.
H Expanded-view function (zoom box) for closer inspection of trace details.
H Event editing for adding, deleting, or moving events and updating measure-
ments to reflect analysis results.
H Landmark marking for recording street locations, manholes, poles, buried
closures, or other physical features that can be associated with the locations
of the fiber splices, connectors, and other events.
H Event and landmark note editing for adding, deleting, or changing notes to
document important fiber information.
Capabilities
H Fiber test file storage on the PC for system documentation, fault location,
and preventive maintenance.
In addition, the TARGET1 application can measure trace subtraction (difference), bidirectional events averaging, and apply event templates to OTDR test
traces.
The TARGET1 application implements OTDR front-panel control functions
using a two- or three-button mouse, the PC keyboard, and measurement and
parameter tool bars displayed on the PC screen.
A menu bar appears at the top of the display. Pull-down menus are available for
file management and printing functions, view options and settings selections,
waveform functions such as event editing and measurements, dual-trace
selection, display window selection, remote connection, and online help.
A second menu bar, the tool bar, provides shortcut icons you can use to directly
select a feature or function of the application. The tool bar can be customized to
show selected sets of shortcut icons.
You can send trace and event tables to a connected printer or save them to a print
file.
You can also export waveform graphics, waveform parameters, waveform data,
and event-table data for use with document or spreadsheet programs.
1- 2
Online help provides information on each dialog box with expanded help
information available through the help contents and index linking.
TARGET1 Trace Analysis, Report Generation and Emulation Tool User Manual
Page 15

Getting Started
File Formats
The TARGET1 application can read and save CFF and SOR files. It can read
WFM and EVT format files.
TFP2 files and TFP2A files that were saved in FiberMaster format are directly
compatible with the TARGET1 application.
TFS3031 files are in CFF (Tektronix Common File Format), and are directly
compatible with TARGET1. If the optical test equipment has a floppy disk drive,
you can transfer files from the OTDR to the PC using a floppy disk.
The TARGET1 trace analysis software can read files compatible with the
Telcordia SOR (standard optical record) format as defined in Telcordia
GR-196-CORE. These include files from Tektronix NetTek OTDRs as well as
from other OTDRs that save files compliant with Telcordia GR-196-CORE SOR
Ver sio n 1.
What You Need to Know
A basic knowledge of your Windows operating system is required to install and
operate your TARGET1 application. Familiarity with operation of Tektronix
optical signal test equipment is helpful for understanding the functions of the
TARGET1 software (refer to the appropriate equipment user manual for details).
You must understand the following:
H Windows directory structure and file-naming conventions.
H How to log onto a particular disk drive.
H How to copy, rename, and delete files, and how to create directories.
TARGET1 Trace Analysis, Report Generation and Emulation Tool User Manual
1- 3
Page 16

Getting Started
Recommended Minimum Operating Requirements
The TARGET1 application requires a PC capable of running in Windows 95, 98,
2000, NT, ME, or XP. You will need a mouse and a compact disc reader.
Processor 300 MHz Pentium
Memory 32 MB
Operating System Windows 95/98, Windows 2000, Windows NT,
Windows ME, or Windows XP
Graphics Adapter VGA or SVGA, 256 colors or better recom-
mended
Monitor SVGA, 800 x 600 minimum resolution
Fixed Disk Drive 10 MB minimum free
Compact Disk Drive Required to load the application software
Printers
Mouse Either a two- or three-button Microsoft-compat-
ible mouse.
Any printer compatible with your version of Windows and for which you have a
printer driver set up can be used for printing. A graphics-capable printer is
required to output graphic files. A color printer may be used to produce color
images for the screen captures and reports.
1- 4
TARGET1 Trace Analysis, Report Generation and Emulation Tool User Manual
Page 17
Installation
Getting Started
The TARGET1 application is provided on a compact disc (CD).
Install the software on your PC as follows:
NOTE. Remove any previous versions of the TARGET1 software prior to
installation. Use the Windows Add/Remove Programs utillity to remove the
TARGET1 software.
1. Insert the TARGET1 CD-ROM into the CD drive of your PC.
2. Navigate to the contents of the TARGET1 CD-ROM using My Computer or
Windows Explorer.
Double click on the file TARGET1_xxxxx.exe (where xxxxx is the software
version number) to run the installation program.
3. Follow the prompts to install the software on your hard drive.
The default destination directory created for the program files is
c:\Program_Files\TARGET1. If you want to install the program files in
another location, select the Browse option to specify another directory.
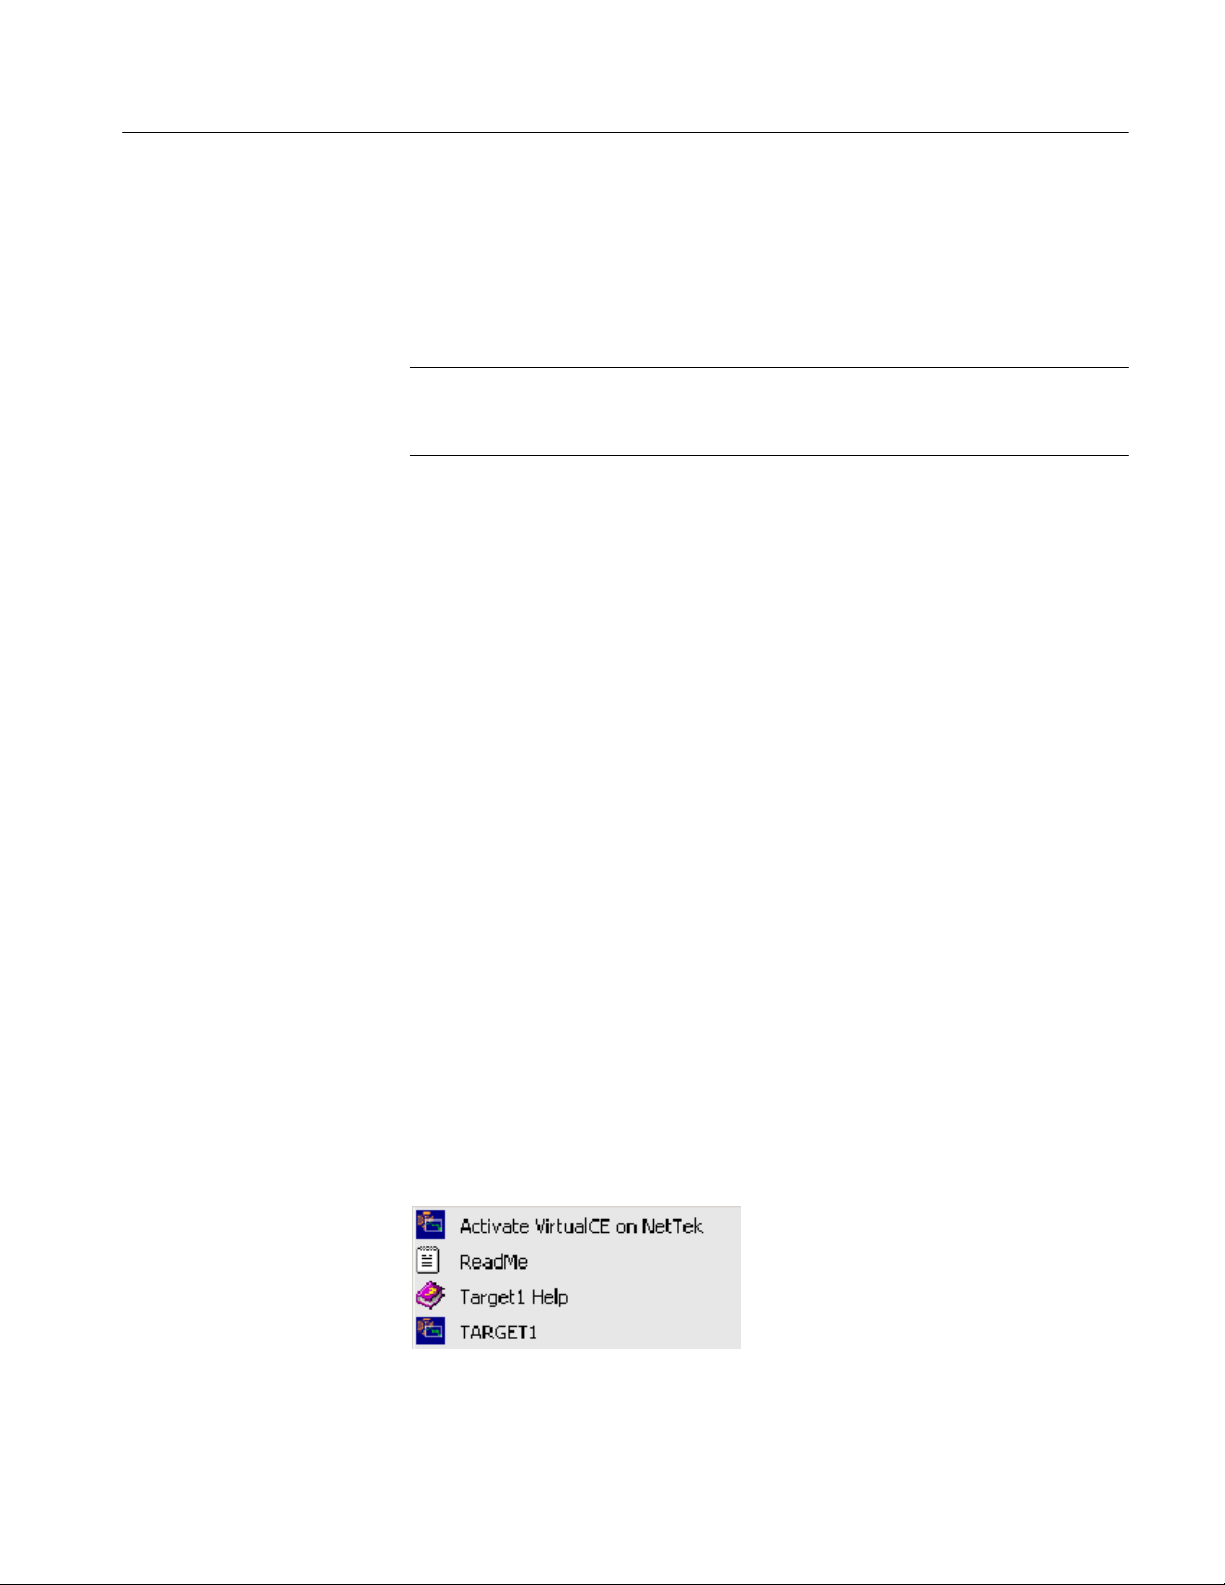
4. When the installation is complete, examine your Start > Programs >
Tektronix TARGET1 menu. It will contain four icons.
H Activate VirtualCE on NetTek enables Virtual CE on a connected
Tektronix NetTek Analyzer. Refer to page 3--1 for additional information
about VirtualCE for the NetTek.
H ReadMe displays a text file containing tips, information not available at
the printing of this manual, and a list of additional files and programs
that may be included on the TARGET1 CD-ROM.
H Target1 Help launches the TARGET1 help system. You can also launch
the help system from any of the TARGET1 menus.
H TARGET1 starts the application.
TARGET1 Trace Analysis, Report Generation and Emulation Tool User Manual
1- 5
Page 18

Getting Started
After Installation
If You Need Help
Read the Readme file for operating tips, latest updates, and additional programs
and files that are included on the TARGET1 CD-ROM.
To learn more about the Tektronix optical time-domain reflectometers (OTDR),
refer to the appropriate user manual and read the online help for the product.
If you need further assistance with using the TARGET1 software or have special
application problems, refer to Contacting Tektronix in the Preface section of this
manual.
1- 6
TARGET1 Trace Analysis, Report Generation and Emulation Tool User Manual
Page 19

Starting the TARGET1 Application
1. To start the installed TARGET1 application, choose Programs/Tektronix
TARGET1/TARGET1 from the Start menu.
The application displays the startup dialog box shown in Figure 1--1.
Getting Started
Figure 1- 1: Application startup dialog box
2. Select the optical test application you want to use. See TARGET1 Applica-
tion Packages on page 1--8 for more information about your choices.
3. Select the Start button to begin.
TARGET1 Trace Analysis, Report Generation and Emulation Tool User Manual
1- 7
Page 20

Getting Started
TARGET1 Application Packages
TARGET1 application packages allow you to work with OTDR (optical time
domain reflectometer) data.
OTDR Software Package
Modes
There are two modes provided by the OTDR software package:
H Trace Analysis mode. When you start the OTDR Trace Analysis Package,
you will be in Trace Analysis mode. You can also enter this mode by
selecting the Go to Trace Analysis button. Use this mode to view individual
files or pairs of files (bidirectional and difference pairs) and manipulate them
in the same ways that you can with the OTDR. You cannot collect new data,
but you can manually adjust events, perform tests, add landmarks, and add
notes about the fiber or about events. See OTDR Trace Analysis Mode on
page 2--1.
H Report Generation mode. Select the Go to Report Generator buttontoenter
this mode. Use this mode to view and manipulate data from multiple OTDR
files at once. You can generate reports using a wizard that walks you through
selecting the files, applying a template, doing additional tests, changing
settings, setting limits, and formatting the information for printing. See
OTDR Report Generator Mode on page 2--49.
1- 8
TARGET1 Trace Analysis, Report Generation and Emulation Tool User Manual
Page 21

OTDR Software Package
Page 22

Page 23

OTDR Trace Analysis Mode
When you start the OTDR Trace Analysis Package, the program will be in Trace
Analysis mode. You can also enter this mode by selecting the Go to Trace
Analysis button.
In OTDR trace analysis mode, you can view, manipulate, and take measurements
on saved OTDR trace data. Y ou can also add or remove events and landmarks
from the trace data. You can review, edit, or add notes to the test files. The saved
data can be either from local files or downloaded from the file systems of remote
test equipment through a remote connection.
The trace area and the measurement table for events are empty until you open a
file. See OpenaTraceFileon page 2--1.
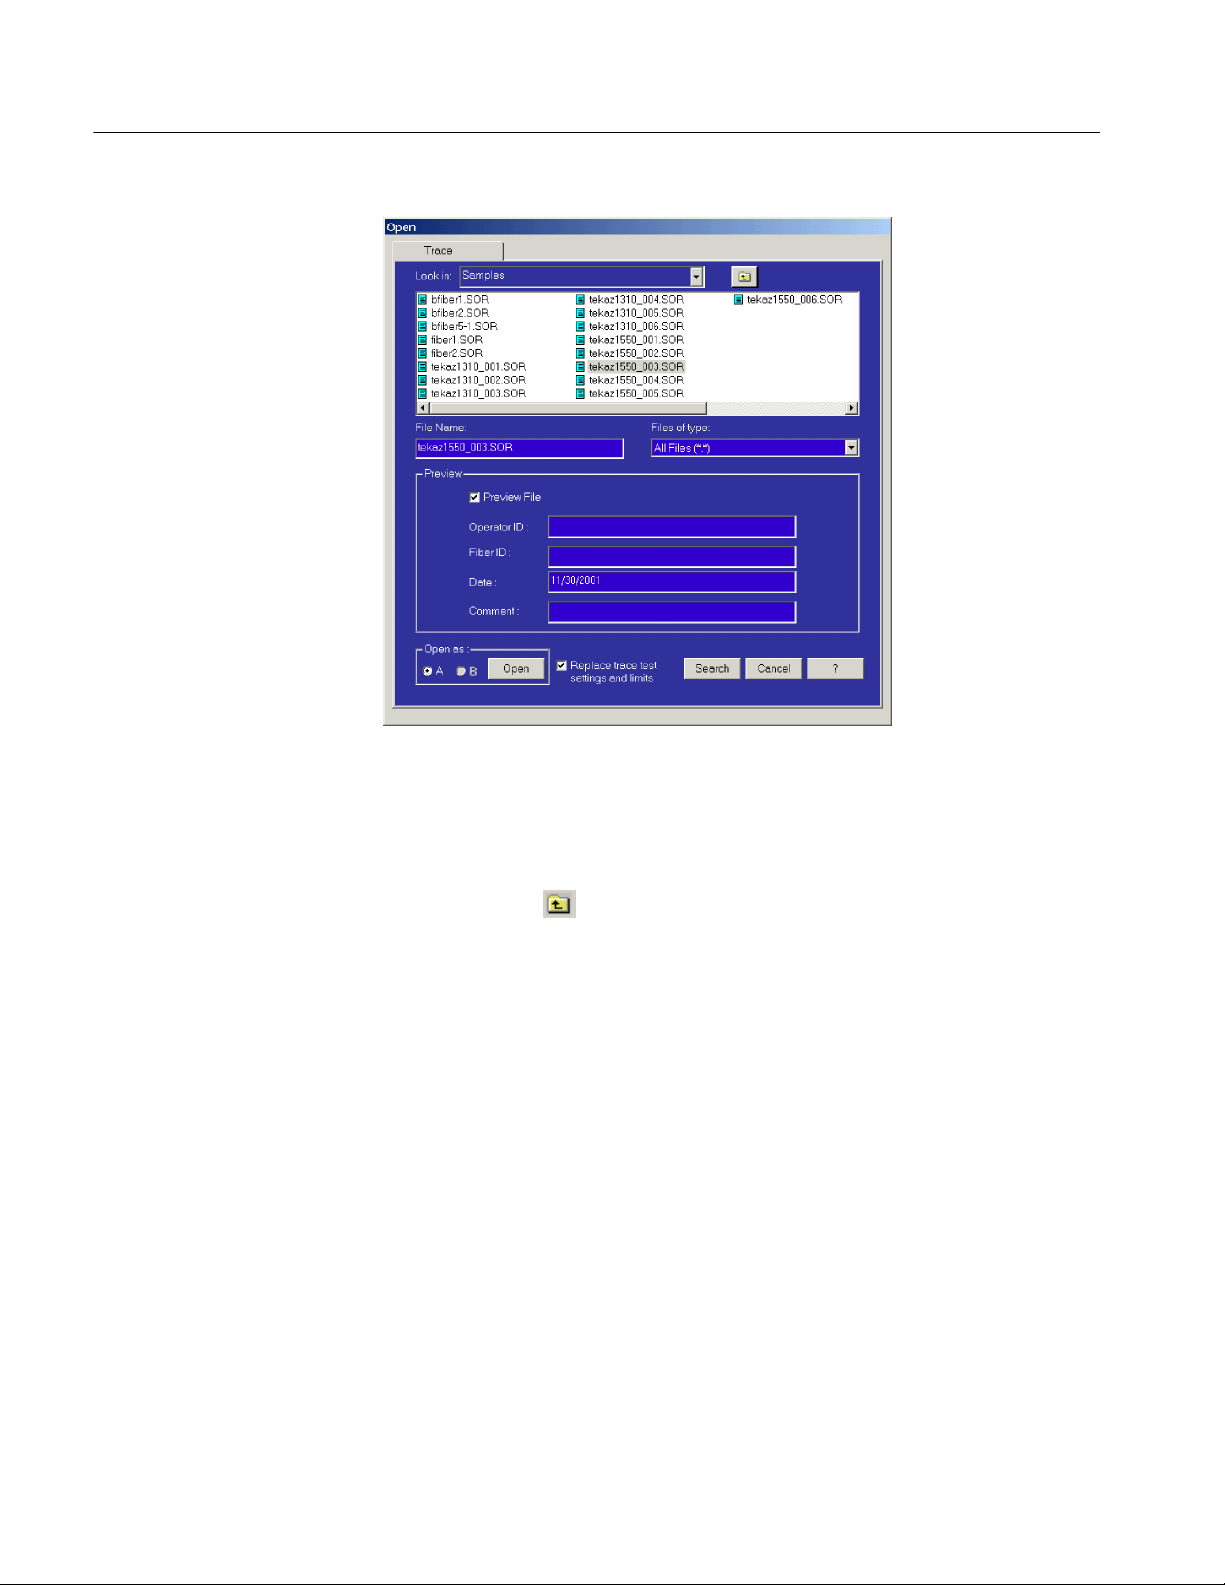
Open a Trace File
Measurement data must be loaded into the application to start the display of a
test file. Click File > Open...to display the Open dialog box shown in
Figure 2--1. Use the Open dialog box to select and open a saved test file.
Choose the type of files to look for and the drive to look in as follows:
1. Select a file type from the Files of type: drop down menu:
H Standard Optical Record files (*.sor files)
H Common File Format files (*.cff files, a Tektronix OTDR format)
H Waveform files (*.wfm files, a Tektronix OTDR format)
H Event File (*.evt, a Tektronix OTDR format)
H Display all file types (*.*)
TARGET1 Trace Analysis, Report Generation and Emulation Tool User Manual
2- 1
Page 24
OTDR Trace Analysis Mode
Figure 2- 1: Open file selection dialog box
2. Navigate to the folder you want by clicking in the Look in: box. The list
shows the local drives on the PC and any networked drives connected to the
PC. Click the
If you can’t find the file you want, click the Search button to display the
Search File(s) dialog box, which enables you to search your drive(s) for files
that meet specific criteria. See page 2--19 for more information on searching.
3. Click a file name in the list to select that file. Its name will appear in the File
Name box.
4. Select Preview File to view the fiber notes entered and saved with the trace
file. Use the fiber notes (if any are present) to help select a file of interest.
5. Select either A or B from the Open as: selections. This selection is
especially important for dual-trace displays. The default selection is the A
tab in single trace displays, but you can select either one and have a file
loaded in either or both A and B. Any new file opened writes over a file
already in the selected tab.
6. Click the Open button to load the file to the selected tab.
symbol to back up the directory tree.
2- 2
TARGET1 Trace Analysis, Report Generation and Emulation Tool User Manual
Page 25
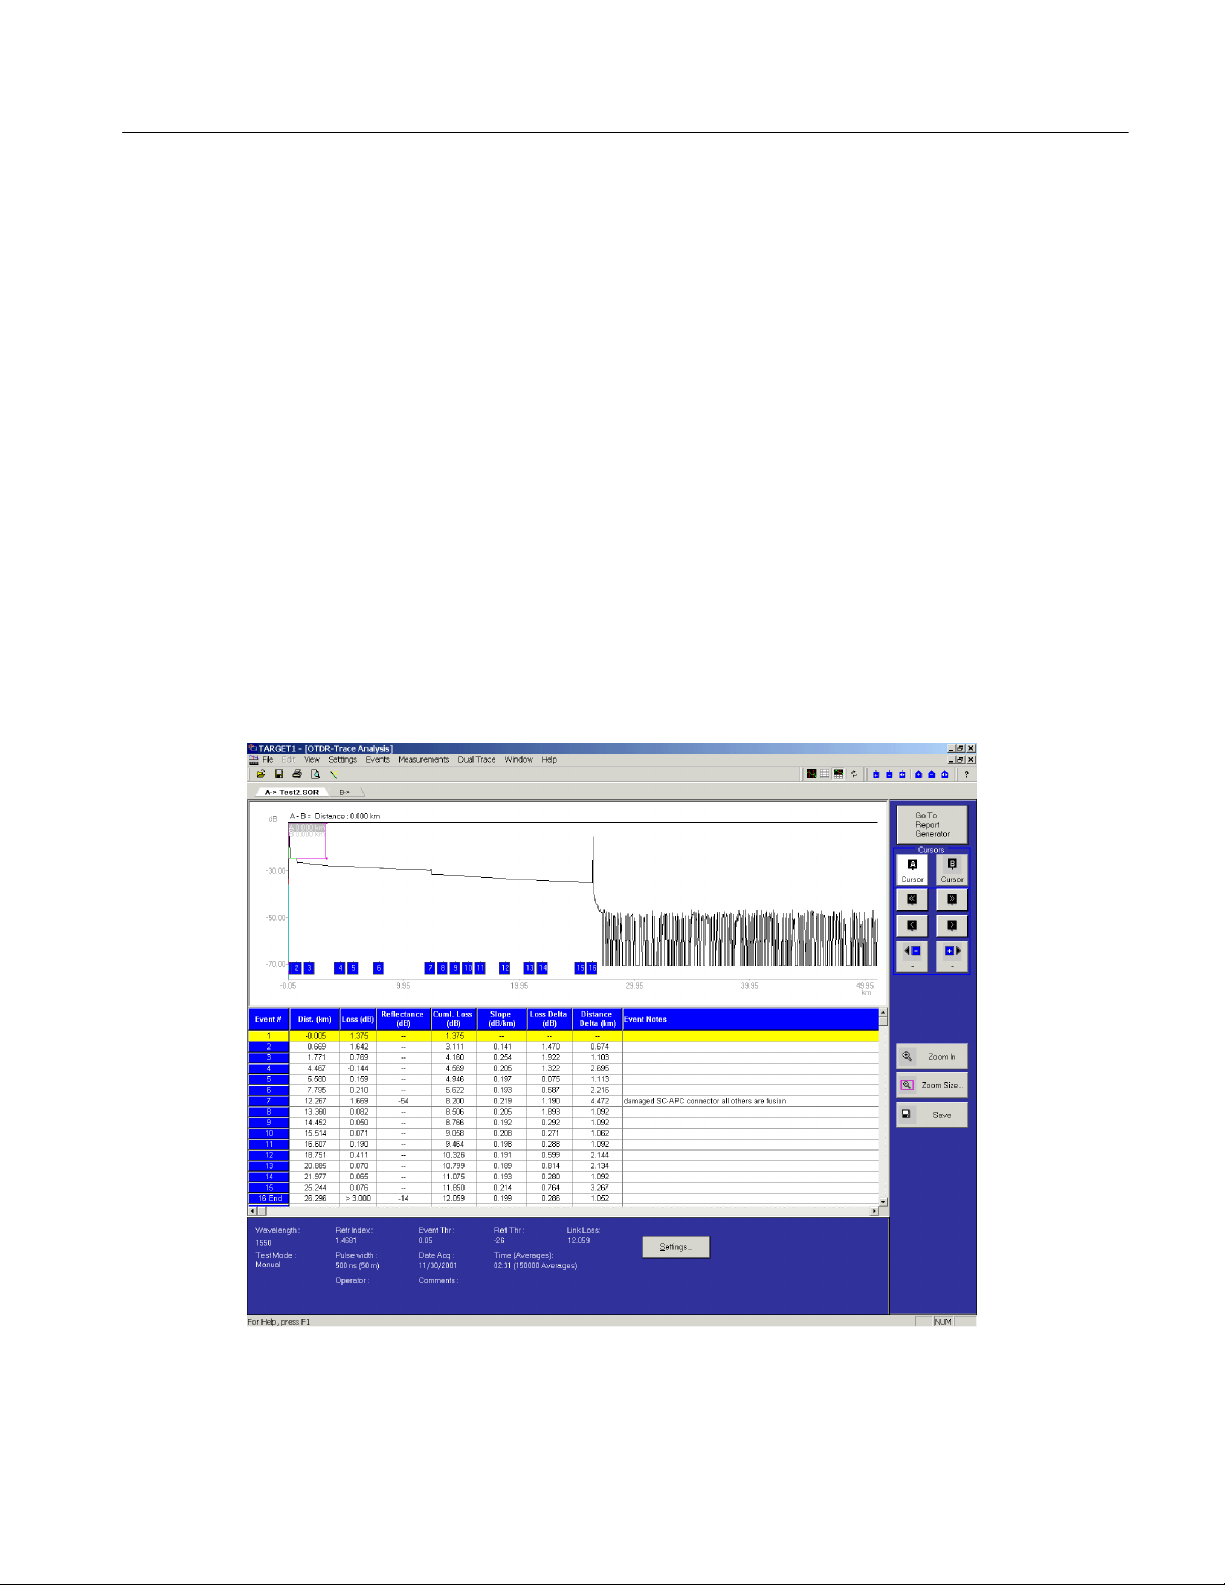
Functional Overview of Trace Analysis Mode
The features, functions, and interface controls for the NetTek Analyzer OTDRs
are emulated by the T ARGET1 Trace Analysis, Report Generation and Emulation Tool (see Figure 2--2). The first four sections describe the different areas of
the TARGET1 application:
H View Options (page 2--4)
H Trace Area (page 2--4)
H Event Table (page 2--9)
H Test Settings Panel (page 2--11)
H Control Panel (page 2--12)
H Menu Selection and Toolbar Button Descriptions (page 2--13)
The application displays views of the trace and event table, a test summary
panel, and a control panel.
OTDR Trace Analysis Mode
Trace Area,
page 2--4
Event Table,
page 2--9
Test Settings
Panel,
page 2--11
Figure 2- 2: OTDR trace analysis display
Control Panel,
page 2--12
TARGET1 Trace Analysis, Report Generation and Emulation Tool User Manual
2- 3
Page 26

OTDR Trace Analysis Mode
View Options
You can select the following views using the View menu or the associated
toolbar button:
Trace Area
H Maximize Trace.
and one line of data for the selected event in the Event Table.
H Split Trace and Event Table.
area and the Event Table.
H Event Table Only.
The trace area shows a graph of the acquired data points in the trace file. When a
trace file is first opened, the initial trace is scaled to show the full trace of the
acquisition.
The opening view depends on the View menu choice in effect when the
application was last closed. Refer to View Options on page 2--4 for more
information.
Figure 2--2 shows the Split Trace and Event Table view. The test settings panel is
also shown.
There are two trace tabs: A and B. Use the tabs to switch between two open data
files. The trace and the event table data change to show the information for the
selected trace file.
This maximizes the trace area showing only the trace
This splits the display between the Trace
This displays only the Event Table.
2- 4
CAUTION. Make sure that you save changes to open data files before opening
new files. If you open a file into a tab in which a data file is already opened, you
will lose any unsaved changes in the open file.
To open two files into the TARGET1 application, select an empty tab in the
Open dialog box. The Open dialog box default is the A trace tab.
TARGET1 Trace Analysis, Report Generation and Emulation Tool User Manual
Page 27
OTDR Trace Analysis Mode
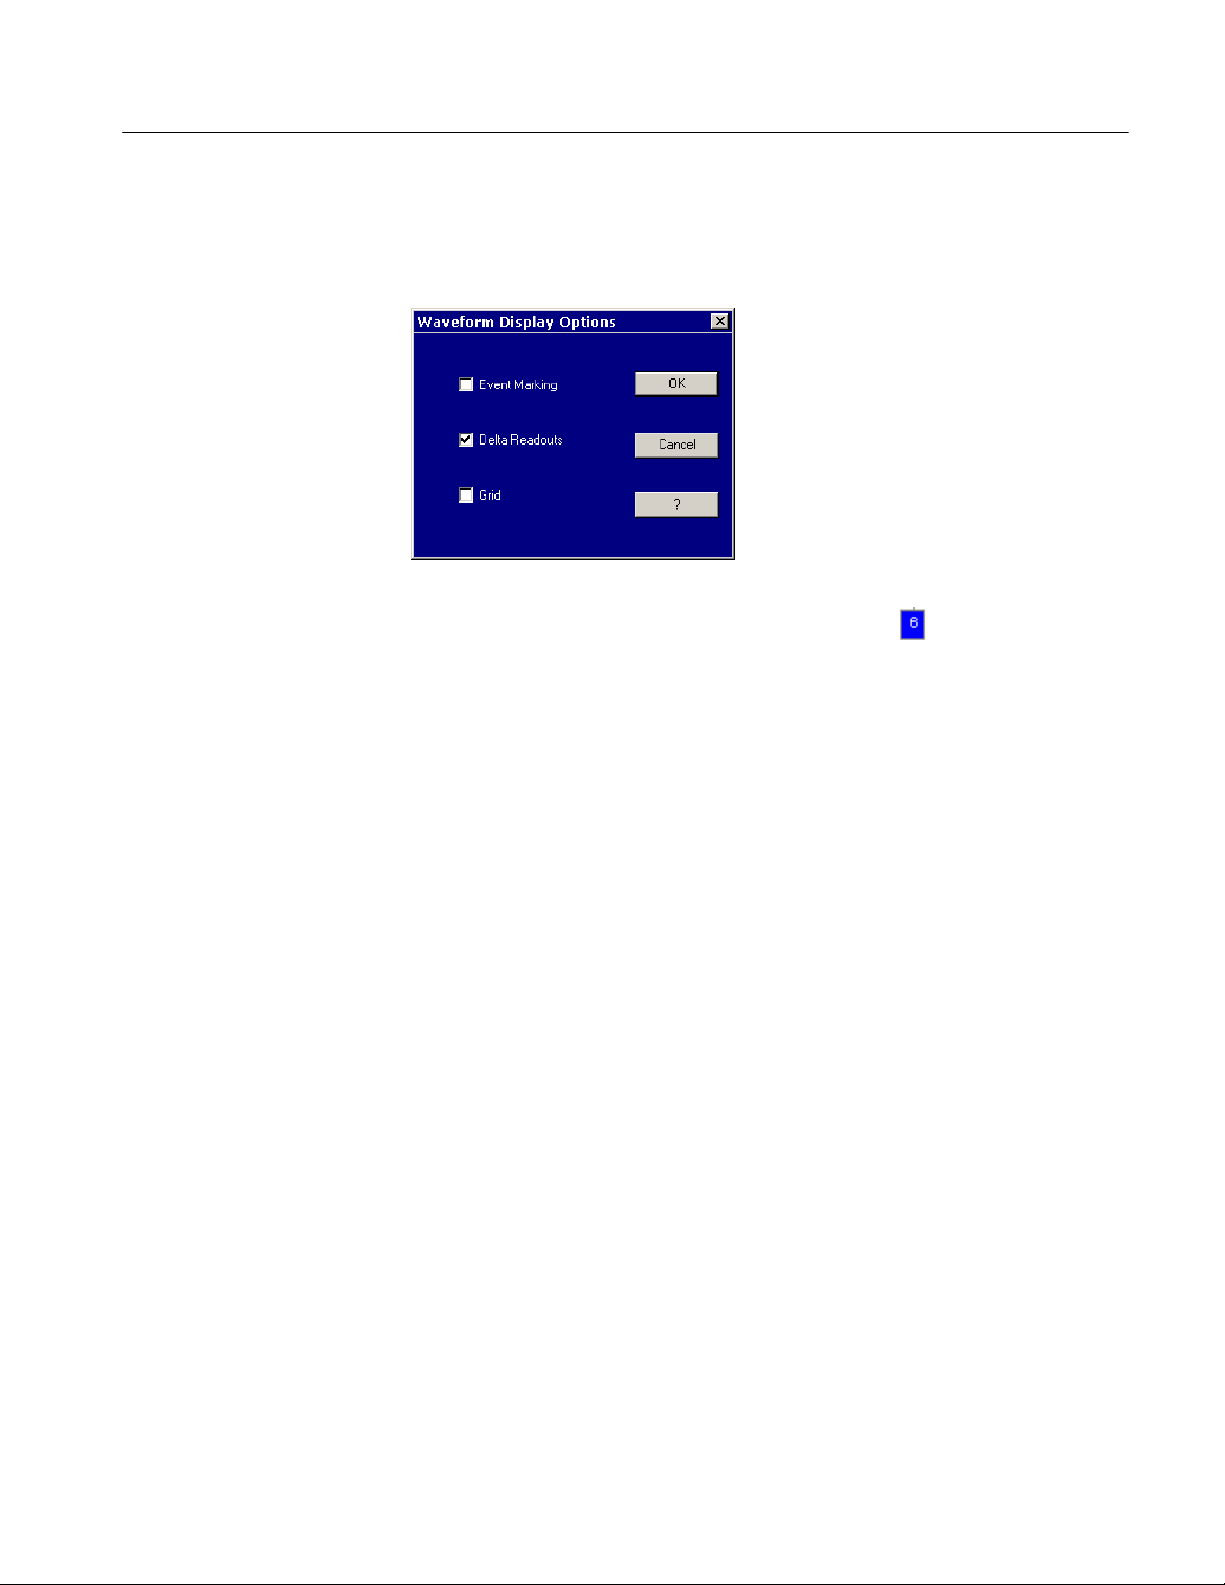
Changing Trace Display
Options
Select View > Trace Display Options... and then choose the options you want
displayed:
H Choose Event Marking to display event markers ( ) at the bottom of the
trace area. Events are points in the acquisition at which measurement
thresholds are exceeded and are sequentially numbered from left to right.
H Choose Delta Readouts to show the difference in position between cursors
A and B. The difference readout is always a positive number.
H Choose Grid to display gridlines in the trace area.
Cursors
There are two vertical or distance cursors used in the trace area: A and B. Use the
cursors to select points of interest (events) in the trace for making measurements.
Use the A and B cursor select buttons in the control panel to make a cursor
active. The button for the active cursor is highlighted. The active cursor in the
trace is shown horizontally centered in the Zoom box (see Zoom Box on
page 2--7).
Selecting a Cursor. In the control panel (to the right of the trace area), click the
button for the cursor you want to make active: A or B. The button for the active
cursor is highlighted. You can activate the inactive cursor by clicking the button
that is not highlighted.
Positioning the Cursors. There are several methods available for positioning a
cursor in the trace:
H Move the active cursor in large increments using the << or >> buttons in the
control panel. This is the same as pressing the Ctrl-Left arrow or
Crtl-Right arrow key on your keyboard.
H Move the active cursor in small increments using the < or > buttons in the
control panel. This is the same as using the Left arrow or Right arrow
key on your keyboard.
TARGET1 Trace Analysis, Report Generation and Emulation Tool User Manual
2- 5
Page 28

OTDR Trace Analysis Mode
H Move the active cursor using the previous (--) or next (+) buttons in the
control panel. Each click moves the active cursor to the previous or next
event in the trace. The event number the cursor will move to is indicated in
the push button box. The active cursor returns to the first event after passing
the last event in the trace.
H Click an event number in the trace display to move the cursor to that event.
H Click and drag a cursor to any position of interest in the trace.
H With the mouse, point to a position in the trace that you want to move the
active cursor to, and then double click. The active cursor moves to that
position in the trace.
H Select an event in the Event T able. The active cursor will move to that event.
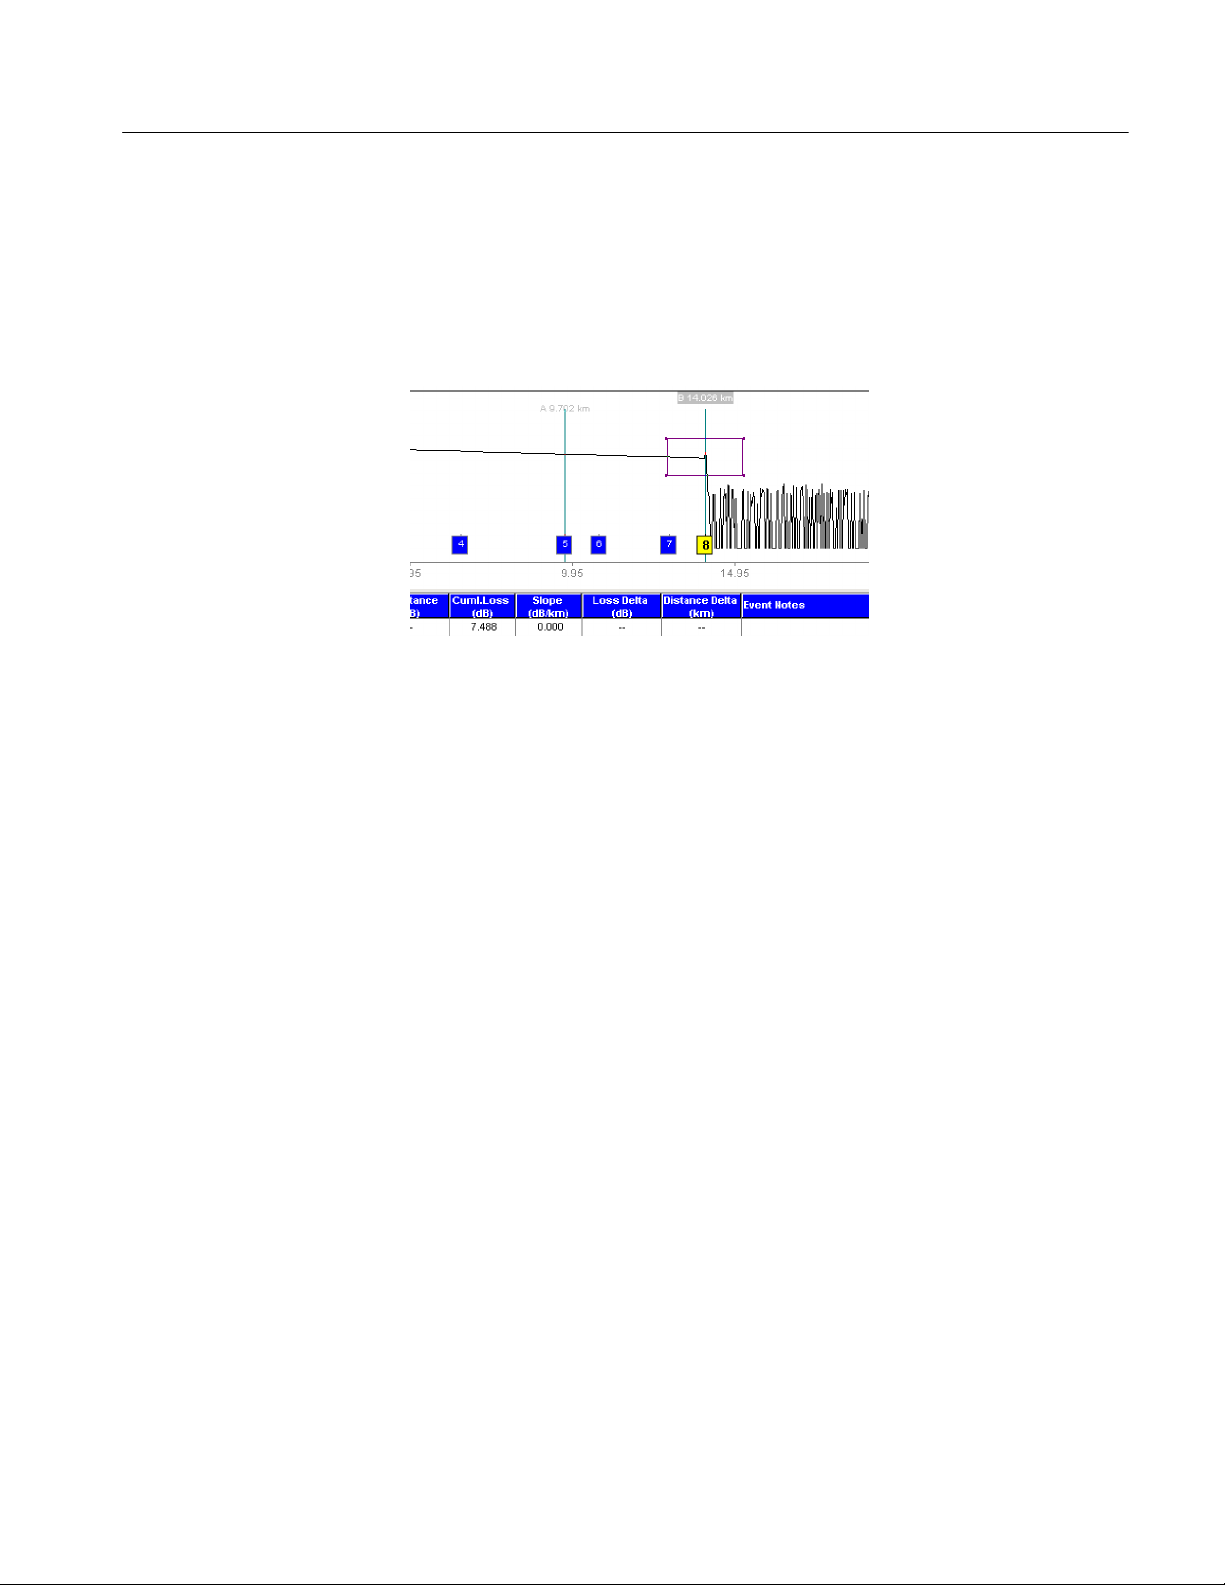
Cursor Measurements. The cursor readouts in the OTDR emulation provide both
the difference in distance from Cursor A to Cursor B and the distance from the
beginning of the trace to the active cursor (either A or B) position. These values
are shown just above the cursors and are updated as the cursors are moved within
the trace area.
Event and Landmark
Markers
Figure 2--3 shows event markers (square numbered boxes) across the bottom of
the trace indicating events that were found when the measurement was made or
were added by the operator. Small house-shaped markers indicate landmarks that
are added to the trace by the operator to record physical features.
Figure 2- 3: Event and landmark indicators on the OTDR trace
2- 6
TARGET1 Trace Analysis, Report Generation and Emulation Tool User Manual
Page 29
OTDR Trace Analysis Mode
Zooming
Use the pink Zoom box to display a selected portion of the trace. The zoom box
displayed in the full trace defines the area of the trace that will be shown in the
expanded (zoomed) trace (see Figure 2--4). Grab one of the corners of the zoom
box with the mouse and drag the size to set the trace expansion area around the
active cursor.
Figure 2- 4: Trace with zoom box
In the control panel, click Zoom In to display the selected portion of the graph
expanded in the trace area. The push button name changes to Zoom Out. Click
Zoom Out to switch back to the full trace display.
The zoom box follows the active cursor. When zoomed in, use the cursor arrows
on the control panel to adjust the portion of the expanded trace that is displayed
in the zoomed trace. If you move the active cursor out of the expanded trace with
the event selection buttons or make the inactive cursor active, the position of the
zoom box is adjusted to again center the trace around the active cursor.
Use View > Join Cursors to bring the inactive cursor into the window when in
zoom.
TARGET1 Trace Analysis, Report Generation and Emulation Tool User Manual
2- 7
Page 30

OTDR Trace Analysis Mode
r
view
Press the Zoom In button to expand the trace to the size of the zoom box you
defined. (The button label changes to Zoom Ou t when you are displaying a
zoomed-in trace.)
You can also change the size of the expansion area by clicking the Zoom Size
button to display the zoom size controls shown below.
While displaying a trace, use the left, right, up, and down arrows to adjust the
size of the zoom box for the active cursor:
H Click the left arrow to make the zoom box narrower.
H Click the right arrow to make the zoom box wider.
H Click the up arrow to make the zoom box taller.
H Click the down arrow to make the zoom box shorter.
After you have set the zoom box size, press the Done button to exit the zoom
size controls.
When you zoom in the display to expand a portion of the trace, a small graphic
display, the Overview window, is shown at the top of the trace area (see
Figure 2--5). This window indicates the location of the cursors in the trace and
the relative horizontal size and location of the pink zoom box within the trace.
Ove
window
Figure 2- 5: Zoomed trace with overview window
2- 8
TARGET1 Trace Analysis, Report Generation and Emulation Tool User Manual
Page 31
Event Table
OTDR Trace Analysis Mode
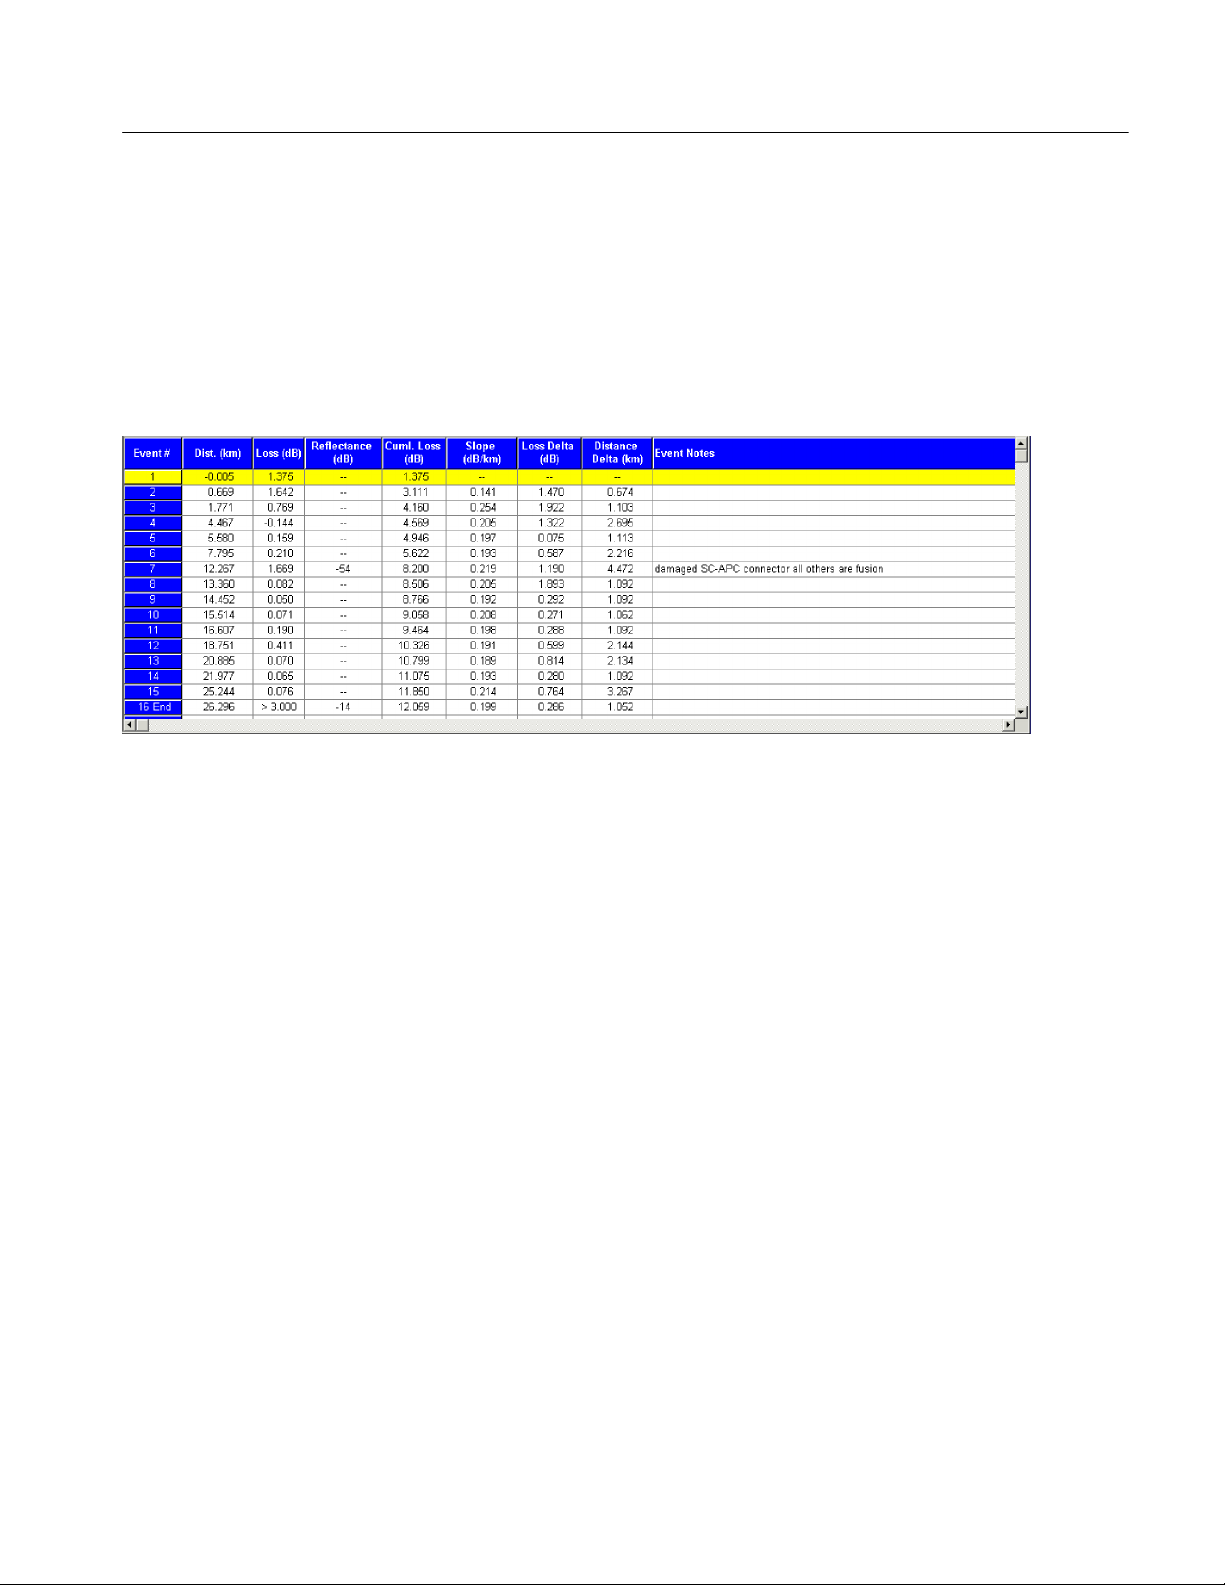
Figure 2--6 shows the Event Table. The event table lists, in order by distance,
those events in the trace file that violate the current event threshold. When the
table contains more columns and rows than can be displayed in the space, use the
horizontal scroll to view measurement columns and the vertical scroll to view all
the events.
Figure 2- 6: Event table
Refer to View Options on page 2--4 for information about how to allocate more
or less screen space to the event table.
When the active cursor is on an event, the event readout in the table is highlighted. Click a line in the measurement table to move the active cursor to that
event in the trace. Event data that exceeds the thresholds you set in the Test
Settings and Limits dialog box (see Changing Test Settings and Limits on
page 2--20) is highlighted in color.
When you add an event or landmark to a file, all the following events are
renumbered. Landmarks are indicated with an “L” following the event number.
Refer to the discussion beginning on page 2--28 for more details about adding,
deleting, or moving event and landmark markers.
The event table contains measurement information for all marked events,
including:
TARGET1 Trace Analysis, Report Generation and Emulation Tool User Manual
2- 9
Page 32

OTDR Trace Analysis Mode
Table 2- 1: Event Table column definitions
Column Definition
Event# Event numbers correspond to event markers or landmarks in the trace area.
Dist. (km) Distance represents the distance from the front panel to the event or landmark.
Loss (dB) Loss lists the loss of optical power at an event due to scattering, absorption, and bending.
Reflectance (dB) Reflectance lists the ratio of reflected optical power to incident optical power for reflective events.
Cuml. Loss (dB) Cumulative Loss lists the total loss from the front panel up to and including this event.
Slope (dB/km) Slope lists the attenuation of the fiber between an event and the preceding event.
Loss Delta (dB) Loss Delta lists the loss between an event and the preceding event.
Distance Delta (km) Distance Delta lists the distance between an event and the preceding event.
Event Notes Event Notes displays the Comments field of the Event / Landmark Notes dialog box.
The current event (the event where the active distance cursor is located) is
highlighted in the event table. You can highlight another event by clicking
anywhere on that event’s row in the event table.
The distance, event loss, reflectance, and two-point distance measurements
correspond to measurements on the trace display. This list shows some other
relationships between different measurements:
H Loss Delta includes the event loss of the previous event and the loss between
events.
H Slope is the loss per unit distance of the fiber between events, starting after
the previous event and up to the current event.
H The overall link loss is the cumulative total of the Loss Delta measurements.
H Distance Delta measurements on the event table should correspond with
those seen on the trace display, if the distance cursors are positioned
precisely on the events in the trace display.
The event table is automatically compiled for all events that exceed a threshold
(event loss or reflectance threshold). Measurements can also be entered manually
into the table, if necessary.
NOTE. Loss measurements on the event table may vary slightly from the same
automatic measurements made in the trace display. For event-loss and reflectance measurements, measurements on the event table are made by fitting lines to
the data between the current event and adjacent events (or in the case of
IntelliTrace traces, to the nearest trace segment boundary), while measurements
on the trace display use data within the expansion window.
2- 10
Refer to page 2--46 for information about editing the event table.
TARGET1 Trace Analysis, Report Generation and Emulation Tool User Manual
Page 33

Test Settings Panel
OTDR Trace Analysis Mode
The test settings panel (see Figure 2--7) provides basic information about the
settings used to perform automatic measurements on the trace file. The fields are
not editable from the panel.
To edit the settings, click the Settings button or select Settings > Test Settings
and Limits (File 1 or File 2). For more about test settings and limits, refer to
page 2--20.
The Avgs/Time field displays the number of sampling acquisitions that were
averaged before stopping the acquisition. The time that elapsed during averaging
is also shown. This acquisition parameter is shown for information only and
cannot be changed using the TARGET1 application.
You can edit the Operator and Comments fields by selecting File > Fiber Notes.
Refer to Adding Notes on page 2--26.
Figure 2- 7: Test settings panel
TARGET1 Trace Analysis, Report Generation and Emulation Tool User Manual
2- 11
Page 34
OTDR Trace Analysis Mode
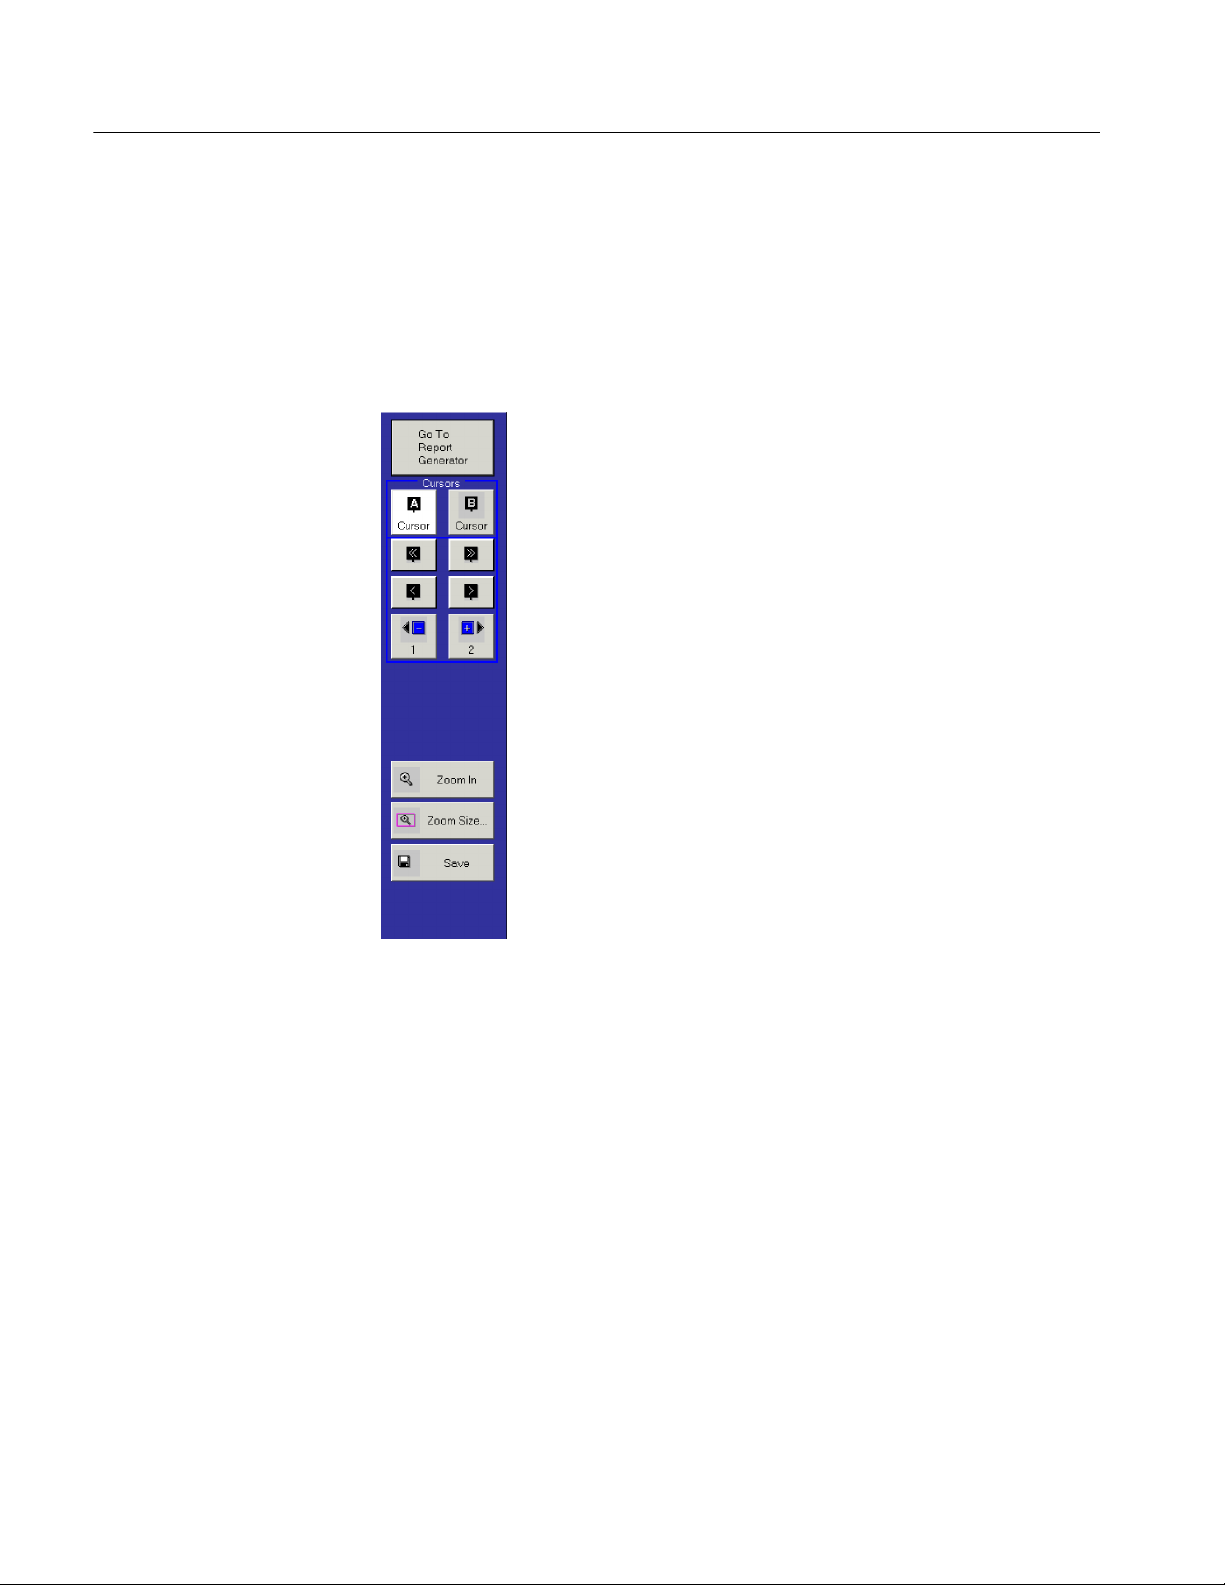
Control Panel
Use the control panel, shown in Figure 2--8, to display the Report Generator (see
page 2--49), select and move the cursors (see page 2--5), jump to previous or
next events (see page 2--5), zoom in on a trace element and size the zoom box
(see page 2--7), or save changes to the trace file (see page 2--5).
Display the Report Generator
Make a cursor active
Move the active cursor in large steps
Move the active cursor in small steps
Select the previous or next event in the trace
Zoom the trace in to the area shown by the zoom box
Display controls for resizing the zoom box
Save changes to the trace file
Figure 2- 8: Control panel
2- 12
TARGET1 Trace Analysis, Report Generation and Emulation Tool User Manual
Page 35

OTDR Trace Analysis Mode
Menu Selection and Toolbar Button Descriptions
The menu bar choices provide the setup and operation selections you need to
control the application. Click a task group title to get a drop down menu of all
the controls and selections for a selected task. Selections followed by an ellipsis
(…) display either a dialog box or further choices. If a menu choice is not
available for the particular operating mode, the choice is grayed out and blocked
from operating.
Table 2- 2: TARGET1 menu selections
Menu / Selection Toolbar button Description
File
Open Open a new OTDR file. Displays the Open dialog box. See page 2--1.
Save Saves changes to a previously saved file. For a new file, opens the Save As
dialog box, allowing you to name and save the active file to a location you
choose. Refer to page 2--19.
Save As Opens the Save As dialog box, allowing you to name, choose a format, and
save the active file to a location you select. Refer to page 2--19.
Export Exports measurement data, notes, and test settings and limits to another file
format (XML, HTML, CSV, or RTF). Displays the Export Data File dialog box.
See Exporting Data on page 2--25.
Page Setup Allows you to set paper type, page margins, page orientation, and other values
for printed documents. See your Windows documentation.
Print Preview Allows you to see how your measurement data will look when printed. See your
Windows documentation.
Print Displays the Print dialog box so you can print the active file. See Printing Trace
Analysis Views on page 2--31.
Fiber Notes Displays the Add Notes dialog box allowing you to add notes to the file. See
page 2--26.
Report Wizard Displays the Report Wizard which walks you through setting up a report in
Report Generator mode. See page 2--56.
Recent OTDR Files Allows you to open recently opened OTDR files.
Exit Closes the TARGET1 application.
View
Maximize Trace Displays only the trace and one line of the event table showing the active event.
Maximizes the trace.
Split Trace and Event Table Displays both the trace and the event table.
Event Table Only Displays the event table only. Maximizes the event table.
Test Settings Bar Shows or hides the Setting panel (at the bottom of the applicati on window). See
page 2--11.
TARGET1 Trace Analysis, Report Generation and Emulation Tool User Manual
2- 13
Page 36

OTDR Trace Analysis Mode
Table 2- 2: TARGET1 menu selections (cont.)
Menu / Selection DescriptionToolbar button
Control Panel Shows or hides the control panel (at the right of the application window). See
page 2--12.
Zoom Scroll Bars Allow you to move the trace left / right, up / down when the Trace view is
zoomed in. Displays scroll bars at the bottom and left of the Trace view.
Trace Display Options Displays the Waveform Display Option dialog box allowing you to show or hide
event markers, delta readouts, or gridlines. See page 2--5.
Toolbars
Reset All Toolbars Returns all toolbars to factory default settings.
Customize Toolbars Displays the Customize Toolbars dialog box allowing you to show or hide
toolbars. See page 2--17.
Join Cursors Moves the inactive cursor to the active cursor position.
Refresh Updates the trace and event table for the current view.
Restore Zoom Box Returns the zoom box to its original setting.
Display Overview Window Determines whether or not the Overview window is displayed when Zoom I n is
selected.
Settings
Test Settings and Limits Displays the Settings and Limits dialog box allowing you to read, save, open, or
modify measurement settings and limits. See page 2--19.
About Trace Displays the About Trace(s) message box providing information about the
active trace file(s). See page 2--18.
Open Settings Displays the Open dialog box with the Settings and Limits tab selected allowing
you to open a new settings file. See page 2--19.
Save Settings Displays the Save As dialog box allowing you to save the current settings to a
new file and location. See page 2--25.
Distance Units Displays a submenu allowing you to set the distance units for the trace display.
See page 2--19.
System Factory Defaults Resets all settings to factory defaults.
Events
Add Events Displays the Add Event dialog box allowing you to add an event to the active
trace file. See page 2--28.
Delete Events Displays the Delete Event dialog box allowing you to delete an event from the
active trace file. See page 2--28.
Move Events Displays the Move Event dialog box allowing you to move an event in the active
trace file. See page 2--28.
Add Landmarks Displays the Add Landmark dialog box allowing you to add a landmark to the
active trace file. See page 2--30.
2- 14
TARGET1 Trace Analysis, Report Generation and Emulation Tool User Manual
Page 37

OTDR Trace Analysis Mode
Table 2- 2: TARGET1 menu selections (cont.)
Menu / Selection DescriptionToolbar button
Delete Landmarks Displays the Delete Landmark dialog box allowing you to delete a landmark
from the active trace file. See page 2--30.
Move Landmarks Displays the Move Landmark dialog box allowing you to move a landmark in the
active trace file. See page 2--30.
Delete All Landmarks Deletes, with your confirmation, all landmarks from the active trace file. See
page 2--30.
Event/Landmark Notes Displays the Event / Landmark Notes dialog box allowing you to record
information and comments about a landmark in the active trace file. See
page 2--26.
Freeze Events Makes the current events a template for subsequently opened files. This means
that all of the current events will continue to be displayed as other traces files
are opened, regardless of the Event Loss actually found at those distances.
Additional events that exceed the thresholds will also be found, displayed, and
included in the event table. Consider freezing events if you are testing more
than one fiber for which you expect the events to have the same locations.
Measurements
Event Loss Displays the Event Loss Measurement dialog box allowing you to perform event
loss measurements (loss at a single point) on the active trace. The event loss
results are displayed in the trace window. See page 2--33.
Two-Point Displays the Two-Point dialog box allowing you to perform two-point
measurements on the active trace. This measurement shows the loss between
the left-most cursor position and the right-most cursor position. See page 2--37.
Reflectance Displays the Reflectance Measurement dialog box allowing you to perform
reflectance measurements on the active trace and to display measurement
values in the trace window. See page 2--39.
ORL Performs optical return loss measurements in the trace and displays the ORL
value in the active trace. See page 2--42.
No Measurements Select to remove all measurement cursors and displays from the active trace.
Bidirectional Averages Displays the Bidirectional Averages dialog box allowing you to perform
bidirectional average measurements between two trace files (representing
measurements taken from each end of the fiber). See page 2--43.
Difference Displays the Difference Measurement dialog box allowing you to perform
difference measurements (the difference between one trace and another) and
display the results in a third trace and event table view. See page 2--45.
No Third Tab Removes the third tab showing difference or bidirectional average measure-
ment results. Dual Trace mode remains active in the two traces.
Dual Trace
Dual Trace On Overlays one trace with a second trace. If a second trace file is not already
opened, you will be prompted to open one. The newly opened trace file is
displayed in the B-tab.
TARGET1 Trace Analysis, Report Generation and Emulation Tool User Manual
2- 15
Page 38

OTDR Trace Analysis Mode
Table 2- 2: TARGET1 menu selections (cont.)
Menu / Selection DescriptionToolbar button
Dual Trace Off Removes the overlay image in open trace files. If a third tab is displayed for
bidirectional average or difference measurements, this tab is removed and the
Measurements menu selections revert to the default selections (No Measurements and No Third Tab).
Reset Vertical Separation When in Dual trace mode, the zoom scroll bar only moves on the trace,
allowing you to move the trace if it is overlaying the second trace. Reset vertical
separation moves the trace back to its original location.
Window
Cascade Displays the Report Generator and Trace Analysis windows (if both are open)
one on top of the other (the active window will be on top). See your Windows
documentation.
Tile Displays the Report Generator and Trace Analysis windows (if both are open)
without overlaying one window on top of the other. See your Windows
documentation.
Arrange Icons Arranges icons representing minimized windows to the lower left of the
application window. See your Windows documentation.
Open files list Allows you to select the window you want to display from this area, which
shows the open windows (maximum of two).
Help
TARGET1 Help Displays the TARGET1 online help with the Contents tab selected.
Contents and Index Displays the TARGET1 online help with the Index tab selected.
About TARGET1 Displays copyright and version information for the TARGET1 application.
2- 16
TARGET1 Trace Analysis, Report Generation and Emulation Tool User Manual
Page 39

OTDR Trace Analysis Mode
Customize Toolbars
Beneath the menu bar is a row of icons that provide quick selections for the tasks
and setups. The icons in the tool bar can be tuned on or off in groups using the
Customize Tool bars dialog box (see Figure 2--9). To access the dialog box,
select View > Toolbars > Customize Toolbars. The default selection is for the
File Options, View Options, Events and Landmarks, and Help icons to be visible
in the icon tool bar. Tool icons are grayed out in the tool bar when their selection
is not currently valid.
Figure 2- 9: Customize toolbar selection window
TARGET1 Trace Analysis, Report Generation and Emulation Tool User Manual
2- 17
Page 40

OTDR Trace Analysis Mode
Displaying Summary
Information About the
Trace File
Select Settings > About Trace to display summary information about the
current trace file. The type of information displayed is shown in Figure 2--10.
There are one or two columns; each represents an open trace file.
NOTE. The About Trace(s) dialog box displays the settings information that were
used to acquire the original trace with the OTDR. The settings recorded here do
not change if you change settings using the TARGET1 application, so you can
use this dialog box as a reference.
2- 18
Figure 2- 10: About Trace(s) dialog box (shows original OTDR acquisition settings)
TARGET1 Trace Analysis, Report Generation and Emulation Tool User Manual
Page 41

OTDR Trace Analysis Mode
Opening a Test Settings
File
Searching for Trace Files
Select Settings > Open Settings > Trace 1 or Trace 2 to select a file to open.
The Open dialog box is displayed, showing the Settings and Limits Only tab. To
open a test settings file, use standard Windows techniques to locate and open a
file.
Once you click OK and return to the Trace Analysis views, the settings and
limits of the newly opened test settings and limits file are applied to the active
trace file, or to subsequent files that you open. Events in the trace file within the
limits of the new test settings and limits file are removed from the trace and
event table. Conversely, if an event exceeds the limits in the newly opened test
settings and limits file, a new event is added to the trace and event table.
After selecting File > Open, you can use the Search button to set up a file
search. The search choices for one-way files are:
H Search for a file name
H Search on a date acquired or modified
H Search on a file parameter
Click a selection tab (Name Locator, Date Modified, or Parameters) to select a
set up window for defining the search criteria. Each of these search methods has
option settings for defining the search. Refer to File Search, beginning on
page 2--63, in the Report Generator operating information for details on file
searching procedures.
Saving a Trace File
Changing Display Units
After entering manually adjusted measurements into an event table, you should
save any changes you make into a different file using the Save As dialog box
(File > Save As). There may be occasions when you want to restore the original
measurement values. The only way to do this is to reload the original trace file.
To save a trace file, including any changes you have made to the file since you
opened it (for instance, added events or landmarks, or manual measurements),
click the Save button on the control panel.
The trace file is saved into the existing file and directory. To save the trace data
into a new file, select Save As from the File menu.
You can save to .SOR and .CFF formats. Some high resolution data may be lost
when you save to .CFF format.
You can set the measurement units to kilometers (km), meters (m), kilofeet (kft),
feet (ft) or miles.You change the display units in the Settings > Distance Units
submenu. To change the display units:
1. Select Distance Units in the Settings menu.
TARGET1 Trace Analysis, Report Generation and Emulation Tool User Manual
2- 19
Page 42
OTDR Trace Analysis Mode
2. Select the desired setting from the submenu.
Changing Test Settings
and Limits
You can modify the current settings and limits. Refer to page 2--25 for information on saving a new test settings and limits file (*.set).
Changing settings. Once you save changes, the active trace file is evaluated with
the new settings and limits. Events in the trace file less than the threshold in the
new settings are hidden from the trace and event table. Conversely, if an event
exceeds the thresholds in the newly opened test settings and limits file, the event
mark is added to the trace and event table.
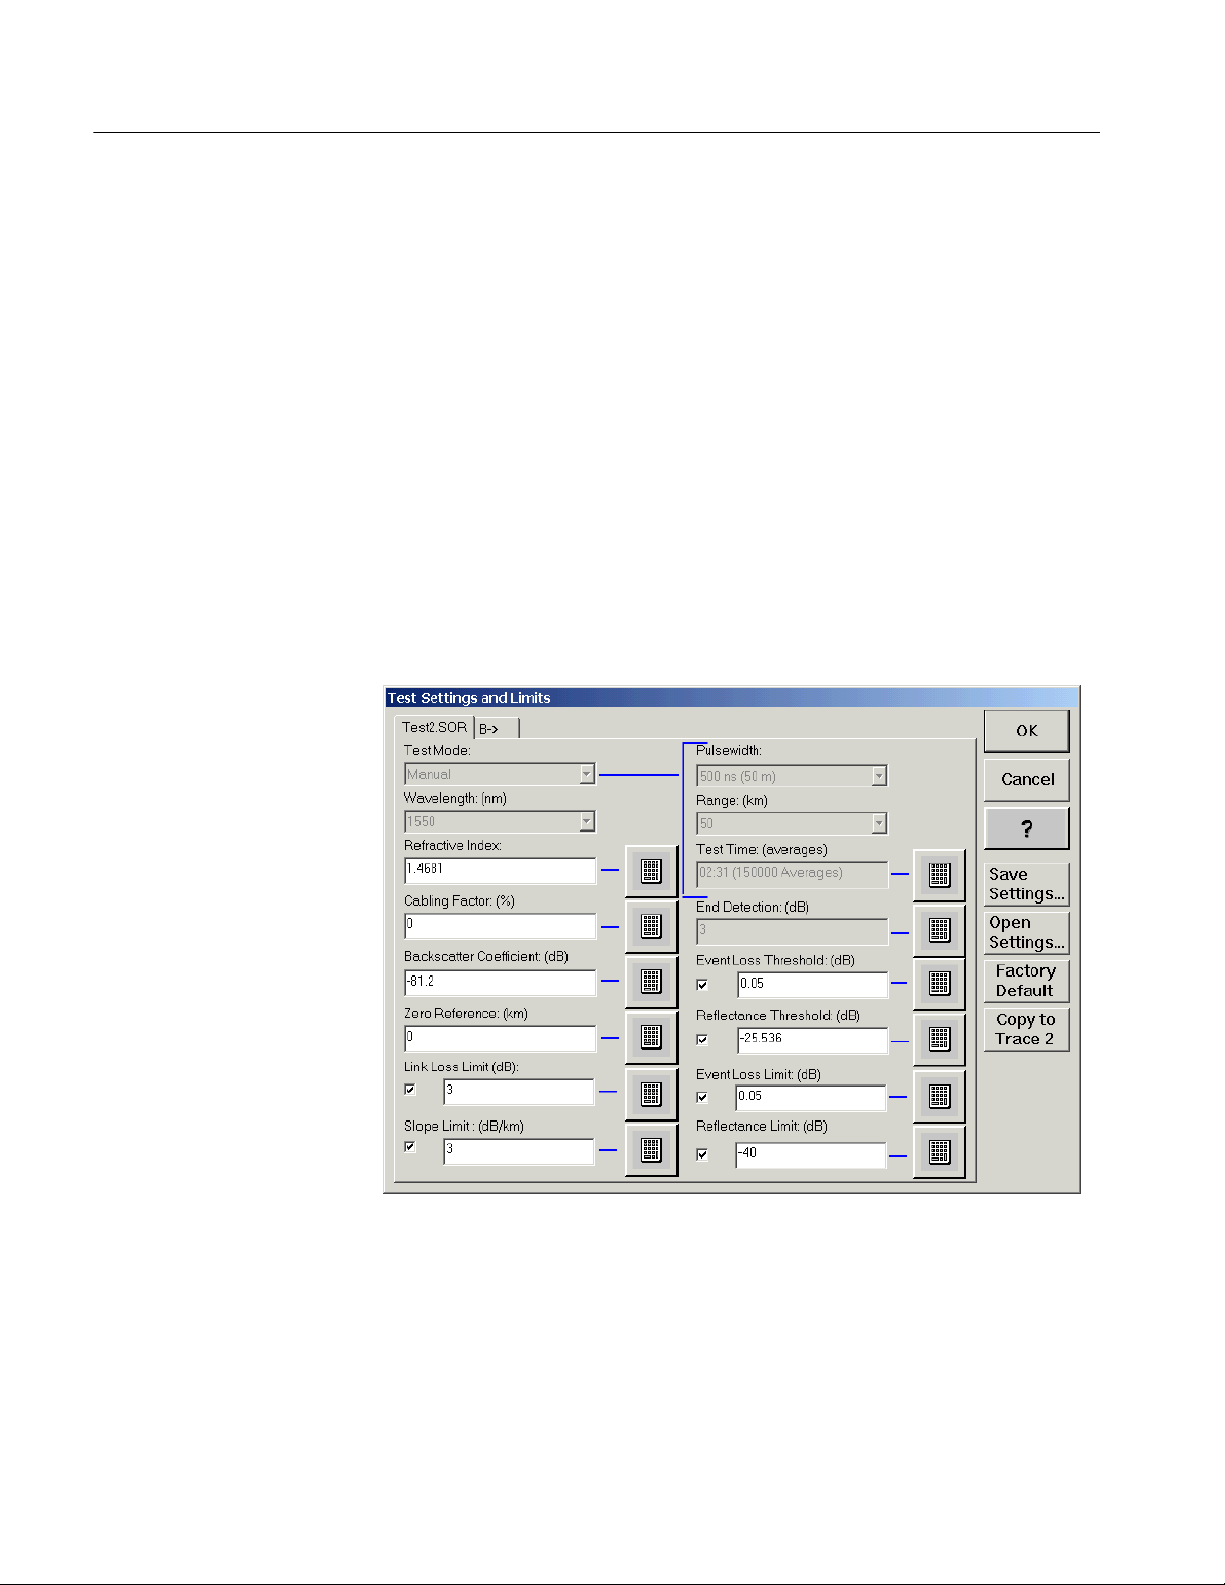
Use these steps to change settings:
1. Click the Settings button in the test settings panel or select Settings > Test
Settings and Limits. The Test Settings and Limits dialog box is displayed
(see Figure 2--11).
2- 20
Figure 2- 11: Changing or displaying the current test settings and limits
The upper fields in the dialog box reflect aspects of the trace file that you
cannot change, including the Test mode, Wavelength, IntelliTrace Plus
Configuration, Pulse width, Range, Test Time (averages) and End Detection
(dB). See the OTDR documentation for more information about these fields.
TARGET1 Trace Analysis, Report Generation and Emulation Tool User Manual
Page 43

OTDR Trace Analysis Mode
Some of the fields in this dialog box have a numeric keypad (
right of the field. Clicking the keypad displays a dialog box allowing you to
specify a new value. You can enter a value directly into the text field, or you
can use the scroll bars above the text field to specify a new value. Only
values between the numbers shown to the left and right of the scroll bars are
accepted (an error message is displayed if you click OK and the number in
the text field is out of range). Figure 2--12 shows the dialog box for the
Refractive Index.
Figure 2- 12: Refractive Index dialog box
)tothe
2. To change the current test settings, click a numeric keypad or enter a new
value directly into the text fields.
NOTE. If you click the Factory Default button, you will be asked to confirm that
you want to change all values to factory defaults. The factory defaults apply only
to the trace values and wavelength shown in the dialog.
Consider the following information when making your changes:
H Refractive Index. You can set the refractive index to any value from 1.4000
to 1.60000, inclusive. This value is a characteristic of the fiber, and can vary
from fiber to fiber. The refractive index can be obtained from the fiber
manufacturer.
The refractive index is a calibration factor for the distance (horizontal) scale.
A change to the refractive index affects the distance scale and measurements.
Distance measurements are rescaled as you change the refractive index.
If you do not know the refractive index of the fiber, you can calibrate the
index if you know the distance to a feature on the fiber, such as a splice or
the end of the fiber. To do this, place one of the distance cursors on the fiber
TARGET1 Trace Analysis, Report Generation and Emulation Tool User Manual
2- 21
Page 44

OTDR Trace Analysis Mode
feature. Adjust the refractive index and press OK until the distance measurement at the cursor matches the known distance to the fiber feature. At this
point, the refractive index is correct.
NOTE. This process to calibrate the index is for straight unbundled fiber. For
fibers in bundles, installed fibers use the Cabling Factor setting to match
distance to ground length.
If you do not know the refractive index for the fiber and cannot calibrate it,
use the factory-default values, which are based on wavelength. See Table 2--3
for the default values.
Table 2- 3: Default values for Refractive Index by wavelength
Wavelength Mode Default refractive index
850 nm Multi 1.496
1300 nm Multi 1.487
1310 nm Single 1.4675
1550 nm Single 1.4681
1625 nm Single 1.4683
H Cabling Factor. In an optical fiber, the optical length can be longer than the
external length of the cable due to spiraling in the cable bundle. The cabling
factor is a percentage applied to the measured optical distance. It is used to
derive the physical distance in the bundled cable so that the distances to
events and landmarks can be determined accurately.
H Backscatter Coefficient. The backscattter coefficient is a characteristic of
the fiber under test and, similar to the refractive index, can vary from fiber to
fiber. It is a negative number indicating the dB level of the backscattered
light relative to the light entering the fiber. Set the backscatter coefficient to
any value from --100 to --40 dB, inclusive. Be sure the backscatter coefficient
is set correctly before doing ORL or reflectance measurements.
The backscatter coefficient for a particular fiber can usually be obtained from
the fiber manufacturer. If you do not know the backscatter coefficient,
however, you should use the factory-default values, which depend on
wavelength. Refer to Table 2--4.
2- 22
TARGET1 Trace Analysis, Report Generation and Emulation Tool User Manual
Page 45

OTDR Trace Analysis Mode
Table 2- 4: Default values for Backscatter by wavelength
Wavelength Mode Core diameter Default backscatter
850 nm
Multi
62.5 µm
--62.8 dB
1300 nm
1310 nm
1550 nm
1625 nm
Multi
Single 9 µm --78.7 dB
Single 9 µm --81.2 dB
Single 9 µm --81.5 dB
62.5 µm
--70.07 dB
H Zero Reference. Sets the distance used as the zero or starting point in the
trace. It is used to eliminate jumper cable lengths between the patch panels
and the front panel of the NetTek Analyzer. Set the distance units in the
drop-down selection box to the right in this dialog box.
H Link Loss Limit. Sets the limit (in dB) for the level at which the Link Loss
readout below the event table is highlighted. When the Link Loss exceeds
this setting, the readout will be highlighted in red. You can set the limit to
any value from 0.1 to 50.00 dB.
H Slope Limit. Sets the limit (in dB) for slope values that are highlighted in
the event table. Slope is the power loss per unit length. Excessive loss can be
due to bends or splices. The threshold setting is a limit on the loss per unit
length that might be considered acceptable for a normal fiber . Excess slope
indicates losses above the normal losses in the fiber. For 850 nm, the Slope
Limit can be set to 2.000 -- 8.000 dB. For other wavelengths, the Slope limit
can be set from 0.100 dB to 5.000 dB.
H Event Loss Threshold. Sets the threshold (in dB) for events that are marked
when event marking is turned on. Only those events with splice-loss
measurements that meet or exceed the threshold are included, both on the
measurement screen and on the event table. You can set the event threshold
to any value from 0.01 to 5.00 dB. To display all events regardless of loss
value, set the event loss threshold to 0.01 dB.
NOTE. When you click OK, this new threshold is applied to the active trace file.
Event and/or landmarks may appear or disappear from the trace area and event
table depending on the whether the new event lies above or below the threshold.
H Reflectance Threshold. Controls which events are visible in the trace area
and event table. Events with reflectance measurements that are equal to or
greater than the threshold are displayed, even if the event threshold is not
met. You can set the reflectance threshold between --65 and --14 dB.
TARGET1 Trace Analysis, Report Generation and Emulation Tool User Manual
2- 23
Page 46

OTDR Trace Analysis Mode
NOTE. When you click OK, this new threshold is applied to the active trace file.
Event and/or landmarks may appear or disappear from the trace area and event
table depending on the whether the new event lies above or below the threshold.
H Event Loss Limit. Sets the limit (in dB) for values that are highlighted in
the event table. Only those events that exceed the limit are highlighted
(displayed with a red background) in the event table. Set the event loss limit
to highlight events that need attention. The range for event loss is 0.010 dB
to 5.000 dB. In bidirectional or difference mode, this setting will apply to the
derivative measurement.
H Reflectance Limit. Sets the limit (in dB) for values that are highlighted in
the event table. Events with measurements that equal or exceed the limit are
highlighted (displayed with a red background) in the event table. You can set
the reflectance limit to any value from --65 to --14 dB, in steps of 1 dB.
If you see the “OOR” symbol in your data, refer to OOR (Out of Range)
Symbol on page 2--24.
3. From the options provided, choose how you want limit violations highlighted in the event table (if at all). You can select any, all, or none of these
options. Use the numeric keypads to display dialog boxes that allow you to
specify a limit for Event Loss, Reflectance, Slope, and Link Loss.
OOR (Out of Range) Symbol. If an event that exceeds the End of Fiber threshold is
not located before the data becomes too noisy, the software will display “OOR”
(Out of Range) next to the event number in the event table.
If an event that exceeds the End of Fiber threshold is not located before the data
becomes too noisy, the software will display “OOR” (Out of Range) next to the
event number in the event table. If you see OOR in your data, refer to your
OTDR documentation for ways to increase the range; try acquiring the trace
again using the techniques suggested.
If there is a large loss that is the end of the fiber but the software passes over it,
you can decrease the End of Fiber Threshold to mark it. The End of Fiber
threshold may not mark the end of the fiber if the backscatter is too close to the
noise level. This happens sometimes when the pulse width is short or the fiber is
short.
If you want a specific event marked as the end, proceed as follows:
1. Move the cursor to the event you want marked as “End”.
2- 24
2. Select Measurement > Event Loss > Advanced Controls button.
3. Manually adjust the event loss so that it is higher than the End of Fiber
threshold. Refer to the Event Loss Measurements discussion beginning on
page 2--33 for information on how to make the adjustments.
TARGET1 Trace Analysis, Report Generation and Emulation Tool User Manual
Page 47
4. Click the Update Table button.
OTDR Trace Analysis Mode
Saving Current Settings
and Limits
Exporting Data
To save the test settings and limits from the active trace file into a new test
settings and limits file (*.set file), click the Settings button in the test settings
panel, and then click the Save Settings button in the Settings and Limits dialog
box. The Save As dialog box is displayed, with the Settings and Limits Only tab
selected. Use standard Windows techniques to specify a drive, directory, and file
name for the test settings.
You can export acquisition data in the following formats:
H HTML for output to the Web
H XML for output to the Web or for other automated processing
H CSV (Comma Separated Variable) for output to a spreadsheet application
H RTF for output to a text editor
H XY for output to a spreadsheet application
Use these steps to export data:
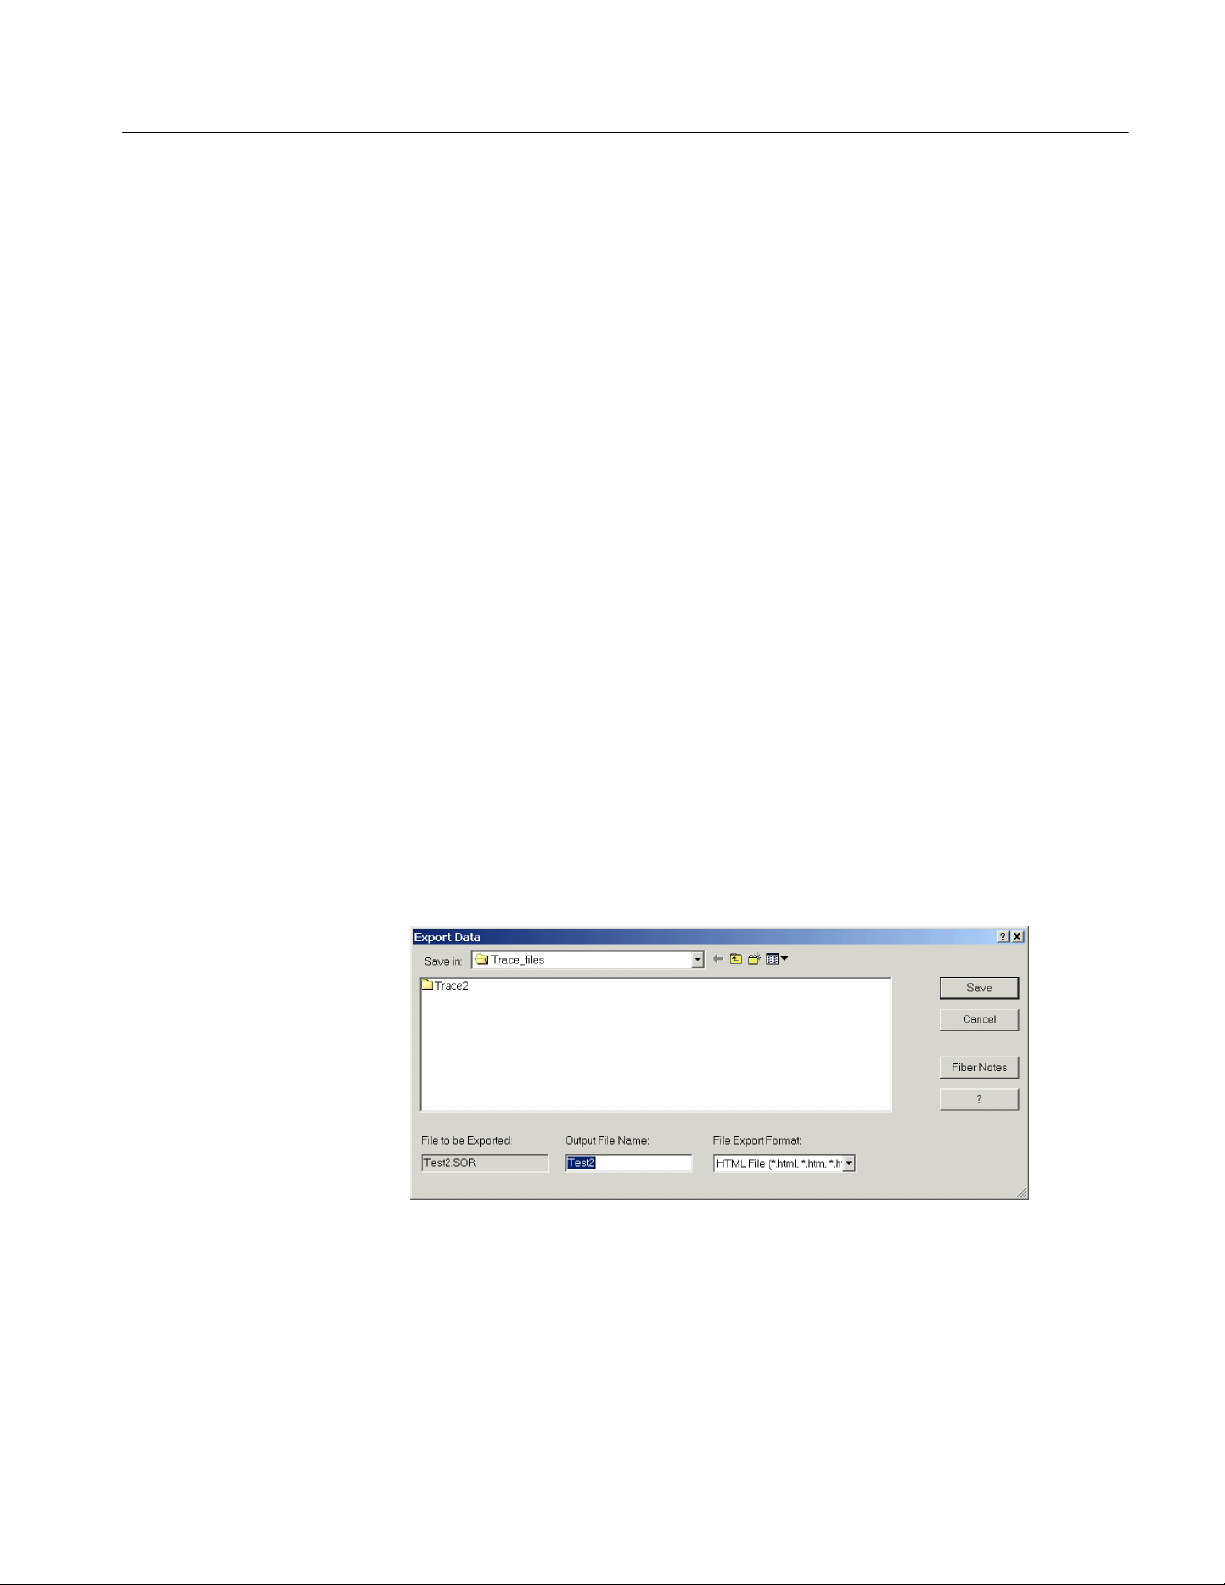
1. Select File > Export.
2. In the Export Data File dialog box (shown in Figure 2--13), navigate to the
drive and directory in which you will save the new file.
Figure 2- 13: Export Data File dialog box
TARGET1 Trace Analysis, Report Generation and Emulation Tool User Manual
2- 25
Page 48

OTDR Trace Analysis Mode
The File to be Exported text box contains the name of the open file to be
exported.
3. Enter a name in the Output File Name text box. This field defaults to the
same name as the data file.
4. Choose the format of the exported file from the File Export Format
drop-down list box.
5. Click the Fiber Notes button to display the Fiber Notes dialog box, which
lets you enter information about the trace file you are exporting. (See Adding
Notes on page 2--26.)
6. Click Save.
Adding Notes
You can add different types of notes to a trace file. Fiber notes describe the
characteristics of the fiber and measurement site. Fiber notes are displayed in
trace summaries and reports. Event notes describe characteristics of specific
events or landmarks. Use the procedures below to add information to your trace
files.
To save any changes you make to either the fiber notes or event/landmark notes,
you must save the trace file.
Adding fiber notes. To add fiber notes to a trace file, select Fiber Notes from the
File menu. The Fiber Notes dialog box is displayed showing the notes (if any)
that were included with the file at the time the measurement was made. The new
notes are saved with the trace file when the file is resaved.
Change or add information to the fiber note fields:
H Cable ID. Identification of the cable containing the fibers being tested.
H Fiber ID. Identification of the tested fiber.
H Cable Code. Telcordia Suggested Optical Cable Code.
H Operator. The name of the operator making the original test, or the name of
the operator who last saved the trace file.
2- 26
H Start Location. A description of the start location for the trace.
H Stop Location. A description of the stop location of the trace.
H Data Flag. For data flags, the following codes are recommended:
H BC -- as-built condition
H RC -- as-repaired condition
H OT -- other (describe the condition in the Comments field)
TARGET1 Trace Analysis, Report Generation and Emulation Tool User Manual
Page 49

OTDR Trace Analysis Mode
H Comments. Use the comments field to note cable or fiber design or link
issues; for instance, describe how the link is used or record any construction
or repair issues.
NOTE. Some of these fields may not be supported in file formats other than .SOR.
In CFF files, the unsupported fields will be saved as text notes.
Adding event and landmark notes. To add event and landmark notes to a trace file,
select Events > Event/Landmark Notes. The Event/Landmark Notes dialog
box is displayed showing the notes (if any) that were included with the file at the
time the measurement was made. For event notes, the only field in this dialog
box that you can edit is the Comments field. You can edit all the fields for
landmark notes. Landmarks are saved only in .SOR format.
Displaying Distance
Markers
Displaying Event Markers
There are two distance cursors, A and B, in Trace Analysis mode.
Make distance measurements by positioning the two cursors anywhere in the
trace area (refer to Cursors on page 2--5). The distance between the position of
the A cursor and the B cursor is displayed at the top of the trace display area.
You can set the measurement units to kilometers (km), meters (m), kilofeet (kft),
feet (ft) or miles using the Settings > Distance Units submenu (refer to
Changing Display Units on page 2--19). Kilofeet (kft) are thousands of feet.
Events indicate a change in fiber characteristics that exceeds a preset threshold.
The OTDR or the operator can add events during testing. You can also add
events and apply a template of events and landmarks to test files.
Displaying event markers in the trace area. To show or hide all event markers in
the trace area, select View > Trace Display Options. In the Waveform Display
Options dialog box, select or deselect the Event Markers option to show or hide
all event markers. Refer to page 2--5 for more information about the trace
display options.
Displaying event markers by changing the test settings. When you change the
threshold values in the Test Settings and Limits dialog box, some of the events
may disappear and new events may appear in both the event table and the trace
area. Refer to Changing Test Settings and Limits on page 2--20.
TARGET1 Trace Analysis, Report Generation and Emulation Tool User Manual
2- 27
Page 50
OTDR Trace Analysis Mode
Adding, Moving, and
Deleting Events
Use the steps described in this section to add, move, and delete events from the
active trace file.
NOTE. When adding, moving, or deleting events, if an event is already selected
or the active cursor is positioned where you want it, you can select Add, Move,
or Delete Events from the Events menu, and then click the Add, Move, or Delete
Event button in the dialog box that is displayed.
Adding events. Use these steps to manually add an event:
1. Place the active cursor where you would like to add an event. You can zoom
in to better see the location.
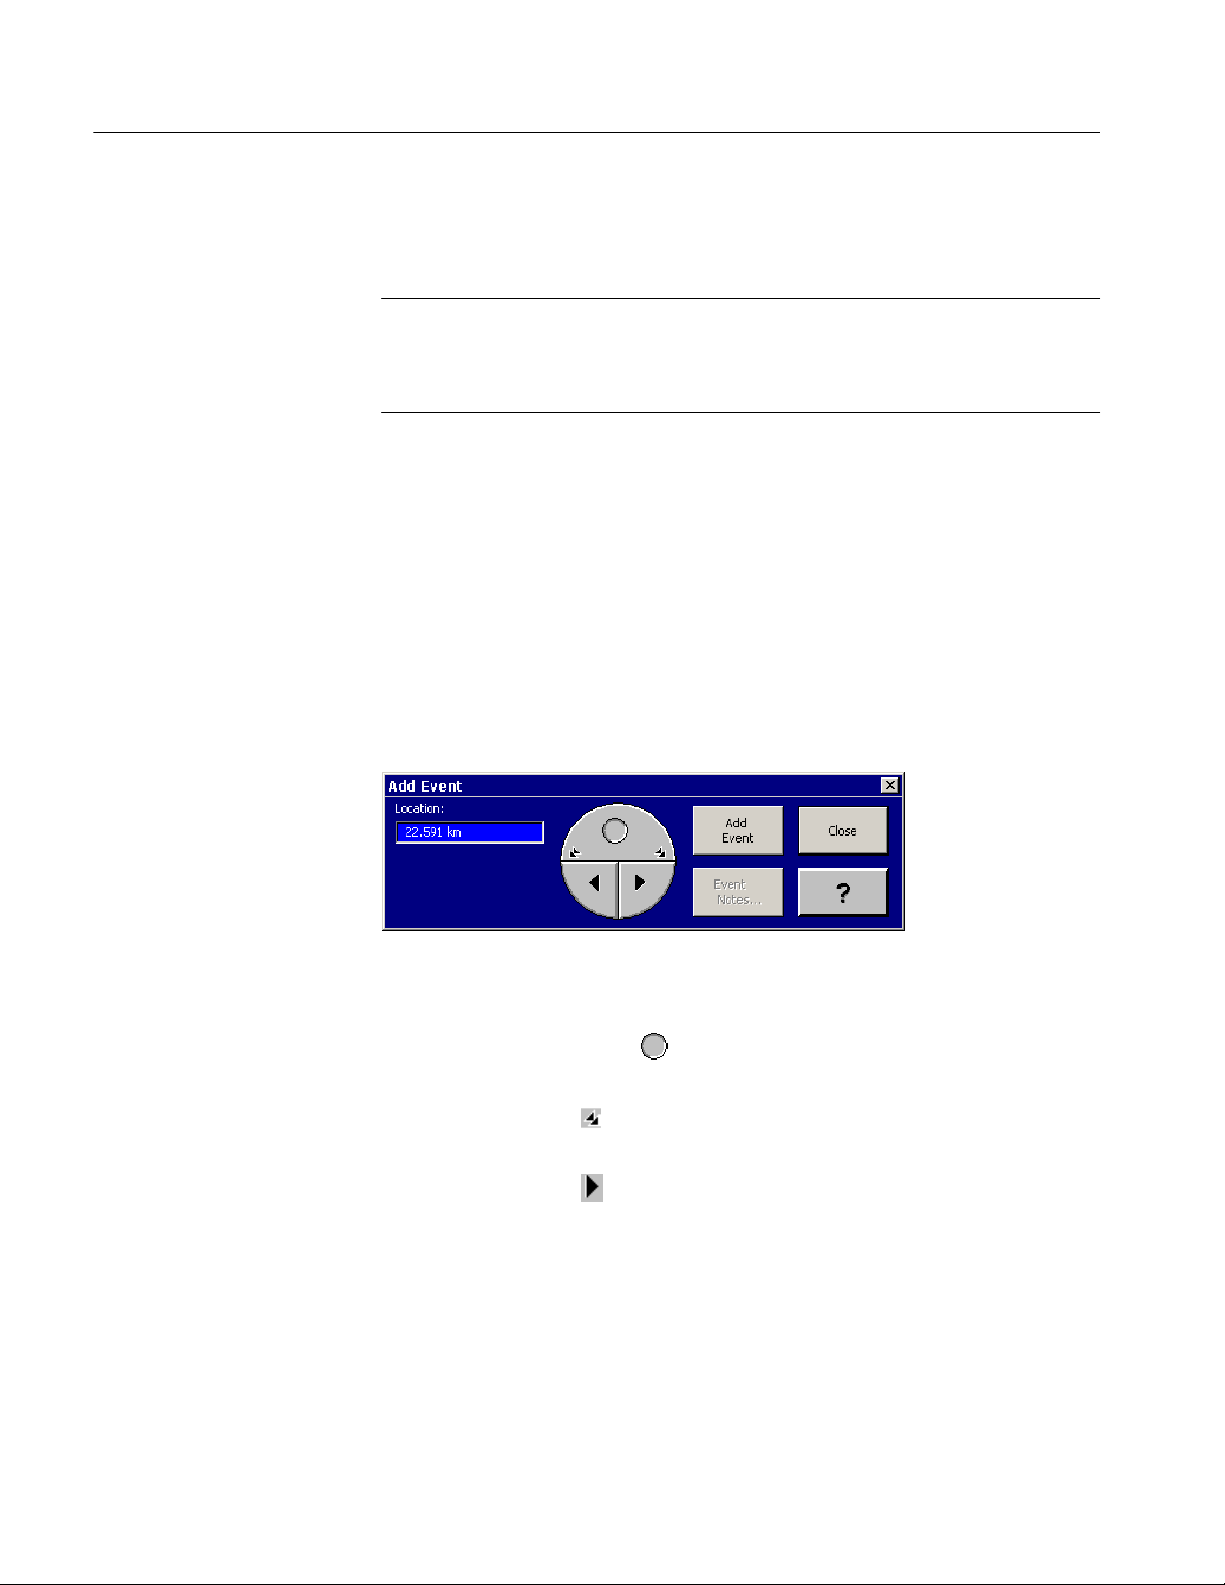
2. Select Add Events from the Events menu.
3. You can adjust the cursor location using the controls in the Add Event dialog
box (see Figure 2--14). The position showing in the Location text area is the
location of the active cursor.
2- 28
Figure 2- 14: Add Event dialog box controls
H Click and drag this icon,
and right in the trace area.
H Click these icons,
across the trace area.
H Click these icons,
across the trace area.
4. After you have positioned the cursor where you want to add an event, click
Add Event.
5. Add an event note if needed, and then click Close.
If the cursor is on an area of the trace that lies below the current event threshold,
you will see a message box saying the event will not be displayed. And when
TARGET1 Trace Analysis, Report Generation and Emulation Tool User Manual
, to move the cursor in large increments left and right
, to move the cursor in small increments left and right
, to move the cursor smoothly and quickly left
Page 51
OTDR Trace Analysis Mode
you acknowledge the message, the event that was showing in the event table is
removed.
After successfully adding an event to the trace area and event table, existing
events are renumbered from left to right, and the added event appears in the
event table with an asterisk, indicating that the event was manually added.
After adding an event, when you save a trace file and reopen it, the added event
is displayed, provided the file is opened with the same test settings and limits.
Moving events. Use these steps to move events from one position to another in
the trace file.
1. In the trace area or the event table, select an event to move.
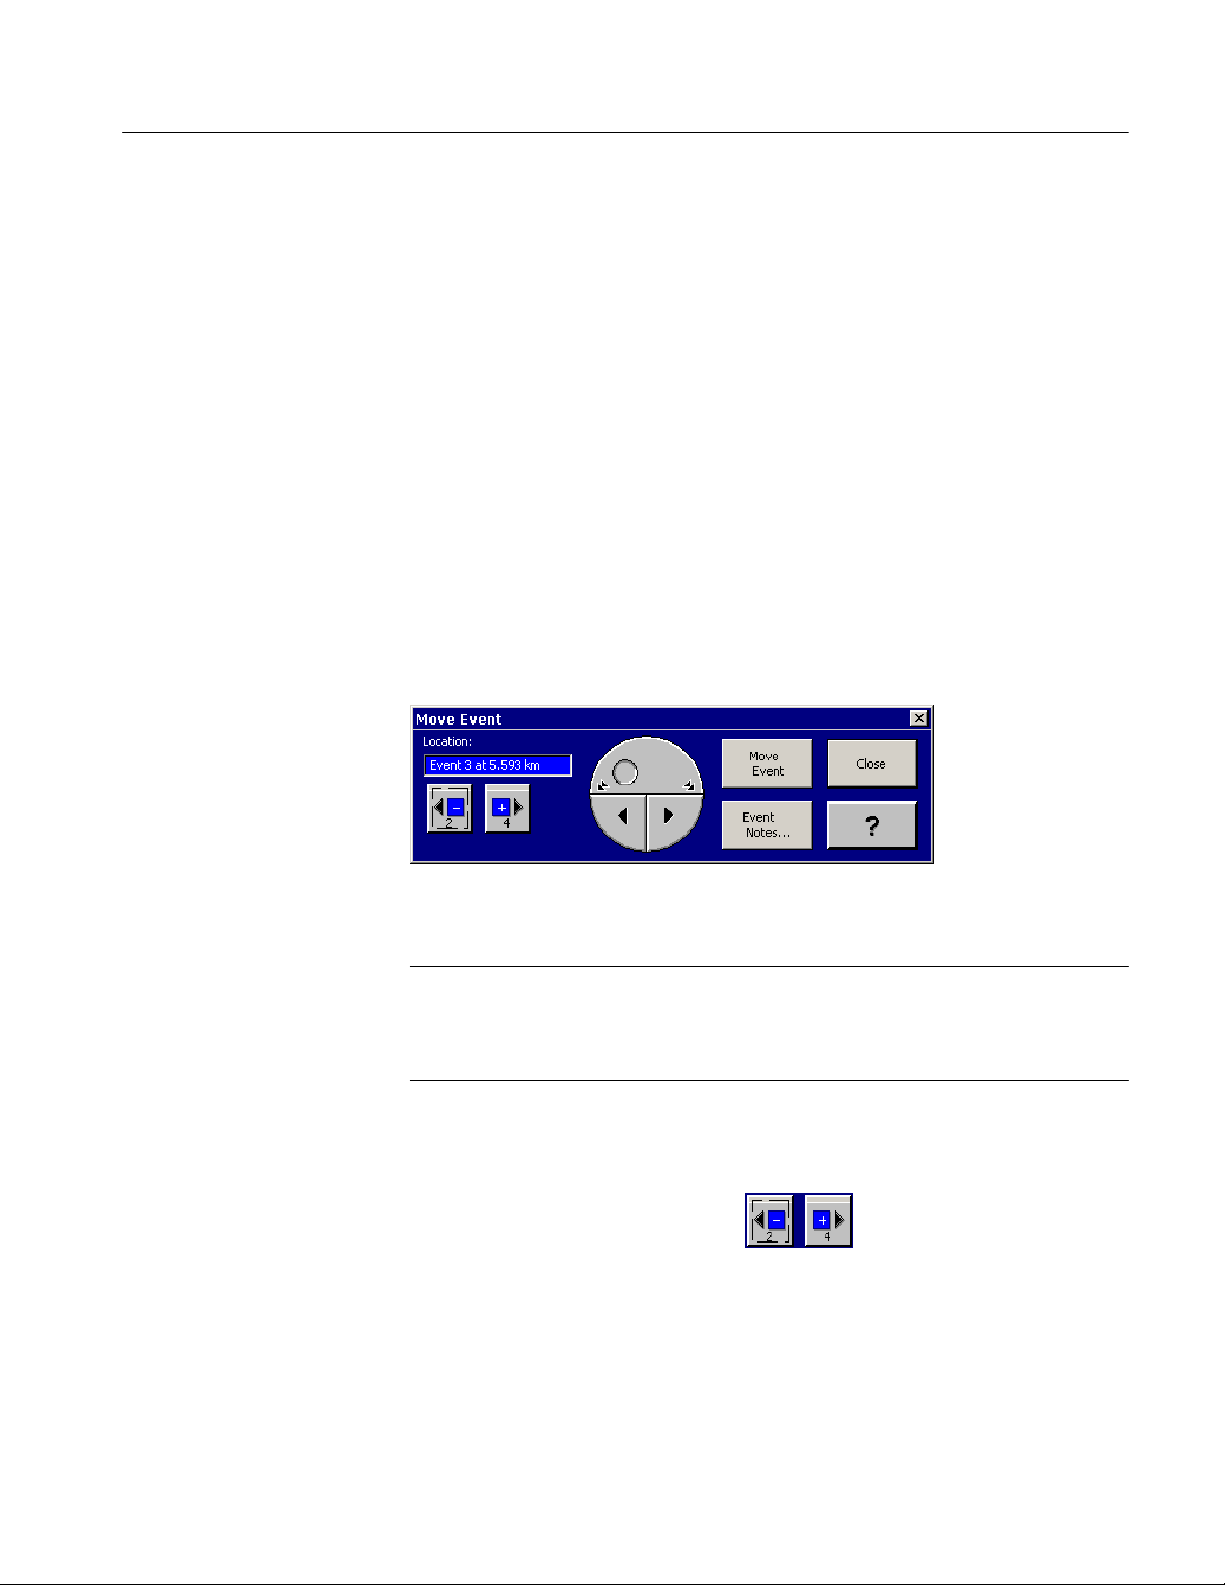
2. Select Move Events from the Events menu. The Move Events dialog box is
displayed with the selected event showing in the Location text box. See
Figure 2--15.
Figure 2- 15: Move Event dialog box controls
NOTE. As you move the cursor, the location in the Location text box updates, but
the event number you chose before you started moving the cursor remains the
same. This indicates which event is being moved, and where it is being moved to,
in the trace file.
3. Use the Move Event dialog box controls to move the event right or left to a
new location in the trace area. You can also type in a new location (distance)
for the event and click Move Event to move an event to another location.
4. Click the previous or next button
the previous or next event. Once you move the active cursor with these
controls and select a new event, the new event will be the event marker
moved.
5. After you have positioned the cursor where you want to move the event,
click Move Event.
to move the active cursor to
TARGET1 Trace Analysis, Report Generation and Emulation Tool User Manual
2- 29
Page 52

OTDR Trace Analysis Mode
6. Add an event note if needed, and then click Close.
After successfully moving an event to the trace area and event table, event
numbers are automatically updated in the trace area and event table.
Deleting events. To delete an event:
1. Select an event in the trace area or the event table that you want to remove
from the trace file.
2. Select Delete Events from the Events menu.
3. In the Delete Events dialog box, click Delete Event, and then close the
dialog box by clicking Close.
After an event is deleted from the trace area and event table, existing events are
renumbered.
Adding, Moving, and
Deleting Landmarks
You can use landmarks to help you remember how the trace relates to real
locations on the fiber such as a bridge. You can mark places where a failure
might occur in the future. Use the following steps to add, move, and delete
landmarks.
Adding landmarks. To add a landmark in the trace:
1. Position the active cursor where you want to add a landmark. You can zoom
in to better see the location.
2. Select Events > Add Landmark.
3. Use the cursor buttons to fine tune the position of the cursor. The location of
the cursor appears in the Location text box.
4. Click Add Landmark toaddalandmarkatthelocationshowninthe
Location text box.
5. Click Landmark Notes to describe the landmark.
Moving landmarks. To move a landmark in the trace:
1. Select Move Landmark from the events menu or click the Move Landmark
icon in the tool bar. Either selection displays the Move Landmark dialog
window. The active distance cursor jumps to the nearest landmark in the
trace.
2- 30
2. The distance from the OTDR to the landmark number in the trace is shown
in the Move Landmark window. If the selected landmark is the landmark
TARGET1 Trace Analysis, Report Generation and Emulation Tool User Manual
Page 53

OTDR Trace Analysis Mode
you want to move, use the position controls in the Move Landmark
window to select the new position.
3. When you have set the new position, click the Move Landmark button.
4. The landmark is moved and renumbered as necessary.
Deleting landmarks. To delete a landmark from the trace and event table:
1. Select Events > Delete Landmark or click the Delete Landmark icon in the
tool bar. The Delete Landmark dialog window appears. The active distance
cursor jumps to the nearest landmark marker in the trace.
2. The distance from the OTDR to the landmark number in the trace is shown
in the Landmark window. If the selected landmark is the landmark you want
to remove, click the Delete Landmark button. The selected landmark is
deleted, and the distance cursor jumps to the next nearest landmark in the
trace (if present).
3. Use the -- and + event position selection buttons to select the next landmark
to delete. The events and landmarks that follow each deleted landmark are
renumbered.
Printing Trace Analysis
Views
4. When finished deleting landmarks, click the Close button.
Deleting all landmarks. To remove all landmarks (and the notes associated with
them) from the trace file, select Events > Delete All Landmarks.
The Page Setup and Print Preview options are similar to most other Windows
applications. The Print dialog box includes options described below that allow
you to limit or include as much or as little information as you want.
Fields to Print. C hoose which parts of the trace analysis view you want to print:
Trace and Table, Trace, or Table.
Table Options. If you are printing the Event Table, choose whether to print all of
the columns or only the first five. This option is not available if you are printing
the Trace only.
Measurement Options. If you are printing a difference or bidirectional measurement, you can also choose to print either all of the event tables that went into
making up the measurement or only the measurement event table (bidirectional
measurement event table or the difference average event table).
TARGET1 Trace Analysis, Report Generation and Emulation Tool User Manual
2- 31
Page 54

OTDR Trace Analysis Mode
Notes. Select this option to include the Fiber notes in the printed version of the
trace data.
OTDR Trace Analysis Mode Measurements
The TARGET1 application emulates the operation of the NetTek Analyzer
OTDR for the analysis of measurement data. Previously acquired and saved
measurement data can be displayed and analyzed in much the same way that
measurements are performed by the NetT ek Analyzer OTDR.
You can make distance measurements by moving the cursors (see page 2--32) or
choose one of the following measurements from the measurement menu.
These measurements are taken on one trace:
H Event Loss: Measures loss at a point on a fiber. See page 2--33.
H Two -- p oint: Measures the loss, slope, and distance between two points on a
fiber. See page 2--37.
H Reflectance: Measures the loss due to light reflected by a particular fiber
H ORL (Optical Return Loss): Measures the reflected light from a section of
These measurements are taken on two traces:
H Bidirectional Averages: Averages the events of two traces taken from
H Difference: Subtracts one trace from another. Use this measurement to
In addition to the automatic measurements performed by the TARGET1
application, you can manually adjust these measurements.
Distance Measurements
Make distance measurements by positioning a distance cursor at the point of
interest. The distance from the front panel to the active distance cursor is
displayed at the top of the cursor. The distance between the position of the A
cursor and the B cursor is displayed at the top of the trace display area.
feature, such as a connector or splice. See page 2--39.
fiber or from the whole fiber. See page 2--42.
opposite ends of the same fiber. Some events may appear differently
depending on which end of the fiber you test. Use this measurement for a
more accurate representation of the fiber than either trace alone can give. See
page 2--43.
compare two similar trace files. See page 2--45.
2- 32
Refer to page 2--5 for information about positioning the cursors.
TARGET1 Trace Analysis, Report Generation and Emulation Tool User Manual
Page 55

Event Loss Measurements
Event Loss measures the loss at a point on a fiber. Use it to measure the loss
caused by a particular fiber feature such as a connector or splice. To measure
event loss:
1. Place a cursor on the event or at a point of interest on the trace. Refer to
2. Click the Event Loss icon on the measurement tool bar or select Measure-
OTDR Trace Analysis Mode
page 2--5 for information about positioning the cursors.
ments > Event Loss.
The Event Loss Measurement dialog box shown in Figure 2--16 appears. The
event loss (or gain) is displayed in a cursor readout at the top of the trace
area.
Figure 2- 16: Event Loss Measurement dialog box
3. If you want to manually adjust the measurement, click Show Advanced
Controls to access the cursor positioning controls. See Figure 2--17.
Figure 2- 17: Advanced controls for Event Loss Measurement
For Event Loss measurements, there are two horizontal loss cursors, matched to
the trace on either side of the active vertical cursor. The loss cursors remain
attached to the vertical cursor and move horizontally as the vertical cursor is
repositioned on the trace.
TARGET1 Trace Analysis, Report Generation and Emulation Tool User Manual
2- 33
Page 56

OTDR Trace Analysis Mode
Left loss cursor
Right loss cursor
Figure 2- 18: Manual event loss cursor around active cursor
How Loss Cursors are
Used
Measurements are calculated by fitting loss cursors to trace data points. The
lengths of the loss cursors indicate the sections of the trace used in the measurement. The left and right loss cursors for the automatic event-loss measurement
extend to the next event to the left and to the right of the vertical cursor position.
The loss cursors extend from the vertical cursor position either to the edges of
the zoom window or the next event marker, if the event is in the zoomed area.
2- 34
When making event-loss measurements, you can select the trace data used in the
measurements by dragging the handle at the end of the loss cursors. You can
include or exclude specific fiber features from your measurements this way.
Make manual adjustments to event-loss measurements by adjusting the slopes
and vertical positions of the left and right loss cursors. Once the loss cursors are
adjusted manually, they maintain the same slopes and vertical positions when
you move the distance cursor.
Manual adjustments are retained until you click the Reset buttoninthe
Advanced Controls dialog box.
If you exit Event Loss mode after making manual adjustments, the loss cursor
position adjustments are retained and displayed when you re-enter Event Loss
mode. In this case, select the Event Loss Advanced controls again and click
Reset to clear the user-adjusted measurements.
After making the measurement, you can update the table to reflect the measured
value you obtained. Click the Update Table button in the Advanced Controls
window to enter the new measurement value for the event. An asterisk precedes
TARGET1 Trace Analysis, Report Generation and Emulation Tool User Manual
Page 57

OTDR Trace Analysis Mode
the altered measurement to show that it has been changed from the original test
data. To save new values to the event table, you must save the file. Use
File > Save to write over the original file with the new data. If you want to keep
the original data as well, use File > Save As to give the file you save a different
name.
Positioning Loss Cursors
Refer to Figure 2--19 for information on using Advanced Controls to manually
adjust loss cursors.
Manual adjustments you make to loss cursors are retained until you restart
automatic measurements by clicking the Reset button. Then another automatic
measurement is made using the current distance-cursor locations. The manual
adjustments to the cursor are retained as long as the measurement is open.
Switching to another measurement and then back again does not reset the cursor
position. Close the measurement to reset the cursor to automatic the next time
the measurement is started.
Adjust slope up in
Move cursor up
in increments
Selects cursor
to adjust
Moves cursor
continuously
up or down
Adjust slope up in
small increments
large increments
Adjust slope
continuous ly
up or down
Move cursor
down in
increments
Adjust slope down in
small increments
Figure 2- 19: Loss cursor position controls
Moving the loss cursor. Grab the end of either loss cursor by positioning the
mouse cursor on the end of the loss cursor and pressing and holding the left
mouse button. Drag the end to rotate the cursor around the point where it touches
the distance cursor. This allows you to match the loss cursor to the slope of the
trace. It does not affect event-loss measurement values.
TARGET1 Trace Analysis, Report Generation and Emulation Tool User Manual
Adjust slope down in
large increments
2- 35
Page 58

OTDR Trace Analysis Mode
Elongating or Shortening the loss cursor. To elongate or shorten a loss cursor for
easier matching to the trace slope, grab the end of the loss cursor with the mouse
cursor and drag it along the trace.
Moving the loss cursors vertically. To move a loss cursor up and down, use the
Advance Cursor controls or use the shift key and the mouse. You can position
the cursor up and down to match it to the trace. The horizontal position of the
loss cursor is not affected.
2- 36
TARGET1 Trace Analysis, Report Generation and Emulation Tool User Manual
Page 59

Two-Point Measurements
Two-point measurements measure the loss, slope, and distance between two
points on a fiber. You can use Two-Point measurements to measure end-to-end
distance and loss, for example. Click the Two Point button on the measurement
tool bar or select Measurements > Two-point.
Look at the loss between two points on the trace:
1. Zoom in on the area of interest on the trace.
2. Select Measurements > Two Point....
OTDR Trace Analysis Mode
The Two-point measurement controls shown in Figure 2--20 appear at the
bottom of the screen.
Figure 2- 20: Two Point Measurement dialog box
3. Place a cursor to the left and right of the area of interest on the trace. Be sure
both cursors are on backscatter regions of the trace. (Refer to page 2--5 for
information about positioning the cursors.)
4. Look at the top line of the trace region for the readouts of distance, two point
loss, and slope between the two cursors.
The distance from the front panel to the cursor is displayed at the top of the
cursor. New two-point measurements are made at the new cursor positions.
Continuous readout of the A-B distance, Two-point loss, and loss slope are
provided as either cursor is positioned.
5. If you want to manually adjust the measurement, click Show Advanced
Controls to access the cursor positioning controls and slope calculations
choices. See Figure 2--21.
You can choose either of two types of slope calculations:
H Two-Point Slope. In two-point slope calculations, the two-point loss is
divided by the two-point distance, using the data point at each intersection between the loss cursor and the trace. Select the two-point type of
slope calculation for most two-point measurements.
TARGET1 Trace Analysis, Report Generation and Emulation Tool User Manual
2- 37
Page 60

OTDR Trace Analysis Mode
H LSA Slope (least-squares average). In LSA slope calculations, the data
points on the trace between the distance cursors are used to determine
the best-fitting straight line using the least-squares average algorithm.
Use the LSA slope calculation method for measuring fiber loss on
featureless sections of backscatter.
Figure 2- 21: Two Point Measurement advanced controls
Two distance cursors and a single loss cursor define two-point measurements.
You can move the distance cursors to make two-point measurements at various
locations along the trace. New automatic two-point measurements are made at
each new position of the distance cursors, if you have not made any manual
measurements.
H Loss cursor. The loss cursor is located between the A and B distance cursors,
positioned at the intersection of each distance cursor and the trace. The loss
cursor moves horizontally as the distance cursors are moved, and moves
vertically automatically with the slope of the trace.
H Two-point distance. The two-point distance is the distance between the
distance cursors. The two-point loss is the difference between the decibel
level of the trace at the right loss cursor and the decibel level at the left
cursor, regardless of which distance cursor is active. The numeric loss and
distance values are displayed in the cursor readouts across the top of the
display area.
2- 38
TARGET1 Trace Analysis, Report Generation and Emulation Tool User Manual
Page 61
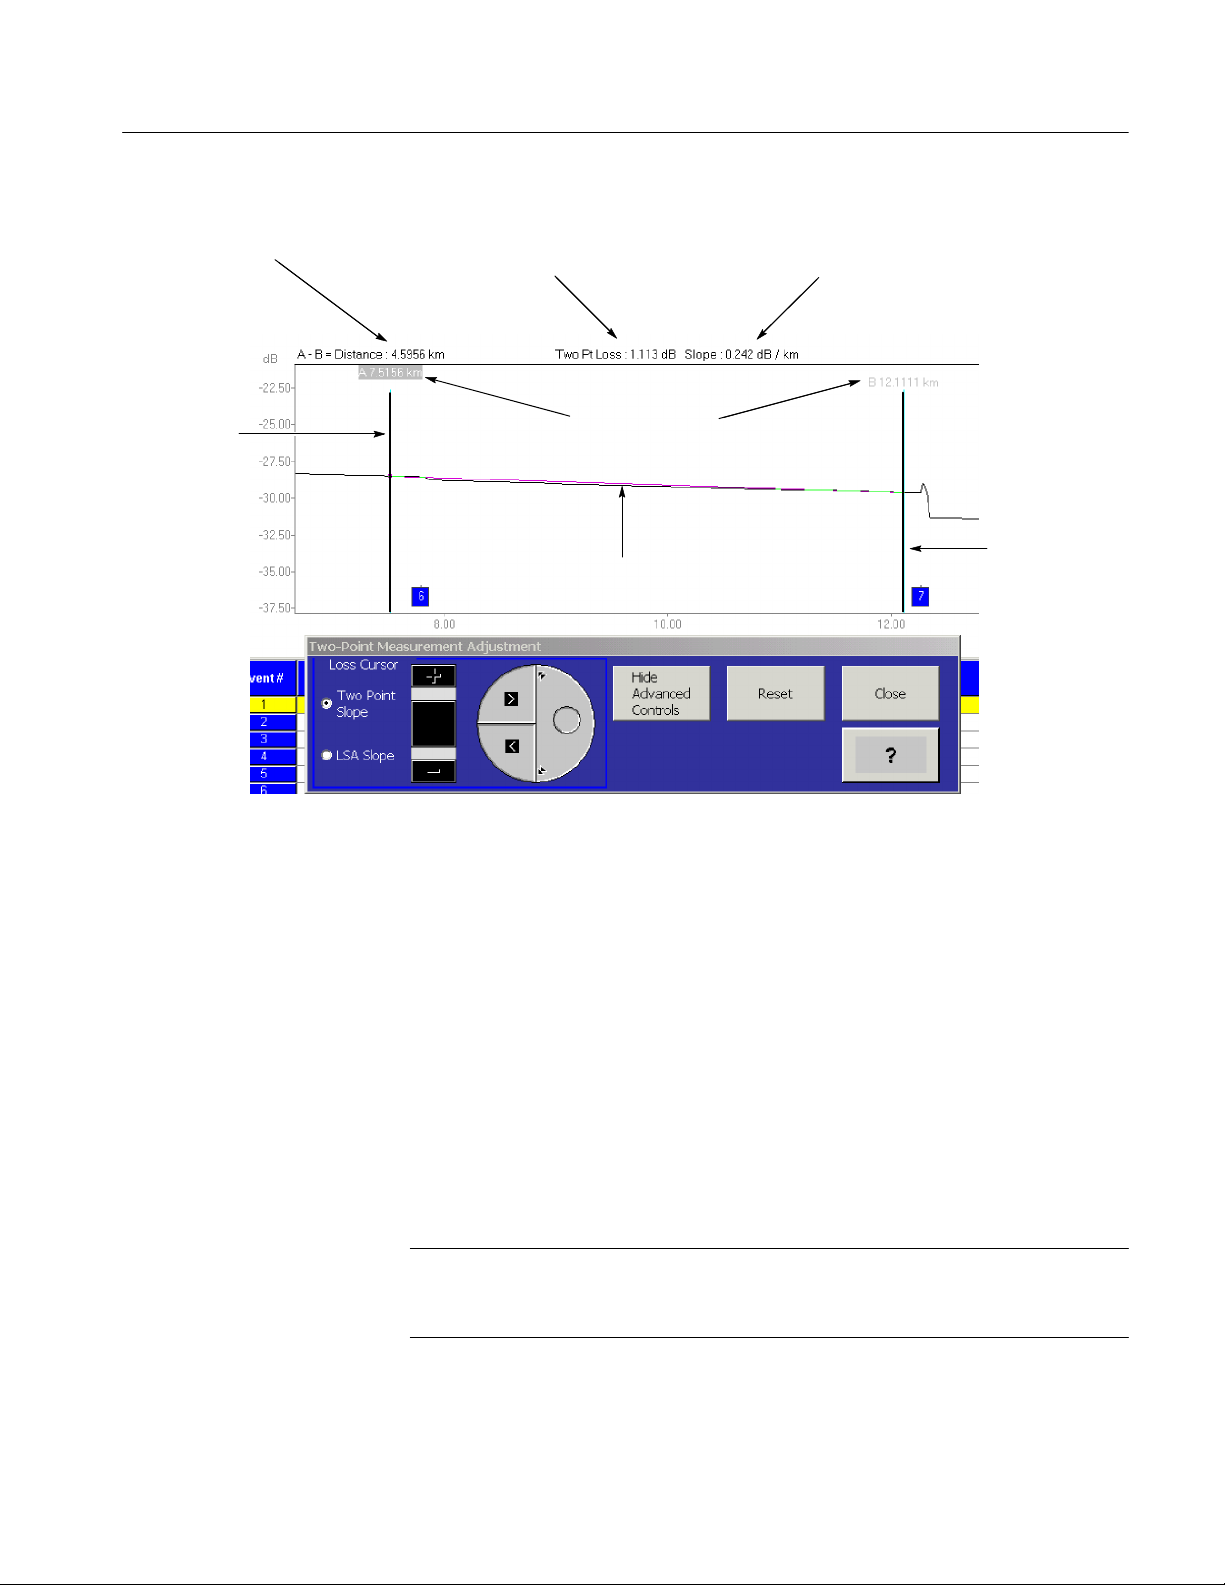
OTDR Trace Analysis Mode
Distance
between cursors
A cursor
Two-point loss
readout
Two-point slope
readout
Distance from front
panel to cursor
B cursor
Loss cursor
Figure 2- 22: Two-point measurement display
Refer to Positioning Loss Cursors on page 2--35 for more information.
To manually adjust two-point measurements, adjust the slope and vertical
position of the loss cursor using the Advanced Controls shown in Figure 2--19.
Once the loss cursors are adjusted manually, they maintain the same two-point
loss (or gain) when you move the distance cursors, and the amplitude of the
point where the loss cursor intersects the distance cursor remains constant as the
distance cursor moves. The loss per distance unit is recalculated at each new
distance-cursor position.
Reflectance Measurements
NOTE. Before performing reflectance measurements, check that the backscatter
coefficient in the Test Settings Tab is set to the correct value for the fiber being
tested. Refer to Backscatter Coefficient on page 2-- 22.
Using reflectance measurements, you can measure the transmission loss due to
reflectance at a point on a fiber, such as at a connector or splice.
TARGET1 Trace Analysis, Report Generation and Emulation Tool User Manual
2- 39
Page 62

OTDR Trace Analysis Mode
To measure reflectance:
1. Place a cursor at the point of interest on the trace. The reflectance from that
point appears as a readout at the top of the trace region.
2. Select Measurement > Reflectance.
The reflectance value is displayed at the top of the trace display area.
3. If you want to manually adjust the measurement, click Show Advanced
Controls to access the cursor positioning controls. See Figure 2--23.
Figure 2- 23: Reflectance measurement advanced controls
In Reflectance mode there are two loss cursors, matched to the trace on
either side of the active distance cursor. Make manual adjustments to
reflectance measurements by adjusting the slopes and vertical positions of
the loss cursors. Refer to Positioning Loss Cursors on page 2--35 for more
information.
4. Place the left loss cursor on the backscatter before the reflection being
measured.
The left loss cursor is fitted to a segment of trace data to establish the
backscatter level before the reflection being measured. This cursor extends
from the distance cursor to the left edge of the expansion window when the
trace is zoomed in.
5. Place the right loss cursor at the top of the reflection. See Figure 2--24.
The right loss cursor is used to mark the top of the reflection being
measured, and extends slightly more than a pulse width to the right of the
distance cursor .
On-screen Reflectance Loss measurements may vary from the Event Table on
some traces. Table measurements use a more accurate area measurement for
reflectance.
2- 40
TARGET1 Trace Analysis, Report Generation and Emulation Tool User Manual
Page 63

OTDR Trace Analysis Mode
NOTE. TFP2/A FS Series modules include a masking capability. The masking
setting used for acquisition is shown in the Mod Info field on the parameter tool
bar. Reflectance measurements on a reflective event yield the most accurate
results on a trace that was acquired with masking off; however, you can perform
reflectance measurements on reflections that were masked using the AccuMask
masking type. Reflectance measurements on reflections that were masked using
the QuickMask masking type are not accurate.
Once the loss cursors are adjusted manually, they maintain the same slopes and
vertical positions when you move the distance cursor, and reflectance is
calculated at each new distance-cursor position.
Figure 2- 24: Manual Reflectance measurement
TARGET1 Trace Analysis, Report Generation and Emulation Tool User Manual
2- 41
Page 64

OTDR Trace Analysis Mode
ORL Measurements
NOTE. Before performing ORL measurements, check that the backscatter
coefficient in the Test Settings Tab is set to the correct value for the fiber being
tested. Refer to Backscatter Coefficient on page 2-- 22. If a trace contains
multiple fiber types, set the backscatter coefficient to the value for the fiber
section under the left cursor.
Optical Return Loss measures the transmission energy reflected from a section of
fiber or from the whole fiber. This measurement tells you the portion of the light
entering from the left cursor that will be reflected back by the fiber and events
between the cursors. ORL measurements are made on the fiber and events
between the cursors.
1. Place the cursors to the left and right of the area of interest on the trace. Do
not place the left cursor on an event; place it on a section of normal
backscatter.
Figure 2- 25: ORL measurement
2. Select Measurements > ORL.
The ORL readout appears at the top of the trace region. See Figure 2--25.
The ORL value is recalculated at each new section between cursors as you
move a cursor. Move the distance cursors to exclude features from the ORL
measurement, such as noise.
2- 42
TARGET1 Trace Analysis, Report Generation and Emulation Tool User Manual
Page 65

NOTE. TFP2/A FS Series optical modules have masking capability. For traces
acquired using one of these modules, the masking setting that was used for
acquisition is shown in the Mod Info field on the parameter tool bar.
ORL measurements yield the most accurate results on a trace that was acquired
with masking off; however, you can perform ORL measurements on r eflections
that were masked using the AccuMask masking type. ORL measurements on
reflections that were masked using the QuickMask masking type are not
accurate.
Bidirectional Measurements
The bidirectional event-averaging feature allows you to use measurement files
obtained from both ends of a fiber link, to average the event losses for each event
on the link. To perform bidirectional event averaging on a fiber, you must have
two trace files that represent the same fiber link, acquired from each end of the
fiber. To average events on these traces together, follow these steps:
OTDR Trace Analysis Mode
1. Open the first trace file into tab A, and the second trace file into tab B.
(Refer to OpenaTraceFileon page 2--1.)
2. Select Measurements > Bidirectional A verages. This selection turns on
dual trace (if it is not already on), displays a third tab called Averages,
displays a mirror image of the second tab, and aligns the traces (see
Figure 2--26). This view allows you to see the matching events on each trace,
and makes it easier to check that each event has a matching event on the
other trace.
3. Make sure the beginning and end of the fiber are marked with event markers
on both traces and both are the same length. If they are not the same length,
a length mismatch error message appears.
4. Remove any markers that appear past the end of either trace.
The bidirectional averaged event table contains each event on the fiber, the
distance to the event as it appears on each trace, the event loss of the event as
measured on each trace, and the average of the event losses.
TARGET1 Trace Analysis, Report Generation and Emulation Tool User Manual
2- 43
Page 66

OTDR Trace Analysis Mode
Figure 2- 26: Bidirectional average trace display
2- 44
TARGET1 Trace Analysis, Report Generation and Emulation Tool User Manual
Page 67

Difference Measurements
Use this measurement to compare two similar trace files, such as traces taken on
two fibers in the same cable, or traces from the same fiber taken at different
times, to evaluate for changes over time.
The Difference function subtracts one trace from another and displays the results
as a third trace. This measurement generates a third tab with a trace and event
table that show the difference between the two trace files. The differences in the
event loss values show you either the changes in the fiber between the acquisitions or the differences between two adjacent fibers.
You must have two files displayed to create difference data.
1. Open a trace file in tab A.
2. Open a second trace file in tab B.
3. Select Measurement > Difference. (If you have not opened a second trace
OTDR Trace Analysis Mode
file, a dialog box asks you to do so.)
Dual-trace mode is automatically turned on. The two traces and the
difference trace are all displayed in the third tab.
The tabs above the trace region are labeled with the file name of the trace
data. Select the tab of the trace data you want to be active. The event markers
of the active trace are displayed in color; the event markers of the inactive
trace are gray. The event table shows the events of the active trace data.
4. Select the third tab (Difference) to display the difference data in the Event
table.
You cannot save the third tab as a file, but you can regenerate the data at any
time from saved trace files.
Select Measurement > No Third Tab or Dual Trace > Dual Trace Off to turn
off the difference trace display.
TARGET1 Trace Analysis, Report Generation and Emulation Tool User Manual
2- 45
Page 68
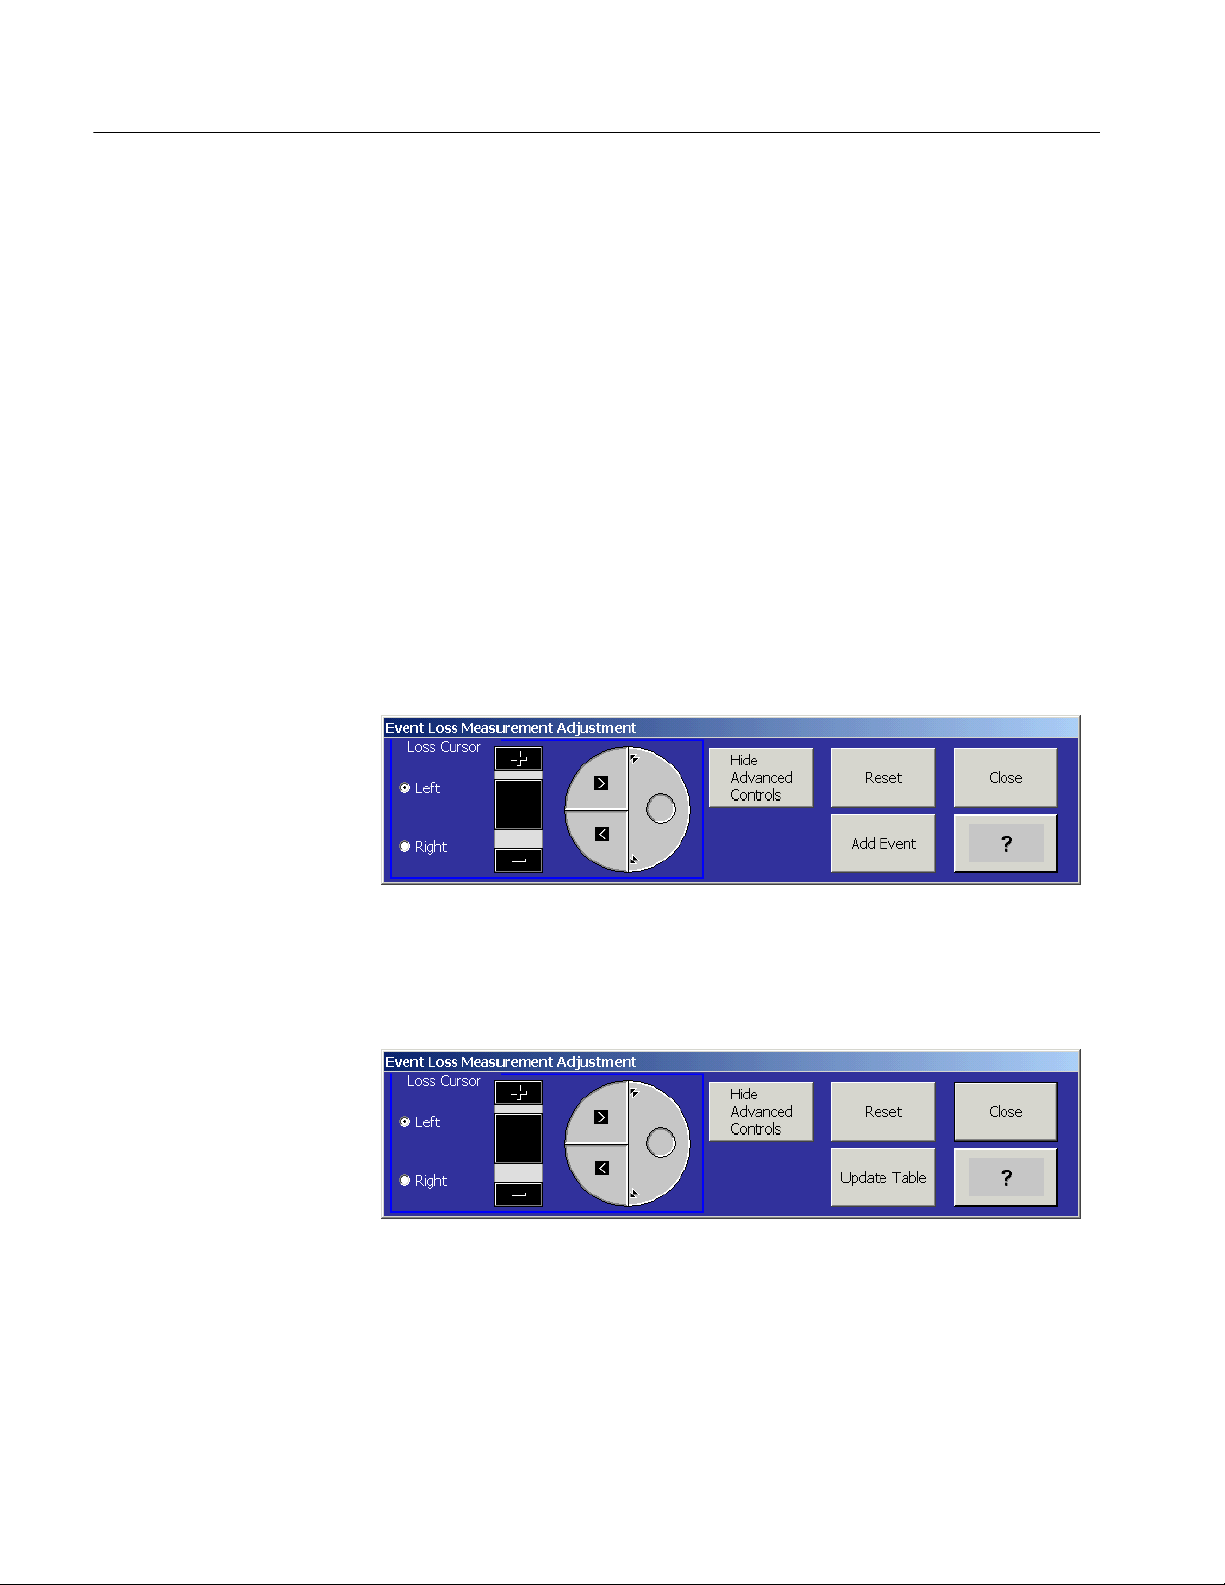
OTDR Trace Analysis Mode
Editing the Event Table
Measurements are made automatically at the locations of the event markers and
entered into the event table. You can also make manually adjusted event-loss and
reflectance measurements on the trace display and enter these into the event
table, replacing the existing measurements.
To edit the event table:
1. On the trace display, move the distance cursor to an event marker by clicking
that marker.
2. Make either an event-loss or a reflectance measurement (by selecting Event
Loss or Reflectance from the Measurement menu).
3. You can adjust measurements manually. Adjust the zoom box and zoom in to
better see the event area. Click the Advanced Controls button to manually
adjust the left and right loss cursors using the controls shown below. Use
Reset to go back to the automatic cursor settings.
2- 46
If an event is selected, you can click the Update Table button, shown below,
to update the event table with your manually adjusted loss data. See the
online help for more information.
The event-marking fields below the trace display show the event-loss and
reflectance measurements from the event table. The adjusted data is marked
with an asterisk to indicate that it was entered manually.
TARGET1 Trace Analysis, Report Generation and Emulation Tool User Manual
Page 69

OTDR Trace Analysis Mode
NOTE. For automatically placed event markers, if a new event-loss or reflectance
measurement is below the current event-loss or reflectance threshold, the event is
hidden from the trace display and from the event table.
To save changes to the event table, you must save the trace file.
For information on editing event notes, refer to page 2--27.
After entering manually adjusted measurements into an event table, you should
save any changes you make into a different file using the Save As dialog box.
There may be occasions when you want to restore the original measurement
values. To do this, reload the original trace file.
TARGET1 Trace Analysis, Report Generation and Emulation Tool User Manual
2- 47
Page 70

OTDR Trace Analysis Mode
2- 48
TARGET1 Trace Analysis, Report Generation and Emulation Tool User Manual
Page 71

OTDR Report Generator Mode
The OTDR Report Generator provides a means of compiling the results of
multiple fiber tests into a comprehensive report format. You can import and
analyze certain file types from other manufacturers’ optical test equipment. You
can use the Report Wizard feature to step you through the process of generating
reports.
Functional Overview
Figure 2--27 shows the main screen of the Report Generator with a report file
open. This view is of both the trace and the table (View > Split Trace and Table).
You can select View > Event Table Only to hide the trace, Report Summary, and
Cable Information. This gives the maximum screen space for viewing the table.
Table 2--6 on page 2--53 lists the functions of each of the Report Generator
menus.
Trace Area,
page 2--50
Event Table,
page 2--51
Figure 2- 27: Report Generator display with both trace and event t able showing
TARGET1 Trace Analysis, Report Generation and Emulation Tool User Manual
Control Panel,
page 2--51
2- 49
Page 72

OTDR Report Generator Mode
Trace Area
The trace area is blank until either a report is compiled or a report file is opened,
at which time the trace of the sample fiber file is displayed in an abbreviated
display area.
When multiple fiber files are included in the report, select the trace that is
displayed by clicking a file row in the table (see Figure 2--27). The display in the
Cable Information area data updates to show that fiber file.
This information summarizes all
the fiber data in the table.
Cable information changes
depending on the selected fiber in
the table.
Figure 2- 28: OTDR report summary and cable information boxes
Report Summary. Selected measurements for a compiled report are displayed to
summarize the report findings. The default contents are the Fiber Length Average, Link Loss - Average, and the Report Notes if any are in the file. Many
additional measurement parameters can be added to the summary list (as shown
in Figure 2--28) using the Report Summary selection in the Format choices. Use
the vertical scroll bar that appears when you click inside a summary box to view
the complete list when extra items are displayed. Refer to Report Formats
beginning on page 2--74 for details on making the report summary selections.
Cable Information. The summary cable information for a compiled report
provides identifying information on the file such as the filename, acquisition
date, and fiber notes as a default. Additional selections that you can add to the
Cable Summary include settings, two-point loss, two-point ORL, and two-point
distance numbers. Use the vertical scroll bar to view the complete list when extra
items are displayed. Refer to Report Formats beginning on page 2--74 for details
on selecting the cable information.
2- 50
TARGET1 Trace Analysis, Report Generation and Emulation Tool User Manual
Page 73

OTDR Report Generator Mode
Event Table
The event table provides a quick view of the events on the fiber. Each fiber file
in the report is shown in the table as a single line. Select the information
displayed for the events using the measurement tabs above the event table. Use
the tab selections to display either event loss or reflectance for each event. A
third tab provides a summary of the total loss and fiber length.
The three measurement tabs, Events, Reflectance, and Summary, are displayed
by default; to change which tabs are displayed, use the Events Table. You can
show all, any combination, or none of the measurement tabs in the Events Table.
Refer to Report Formats beginning on page 2--74 for details on how to include
or exclude these tabs from the report. The minimum event table display shows
the event loss for each event in the trace.
Use the cursor placement and the right mouse button to display pop-up menus
for additional functions. With the cursor on the file name, use the right mouse
button to go to the Trace Analysis view of the file (Go to File). With the cursor
on a column header, use the right mouse button to delete the column (Delete
Column). With the cursor on any table cell, the right mouse button displays both
pop-ups.
Events Tab. The Events tab provides a column for each event with the distance to
the event shown in the table heading. The Event Loss for each event is displayed
in the table cells.
Control Panel
Reflectance Tab. The Reflectance tab provides a column for each event with the
distance to the event shown in the table heading. The Reflectance for each event
is displayed in the table cells.
Summary Tab. The Summary tab provides a summary of the selected measurements on the fiber and the test wavelength. You can show all or none of the
measurements in the Summary table. Refer to Report Formats beginning on
page 2--74 for details on selecting the summary measurements.
The control panel buttons give you access to all the major functions of the report
generator. The Report Wizard button walks you through all the functions. The
buttons below the Report Wizard provide quick access to functions of the Report
Wizard, allowing you to make changes without stepping through the Report
Wizard. The Go To Trace Analysis button toggles to Trace Analysis mode. See
the button descriptions in Table 2--5 on page 2--52.
TARGET1 Trace Analysis, Report Generation and Emulation Tool User Manual
2- 51
Page 74

OTDR Report Generator Mode
Table 2- 5: Report Generator control panel
Button Description
Returns to the Trace Analysis mode. See OTDR Trace Analysi s Mode on page 2--1.
Starts the Report Wizard, which asks you questions about the report content and finds files based on the
answers you check. The Report Wizard guides you through the report generation process to produce a
report file that can be saved and printed, or exported to third-party data processing applications. Refer to
Using the Report Wizard beginning on page 2--56.
Allows you to define the type of report you want to make: one-way or bidirectional, in either a batch output
of individual OTDR traces or a fiber group summary report.
Allows you to add files to or replace files in the list of files that will be included in the report.
Allows you to use data from a sample file as a template for all the files in a report. You can add events,
landmarks, and notes to all the files in the report.
Allows you to select additional measurements: Auto 2-Point Loss and ORL. You can place the cursors at
specific events or distances in the trace, and you can zoom in on specific portions of the trace.
Allows you to assign common settings for all the traces in a report. This affects what events will appear. You
can also assign common limits for all the traces in a report; this allows you to highlight out-of-limit data in
the report event table.
Allows you to select the elements that you want included in the report and set up the layout of the report.
You can set up a title, headers, footers, and page numbering. Refer to Report Formats beginning on
page 2--74.
2- 52
TARGET1 Trace Analysis, Report Generation and Emulation Tool User Manual
Page 75

OTDR Report Generator Mode
Menu Selections
Table 2--6 lists all the menus and their functions.
Table 2- 6: TARGET1 Report Generator menu selections
Menu / Selection Toolbar button Description
File
New... Prompts you to save an unsaved report if appropriate. Opens a blank report.
Open... Displays the Open dialog box, allowing you to open a saved report file.
Close... Prompts you to save an unsaved report if appropriate. Closes an open report
file.
Save Saves changes to a previously saved file. For a new file, opens the Save As
dialog box, allowing you to name and save the active file to a location you
choose.
Save As... Opens the Save As dialog box, allowing you to name, choose a format, and
save the active file to a location you select.
Export... Allows you to save the active report to another file format (XML, HTML, CSV, or
RTF). See page 2--25 for details about the file formats you can use for exporting
files.
Page Setup... Allows you to set paper type, page margins, page orientation, and other values
for printed documents. See your Windows documentation.
Print Preview
Summary Preview
Batch Preview
Print... Displays the Print dialog box so you can print the active file. See your Windows
Report Wizard... Starts the Report Wizard, which walks you through creating a report. See
Report Notes... Allows you to enter notes about the report. See page 2--55.
Report Date... Allows you to enter a date for the report. See page 2--55.
Recent Report Files Allows you to open a recently opened report file.
Exit Closes the TARGET1 application.
View
Split Trace and Event Table Displays both the trace and the event table.
Event Table Only Displays the event table only. The trace, report summary, and cable information
Show Wizard Control Panel Allows you to show or hide the control panel buttons.
Refresh Updates the trace and event table for the current view.
Displays a sample page of a summary report.
Displays a sample page of a batch report.
documentation.
page 2--56.
are hidden.
TARGET1 Trace Analysis, Report Generation and Emulation Tool User Manual
2- 53
Page 76

OTDR Report Generator Mode
Table 2- 6: TARGET1 Report Generator menu selections (cont.)
Menu / Selection DescriptionToolbar button
Window
Cascade Displays the Report Generator and Trace Analysis windows (if both are open)
one on top of the other (the active window will be on top). See your Windows
documentation.
Tile Displays the Report Generator and Trace Analysis windows (if both are open)
without overlaying one window on top of the other. See your Windows
documentation.
Arrange Icons Arranges icons representing minimized windows to the lower left of the
application window. See your Windows documentation.
Open files list Shows the open windows (maximum of two). Select the window you want to
display.
Help
TARGET1 Help Displays the TARGET1 online help with the Contents tab selected.
Report Wizard Help Displays the TARGET1 Report Generator online help with the Contents tab
selected.
Contents and Index Displays the TARGET1 online help with the Index tab selected.
About TARGET1 Displays copyright and version information for the TARGET1 application.
Saving Reports
Select File > Save to save changes to a previously saved file, or select File >
Save As to choose a name, format, and location for saving the active file.
You can save files in the following formats:
H Report File (*.rpt) saves the report with all the trace data.
H Report Format (*.rpf) saves pointers to the trace files used to create the
report file. When reopened, the report is regenerated. You can use these files
as a template to generate similar reports.
H Report and Data Files saves .rpt and .rpf to a directory along with the OTDR
trace files in the report. This is the most robust way of saving files.
Exporting Report Files
Select File > Export to display a Save As dialog box that allows you to save the
report data as XML, HTML, CSV, or RTF. See page 2--25 for details about the
file formats you can use for exporting files.
2- 54
TARGET1 Trace Analysis, Report Generation and Emulation Tool User Manual
Page 77

OTDR Report Generator Mode
Adding Report Notes and
Date
After you have generated a report file, select File > Report Notes to record
comments about the report. Click inside the report note window and type in the
report note information.
To add a date to the report file, select File > Report Date. The default date is
taken from the computer date-time. Click the down arrow in the Report date:
window to display a calendar that you can use to select a different date for the
report. See Figure 2--29. Use the Format dialog box to include the date in the
Report Summary.
Figure 2- 29: Report date selection calendar
TARGET1 Trace Analysis, Report Generation and Emulation Tool User Manual
2- 55
Page 78

OTDR Report Generator Mode
Using the Report Wizard
The Report Wizard guides you through the complete setup procedure for creating
a report. Based on the selections you check, the wizard accesses the files needed,
analyzes the data in the files, and generates a report that gives the requested
information for a set of fibers.
NOTE. To create a report, you must fill in the first three dialog boxes of the
Report Wizard to select files and the report type. Making changes to the other
dialog boxes is optional; the default selections will give you a usable report.
You can access any of the Report Wizard steps directly using the control panel
selection buttons below the Report Wizard button. Each of the buttons goes
directly to a setup dialog box. The direct access buttons are useful to modify the
report after you have used the Report Wizard to make the initial selections.
In the Report Generator control panel, click the Report Wizard button to start the
Report Wizard.
Files
The Files dialog box, shown in Figure 2--30, is the first in the Report Wizard.
You can also access it by clicking the File button.
1. You can select either or both types of report:
H Fiber Summary Report is the default selection and creates a detailed
report. Select this type of report to create a single table summarizing
multiple traces.
H Batch Output Multi-page report gives brief reports based on many
files. Select this type of report to create similarly formatted tables, one
for each trace (or one table for each pair of traces for bidirectional and
difference measurements).
2- 56
TARGET1 Trace Analysis, Report Generation and Emulation Tool User Manual
Page 79

OTDR Report Generator Mode
Figure 2- 30: Report Wizard Files dialog box, part 1
2. Choose One Way, Bi-directional, or Difference report type. This option
determines the selections available when you click Next. Descriptions for
each report choice follows:
H One-way report provides only one file selection. Select one-way reports
when all the files that you want in your report are taken from the same
end of the fiber.
H Bi-directional r eport provides a second file selection, representing the
Far End measurement file. Select Bi-directional report when there are
measurement files taken from both ends of the fiber and you want to use
bi-directional averaging. You will need to provide a sample file name for
each direction in the bidirectional report.
Bi-directional characterization of the fiber (the same measurements taken
from both ends of the fiber) can be used to cancel fiber mismatches, such
as those caused by the joining of two fibers with different scattering
coefficients. When the two files are compared with bidirectional
averaging, the mismatch errors are cancelled.
H Difference report provides a second file selection, representing the
second file that was used to create difference average measurements.
TARGET1 Trace Analysis, Report Generation and Emulation Tool User Manual
2- 57
Page 80

OTDR Report Generator Mode
3. Choose the Single or Multiple Wavelength report type depending on how
many wavelengths were used to take traces. You can include up to three
wavelengths for each trace in one report. If you have more than three
wavelengths to make reports for, create additional reports.
H Select Single Wavelength when all the traces were taken with the same
wavelength.
H Select Multiple Wavelength when all the traces were taken with more
than one wavelength.
NOTE. For difference measurements for which you want to compare traces
acquired with two wavelengths, it doesn’t matter whether you choose Single or
Multiple. In the second part of the Files dialog box, put the second wavelength
files in the the column on the right. The third dialog box, Files Selected, should
then look something like what is pictured below:
2- 58
4. Click Next to go to the next part of the Files dialog box. See Figure 2--31.
TARGET1 Trace Analysis, Report Generation and Emulation Tool User Manual
Page 81
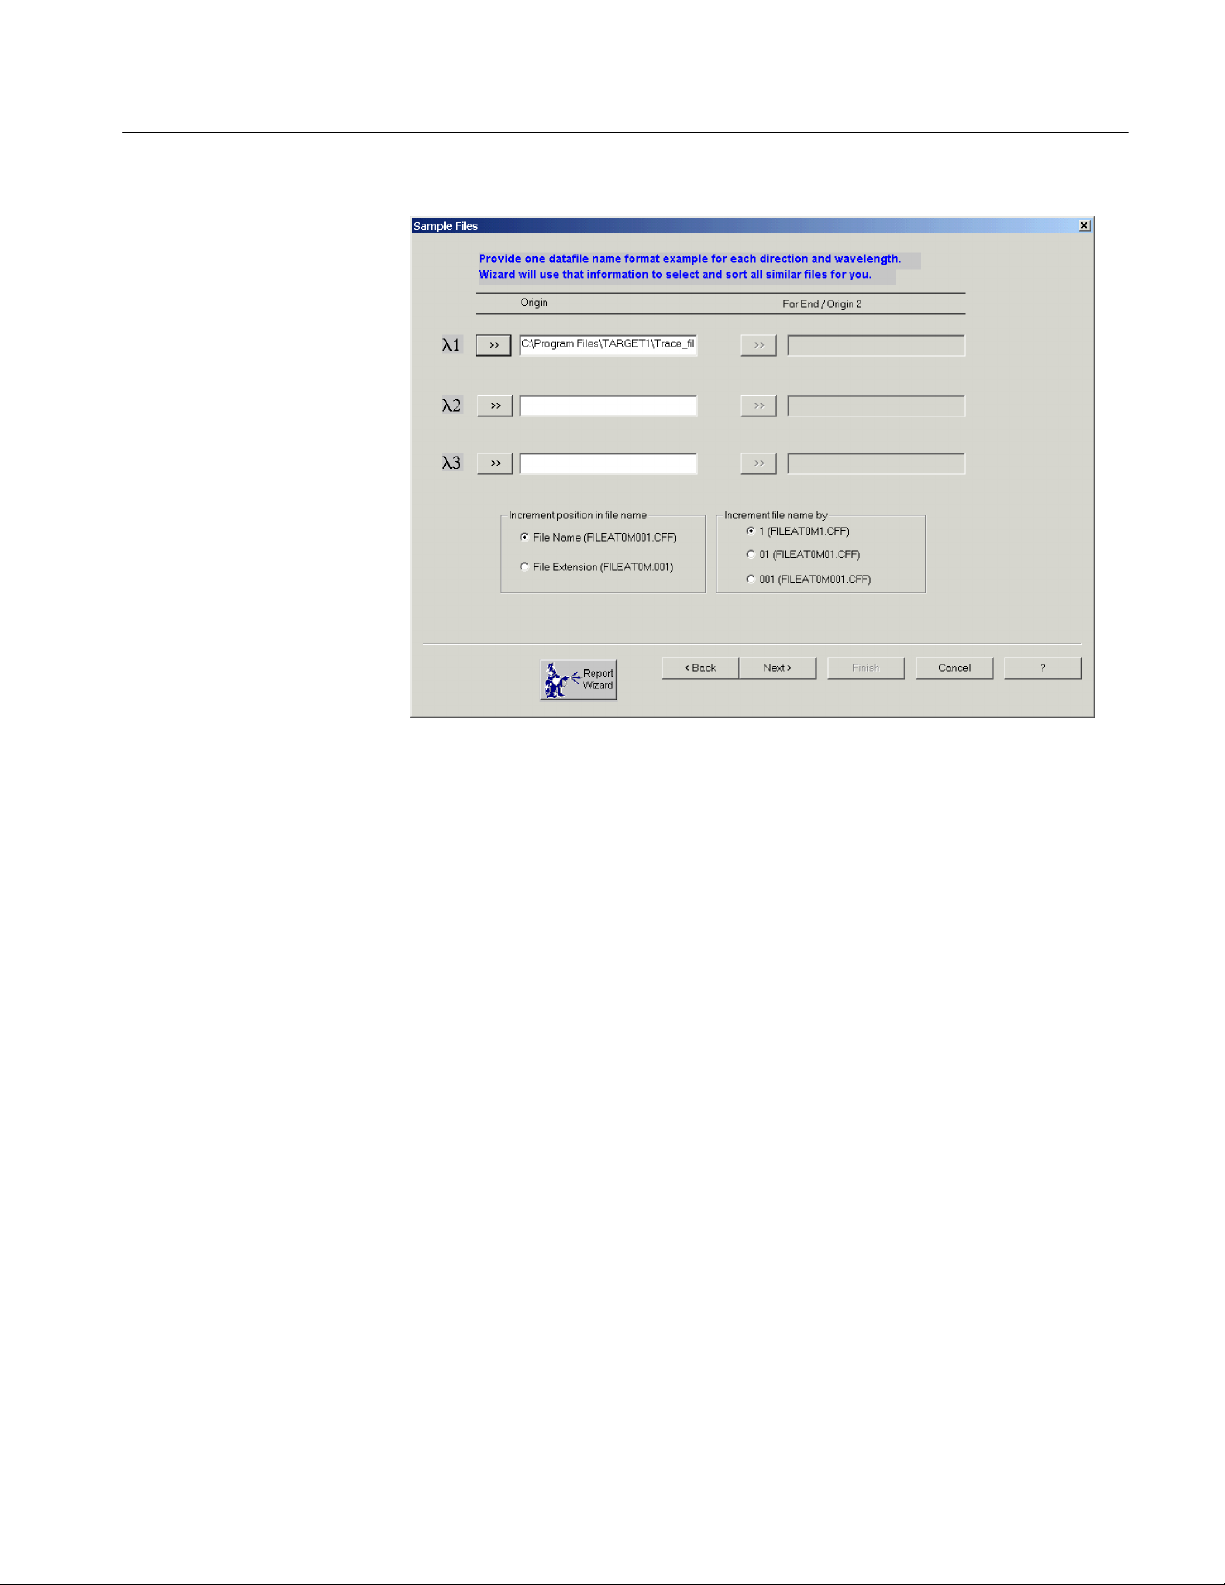
OTDR Report Generator Mode
Figure 2- 31: Report Wizard Files dialog box, part 2
5. Choose example files for up to three wavelengths that you want in your
report.
You can use files from any accessible file directory. If the computer is
connected to a network, any connected file system is accessible. Start your
selection of files by clicking the >> buttonnexttotheλ1 wavelength file
name window. The Select File dialog box, shown in Figure 2--32, is
displayed. Select the directory and locate the file or files you need for the
report.
Refer to File Search on page 2--63 for more information about how to find
files.
The Report Wizard needs examples of the type of files you want to include
in the report. A good file naming convention is important. Provide an
example file name of the matching files for each direction and each
wavelength you have selected.
Fiber No. Point of Origin File Far End of Fiber File
1 AFIBER01.SOR BFIBER01.SOR
2 AFIBER02.SOR BFIBER02.SOR
andsoforth
TARGET1 Trace Analysis, Report Generation and Emulation Tool User Manual
2- 59
Page 82

OTDR Report Generator Mode
Figure 2- 32: Select file navigation screen
6. Indicate what file extensions the Report Wizard should look for and how
many digits are used in your file incrementing.
If there are multiple files, the Report Wizard matches the files to compare by
a parameter of the file name, usually the number in the file name or the file
extension. The file increment selections provide a guide as to how the
filenames should be looked at for matches. For example, if the files are
incremented in the name such as AtoB001.sor and AtoB002.sor, then the
File Name selection is correct. If the files are incremented in the extension,
for example AtoB1310.001 and AtoB1310.002, then the file extension
choice is correct.
Use the selections in the box Increment position in file name to indicate
whether the file number appears just before the file extension (FILEAT0M001.CFF) or as the file extension (FILEAT0M.CFF). Use the
selections in the box Increment file name by to indicate whether your files
are numbered with one digit (1), two digits (01), or three digits (001).
7. Click Next in the Files dialog box to view the list of files that the Report
Generator finds based on the samples you identified. The Files Selected
dialog box appears. See Figure 2--33.
The Report Wizard searches the file system for files that match the example
file name(s) you provided and generates a Report File List. Using the
examples you provide, the Report Wizard searches for all matching file types
and generates a file list as shown in Figure 2--33.
2- 60
Review the list to see if the correct files are listed for the report you want
made. You can then accept, add, or remove files from the list as needed to
TARGET1 Trace Analysis, Report Generation and Emulation Tool User Manual
Page 83

OTDR Report Generator Mode
create the file list to use for the report. Click the file name and then Remove
to remove a file. Click Add Files... to browse for a file name to add to the
list.
Figure 2- 33: Report Wizard File Selected dialog box
TARGET1 Trace Analysis, Report Generation and Emulation Tool User Manual
2- 61
Page 84

OTDR Report Generator Mode
When building a report file list, the position of the file name in the list has
meaning. Files are listed in groups with all the trace files for one fiber
together. Columns designate which end of the fiber the files are from (that is,
their point of origin). If there is more than one row per group, then each row
is a different wavelength. The number of file slots per group is based on the
number of sample file names entered and their position.
TARGET1 analysis looks at relationships between the trace files for each
fiber for critical measurements. Failure to group files as described above can
lead to measurement errors.
For example, a bidirectional average report means that you have a file from
each end of the fiber . The list will have two columns. If you test at two
wavelengths, you will have two files from each end, one for each wavelength. So each fiber will have four test files. These are presented in a group
like:
NearEnd--Wavelength1--F iber001 FarEnd--Wavelength1--Fiber001
NearEnd--Wavelength2--F iber001 FarEnd--Wavelenght2--Fiber001
TARGET1 will leave a space for files not located. In the example above,
let’s say we were missing the Far End trace for Wavelength 1. The list
would look like:
N e a r E n d -- Wa v e l e n g t h 1 -- F i b e r 0 0 1 -- -- -- -- -- -- -- -NearEnd--Wavelength2--F iber001 FarEnd--Wavelenght2--Fiber001
If you manually add the missing file you need to put it in the empty space.
You can also replace one of the other traces, as long as the replacement is put
in the right file position. At the end of the file list TARGET1 provides an
empty file group:
-- -- -- -- -- -- -- -- -- -- -- -- -- -- -- -- -- -- -- --
-- -- -- -- -- -- -- -- -- -- -- -- -- -- -- -- -- -- -- --
This allows you to add a new fiber group and maintain the file relationship
information. When you add a name to this empty group, a new blank group
is added to the bottom of the list.
8. Click Next (or the Report Generator button and then Next) to proceed to the
Template Options dialog box. Go to Template Selection on page 2--66.
2- 62
TARGET1 Trace Analysis, Report Generation and Emulation Tool User Manual
Page 85

OTDR Report Generator Mode
File Search
Use the Search feature in the Select File dialog box to locate a file you want to
use for the example. You can search by file name or partial name, search by a
date or range of dates, or search by certain file parameters. Click the Search
button to display the Search File(s) dialog box shown in Figure 2--34. Select a
search type tab to display the search options for that parameter .
NOTE. The search criteria are Boolean ANDs, so a search will only find files that
match all the search criteria you enter. The search is case sensitive.
Name Locator. If you know the specific file name you want, type it in the
Named: box. If you know only the type of files you want to look for, use a
wildcard with the file extension in the Named: box. For example, if you want to
look at all the SOR files stored in the file system, type *.sor. Y ou can also use
partial file names with wildcard characters (*filename*.*).
Look in. Select a directory in the Look in box to specify one of the connected file
systems to search. Click the down arrow in the box to show the connected drives
that you can select. You can also use the Browse button to select a folder for the
search. All the connected and accessible directories are displayed for making
your selection.
Search by Date Modified. If you know the date or range of dates of the files you
want to look at, search by Date Modified. Click the desired search parameter
and fill in the values. You can search for files modified in a specific range of
dates, within a selected number of months, or within a selected number of days.
See Figure 2--35.
TARGET1 Trace Analysis, Report Generation and Emulation Tool User Manual
2- 63
Page 86
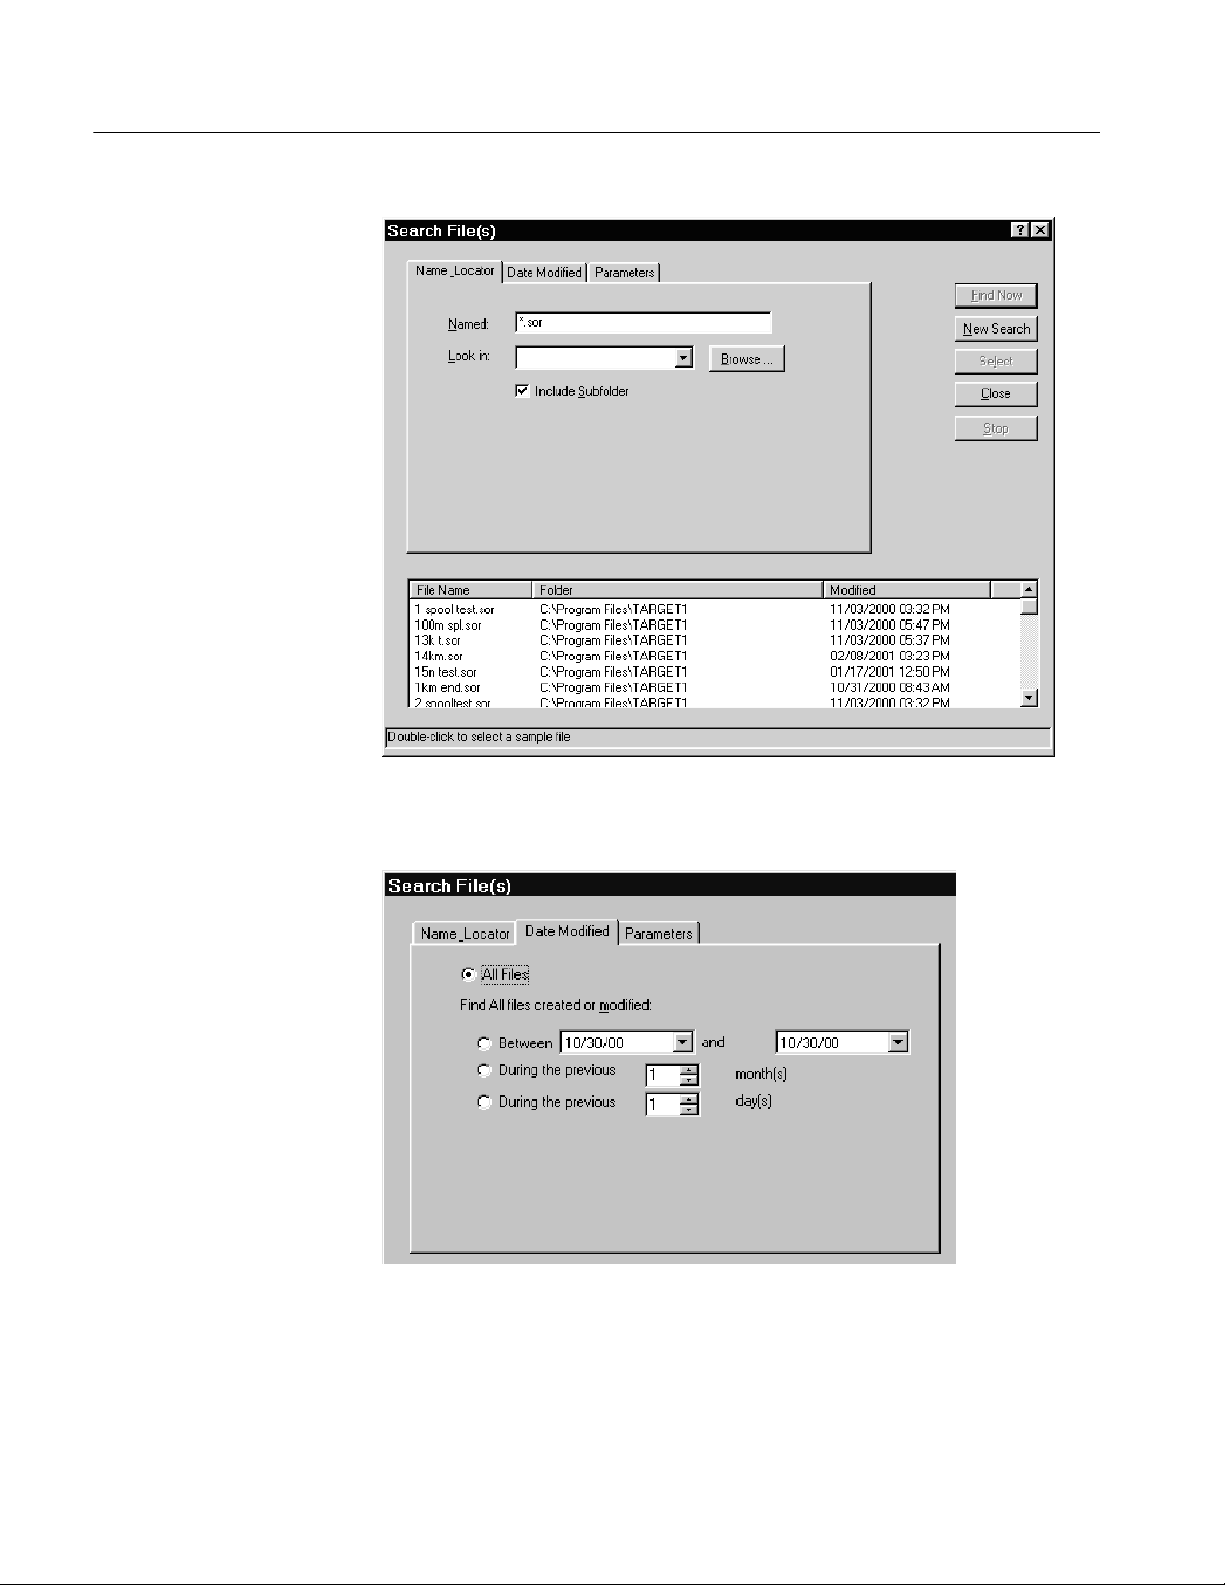
OTDR Report Generator Mode
Figure 2- 34: Search File dialog box
Figure 2- 35: Search by date option
2- 64
TARGET1 Trace Analysis, Report Generation and Emulation Tool User Manual
Page 87
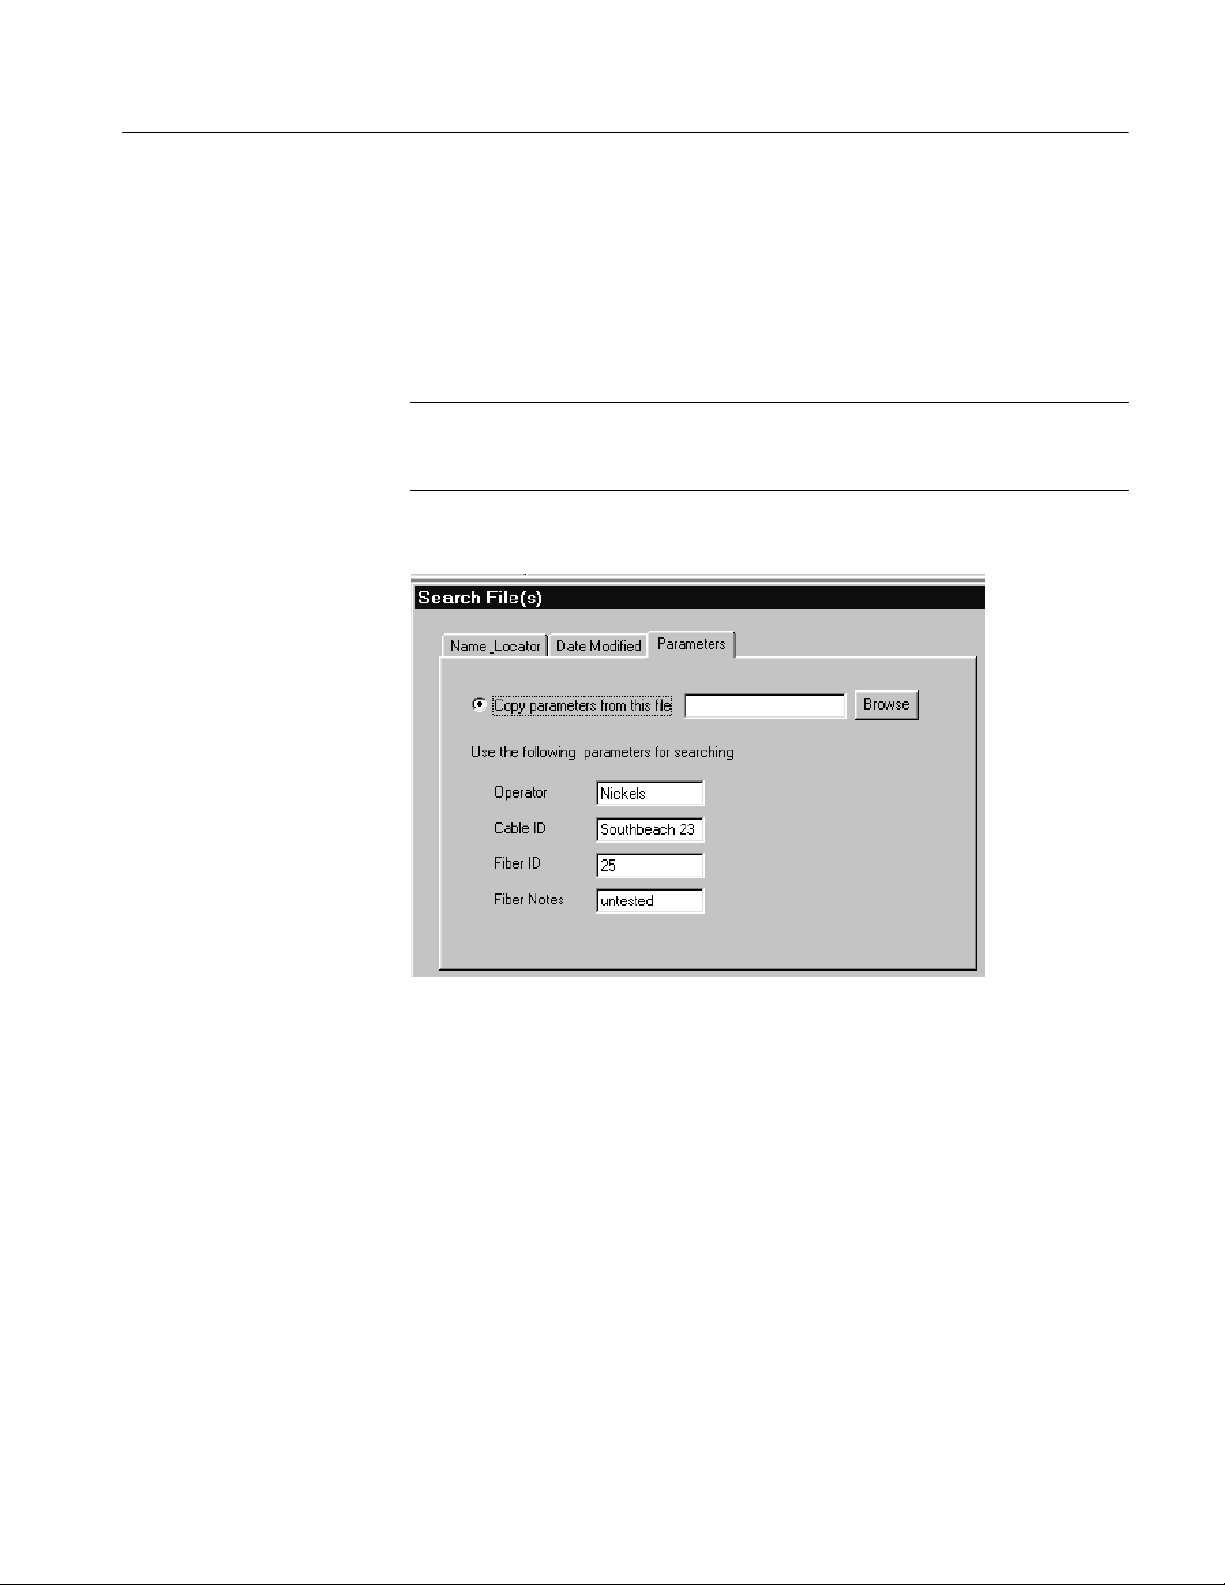
OTDR Report Generator Mode
Search by Parameters. Use this option to locate files that match selected file
parameters. You can fill in the file parameter or parameters to use or copy
parameters from a selected file. To copy file parameters, click the Copy
parameters from this file selection box, and use the Browse button to search
the directory for the file to use. Any parameters associated with the file are
loaded in the appropriate box in the parameters list. See Figure 2--36.
NOTE. The search parameters in the Parameters tab are all fields that you can
modify with a template. You can use a template to alter the file description fields
to make future searches easier. See Template Selection on page 2--66.
Figure 2- 36: Search by parameter option
Search File Control Buttons. The control buttons direct the action of the search:
H Find Now. When you have made your search selection, click Find Now to
conduct the search.
H New Search. Click New Search to clear any files in the search list from a
previous search.
H Select. Select a file in the list and then click Select to choose that file.
H Close. Click Close to exit the Search Files(s) dialog box.
TARGET1 Trace Analysis, Report Generation and Emulation Tool User Manual
2- 65
Page 88

OTDR Report Generator Mode
Template Selection
The Template dialog box allows you to use data from a specific trace file as a
template or to create your own template. When you apply a template to the
report, events and other information are added to each data file in the report.
The data that is transferred from the template trace to other trace files includes:
H Events and event notes
H Operator name
H Fiber ID
H Cable ID
H Fiber notes
Events Info Tab. The events in the template file are implemented across all the
selected files in the report file list. You can browse for and select a file to use as
a template. You can then edit the template by adding or deleting events. If you
choose to Delete Non-template Events from the files for the report, only the
events at the locations listed in the table of the Event Info tab will be shown in
the report. See Figure 2--37.
2- 66
Figure 2- 37: Template events info tab
TARGET1 Trace Analysis, Report Generation and Emulation Tool User Manual
Page 89
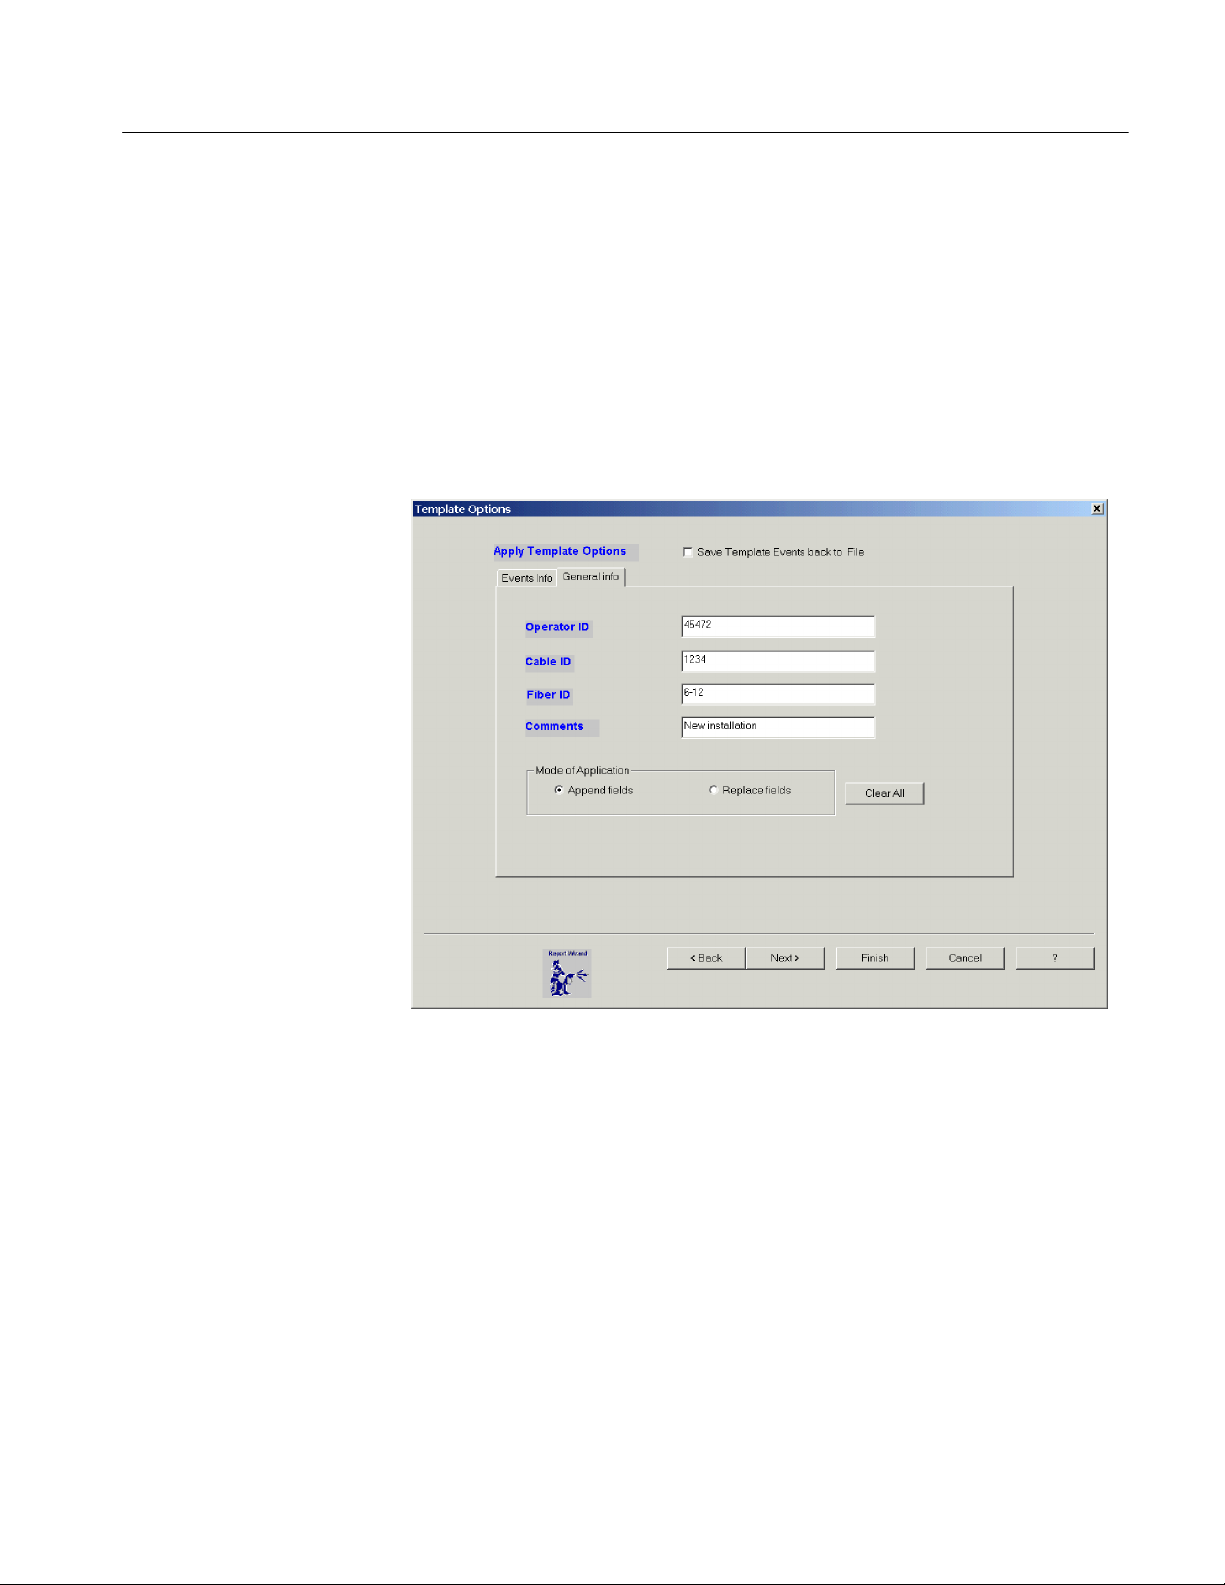
OTDR Report Generator Mode
General Info Tab. The following information can also be applied from a
template: Operator ID, Cable ID, Fiber ID, and Comments. Select the General
Info tab to add or replace the information in the files. See Figure 2--38.
You can add or delete events and landmarks to and from the template. You can
also add template events to the existing events of a file or delete the non-template events from a file or set of files.
Select the Save Template Events back to File box to save the added events as
part of the existing file.
Figure 2- 38: Template general information dialog box
Add Event to Template. In general, all occurrences on the trace are events, but
they can be classified as measurement events such as splice loss, reflectance, and
end of fiber, or as landmarks that are added by the operator to indicate physical
locations of points of reference. Click the Add Event button to display the
dialog box shown in Figure 2--39.
Designate the event type by clicking the appropriate check area. Enter the
distance to the event. Distance is specified from the front panel of the OTDR.
TARGET1 Trace Analysis, Report Generation and Emulation Tool User Manual
2- 67
Page 90

OTDR Report Generator Mode
Figure 2- 39: Add event or landmark to template dialog box
Building a Template File
You can use any trace file as a template or the basis of a new template.
To build a template from an existing file, click Copy from existing file in the
Apply Template Options dialog box (see Figure 2--40). Click the Browse button
to display the Open dialog box. Locate the file you want to use for a template.
Highlight the file name and click Open to display the events of the file.
In the Events Info tab, add, delete, or modify the events to your template
requirements.
Click the General Info tab to enter or edit the Operator ID, Cable ID, Fiber ID,
and Comments to your template requirements. In the General Info tab, select
either Append fields or Replace fields as the method for adding general
information from the template file to the files of the report.
If you want to build a template without loading anything from an existing file,
leave Copy from existing file unchecked. Make the appropriate template entries
directly into the table cells. The Marker Type column has a selection arrow that
you can use to designate the event type as an Event or a Landmark. You can
also use the Add Events or Delete Event buttons to alter the template events.
Before applying the template to the report files, select either Add Template
Events to the existing events on the trace file or Delete Non-template Events.
After all the template choices are made, click the OK button. The report will be
recalculated based on the new template applied to the file.
2- 68
To save the template changes for later use or as a record of the template changes,
check Save Template Events Back to File. The changes are saved to the file.
TARGET1 Trace Analysis, Report Generation and Emulation Tool User Manual
Page 91

OTDR Report Generator Mode
Figure 2- 40: Template Options dialog box
TARGET1 Trace Analysis, Report Generation and Emulation Tool User Manual
2- 69
Page 92

OTDR Report Generator Mode
Analysis Selection
The Analysis dialog box, shown in Figure 2--41, is next in the Report Wizard.
You can also access it by clicking the Analysis button.
You can select additional analysis options for the report. You can select Auto
2-Point Loss or ORL measurements and you can zoom on selected portions the
fiber trace.
Auto Two Point Measurement Options. You can select either or both of these auto
measurements for additional analysis of the report data (see Figure 2--42):
H Make Auto two-point loss measurement. Use the cursor position options to
place the distance cursors for the automatic measurement.
H Make Auto two-point ORL measurement. Use the cursor position options to
place the distance cursors for the automatic measurement.
Cursor Position Options. You can place the cursors in the report trace to indicate
where the Auto Two-Point Measurement is to be made. The placement options
are as follows:
H Place cursors at location saved in each file.
H Place cursors on the first and last events.
H Place cursors on the second and last events. (Use this option if the first event
is the connector to the OTDR.)
H Place cursors at specific distances. Enter distance values for the Left and
Right Cursors in the distance edit boxes to define the cursor placement for
the auto two-point measurement.
Auto Zoom Options. Use the Auto Zoom selection to choose a zoom area for the
trace that is displayed for the report. See Figure 2--43. Select one of the
following zoom choices if you want to see a zoomed display in the report trace:
H Zoom in to section saved in each file (same size, centered on the active
distance cursor).
H Zoom between the first and last events. This expands the graph to show the
trace between the first and last events.
H Zoom between the second and last events.
H Zoom to between distances: Enter the left and right edge distances in the edit
boxes to define the zoom area.
2- 70
TARGET1 Trace Analysis, Report Generation and Emulation Tool User Manual
Page 93
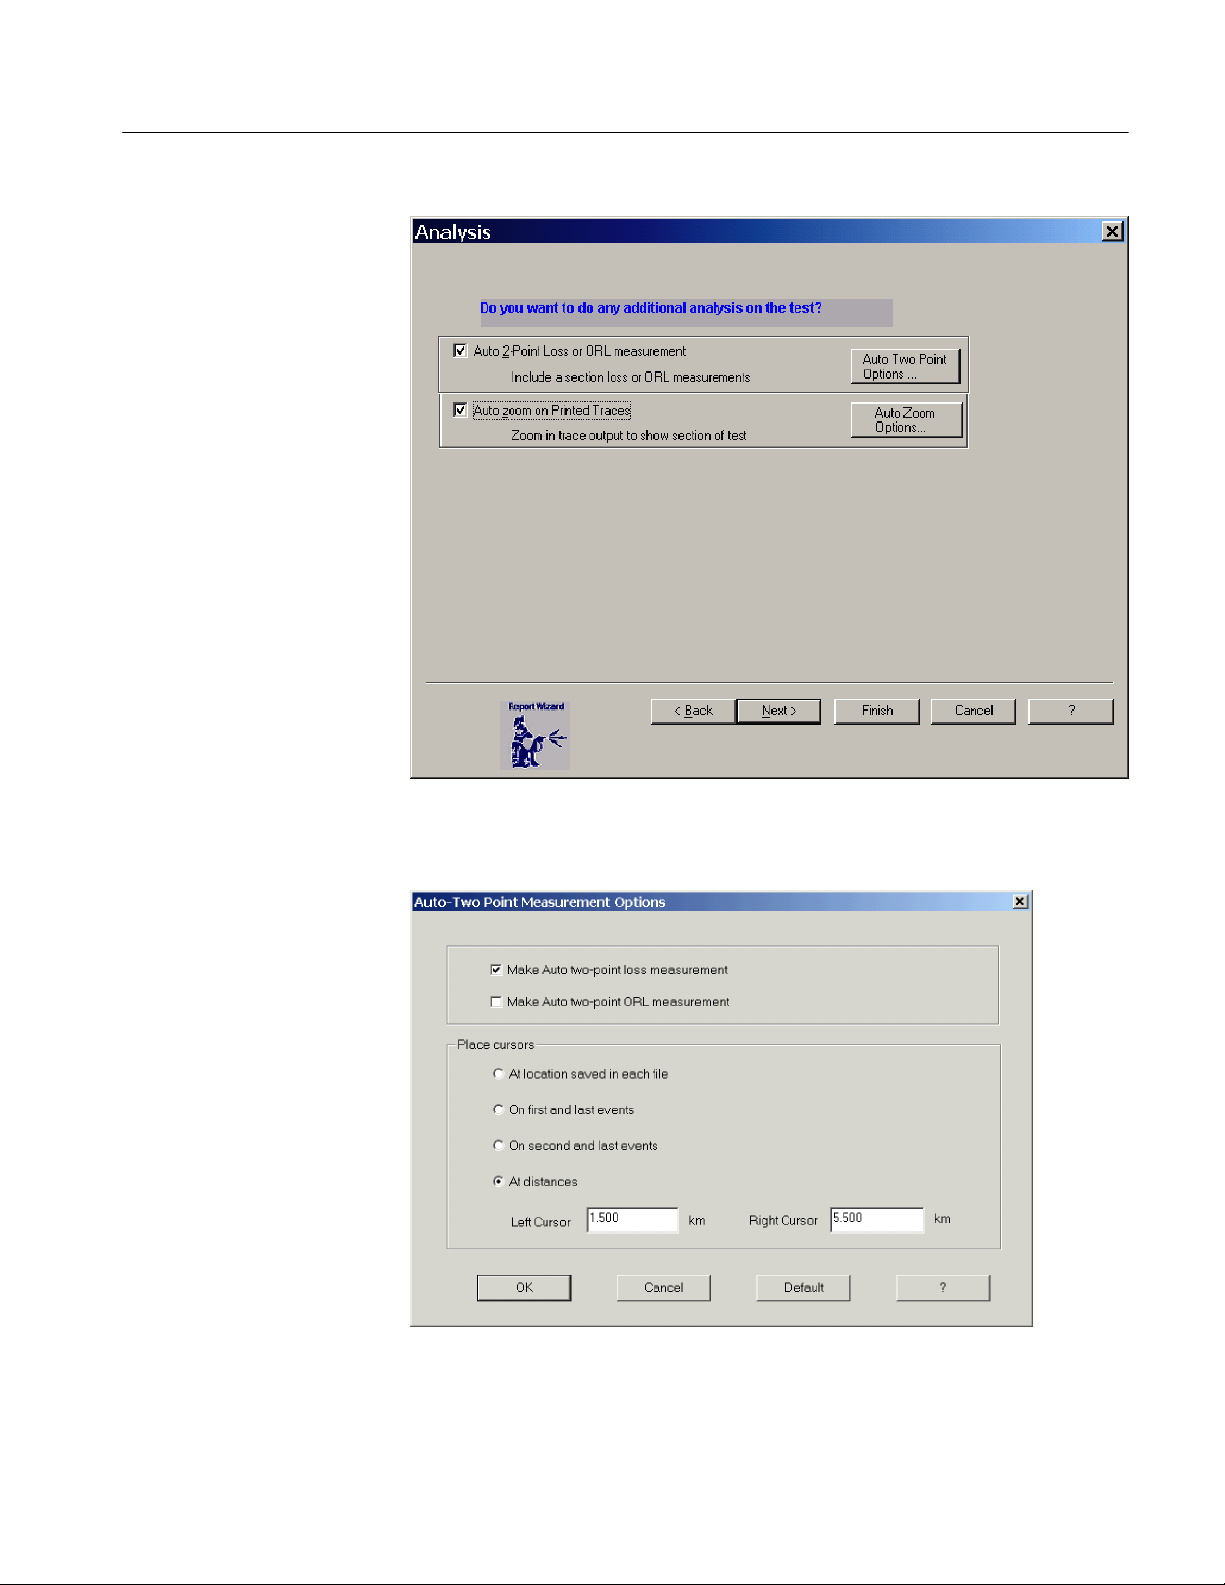
OTDR Report Generator Mode
Figure 2- 41: Report Wizard analysis dialog box
Figure 2- 42: Analysis Auto Two-Point Measurement options
TARGET1 Trace Analysis, Report Generation and Emulation Tool User Manual
2- 71
Page 94

OTDR Report Generator Mode
Figure 2- 43: Analysis Auto Zoom options
Test Settings and Limits
TARGET1 checks the files listed in the first file name group to determine what
wavelengths are present. A settings tab is generated for each unique wavelength
found in that group (see Figure 2--44). The test settings for the first file read for
each wavelength are loaded into the dialog box.
If you need to correct a setting or make new limit choices (to find events or
delete events at different limits), you can make those changes in the Test Settings
and Limits edit boxes. (Changes made to a wavelength tab do not affect other
wavelength tabs.) When all the changes have been made, click the Next button
(if you are using the Wizard to set up a report) or OK (if you are not using the
Wizard). If the report has been generated once, or no other changes are needed,
click the Finish button.
The report is regenerated with the changed test settings and limits. If new limits
cause more events to fail, then in the original file those events are marked in the
event table. If fewer events fail, those events become unmarked in the event
table.
2- 72
TARGET1 Trace Analysis, Report Generation and Emulation Tool User Manual
Page 95

OTDR Report Generator Mode
Figure 2- 44: Test Settings and Limits
Use or Modify Existing File. Select an existing file from which to load settings.
Click the Copy from existing file selection box, and then use Browse to select a
file. Settings associated with the selected file are entered in the settings windows.
You can use the settings as loaded or modify them.
Settings. Set the values for Refractive Index, Cabling Factor, Backscatter
Coefficient, Event Loss Threshold, End Detection, Zero Reference and
Reflectance Threshold values. You can also set the distance units to feet, miles,
meters or kilometers. If the event marking puts an event past the end of the fiber,
you can reduce the End Detection level to correct the situation. The End
Detection level can be set to a value from 1 to 20 dB. A typical setting might be
5dB.
Limits. Use the limits to define out-of-tolerance conditions. You can set limits for
Event Loss, Reflectance, Slope, Difference or Link Loss. Values that exceed
these limits are highlighted in the report.
Factory Defaults. The factory default settings provide reasonable values for the
settings and limits for testing. You can use the factory defaults as a starting point
if you are not using a sample file as a template.
TARGET1 Trace Analysis, Report Generation and Emulation Tool User Manual
2- 73
Page 96

OTDR Report Generator Mode
Report Formats
There are two report types: Fiber Summary Report and Batch Output Multi-page
report. You can select either or both types to output from the Report Wizard.
The formatting choices depend on the report tab you select in the Report Format
dialog box (shown in Figure 2--45). A summary report compiles information
from the selected fiber files in one report. A batch output is a separate report for
each fiber file selected.
Fiber Summary Report
Select components you want to appear in the report. You can include the
Summary Table, the Sample Trace, a Report Summary, the Summary Cable
Information, and a Summary Header/Footer. When you select one of these
components to be included in the report, you can also select elements for that
component (except for the Sample Trace).
2- 74
Figure 2- 45: Summary Report component selection
Summary Table. The Summary Table is always included in the report. Check any
additional components you want to appear in the report (see Figure 2--45), and
then click the Select Elements... button to make additional selections to add
items to that component. Once selected, the component remains checked for the
duration of the active session. Exiting the application and starting it again reverts
TARGET1 Trace Analysis, Report Generation and Emulation Tool User Manual
Page 97

OTDR Report Generator Mode
to the default selections for all report components and elements of the component.
You can change the order in which the selected measurements appear in the
report. Click an element in the list, and then click the up arrow or the down
arrow to change the element’s position in the list.
Sample Trace. Check to include the trace view in the report.
Report Summary. Several elements can be added to the default selection. The
defaults are Fiber Length Average, Link Loss Average, and Report notes. The
maximums and minimums for those and others can be added to the report. Click
the Change the Order arrows to move a selected element to a higher or lower
place in the display order. Click in the Report Summary display box to add the
vertical scroll bar so that you can view the complete list if it exceeds the default
display area.
Report Elements
Summary Cable Information. The default selection components are filename,
acquisition date, and Fiber notes. You can add test settings, Two Point Loss
measurements, Two Point ORL measurements, and Two Point Distance readout
to show in the Cable Information display area. Click in the Cable Information
display box to add vertical scroll bar so that you can view the complete list if it
exceeds the default display area.
Summary Header/Footer. Select this item and click the associated Select Elements
button to set up the title, header, and footer. You can include page numbers, total
page count, date, and time, as well as type in your own text. The default footer
follows:
Tektronix TARGET1 Analysis SW [date] [time]
[page count]
Select any components you want included in the report. When you select a
component checkbox, the Select Elements button becomes available.
H Summary Table: Click Select Elements to select the measurements and
measurement tabs you want to appear in the summary table. This displays
the dialog box shown in Figure 2--46. Click the Select All button to include
the complete list in the table. Click the Clear All button to deselect any
selected components. You can then select only those components you want
in the summary table for the report. Click the Default button to check the
factory default choices shown in Figure 2--46 for the summary table and
measurement tabs.
TARGET1 Trace Analysis, Report Generation and Emulation Tool User Manual
2- 75
Page 98

OTDR Report Generator Mode
You can change the order in which the selected measurements will appear in
the report. Click an element in the list, and then click the up arrow or the
down arrow to change the position of the element in the list.
Figure 2- 46: Summary table element selections
H Sample Trace: Select to include the trace view in the report.
H Report Summary: Select the summary elements you want to appear in the
report. See Figure 2--47. The default selection provides a short list of
elements. You can choose other elements from the Average and Maximum
choices for Fiber Length, Link Loss, Fiber Slope, Connector Loss, and Link
ORL.
2- 76
TARGET1 Trace Analysis, Report Generation and Emulation Tool User Manual
Page 99

Figure 2- 47: Report Summary element selections
OTDR Report Generator Mode
H Summary Cable Information: Select the types of cable information you
want to appear in the report. See Figure 2--48. The default selections are
Filename, Acquisition Date, and Fiber Notes. You can add Settings,
Two-Point Loss, Two-Point ORL, and Two-Point Distance to the cable
information format. (The two-point measurements are only available if you
have activated and defined them in the Analysis section.)
TARGET1 Trace Analysis, Report Generation and Emulation Tool User Manual
2- 77
Page 100

OTDR Report Generator Mode
Figure 2- 48: Summary Cable element selections
H Summary Header/Footer: Enter the Report Title that you want to appear on
the first page of the report. Enter the Header and Footer information that you
want to appear on each page in the printed report. See Figure 2--49.
NOTE. The Header/Footer formatting done in the Report Generator for the
printed report is not exported.
2- 78
TARGET1 Trace Analysis, Report Generation and Emulation Tool User Manual
 Loading...