

Page 1
It’s Time To Get Real.
Your Guide to Selecting the Right Real-Time Spectrum Analyzer
Page 2
Complex RF Problems
Require a New Type of Analysis
Today’s RF signals change over time, often unpredictably. To effectively characterize these signals, you need a
tool that can discover and trigger on both known and unpredictable events, capture the signals seamlessly
into memory, and analyze the behavior of frequency, amplitude, and modulation parameters over time. Using
traditional tools like swept spectrum analyzers and vector signal analyzers might provide snapshots of the signal
in the frequency and modulation domains, but this is often not enough information to confidently describe the
dynamic RF signals produced by the device under test. By providing insight into how parameters change over
continuous time, the Real-Time Spectrum Analyzer adds another crucial dimension to all of these measurements.
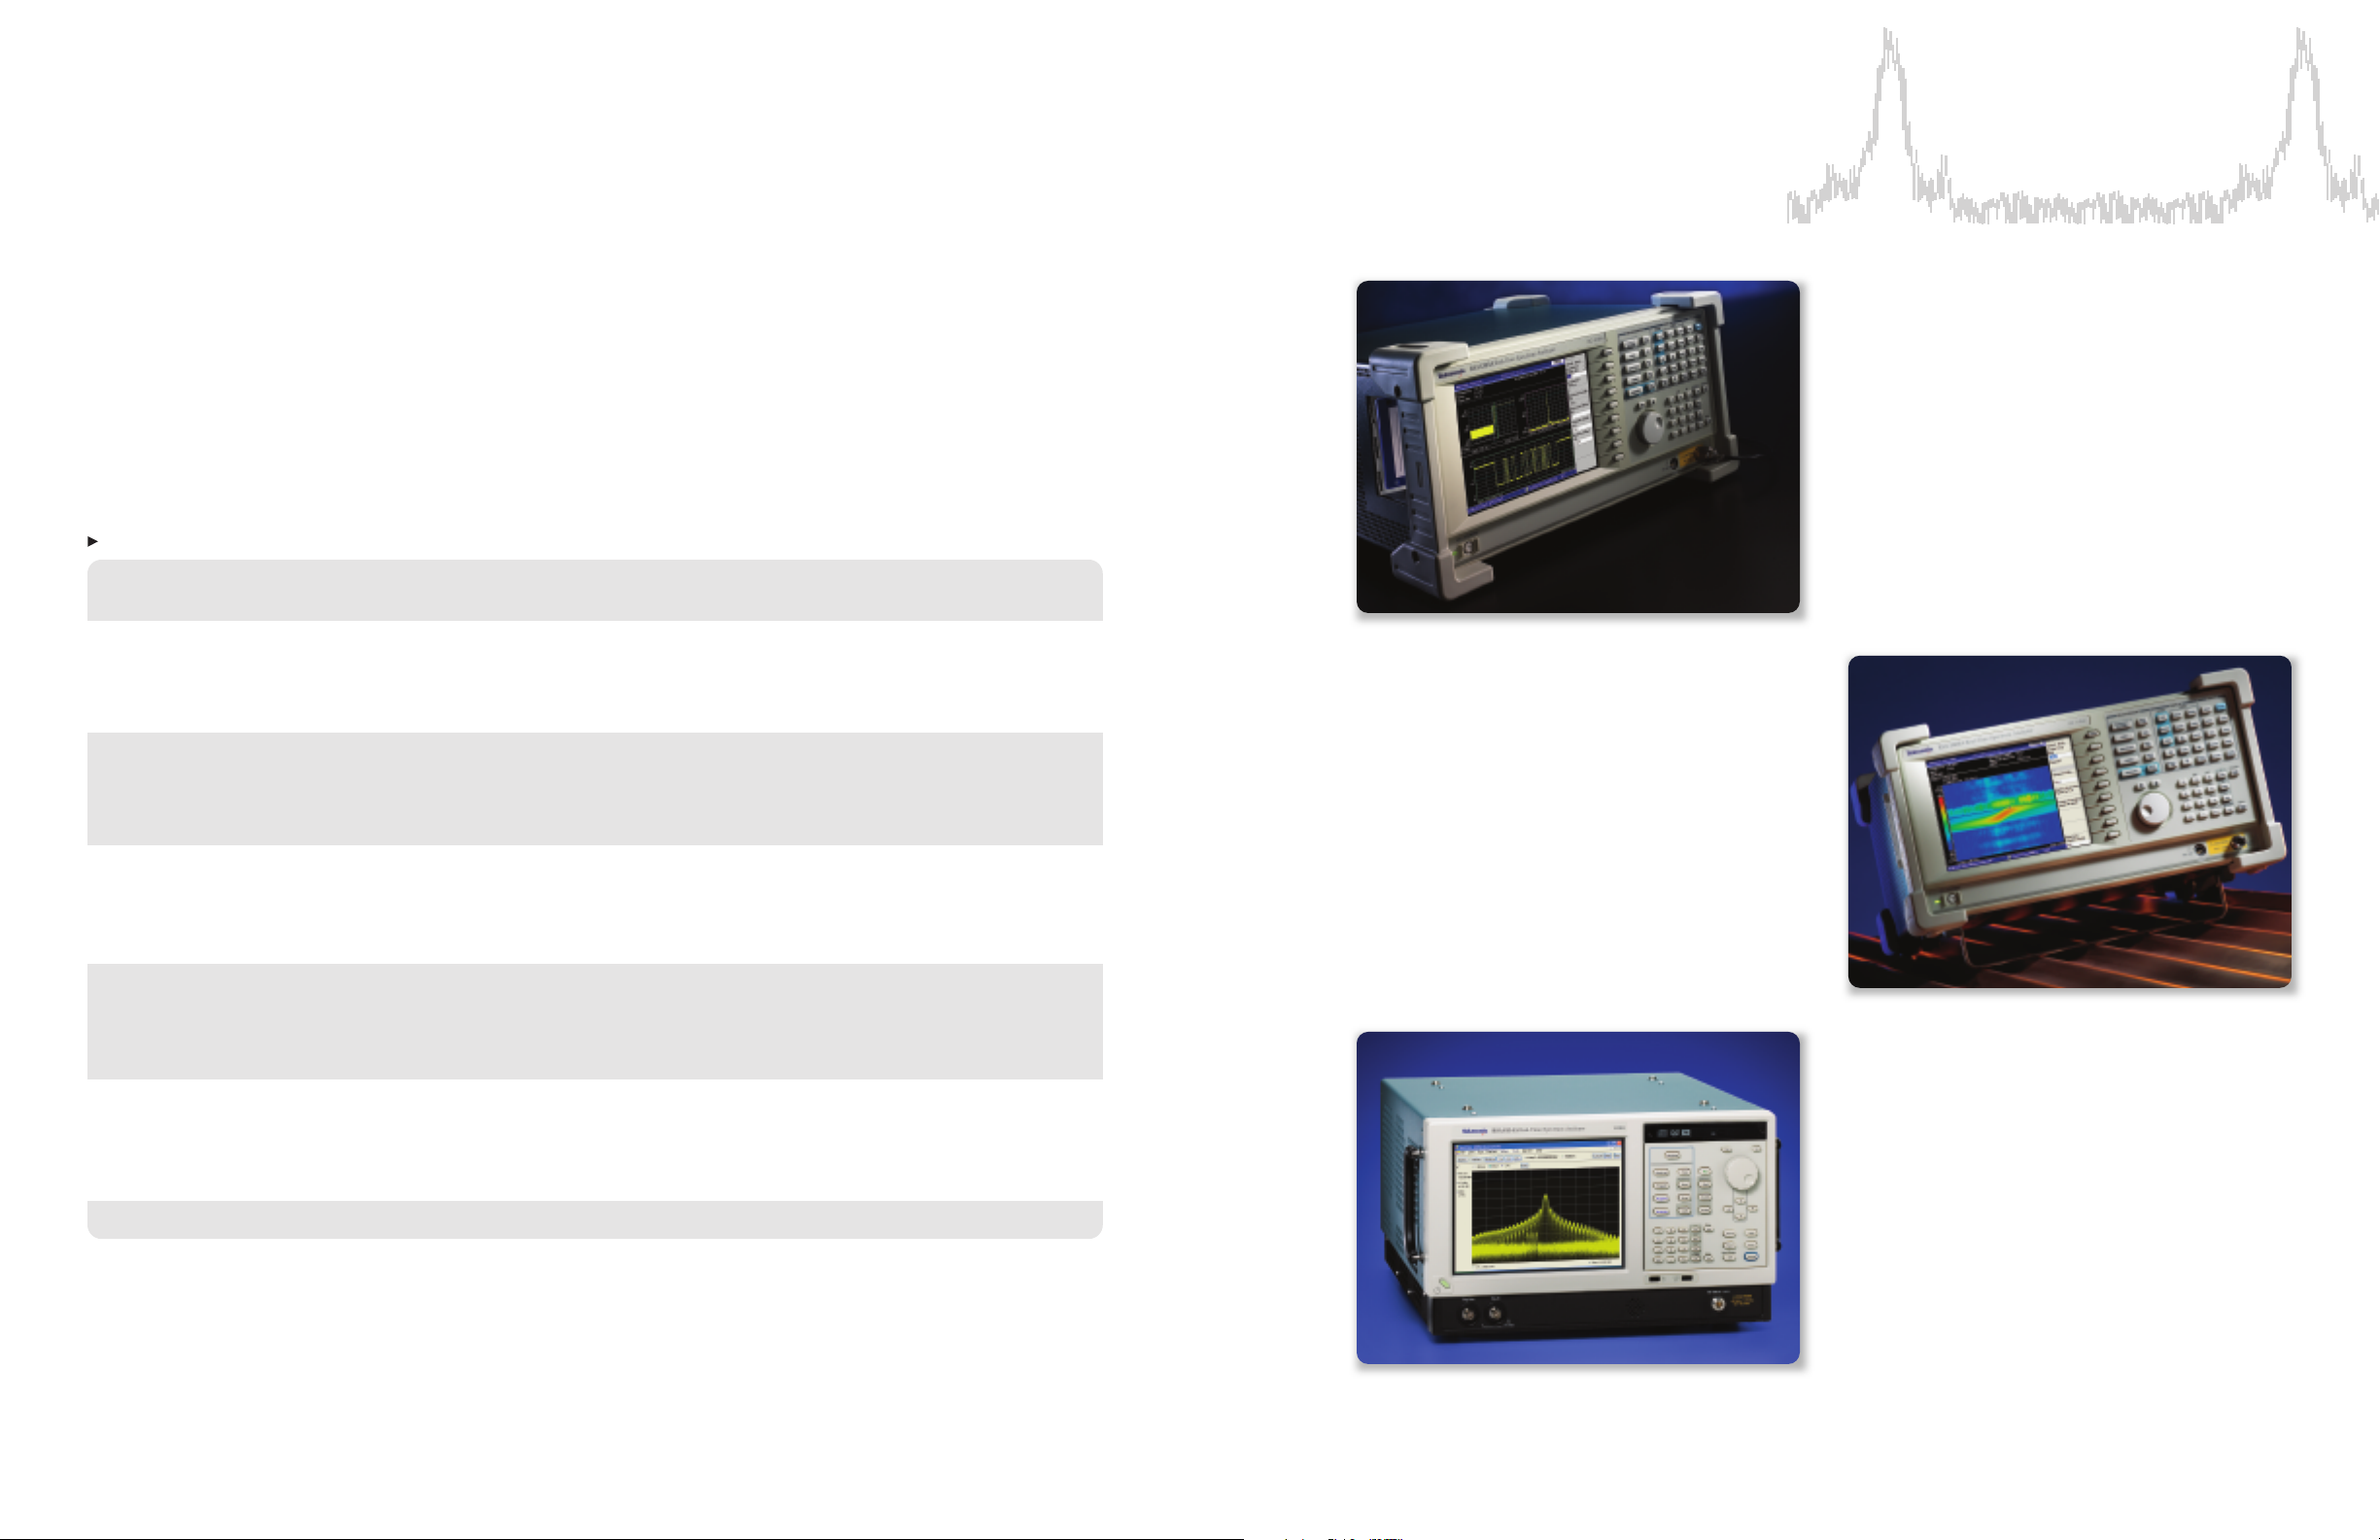
RSA3300A Series
With a single acquisition, the RSA3300A Series
captures a continuous time record of changing
RF events and enable time-correlated analysis
in the frequency, time and modulation domains.
Select Y
Model Series
RSA3303A
RSA3308A DC-8 GHz 64 MB, AM, FM 15 MHz IF Level,
RSA3408A DC-8 GHz 64 MB, AM, FM 36 MHz Power and
RSA6106A
RSA6114A
our Real-Time Spectrum Analyzer Performance
RTSA
Frequency Memory Modulation Real-Time Capture Triggering
Range Depth Analysis Bandwidth Modes
DC-3 GHz 64 MB, AM, FM 15 MHz IF Level,
9 kHz - 6.2 GHz
9 kHz - 14 GHz
256 MB optional
256 MB optional (ASK, FSK), PM, Power and
256 MB optional (ASK, FSK), PM, Opt. Frequency
256 MB,
1 GB optional Phase vs Time and 110 MHz optional Opt. Frequency
256 MB,
1 GB optional Phase vs Time and 110 MHz optional Opt. Frequency
(ASK, FSK), PM, Power and
Pulse Analysis; Opt. Frequency
optional general purpose Mask Trigger
digital mod analysis
Pulse Analysis; Opt. Frequency
optional general purpose Mask Trigger
digital mod analysis
Pulse Analysis; Mask Trigger
optional general purpose
digital mod analysis
Amplitude, Frequency, 40 MHz Power and
Advance Signal (Pulse)Analysis
optional general purpose
digital mod analysis
Amplitude, Frequency
Advance Signal (Pulse)Analysis
optional general purpose
digital mod analysis
, 40 MHz Power and
Mask Trigger
Mask T
rigger
RSA3408A Series
Get fast resolution to complex problems with
enhanced triggering, more capture bandwidth
and great analysis tools with the RSA3408A.
RSA6100A Series
The RSA6100A Series offers the revolutionary
®
spectrum display with an intuitive live
DPX
color view of signal transients changing over
time in the frequency domain, giving you
immediate confidence in the stability of your
design, or instantly displaying a fault when
it occurs.
2
.tektronix.com/rsa
www
RSA Real-T
ime Spectrum Analyzers
3
Page 3
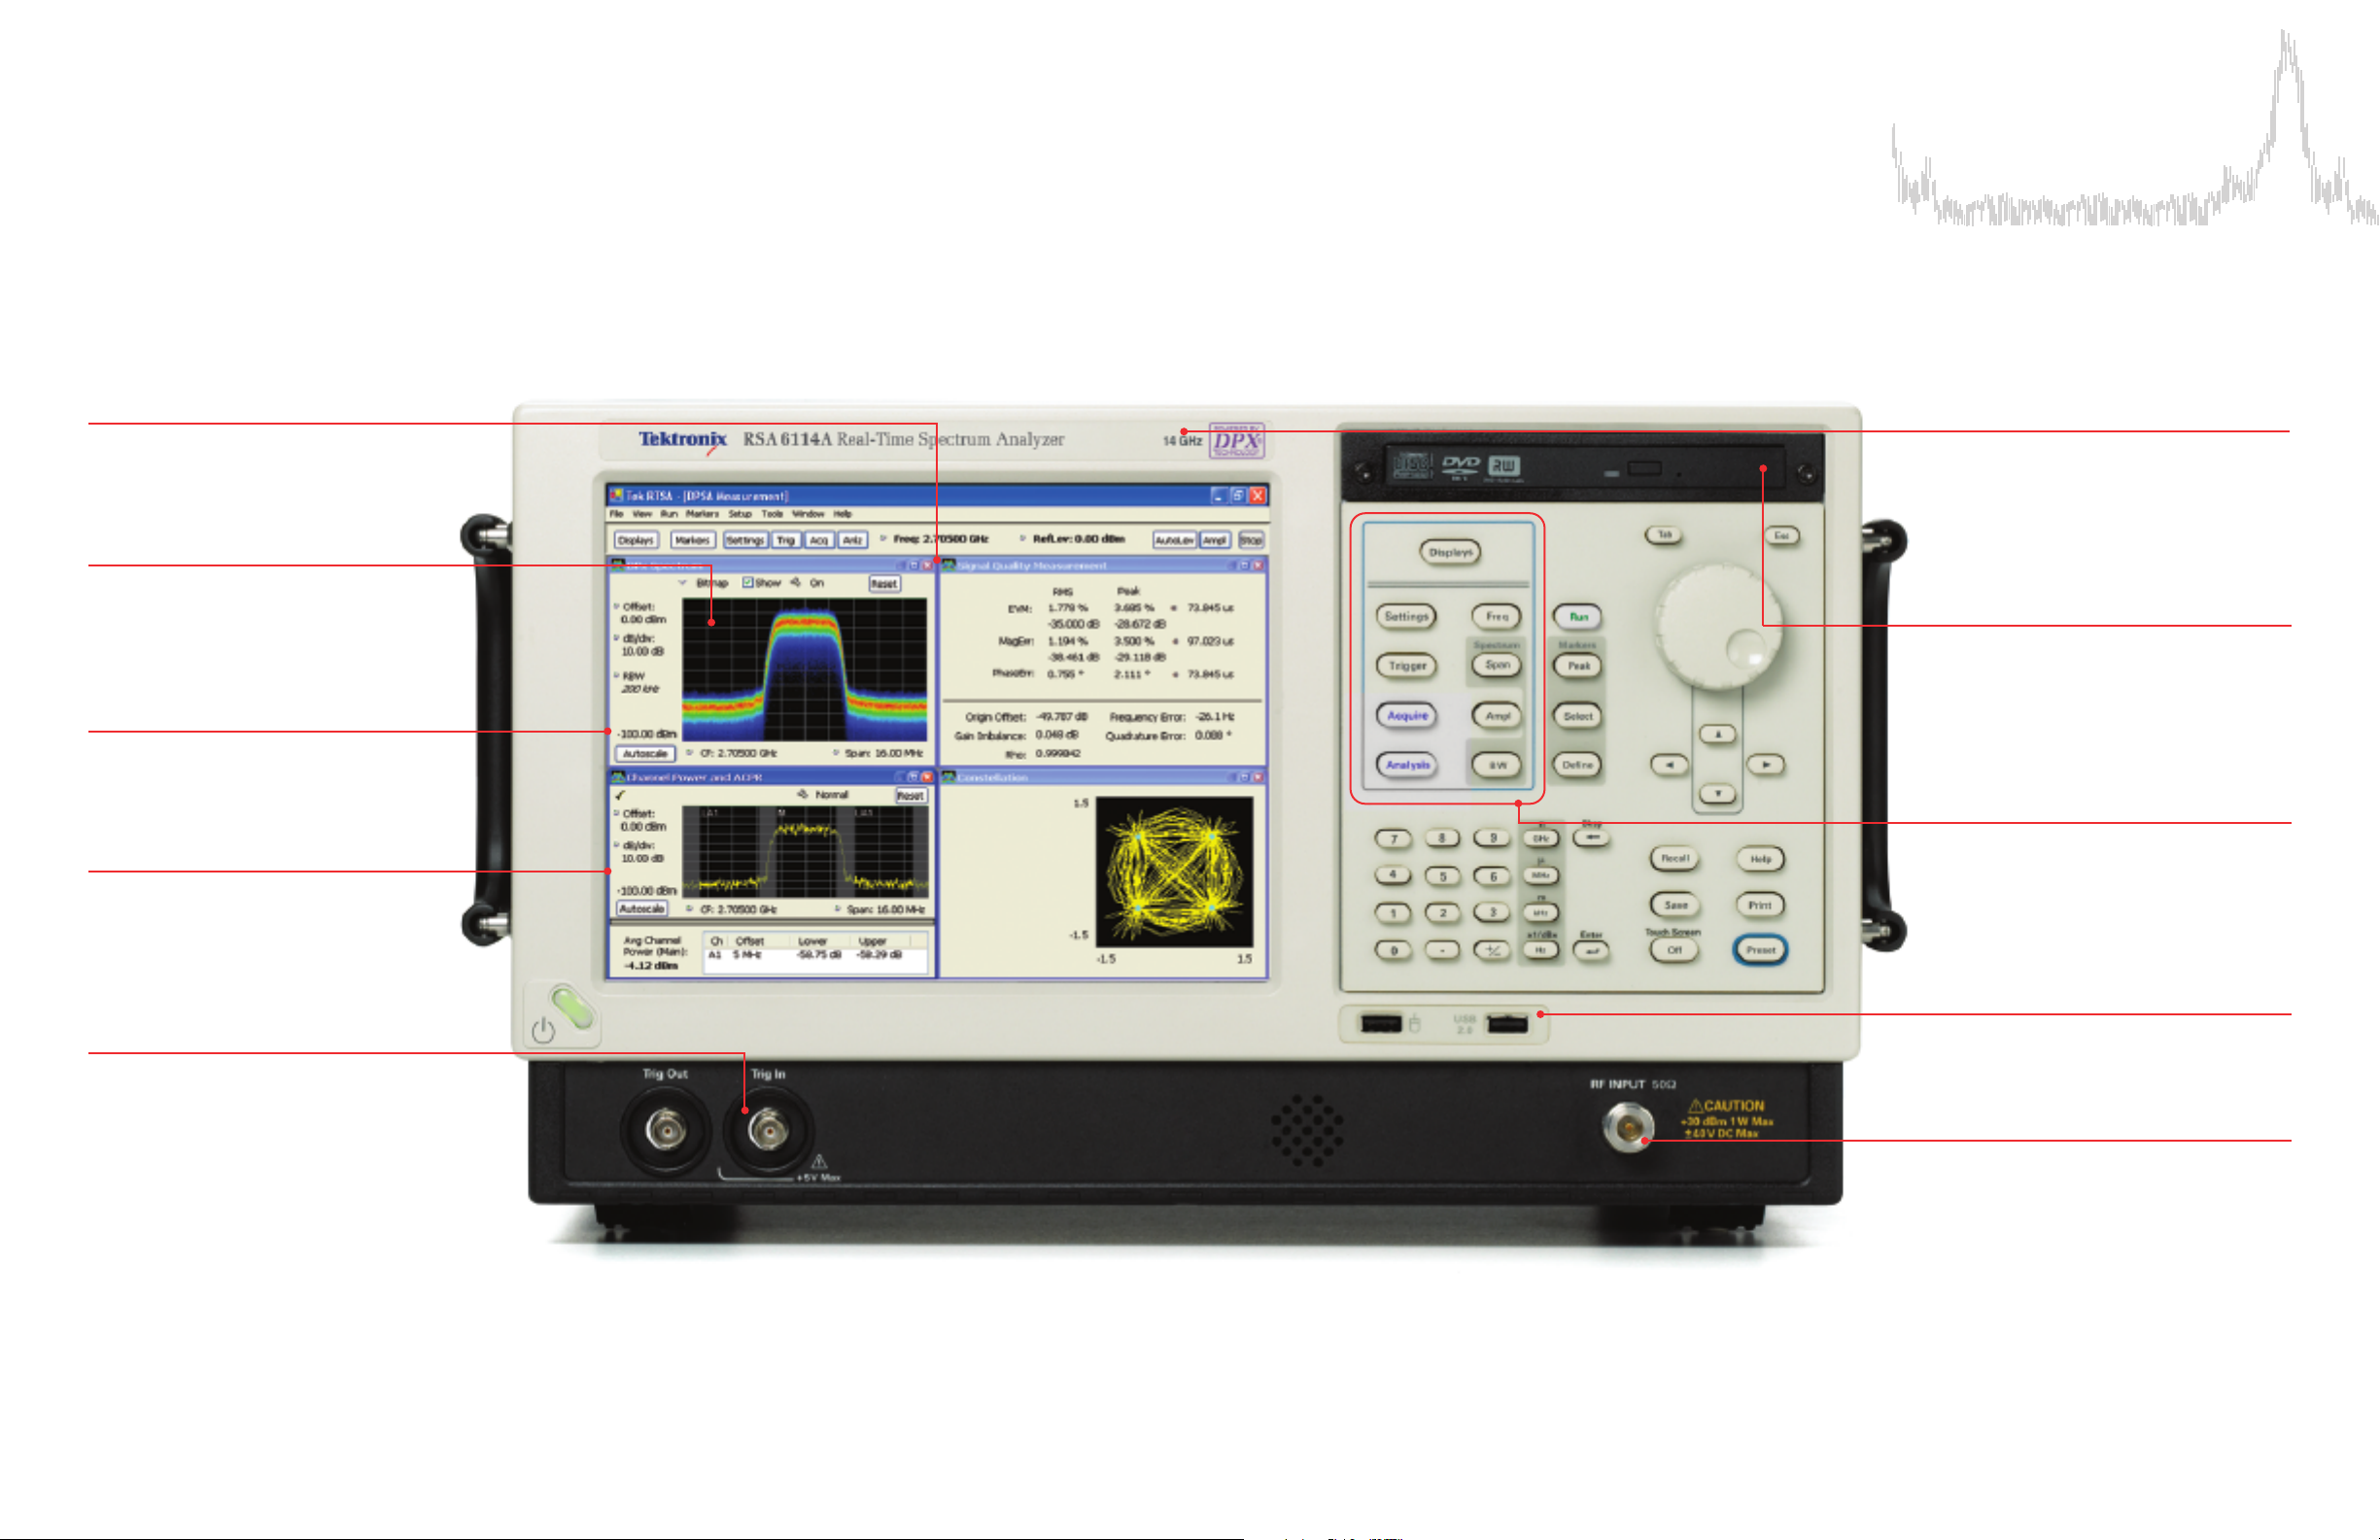
It’s Time to Get Real.
Completely Characterize Time-varying RF Signals
Multiple correlated views
in all domains (Frequency, Time,
Amplitude, Phase, Modulation)
with intuitive user interface.
Revolutionary DPX®spectrum
processing
troubleshooting and live transient
analysis.
Touch screen, mouse and front
panel controls
in the views.
Windows XP Operating System
with Tek OpenChoice®for easy file
operations, printing, Ethernet and
GPIB control, remote connections
and more.
wo external triggers
T
key event information (1 front, 1 rear).
for unmatched
directly adjust settings
to capture
Two frequency ranges:
9 kHz to 6.2 GHz (RSA6106A) or
9 kHz to 14 GHz (RSA6114A).
DVD ±RW (standard) for waveform
storage. Removable HDD (optional)
for data security.
Familiar spectrum analyzer
controls
acquisition and measurement
settings.
USB connections (2 front, 2 rear),
for mouse, keyboard and memory.
plus fast access to all
4
.tektronix.com/rsa
www
DC-Protected Input
40 V DC, over entire frequency
±
range, +30 dBm CW
Maximum.
RSA Real-T
ime Spectrum Analyzers
, 75W Pulse
5
Page 4

Discover
Easily Problems Using the Revolutionary DPX®Spectrum Display
Detection is the first step in understanding and resolving any problem relating to time-variant signals. As new
applications utilize wireless transmission, new channels crowd into available bandwidth, and RF systems become
digital-based, engineers need better tools to help them find and interpret complex behaviors and interactions.
ektronix’ patented Digital Phosphor technology, standard in our RSA6100A Series Real-Time Spectrum Analyzers,
T
reveals signal details that are completely missed by conventional spectrum analyzers and vector signal analyzers.
®
The DPX
accelerating discovery and diagnosis.
Spectrum’s live RF display shows signals never seen before, giving users instant insight and greatly
Revolutionary DPX spectrum display
reveals transient signal behavior that
helps you discover instability, glitches
and interference.
Infrequently occurring transient is seen
in detail. The frequency of occurrence is
color-graded, indicating the infrequent
transient event in blue and the noise
background in red.
Performing >48,000 frequency
transforms per second, transients as
brief as 24
in the frequency domain. This is a
1000-fold improvement over swept
analysis techniques. Events can be
color coded by rate of occurrence
onto a bitmapped display, providing
unparalleled insight into transient
signal behavior.
DPX Spectrum display after
5 seconds. Bitmap color mapping
is “Spectral”, to emphasize
infrequent signals with hot colors.
MaxHold trace is indicated in yellow.
µs in length are displayed
6
.tektronix.com/rsa
www
RSA Real-T
ime Spectrum Analyzers
7
Page 5

Trigger
the Only Spectrum Analyzers with Frequency Domain Triggering
Real-Time Spectrum Analyzers overcome the challenges associated with today’s complex RF signals with both
frequency and time domain event triggers. These advanced triggers provide the ability to capture a seamless
record of RF signals into memory and perform time-correlated, multi-domain analysis.
Unlike traditional swept spectrum analyzers, the Real-Time Spectrum Analyzer offers a Power Trigger with
user-settable span, enabling spectrum capture whenever the power of any signal crosses a user-defined
threshold. Tektronix’ exclusive Frequency Mask Trigger enables the capture of the spectrum of interest when
a discrete change in signal frequency, amplitude, or bandwidth occurs, or when a signal appears or disappears.
Frequency Mask Triggering occurs even if spectral events are detected at a much lower level than adjacent
signals. In addition, the flexibility of the Frequency Mask Trigger enables the creation of a customizable mask
that can monitor multiple different frequency bands within the analysis span.
Using the Frequency Mask Trigger and
Spectrogram to determine if interference with
specific WLAN packets is coming from a
Bluetooth transimitter or a microwave oven.
Frequency Mask Trigger can
catch unknown, transient
or low duty cycle signals in
a multi-signal spectrum
Point-click-and-drag editor
makes mask set-up easy
Trigger can be used in an
exceed threshold or “fall under”
threshold mode
Trigger position can be set to
designate what percentage of
the captured time record will
be pre-trigger and post-trigger
8
8
.tektronix.com/rsa
.tektronix.com/
www
www
RSA Real-T
ime Spectrum Analyzers
9
9
Page 6

Capture
Continously a Seamless Time Record of a Span of RF Frequencies
As the complexity of new RF components, devices and systems continues to increase, the ability to acquire and
store a record of time-variant RF signal activity and thoroughly analyze its unique behavior – over time, in multiple
domains – is becoming increasingly essential. Tektronix’ Real-Time Spectrum Analyzers meet these requirements
by seamlessly capturing and recording all the signals across a user-selected span – up to 110 MHz, depending
upon model used. Transient, pulsed and other time-variant signals are all captured as a seamless time record into
deep memory. Some models also include an option for streaming live IQ data to an output for external recording
and analysis.
User adjustable color scaling shows signal
amplitude transitions
Spectrogram showing oscillator
turn-on settling characteristic enables
measurement frequency variance
over time
Marker/delta markers provide signal amplitude,
frequency, frame number and time
Time
Frequency
Readouts show first and last spectra
(frame) displayed, with color scaling
that indicates amplitude
Spectrogram showing a pulsed AM signal...
measure spectral occupancy and amplitude,
timing between pulses. Also measure transient
signals at carrier turn-on time
rigger/pre-trigger time designation
T
10
.tektronix.com/rsa
www
RSA Real-T
ime Spectrum Analyzers
11
Page 7

Analyze
Complex RF Signals Completely
The analysis capabilities of the Real-T
in the frequency, time and modulation domains, enabling much faster resolution of complex problems that often
occur in today’s RF systems.
By acquiring a record of real-time signal behavior, the Real-Time Spectrum Analyzer supports numerous powerful
analysis tools. One example is the spectrogram display, which plots frequency and amplitude changes over time.
It provides an intuitive, three-dimensional display of the time-varying signal behavior, not seen in traditional frequency
domain plots. This view makes it easy to see phenomena such as modulation switching, signal hand-offs, frequency
hops and settling time between pulses, and changes in frequency over time.
In addition to providing time-correlated multi-domain analysis on a wide variety of signals, certain Tektronix Real-Time
Spectrum Analyzers support the latest mobile and wireless data standards, as well as providing a general purpose
digital modulation analysis on a wide variety of formats. With time-correlated views across the frequency, time and
modulation domains and a full range of analysis capabilities, you gain unprecedented insight into RF signal behavior
for complete characterization and quick problem-solving.
ime Spectrum Analyzer provide simultaneous time-correlated views of a signal
Time-correlated views relate EVM,
symbol value or constellation with
frequency vs. power or spectrogram
representation of a digital signal
View Multiple Domains At Your Convenience
Overview window: power vs. time
Sub-view window: choice of frequency vs.
amplitude, constellation, EVM, many other
displays
Color-keyed lines show timing of Main View
analysis and Sub-View spectrum analysis and
trigger time
Measurements are time-correlated
12
.tektronix.com/rsa
www
Automated measurements for EVM,
Magnitude Error
number where each measurement peaks
, Phase Error
, plus symbol
Settings for modulation
parameters, such as
symbol rate, measurement
filter and alpha/BW
product
Views for EVM vs. time,
eye diagram, constellation
(with and without transitions),
IQ amplitude (or frequency
for GFSK) vs. time
Modulation analysis for:
BPSK; QPSK; 16, 32, 64,
256 QAM; 8PSK;
GMSK; GFSK and more
π/4 DQPSK;
Main view window: time vs. amplitude,
time vs. frequency, time vs. phase,
many other views
RSA Real-T
ime Spectrum Analyzers
13
Page 8

Application
Solutions for Your Digital RF Challenges
Example Applications Benefiting from Key Standard Capabilities and Options
Analysis Feature
General Signal RF Communication Spectrum Radar & Pulsed SDR and
Analysis Systems Management Signals Cognitive Radio WiMAX WLAN RFID Cellular RSA6100A RSA34 08A RS A330 0A
DPX®Spectrum Processing X X X X X X X X X standard
Multi-Domain Correlation X X X X X X X X X standard standard standard
Hi-res Spectrogram X X X X X X X X X standard standard standard
eamplifier
nal Pr
Inter
External Preamplifier XX X optional optional
110 MHz Capture Bandwidth X X X X X optional
40 MHz Capture Bandwidth XX X X X standard
36 MHz Capture Bandwidth X X X X X X X X standard
15 MHz Capture Bandwidth X X X X X X X standard
Power Trigger X X X X X X X X standard optional optional
Frequency Mask Trigger X X X X X X X X X optional optional optional
General Purpose Modulation Analysis XX X X optional optional optional
Removable HDD X X optional optional
X
Applications Product Series
X
X optional
Digital IQ Output XXXX optional optional
Analog IF Output X X X X optional standard
Differential Analog IQ Input X X X X X optional optional
Pulsed RF Analysis XX XX optional optional
Advanced Analysis Pulsed Signal Suite X
AM/AM, AM/PM, 1 dB Compression XX XX X optional optional
Cellular Standards Analysis XX X X optional optional optional
802.11a/b/g/n Analysis XX X optional
RFID Analysis X optional optional
WiMAX Analysis X optional optional optional
14
.tektronix.com/rsa
www
X
X
optional
RSA Real-T
ime Spectrum Analyzers
15
Page 9

Contact Tektronix:
ASEAN / Australasia (65) 6356 3900
Austria +41 52 675 3777
Balkan, Israel, South Africa and other ISE Countries +41 52 675 3777
Belgium 07 81 60166
Brazil & South America (11)
Canada 1 (800) 661-5625
Central East Eur
ope, Ukraine and the Baltics
Central Europe & Greece +41 52 675 3777
Denmark +45 80 88 1401
Finland +41 52 675 3777
France +33 (0) 1 69 86 81 81
many
Ger
Hong Kong (852) 2585-6688
India (91) 80-22275577
Italy +39 (02) 25086 1
Japan 81 (3) 6714-3010
Luxembour
g
Mexico, Central America & Caribbean 52 (55) 5424700
Middle East, Asia and Nor
th Africa
The Netherlands 090 02 021797
People’s Republic of China 86 (10) 6235 1230
Poland +41 52 675 3777
Por
Republic of Korea 82 (2) 528-5299
Russia & CIS +7 (495) 7484900
South Africa +
Spain (+34) 901 988 054
Sweden 020 08 80371
Switzerland +41 52 675 3777
Taiwan 886 (2) 2722-9622
United Kingdom & Eire +44 (0) 1344 392400
USA 1 (800) 426-2200
For other areas contact Tektronix, Inc. at: 1 (503) 627-7111
Updated 15 September 2006
40669400
+41 52 675 3777
+49 (221) 94 77 400
+44 (0) 1344 392400
+41 52 675 3777
Norway 800 16098
tugal
80 08 12370
27 11 254 8360
For Further Information
onix maintains a compr
Tektr
collection of application notes, technical briefs and other
esources to help engineers working on the cutting edge of
r
ehensive, constantly expanding
technology. Please visit www.tektronix.com
Copyright © 2007, Tektronix. All rights reserved. Tektronix products are covered by
U.S. and for
sedes that in all previously published material. Specification and price change
privileges reserved. TEKTRONIX and TEK are registered trademarks of Tektronix,
Inc. All other trade names referenced are the service marks, trademarks or regis-
ed trademarks of their r
ter
03/07 DM/PT/ xxx 37W-19913-1
patents, issued and pending. Infor
eign
espective companies.
mation in this publication super
-
 Loading...