


xx
SignalVu™
ZZZ
Vector Signal Analysis Software
Printable Online Help
*P077022507*
077-0225-07


SignalVu™
Vector Signal Analysis Software
ZZZ
PrintableOnlineHelp
www.tektronix.com
077-0225-07

Copyright © Tektronix. All rights reserved. Licensed software products are owned by Tektronix or its
subsidiaries or suppliers, and are protected by national copyright laws and international treaty provisions.
Tektronix p roducts are covered by U.S. and foreign patents, issued and pending. Information in this
publication supersedes that in all previously published material. Specifications and price change privileges
reserved.
TEKTRONIX and TEK are registered trademarks of Tektronix, Inc.
Compiled Help part number 076-0177-07
Help version: October 29, 2013
Contacting Tektronix
Tektroni
14150 SW Karl Braun Drive
P. O . Box 5 00
Beaverton, OR 97077
USA
x, Inc.
For pro
duct information, sales, service, and technical support:
In North America, call 1-800-833-9200.
Worldwide, visit www.tektronix.com to find contacts in your area.

Table of Contents
Welcome
Welcome............................................................................................................. 1
About Tektronix Analyzer
Options
Options.......................................................................................................... 3
Documentation and Support
Documentation ................................................................................................. 3
Video Tutorials................................ ................................ ................................ . 3
Orientation
Connecting Signals and Selecting the Analysis Channel....................................................... 5
Front-Panel Controls ...................... ................................ .................................. ....... 5
Touch-Screen Actions.............................................................................................. 5
Elements of the Display............................................................................................ 9
Table of Contents
Operating Your Instrument
Presets... ................................ .................................. ................................ .......... 13
Setting Options. ... ... . .. . ... ... . .. . ... ... . .. . ... ... . .. . ... ... . .. . ... ... . .. . ... . .. . .. . ... . .. . ... ... . .. . ... ... . .. . ... 17
Using the Measurement Displays
Selecting Displays............... ................................ .................................. ................ 21
Taking Measurements
Measurements
Available Measurements............. ................................ ................................ ........ 23
General Signal Viewing
Overview ........................................................................................................... 31
Time Overview
Time Overview Display...................................................................................... 31
Time Overview Settings ..................................................................................... 33
Spectrum
Spectrum Display ..................... ................................ ................................ ........ 37
Spectrum Settings............................................................................................. 38
Spectrogram
Spectrogram Display ......................................................................................... 39
Spectrogram Settings .. ... . ... ... . .. . ... ... . .. . ... . .. . ... . .. . ... ... . .. . ... ... . .. . ... . .. . ... . .. . ... ... . .. . ... .. 42
SignalVu™ Vector Signal Analysis Software Printable Online Help i

Table of Contents
Amplitude Vs Time
Amplitude Vs Time Display................... ................................ .............................. 46
Amplitude Vs Time Settings .................. .................................. ............................ 47
Frequency Vs Time
Frequency Vs Time Display................................................................................. 48
Frequency Vs Time Settings.. . .. . ... ... . .. . ... ... . .. . .. . ... ... . .. . .. . ... ... . .. . ... ... . .. . .. . ... ... . .. . ... ... 49
Phase Vs Time
Phase Vs Time Display....................................................................................... 50
Phase Vs Time Settings . ... ... . .. . ... ... . .. . ... ... . .. . ... ... . .. . .. . ... ... . .. . .. . ... ... . .. . ... ... . .. . ... ... . .. 51
RF I & Q Vs Time
RF I & Q vs Time Display................................................................................... 52
RF I & Q vs Time Settings.. . .. . ... ... . .. . .. . ... ... . .. . ... ... ... . .. . ... ... . .. . ... ... . .. . .. . ... ... . .. . .. . ... .. 53
Common Controls for General Signal Viewing Displays
General Signal Viewing Shared Measurement Settings .. . ... ... . .. . ... ... . .. . ... ... . .. . ... ... . .. . ... ... . 54
Analog Modulation
Overview ........................................................................................................... 65
AM
AM Display ......................... ................................ ................................ .......... 65
AM Settings ................................................................................................... 66
FM
FM Display.................................................................................................... 72
FM Settings.. . .. . .. . ... ... . .. . ... ... . .. . ... ... ... . .. . ... ... ... . .. . ... ... . .. . ... ... . .. . .. . ... ... . .. . .. . ... ... . .. 74
PM
PM Display.................................................................................................... 80
PM Settings.. . .. . .. . ... ... . .. . ... ... . .. . ... ... ... . .. . ... ... ... . .. . ... ... . .. . ... ... . .. . .. . ... ... . .. . .. . ... ... . .. 82
RF Measurements
Overview ........................................................................................................... 89
Channel Power and ACPR
Channel Power and ACPR (Adjacent Channel Power Ratio) Display...................... ............ 89
Channel Power and ACPR Settings ........................ ................................ ................ 92
MCPR
MCPR (Multiple Carrier Power Ratio) Display . ... . ... ... . ... ... . .. . ... . .. . ... . .. . ... ... . .. . ... . .. . ... . .. 95
MCPR Settings............................................ ................................ .................... 98
Occupied BW & x dB BW
Occupied BW & x dB BW Display..................... ................................ .................. 104
Occupied BW & x dB BW Settings . . ... . .. . ... ... . .. . ... ... . ... ... . ... ... . .. . ... ... . ... ... . .. . ... . .. . ... 107
Spurious
Spurious Display............................................................................................ 108
Spurious Display Settings. ... ... . .. . ... ... . .. . .. . ... ... ... . .. . ... ... . .. . .. . ... ... ... . .. . ... ... . .. . .. . ... ... 112
CCDF
ii SignalVu™ Vector Signal Analysis Software Printable Online Help

CCDF Display............................................................................................... 119
CCDF Settings ... . .. . ... ... . ... ... . ... ... . .. . ... ... . ... ... . .. . ... . .. . ... ... . .. . ... . .. . ... . .. . ... ... . .. . ... . . 120
Settling Time Measurements
Settling Time Measurement Overview .. . ... ... . .. . ... . .. . ... ... . .. . ... ... . .. . ... ... . .. . ... . .. . ... ... . .. . 121
Settling Time Displays
Settling Time Displays . . .. . ... ... . .. . ... ... . .. . ... ... . .. . ... ... . .. . ... ... . .. . ... ... . .. . ... . .. . ... ... . .. . ... 126
Settling Time Settings . ... ... . .. . ... ... . .. . ... ... ... . .. . ... ... ... . .. . ... ... . .. . ... ... . .. . .. . ... ... . .. . .. . ... 133
Common Controls for Settling Time Displays
Settling Time Displays Shared Measurement Settings . . ... ... . .. . ... ... . .. . ... ... . .. . ... ... . .. . ... ... . 133
SEM (Spectrum Emission Mask)
SEM Display ................................................................................................ 141
Spectrum Emission Mask Settings . .. . ... ... . .. . ... ... . .. . ... ... . .. . .. . ... . .. . .. . ... ... . .. . ... ... . .. . ... .. 144
Common C ontrols for RF Measurements Displays
RF Measurements Shared Measurement Settings .. . ... . .. . ... ... . .. . ... ... . .. . ... ... . .. . ... ... . .. . ... .. 151
WLAN Measurements
WLAN Overview........ ................................ .................................. ...................... 159
WLAN Chan Response
WLAN Channel Response Display ................. ................................ ...................... 161
WLAN Channel Response Settings.. . ... ... . .. . ... ... . .. . ... ... . .. . ... ... . .. . ... . .. . ... ... . .. . ... ... . .. . . 163
WLAN Constellation
WLAN Constellation Display............................................................................. 164
WLAN Constellation Settings............................................................................. 165
WLAN EVM
WLAN EVM Display ............ ................................ ................................ .......... 166
WLAN EVM Settings. ... . ... ... . .. . ... ... . ... ... . ... ... . .. . ... ... . .. . ... . .. . ... . .. . ... ... . .. . ... . .. . ... . .. 167
WLAN Mag Error
WLAN Magnitude Error Display......................................................................... 168
WLAN Magnitude Error Settings......................................................................... 169
WLAN Phase Error
WLAN Phase Error Display............................................................................... 170
WLAN Phase Error Settings . .. . ... ... . .. . ... ... . .. . ... ... . .. . ... . .. . ... ... . .. . ... ... . ... ... . .. . ... ... . .. . . 171
WLAN Power vs Time
WLAN Power vs Time Display ........................................................................... 172
WLAN Power vs Time Settings........................................................................... 174
WLAN Spectral Flatness
WLAN Spectral Flatness Display................. ................................ ........................ 175
WLAN Spectral Flatness Settings ... ... . .. . ... ... . .. . ... ... . .. . ... ... . .. . ... ... . .. . ... ... . .. . ... . .. . .. . .. 176
WLAN Summary
WLAN Summary Display ................................................................................. 177
WLAN Summary Settings................................................................................. 181
WLAN Symb Table
Table of Contents
SignalVu™ Vector Signal Analysis Software Printable Online Help iii

Table of Contents
WLAN Symbol Table Display .. .................................. ................................ ........ 182
WLAN Symbol Table Settings .. . ... ... . .. . ... . .. . ... ... . ... ... . .. . ... ... . .. . ... ... . .. . ... . .. . ... ... . ... .. 184
Common Controls for WLAN Analysis Displays
WLAN Analysis Shared Measurement Settings .. . .. . ... ... . .. . ... . .. . .. . ... . .. . ... ... . .. . ... ... . .. . ... 184
OFDM Analysis
Overview ......................................................................................................... 195
OFDM Chan Response
OFDM Channel Response Display ..................... .................................. ................ 195
OFDM Channel Response Settings . ... . .. . ... ... . .. . ... ... . .. . ... ... . .. . ... ... . .. . ... ... . .. . ... ... . .. . ... 197
OFDM Constellation
OFDM Constellation Display ............................................................................. 198
OFDM Constellation Settings ............................................................................. 199
OFDM EVM
OFDM EVM Display ................ ................................ .................................. .... 199
OFDM EVM Settings .. . ... ... . .. . ... ... . .. . ... ... . ... ... . .. . ... ... . ... ... . .. . ... ... . .. . ... ... . ... ... . .. . .. 200
OFDM Flatness
OFDM Spectral Flatness Display ......... ................................ ................................ 201
OFDM Spectral Flatness Settings . ... ... . .. . ... ... . .. . ... ... . .. . .. . ... ... . .. . ... ... . .. . ... ... . .. . ... ... . .. 202
OFDM Mag Error
OFDM Magnitude Error Display ......................................................................... 203
OFDM Magnitude Error Settings ......................................................................... 204
OFDM Phase Error
OFDM Phase Error Display ............................................................................... 205
OFDM Phase Error Settings . . .. . ... . .. . ... ... . .. . ... ... . .. . ... ... . .. . ... ... . .. . ... ... . .. . ... . .. . ... ... . .. . 206
OFDM Power
OFDM Power Display ..................................................................................... 207
OFDM Power Settings .. ... . .. . ... ... . .. . ... ... . .. . ... . .. . ... ... . .. . ... ... . .. . ... ... . .. . ... ... . .. . ... ... . .. 208
OFDM Summary
OFDM Summary Display............................ .................................. .................... 209
OFDM Summary Settings ................................................................................. 211
OFDM Symb Table
OFDM Symbol Table Display............................................................................. 212
OFDM Symbol Table Settings . ... . ... ... . .. . ... ... . .. . ... . .. . ... ... . ... ... . .. . ... ... . .. . ... . .. . ... ... . ... 213
Common Controls for OFDM Analysis Displays
OFDM Analysis Shared Measurement Settings . .. . ... ... . .. . ... ... . .. . ... . .. . .. . ... . .. . ... ... . .. . ... ... 213
Pulsed RF
Overview ......................................................................................................... 221
Pulse Table Display
Pulse Table Display....................... .................................. ................................ 221
Pulse Table Settings .. . ... . .. . ... ... . .. . ... ... . .. . ... . .. . ... ... . .. . ... ... . .. . ... ... . .. . ... ... . .. . ... ... . .. . . 222
iv SignalVu™ Vector Signal Analysis Software Printable Online Help

Pulse Trace Display
Pulse Trace Display................................. ................................ ........................ 223
Pulse Trace Settings .. . .. . ... ... ... . .. . ... ... . .. . .. . ... ... . .. . .. . ... ... . .. . .. . ... ... . .. . .. . ... ... . .. . ... ... . 225
Pulse Statistics
Pulse Statistics Display..................................................................................... 225
Pulse Statistics Settings . . .. . ... ... . .. . ... ... . .. . ... ... . .. . ... ... . .. . ... ... . .. . ... ... . .. . .. . ... . .. . .. . ... ... 227
Common Controls for P
Pulsed RF Shared Measurement Settings ................................ ................................ 227
Audio Analysis
Overview ......................................................................................................... 239
Audio Spectrum
Audio Spectrum Display................................................................................... 239
Audio Spectrum Settings. . ... ... . .. . ... ... . .. . .. . ... ... . .. . ... ... . .. . ... ... . .. . .. . ... ... . .. . ... ... . .. . ... .. 240
Audio Summary
Audio Summary Display........................................... ................................ ........ 241
Audio Summary Settings . ... . .. . ... ... ... . .. . ... ... . .. . ... ... . .. . .. . ... ... . .. . .. . ... ... . .. . ... ... . .. . ... .. 242
Common Controls for Audio Analysis Displays
Audio Analysis Measurement Settings................................................................... 243
Table of Contents
ulsed RF Displays
GP Digital Modulation
Overview ......................................................................................................... 253
Constellation
Constellation Display....................................................................................... 254
Constellation Settings ... ... . .. . ... . .. . ... ... . .. . ... ... . .. . ... . .. . ... ... . .. . ... . .. . ... ... . .. . ... ... . .. . ... . . 255
Demod I & Q vs Time
Demod I & Q vs Time Display............................................................................ 256
Demod I & Q vs Time Settings ........................................................................... 258
EVM vs Time
EVM vs Time Display...................... ................................ ................................ 258
EVM vs Time Settings . . ... ... . .. . ... ... . .. . ... ... . .. . ... ... . .. . ... ... . .. . ... . .. . ... ... . .. . ... ... . .. . ... . .. 259
Eye Diagram
Eye Diagram Display........................... ................................ ............................ 260
Eye Diagram Settings .. ... . .. . ... ... . .. . .. . .. . ... ... . .. . ... ... ... . .. . .. . ... ... . .. . .. . ... ... ... . .. . ... ... . .. 261
Frequency Deviation vs Time
Frequency Deviation vs Time Display ................................................................... 262
Frequency Deviation vs Time Settings . . ... ... . .. . ... ... ... . .. . ... ... ... . .. . ... ... . .. . ... ... . .. . .. . ... ... 264
Magnitude Error vs Time
Magnitude Error vs Time Display .............. ................................ .......................... 264
Magnitude Error vs Time Settings ................ ................................ ........................ 266
Phase Error vs Time
Phase Error vs Time Display .......... ................................ .................................. .. 266
SignalVu™ Vector Signal Analysis Software Printable Online Help v

Table of Contents
Phase Error vs. Time Settings . . ... ... . .. . .. . .. . ... ... . .. . ... ... ... . .. . .. . ... ... . .. . .. . ... ... ... . .. . ... ... . 268
Signal Quality
Signal Quality Display .. . .. . ... ... . .. . ... ... . .. . ... ... . .. . ... ... . ... ... . .. . ... ... . ... ... . .. . ... ... . .. . ... .. 268
Signal Quality Settings . ... ... . .. . ... ... . .. . ... . .. . ... ... . .. . ... ... . .. . ... ... . .. . ... ... . .. . ... ... . .. . ... ... . 273
Symbol Table
Symbol Table Display.............................. ................................ ........................ 274
Symbol Table Setting
Trellis Diagram
Trellis Diagram Display.. ... . .. . ... ... . .. . ... ... . .. . ... ... . .. . .. . ... . .. . .. . ... ... . .. . ... ... . .. . ... ... . .. . .. 275
Trellis Diagram Settings . . .. . ... ... . .. . ... ... . .. . ... ... . .. . ... ... . .. . ... ... . .. . ... ... . .. . ... . .. . .. . ... . .. . . 277
Common Controls for GP Digital Modulation Displays
GP Digital Modulation Shared Measurement Settings ................................................. 277
Standard Settings Button.. . ... . .. . ... ... . .. . ... ... . .. . ... . .. . ... . .. . ... ... . .. . ... ... . ... ... . .. . ... . .. . ... .. 278
Symbol Maps
Symbol Maps.................... .................................. ................................ .......... 294
User Filters
Overview: User Defined Measurement and Reference Filters. . ... . .. . ... ... . .. . ... ... . .. . ... . .. . ... .. 299
User Filter File Format . ... . .. . ... ... . .. . ... ... . .. . ... ... . .. . ... ... . .. . ... ... . .. . ... ... . .. . ... ... . .. . ... ... . 300
s...................................................................................... 275
Marker Measurements
Using Markers
Using Markers............................................................................................... 303
Controlling Markers with the Touchscreen Actions Menu . .. . ... ... . .. . ... ... . .. . ... ... . .. . ... ... . .. . . 303
Measuring Frequency and Power in the Spectrum Display ........ ................................ .... 306
Common Marker Actions
Marker Action Controls ................................. ................................ .............. 307
Peak.................................. .................................. ................................ .. 307
Next Peak ............................................................................................... 307
Marker to Center Frequency.......................................................................... 307
Sync Scope C1/C2 to Active Marker ................................................................ 307
Define Markers Control Panel
Enabling Markers and Setting Marker Properties ... . .. . .. . ... . .. . .. . ... ... . .. . ... ... . .. . ... ... . .. . 308
Markers Toolbar
Using the Markers Toolbar.................................... ................................ ........ 309
Noise Markers in the Spectrum Display
Using Noise Markers in the Spectrum Display ............. ................................ ........ 310
Search (Limits Testing)
The Search Tool (Limits Testing)................................ .................................. ............ 313
Search (Limits Testing) Settings .. . .. . ... ... . .. . ... ... . .. . ... . .. . ... ... . .. . ... ... . .. . ... . .. . ... ... . .. . ... ... . .. 313
Define Tab (Search) ..................... ................................ ................................ ........ 313
Actions Tab....................................... ................................ ................................ 317
vi SignalVu™ Vector Signal Analysis Software Printable Online Help

Analyzing Data
Analysis Settings
Analysis Settings.. .................................. ................................ ........................ 319
Analysis Time Tab.......................................................................................... 319
Spectrum Time Tab................... .................................. ................................ .... 321
Frequency Tab............................................................................................... 321
Units Tab................................. ................................ .................................. .. 324
Analyzing Data Using Replay
Replay Overview ........................................................................................... 325
Replay Menu .................. ................................ .................................. ............ 327
Acq Data..................... ................................ ................................ ................ 327
Replay All Selected Records .. ................................ .................................. .......... 327
Replay Current Record..................................................................................... 328
Replay from Selected....................... ................................ ................................ 328
Pause ............... .................................. ................................ ........................ 328
Stop........................................................................................................... 328
Select All .................................................................................................... 328
Select Records from History............................................................................... 328
Replay Toolbar .............................................................................................. 329
Table of Contents
Amplitude Corrections
Amplitude Settings . ... ... . .. . ... ... . .. . ... ... . .. . .. . ... ... . .. . .. . ... ... . .. . ... ... . .. . ... ... . .. . ... ... . .. . .. . ... . 331
External Gain/Loss Correction Tab........................................ ................................ .... 331
External Gain Value ........................................................................................ 331
Apply External Corrections To........ .................................. ................................ .. 332
External Loss Tables ....................................................................................... 332
Controlling the Acquisition of Data
Acquisition Controls in the Run Menu
Continuous Versus Single Sequence.......................................... ............................ 335
Run ................... ................................ ................................ ........................ 335
Resume....................................................................................................... 335
Abort ............... .................................. ................................ ........................ 335
Acquisition Controls in the Acquire Control Panel
Acquire....................................................................................................... 336
Vertical ....................................................................................................... 336
IQ Sampling Parameters ................................................................................... 338
Scope Settings. . .. . .. . ... ... . .. . ... ... . .. . ... ... . .. . ... ... . .. . .. . ... ... . .. . ... ... ... . .. . ... ... . .. . ... ... . .. . . 339
Scope Data Tab.......... ................................ ................................ .................... 340
Managing Data, Settings, and Pictures
Saving and Recalling Data, Settings, and Pictures.. . .. . ... ... . .. . ... ... . .. . ... . .. . ... . .. . ... ... . .. . ... ... . .. 341
SignalVu™ Vector Signal Analysis Software Printable Online Help vii

Table of Contents
Data, Settings, and Picture File Formats .. . ... ... . .. . ... . .. . ... ... . ... ... . .. . ... ... . .. . ... . .. . ... . .. . ... ... . .. 343
Printing Screen Shots ........................................................................................... 347
Reference
Online Help ...................................................................................................... 349
About the Vector Signal Analysis Software .............. .................................. .................. 349
Menus
Menu Overview............................................................................................. 350
File Menu
View Menu
Run
Replay
Markers Menu
Setup Menu
Presets Menu
Tools Menu
Window Menu
Help Menu
Troubleshooting
Error and Information Messages .......... .................................. .............................. 360
Displaying the Windows Event Viewer .................................................................. 367
Dealing with Sluggish Instrument Operation ............................................................ 369
Upgrading the Instrument Software
How to Find Out If Instrument Software Upgrades Are Available.................................... 369
Changing Settings
Settings. . .. . .. . ... ... ... . .. . .. . ... ... ... ... . .. . .. . ... ... ... . .. . .. . .. . ... ... . .. . .. . .. . ... ... . .. . .. . .. . ... ... ... 370
File Menu ............................................................................................... 351
View Menu ............................................................................................. 355
Menu
Run Menu........................................... ................................ .................... 356
Replay Menu ........................................................................................... 358
Markers Menu.......................................................................................... 358
Setup Menu................... ................................ .................................. ........ 358
Presets Menu ........... .................................. ................................ .............. 358
Application Presets ................ .................................. ................................ .. 359
Tools Menu ........................... ................................ ................................ .. 359
Window Menu........................ .................................. ................................ 360
Help Menu ................ ................................ ................................ .............. 360
Glossary
Index
viii SignalVu™ Vector Signal Analysis Software Printable Online Help

Welcome Welco m e
Welcome
This help provides in-depth information on how to use the SignalVu™ and SignalVu-PC Vector Signal
Analysis Software. This help is also available in a PDF format for printing.
NOTE. Most of
software version that runs on the RSA5100A Real-time Signal Analyzers. These instruments support
additional hardware-based functionality and buttons, such as Trig, that are not present in the SignalVu™
or SignalVu-PC application.
the screen illustrations in this document are taken from the vector signal analysis
SignalVu™ Vector Signal Analysis Software Printable Online Help 1

Welcome Welcome
2 SignalVu™ Vector Signal Analysis Software Printable Online Help

About Tektronix Analyzer Options
Options
To view a listing of the software options installed in your software, select Help > About Your Tektronix
Vector Signal Analysis Software.
Options can be added to your software. For the latest information on available option upgrades, see
the Tektronix Web site
.
Documentation
In addition to the help, the following documents are available:
SignalVu Reference (Tektronix part number 077-0224-XX). This document provides a brief overview
of the SignalVu software. It identifies elements of the SignalVu screen, elements of different displays
andincludesamenutree. TheReferenceManualisprovidedasaprintablePDFfile.
SignalVu Programmer Manual (077-0223-XX). This document provides supplementary information
about the remote commands for the SignalVu software. The Programmer Manual is provided as a
printable PDF file. For detailed descriptions of the remote commands, see the RSA6100B Series
Real-Time Spectrum Analyzers, RSA5100A Series Real-Time Signal Analyzers Programmer Manua
(077-0523-XX) and the DPO7000, DPO70000B/C, DSA70000B/C, MSO70000/C, MSO5000, and
DPO5000 Series Digital Oscilloscopes Programmer Manual (077-0010-10 or later).
l
SignalVu Printable Help Document (PDF) (077-0225-XX). A PDF file version of the help that
can easily be printed.
The SignalVu documentation PDFs are located on the Optional Applications Software for Windows-Based
Oscilloscopes DVD.
The most recent versions of the product documentation, in PDF format, can be downloaded from
www.tektronix.com/manuals
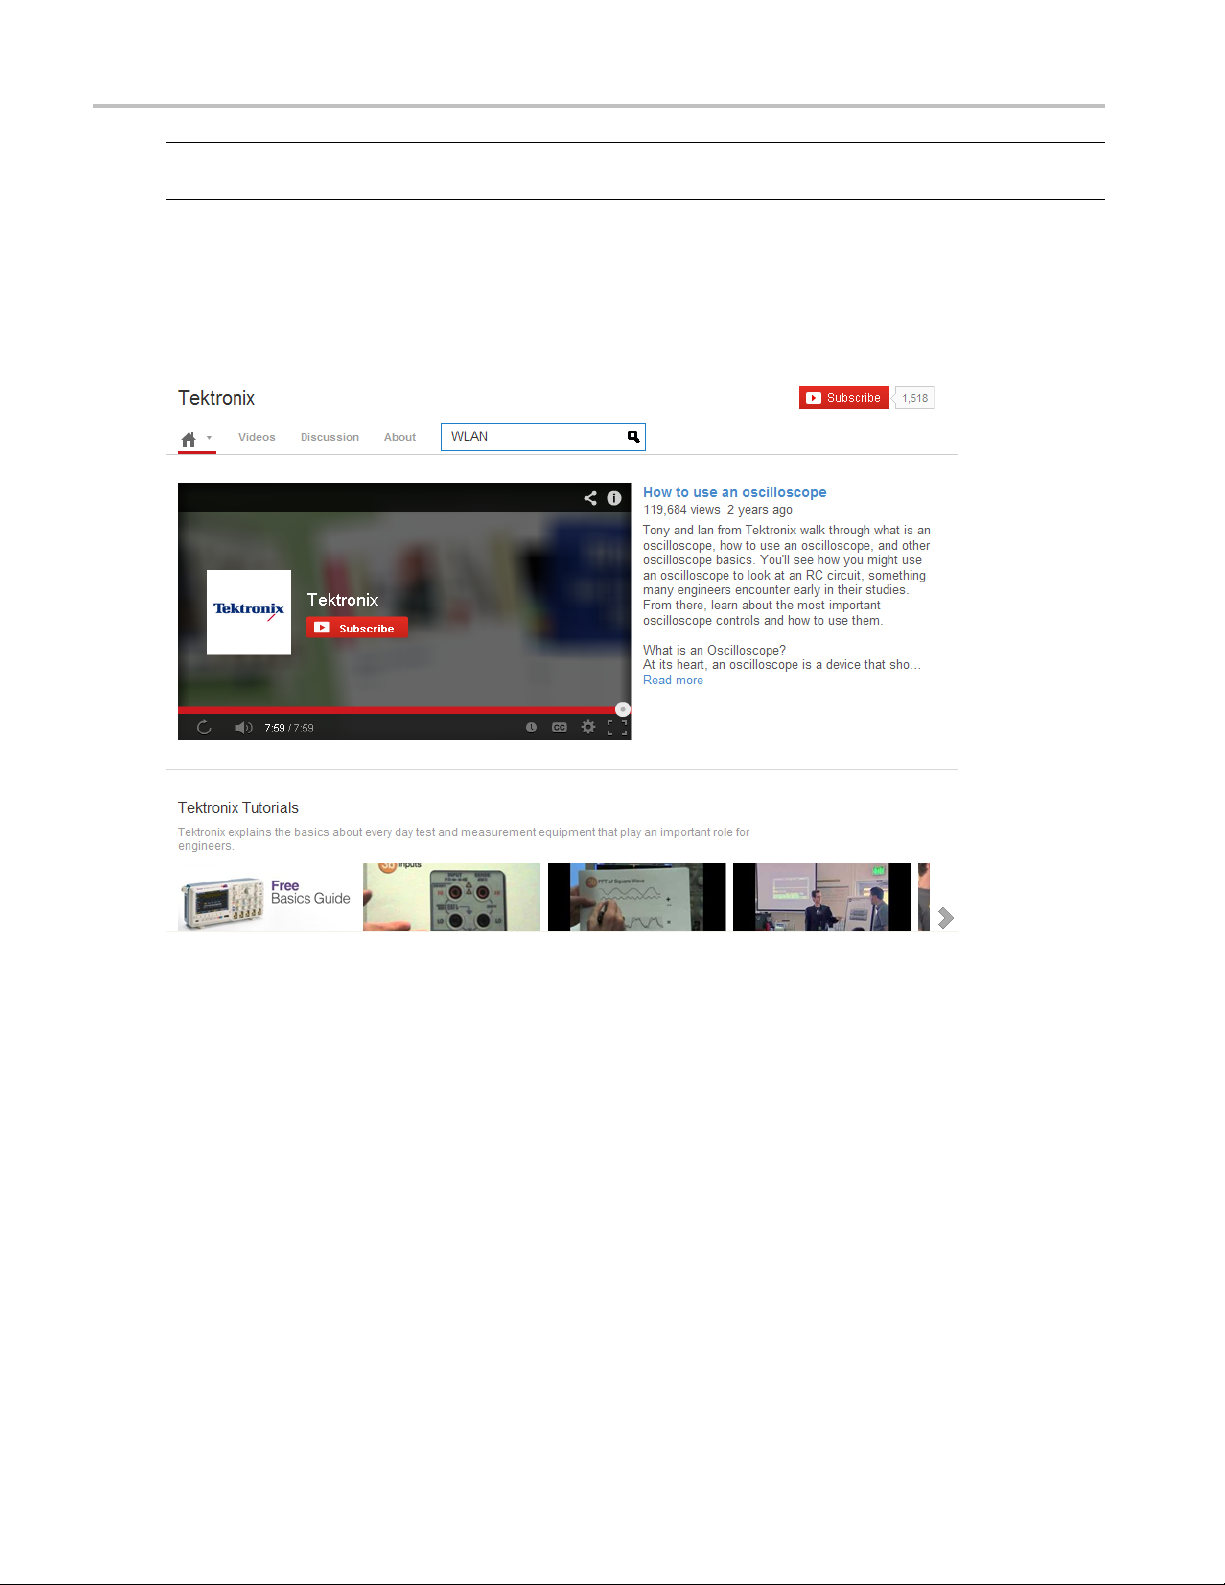
Video Tutorials
You can browse the Tektronix YouTube channel (www.youtube.com/user/tektronix) to find video tutorials
about various topics related to your product. You can also subscribe to the Tektronix YouTube channel to
keep up with new postings.
Searching for topics
For example, you can watch a video tutorial about using the WLAN Presets. To fi
do the following. The following image shows you what the Tektronix YouTube Channel looks like.
1. Click on the search icon located just above the video you see when the page first loads.
. You can find the manuals by searching on the product name.
nd a video on this topic,
SignalVu™ Vector Signal Analysis Software Printable Online Help 3
About Tektronix Analyzer Video Tutorials
NOTE. This icon allows you to search the Tektronix YouTube channel specifically. The search icon located
at the top of the page allows you to search all of YouTube .
2. Type in the keyword “WLAN” in the search field.
3. Click the search icon to start the search.
4. Videos related to the topic will appear. Click a video to view it.
4 SignalVu™ Vector Signal Analysis Software Printable Online Help

Orientation Connecting Signals and Selecting the Analysis Channel
Connecting Signals and Selecting the Analysis Channel
SignalVu analyzes signals acquired by the oscilloscope. The SignalVu software analyzes one, two, or
four signals at a time, so you need to specify which oscilloscope input channels to use. Math and Ref
channels can
To specify which oscilloscope channel is analyzed:
1. Select Settings > Acquire to display the Acquire control panel.
2. Select the desired signal type from the Signal Input drop-down list along the left side of the control
panel. Available choices are RF (uses one oscilloscope channel), IQ (uses two channels), and Diff IQ
(uses four channels).
3. On the Ve r tic a l tab, use the Source drop-down list(s) to select the channels to analyze.
4. Use the oscilloscope controls in the TekScope application to achieve a stable, triggered signal.
For information on the oscilloscope input signal capabilities and how to trigger on a signal, see the
oscilloscope's help. Note that SignalVu does not control triggering on the oscilloscope; you will need to
use the oscilloscope triggering functions to achieve a stable, triggered signal on the oscilloscope.
also be selected.
Front-Panel Controls
The front-panel controls remain dedicated to oscilloscope control functions when SignalVu is running. The
front-panel buttons and knobs of the oscilloscope do not have any effect on the SignalVu software settings.
NOTE. One button that affects the SignalVu software is the Run/Stop button. Pressing the Stop button
l halt data acquisition in the SignalVu software.
wil
Touch-Screen Actions
You can use the touch screen to change marker settings and how waveforms are displayed by using the
ouch-screen Actions menu.
T
SignalVu™ Vector Signal Analysis Software Printable Online Help 5

Orientation Touch-Screen Actions
To use the Touch-screen Actions menu, touch the display in a graph area and hold for one second, then
remove your finger. You can also use a mouse to display the Touch-screen Action menu by clicking
the right mouse button.
6 SignalVu™ Vector Signal Analysis Software Printable Online Help

Orientation Touch-Screen Actions
Icon Menu Description
Select Selects markers and adjusts their position.
Span Zoom
CF Pan Adjusts the Center Frequency according to horizontal movement.
Zoom
Pan
-
-
-
-
-
-
xxx
Reset Scale
Marker to peak
Next Peak
Add marker
Delete marker Removes the last added marker.
All markers off
Touch-Screen Menu for Spurious Display
Zooms the graph area about the selected point. Touch the graph
display at a point of interest and drag to increase or decrease the
span about the point of interest. Span Zoom adjusts the span
control and can affect the acquisition bandwidth.
Adjusts horizontal and vertical scale of the graph. The first
direction with enough movement becomes the primary scale of
adjustment. Adjustment in the secondary direction does not occur
until a threshold of 30 pixels of movement is crossed.
Dragging to the left or down zooms out and displays a smaller
waveform (increases the scale value). Dragging to the right or up
zooms in and displays a larger waveform (decreases the scale
value).
Adjusts horizontal and vertical position of the waveform. The first
direction with enough movement becomes the primary direction of
movement. Movement in the secondary direction does not occur
until a threshold of 30 pixels of movement is crossed.
Returns the horizontal and vertical scale and position settings
to their default values.
Moves the selected marker to the highest peak. If no marker is
turned on, this control automatically adds a marker.
Moves the selected marker to the next peak. Choices are Next
left, Next right, Next lower (absolute), and Next higher (absolute).
Defines a new marker located at the horizontal center of the graph.
Removes all markers.
The Touch-screen actions menu in the Spurious display has some minor changes compared to the standard
version used in other displays.
SignalVu™ Vector Signal Analysis Software Printable Online Help 7

Orientation Touch-Screen Actions
Icon Menu Description
-
-
-
xxx
lVu Markers Menu
Signa
Single-range Changes the current multi-range display to a single range display.
The displayed range is the range in which you display the
touchscreen-actions menu. Selecting Single-range from the menu
is equivalent to selecting Single on the Settings > Parameters tab.
Multi-range
Marker -> Sel Spur
Changes the current single-range display to a multi-range display.
Selecting Multi-range from the menu is equivalent to selecting
Multi on the Settings > Parameters tab.
Moves the selected marker to the selected spur.
The SignalVu Markers menu appears when you right-click (or touch and hold) on a marker. The SignalVu
ers menu enables you to assign a marker to a different trace, synchronize markers with oscilloscope,
Mark
cursors and pan the trace to place the marker at the measurement frequency.
8 SignalVu™ Vector Signal Analysis Software Printable Online Help

Orientation Elements of the Display
Icon Menu Description
-
-
-
-
xxx
Pan to marker
Assign to trace Assigns the selected marker to Trace 1, Trace 2, Trace 3 or the
Sync scope C1 Synchronize
Sync scope C2 Synchronizes the position of oscilloscope Cursor 2 with the
Adjusts horizontal position of the waveform to locate the selected
marker at the m
Math trace. A t
location of the selected m arker. Turns on cursors if necessary.
location of the selected m arker. Turns on cursors if necessary.
easurement frequency.
race must be enabled to assign a marker to it.
s the position of oscilloscope Cursor 1 with the
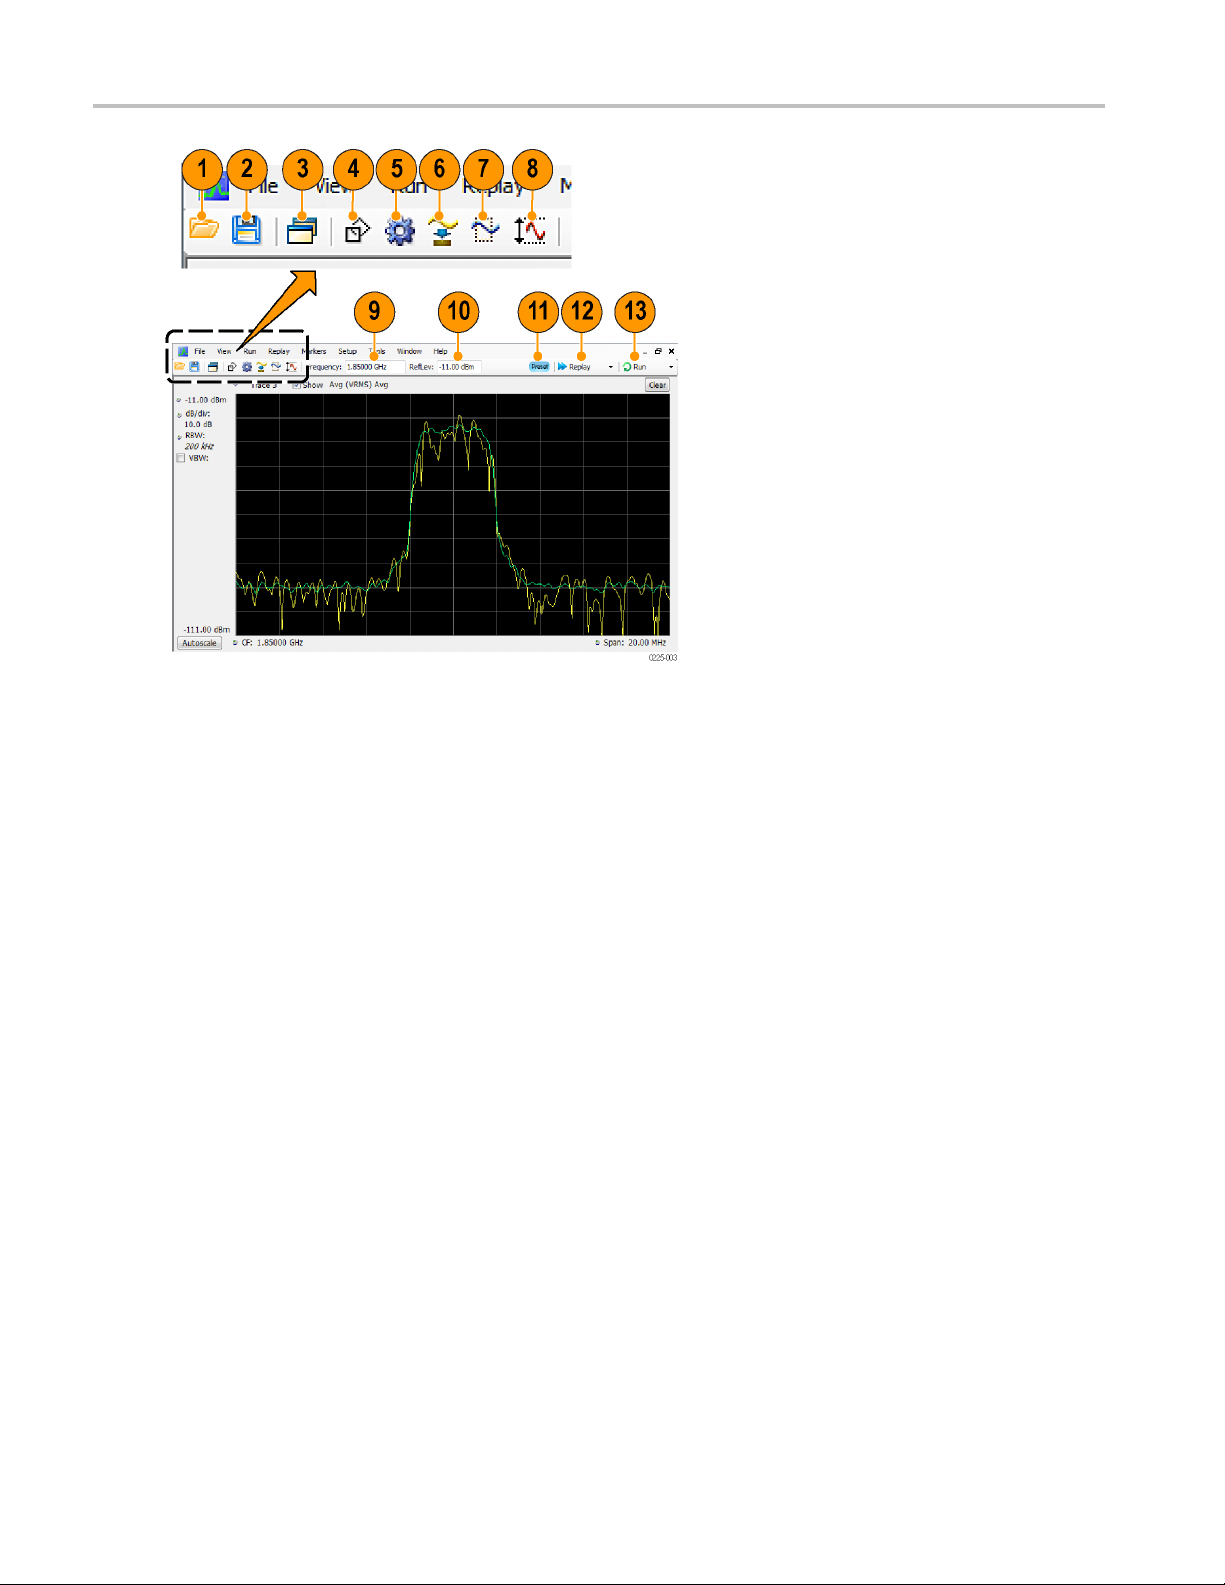
Elements o
The main a
ftheDisplay
reas of the application window are shown in the following figure.
Specific elements of the display are shown in the following figure.
SignalVu™ Vector Signal Analysis Software Printable Online Help 9
Orientation Elements of the Display
10 SignalVu™ Vector Signal Analysis Software Printable Online Help

Orientation Elements of the Display
Ref
Setting
number
1 Recall
2
Save Opens the Save As dialog in order to save setup files, pictures (screen
3 Displays
4Markers
5
Settings Opens the Settings control panel for the selected display. Each display has
6 Acquire
7
8Amplitu
9
10
11 Pres
12 Repl
Analysis
de
Center Frequency Displays the Center Frequency. To change the value, click the text and enter the
ence Level
Refer
ets
ay
13 Run
xxx
Description
Displays the Open window in order to recall setup files, acquisition data files,
or trace files.
captures), a
cquisition data files, or export measurement settings or acquisition
data.
Opens the Select D isplays dialog box so that you can select measurement
displays.
Opens or closes the Marker toolbar at the bottom of the window.
its own co
Opens the
Opens th
ntrol panel.
Acquire control panel so that you can define the acquisition settings.
e Analysis control panel so that you can define the analysis settings
such as frequency, analysis time, and units.
Opens the Amplitude control panel so that you can define the Reference Level,
configure internal attenuation, and enable/disable the (optional) Preamplifier.
ency with a keyboard. For fi ne adjustments, you can use the mouse wheel.
frequ
ays the reference level. To change the value, click the text and enter a
Displ
number using a keyboard, or use a mouse scroll wheel.
Recalls the Main
a new measurement cycle on the existing acquisition data record using
Runs
(see page 13) preset.
any new settings.
Starts and stops data acquisitions. When the instrument is acquiring data, the
button label has green lettering. When stopped, the label has black lettering.
can specify the run conditions in the Run menu. For example, if you
You
select Single Sequence in the Run menu, when you click the Run button,
the instrument will run a single measurement cycle and stop. If you select
ntinuous, the instrument will run continuously until you stop the acquisitions.
Co
SignalVu™ Vector Signal Analysis Software Printable Online Help 11

Orientation Elements of the Display
12 SignalVu™ Vector Signal Analysis Software Printable Online Help

Operating Your Instrument Presets
Presets
Menu Bar: Presets
SignalVu includes a set of configuration files that are tailored to specific applications. These configuration
files, referred to as Application Presets, open selected displays and load settings that are optimized to
address specific application requirements. You can add to the default application presets by creating your
own applica
tion (user) presets. See Creating User Presets
presets through the Application Presets menu item.
Available Presets
Select Presets from the menu bar to access the four types of factory Presets: Main, D PX, Standards, and
Application. In addition to these factory defined Presets, you can create your own presets, called User
presets. Available presets are described in the following table.
Presets Description
Main
Application
Time-Frequency Analysis
(see page 16)
rum Analysis
Spect
page 16)
ation Analysis
Modul
Pulse Analysis (see
page 15)
Pulse Analysis The Pulse Analysis application preset provides you with the most common displays used
r Search Multi Zone
Spu
9k-1GHz
er
Us
User Preset 1
ser Preset 2
U
xxx
(see
The Time-Frequency preset configures the instrument with settings suited to analyzing
behavior over time.
signal
ectrum Analysis application preset provide you with the settings commonly used
The Sp
for general purpose spectrum analysis.
dulation Analysis setup application preset provides you with the most common
The Mo
displays used during modulation analysis. Only present when Option SVM is installed.
ulse Analysis application preset provides you with the most common displays used
The P
during pulse analysis, and makes changes to the default parameters to settings better
optimized for pulsed signal analysis. Only present when Option 20 is installed.
during pulse analysis, and makes changes to the default parameters to settings better
imized for pulsed signal analysis. Only present when Option SVP is installed.
opt
Spur Search application preset configures the instrument to show the Spurious
The
display with the frequency range set to 9 kHz to 1 GHz.
his Preset is provided as a example for you to create your own Presets. This preset
T
displays the Spectrum, Spectrogram, Frequency vs Time, and Time Overview displays.
This Preset is provided as an example for you to c reate your own Presets. This preset
displays the Spurious display configured to test for Spurious signals across four ranges.
Preset Options
(see page 14). You access the application
Select the Presets > Preset Options menu to open the Options control panel. This panel does the
following. Once you have chosen these settings, you can access any preset or list of presets from Presets
on the menu bar.
SignalVu™ Vector Signal Analysis Software Printable Online Help 13

Operating Your Instrument Presets
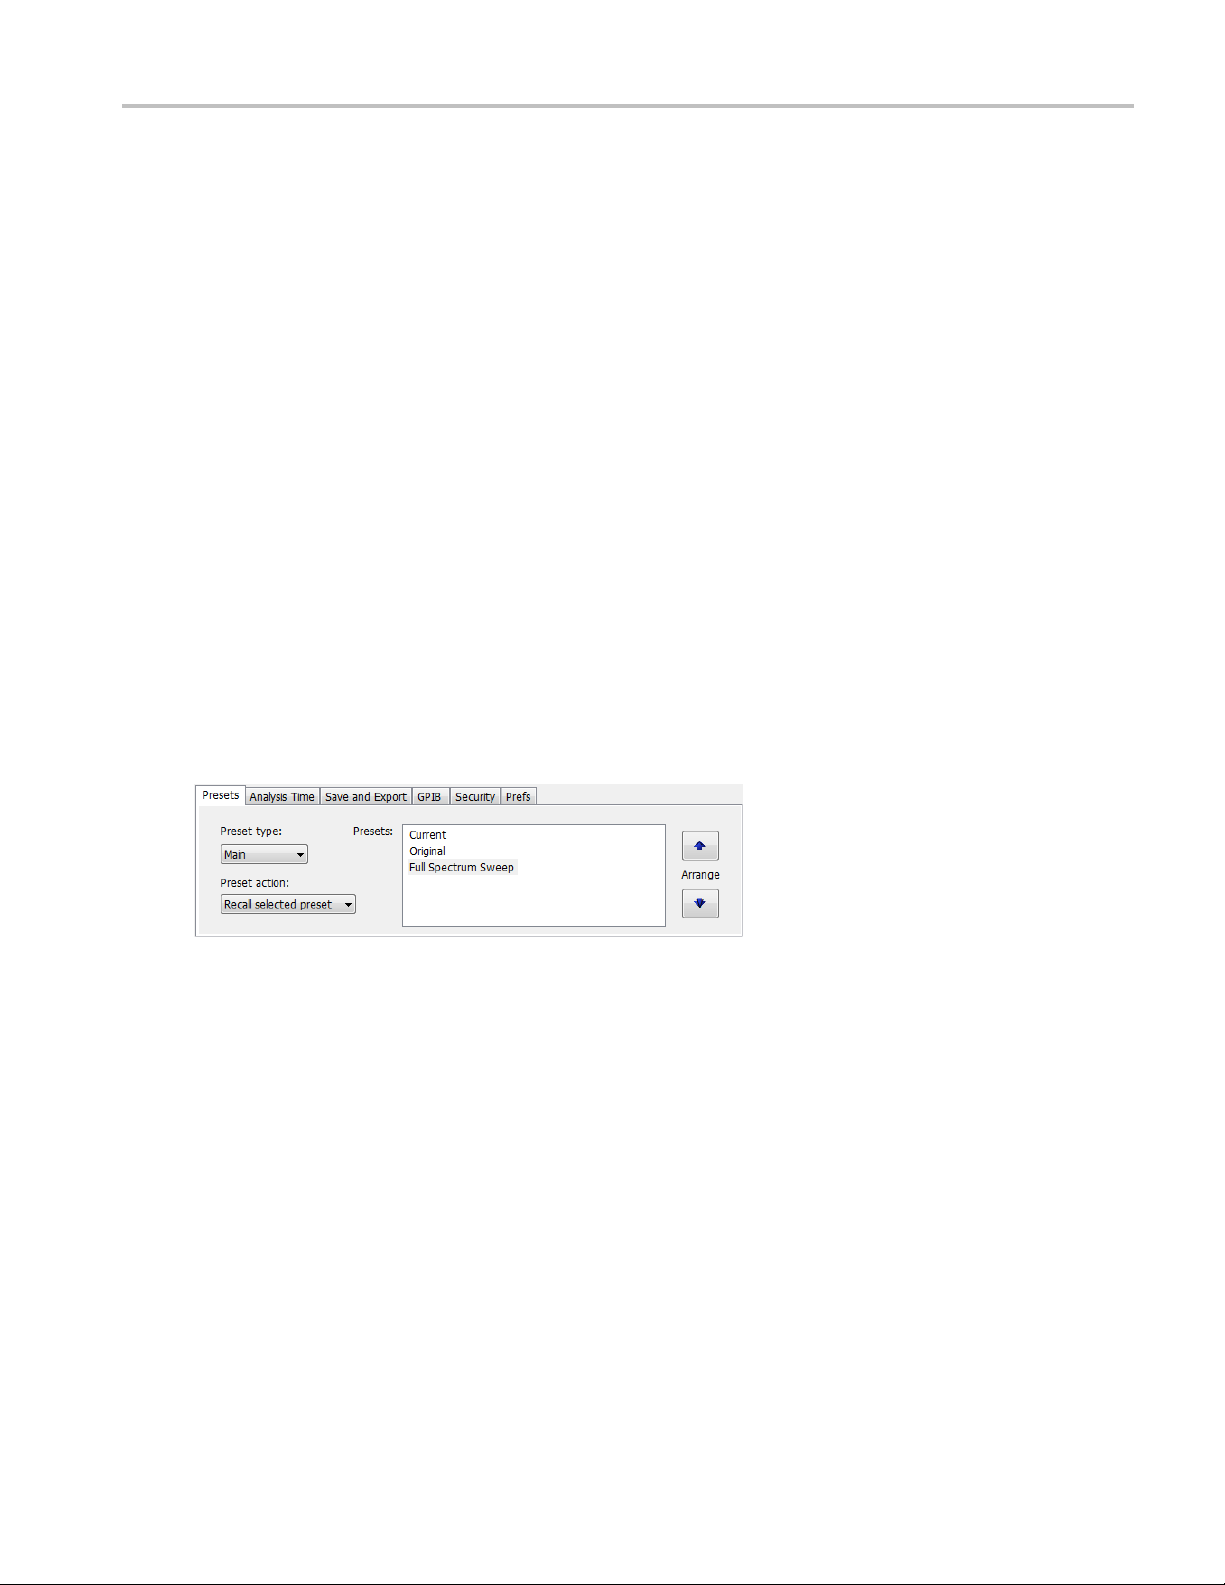
Preset type: Select the Preset type.
Presets: Select w hich preset you want to display for that particular preset type.
Preset action: Recalling Presets results in either of two actions. One action is to immediately execute
a Preset. The second action displays a list of Presets from which you select the Preset you want to
recall. You can select from Recall selected preset or Show list.
If you select Recall selected preset from the Preset action list, click in the Presets list box on the preset you
wish to recall. The selected preset, indicated by a tan background highlight, is the Preset that is recalled.
Configurin
After you have selected a preset:
Adjust the span to show the necessary detail.
Recalli
NOTE. You can also click the Preset button on the right-hand side of the menu bar to load the Main preset.
To rec
Select Presets > User. The Preset at the top of the Presets list will be recalled (if Preset action is set to
Recal
g a User Preset
ng a Preset
all a named (User) preset:
l named preset). To change the user preset, select Presets > Preset Options.
Creating User Presets
You can add your own application pre sets to the list that appears in the User Presets dialog box. Create a
Setup file and save a copy of it to C:\SignalVu Files\User Presets. The name you give the file will be
shown in the User Presets list. For instructions on how to save a Setup file, see Saving Data
(see page 341).
Using Standards Presets for WLAN
In addition to accessing Standards presets from the Presets menu bar, you can also click the Standards
Presets button on the WLAN Settings Control Panel to recall these preconfigured WLAN displays for the
tandards and bandwidths that you select.
s
NOTE. More information is available about WLAN standards here
a v ideo tutorial about WLAN Presets at www.youtube.com/user/tektronix. Click here
information about searching the Tektronix YouTube channel for videos.
(see page 159). Youcanalsowatch
(see page 3) for
Modulation Analysis
The Modulation Analysis application preset opens the following displays:
14 SignalVu™ Vector Signal Analysis Software Printable Online Help

Operating Your Instrument Presets
Signal Quality: Shows a summary of modulation quality measurements (EVM, rho, Magnitude
Error, Phase Error, and others).
Constellation: Shows the I and Q information of the signal analyzed in an I vs. Q format.
Symbol Table: Shows the demodulated symbols of the signal.
To use the Modulation Analysis preset (assuming the Preset action is set to Show list in the Presets tab
of the Options control panel):
1. Select Presets > Application. Select Modulation Analysis andthenclickOK.
2. Set the measurement frequency.
3. Set the reference level so that the peak of your signal is about 10 dB below the top of the spectrum
display.
4. Set the modulation parameters for your signal. This includes the Modulation Type, Symbol Rate,
Measurement Filter, Reference Filter and Filter Parameter. All of these settings are accessed by
pressing the Settings button.
For most modulated signals, the Modulation Analysis application preset should pre sent a stable display of
modulation quality. Additional displays can be added by using the Displays button, and oth
be modified to better align with your signal requirements.
er settings can
Pulse Analysis
The Pulse Analysis appli
Time Overview: Shows amplitude vs. time over the analysis period.
Pulse Trace: Shows the trace of the selected pulse and a readout of the selected measurement from
the pulse table.
Pulse Measurement Table: This shows a full report for the user-selected pulse measurements.
You can make a selected pulse and measurement appear in the Pulse Trace display by highlighting it in the
Pulse M easurement Table. Key pulse-related parameters that are set by the Pulse Analysis application
preset are:
Measurement Filter: No Filter.
Measurement Bandwidth: This is set to the maximum real-time bandwidth of the instrument. Note:
The label on the “Measurement Bandwidth” setting is just “Bandwidth”. Like the main instrument
Preset command and the other application presets, the Pulse Analysis application preset also sets
most other instrument controls to default values.
Analysis Period: This is set to 2 ms to ensure a good probability of catching several pulses for
typical signals.
To use the Pulse Analysis preset (assuming the Preset action is set to Show list in the Presets tab of the
Options control panel):
cation preset opens the following displays:
1. Select Presets > Application. Select Pulse Analysis and then click OK.
2. Set the Center Frequency control to the carrier frequency of your pulsed signal.
SignalVu™ Vector Signal Analysis Software Printable Online Help 15

Operating Your Instrument Presets
3. Set the Reference Level to place the peak of the pulse signal approximately 0-10 dB down from
thetopoftheTimeOverviewdisplay.
You may need to trigger on the signal to get a more stable display. This is set up with the oscilloscope's
controls. A rising-edge trigger works well for many pulsed signals.
4. Set the Analysis Period to cover the number of pulses in your signal that you want to analyze. To do
this, click in the data entry field of t he Time Overview window and set the analysis length as needed.
Spectrum Analysis
The Spectr
Spectrum Analysis preset sets the analyzer as follows.
Spectrum
optimization to Minimize Sweep Time.
To use th
of the Options control panel):
1. Select
2. Set the measurement frequency using the front-panel knob or keypad.
3. Adjust the span to show the necessary detail.
Time
The Time-Frequency Analysis application preset opens the following displays:
Time Overview: Shows a time-domain view of the analysis time ‘window’.
Spectrogram: Shows a three-dimensional view of the signal where the X-axis represents frequency,
the Y-axis represents time, and color represents amplitude.
Frequency vs. Time: This display's graph plots changes in frequency over time and allows you to
make marker measurements of settling times, frequency hops, and other frequency transients.
um Analysis application preset opens a Spectrum display and sets several parameters. The
Analysis : Sets the frequency range to maximum for the analyzer, and sets the RF/IF
e Spectrum Analysis preset (assuming the Preset action is set to Show list in the Presets tab
Presets > Application.SelectSpectrum Analysis andthenclickOK.
-Frequency Analysis
Spectrum: Shows a spectrum view of the signal. The only trace showing in the Spectrum graph
after selecting the Time-Frequency A nalysis preset is the Spectrogram trace. This is the trace from
the Spectrogram display that is selected by the active marker. Stop acquisitions with the Run button
because its easier to work with stable results. In the Spectrogram display, move a marker up or down
to see the spectrum trace at various points in time.
Theanalysisperiodissetto5ms.
To use the Time-Frequency Analysis preset (assuming that Time-Frequency Analysis is the selected preset
on the list of Application Presets and Preset action is set to Recall selected preset):
1. Select Presets > Application.SelectTime-Frequency Analysis and then click OK.
2. When the preset's displays and settings have all been recalled and acquisitions are running, adjust the
center frequency and span to capture the signal of interest.
16 SignalVu™ Vector Signal Analysis Software Printable Online Help
Operating Your Instrument Setting Options
3. Set the Reference Level to place the peak of the signal approximately 0-10 dB down from the top of
the Spectrum graph.
4. If the signal is transient in nature, you might need to set a trigger to capture it. You will need to use the
oscilloscope triggering functions to capture the signal.
When the signal has been captured, the spectrogram shows an overview of frequency and amplitude
changes over time. To see frequency transients in greater detail, use the Frequency vs. Time display.
The Time-Frequency Analysis preset sets the analysis period to 5 ms. The Spectrum Span is 40 MHz. The
RBW automatically selected for this Span is 300 kHz. For a 300 kHz RBW, the amount of data needed for
a single sp
each one forming one trace for the Spectrogram to display as horizontal colored lines. This preset scales
the Spectrogram time axis (vertical axis) to -2, which means that the Spectrogram has done two levels of
time compression, resulting in one visible line for each four transforms. This results in 167 lines in the
Spectrogram for each acquisition, each covering 29.84 μs.
ectrum transform is 7.46 μs. A 5 ms Analysis Length yields 671 individual spectrum transforms,
Setting Options
Menu Bar: Tools > Options
There are several settings you can change that are not related to measurement functions. The Option
settings control panel is used to change these settings.
SignalVu™ Vector Signal Analysis Software Printable Online Help 17

Operating Your Instrument Setting Options
Settings tab
Presets
Analysis Time
Save and Export Use this tab to specify whether or not save files are named automatically and what
GPIB Do not use th
Security Selecting the Hide Sensitive readouts check box causes the instrument to replace
Prefs Use this t
xxx
Description
Use this tab to
recalled and which preset to recall when the Preset button is selected.
Use this tab to specify the method used to automatically set the analysis and spectrum
offsets when the Time Zero Reference
informatio
Configuration control w indow in the TekScope application to set the instrument GPIB
address.
measurem
how markers to automatically jump to the next peak
When this setting is deselected, you can drag a marker to any point on the trace.
configure Presets. You can specify the action to take when a preset is
(see page 319) is set to Trigger.
n is saved in acquisition data files.
is tab to set the GPIB address for the instrument. Use the Utilities > GPIB
ent readouts with a string of asterisks.
ab to select different color schemes for the measurement graphs and specify
(see page 308) when you drag them.
Presets
The Presets tab in the Options control panel allows you to specify actions taken when you press the Preset
button. You can read more about this tab here
(see page 13).
Analysis Time
The Analysis Time tab in the O ptions control panel is used to specify the method used to automatically set
the analysis and spectrum offsets when the Time Zero Reference
(see page 319) is set to Trigger. The
available settings are:
Include trigger point – Selects an algorithm that uses the measurements to determine how far in
advance of the trigger to set the analysis offset. The analyzer tries to ensure that data about the trigger
point is included in the analyses.
Startattriggerpoint(legacy)–Themethodusedby the instrument in prior versions, which sets the
Analysis Offset to zero when possible. The analyzer tries to ensure that data following the trigger
point is included in the analyses. Use this method if your measurements or procedures depend on past
behavior of the Auto Analysis Offset function.
Save and Export
The Save and Export tab a llows you to specify whether or not files are saved with an automatically
generated name, and how much data is saved in an acquisition data file.
All files. The Automatically increment filename/number function can automatically name saved files by
appending a number to a base fi le name. Use this tab to enable/disable automatic naming of files. For
example, if Automatically Increment Filename Number is disabled, when you select Save from the File
menu, you will have to enter a name for the file.
Acquisition data files. This setting specifies whether saved data files include the entire acquisition record or
only the data for the analysis length (a subset of the acquisition record). You can choose from the following:
18 SignalVu™ Vector Signal Analysis Software Printable Online Help
 Loading...