

Page 1

x
RSA5100B Series
Real-Time Spectrum Analyzers
ZZZ
Quick Start User Manual
$
071-3224-12
Page 2

Page 3

xx
RSA5100B Series
Real-Time Spectrum Analyzers
ZZZ
Quick Start User Manual
www.tek.com
071-3224-12
Page 4

Copyright © Tektronix. All rights reserved. Licensed software products are owned by Tektronix or its subsidiaries or suppliers, and are
protected by na
tional copyright laws and international treaty provisions.
Tektronix pro
previously published material. Specifications and price change privileges reserved.
TEKTRONIX and TEK are registered trademarks of Tektronix, Inc.
Planar Crown is a registered trademark of Aeroflex Inc.
LTE is a trademark of ETSI.
Bluetooth is a registered trademark of Bluetooth SIG, Inc.
ducts are covered by U.S. and foreign patents, issued and pending. Information in this publication supersedes that in all
Contacting Tektronix
Tektronix, Inc.
14150 SW Karl Braun Drive
P.O. Box 500
Beaverton, OR 97077
USA
For product information, sales, service, and technical support:
In North America, call 1-800-833-9200.
Worldwide, visit www.tek.com to find contacts in your area.
Page 5

Warranty
Tektronix warrants that this product will be free from defects in materials and workmanship for a period of one (1) year from the date of
shipment. If any such product proves defective during this warranty period, Tektronix, at its option, either will repair the defective
product without charge for parts and labor, or will provide a replacement in exchange for the defective product. Parts, modules and
replacement products used by Tektronix for warranty work may be new or reconditioned to like new performance. All replaced
parts, modules and products become the property of Tektronix.
In order to obtain service under this warranty, Customer must notify Tektronix of the defect before the expiration of the warranty period
and make suitable arrangements for the performance of service. Customer shall be responsible for packaging and shipping the
defective product to the service center designated by Tektronix, with shipping charges prepaid. Tektronix shall pay for the return of the
product to Customer if the shipment is to a location within the country in which the Tektronix service center is located. Customer shall
be responsible for paying all shipping charges, duties, taxes, and any other charges for products returned to any other locations.
This warranty shall not apply to any defect, failure or damage caused by improper use or improper or inadequate maintenance and
care. Tektronix shall not be obligated to furnish service under this warranty a) to repair damage resulting from a ttempts by personnel
other than Tektronix representatives to install, repair or service the product; b) to repair damage resulting from improper use or
connection to incompatible equipment; c) to repair any damage or malfunction caused by the use of non-Tektronix supplies; or
d) to service a product that has been modified or integrated with other products when the effect of such modification or integration
increases the time or difficulty of servicing the product.
THIS WARRANTY IS GIVEN BY TEKTRONIX WITH RESPECT TO THE PRODUCT IN LIEU OF ANY OTHER WARRANTIES,
EXPRESS OR IMPLIED. TEKTRONIX AND ITS VENDORS DISCLAIM ANY IMPLIED WARRANTIES OF MERCHANTABILITY OR
FITNESS FOR A PARTICULAR PURPOSE. TEKTRONIX' RESPONSIBILITY TO REPAIR OR REPLACE DEFECTIVE PRODUCTS
IS THE SOLE AND E XCLU S IVE REMEDY PROVIDED TO THE CUSTOMER FOR BREACH OF THIS WARRANTY. TEKTRONIX
AND ITS VENDORS WILL NOT BE LIABLE FOR ANY INDIRECT, SPECIAL, INCIDENTAL, OR CONSEQUENTIAL DAMAGES
IRRESPECTIVE OF WHETHER TEKTRONIX OR THE VENDOR HAS ADVANCE NOTICE OF THE POSSIBILITY OF SUCH
DAMAGES.
[W2 – 15AUG04]
Page 6

Page 7

Table of Contents
Important safety information .......................................................................................................... iii
General safety summary......................................................................................................... iii
Service safety summary ......................................................................................................... v
Terms in this manual .......................................................................... . .. . . . . . . . . . . . . . . . . . . . . . . . . . . . . . . . . v
Symbols and terms on the product.................................................................... . .. . . . . . . . . . . . . . . . . . . . . . . . v
Compliance information ............................................................................................................... vi
EMC compliance ................................................................................................................. vi
Safety compliance............................................................................................................... vii
Environmental considerations ................................................................................................... ix
Preface................................................................................................................................. x
Key Features .....................................................................................................................x
Documentation ...................................................................................................................xi
Software Upgrades. . . . . . . . . . . . . . . . . . . . . . . . . . . . . . . . . .. . .. . ... ... ... .............................................................. xii
Conventions Used in This Manual.............................................................................................. xii
Installation.............................................................................................................................. 1
Before Installation................................................................................................................ 1
Standard Accessories. . . . . . . . . . . . . . . . . . . . . . . . . . . . . . . . . . . . . . . . . . . . . . . . . . . .. . ... ................................................... 1
Optional Accessories ............................................................................................................ 2
Options ........................................................................................................................... 3
Upgrades .. . . ............................ . ................................ . . ............................... . . . . . . . . . . . . . . . . . . . . . .. 3
How to manage the 5GNR analysis license . . . . . . . . . . . . . . . . . . . . . . . . . . . . . . . . . . . . . . . .. . ... ....................................... 3
Operating Considerations........................................................................................................ 7
Connecting to the Instrument .......................................................................... . ......................... 8
Activating Microsoft Windows 10 . . . . . . . . . . . . . . . . . . . . . . . . . . . . . . . . . . . . . . . . . . . . . . . . . . . ... .......................................... 8
Powering On the Instrument..................................................................................................... 9
Powering Off the Instrument..................................................................................................... 9
Removing the Power............................................................................................................. 9
Adding an External Monitor..................................................................................................... 10
Inspecting the Instrument....................................................................................................... 11
User Maintenance . ........................................... . . ...................... . .......................... . . .............. 12
ation.............................................................................................................................. 14
Oper
Getting Acquainted with Your Instrument ...................................................................... . ............... 14
Basic Concepts.................................................................................................................. 24
Navigating Displays............................................................................................................. 26
Selecting Displays...............................................................................................................28
Connecting a Signal.......................................................................................... . .................. 37
Starting and Stopping Acquisitions . .. . .. . .. . ... ... ............................................................................. 38
Markers.......................................................................................................................... 40
Touchscreen Actions............................................................................................................ 43
Printing .......................................................................................................................... 45
Saving Data ..................................................................................................................... 47
Recalling Data...................................................................................................................49
Table of Content
s
RSA5100B S eries Quick Start User Manual i
Page 8

Table of Content
Specifications
Index
s
Advanced Techniques.. . . . . . . . . . . . . . . . . . . . . . . . . . . . . . . . . . . . . . ..................................... . . . . . . . . . . . . . . . . . . . . . . . . . . . . . . . 50
......................................................................................................................... 75
Specifications.................................................................................................................... 75
ii RSA5100B Series Q uick Start User Manual
Page 9

Important safet
y information
Important saf
This manual contains information and warnings that must be followed by the user for safe operation and to keep the
product in a safe condition.
To safely perform service on this product, additional information is provided at the end of this section. (See page v,
Service safety summary.)
ety information
General safety summary
Use the product only as specified. Review the following safety precautions to avoid injury and prevent damage to this product
or any products connected to it. Carefully read all instructions. Retain these instructions for future reference.
Comply with local and national safety codes.
For c orrect and safe operation of the product, it is essential that you follow generally accepted safety procedures in addition
to the safety precautions specified in this manual.
The product is designed to be used by trained personnel only.
Only qualified personnel who are aware of the hazards involved should remove the cover for repair, maintenance, or
adjustment.
Before use, always check the product with a known source to be sure it is operating correctly.
This product is not intended for detection of hazardous voltages.
Use personal protective equipment to prevent shock and arc blast injury where hazardous live conductors are exposed.
While using this product, you may need to access other parts of a larger system. Read the safety sections of the other
component manuals for warnings and cautions related to operating the system.
When incorporating this equipment into a system, the safety of that system is the responsibility of the assembler of the system.
To avoid fire or personal injury
Use proper power cord. Use only the power cord specified for this product and certified for the country of use.
Do not use the provided power cord for other products.
Ground the product. This product is grounded through the grounding conductor of the power cord. To avoid electric
shock, the grounding conductor must be connected to earth ground. Before making connections to the input or output
terminals of the product, make sure that the product is properly grounded.
Do not disable the power cord grounding connection.
Power disconnect. The power cord disconnects the product from the power source. See instructions for the location. Do
not position the equipment so that it is difficult to disconnect the power cord; it must remain accessible to the user at all
times to allow for quick disconnection if needed.
Connect and disconnect properly. Do not connect or disconnect probes or test leads while they are connected
to a voltage source.
Observe all terminal ratings. To avoid fire or shock hazard, observe all ratings and markings on the product. Consult
the product manual for further ratings information before making connections to the product.
RSA5100B S eries Quick Start User Manual iii
Page 10
Important safet
Do not apply a potential to any terminal, including the common terminal, that exceeds the maximum rating of that terminal.
The measuring terminals on this product are not rated for connection to mains or Category II, III, or IV circuits.
Do not operate without covers. Do not operate this product with covers or panels removed, or with the case open.
Hazardous voltage exposure is possible.
y information
Avoid expose
d circuitry.
Do not touch exposed connections and components when power is present.
Do not operate with suspected failures. If you suspect that there is damage to this product, have it inspected by
qualified service personnel.
Disable the product if it is damaged. Do not use the product if it is damaged or operates incorrectly. If in doubt about safety of
the product, turn it off and disconnect the power cord. Clearly mark the product to prevent its further operation.
Before use, inspect voltage probes, test leads, and accessories for mechanical damage and replace when damaged.
Examine the exterior of the product before y ou use it. Look for cracks or missing pieces.
Use only specified replacement parts.
Wear eye protection. Wear eye protection if exposure to high-intensity rays or laser radiation exists.
Do not operate in wet/damp conditions. Be aware that condensation may occur if a unit is moved from a cold to a
warm environment.
Do not operate in an explosive atmosphere.
Keep product surfaces clean and dry.
Remove the input signals before you clean the product.
Provide proper ventilation. Refer to the installation instructions in the manual for details on installing the product
so it has proper ventilation.
Slots and openings are provided for ventilation and should never be covered or otherwise obstructed. Do not push objects
into any of the openings.
Provide a safe working environment. Always place the product in a location convenient for viewing the display
and indicators.
Avoid improper or prolonged use of keyboards, pointers, and button pads. Improper or prolonged keyboard or pointer use
esult in serious injury.
may r
ure your work area meets applicable ergonomic standards. Consult with an ergonomics professional to avoid stress
Be s
injuries.
Use care when lifting and carrying the product. This product is provided with handles for lifting and carrying.
WARNING. The product is heavy. To reduce the risk of personal injury or damage to the device get help when lifting or
rrying the product.
ca
Use only the Tektronix rackmount hardware specified for this product.
iv RSA5100B Series Q uick Start User Manual
Page 11
Servicesafetysummary
The Service safety summary section contains additional information required to safely perform service on the product. Only
qualified personnel should perform service procedures. Read this Service safety summary and the General safety summary
before performing any service procedures.
To avoid electric shock. Do not touch exposed connections.
Do not service alone. Do not perform internal service or adjustments of this product unless another person capable of
rendering first aid and resuscitation is present.
Disconnect power. To avoid electric shock, switch off the product power and disconnect the power cord from the mains
power before removing any covers or p
Use care when servicing with power on. Dangerous voltages or currents may exist in this product. Disconnect
power, remove battery (if applicable), and disconnect test leads before removing protective panels, soldering, or replacing
components.
Verify safety after repair. Always recheck ground continuity and mains dielectric strength after performing a repair.
Terms in this manual
anels, or opening the case for servicing.
Important safet
y information
These terms may appear in this manual:
WARNING. Warning statements identify conditions or practices that could result in injury or loss of life.
CAUTION. Caution s tatements identify conditions or practices that could result in damage to this product or other property.
Symbols and terms on the product
These terms may appear on the product:
DANGER indicates an injury hazard immediately accessible as you read the marking.
WARNING indicates an injury hazard not immediately accessible as you read the marking.
CAUTION indicates a hazard to property including the product.
When this symbol is marked on the product, be sure to consult the manual to find out the nature of the
potential hazards and any actions which have to be taken to avoid them. (This symbol may also be used
refer the user to ratings in the manual.)
The following symbol(s) m ay appear on the product:
to
RSA5100B S eries Quick Start User Manual v
Page 12

Compliance info
rmation
Compliance in
This section lists the EMC (electromagnetic compliance), safety, and environmental standards with which the instrument
complies.
EMC compliance
EC Declaration of Conformity – EMC
Meets intent of Directive 2004/108/EC for E lectromagnetic Compatibility. Compliance was demonstrated to the following
specifications as listed in the Official Journal of the European Communities:
EN 61326-1 2006, EN 61326-2-1 2006. E MC requirements for electrical equipment for m easurement, control, and
laboratory use.
CISPR 11:2003. Radiated and conducted emissions, Group 1, Class A
IEC 61000-4-2:20
IEC 61000-4-3:2002. RF electromagnetic field immunity
IEC 61000-4-4:2004. Electrical fast transient / burst immunity
IEC 61000-4-5:2001. P ower line surge immunity
IEC 61000-4-6:2003. Conducted RF immunity
IEC 61000-4-11:2004. Voltage dips and interruptions immunity4,
123
formation
01. Electrostatic discharge immunity
5
6
7
EN 61000-3-2:2006. AC power line harmonic emissions
EN 61000-3-3:1995. Voltage changes, fluctuations, and flicker
European contact.
Tektronix UK, Ltd.
Western Peninsula
Western Road
Bracknell, RG12 1RF
United Kingdom
1
This product is intended for use in nonresidential areas only. Use in residential areas may cause electromagnetic interference.
2
Emissions which exceed the levels required by this standar
3
For compliance with the EMC standards listed here, high quality shielded interface cables s hould be used.
4
At the IEC 61000-4-11 Voltage-Interruption Transient Immunity test at 0% for 250 cycles, the EUT reboots and can take greater
than 10 seconds to recover.
5
Performance degradation information for the IEC 61000-4-3 test: Residual spurious signals can typically increase to -55 dBm with
exposure to the disturbancelevelsofthistest.
6
Performance degradation inf
either 55 dB below reference level or -75 dBm, with exposure to the disturbancelevelsofthistest.
7
Performance Criterion C applied at the 70%/25 cycle Voltage-Dip and the 0%/250 cycle Voltage-Interruption test levels (IEC
61000-4-11).
ormation for the IEC 61000-4-6 test: Residual spurious signals can typically increase to the worse of
d may occur when this equipment is connected to a test object.
vi RSA5100B Series Quick Start User Manual
Page 13

Australia / New Zealand Declaration of Conformity – EMC
Complies with the EMC provision of the Radiocommunications Act per the following standard, in accordance with ACMA:
CISPR 11:2003. Radiated and Conducted Emissions, Group 1, Class A, in accordance with EN 61326-1:2006 and
EN 61326-2-1:2006.
Australia / New Zealand contact.
Baker & McKenzie
Level 27, AMP Centre
50 Bridge St
Sydney NSW 2000, Australia
reet
Safety compliance
This section lists the safety standards with which the product complies and other safety compliance information.
EU declaration of conformity – low v oltage
Compliance was demonstrated to the following specification as listed in the Official Journal of the European Union:
Compliance info
rmation
Low Voltage Directive 2006/95/EC.
EN 61010-1. Safety Requirements for Electrical Equipment for Measurement, Control, and Laboratory Use – Part
1: Gener
al Requirements.
U.S. nationally recognized testing laboratory listing
UL 61010-1. Safety Requirements for Electrical Equipment for Measurement, Control, and Laboratory Use – Part
1: General Requirements.
Canadian certification
CAN/CSA-C22.2 No. 61010-1. Safety Requirements for Electrical Equipment for Measurement, Control, and Laboratory
Part 1: General Requirements.
Use –
Additional compliances
IEC 61010-1. Safety Requirements for Electrical Equipment for Measurement, Control, and Laboratory Use – Part
1: General Requirements.
Equipment type
Test and measuring equipment.
afety class
S
Class 1 – grounded product.
RSA5100B S eries Quick Start User Manual vii
Page 14

Compliance info
Pollution degree descriptions
A measure of the contaminants that could occur in the environment around and within a product. Typically the internal
environment inside a product is considered to be the same as the external. Products should be used only in the environment
for which they are r ated.
Pollution degree 1. No pollution or only dry, nonconductive pollution occurs. Products in this category are generally
encapsulated, hermetically sealed, or located in clean rooms.
Pollution degree 2. Normally only dry, nonconductive pollution occurs. Occasionally a temporary conductivity that is
caused by condensation m ust be expected. This location is a typical office/home environment. Temporary c ondensation
occurs only when the product is out of service.
Pollution degree 3. Conductive pollution, or dry, nonconductive pollution that becomes conductive due to condensation.
These are sheltered locations where neither temperature nor humidity is controlled. The a rea is protected from direct
sunshine, rain, or direct wind.
Pollution degree 4. Pollution that generates persistent conductivity through conductive dust, rain, or snow. Typical
outdoor locations.
Pollution degree rating
Pollution degree 2 (as defined in IEC 61010-1). Rated for indoor, dry location use only.
rmation
Measurement and overvoltage category descriptions
Measurement terminals on this product may be rated for measuring mains voltages from one or more of the following
categories (see specific ratings marked on the product and in the manual).
Category II. Circuits directly connected to the building wiring at utilization points (socket outlets and similar points).
Category III. In the building wiring and distribution system.
Category IV. At the source of the electrical supply to the building.
NOTE. Only mains power supply circuits have an overvoltage category rating. Only measurement circuits have a
measurement category rating. Other circuits within the product do not have either rating.
Mains overvoltage category rating
rvoltage category II (as defined in IEC 61010-1).
Ove
viii RSA5100B Series Q uick Start User Manual
Page 15

Environmental considerations
This section provides information about the environmental impact of the product.
Product end-of-life handling
Observe the following guidelines when recycling an instrument or component:
Equipment recycling. Production of this equipment required the extraction and use of natural resources. The equipment
may contain substances that could be harmful to the environment or human health if improperly handled at the product’s
end of life. To avoid release of such substances into the environment and to reduce the use of natural resources, we
encourage you to recycle this product in an appropriate system that will ensure that most of the m aterials are reused
or recycled appropriately.
This symbol indicates that this product complies w ith the applicable European Union requirements according
to Directives 2012/19/EU and 2006/66/EC on waste electrical and electronic equipment (WEEE) and
batteries. For information about recycling options, check the Support/Service section of the Tektronix Web
site (www.tektronix.com).
Perchlorate materials. This product contains one or more type CR lithium batteries. According to the state
of Califo
www.dtsc.ca.gov/hazardouswaste/perchlorate for additional information.
rnia, CR lithium batteries are classified as perchlorate materials and require special handling. See
Compliance info
rmation
Restriction of hazardous substances
This product is classified as an industrial monitoring and control instrument, and is not required to c omply with the substance
restrictions of the recast RoHS Directive 2011/65/EU until July 22, 2017.
RSA5100B S eries Quick Start User Manual ix
Page 16

Preface
Preface
This manual describes the installation and basic operation of the RSA5100B Series Real-Time Signal Analyzers. For more
detailed information, see the instrument help.
RSA5103B
RSA5106B
RSA5115B
RSA5126B
Key Features
The RSA5100B Series is a family of high-performance real-time signal analyzers. Key features include:
Reduce Time-to-Fault and increase design confidence with Real-time Signal Processing
Swept DPX spectrum enables unprecedented signal discovery over full frequency range
Advanced DPX including swept DPX, gap-free DPX spectrograms, and DPX zero span with real-time amplitude,
frequenc
y, or phase
DPX densi
Advance
25, 40, 8
Acquire
Wideba
Measur
Amplit
Corre
ty™ trigger on frequency domain events and distinguish between continuous signals vs infrequent events
d time-qualified, runt, and frequency-edge triggers act on complex signals as brief as 20 ns
5, 125, or 165 MHz acquisition bandwidths
more than 5 seconds at 165 MHz bandwidth
nd preselection filter provides image free measurements in entire analysis bandwidth up to 165 MHz
ements including channel power, ACLR, CCDF, OBW/EBW, spur search, EMI detectors
ude, frequency, phase vs. time, DPX spectrum, and spectrograms
lated multi-domain displays
x RSA5100B Series Quick Start User Manual
Page 17

Documentation
The following documentation is available for your Tektronix RSA5100B Series Signal Analyzers. For the most current
documentation, refer to the Tektronix Web site.
To read about Use these documents
Installation and operation
(overviews)
Installation, safety,
compliance information
In-depth operation and
user interface help
Application examples Application Examples Manual
Programming commands Programmer Manual
Specifications and
performance verification
User service
Data security
Preface
Quick Start User Manual
The quick start user manual contains general information about how to put your instrument
into service and guides to user interface controls. These manuals are available as PDF
files.
English, Tektronix part number 071-3224-XX.
Japanese, Tektronix part number 071-3225-XX.
Simplified Chinese, Tektronix part number 071-3226-XX.
Russian, Tektronix part number 071-3227-XX.
Installation and Safety Instructions
The installation and safety instructions contain an introduction to the front and rear panel
of the instrument, basic connection, important safety, compliance, and environmental
information, and basic power specifications. This manual is available in printed form
and as a PDF file.
Instrument help
The instrument help contains detailed information about how to operate the instrument.
The help is available as a PDF file.
Tektronix part number 077-0899-XX.
This manual provides practical examples of using the analyzer to accomplish tasks. This
manual is available as a PDF file.
Tektronix part number 071-3283-XX.
This manual contains descriptions of programming commands and their use. This manual
is available as a PDF file.
Tektronix part number 077-0901-XX.
Specifications and Performance Verification Manual
This manual contains the instrument specifications and a procedure to check instrument
performance against warranted characteristics. This manual is available as a PDF file.
Tektronix part number 077-0900-XX.
Service Manual
This manual provides a list of replaceable parts, care and maintenance information, and
information for servicing the instrument to the module level. This manual is available
as a PDF file.
Tektronix part number 077-0903-XX.
Declassification and Security Instructions
This document helps customers with data security concerns to sanitize or remove memory
devices. This document is available as a PDF file.
Tektronix part number 077-0902-XX.
RSA5100B S eries Quick Start User Manual xi
Page 18

Preface
Software Upgrades
Software option upgrades are available. Software upgrades for options become operational only after you enter a valid
option key for the specific analyzer model and serial number.
To check for upgrades:
1. Use your Web browser to go to www.tek.com/software.
2. Enter the product name (for example RSA5126B) to find available software upgrades.
Conventions Used in This Manual
The follow
Sequence
Step
ing icons are used throughout this manual:
Front panel
power
Connect
power
Network
PS2 SVGA USB
xii RSA5100B Series Quick Start User Manual
Page 19

Installation
Before Installation
Unpack the instrument, and check that you received all items listed as Standard Accessories. Optional accessories and
instrument options are also listed in this section. Check the Tektronix website (www.tek.com) for the most current information.
Standard Accessories
Your instrument comes with the following accessories: product documentation (listed below), power cord, USB keyboard,
USB mouse, and instrument front cover.
The RSA5103B and RSA5106B also includes a BNC-N adapter.
The RSA5115B also includes a type N female Planar Crown R F input connector.
The RSA5126B also includes a 3.5 mm female Planar Crown RF input connector.
Product Documentation
Installation
RSA5100B Series Real-Time Signal Analyzers Quick S tart User Manual
RSA5100B Series Real-Time Signal Analyzers Installation and Safety Instructions
RSA5100B Series Real-Time Spectrum Analyzers Application Examples Manual
RSA5100B Series Help (accessible from the instrument and available as a downloadable PDF from www.tek.com)
Power Cords
The analyzer is shipped with one of the following power cord options. Power cords for use in North A merica are UL listed
and CSA certified. Cords for use in areas other than North America are approved by at least one authority acceptable in
the country to which the product is shipped.
International Power Plugs
Opt. A0 - North America power
Opt. A1 - Universal EURO power
Opt. A2 - United Kingdom power
Opt. A3 - Australia power
Opt. A4 - 240 V, North America power
Opt. A5 - Switzerland power
Opt. A6 - Japan power
Opt. A10 - China power
Opt. A11 - India power
RSA5100B S eries Quick Start User Manual 1
Page 20

Installation
Opt. A12 - Brazil power
Opt. A99 - No power cord
Optional Acce
RTPA2A – Real-Time Spectrum Analyzer Probe Adapter; Supports TekConnect probes P7225, P7240, P7260, P7313,
P7313SMA, P7330, P7340A, P7350, P7350SMA, P7360A, P7380A, P7380SMA, P7500 Series.
SignalVu-PC – Offline analysis software based on the RSA5000/6000 Series platform.
RSAVu – Offline analysis software based on the RSA3000 platform for analysis supporting 3G wireless standards
Planar Crown 3.5 mm female connector, Tektronix part number 131-9062-00.
Planar Crown 3.5 mm male connector, Tektronix part number 131-8822-00.
Planar Crown Type N female connector, Tektronix part number 131-4329-00.
Planar Crown SMA female connector, Tektronix part number 131-8689-00.
Transit Case – Tektronix part number 016-1963-00.
Rackmount Retrofit - RSA56KR.
ssories
2 RS A5100B Series Quick Start User Manual
Page 21

Options
See the RSA5000B datasheet at www.tek.com for a current list of available options you can add to your analyzer.
Upgrades
RSA5BUP SPARE-WIN10 – Adds an additional removable solid-state hard drive. Windows 10 and instrument software
pre-install
Installation
ed.)
RSA5BUP WIN
preinstalled.
RSA5BUP WIN10INT– An internally mounted drive. The Windows 10 operating system and instrument software is
preinstalled.
NOTE. Wind
How to man
The 5GNR Analysis option provides 5GNR analysis capabilities. To use the option, it must first be activated on the
instrument. Activation requires an activation c ode that you will receive from Tektronix. (The code is 20 digit alphanumeric
characters separated by a hyphen between every four characters). The following procedures show you how to activate or
deactivate 5GNR Analysis.
5GNR Analysis activation
1. On the T
will appear.
10REM– A removable solid-state drive. The Windows 10 operating system and instrument software is
ows 1 0 requires activation to operate in Activated mode. (See page 8, Activating Microsoft Windows 10.)
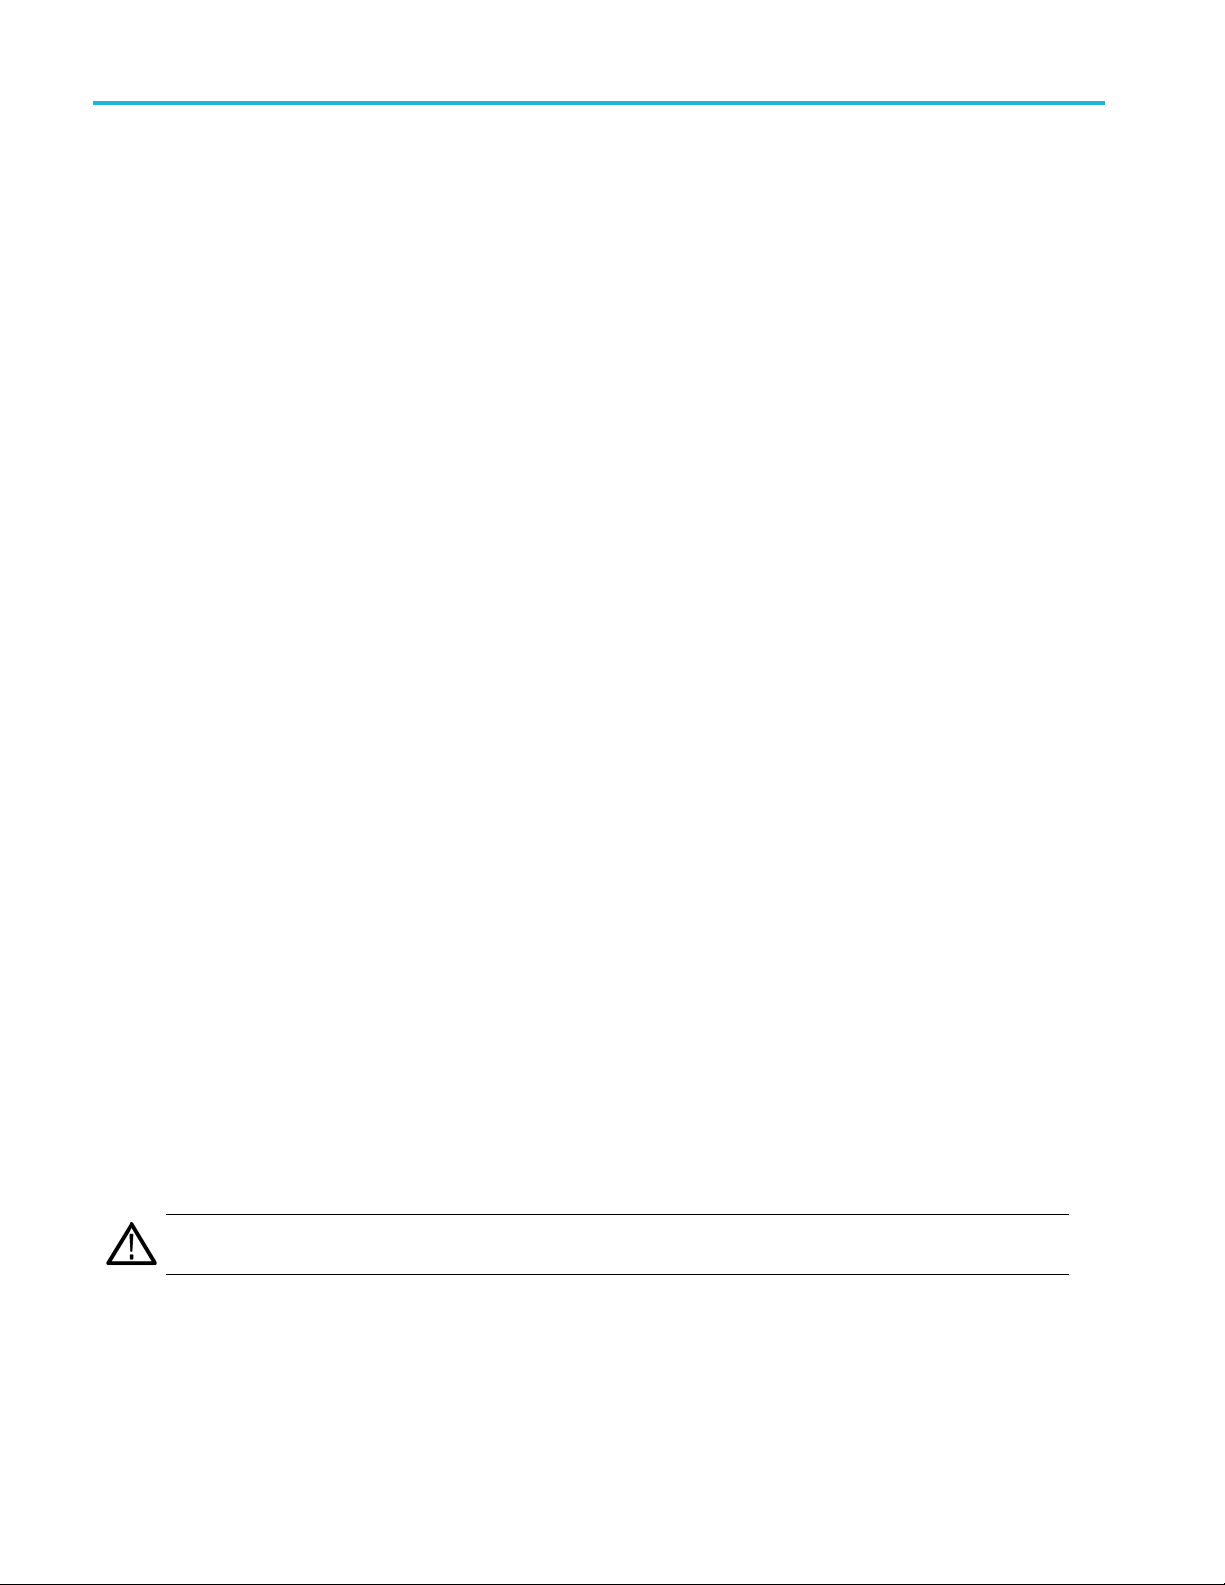
age the 5GNR analysis license
ools menu, click Manage 5GNR Analysis Activation....TheManage 5GNR Analysis Activation dialog box
RSA5100B S eries Quick Start User Manual 3
Page 22
Installation
2. If you do not have the activation code, select Copy under Activation to copy the Computer ID and API Version. You
will then need t
o share those with your local Tektronix account manager to get the activation code generated for the
instrument. Once you have the code, proceed to the next step.
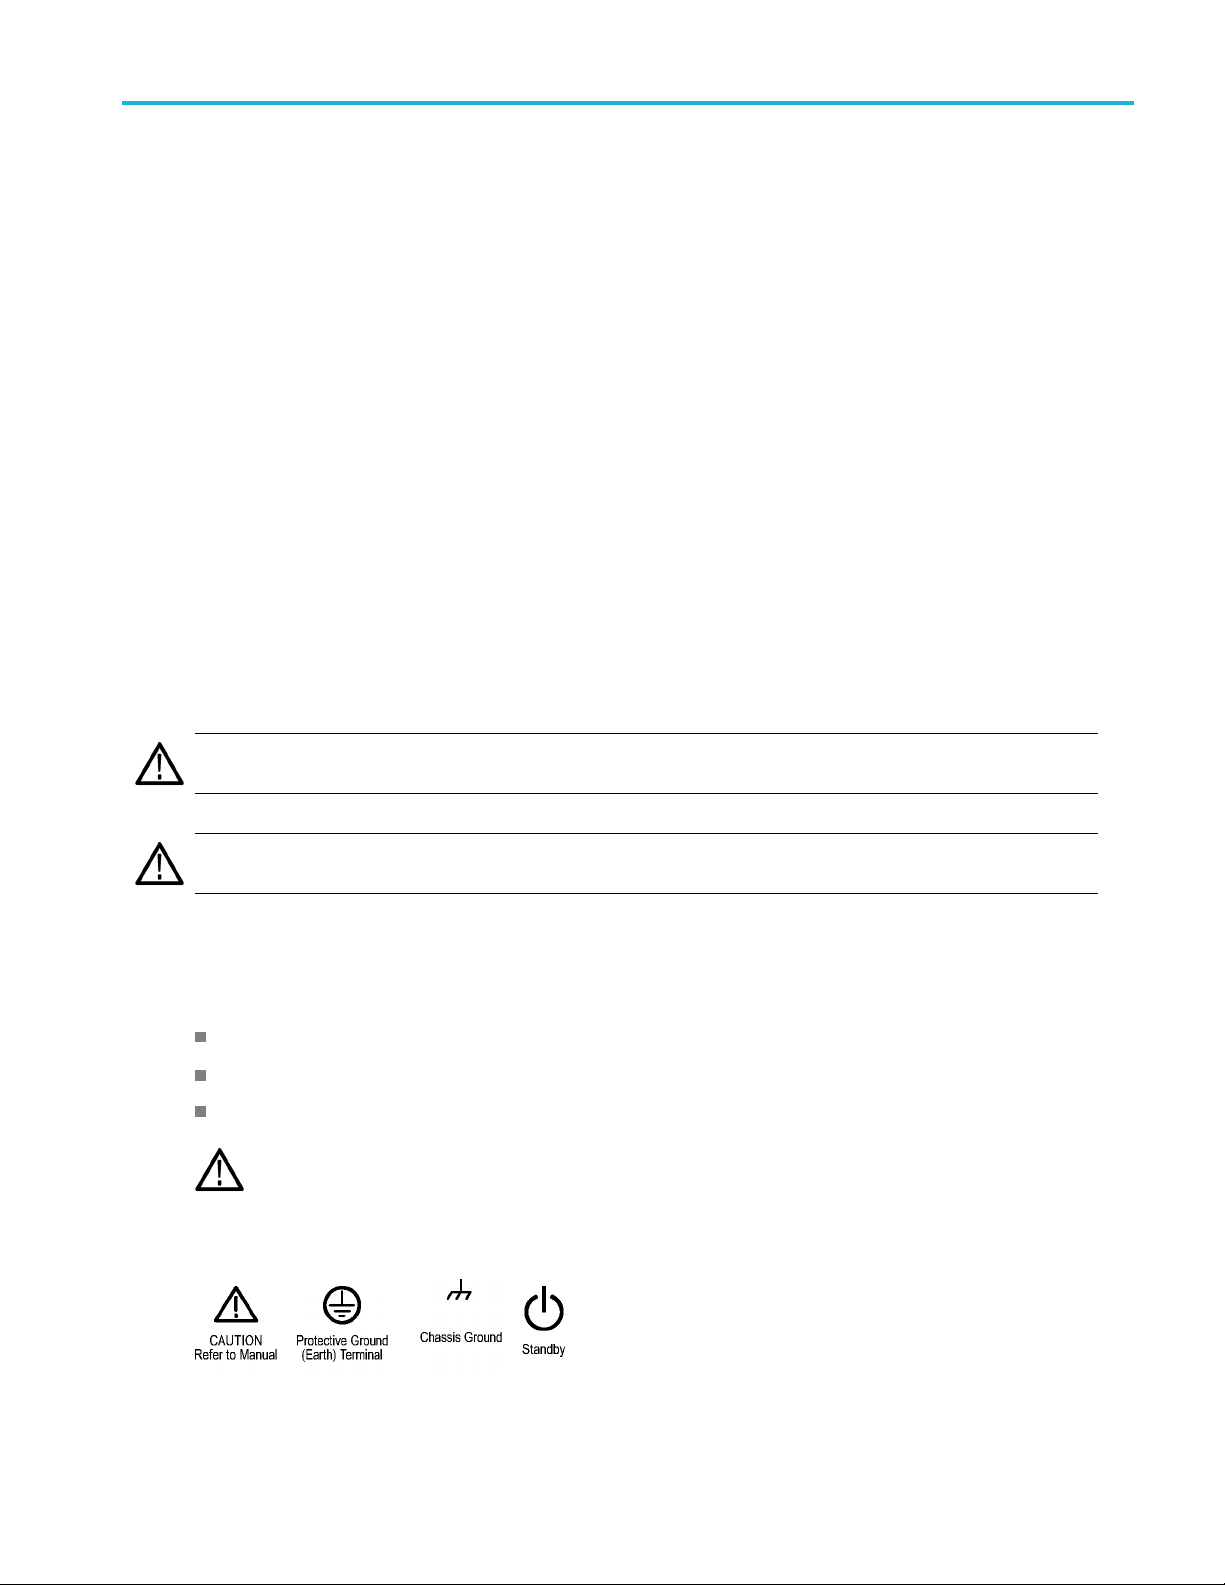
3. If you have the activation code that you received from Tektronix, enter it in the Activation code field and then select
Activate.
4 RS A5100B Series Quick Start User Manual
Page 23
Installation
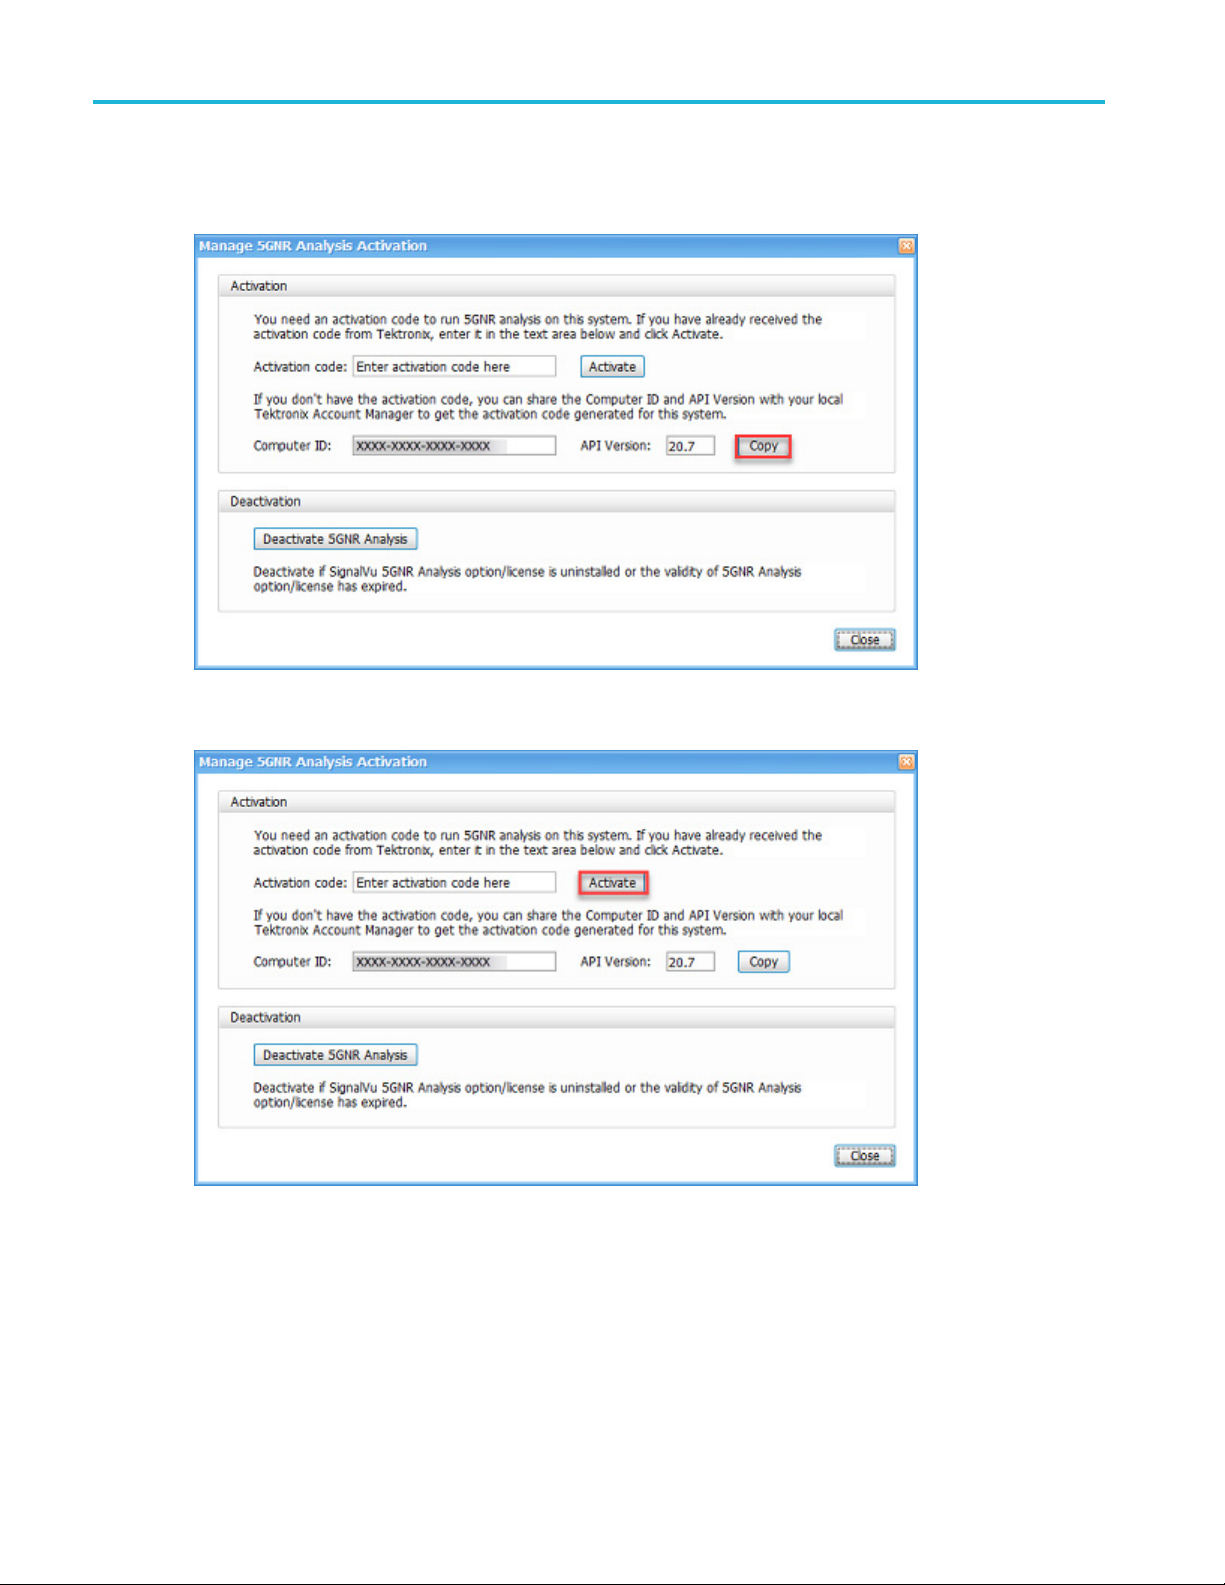
4. If you receive the “5GNR Analysis activation failed. Please enter a valid activation code.” message, click OK and then
contact your lo
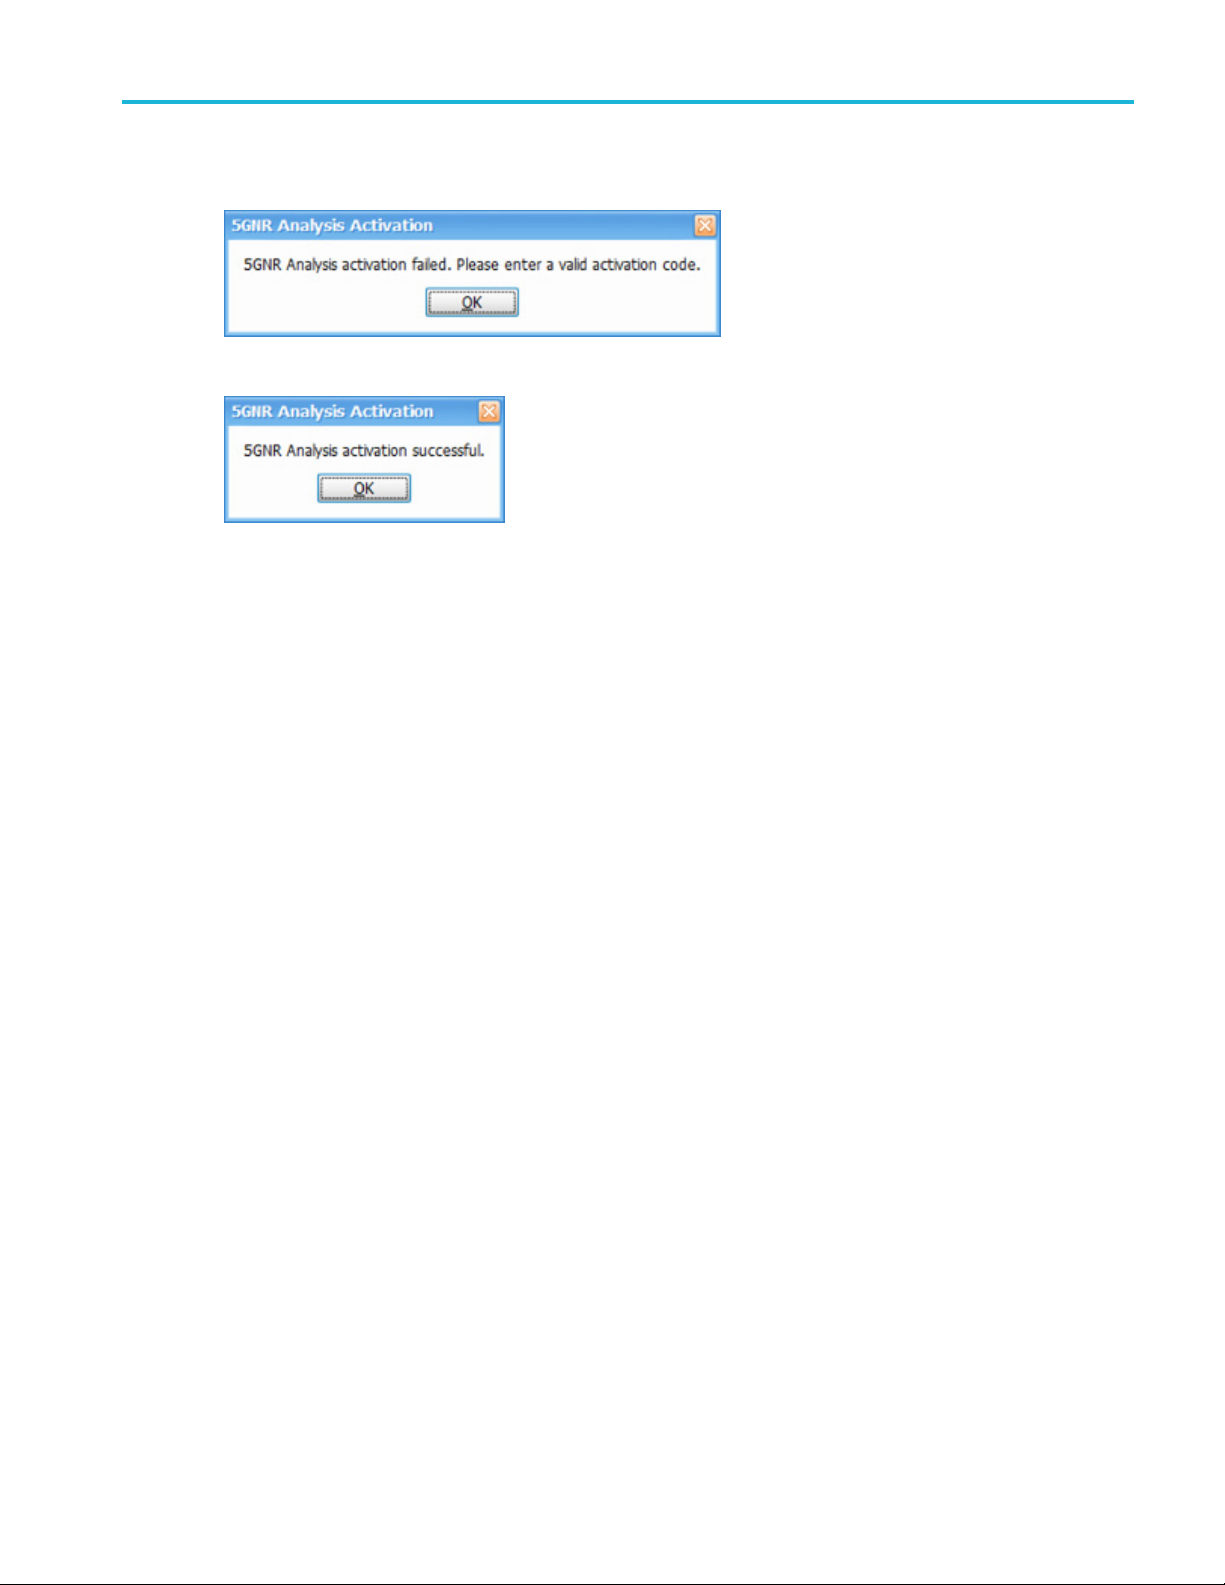
5. If you receive the “5GNR Analysis activation successful.” message, click OK.
6. Close the Manage 5GNR Analysis Activation dialog box and restart the application.
cal Tektronix support or Account Manager to get the correct activation code.
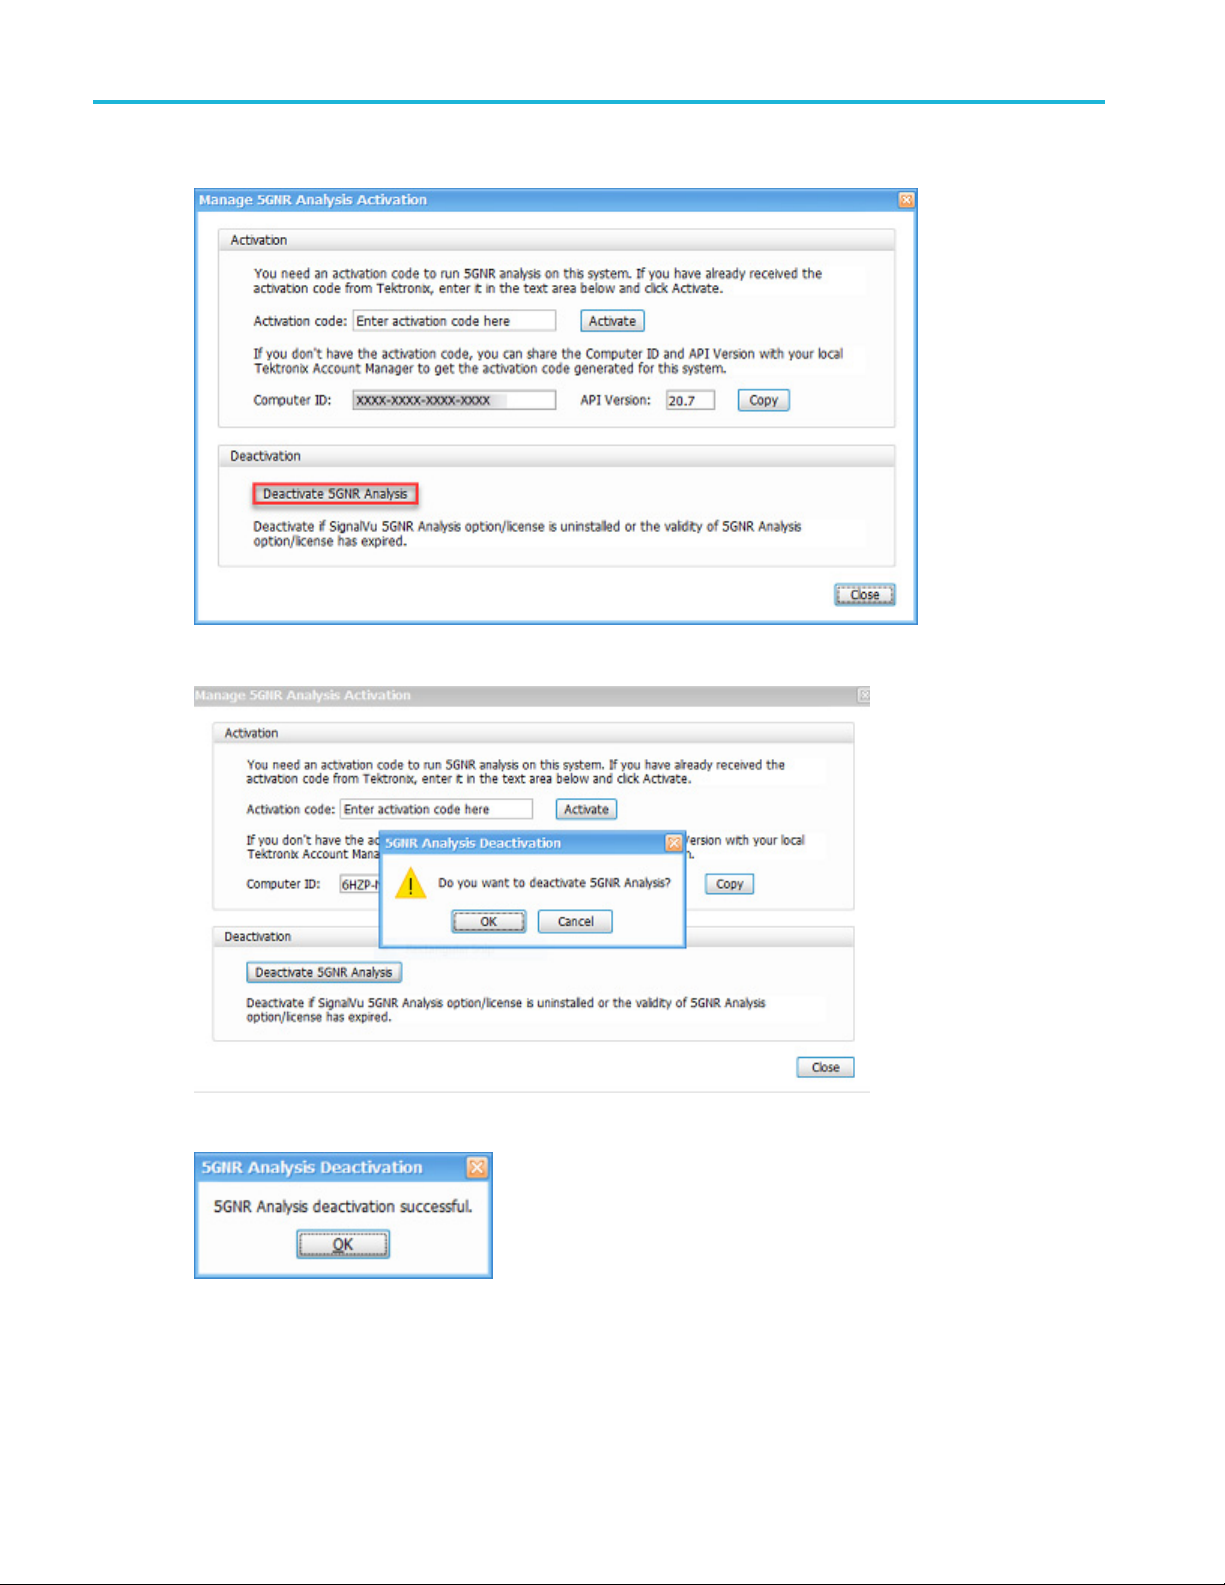
5GNR Analysis deactivation
1. On the Tools menu, click Manage 5GNR Analysis Activation....TheManage 5GNR Analysis Activation dialog box
will appear.
RSA5100B S eries Quick Start User Manual 5
Page 24
Installation
2. Select Deactivate 5GNR Analysis under Deactivation.
3. Select OK in the popup window to continue with 5GNR Analysis deactivation.
4. If you receive the “5GNR Analysis deacti vation successful.” message, click OK.
5. Restart the application.
6 RS A5100B Series Quick Start User Manual
Page 25
Operating Considerations
Power supply requirements
Source voltage and frequency Power consumption
100 – 240 V
115 V
RMS
, 400
, 50/60 Hz
RMS
Hz
Installation
450 W maximum (all models)
Environmen
Characteristic Description
Operating temperature +10 °C to +40 °C
Non-opera
Humidity
Operating
Altitude:
Operati
Non-operating
Cooling clearance
Bottom
Sides
tal requirements
ting temperature
ng
and back
-20°Cto+60°C
+40 °C at 95% relative humidity, meets intent of EN 60068-2-30.
Frequency amplitude response may vary up to ±3 dB at +40 °C and greater
than 45%
Up to 30
12190 m (40,000 ft)
20 mm (0.79 in)
50 mm (1.97 in)
relative humidity.
00 m (9843 ft)
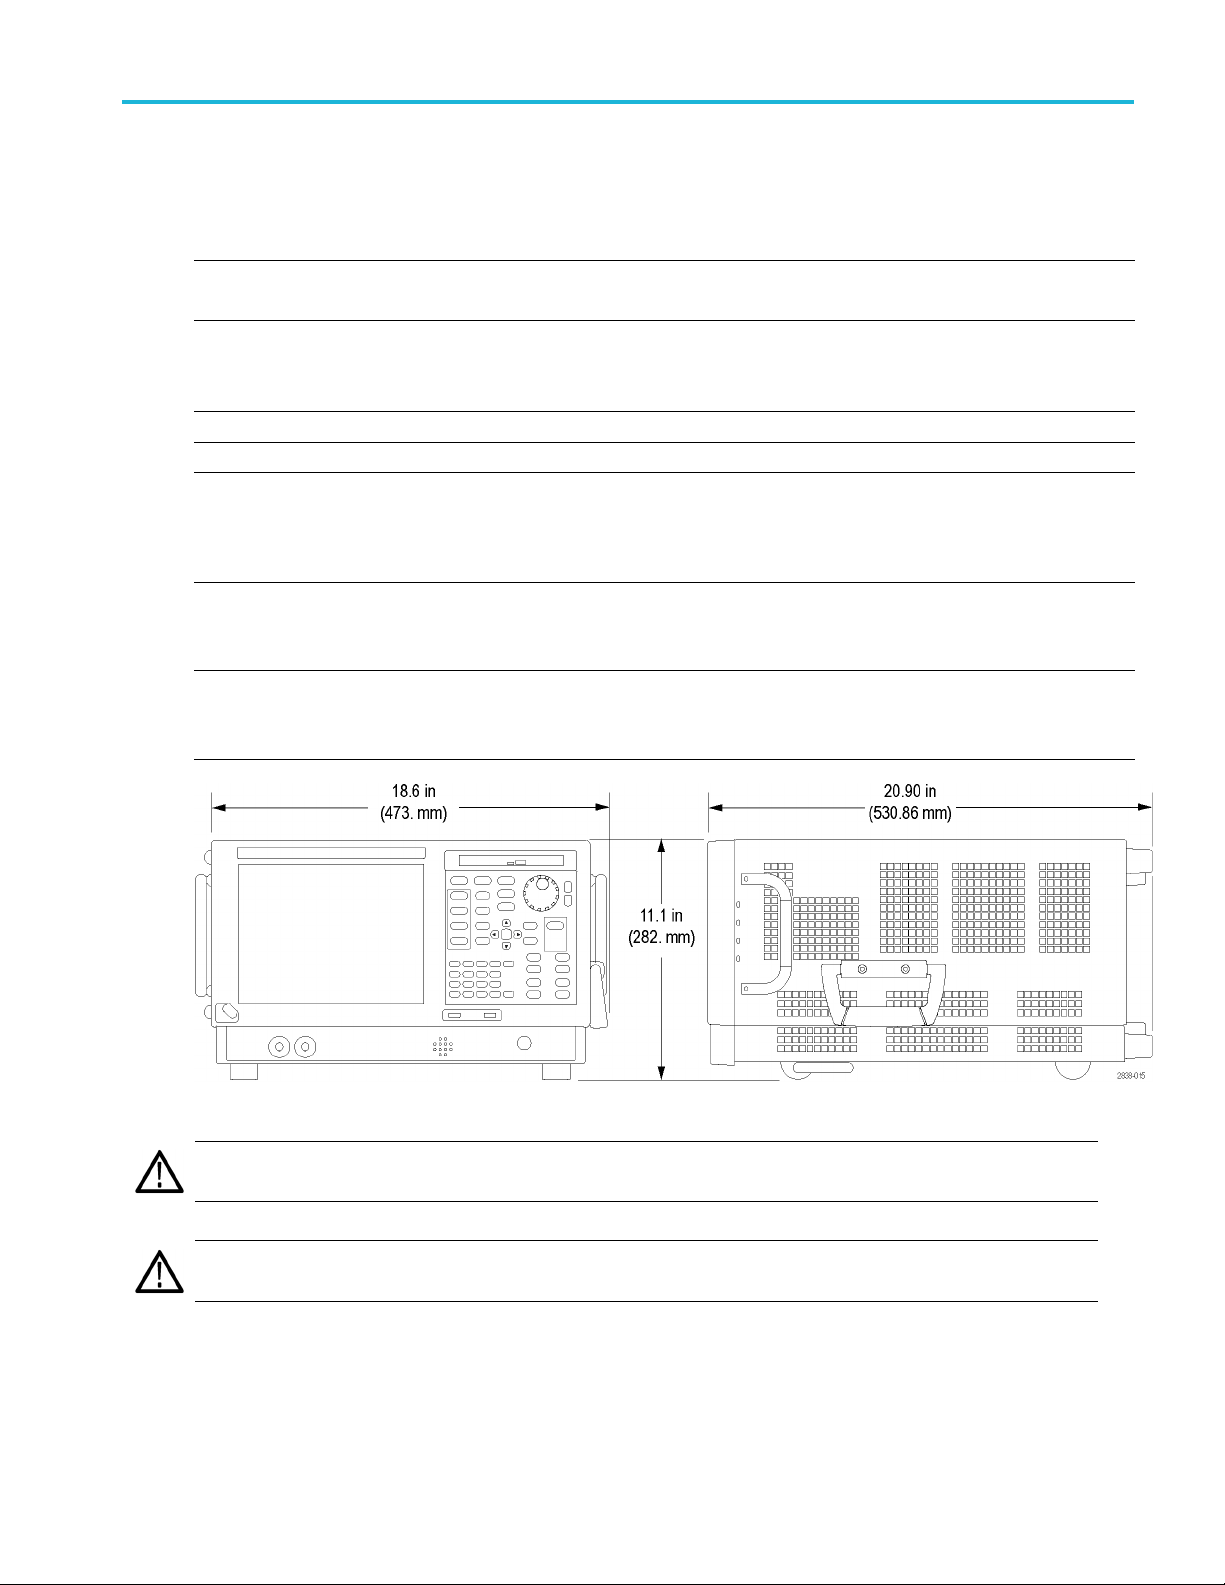
CAUTION. To ensure proper cooling, do not operate the instrument on its side. Operate the instrument only when it is
sting on i ts bottom feet or rear feet. Maintain at least 2 inches (5 cm.) clearance around ventilation openings.
re
WARNING. To avoid personal injury, take extra care when lifting or moving the signal analyzer. The instrument is heavy and
requires extra care when moving it.
RSA5100B S eries Quick Start User Manual 7
Page 26
Installation
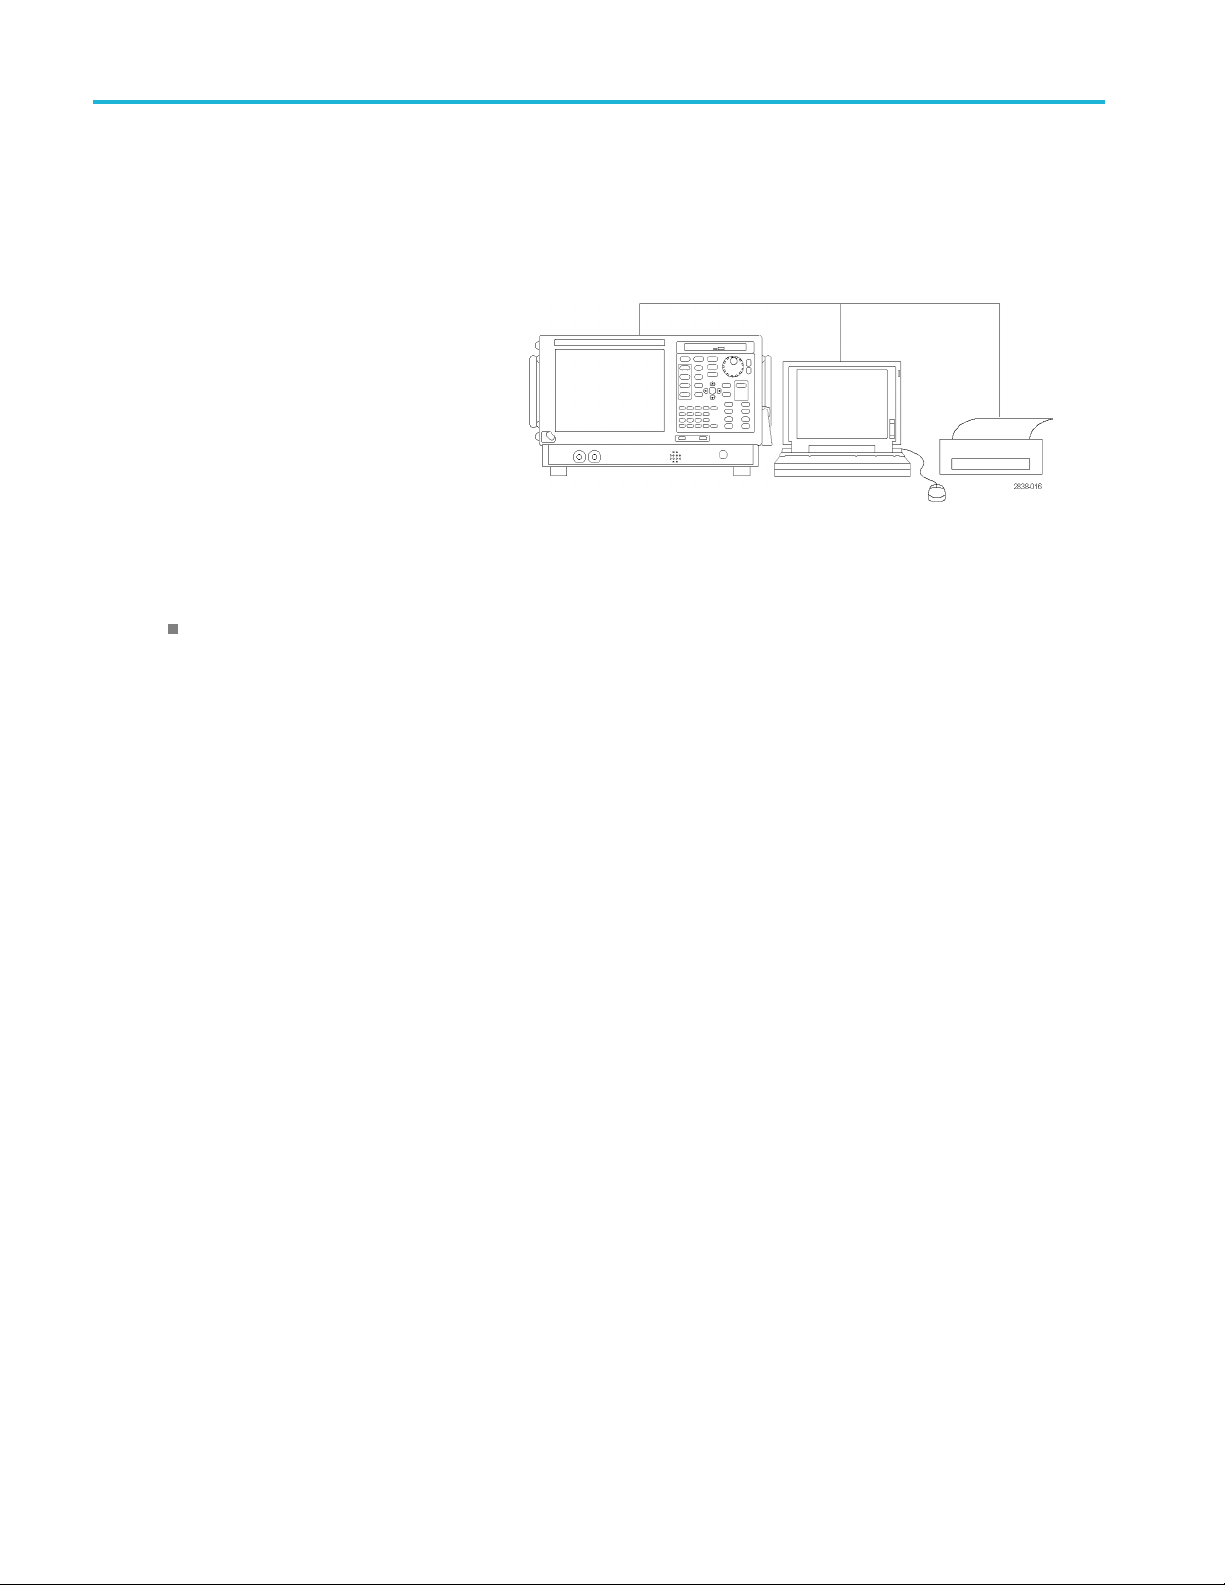
Connecting to the Instrument
Connecting to a Network
Connect your keyboard, mouse, printer, and other accessories to your instrument before applying power. (Accessories with
USB connecto
rs can be connected before or after applying power.)
You can conne
network for printing, file sharing, Internet
access, and other functions. C onsult your
network adm
Windows utilities to configure the instrument
for your network.
ct your instrument to a
inistrator and use the standard
Quick Tip
If you con
regular approved operating system updates, and using up-to-date antivirus software.
nect your instrument to a network, you should protect your instrument by using an internet firewall, installing
Activating Microsoft Windows 10
The version of Microsoft Windows 10 that ships with this product is shipped in Deferred Activation mode. Microsoft has
a default activation method that requires a connection to the Internet. If you do not have a connection, you can activate
Windows 10 by phone or you can continue to operate in Deferred Activation mode.
First time activation
You can activate Windows 10 two ways.
1. Connect to the Internet. Windows will automatically activate. You can also go to System Properties to connect and
activate.
2. Call Microsoft and speak with a representative to activate Windows 10. Contact information and a unique activation
(installation ID) will appear in a pop up window.
code
Activation with removable drives
If the SSD is removed from one analyzer and inserted into another analyzer, then the activation process will need to run
again. If analyzer 2 is not connected to the Internet, the activation will fail and an Activate Windows watermark will display on
the screen. To activate Windows and remove the watermark, you must connect to the Internet or call Microsoft.
8 RS A5100B Series Quick Start User Manual
Page 27
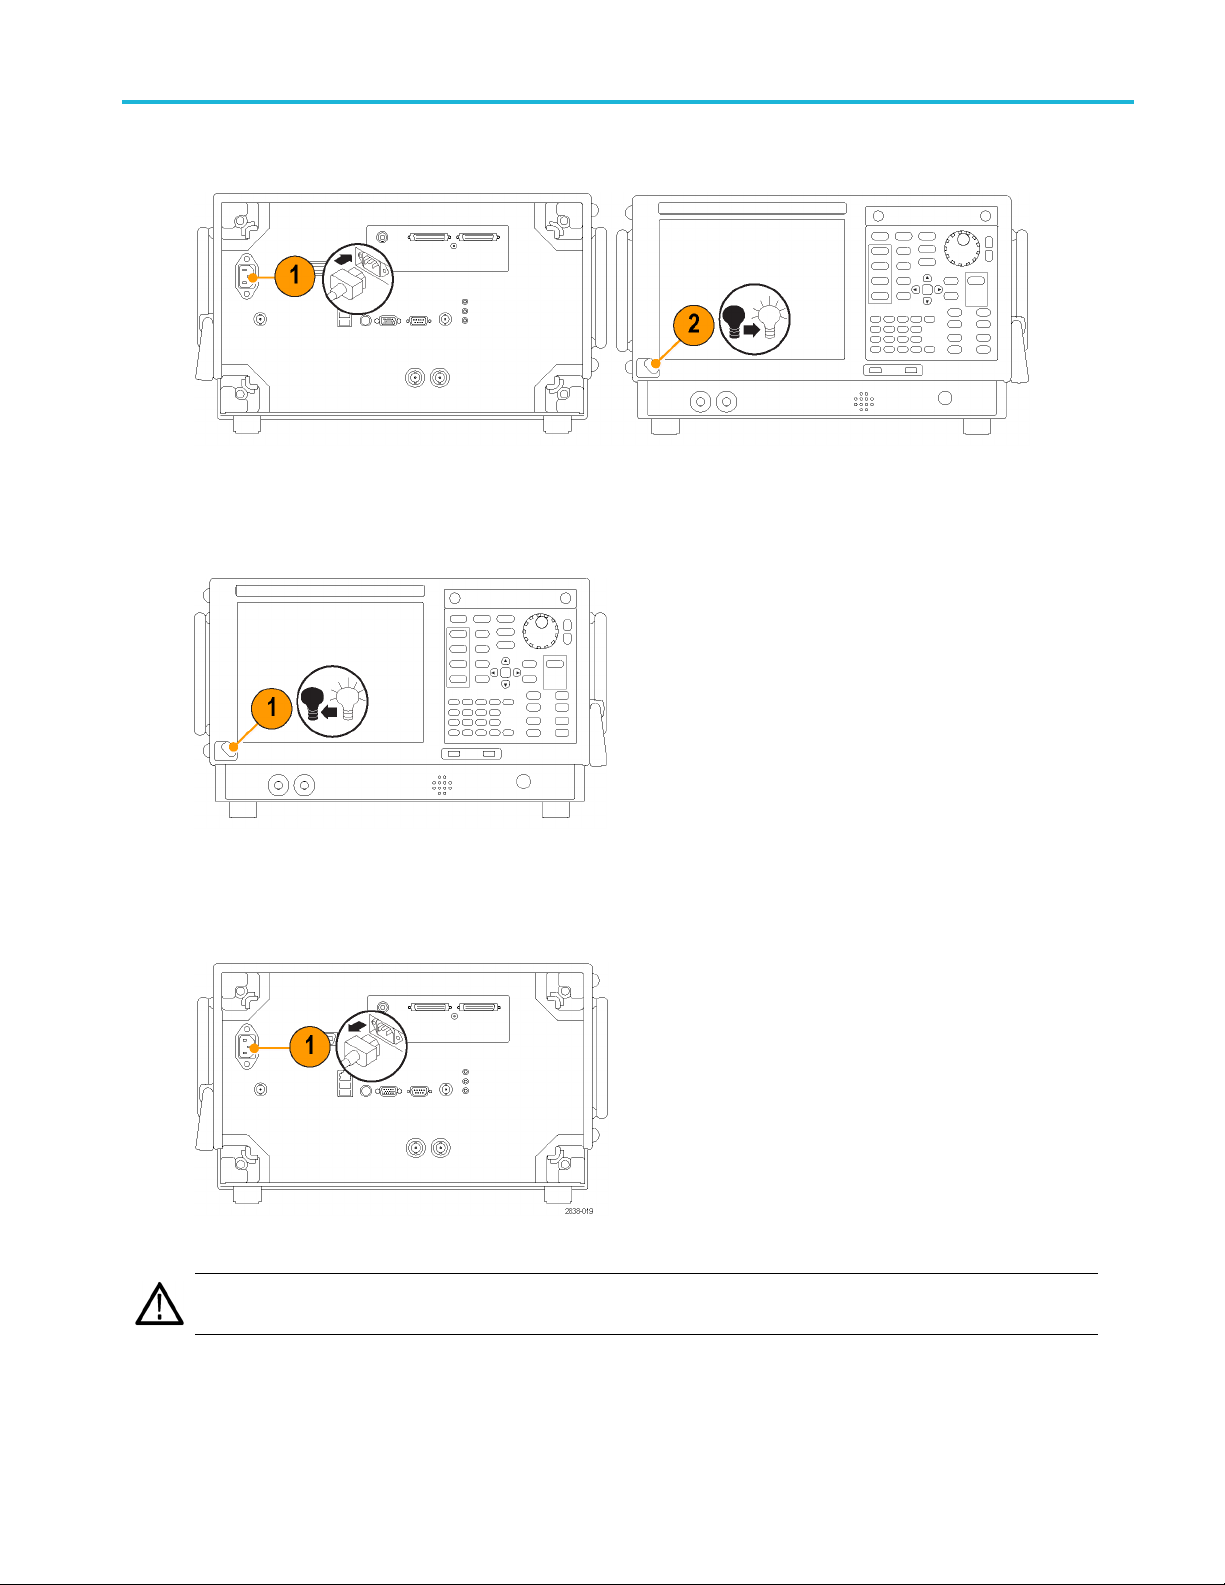
Powering On the Instrument
Powering Off the Instrument
Installation
Removing the Power
CAUTION. Do not remove the power cord while the instrument is running. P ower off the instrument first, allowing the
instrument to completely shut down before removing the power cord. The fans stopping is a good indicator.
RSA5100B S eries Quick Start User Manual 9
Page 28
Installation
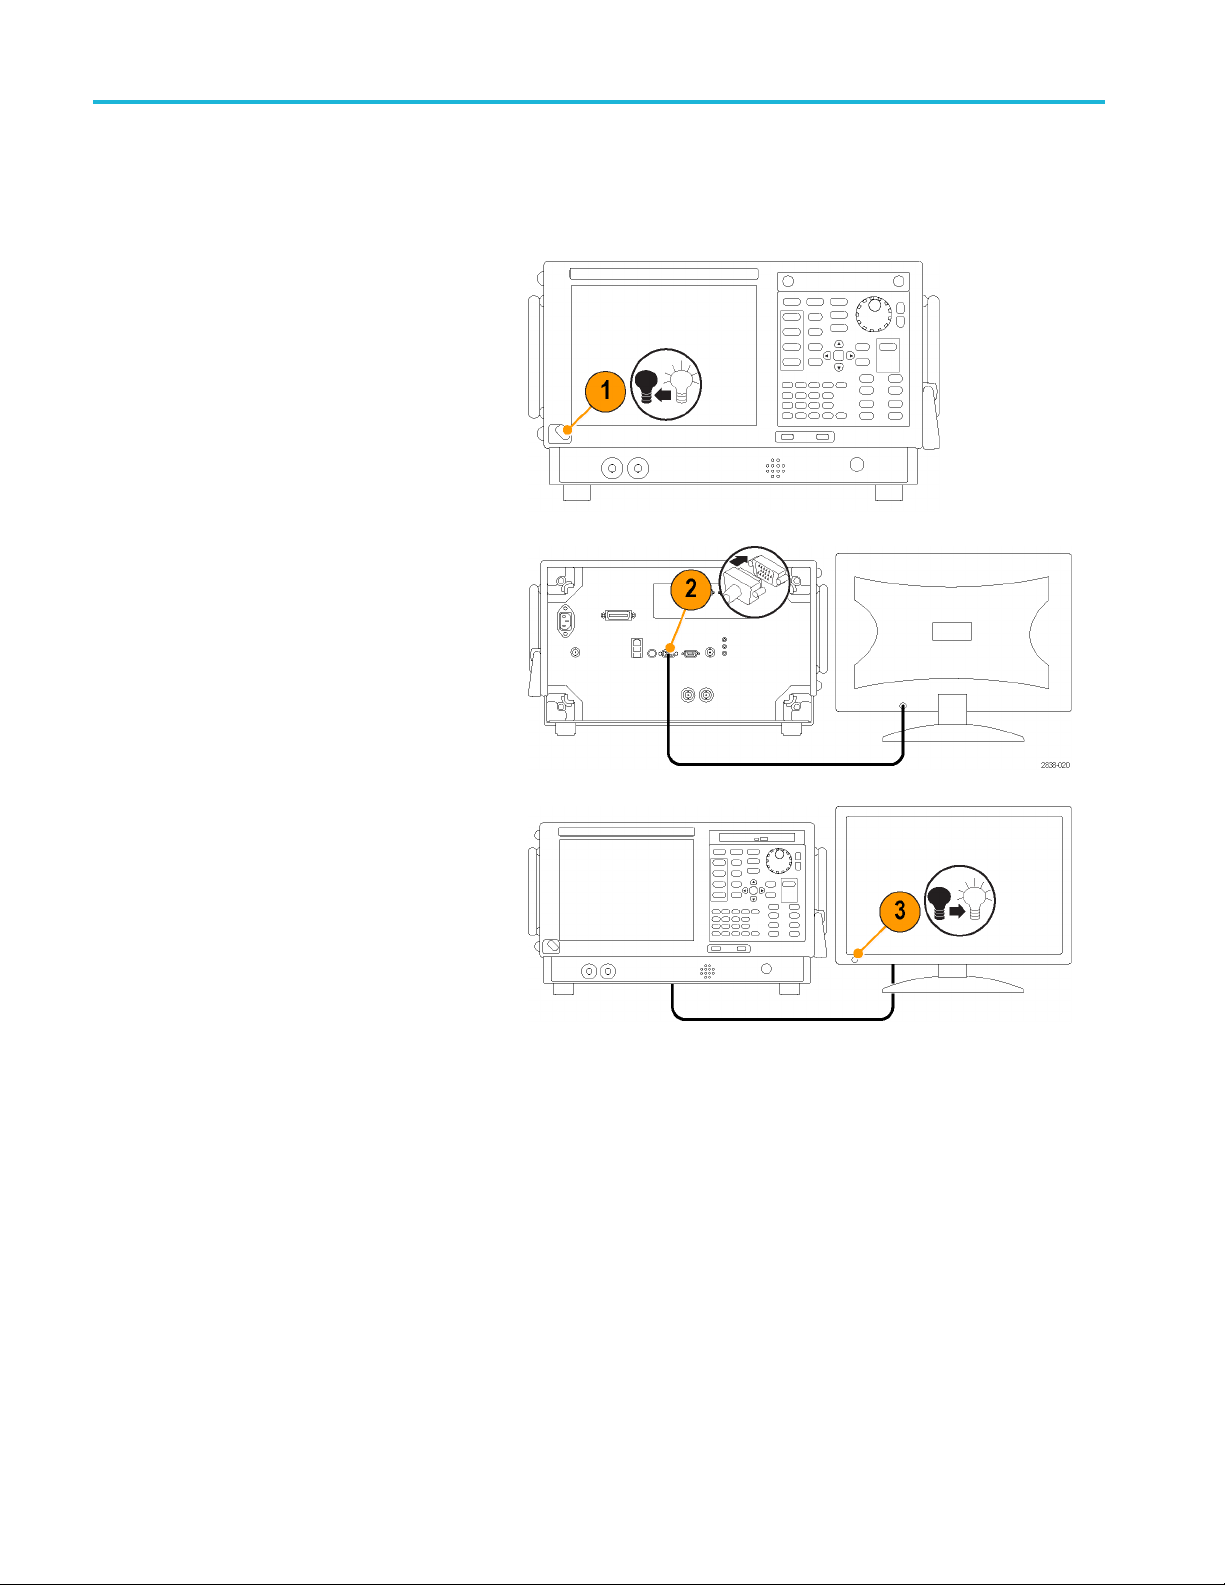
Adding an External Monitor
Use the following procedure to add an external monitor for dual monitor configuration. Both the analyzer and the second
monitor must have the color set to True Color.
1. Power on the analyzer.
2. Connect the external monitor to the
analyzer.
3. Power on
You can now navigate to the Display Settings in Windows 10 to extend the desktop to the connected monitor and set
display settings.
the external monitor.
10 RSA5100B Series Quick Start User Manual
Page 29

Inspecting the Instrument
Run the diagnostics application (Tools > Diagnostics). If failures occur, perform the following steps to get more information
about them. You can also use the following steps as a detailed incoming inspection to verify the functionality of y our
instrument. If you want to check the accuracy specifications of your instrument, see the RSA5100B Series Real-Time
Signal Analyzers Specifications and P erformance Verification Technical Reference manual PDF located on the Product
Documentation CD.
1. Select Tools > Diagnostics.
Installation
2. On the Dia
Modules, All Tests.
3. Click Single Test.
4. Click RUN.
The instrument will run through the
tests o
or X icon will appear to the right
of each check box as that test is
comple
the test was passed. An X means
the test has failed.
5. For tests that require manual
inter
instructions to complete the tests.
NOTE. Select the Diagnostics Failure Information tab to see basic diagnostic failure information. Use the Windows Event
Viewer (Control Panel > System and Security > Administrative Tools > Event Viewer) to view failure history and nondiagnostic
ures reported by the application.
fail
gnostics tab, click All
ne at a time. A check mark
ted. The check icon means
vention, follow the on-screen
RSA5100B S eries Quick Start User Manual 11
Page 30
Installation
User Maintenance
Caring for the Planar Crown RF Input Connector (RSA5115B/RSA5126B Only)
The Planar Crown input connector consists of two parts. The first part is the Planar Bulkhead, which is mounted in the
instrument front panel. The second part of the input connector is the Planar Crown, which mates to the Planar Bulkhead. The
Planar Crown c
an be easily changed should the connector become damaged or a different connector type be required.
No tools are r
sufficient to ensure an excellent connection.
When changing connectors, be careful not to touch inner surfaces of the connector halves.
Use only a 75% isopropyl alcohol solution to clean the Planar Crown connector, if needed. Do not use tap water to clean the
connector. Do not submerge the connector in a cleaning solution. Do not use abrasive compounds to clean the connector.
Cleaning Y
Clean the exterior surfaces of the chassis with a dry lint-free cloth or a soft-bristle brush. If any dirt remains, use a cloth or
swab dipped in a 75% isopropyl alcohol solution. Use a swab to clean narrow spaces around controls and connectors. Do
not use abrasive compounds on any part of the instrument because they might damage the instrument.
CAUTION. Avoid getting moisture inside the instrument during exterior cleaning; use just enough moisture to dampen the
cloth or swab. Do not wash the front-panel On/Standby switch. Cover the switch while washing the instrument. Use only
deionized or distilled water when cleaning. Use a 75% isopropyl alcohol solution as a cleanser and rinse with deionized
or distilled water. Do not use chemical cleaning agents; they might damage the chassis. Avoid chemicals that contain
benzene, toluene, xylene, acetone, or similar solvents.
CAUTION. To prevent damage to the flat panel display, do not use improper cleaning agents or methods. Avoid using
abrasive cleaners or commercial glass cleaners to clean the displ ay surface. Avoid spraying liquids directly on the display
surface. Avoid scrubbing the display with excessive force.
equired to remove or install the Planar Crown connector. A reasonable hand tightening of the connector is
our Instrument
Clean the d isplay surface by gently rubbing the display with a clean-room wipe. If the display is very dirty, moisten the wipe
with distilled water or a 75% isopropyl alcohol solution and gently rub the display surface. Avoid using excess force; this
might damage the display surface.
12 RSA5100B Series Quick Start User Manual
Page 31

Installation
Upgrading the Instrument Software
Software upgrades are available by downloading them from the Tektronix Web site www.tektronix.com/software.Toadd
additional software options or features, you will need an option key from Tektronix. When you receive the option k ey from
Tektronix, follow the installation instructions provided with the upgrade.
Returning Your Instrument
If you return your instrument to Tektronix:
Back up any user software on the hard disk. You may need to reinstall the software after your instrument is returned.
When repacking the instrument for shipment, use the original packaging. If the packaging is unavailable or unfit for use,
contact your local Tektronix representative to obtain new packaging.
Seal the shipping carton with an industrial stapler or strapping tape.
RSA5100B S eries Quick Start User Manual 13
Page 32

Operation
Operation
Getting Acquainted with Your Instrument
Controls and display elements are shown in the following illustrations and tables.
Front Panel Controls
Most front panel controls are shortcuts for opening control panels.
Ref number Item Description Menu equivalent
1 Media
2 Displays
3
4 Trigger
5
6 Analysis
7
8
9 Amplitude
10
1
Applicable only when the selected display is Spectrum, DPX Spectrum, or Spectrogram.
Settings Opens the Settings control panel for the selected display. Setup > Settings
Acquire
Freq
Span (Spectrum) Adjusts the span or frequency range shown in the Spectrum
BW (Spectrum) Adjust the resolution bandwidth (RBW).
Optional removable solid-state hard drive.
Opens the Displays dialog box to select measurement
displays.
Opens the Trigger control panel. Setup > Trigger
Opens the Acquire control panel. Setup > Acquire
Opens the Analysis control panel. Setup > Analysis
Adjusts the measurement frequency. Setup > Analysis >
1
display.
Adjusts the reference level. Setup > Amplitude
1
Setup > Displays
Frequency tab
Setup > Settings >
Freq & Span
Setup > Settings >
BW tab
1
1
14 RSA5100B Series Quick Start User Manual
Page 33
Operation
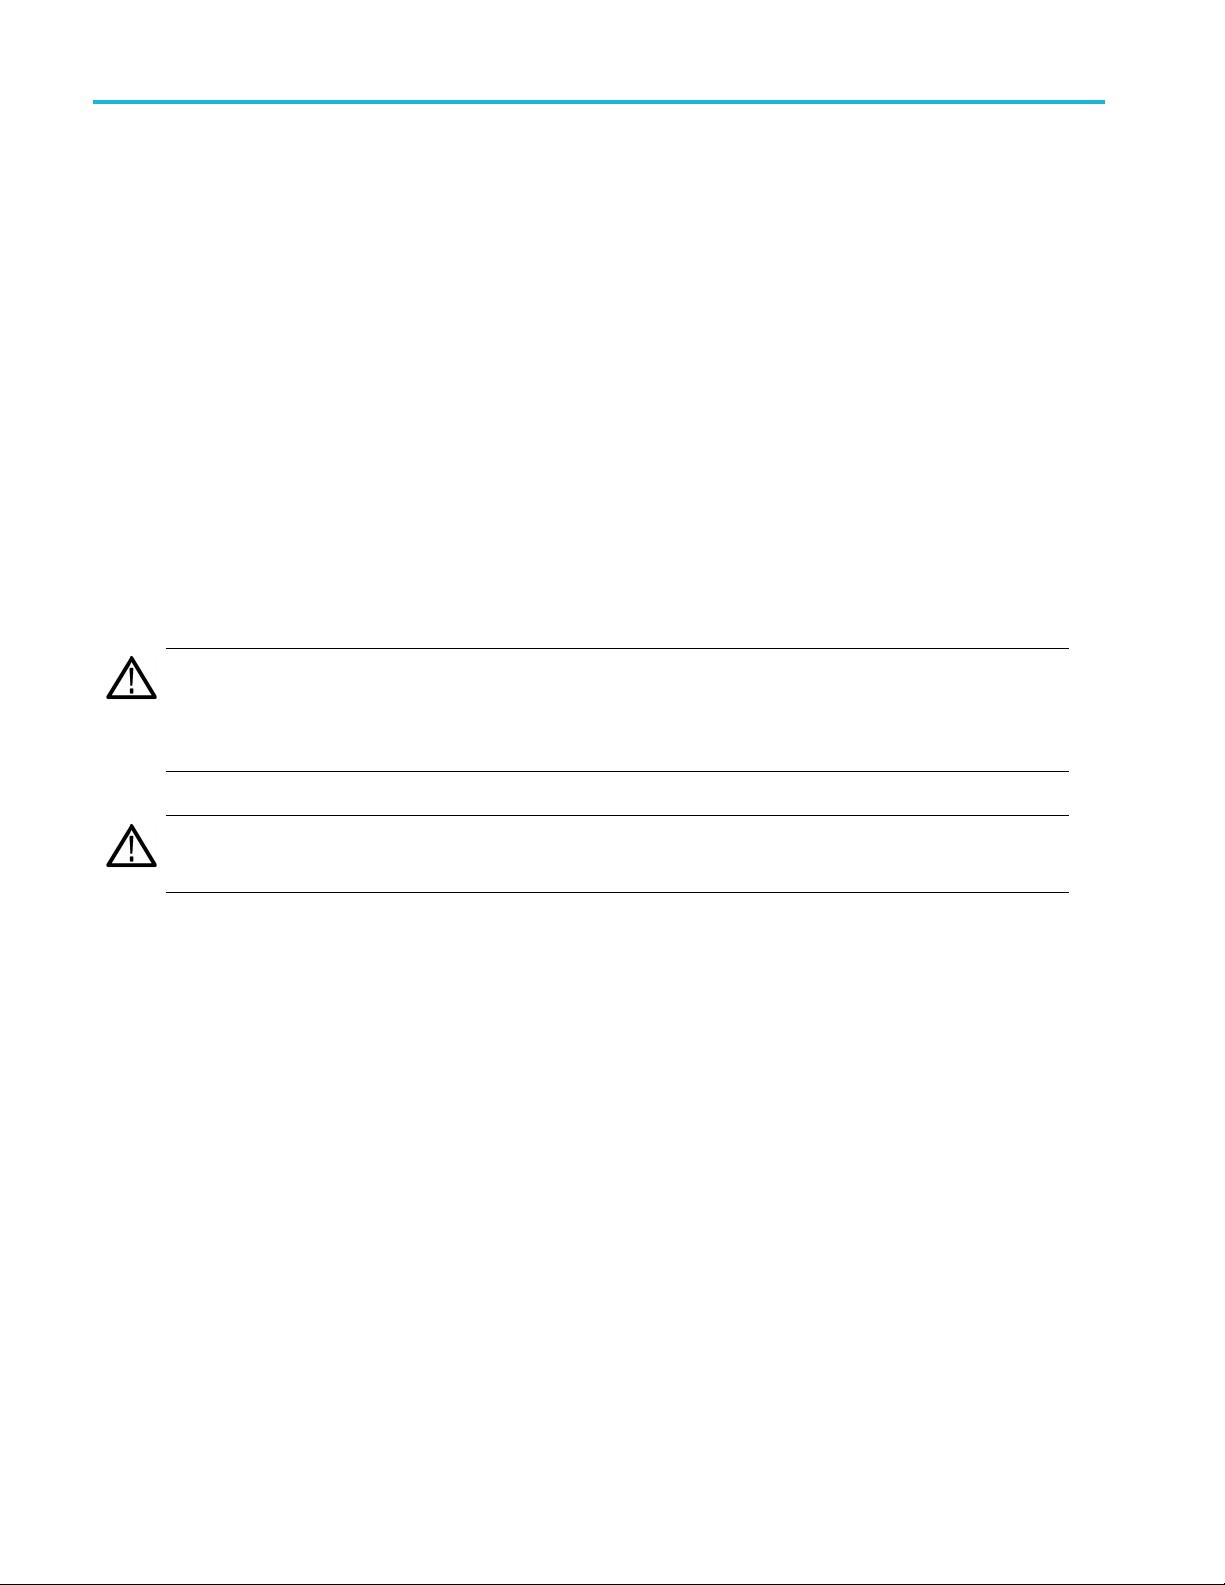
Ref number Item Description Menu equivalent
12
13 Markers, Peak
14
15
17
18 Arrow keys Move the Markers. The Up arrow moves the selected
19
20 Markers, Delete Deletes the highest-numbered marker.
21 Markers, Add Adds a marker to the selected trace.
22 Replay Replays the current acquisition record.
23
Run (Stop)
Markers, Select Selects the next marker.
Markers, Define Opens the Markers control panel. Markers > Define
Control knob Increments/decrements numbers w ith fine resolution.
Increment /
decrement keys
Single Sets the Run mode to Single Sequence and initiates a single
Push to start and stop acquisitions. Run > Run
Moves the active marker to the maximum peak of the trace
in the selected display. If markers are turned off, the MR
(marker reference) marker will appear at the maximum peak.
Markers
marker 10 trace points to the right. The down arrow moves
the selected marker 10 trace points to the left. The left and
right arrows move the selected marker to the next peak.
(Turning the knob moves the marker one trace point left or
right.)
Increments or decrements numbers with coarse resolution.
sequence acquisition cycle.
RSA5100B S eries Quick Start User Manual 15
Page 34

Operation
Ref number Item Description Menu equivalent
24 Keypad Enters values in controls.
25 Enter
Completes the data entry in controls. Same as pressing the
Enter key on the keyboard.
16 RSA5100B Series Quick Start User Manual
Page 35

Operation
Ref number Item Description Menu equivalent
26 Recall
27
28
29 Help Displays the online help. Help >
31 Application
32 DPX
33 User
34 Preset
Save Saves working file using the same user selections as for the
Touch Screen Off Turns the touch screen on and off.
Opens the Recall dialog box.
previous Save action.
Opens the Application preset dialog box. You can change
the effect of pressing Application using the settings at
Presets > Preset Options > Preset type/action.
Opens a DPX display set to the same span as the spectrum
display. If the spectrum display is not open, the span is set
to the last span of the spectrum display. You can change
the effect of pressing DPX using the settings at Presets >
Preset Options > Preset and Preset action.
Opens the User preset dialog box. You can change the
effect of pressing User using the settings at Presets > Preset
Options > Preset type/action.
Resets the instrument to its factory default settings.
File > Recall
File > Save
User Manual
Presets >
Application
Presets > DPX
Presets > User
Preset
RSA5100B S eries Quick Start User Manual 17
Page 36

Operation
Front Panel Connectors
Ref number Item Description
1
2 Trig In External T
3
4
5
Trig Out Trigger output connector. 50 Ω, BNC, High > 2.0 V, Low < 0.4 V, (output current 1 mA)
rigger input connector, –2.5 V to +2.5 V range,
trigger level is user adjustable
USB port USB 2.0 connector
USB port USB 2.0 connector
RF Input
RF input connector 50 Ω
+ 30 dBm (Pre-amp off)
+ 20 dBm
(Pre-amp on)
18 RSA5100B Series Quick Start User Manual
Page 37
Rear Panel
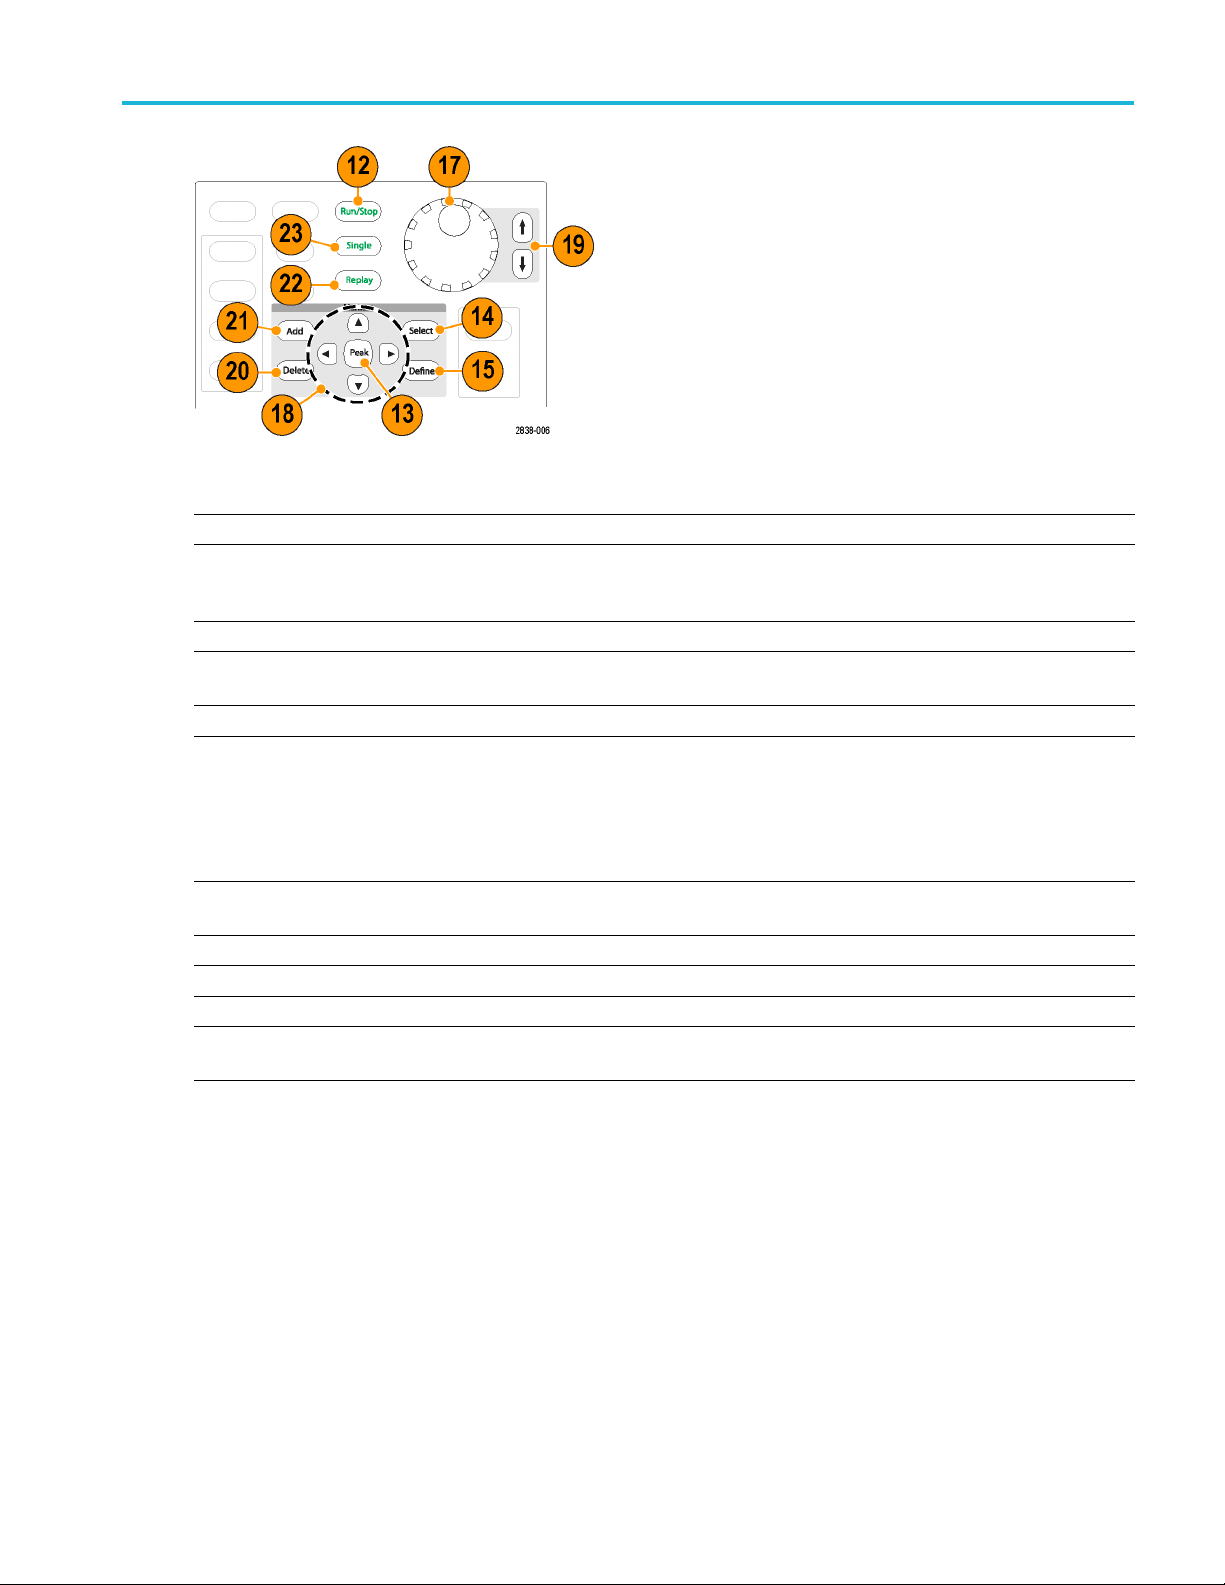
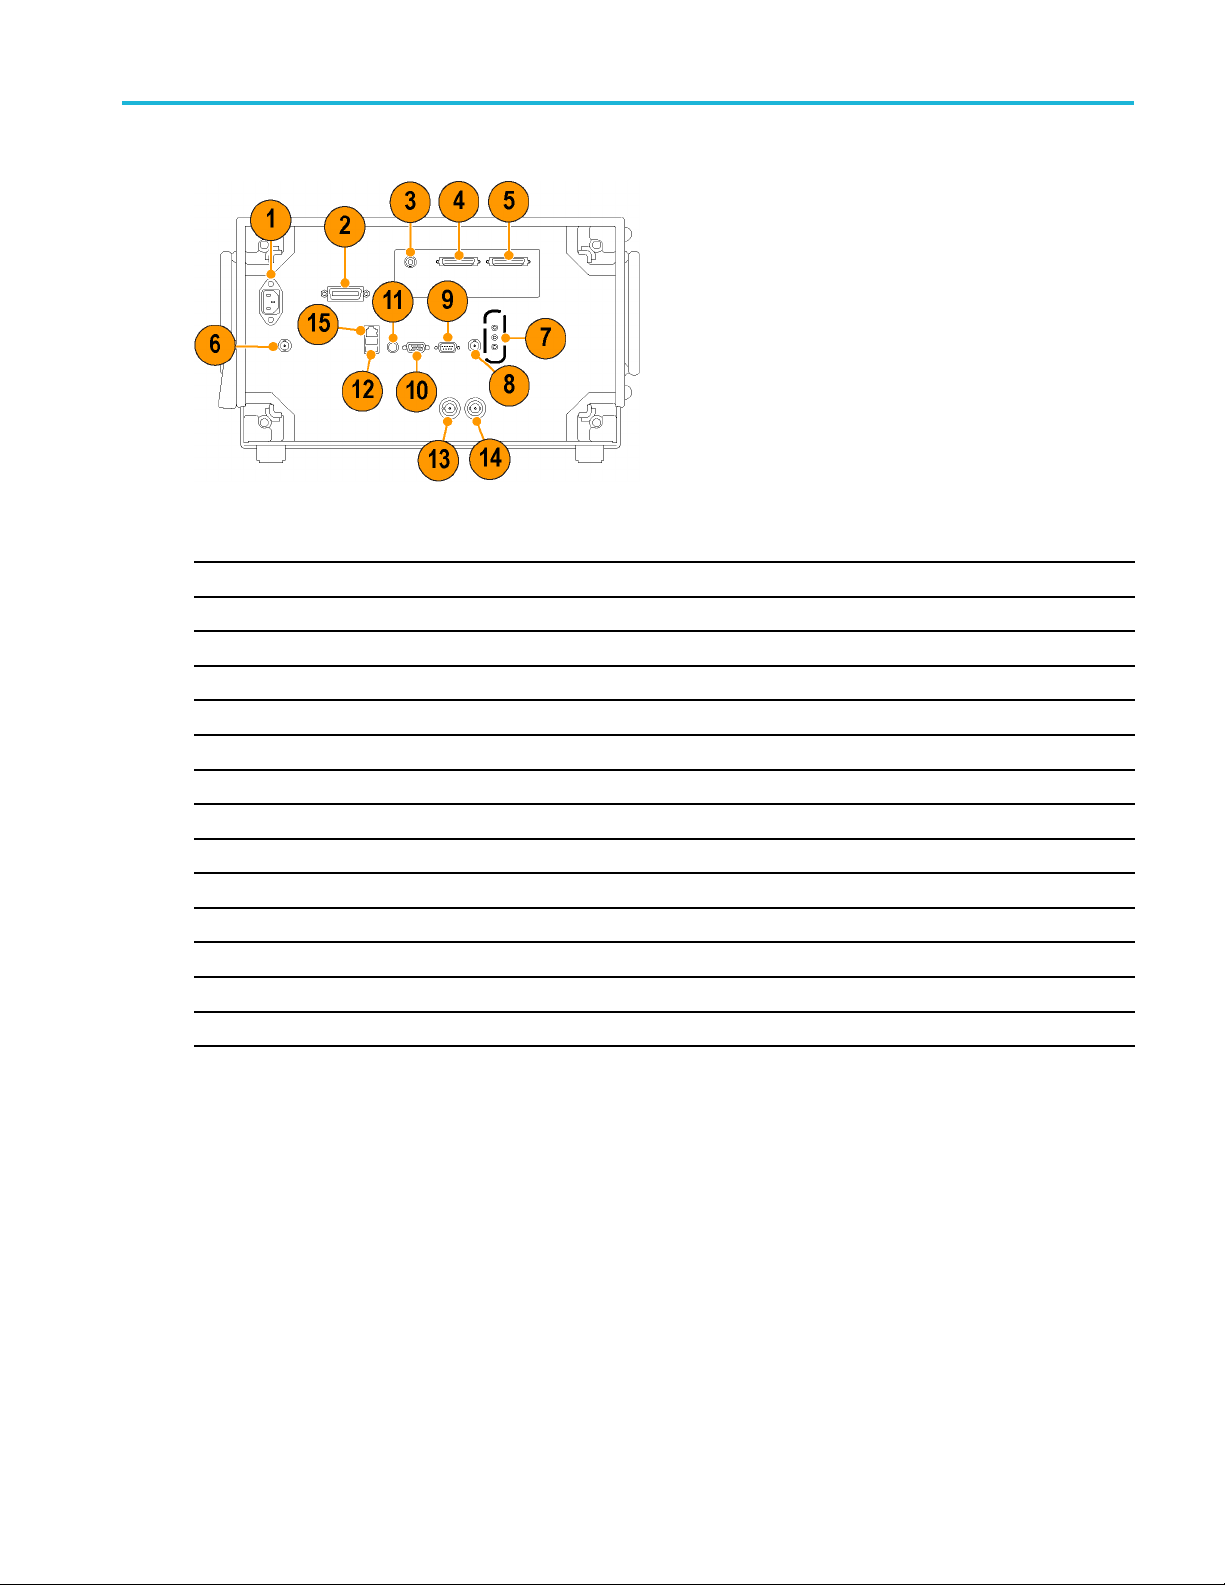
Ref number Connector, Description
Operation
1
2
3
4, 5
6
7
8 External Trigger 2 Input
9
10
11
12
13
14
15
AC Input, main power connector
GPIB
Zero Span Analog Out (Option 66)
Real Time I and Q Out (Option 65)
+28 VDC output, switched
Microphone in; Headphone, audio output; and Line In connectors (Line In not supported)
COM 2, serial port for connecting peripherals
VGA external monitor output (resolution not limited to VGA)
PS2 Keyboard input
USB 2.0 ports for mouse and other peripherals (printers, external hard disks)
Ref Out, reference frequency output
Ref In, reference frequency input
LAN, Ethernet 10/100/1000 Base T network connector
RSA5100B S eries Quick Start User Manual 19
Page 38
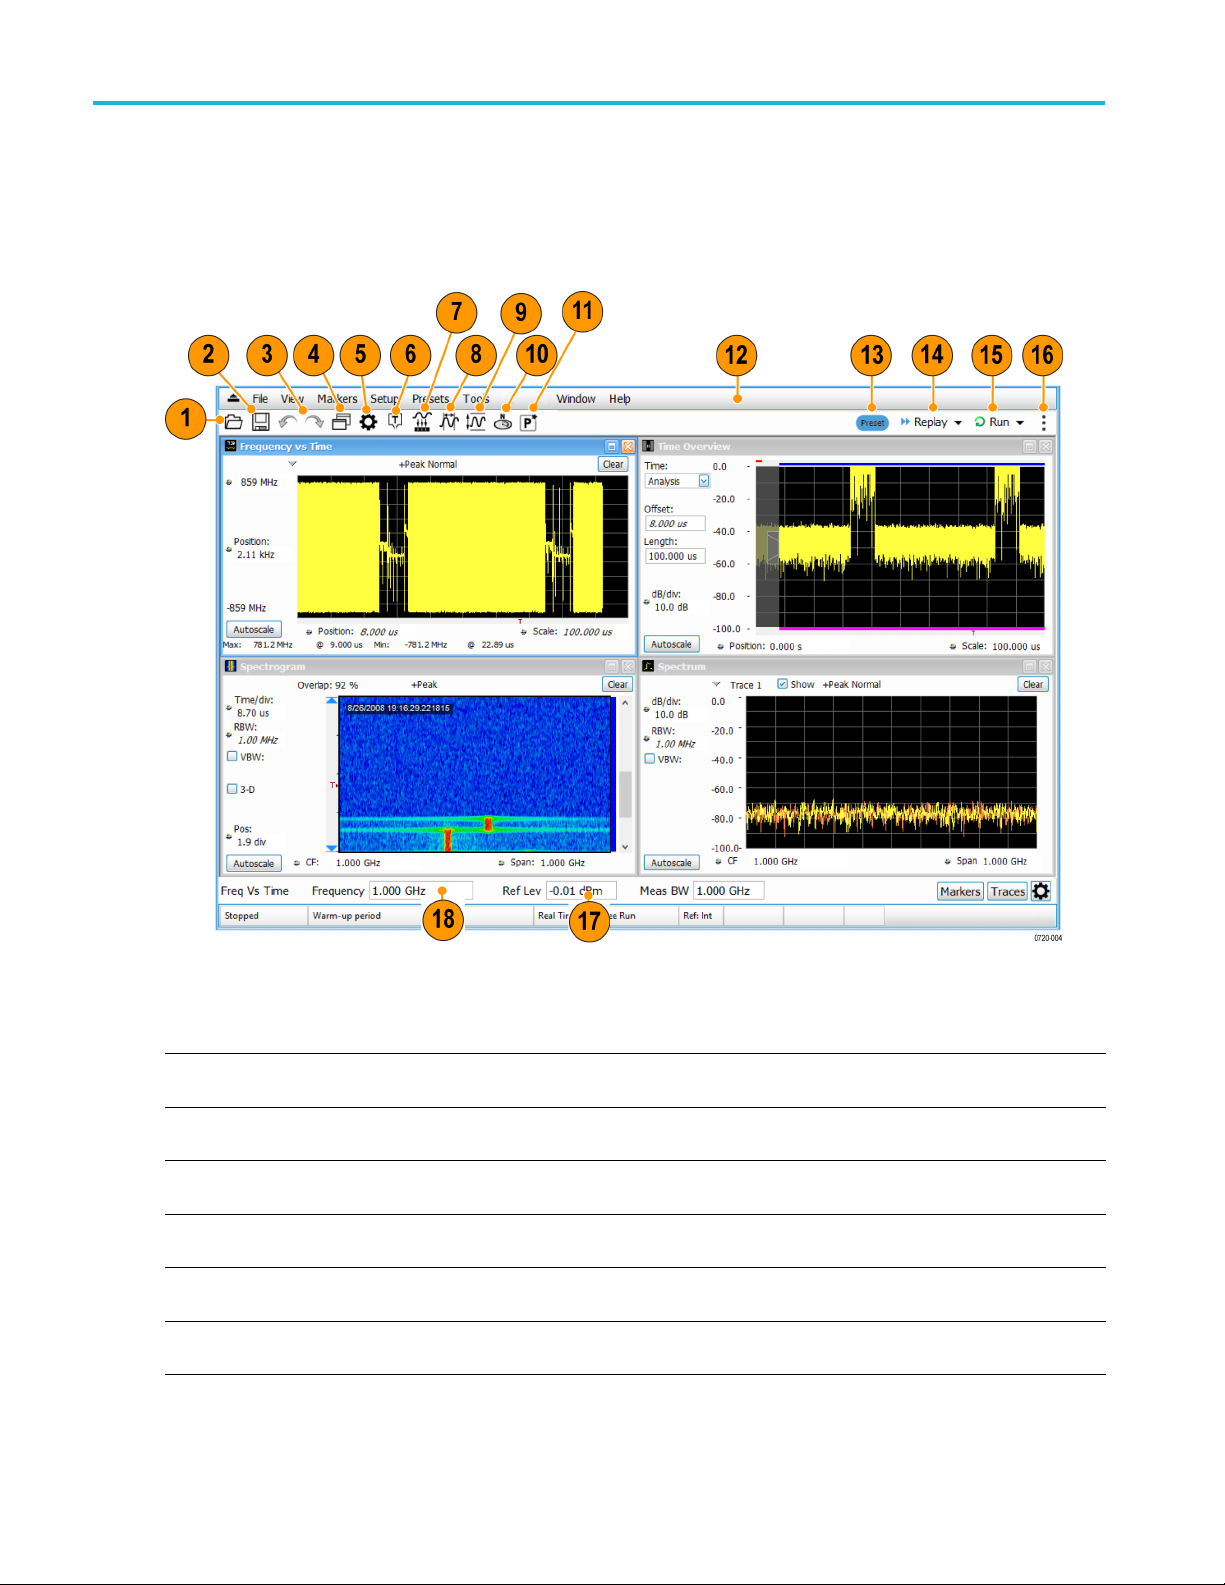
Operation
Interface and Display Elements
Commonly-used buttons and controls are located in the tool bar. Most of the buttons open control panels for changing the
instrument setups. The contents of the control panels vary depending on the selected display. You can also access the
control panels from the front panel buttons or from the keyboard.
Ref
number
1 Recall
2
3
4 Displays
5
6 Trigger
20 RSA5100B Series Quick Start User Manual
Setting
Save Opens the Save As dialog in order to save setup files, pictures (screen
Undo/Redo
Settings Opens the Settings control panel for the selected display. Each display has
Description
Displays the Open window in order to recall setup files, acquisition data files,
or trace files.
captures), acquisition data files, or export measurement settings.
Undoes or redoes the previous edit to a display or measurement settings, a
preset, or a measurement change.
Opens the Select D isplays dialog box so that you can select measurement
displays.
its own control panel.
Opens the Trigger control panel so that you can define the instrument trigger
settings.
Page 39

Operation
Ref
number
7
8 Analysis
9 Amplitude
10
11 Favorite User Presets
12 Main menu bar Located above the Favorites toolbar, it contains access to menus.
13 Preset Recalls the Main preset.
14 Replay Runs a new
15 Run
Setting
Acquire
GNSS/Antenna Opens the GNSS/Antenna control panel so that you can configure and activate
and
Run/Stop toolbar
Description
Opens the Acquire control panel, which displays the Sample Rate and Record
length of the recalled waveform file.
Opens the Analysis control panel so that you can define the analysis settings
such as frequ
Opens the Am
configure internal attenuation, and specify external gain/loss corrections.
an external GNSS receiver and antenna.
Click to s elect from a list of custom favorite User presets and load the selected
preset.
new settings.
Run menu and Run/Stop toolbar
Starts and stops data acquisitions and specifies the run conditions. For
example
Run menu), a single measurement cycle is r un. If you select Continuous
in the Run/Stop toolbar (or Run Continuous in the Run menu), the data
acquis
ency, analysis time, and units.
plitude control panel so that you can define the Reference Level,
measurement cycle on the last acquisition data record using any
, if you select Single in the Run/Stop toolbar (or Run Single in the
ition runs until stopped.
Run men
The Run menu also includes Resume and Abort.
Resume restarts data acquisition, but does not reset accumulated results,
such a
temporarily, then continue.
Abort immediately halts the current acquisition/measurement cycle.
In-pr
u
s Average or MaxHold. This allows you to stop acquisitions
ocess m easurements and acquisitions are not allowed to complete.
RSA5100B S eries Quick Start User Manual 21
Page 40
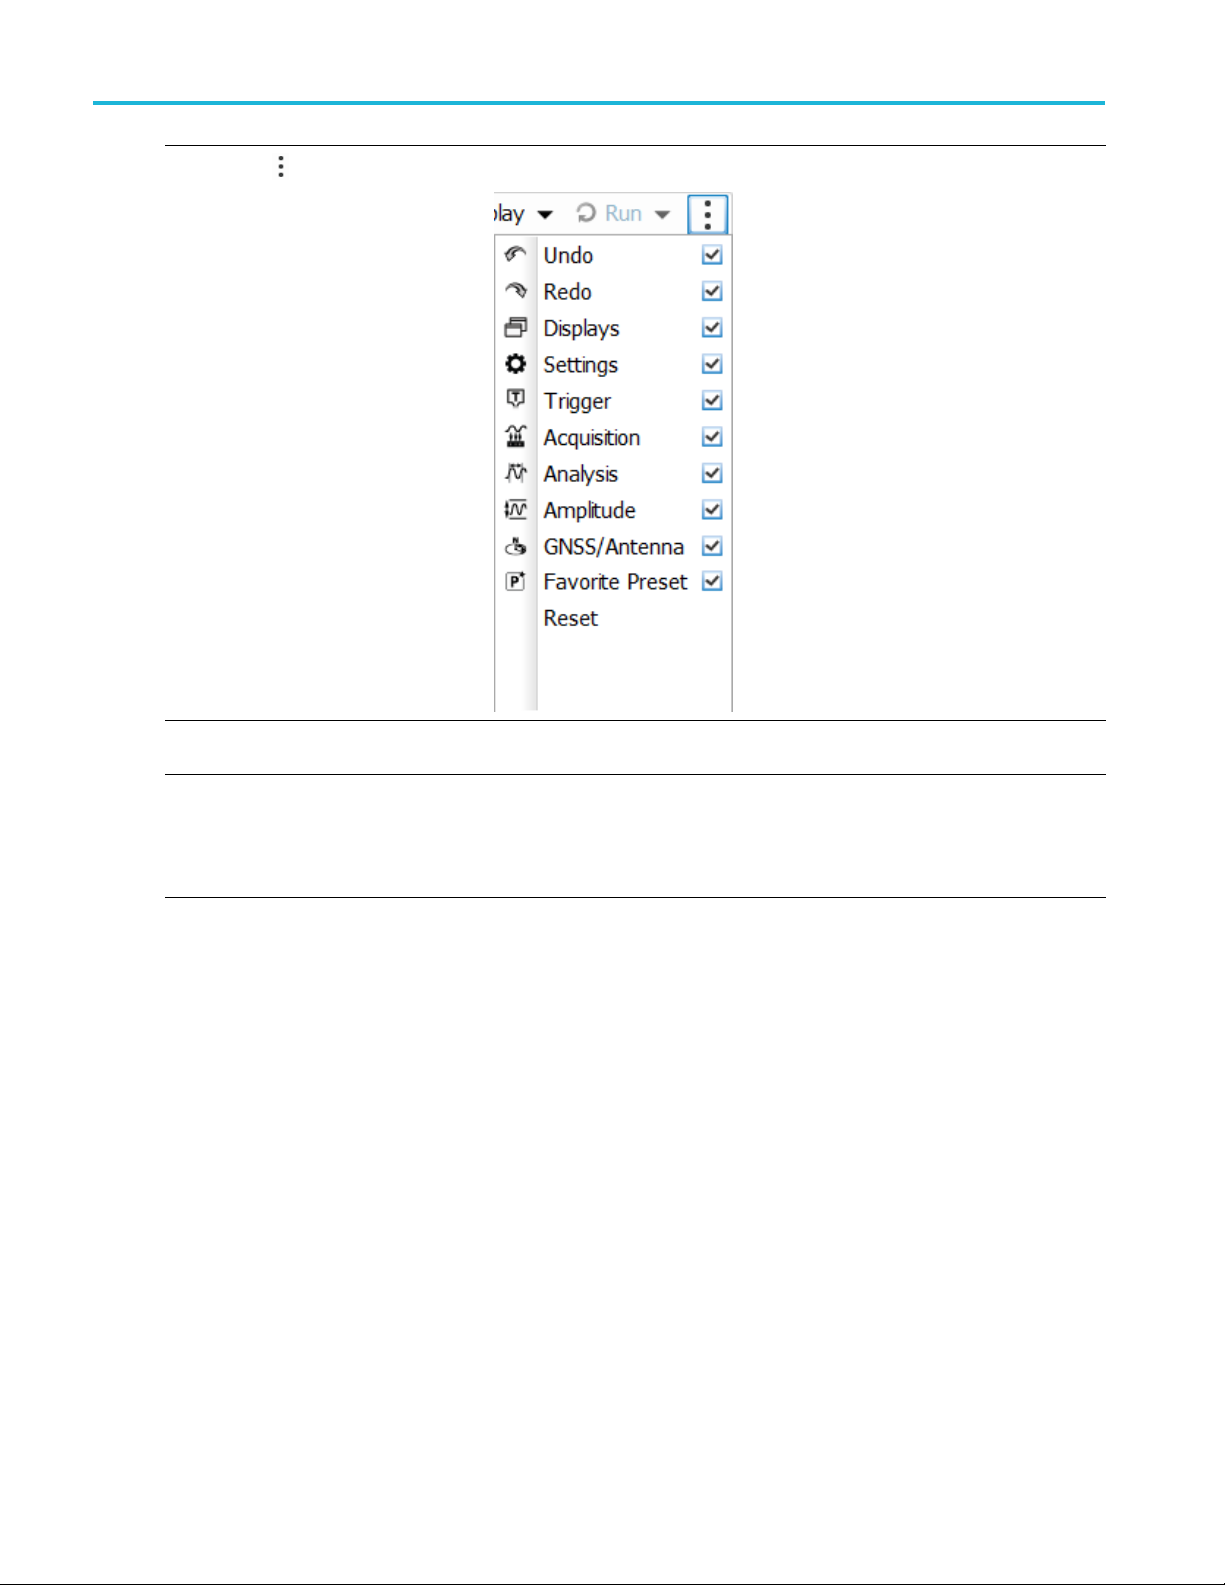
Operation
16 The Edit Favorites icon allows you access the below menu, which allows you to
edit the conte
nts of the Favorites bar.
17
Reference Level Displays the reference level. To change the value, click the text and enter a
18 Frequency
number using a keyboard, or use a mouse scroll wheel.
Displays the frequency at which measurements are made. For spectrum
displays, this is called “Center Frequency”. To change the value, click the
text and use the front panel knob to dial in a frequency. You can also enter
a frequency with the front panel keypad or use the front panel up and down
buttons.
22 RSA5100B Series Quick Start User Manual
Page 41

Display-Specific Controls
Most displays have commonly-used controls arranged around the graph. They provide quick access to common settings;
the full control set for the display is in the Settings control panel. The following illustration and table show some of the
common icons that appear in most displays.
Table 1: Common icons
Ref number Control icon Description
1
Drop-down List. Click to select a value from the drop-down list.
Operation
2
3 1.00 MHz
Knob. Click anywhere on the icon or on the text readout to select the c ontrol. You
can then change the value with the front panel control knob or arrow keys, or enter a
value from the keypad.
Italicized numbers. These indicate automatically selected control values. Several
controls in the instrument (for example, RBW and Analysis Length) allow you to
select an Auto mode. In Auto m ode, the instrument software automatically sets the
value. You can change the control to Manual mode by changing the value. To return
to Auto mode, clear the value, and then press the Enter key.
RSA5100B S eries Quick Start User Manual 23
Page 42

Operation
Basic Concepts
Real Time Analyzers
Tektronix real-time analyzers have a frequency mask trigger. The frequency mask trigger allows you to set up a spectral
mask to captu
acquiring, and then capture precisely the intermittent RF event of interest.
DPX™ technology allows you to view the RF signal as a live display. You can view very s hort transient signals, multilevel
signals, and time-varying events. You also have the ability to measure and trigger on signal density values in the DPX display.
The analyzers allow you to view the captured signals in a wide variety of time-correlated displays. This is useful for device
troublesho
the DPX display has a unique method for processing, storing, and displaying the data.
Measurement Displays
The analyzer window can show one or any combination of general purpose and application-specific displays.
This example shows a DPX Spectrum Split
display. A DPXogram display appears on the
top and a DPX Spectrum display appears on
the bottom.
re a signal when a spectral anomaly occurs. This allows the analyzer to check 100% of the input signal before
oting and signal characterization applications. All measurements are based on the same real-time data, however
24 RSA5100B Series Quick Start User Manual
Page 43

Operation
This example sh
displays, a Spectrum display and a DPX
spectrum display.
When you have m
the display with the check mark icon has
control over the acquisition hardware. To
give a displa
its title bar.
This example shows four displays in the
window.
ows the window with two
ore than one display open,
y priority over any others, click
The acquisition data source can be a live acquisition or a saved acquisition data file. The sharing of acquisition data between
displays allows you to view the same data in multiple ways. For example, you can display a power versus frequency
(spectrum) display and a spectrogram diagram at the same time. Because the data source is shared among the different
displays, the displays are correlated. That is, a point or set of points within one display is associated with a point or set of
points in every other display in the application window.
RSA5100B S eries Quick Start User Manual 25
Page 44

Operation
Navigating Displays
The analyzers use multiple displays to keep operations simple, and yet provide advanced functionality when needed. Some
of the display categories include:
General Signal Viewing displays. These displays show graphs for basic signal parameters such as amplitude, phase,
and frequency plotted against frequency or time. Examples of these displays include: Spectrum, DPX, Spectrogram,
Time Overview, and Phase vs Time.
Analog Modulation. These displays s how graphs and measurements for Analog Modulation, Frequency Modulation,
and Phase Modulation.
General Purpose Digital Modulation displays. Available with Option 21. These displays show the results of
demodulating signals and analyzing them in multiple domains. Examples of these displays include: Constellation,
EVM vs Time, Eye, Symbol Table, and Trellis diagrams.
RF Measurements displays. Available with Option 11. These displays show the results of automated measurements on
RF signals. Examples of these displays include: ACPR, MCPR, Phase Noise, and CCDF.
OFDM Analysis. Available with Option 22. These displays provide OFDM analysis for WLAN 802.11a/j/g and WiMax
802.16-2004 signals.
Advanced Pulse Analysis. Available with Option 20. These displays show the results of advanced analysis for pulsed
RF signals. Pulse-Ogram™ waterfall disp lay of multiple segmented captures, with amplitude vs time and spectrum of
each pulse. Pulse frequency, Delta Frequency, Average on power, Peak power, Average transmitted power, Pulse width,
Rise time, Fall time, Repetition interval (seconds), Repetition interval (Hz), Duty factor (%), Duty factor (ratio), Ripple
(dB), Ripple (%), D roop (dB), Droop (% ), Overshoot (dB), Overshoot (%), Pulse- Ref Pulse frequency difference, PulseRef Pulse phase difference, Pulse- Pulse frequency difference, Pulse- Pulse phase difference, RMS frequency error,
Max frequency error, RMS phase error, Max phase error, Frequency deviation, Phase deviation, Impulse response
(dB), Impulse response (time), Time stamp.
Audio Analysis. Available with Option 10. These displays measure basic time- and frequency-domain parameters
of analog audio signals modulated on a carrier (AM, FM and PM modulation) or unmodulated (non-carrier) audio
signals (Direct).
WLAN Analysis. Available with Options 23, 24, and 25. Each of these options provide OFDM analysis of WLAN802.11
standards. All three options combined provide analysis for WLAN802.11a/b/g/j/p/n/ac signals.
Bluetooth® LE and Bluetoo th Basic Rate RF. Available with Option 27. Bluetooth LE (Low Energy) and Bluetooth
Basic Rate RF (Radio Frequency) provides 13 transmitter performance measurements for 10 different test setups in
compliance w ith Bluetooth RF PHY Test Specifications 4.1.1 and Radio Frequency (RF) Test Specifications 4.1.1.
APCO P25 Analysis. Available with Option 26. This complete set of push-button Telecommunication Industry
Association TIA-102 standard-based transmitter measurements includes modulation m easurements, power
measurements, and timing measurements. These measurements are al so compared with the limits that best fitthe
signal for which the standard applies to provide pass/fail results.
LTE™ Downlink Analysis. Available with Option 28. LTE Downlink (Base Station) RF analysis provides transmitter
performance measurements for both TDD and FDD (for example, Channel Power, Occupied Bandwidth, ACLR,
SEM, Cell ID, and TDD LTE Transmit Power Off) in compliance with Test Specifications 36.104 (Base Station radio
transmission and reception) and 36.141 (Base Station conformance testing).
5GNR Analysis. 5GNR Uplink/Downlink measurements with Modulation Accuracy (EVM), ACP, CHP, SE M, OBW,
and PVT measurements. Available with Option 5GNR. 5G NR Uplink/Downlink RF Power, Bandwidth, Demodulation
and Error Vector Magnitude measurements.
26 RSA5100B Series Quick Start User Manual
Page 45

Operation
Signal Classification. Available with Option 54. The signal classification application enables expert systems guidance
to aid the user i
n classifying signals. It provides graphical tools that allow you to quickly c reate a spectral region of
interest, enabling you to classify and sort signals efficiently.
Return loss. Available with Option 60. Provides return loss, VSWR, cable loss, and distance to fault measurements.
Noise Figure. Available with Option 14. These displays measure the noise contributions in a system. Displays include
Noise F igure, Gain, Y-factor, Noise Temperature, Uncertainty Calculator, and tabular results. Single-frequency metering
and swept-tr
ace results are available, as well as support for industry-standard noise sources. Measurements for amplifiers
and other non-frequency c onverting devices, and fixed local-oscillator up and down converters are also available.
RSA5100B S eries Quick Start User Manual 27
Page 46

Operation
Selecting Displays
The analyzer provides an easy way to select displays.
1. Click the Displays icon to open the Select
Displays dialog box.
There are two ways to select displays: choose any combination of displays or use an Application Preset.
Choose any C
1. Click the desired application folder in the
Select Displays dialog box.
The availa
listed in the Available Displays pane.
2. Click one of the display icons.
3. Click Add (or double-click the icon) to
add the selected display to the Selected
displays
add other displays.
4. Click OK to close the dialog box. The
selected displays will open.
ombination of Displays.
ble displays for each folder are
list. Repeat the procedure to
Select displays one by one as needed.
28 RSA5100B Series Quick Start User Manual
Page 47

Use an Application Preset. Select displays from the presets for your application.
Operation
1. Click Applica
Displays dialog box.
2. Use the pull down list to display the
presets.
tion Presets in the Select
NOTE. Some presets appear only if the
associated instrument option is installed.
3. Select a preset from the list.
RSA5100B S eries Quick Start User Manual 29
Page 48

Operation
4. The default displays for the selected
preset are shown.
5. Click OK to close the dialog box. The
preset displa
ys will open. (See Table 2.)
Table 2: Application presets
Presets Displays
Time-Frequency Analysis
Spectrum Analysis Spectrum
Modulation Analysis (Option 21 only) Constellation, DPX Spectrum, Signal Quality, Symbol Table
Pulse Analysis (Option 20 only) DPX Spectrum, Pulse Table, Pulse Trace, Time Overview
Spur Search Multi Zone 9k-1G Hz Spurious
Noise Figure (Option 14 only) Gain, Noise Figure, Noise Table
Phase Noise Phase Noise
Frequency vs Time, Spectrogram, Spectrum, Time Overview
30 RSA5100B Series Quick Start User Manual
Page 49
Operation
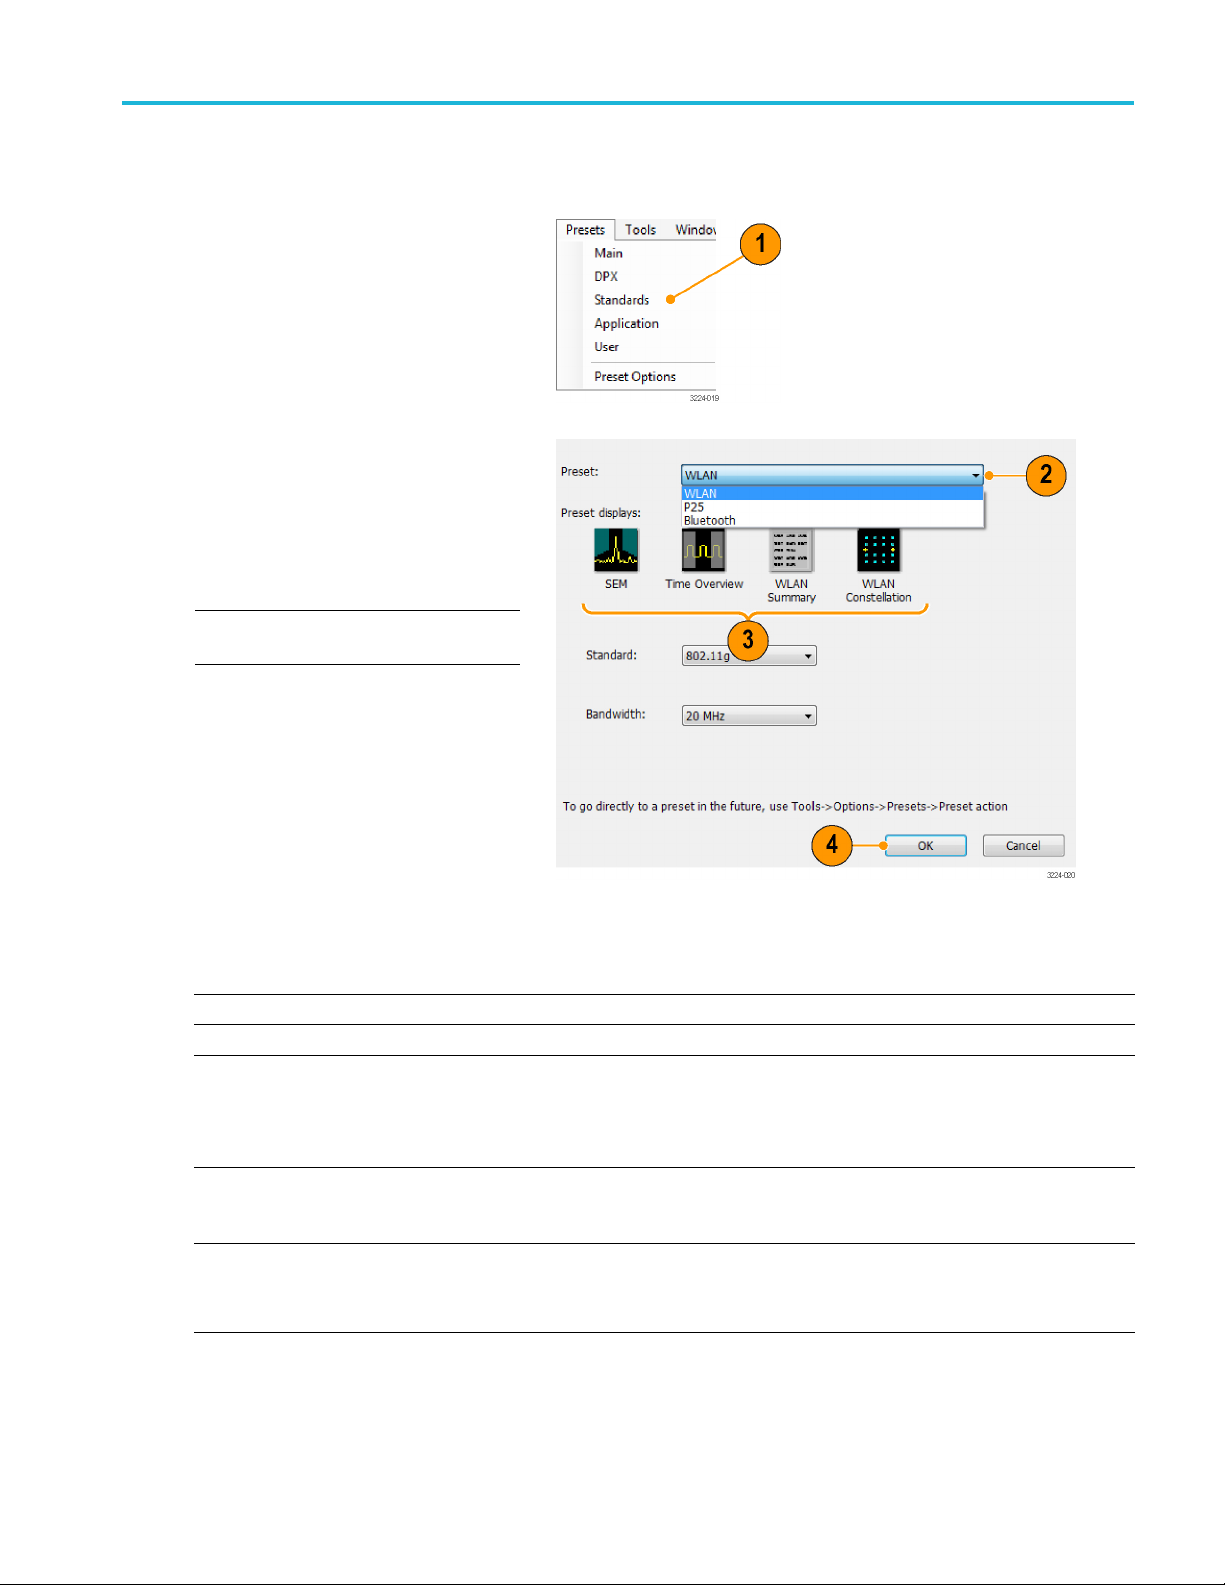
UseaStandardsPreset. When you select a specific standard from the Standards presets, the analyzer automatically
loads the displ
1. Select Presets > S tandards from the
main menu bar.
ays and settings that are optimal for analysis of signals based on that standard.
2. Use the Pres
and select a preset from the list.
3. The default displays for the selected
preset are shown.
4. Click OK to close the dialog box. The
preset dis
NOTE. Some presets appear only if the
associated instrument option is installed.
et pull down list to display
plays will open. (See Table 3.)
Table 3: Standards presets
Presets Displays
WLAN (Option 25) SEM, Time Overview, WLAN Summary, WLAN Constellation
P25 (Option 26) MCPR, Time Overview, P25 Summary, P25 Constellation
Bluetooth® (Option 27) BT Eye Diagram, BT Frq Dev vs Time, BT Summary, BT CF
Offset and Drift, Spectrum, Time Overview
NOTE. Bluetooth displays vary depending on the selected Test
Setup.
5GNR (Option 5GNR) NR Adjacent Channel Power, NR Channel Power, NR
Constellation, NR Spectral Emission Mask, Occupied Bandwidth,
NR EVM, NR Power vs Time, NR Summary
LTE™ (Option 28) LTE Summary, LTE Constellation, Time Overview, Spectrum,
LTE ACLR, LTE Channel Spectrum, SEM
NOTE. LTE displays vary depending on the selected Test Setup.
RSA5100B S eries Quick Start User Manual 31
Page 50

Operation
Quick Tips
Push the Displays button on the front panel to open the Select Displays dialog box.
To add a display, double-click the icon.
To remove displays, do one of the following:
Select a display icon in the Selected Displays list, and then click Remove.
Double-click a display icon in the Selected Displays list.
Click the Close button in the upper right hand corner of the selected display.
You can mix displays from multiple application folders.
Common Information Messages
The following table lists some of the common information messages that might appear during normal operation.
Table 4: Common information messages
Message Explanation and recommended action
Acq BW too small for current setup
The displ
contains. This can be due to any of the following reasons:
ay needs a wider acquisition bandwidth than the current data record
A display other than the one you intended has been selected. The selected
display has requested a smaller acqui sition bandwidth to achieve a better
y or dynamic range for its particular measurement.
accurac
Select the display that contains the message. Click Run if the instrument
is not already acquiring data.
Acquisitions are not running and the measurement now requests a wider
dth than the last acquisition.
bandwi
Click Run to perform a new acquisition with a wider bandwidth.
The data is from a recalled file.
There is no way to increase the acquisition bandwidth for saved data. You
djust the measurement settings so that less bandwidth is required.
must a
Need swept acq or larger Acq BW When any display requires a swept acquisition, the other displays are unable to
ess the swept data. This is because the swept data is customized for the
proc
selected display.
Select the display that you are interested in and the acquisition settings will
matically change to meet the requirements of the selected display.
auto
RBW increased to xx kHz
current Spectrum Length or Analysis Length is not long enough to allow
The
a narrower RBW filter.
If the Length control is set to Manual, try increasing it or setting it to Auto so
t the Analysis Length will increase to the required value.
tha
32 RSA5100B Series Quick Start User Manual
Page 51

Operation
Changing Measurement Settings
The displays have settings that control how signals are acquired and processed. The settings that you can change depend
on the selected display.
To access the settings (in this case, for the Spectrum display):
RSA5100B S eries Quick Start User Manual 33
Page 52

Operation
1. Click Settings to open the Settings
control panel.
2. Adjust the co
signal or test. For example, use the
Freq & Span tab to set frequency and
span. Most of
tabs that provide easy access to other
related controls. (See page 35, Quick
Tip.)
3. You c an cha
display screen in the Prefs tab. Not all
of the following controls apply to every
display. S
controls not described here.
To turn on or off the graticule, select
the Show graticule check box.
To turn on or off the marker readout,
select t
graph check box.
To turn on or off the trace legend,
select the Show trace legend check
box. Th
information on the trace number,
detection, and function (such as
averag
ntrols as needed for your
the control panels have
nge the appearance of the
ome displays have additional
he Show Marker readout in
e trace legend includes
e) for each trace on screen.
on or off the parameter
To tu r n
readouts. select the Show
parameter readouts check box.
eports the time to create and
This r
display the sweep of the spectrum
analyzer. It includes the entire
p plus any retrace time. When
swee
trace averaging is activated, the
sweep reports the time for individual
es while collecting the averages,
trac
and reports the time for the entire
averaged trace when averaging is
plete.
com
34 RSA5100B Series Quick Start User Manual
Page 53

Quick Tip
If you have multiple displays on the screen, click anywhere i nside one of the other displays to change to the control
panel for that display.
You can adjust many of the parameters of your measurement by clicking on the readout in the display. For example,
in the spectrum display, dB/div, RBW, VBW, Span, and Center Frequency can all be accessed on the display without
bringing up the Settings panel.
Operation
RSA5100B S eries Quick Start User Manual 35
Page 54

Operation
Presetting the Instrument
You can preset the instrument to restore the setups to their default values.
1. To start with the default instrument
settings, push the Preset button on the
front panel or select Preset from the
toolbar.
Quick Tip
Preset d
menu, such as GPIB address, Save/Export pre ferences, or the Auto Alignment setting.
oes not change any of the settings specified from the Setup > C onfigure In/Out control panel or from the Tools
36 RSA5100B Series Quick Start User Manual
Page 55

Connecting a Signal
The analyzer has a single RF signal input located on the front panel. Make sure that you observe the input signal
requirements before connecting a signal to the input.
CAUTION. To prevent static damage to the instrument or to any instrument accessories, discharge to ground any
electrostatic charge that may be present on the center and outer conductors of cables, before attaching the cables to the
instrument inputs. Do not create an ESD (electrical static damage) antenna by leaving cables attached to the instrument with
the other ends of the cables open.
Required Signal Levels
The following table shows the input signal levels over which the analyzer can be used for measurements. The accuracy
is guaranteed at a signal amplitude and frequency (normalization point). Measurements can be made on signals within
the entire
the signal to be measured.
range of allowable inputs, but the accuracy of the measurement is affected by the frequency and amplitude of
Operation
RF signal
Characteristic Description
Maximum DC voltage ±5 V (RF input)
Maximum safe input power +30 dBm (RF Input, RF ATT≥10dB, Pre-amp Off)
Maxim
CAUTION. To prevent damage to the instrument, do not connect CW signals greater than 1 Watt (+30 dBm). The maximum
age rating is ±5 V DC. The maximum pulse specifications are 50 W peak, <10 µs pulse width, 0.001 duty cycle and
volt
≥30 dB attenuation.
input range (CW or peak envelope power)
um measurable input power
+20 dBm (RF Input, RF ATT≥10dB, Pre-amp On)
+50 Wat
repetitive Pulses))
+30 dBm (RF Input, RF ATT Auto)
+10 Watts peak (RF Input, RF ATT Auto (<10 μs, 1% Duty Cycle
repet
ts peak (RF Input, RF ATT≥30dB, (<10 μs, 1% Duty Cycle
itive Pulses))
RSA5100B S eries Quick Start User Manual 37
Page 56
Operation
To connect an RF signal:
Connect the si
connector on the front panel.
NOTE. On RSA5115B and RSA5126B
instruments,
connector type by using a different Planar
Crown connector.
gnal to the RF INPUT
you can change the RF input
Quick Tip
If the source signal exceeds the specified maximum input rating, connect the source signal to an attenuator. Connect the
attenuator output to the RF Input connector.
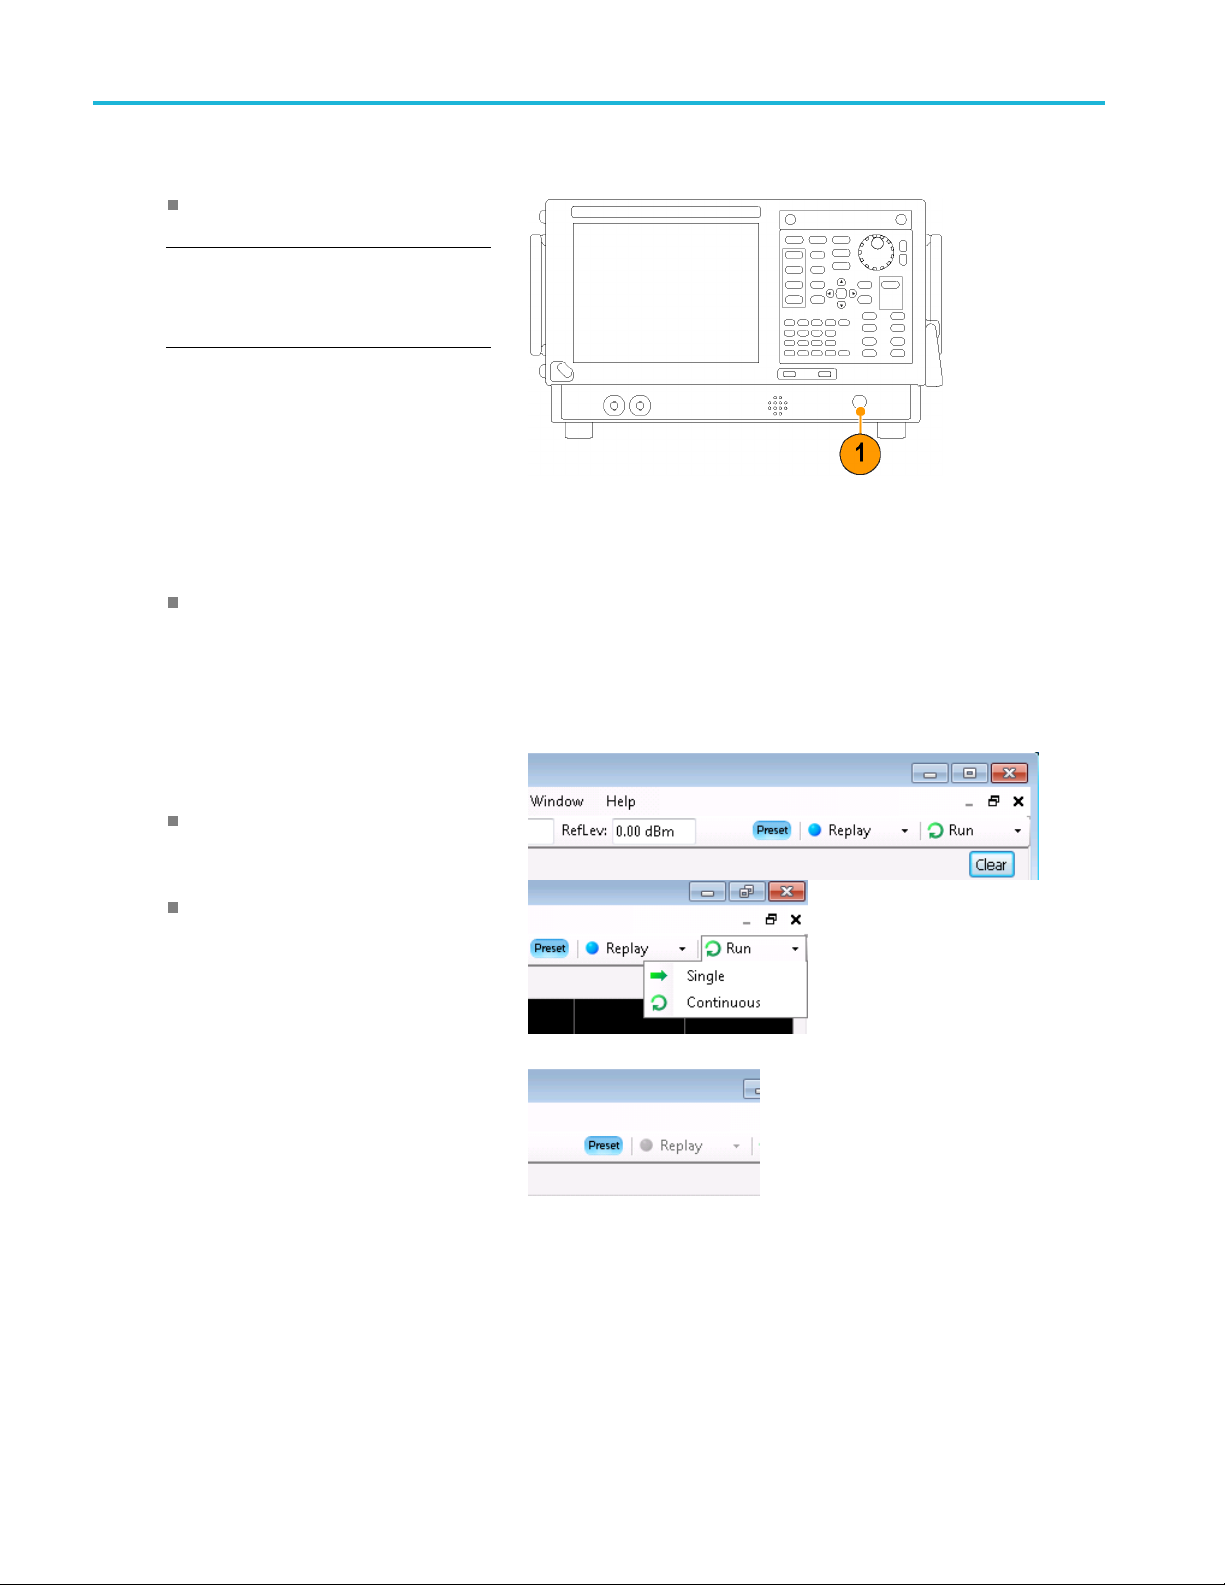
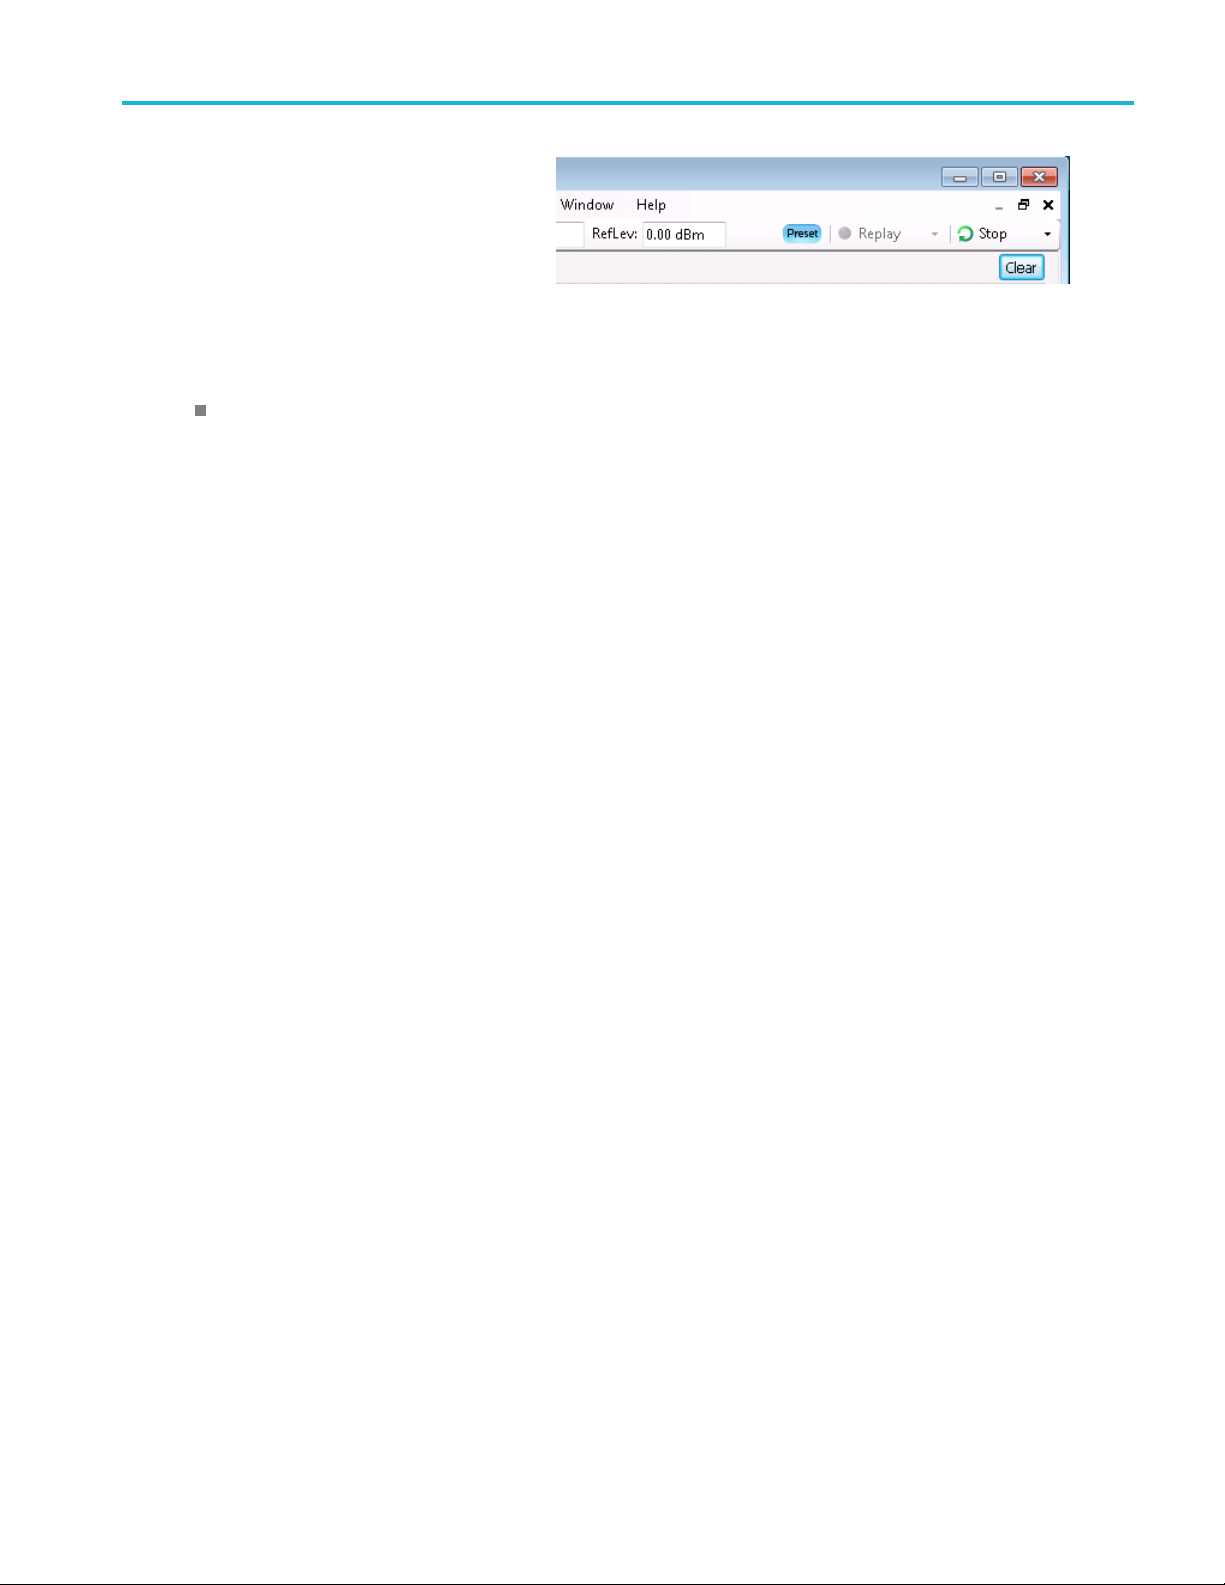
Starting and Stopping Acquisitions
1. Click the Run button to start an
acquisition.
To select the Run mode, click the
drop-list icon to the right of the Run
button.
Select Single or Continuous to set the
Run mode as necessary.
e analyzer is in Continuous Run
If th
mode, the Replay button is dimmed while
acquisitions are active. If there are no
isitions active, the Replay button is
acqu
blue.
38 RSA5100B Series Quick Start User Manual
Page 57
2. Click the Stop button again to stop an
acquisition. If an analysis is in process, it
will finish its
sequence and then stop.
Quick Tip
Push the front panel Run button to start and stop acquisitions.
Run Control
The Run menu provides access to commands that control the acquisition and the measurement sequence. Refer to
the online help for information on all of the Run menu selections. Continuous is the default selection. When you select
Continuo
single acquisition every time you click Run or push the Run button on the front panel.
us, the instrument will continuously acquire data until you stop the acquisitions. Select Single Sequence to run a
Operation
RSA5100B S eries Quick Start User Manual 39
Page 58

Operation
Markers
Use markers to measure time, frequency, power and other results. Markers measure absolute values and can also measure
the difference between markers.
Using Markers to Measure Frequency and Power
The following procedure s hows how to use markers in the Spectrum display to measure frequency and power. The example
assumes that
1. Click the Markers button located at the
Alternately, press the front panel Markers
Define butt
all markers are turned off and that a signal is on the screen.
bottom of the display to open the Marker
toolbar at t
window.
he bottom of the Analysis
on.
2. Select Ad
list in the Marker Toolbar.
The first marker i s designated the marker
referen
3. Position the marker on the screen using
the arrow buttons in the M arker toolbar.
The left and right arrows move the
marker to the next peak. The up and
down arrows move the marker to the
next higher or next lower peak.
The peak excursion preferences are set in
the Define Peaks menu tab.
You can also drag the marker to the desired
position using the touch screen or the mouse.
4. Read the frequency and power level from
the marker readout on the display.
d Marker from the drop down
ce (MR).
Quick Tip
Marker controls are available directly from the front panel Marker buttons.
40 RSA5100B Series Quick Start User Manual
Page 59

Markers Display
Reference Marker: This marker type is labeled MR in the graph. It makes absolute measurements and is also used for
calculating differences when Delta or Power readouts are enabled.
Delta Markers: This marker type is labeled M1 to M4 in the graph. It is used to measure other points on the trace or the
difference between the Marker R eference and the Delta marker.
Power Markers: This marker type is labeled M1 to M4 in the graph. It function the same way as Delta Markers, except it
shows power density and integrated power density (dBm/Hz) instead of power level (dBm).
The following information tells you more about how markers function. For more detailed information about markers, see
the instrument Help.
When you drag markers along a trace with either the touch screen or the mouse, the marker will seek the high p oints.
The marker stays within 20 trace points of the mouse position. If there are no peaks within the current range of trace
points, the marker finds the highest point.
When you attach the marker to the bitmap trace in the DPX spectrum display, the marker readout indicates the hit count
for pixels (maximum 65,536) along with frequency and power (see the following figure). You can position the marker
at any point in the graph.
Markers attached to the DPX bitmap display the signal density in percent at the selected pixel, rather than the hit count.
Operation
Quick Tips
If markers are turned off, click Peak in the M arker toolbar or on the front panel to add the marker reference (MR) and to
position it on the maximum peak level on the trace in the selected display.
Click Ta ble in the M arker toolbar to open a tabular display showing the marker information.
RSA5100B S eries Quick Start User Manual 41
Page 60

Operation
Marker Toolbar
The Marker toolbar has several controls to work with markers. (See Table 5.) Some of these controls are similar to those
on the front panel.
Table 5: Marker toolbar
Icon Description
Opens the Define Markers control panel. Use the control panel to add and remove markers and
to set marker parameters.
Sets the Measurement Frequency of the instrument to the frequency of the selected marker. This
button is only present when the selected display has frequency on the horizontal axis.
Moves the marker to the maximum peak level on the trace. The maximum peak can be either the
highest or the lowest point in displays with both positive and negative values on their vertical axis
(such as Frequency Error or Phase).
Moves the selected marker to the next peak to the left of the current position.
Moves the selected marker to the next peak to the right of the current position.
Moves the selected marker to the next lower peak value. The peak value refers to the absolute
value of the peak amplitude. When repeatedly moving the marker, it can move in any direction
depending on the location of the next peak. If the marker is attached to the DPX bitmap trace, this
button moves it to the next-lower-amplitude density peak at the same frequency.
Moves the selected marker to the next higher peak value. The peak value refers to the absolute
value of the peak amplitude. When repeatedly moving the marker, it can move in any direction
depending on the location of the next peak. If the marker is attached to the DPX bitmap trace, this
button moves it to the next-higher-amplitude density peak at the same frequency.
Opens or closes the marker table in the display.
Adding Markers
an have up to five markers. The first marker (MR) is a reference marker. The other markers (M1, M2, M3, and M4) can
You c
show absolute values or can show both absolute values and the difference values between them and the reference marker.
To add another marker, select Add Marker from the drop-down list in the toolbar or from the front panel button.
Markers can also be added by right-clicking in the desired display and selecting Add marker.
42 RSA5100B Series Quick Start User Manual
Page 61

Defining Markers
Use the Define Markers control panel to define the marker settings.
1. Click Define to open the Define Markers
control panel.
Alternately, press the front panel Markers
Define button.
Use the control panel to:
Add or delete markers.
Turn markers off.
Assign markers to specifictraces.
Set the marker readouts to absolute or
delta.
Define the threshold and excursion
values.
Operation
Quick Tip
You can add or delete markers using the drop-down list next to Define in the Marker toolbar, or by right-clicking in the
desired display and selecting Add marker.
Touchscreen Actions
You can use the touchscreen to change marker settings and how waveforms are displayed by using the Touchscreen Actions
menu. To use the Touchscreen Actions menu, touch the display and hold for one second, then remove your finger. You can
also use a mouse to display the Touchscreen Action menu by clicking the right mouse button.
Some selections in the Touchscreen Actions
menu are selectable only when a marker is
defined.
Touchscreen Actions menu
RSA5100B S eries Quick Start User Manual 43
Page 62

Operation
Table 6: Touchscreen actions menu
Icon Menu item Description
Select Selects markers and adjusts their position.
Span Zoom
CF Pan Adjusts the Center Frequency acc ording to horizontal movement.
Zoom
Pan
–
–
–
–
–
–
Reset Scale Returns the horizontal and vertical scale and position settings to their default
Marker to peak
Next Peak
Add marker
Delete marker Removes the last added marker.
All markers off
Trigger On This
Zooms the graph area about the selected point. Touch the graph display a t a point
of interest and drag to increase or decrease the span about the point of interest.
Span Zoom adjusts the span control and can affect the acquisition bandwidth.
Adjusts horizontal and vertical scale of the graph. The first direction with
enough movement becomes the primary scale of adjustment. Adjustment in the
secondary direction does not occur until a threshold of 30 pixels of movement is
crossed.
Dragging to the left o r down zooms out and displays a smaller waveform
(increases the scale value). Dragging to the right or up zooms in and displays a
larger waveform (decreases the scale value).
Adjusts horizontal and vertical position of the waveform. The first direction with
enough movement becomes the primary direction of movement. Movement in
the secondary direction does not occur until a threshold of 30 pixels of movement
is crossed.
values.
Moves the selected marker to the highest peak. If no marker is turned on, this
control automatically adds a marker.
Moves the selected marker to the next peak. Choices are Next left, Next right,
Next lower (absolute), and Next higher (absolute).
Defines a new marker located at the horizontal center of the graph.
Removes all markers.
Positions the DPX Density measurement box at the click point, measures the
current signal density, sets up the DPX Density Trigger function based on the
measurement result, and starts acquisitions.
44 RSA5100B Series Quick Start User Manual
Page 63

Printing
You can print a copy of the screen and its contents (a screen shot) to a printer or a file.
1. Push the P rint button on the front panel
Operation
or select Print from the File menu.
2. Fill out the details in the Print dialog box,
and then click OK.
The Print dialog box is the standard
Microsoft Windows Print dialog box. The
printer controls are dependent on your
printer.
RSA5100B S eries Quick Start User Manual 45
Page 64

Operation
Ink Saver Mode
You can print screen images with a white background.
1. Select Options from the Tools menu.
2. Select the Prefs tab in the control panel.
3. Set the Color Scheme to Blizzard. The background color changes from black to w hite in the graphs.
46 RSA5100B Series Quick Start User Manual
Page 65
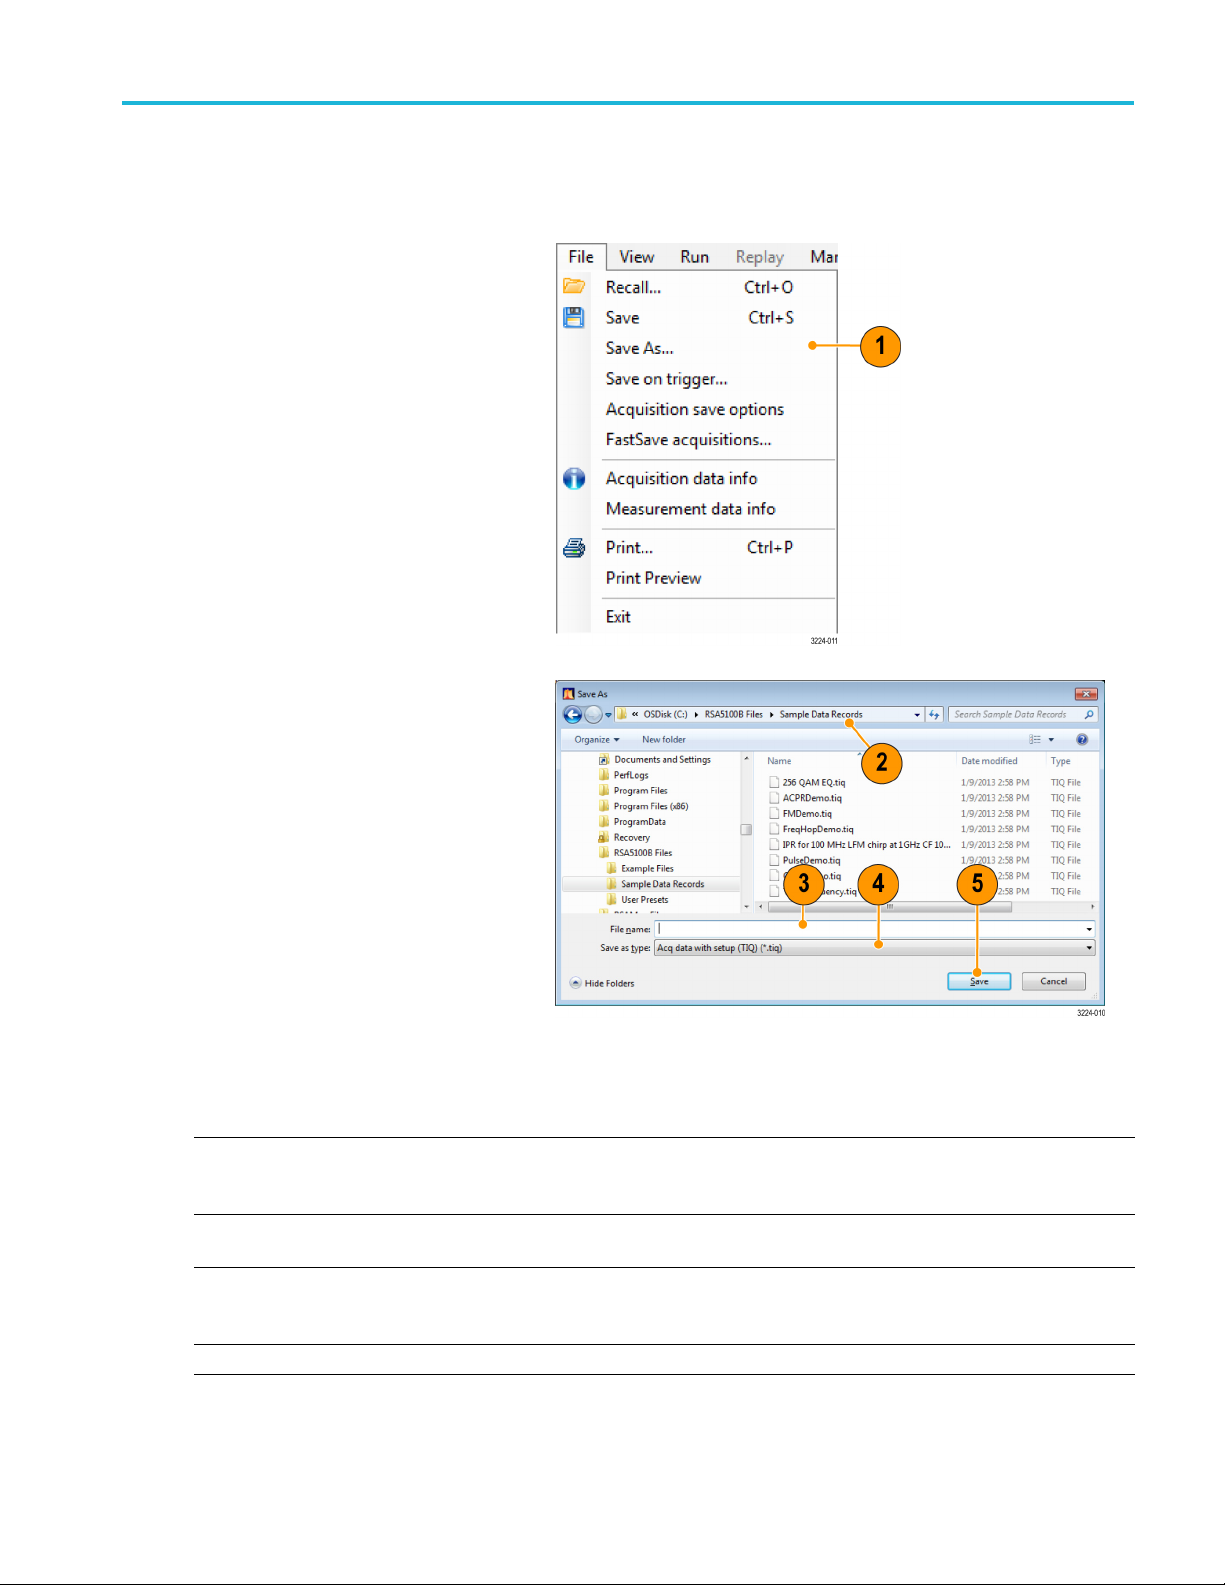
Saving Data
You can save different types of data for future use.
1. Select Save As. from the File menu to
open the Save As dialog box.
Operation
2. Navigate to the folder where you want
to save the setups, or use the default
location.
3. Enter a file name.
4. Select the type of file to save. (See
Table 7.)
5. Click S ave.
Table 7: File types for save
File types Description
Setup files Saves all of the setup information for a ll settings displays, except those settings that
are specified under the Tools menu (Alignments and Options) or in the ConfigIn/Out
control panel.
Results Export files Saves the trace and numeric data for the selected display. The trace and numeric data
are saved in CSV format as text files.
Picture (PNG/JPG/BMP) Saves a graphical representation of the screen in the specified format. This option is
useful for including the g raphic in reports or other applications. Marker readouts and
other information are included.
Selected Trace Saves a trace for later recall back into the display from which it was saved.
RSA5100B S eries Quick Start User Manual 47
Page 66

Operation
Table 7: File types for save (cont.)
File types Description
Acq Data (acquisition data
and acquisition data export)
Measurement
Saves data for reanalysis by the analyzer (.TIQ) or as CSV (comma-separated value) or
MAT (Matlab) format to use with external software.
Saves a list of settings relevant to the selected m easurement to a TXT (text file).
Quick Tips
Select Fi
as the last time that you saved. If the file already exists, the file name suffix number will increment if you previously
selected that option in the Tools > Options > Auto Filename c ontrol panel tab.
Select File > Save As to open the standard Windows S ave dialog box where you can edit the file name, choose what
data typ
le > Save or press the Save button to save the information to a file using the same name, path, and data type
e to save, and select a folder for storing the file.
48 RSA5100B Series Quick Start User Manual
Page 67
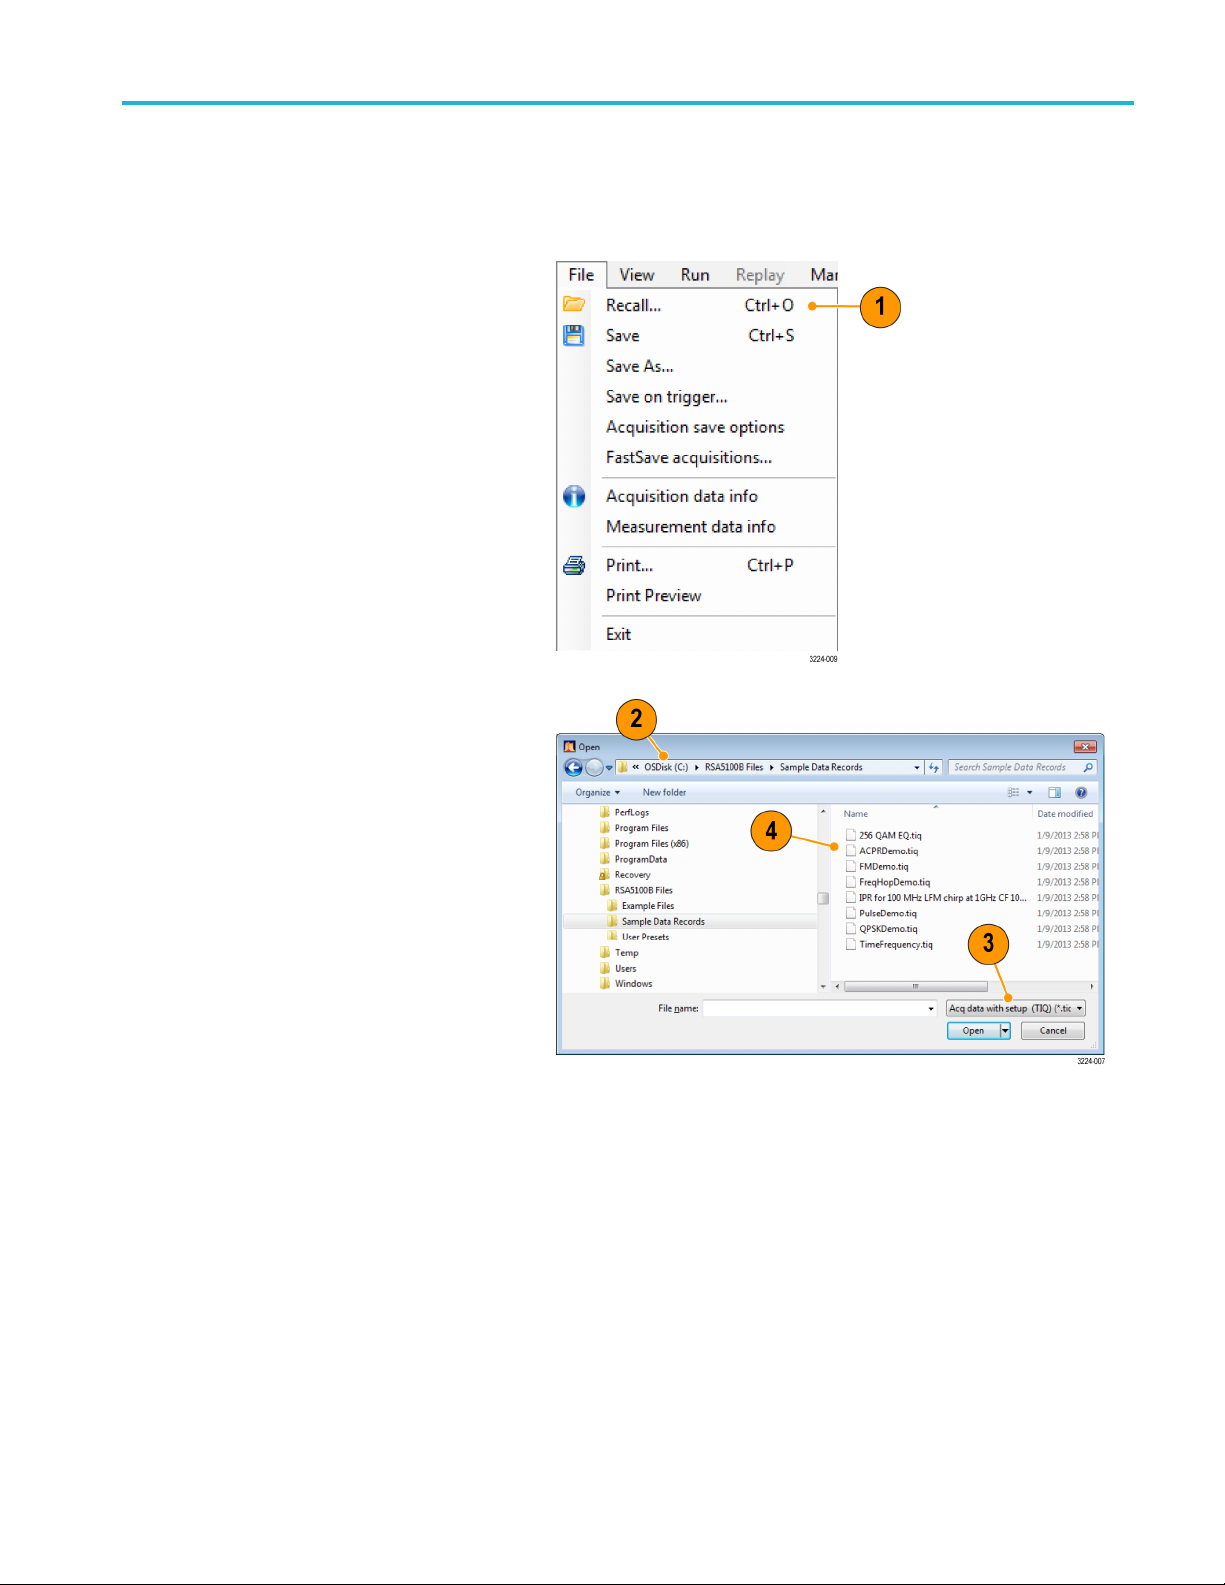
Recalling Data
You can recall and reanalyze acquisition data and setup files previously saved by an RSA6100 Series, RSA5100 Series, or
SPECMON Series analyzer.
1. Push the Recall button on the front panel
or select Recall from the File menu.
Operation
2. In the Ope
location of the file.
3. If you do not see the file, select the type
of file from the drop-down list.
4. Double click the file name to load the file.
ndialogbox,browsetothe
Quick Tip
If you recall a trace that has an x-axis range that does not fall within the x-axis range of the current graph, the trace will not be
visible. A small arrow will point off-screen in the direction of the recalled trace. Use the Frequency and Span (or Span and
set) controls to bring the trace on the screen in the Spectrum display. In other displays, use Horizontal Scale and Offset
Off
(which can also be used in the Spectrum displa y). These controls are on the Settings > Scale tab.
RSA5100B S eries Quick Start User Manual 49
Page 68

Operation
Advanced Techniques
This section contains advanced operating techniques. For examples of practical applications, see the RSA5100B Series
Real-Time Signal Analyzers Application Examples Manual.
Setting Up Triggering
The analyzers offer real-time power-level triggers, frequency mask trigger, frequency edge trigger, line trigger, runt trigger,
DPX density,
signal. This allows the analyzer to store both pretrigger and posttrigger information.
To set up triggering, first select the Event (source and trigger type). Next, continue to set other optional trigger settings,
such as Time Qualified aspects and define specific actions to be taken upon recognition of a trigger event (such as Save
data, save picture, etc ).
The analyzer has two triggering modes:
Free Run mode. In Free run mode, the instrument initiates acquisitions without considering any trigger conditions. It
is a fast and easy way to see the signals. Free Run is usually adequate for the Spectrum display unless you need to
specify a particular time at which to collect the data record.
Triggered mode. In Triggered mode, the instrument initiates an acquisition when a trigger event is recognized. The
conditions that define a trigger event depend on the selected trigger source. There are several source selections available for
choosing the signal to monitor for a trigger event.
and external triggers. It uses a trigger event as a reference point in time for the seamless acquisition of the
Once you select the Triggered mode, you must select the source. The trigger sources are:
RF Input
Trig In
Trig2In
Gated
Line
Once you select the trigger source, you can set additional parameters to specify the trigger event. If you specify the RF Input
as the trigger source, you can chose from the following trigger types:
Power Triggering. Power triggering triggers the instrument on time-domain signal characteristics. The incoming signal is
compared to a user-selected level in dBm. You can select the time-domain bandwidth and trigger on the rising or falling edge.
Frequency Edge Triggering. Frequency Edge triggering triggers the instrument on time-domain signal characteristics.
The incoming signal is compared to a user-selected level in Hertz. Frequency edge trigger is similar to Power triggering,
except you also need to set a power threshold to avoid triggering on the apparent frequency fluctuations that occur at low
amplitude. You can select the time-domain bandwidth and trigger on the rising or falling edge.
Frequency Mask Triggering. Frequency Mask Triggering allows you to trigger the instrument when a signal in the
frequency domain violates the mask. You can draw a mask to de fine the c onditions within the real-time bandwidth that will
generate the trigger event. It allows you to trigger on weak signals in the presence of strong signals. This triggering is
also useful for capturing intermittent signals.
DPX Density Triggering. This trigger type enables the instrument to capture any signal you can see in the DPX display,
including difficult to see signals hiding beneath other signals that have a higher amplitude or a greater repetition rate. Using
50 RSA5100B Series Quick Start User Manual
Page 69

Operation
the Trigger On This™ feature, you can draw a box around the area of interest in the graph, set a Density threshold, and
the instrument
will trigger when the measured Density exceeds your threshold.
Runt Triggering. Runt triggering defines a trigger event based on a pulse amplitude that crosses one threshold but fails
to cross a second threshold before recrossing the first.
In addition to defining the trigger event, you can define the following parameters by selecting the Advanced tab in the
Trigger control panel:
Position and Delay parameters that define where a trigger occurs within the acquired data record and whether to
delay the trigger for a set amount of time.
Whether a single event can trigger an entire sweep, or each segment of the sweep requires a new trigger event in
swept acquisition mode.
Time Qualified Triggering. Time Qualified triggers allow you to trigger the instrument based on when signal transitions
occur in time. You can apply time qualification to the basic trigger types. For example, if you select the Power type and
configure i
signal stays high after it exceeds the trigger threshold. You may wish to trigger only on pulses that last longer than a
specified time or shorter than a specified time. You can set Time Qualified to accept only pulse widths between two specified
values, o
t to trigger on a rising edge, Time Qualification allows you to screen rising-edge events based on how long the
r outside of these two values.
You c an ti
the instrument finds all events that meet the basic trigger criter ia, then further tests them against your time qualification
parameters.
me qualify Frequency Edge, Frequency Mask, DPX Density, and Runt trigger events. For each trigger type,
RSA5100B S eries Quick Start User Manual 51
Page 70

Operation
Accessing Trigger Parameters
1. Click Trig to o
panel.
Alternately, press the front panel TRIGGER
button.
2. As shown in the following steps, click
one of the tab
panel to de fine the trigger parameters.
3. Use the Event tab to set parameters that
define trigger events. The parameters
vary depend
and Type selections.
4. Use the Tim
parameters that qualify trigger events
based on their time duration.
pen the Trigger control
s in the Trigger control
ing on the trigger Source
e Qualified tab to set
5. Use the A
for trigger position and holdoff settings.
6. Use the Actions tab to set parameters for
the Save on trigger function. The Save
on tri
an acquisition data file and/or a screen
capture when a trigger event occurs.
dvanced tab to set parameters
gger function allows you to save
52 RSA5100B Series Quick Start User Manual
Page 71

Operation
Quick Tip
Other ways to access the Trigger control panel:
Push the Trigger button on the front panel.
Select Trigger. from the Setup menu.
Setting Up a DPX Density Trigger
The DPX Density trigger enables you to capture transient events that may be partially obscured by other higher-amplitude
or more freq
is used to select the region of interest in the display and to measure its current density. You set a density threshold, and
the instrument triggers when the density measurement exceeds your threshold.
The quickest way to set up a DPX Density trigger is to use a mouse and right-click on a signal of interest in the DPX
graph, or p
This action performs several tasks:
uent signals. If you can see it in the DPX bitmap, you can trigger on it. The DPX Density area measurement
ress on the screen and hold with your finger for one second. A menu will pop up. Select Trigger On This.
Places the density measurement box at the click point
Sets the measurement box to its default size
Measures the average density in the box
Sets the Trigger mode to Triggered
Selects the DPX Density "Higher" trigger type
Adjusts the trigger threshold to a density value slightly below the current measured value
Starts the acquisition process
To optimize DPX Density trigger settings for your particular signals, open the Trigger control panel. Use the controls for
changing the polarity of the trigger's threshold comparison (Higher versus Lower), the Threshold value, and the size and
on of the measurement box. Use the Frequency and Amplitude settings to locate the center of the box, and set the +/-
locati
values to adjust the width and height of the measurement box.
For events that are partially masked by stronger signals, you will often need to adjust the density Threshold based on
density measurements of the event of interest and of the obscuring signal. For example, if the density of the background
representing only the stronger signal is 7% and the density measurement including both signals is 9%, you would
color
set the Threshold to 8%.
RSA5100B S eries Quick Start User Manual 53
Page 72
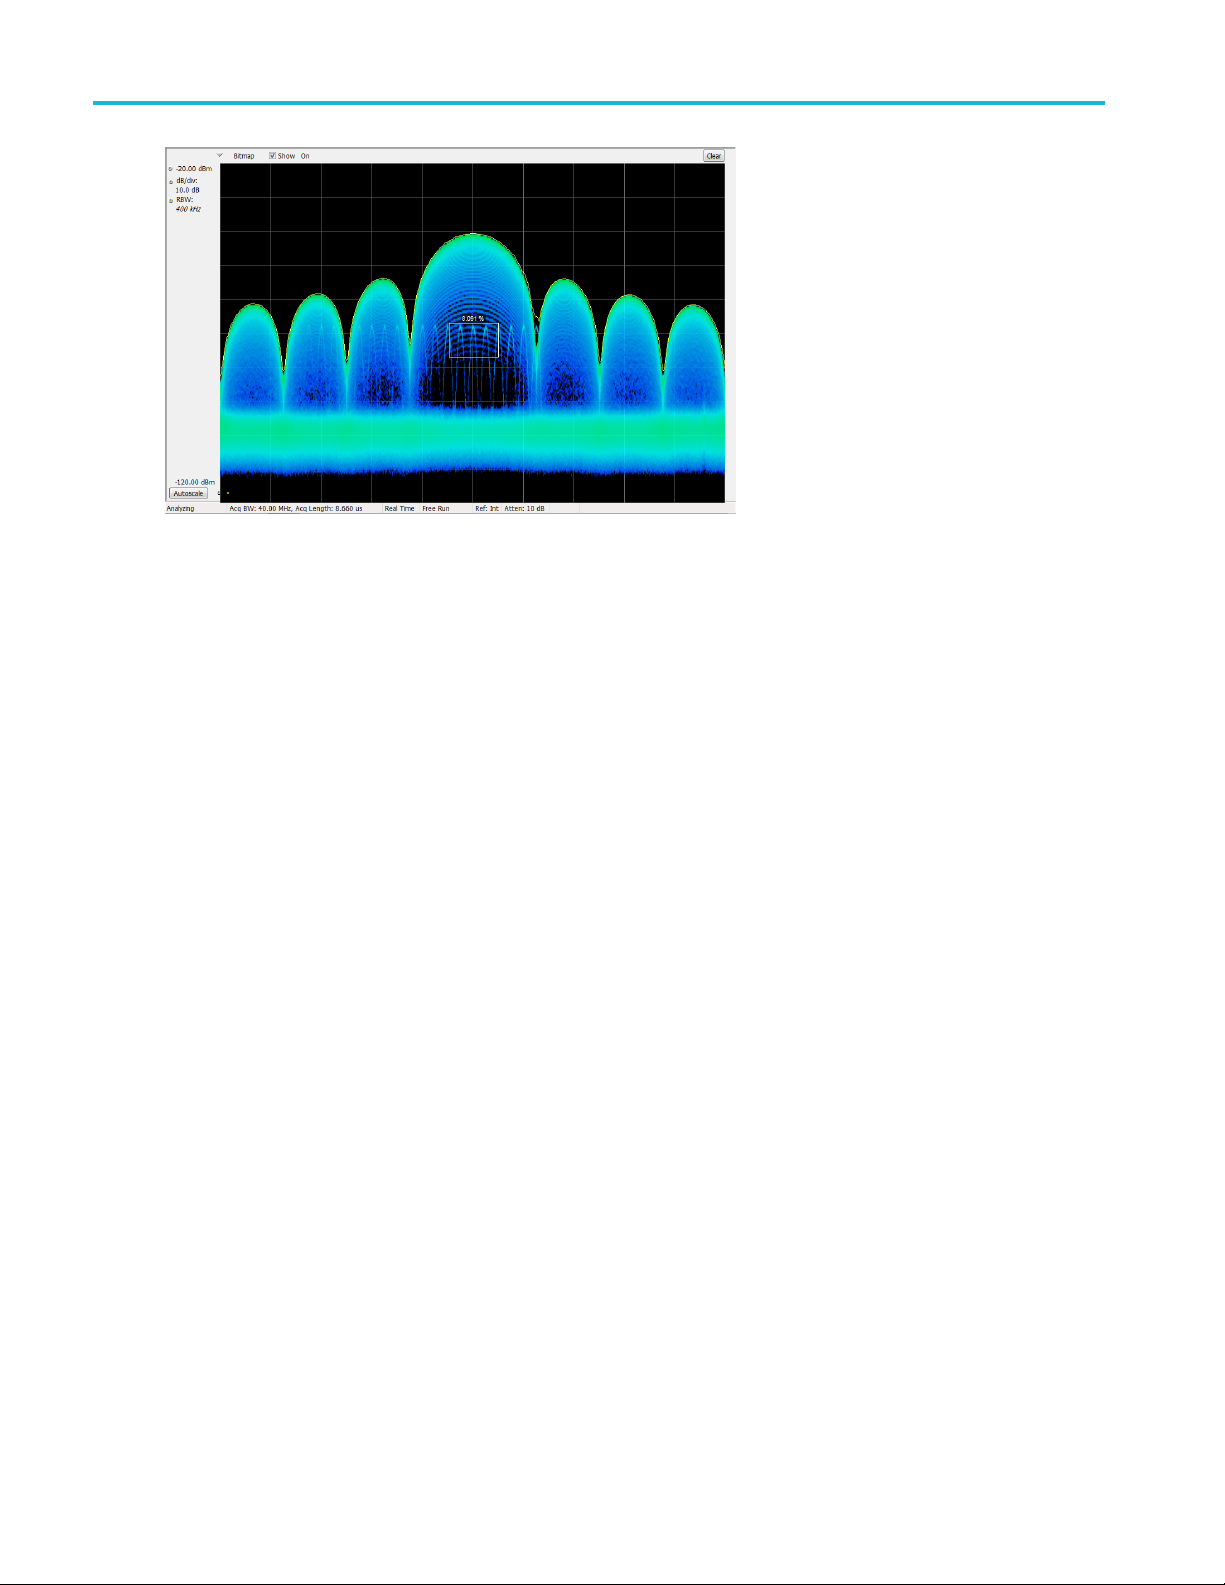
Operation
If your expected signal is a continuous tone and you want to capture events when it hops to a different frequency or drops
to a lower a
control, and set Threshold to 100%. The instrument will trigger when the signal is absent from the measurement box.
mplitude, move the Density measurement box to surround the peak of the signal, s elect Lower in the Density
Hint. The density measurement is the average of the densities for each column of pixels in the box. If your measurement
box is wider than the peak of a CW signal, the density reading will be less than 100%. To get a 100% reading, you can
broaden the peak by increasing RBW or narrow the box until there are no colored pixels either above or below the box. The
signal should enter the left side of the box and e xit the ri ght side. It should not cross the bottom edge of the box.
54 RSA5100B Series Quick Start User Manual
Page 73
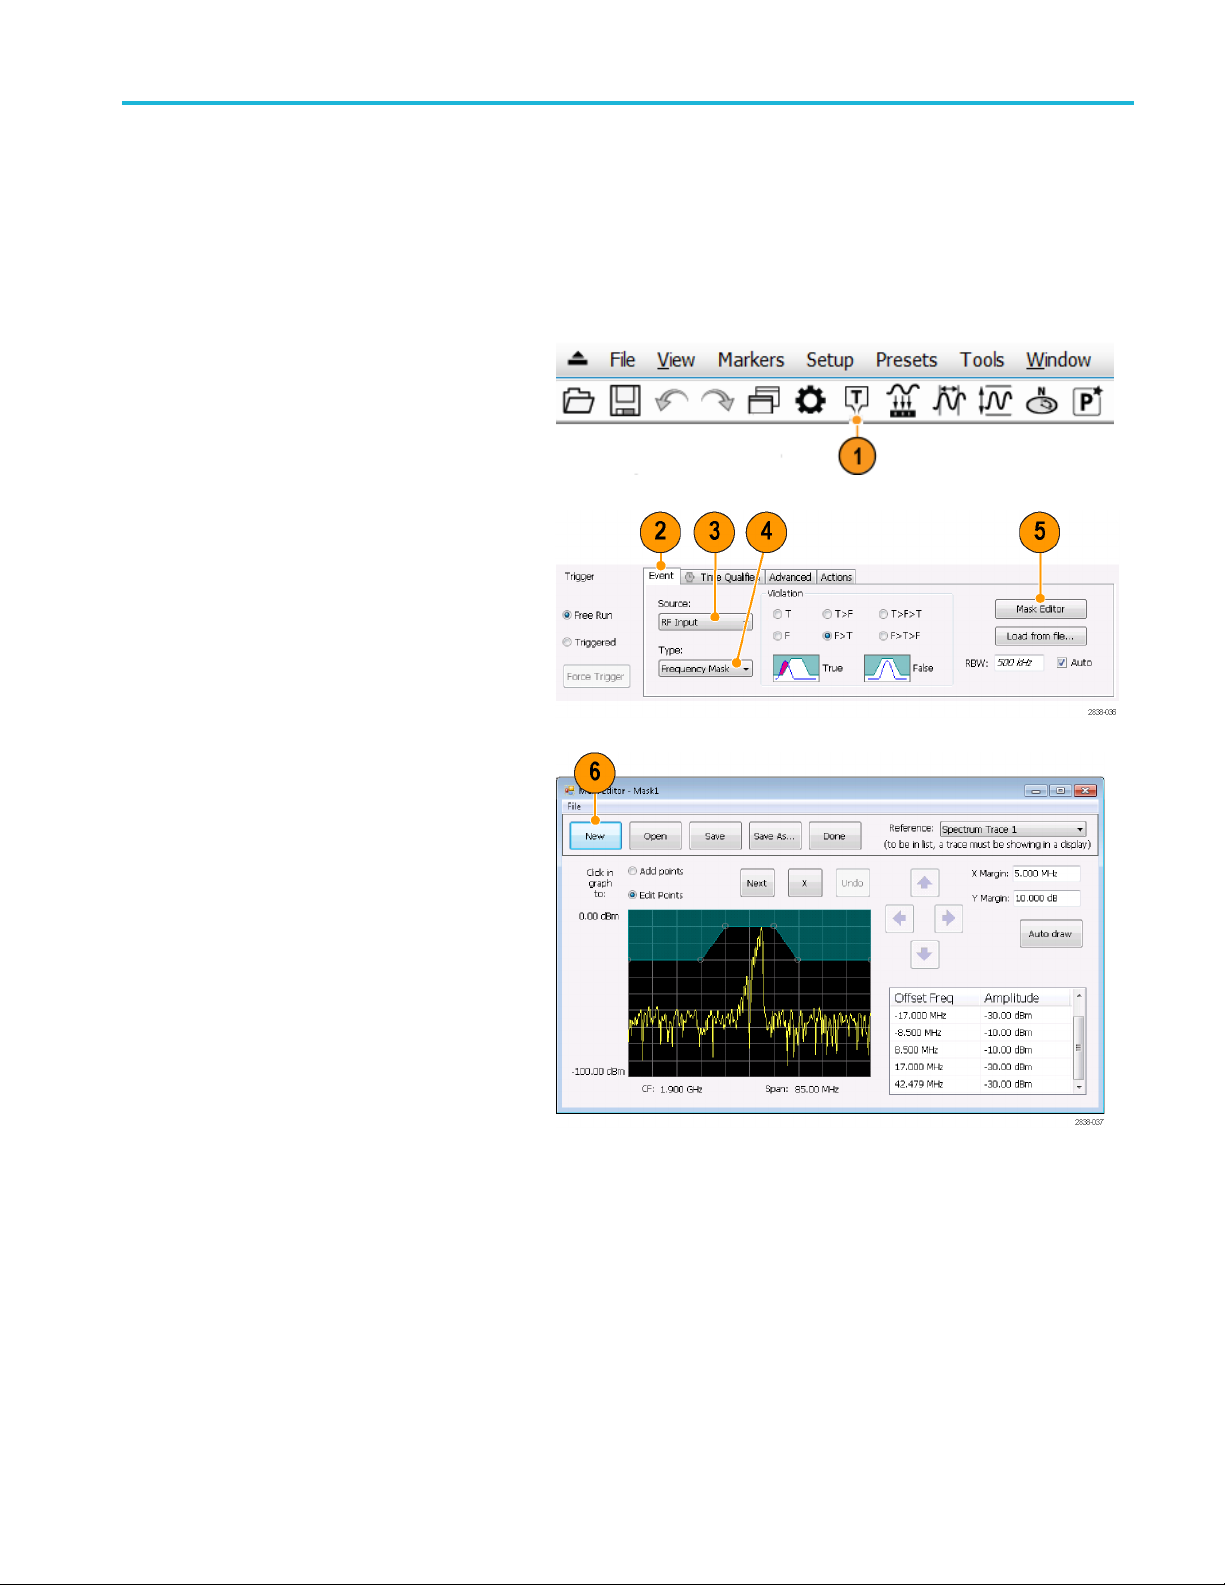
Operation
Creating a Frequency Mask
Use the Mask Editor to create a Frequency Mask. The mask is a set of points defined by frequency and amplitude. Access
the Mask Editor from the Trigger control panel. (This procedure uses the Spectrum display.)
You can create a Frequency Mask by using either the manual or Auto D raw method. The following procedure explains the
manual method. For a procedure on how to use the Auto Draw method, see the topic Mask Editor (Frequency Mask
Trigger) in the online help.
1. Click Trig to open the Trigger control
panel.
2. Select the Event tab in the control panel.
3. Set the Source to RF Input.
4. SettheTypetoFrequency Mask.
5. Click Mask Editor to open the Mask
Editor.
The Mask Editor opens with the traces of
the Spectrum display in the graph.
6. Click New in the tool bar. This removes
ting mask and then creates a
the exis
default 6-point mask.
RSA5100B S eries Quick Start User Manual 55
Page 74

Operation
7. Click any point in the mask to select it.
The frequency and amplitude of the
selected poin
graph.
8. Edit the point by doing one of the
following:
Drag and drop the point with the
mouse.
t are highlighted in the
Enter the fr
the table.
Adjust amplitude with the up/down
arrow keys and frequency with the
left/righ
equency and amplitude in
tarrowkeys.
Quick Tips
Click Auto draw to generate a mask automatically adjusted to the Reference. Set the X Margin (frequency) and Y
Margin (amplitude) before pressing Auto draw.
Right click on the display screen to add a new point.
Click Add Points and then click on the graph to add a new point in the graph.
Click Next to select the next point in the graph.
Click the X (delete button) to delete the selected mask point.
Click Save to save the mask file and continue working with the mask editor.
Click Open to load and edit a previously saved mask file.
Defining Trigger Condition s
After you have set up the mask, you can select whether to trigger on the presence or absence of m ask v iolations.
1. Sele
2. Click Triggered.
56 RSA5100B Series Quick Start User Manual
ct a condition.
The choices are described in the
following table. (See Table 8.) The icons
he bottom of the control panel identify
at t
what is considered true or false.
The instrument will trigger when the
igger conditions are met.
tr
Page 75

Operation
Table 8: Trigger violations
Violation Description
T
F The instrument triggers whenever the signal has no points in the mask.
T>F
F>T
T>F>T
F>T>F
The instrument triggers whenever the signal violates the mask (above the line).
Onetransitiondefines the trigger event. The signal must go out of the mask (no violation)
after being inside of the mask (violation).
Onetransitiondefines the trigger event. The signal must go into the mask after being
outside of t
Two transi
outside of the mask, and then cross back into the mask.
Two transitions define the trigger event. The signal must start outside of the mask (no
violation), cross into the mask, and then cross back outside of the m ask.
he mask.
tions define the trigger event. The signal must start inside of the mask, cross
Controlling Acquisitions
When two or more displays are open, one display controls the acquisition system. The acquisition requirements for the
selected display set the acquisition hardware parameters. While the acquisition parameters are optimized for the selected
display, they might not be ideal for other displays. In this case, the other displays might be unable to maintain optimum
performance and consequently might be unable to produce results. (This also happens when you analyze recalled data:
measurements attempt to deliver results, but may not be able to comply with all their settings.)
You can specify which display controls the hardware acquisition parameters by clicking anywhere in that display. When there
are multiple displays, the highlighted display controls the hardware acquisition parameters.
In this example, there are two displays, a
Spectrum display and a DPX Spectrum
display. The highlighted title bar on the
Spectrum display indicates that it is the
selected display.
The check mark indicator in the upper
left corner of the display indicates that
acquisition hardware is optimized for the
Spectrum display.
Some displays do not control the acquisition hardware. These displays just show the captured data. Some displays share
the same parameters. If any of one of these displays in such a family controls the a cquisition hardware, then the acquisition
parameters are optimized for all of the displays in that family.
RSA5100B S eries Quick Start User Manual 57
Page 76

Operation
Measurements with Conflictin g Acquisition Requirements
The analyzers let you open any combination of measurements. You can select the displays that you are interested in and the
instrument will automatically set up the appropriate analysis and acquisition parameters.
If measurements place conflicting requirements on the acquisition parameters, the current selected display takes priority. The
following example s hows incompatible measurement settings when one display needs real-time data (such as the Amplitude
vs Time measurement) while another display requires swept data (such as a Spectrum graph with a very wide span).
1. Push the Preset button on the front
panel to set the instrument to the default
settings.
2. Tune the instrument to the frequency of
your signal and then set the span.
3. Click the Displays icon to open the Select
Displays dialog box.
4. Select t
5. Select the Amplitude vs Time icon.
6. Click Add to add the icon to the Selected
NOTE. A
already in the Selected Displays list.
7. Click OK to accept the changes and
he General Signal Viewing
folder.
Displays list.
dd the Spectrum display if it is not
the dialog box.
close
58 RSA5100B Series Quick Start User Manual
Page 77

8. Increase the span in the Spectrum
display to 200 MHz.
Because Spect
display, the acquisition parameters
adjust automatically to meet the needs
of the displa
exceeds the real-time bandwidth of the
instrument. As a result, the instrument
will change t
rum is the selected
y. The 200 MHz span
o swept mode.
Operation
9. Look at the S
“Swept” indicates when acquisitions are
swept.
When the ac
all measurements usually run. If the
acquisitions are swept, only the selected
display ca
10. Click the Amplitude vs Time display to
make it th
The acquisition switches back to
real-time because the selected display
require
suitable for the Amplitude vs Time
display but doesn't contain the full range
of frequ
display.
In this case, the Spectrum is unable to
run.
tatus bar. The readout
quisitions are in “Real Time,”
nrun.
eactivedisplay.
s real-time. The data is now
encies needed by the Spectrum
RSA5100B S eries Quick Start User Manual 59
Page 78

Operation
11. Decrease the sp
an to 25 MHz in the
Spectrum display. Now the acquisitions
are real time again.
12. Check the status bar readout to verify
that the acqui
sition is real-time.
Both of the displays can run now.
60 RSA5100B Series Quick Start User Manual
Page 79

Operation
Mask Testing
The analyzer lets you test many trace results for changes in level. You can identify matches crossing a power level or
you can create a mask that specifies power level and frequency range limits. You can select which trace to test and
specify an action to take when a test condition is met for traces in the Spectrum, DPX, Noise Figure, Spurious, and Setting
Time displays. The Frequency Settling Time, Phase Settling Time, Spurious, Bluetooth InBand Emission, and Occupied
Bandwidth measurements tests provide pass/fail results.
The available choices include only results from displays that are currently open.
Selecting Mask Test from the Tools menu displays the Mask Test control panel. These settings define test parameters and
specify actions to be performed when the test conditions are met.
To start a mask test. Perform the following steps to set up for any mask test.
1. Open the Sp
Spectrum display if it is already open.
2. Select Tools > Mask Test.
3. Select the Enable Test check box to set
the application to perform the test once
the conditions are defined.
4. Selec
Search in drop-down list box.
ectrum display or select the
t the trace you wish to test from the
RSA5100B S eries Quick Start User Manual 61
Page 80
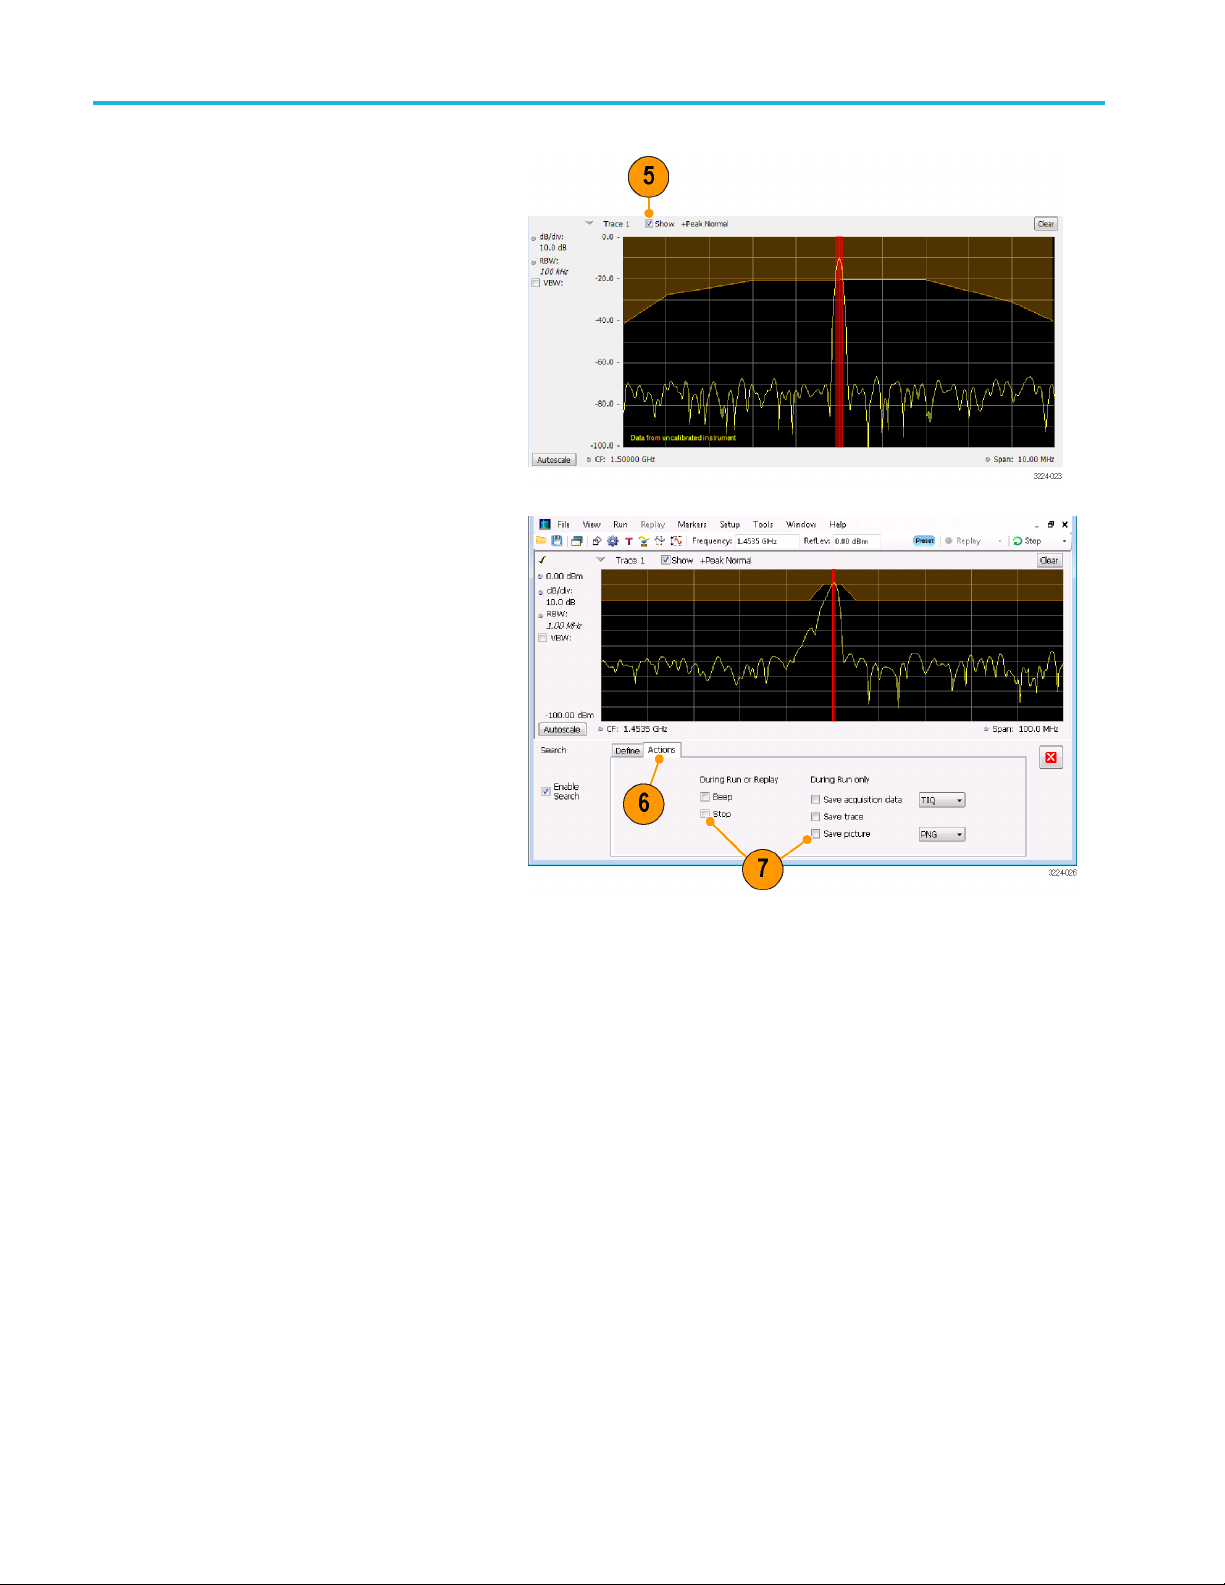
Operation
5. Verify that the trace you selected in the
Search in list is the selected trace and
that the Show b
6. Click the Actions tab to specify what
actions the analyzer should take when a
match occurs.
The analyzer can take up to five actions
when a match occurs, depending on the
run mode. In Run mode, the analyzer
can sound a beep, stop acquisitions,
save acquisition data, save trace data,
and save a picture of the display. In
Replay mode, it can sound a beep and
stop analyzing.
ox is checked.
7. To have the analyzer take an action
when a match occurs, select the desired
action.
You can select any combination of
actions to perform on a match. If you
select all actions, they will all occur when
a match is found (in Run mode).
62 RSA5100B Series Quick Start User Manual
Page 81

To perform a Greater Than/ Less Than mask test.
1. Specify what to test for by making a
selection from the Test for drop-down
list.
To test for signal levels above or below
aspecified level, select either is greater
than or is less than.
2. Press the Run button to initiate a test.
Click the Replay button on the toolbar to
initiate a test on the current data record.
3. Notice the vertical red bar. It highlights
results that match the test definition.
Operation
4. Click the close box to remove the Mask
Test control panel.
RSA5100B S eries Quick Start User Manual 63
Page 82
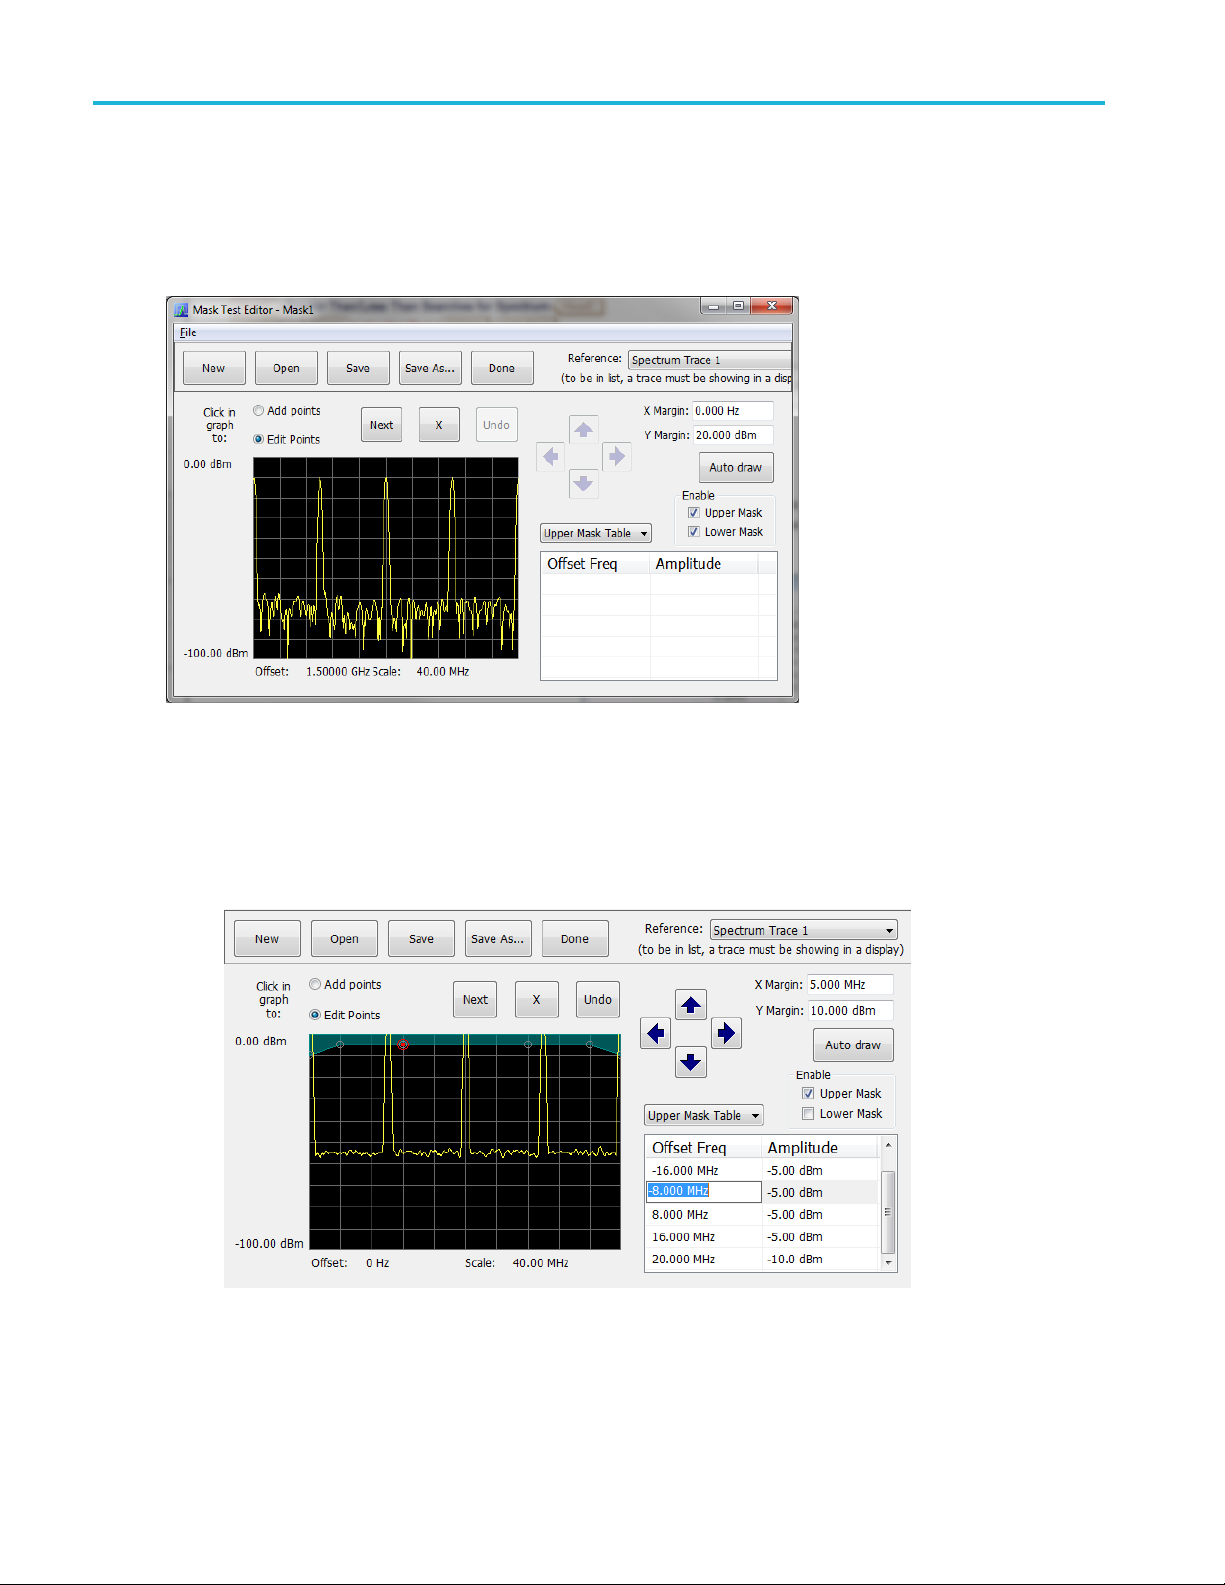
Operation
To perform an Outside/Inside mask test. If you specify a mask-based test, then you need to edit the mask to specify
the levels that
define a violation. You can do this as follows.
1. Select is outs
2. Click the Edit
3. Click the New button to create a table. This clears the existing points and loads the default table. You can also click
Open to open an existing table.
ide mask or is inside mask from the Test for menu.
limits button to display the Mask Test Editor window.
4. To edit values, add points, or delete points in a table:
a. To edit an existing value, double-click on the cell you want to edit and enter the desired value. The active point
shows as a red point on the p lot.
64 RSA5100B Series Quick Start User Manual
Page 83
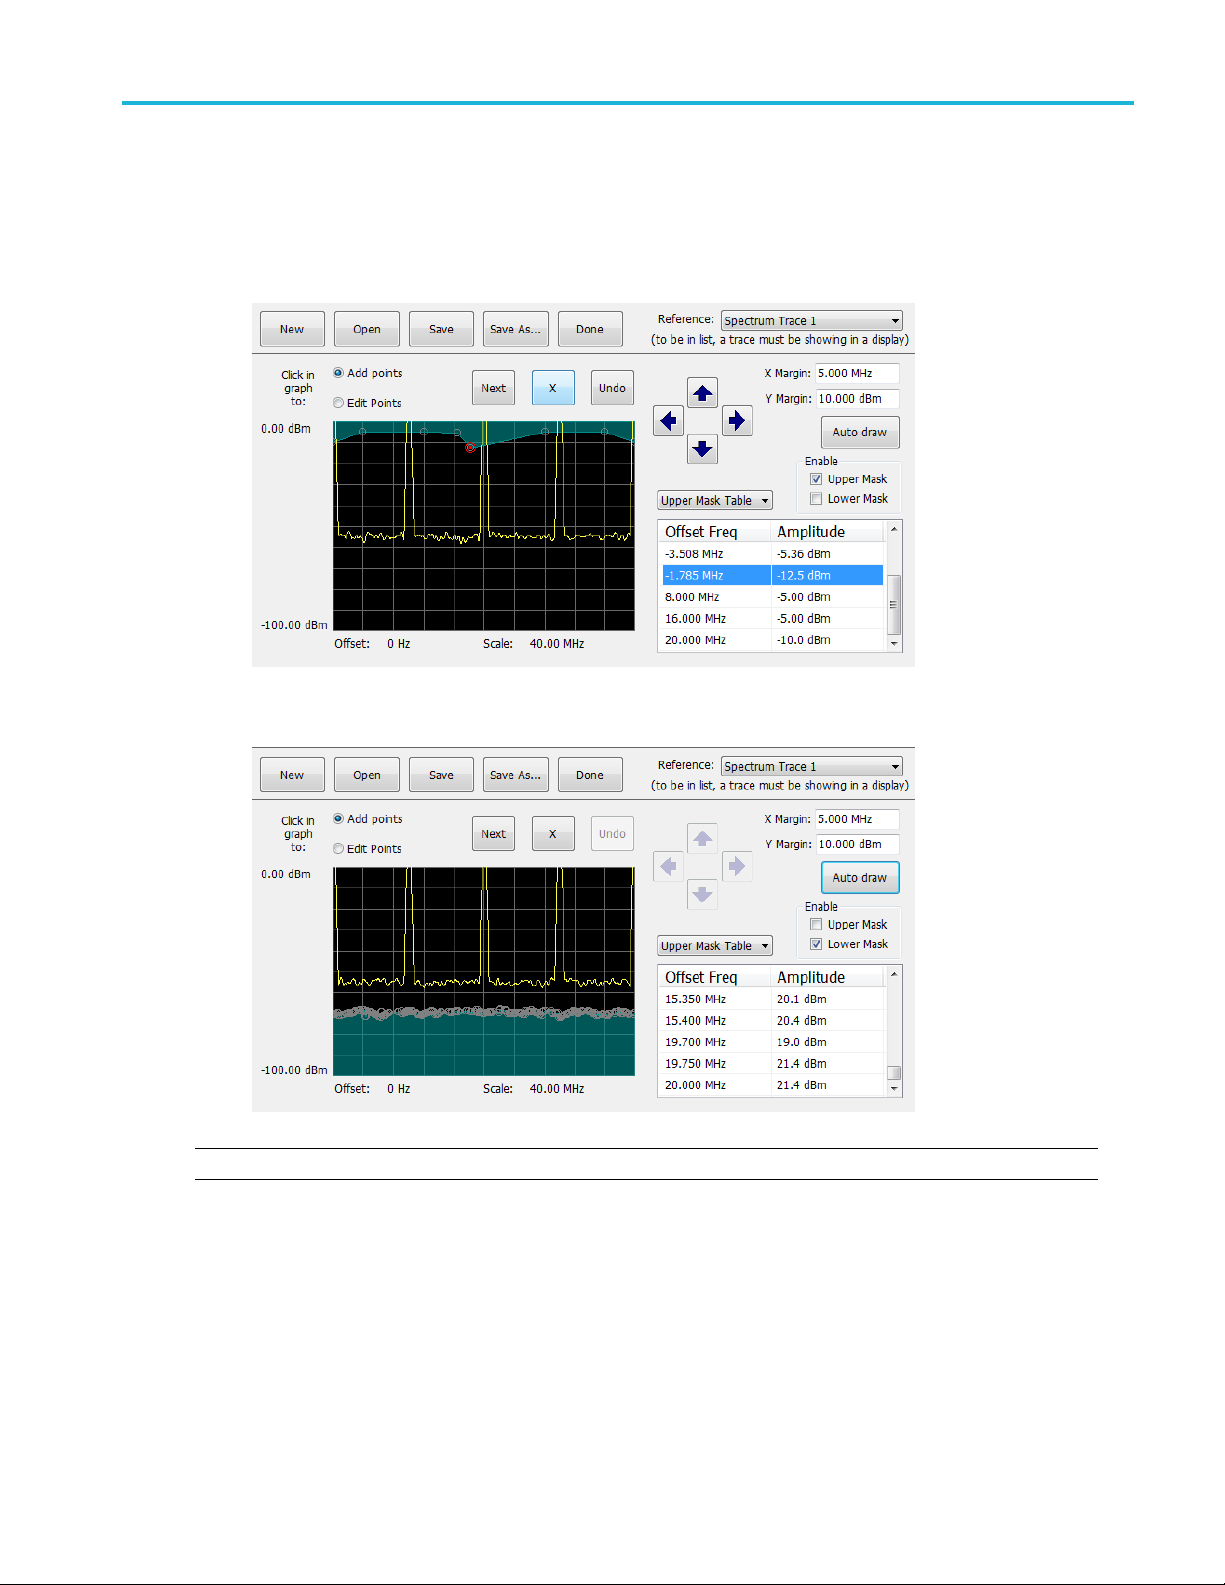
b. To add a new point, check the box next to the target mask (located below the Auto draw button).
c. Select Add points located below the Open button.
d. Select the target mask (Upper Mask Table or Lower Mask Table) from the drop-down menu.
e. Click in the desired location on the plot to add the point.
Operation
f. To use the auto draw feature to automatically place points on the chosen mask, enable the desired mask from the
drop-down menu and then click the Auto draw button.
NOTE. Units may be changed for measurements other than Noise Figure in Setup > Analysis > Units.
delete a point from the table, select the point to be removed, and click the X button.
5. To
save the mask to a file for later recall, click Save As.
6. To
om the Save As dialog, name the file and save it in the desired location.
7. Fr
RSA5100B S eries Quick Start User Manual 65
Page 84
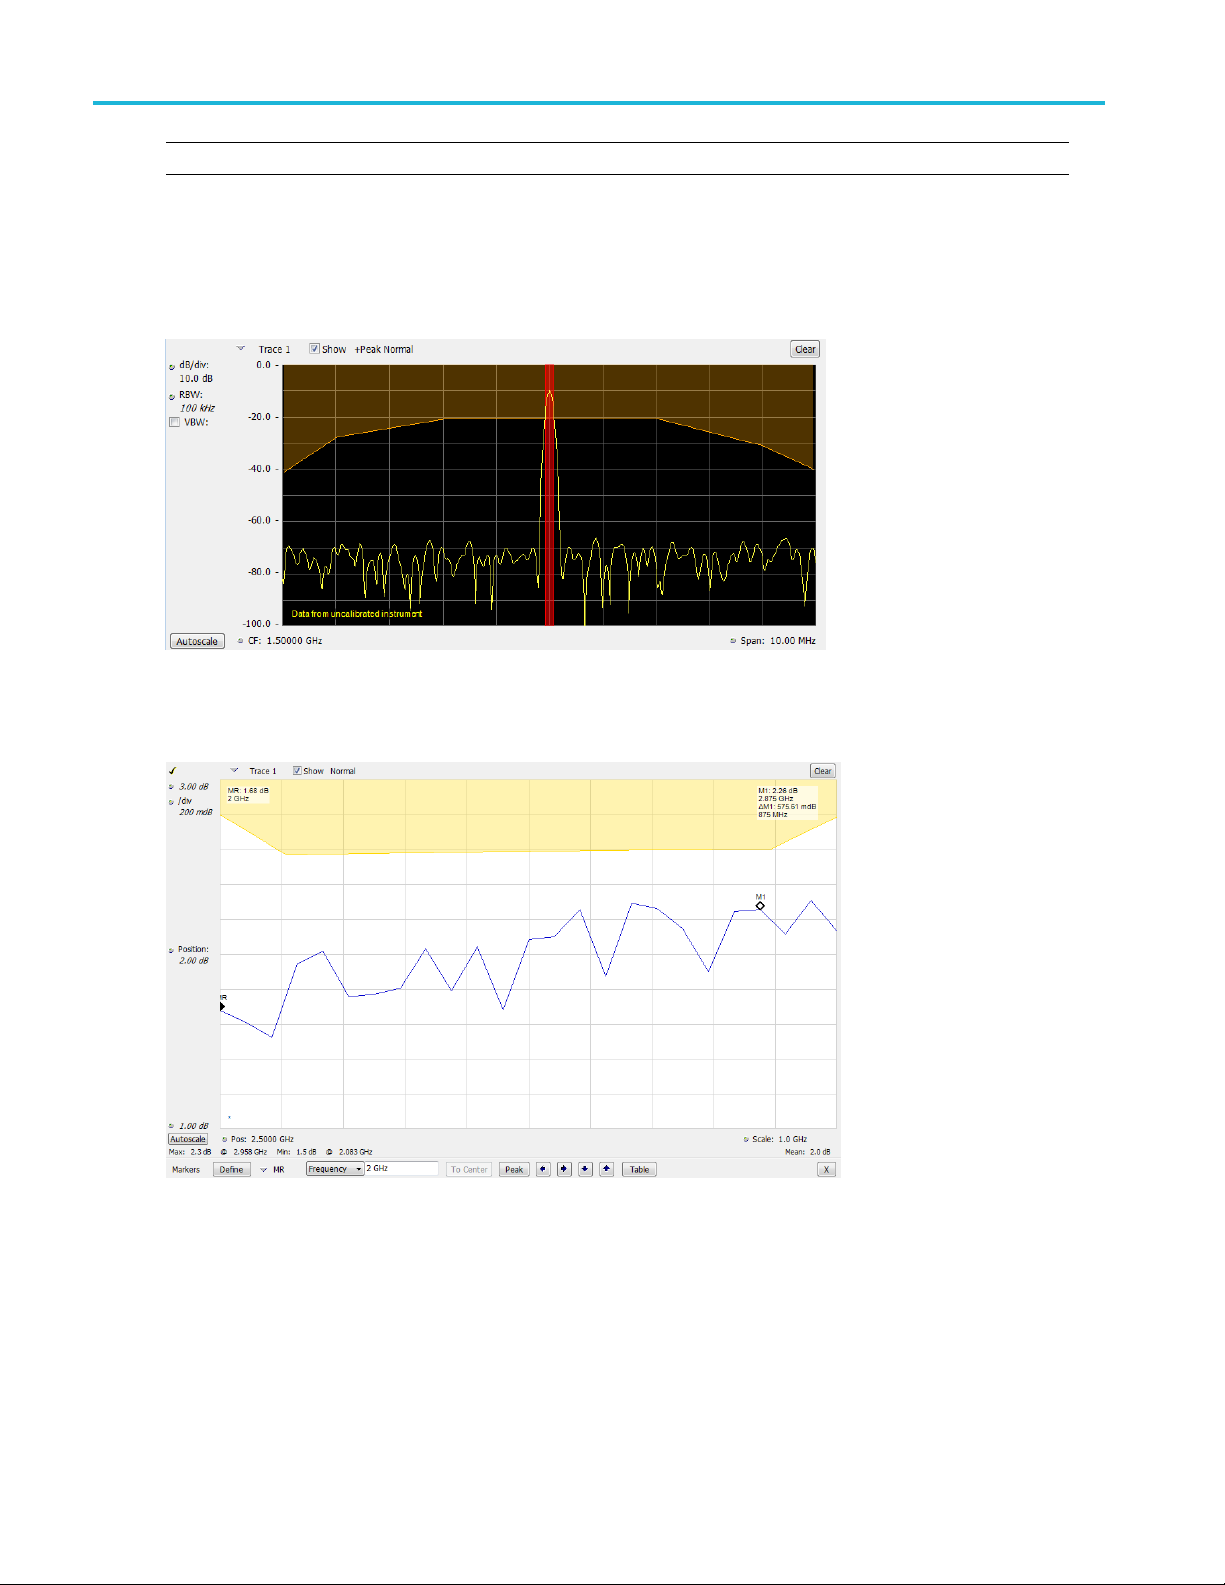
Operation
NOTE. Masks are saved in XML format with a .msk extension.
8. To dismiss the Mask Test Editor window, click Done.
Mask Test result examples. The following figure shows the results of a Spectrum is outside mask test with Upper Mask
enabled. The vertical red bar highlights results that have exceeded the test limits. The shaded region shows the mask area.
The following figure shows the results of a passing Noise Figure is outsid e mask test with Upper Mask enabled. Markers
are also
in use.
66 RSA5100B Series Quick Start User Manual
Page 85
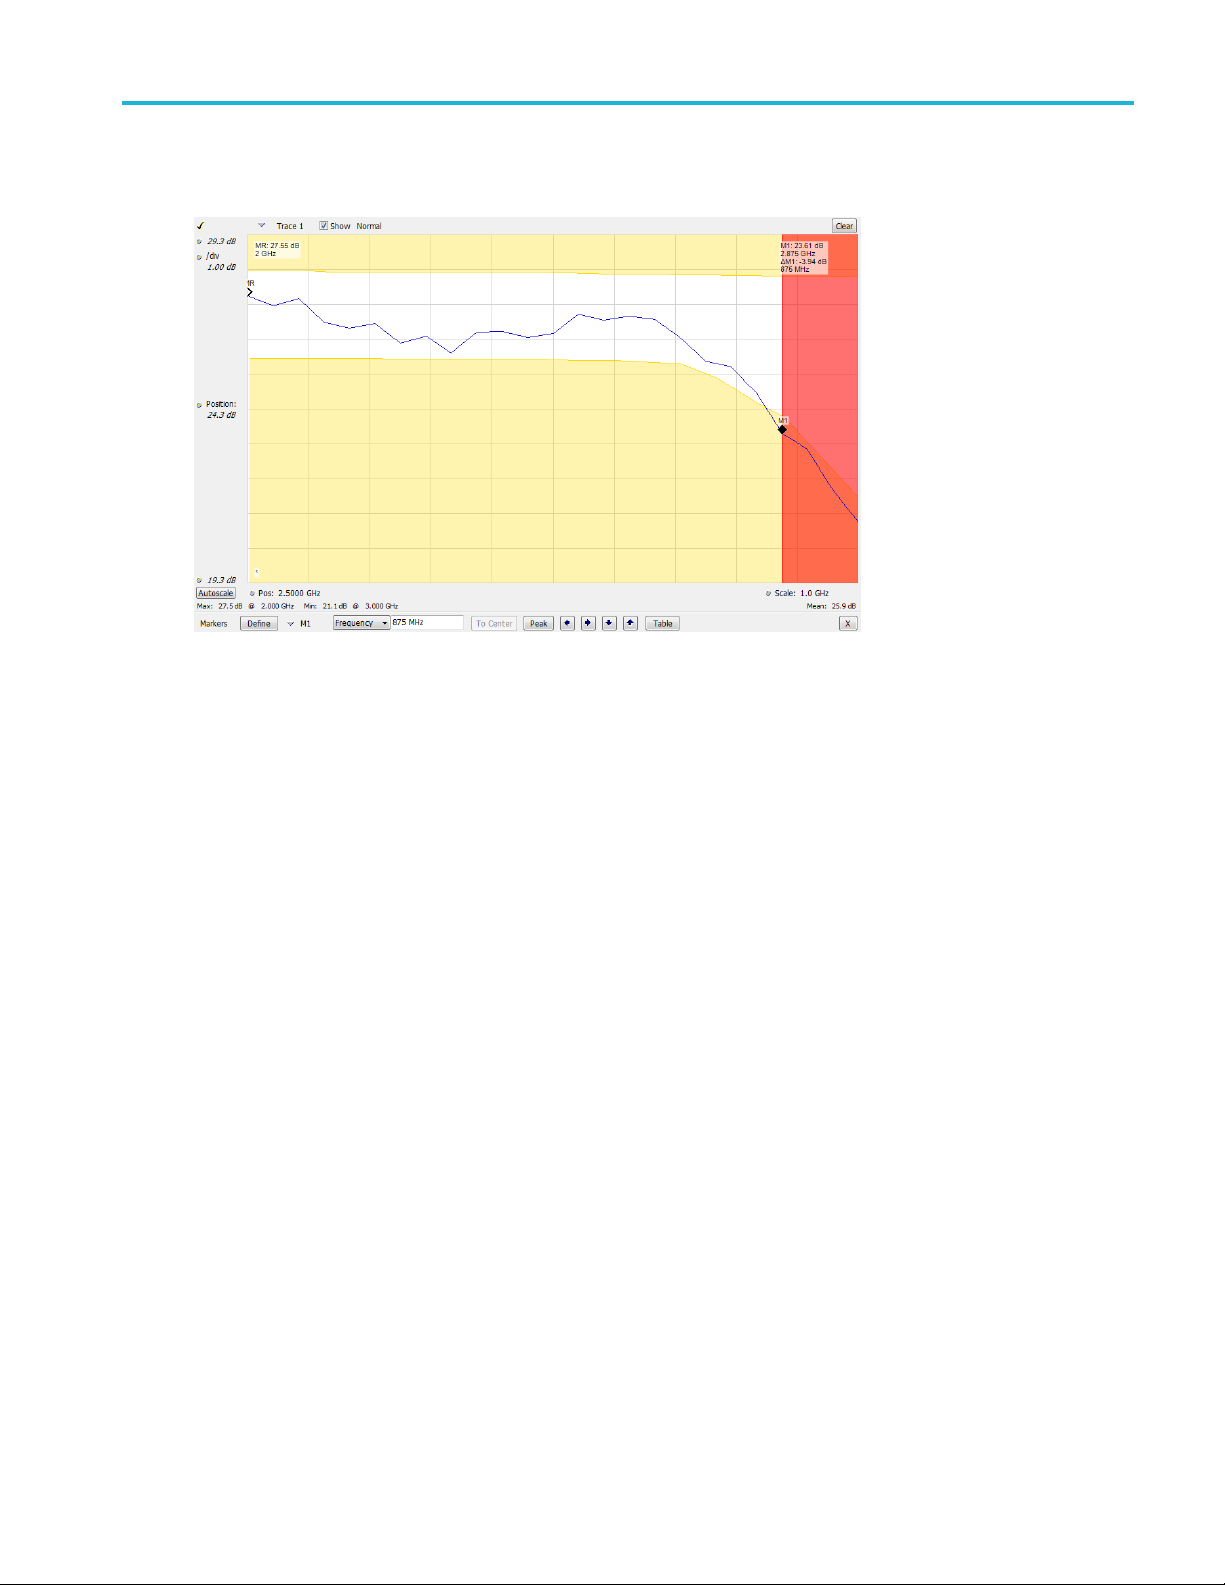
The following figure shows the results of a failing Noise Figure is outside mask test with Lower Mask and Upper Mask
enabled. The re
d area highlights the area of failure, which occurs at the lower mask. Markers are also in use.
Operation
RSA5100B S eries Quick Start User Manual 67
Page 86

Operation
Using Correction Tables
The analyzers let you correct the signal displays and measurement results to account for gains and losses in external
equipment. You can specify a single gain value or you can use an external loss table to adjust the gain/loss value based
on frequency.
To specify external gain/loss corrections:
1. Press the Amplitude icon button to
display the Amplitude control panel.
2. Select the External Gain/Loss
Correction tab.
3. To apply a constant correction factor,
select the External Gain value check
box. Ent
NOTE. You can enter either positive or
negative gain values. Positive values
repres
aloss.
4. To u s e
values depending on frequency, click a
check box under External Loss Tables.
You ca
tables at the same time. Thus, you could
use different external loss tables for an
ante
5. To e d
table, click the Edit button for the table
youwanttoedit.
er a value into the text entry box.
ent a gain. Negative values represent
a table that corrects for gain/loss
n enable all three external loss
nna, a preamplifier, and for cabling.
it the contents of an external loss
68 RSA5100B Series Quick Start User Manual
Page 87
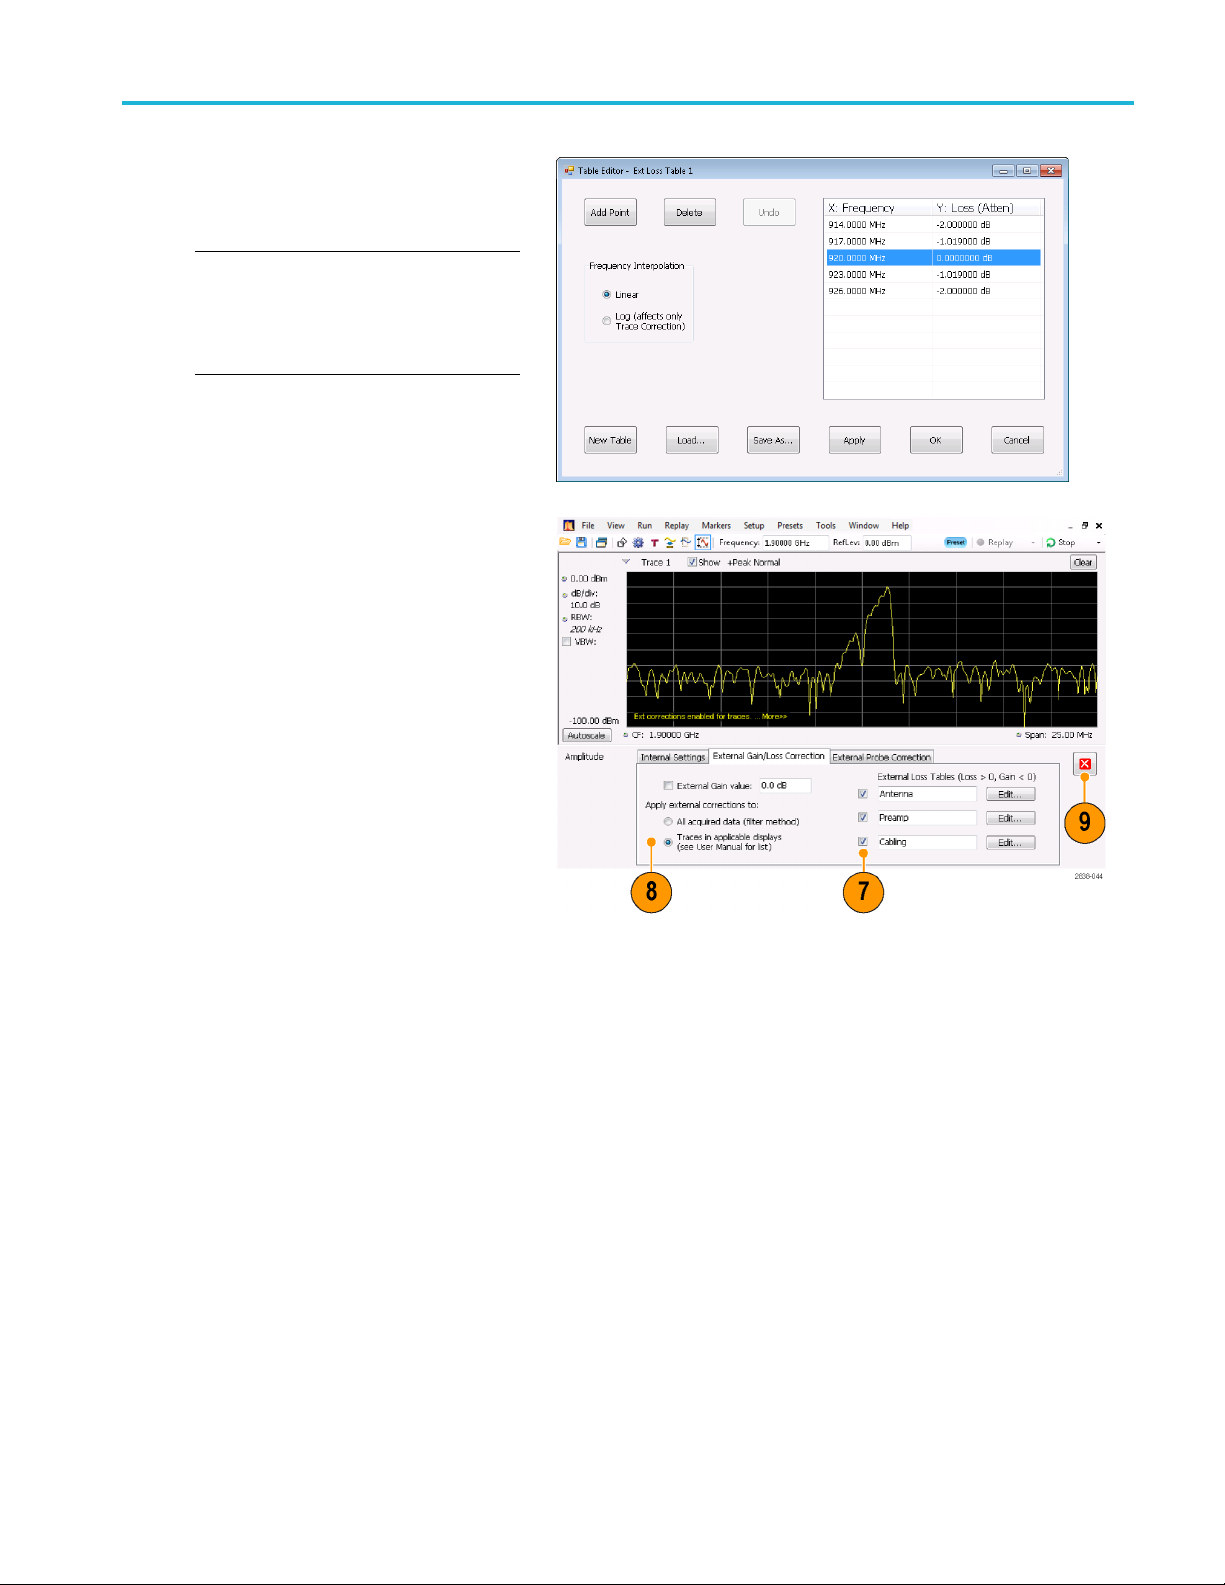
6. Edit the contents of the table to match
the loss characteristics of the equipment
you are correc
you are finished.
NOTE. You can enter either positive or
negative val
to the External Gain value setting, positive
values represent a loss and negative values
represent a g
For detailed information on using the Table
Editor, select Help > User Manual and look
in the Inde
7. You can change the title for each external
loss table. Select the title box and type
in a new title.
Note that the title is only a label. It is
not tied to the file name of any table you
have loaded or saved.
ting for. Click OK when
ues into the table. But in contrast
ain.
xforExternal Loss Tables.
Operation
8. Specify whether table corrections are
applied to all acquired data or only to
traces in the Spectrum, Spectrogram,
Spurious and Amplitude vs Time
displays.
Corrections applied to data are
performed in real time using the digital
filter capabilities of the instrument. While
this has the advantage of correcting
the data for use in all measurements,
digital filtering is limited in its ability to
apply corrections that change rapidly in
amplitude over small frequency ranges,
as may occur when switching between
two antennas. When this happens,
the filters may result in an amplitude
correction that appears to ring in its
response, resulting in poorly corrected
data. For that reason, the RSA offers
trace-only correction for spectrograms,
spectrum, spurious, and amplitude vs.
time displays. These trace corrections
are similar to those applied in traditional
spectrum analyzers, and should be
used when discontinuities occur in the
amplitude/frequency correction table.
RSA5100B S eries Quick Start User Manual 69
Page 88

Operation
When choosing w
sample data or traces, keep the following
in mind:
If sample data is acquired while
data correcti
record is permanently corrected. If the
acquisition is saved and recalled, the
recalled acq
Corrections are not saved separately
from the raw data; they are used during
the acquisi
values.
Trace corrections can be applied
at any time, as they are part of the
measureme
Replay will apply trace corrections to
a trace if this control is enabled (and
an externa
enabled).
Be aware that if you recall acquisition
data that was saved with data corrections
and you us
corrections selected and an external
loss table enabled, the trace will be
ted using corrected data and also
calcula
corrected with trace corrections. This
usually creates incorrect traces.
hether to correct
on is enabled, that data
uisition includes corrections.
tion process to adjust the data
nt's computations. Using
l loss table is specified and
e Replay with trace
9. Click the close box to remove the
ude control panel when you are
Amplit
finished making changes.
70 RSA5100B Series Quick Start User Manual
Page 89

Operation
Using Audio Demodulation
The analyzers can demodulate AM and FM signals, which can help you to analyze known and unknown radio signals. You
access the Audio Demod tab from the Settings control panel of the D PX Spectrum plot display.
To demodulate an audio signal:
1. Click the Displays icon to display the
Select Displays dialog box.
2. Select the Ge neral Signal Viewing
folder.
3. Double-click the DPX Spectrum icon to
add it to the Selected Displays list.
4. Click OK to close the dialog box. The
DPX display will open.
5. If necessary, select the Spectrum plot
from the drop-down list.
6. Press the Settings front-panel button to
display the DPX Settings control panel.
7. Click the Audio Demod tab to display
the Audio Demod control panel.
RSA5100B S eries Quick Start User Manual 71
Page 90

Operation
8. Click the On button to enable audio
demodulation.
9. To specify the demodulation type, click
either the AM o
NOTE. Note that the AM and FM buttons
select only the demodulation type; they do
not specify a
10. S et the center frequency as needed.
The receiver frequency (frequency to
be demodulated) is specified with either
markers or
front panel Frequency button or the Freq
control in the toolbar). Use the Tune with
setting t
frequency control is used to specify the
receiver frequency.
11. Select either a marker or frequency
from the Tune w ith drop-down
control
list.
r FM button.
frequency band.
the frequency control (the
o specify whether markers or the
12. If the marker you select is not enabled
(it will be visible in the display if it is
d), click the Markers buttoninthe
enable
toolbar to display the Markers toolbar.
72 RSA5100B Series Quick Start User Manual
Page 91

13. Click the Define button in the Marker
toolbar to display the Define Markers
control panel
.
Operation
14. Click Add to ad
d markers as needed.
15. Click the Settings button to return to the
Audio Demod
control panel.
16. Set the required receiver bandwidth by
ng a value into the Receiver BW
enteri
value entry box.
RSA5100B S eries Quick Start User Manual 73
Page 92

Operation
17. S e t the receiver frequency.
If you specifiedamarkerwiththeTune
with setting,
required frequency. Fine tune the marker
position with the front-panel knob or
your mouse wh
Frequency control in the Tune with
setting, press the front-panel FREQ
button, then
use the Freq setting in the toolbar to set
the required frequency.
The receive
Receiver Freq between the Tune with
and Receiver BW settings.
18. Adjust the Audio Gain setting so you can
hear the de
the sound level is also affected by the
setting of the Windows v olume control.
drag the marker to the
eel. If you selected
turn the front-panel knob or
r frequency is displayed as
modulated signal. Note that
74 RSA5100B Series Quick Start User Manual
Page 93

Specifications
Specification
Specifications
This section provides warranted and nominal characteristics. For a complete list of all instrument characteristics, refer to
the Specifications and P erformance Verification manual.
Table 9: Frequency specifications
Characteristic Description
Reference frequency
Initial accuracy at calibration 1 x 10
Reference output level
External Reference input connector BNC Connector
External Reference input level
Table 10: RF input
Characteristic Description
RF input connector
Maximum DC voltage
Maximum safe input power + 30 dBm (RF Input, RF ATT 10 dB, Pre-amp Off)
s
–6
1x10⁻⁷(Opt. PFR)
After 10 minute warm-up
>0 dBm
50 Ω nominal
–10 dBm to +6 dBm
N type (RSA5103B, RSA5106B)
Planar Crown (RSA5115B, RSA5126B)
±5V
+ 20 dBm (RF Input, RF ATT
+ 50 Watts peak (RF Input, RF ATT
pulses))
10 dB, Pre-amp On)
30dB, (<10 μs, 1% Duty Cycle repetitive
RSA5100B S eries Quick Start User Manual 75
Page 94

Specifications
Table 11: Amplitude and R F flatness (excluding mismatch error)
Characteristi
Frequency res
10 MHz to 32 MHz, LF Band ±0.2 dB ±0.5 dB
10MHzto3GHz
3GHzto6.2GHz
(RSA5106B
6B)
6.2 GHz to 15 GHz
(RSA5115B/RSA5126B)
15 GHz to 26.5 G Hz
(RSA512
Absolute amplitude accuracy at
calibra
Absolute amplitude accuracy at
ation point (LF band)
calibr
(RSA5103B/RSA5106B)
c
ponse (18 °C to 28 °C, ATT = 10 dB)
/RSA5115B/RSA512
6B)
tion point
Description
Preamp off
±0.35dB ±0.5dB
±0.5 dB ±0.7 dB
±1.0 dB ±1.0 dB
±1.2 dB ±1.2 dB
±0.31dB ±0.5dB
±0.31dB ±0.5dB
Preamp on
Table 12: Noise and distortion
Characteristic Description
3rd Order intermodulation distortion < –84 dBc at 2.130 GHz (RSA5103B/RSA5106B)
< –80 dBc at 2.130 GHz (RSA5115B/RSA5126B)
Each signal level at –25 dBm at the RF input, Attenuator = 0, 1 MHz tone
separation, Ref Level = –20 dB
Displayed average noise level (DANL), normalized to 1 Hz RBW
Preamp off
100 Hz to 2 kHz, LF Band
2 kHz to 10 kHz, LF Band
10 kHz to 32 MHz, LF Band
9kHzto1MHz
(RSA5103B/RSA5106B)
1MHzto10MHz
10MHzto2GHz
RSA5103B/RSA5106B)
10MHzto2GHz
(RSA5115B/RSA5126B)
2 GHz to 3 GHz –152 dBm/Hz
3GHzto4GHz
(RSA5106B/RSA5115B/RSA512
6B)
–124 dBm/Hz
–141 dBm/Hz
–150 dBm/Hz
–108 dBm/Hz
–136 dBm/Hz
–153 dBm/Hz
–152 dBm/Hz
–151 dBm/Hz
76 RSA5100B Series Quick Start User Manual
Page 95

Table 12: Noise and distortion (cont.)
Characteristic Description
4GHzto6.2GHz
(RSA5106B/RSA5115B/RSA512
6B)
6.2 GHz to 13 GHz
(RSA5115B/RSA5126B)
13 GHz to 23 GHz
(RSA5115B/RSA5126B)
23 GHz to 26.5 GHz
(RSA5126B)
Displayed average noise level (DANL), normalized to 1 Hz RBW
Preamp on
1 MHz to 32 MHz, LF Band
(RSA5103B/RSA5106B)
1MHzto10MHz
10 MHz to 2 GHz –164 dBm/Hz
2 GHz to 3 GHz –163 dBm/Hz
3GHzto6.2GHz
(RSA5106B)
3GHzto4GHz
(RSA5115B/RSA5126B)
4GHzto6.2GHz
(RSA5115B/RSA5126B)
6.2 GHz to 13 GHz
(RSA5115B/RSA5126B)
13GHzto23GHz
(RSA5115B/RSA5126B)
23 GHz to 26.5 GHz
(RSA5126B)
–149 dBm/Hz
–146 dBm/Hz
–144 dBm/Hz
–140 dBm/Hz
–158 dBm/Hz
–158 dBm/Hz
–162 dBm/Hz
–160 dBm/Hz
–159 dBm/Hz
–159 dBm/Hz
–157 dBm/Hz
–153 dBm/Hz
Specifications
Table 13: Channel response
Measurement center frequency Span Amplitude flatness
200 MHz ≤ 300 kHz ±0.1 dB
200 MHz 300 kHz < span ≤10 MHz ±0.2 dB
200 MHz
200 MHz 40 MHz < span ≤ 85 MHz ±0.5 dB
200 MHz 85 MHz < span ≤ 110 M Hz ± 0.5 d B
200 MHz 110 MHz < span ≤ 160 MHz ±0.5 dB
RSA5100B S eries Quick Start User Manual 77
10 MHz < span ≤ 25/40 MHz
±0.4 dB
Page 96

Specifications
Table 14: Spurious response
Characteristi
Residual response
c
Description
–95 dBm
200 MHz to 3 GHz
3 GHz to 6.2 GHz (RSA5106B/RSA5115B/RSA5126B)
6.2 GHz to 15 G
Hz
(RSA5115B/RSA5126B)
15 GHz to 26.5 GHz (RSA5126B)
Spurious response with signal
(Image supp
ression)
Ref = –30 dBm, Atten = 10 dB, RF input level = –30 dBm, RBW = 10 Hz
10 kHz to <30 MHz < –75 dBc
30MHzto3GHz
3 GHz to 6.2 GHz (RSA5106B/RSA5115B/
6.2 GHz t
RSA5126B)
o15GHz
< –75 dBc
< –70 dBc
< –76 dBc
(RSA5115B/RSA5126B)
15 GHz to 26.5 GHz (RSA5126B)
Spurious Response with Signal at CF
(offset ≥400 MHz)
< –72 dBc
Span ≤ 25 MHz,
Swept spans >
25 MHz
1 MHz – 32 MHz (LF Band)
30MHz–3GHz
3GHz–6.2GHz
A5106B/RSA5115B/RSA512
(RS
–80 dBc
–73 dBc –73 dBc –73 dBc –80 dBc
–73 dBc –73 dBc –73 dBc –80 dBc
6B)
dBc
6.2GHz–15GHz
–70
(RSA5115B/RSA5126B)
15 GHz – 26.5 G Hz
RSA5126B)
(
1
With Center frequency > 150 MHz for Options B40/B85/B125/B16x.
–66 dBc –66 dBc –66 dBc –76 dBc
Opt. B40
span ≤ 40 MHz
swept s
40 MHz
1
pans >
Opt.
B85/B125/B16x
40 MHz <
span
≤ 160 MHz
Opt. B85HD
1
/ B125HD
/B16xH
40 MHz < span
≤ 165 MHz
N/A N/A N/A
–70
dBc
–70
dBc
–80
dBc
1
D
Table 15: Physical characteristics
Characteristic Description
Dimensions
Width (with handles folded in) 473 mm (18.6 in)
Height (with feet) 282 mm (11.1 in)
Length
Weight (without options)
Net
Shipping 35.6 kg (78.5 lbs)
78 RSA5100B Series Quick Start User Manual
531 mm (20.9 in)
24.7 kg (54.5 lbs)
Page 97

Index
Index
A
Accessories
optional, 2
power cords, 1
Product Docu
standard, 1
Acquisition
conflicts, 5
controlling, 57
data source, 25
starting,
stopping, 38
Analysis window, 24, 26
Applicati
audio demodulation, 71
on presets, 29
mentation, 1
8
38
C
CF Pan
Touchscr
check mark indicator, 57
Cleaning procedures, 12
Conflict
measurement, 58
Connectors
front p
rear panel, 19
RF signal input, 37, 38
Contro
Controls
display-specific, 23
front
interface, 20
Cooling clearances, 7
ction tables, 68
corre
een actions menu, 43
s
anel, 18
lling acquisitions, 57
panel, 14
D
Data
recalling, 49
ing, 47
sav
Default settings, 36
Diagnostics, 11
ital demodulation displays, 26
Dig
Display
conflicts, 58
splay settings
Di
changing, 33
Displays
general signal viewing, 26
GP digital mo
printing, 45
Pulsed RF, 26
RF measureme
selecting, 28
Documentation, xi
Tektronix p
DPX Density
triggering, 50
dulation, 26
nt, 26
art numbers, 1
E
Environme
Extended desktop, 10
externa
External monitor, 10
ntal specifications, 7
altitude, 7
cooling clearances, 7
humidity
temperature, 7
,7
l gain/loss correction, 68
F
Features, x
pes, 47
File ty
Free Run trigger mode, 50
Frequency edge
ering, 50
trigg
Frequency mask
Mask Editor, 55
ering, 50
trigg
Frequency specifications, 75
Front panel
ectors, 18
conn
controls, 14
G
General signal viewing displays, 26
ater than (Mask Test), 63
Gre
I
Incoming inspection, 11
Information messages, 32
k saver mode, 46
In
Input requirements
max DC voltage, 37
max m easurab
power, 37
max safe input power, 37
RF, 75
RF signal range, 37
Installation, 1
network con
is inside mask (Mask Test), 64
is outside mask (Mask Test), 64
d numbers, 23
Italicize
le input
nections, 8
K
Key features, x
L
Less than (Mask Test), 63
M
nance
Mainte
cleaning procedures, 12
repackaging, 13
toolbar, 42
Marker
Markers, 40
absolute, 41
g, 42
addin
defining, 43
delta, 41
tmap trace, 41
DPX bi
power, 41
reference, 41
Editor
Mask
adding points, 55
editing points, 56
Test, 61
Mask
Measurement
conflicts, 58
hanical specifications, 7, 78
Mec
Messages
on-screen, 32
41
MR,
N
Network connections, 8
RSA5100B S eries Quick Start User Manual 79
Page 98

Index
Noise requirements
RF, 76
O
Optional accessories, 2
Options
Power cords,
1
P
Pan
Touchscreen actions menu, 43
Part number
Power cord options, 1
Power level triggering, 50
Power supp
Preset, 36
Printing, 45
Product f
Pulsed RF displays, 26
s, manuals, 1
ly, 7
selecting displays, 29, 31
system se
ink saver mode, 46
ttings, 36
eatures, x
R
Real-Time signal analyzer, 24
nel connectors, 19
Rear pa
Recalling data, 49
Repackaging, 13
cale
Reset s
Touchscreen actions menu, 43
Returning the instrument, 13
surement displays, 26
RF mea
RF signal connections, 37, 38
RF signal input range, 37
ntrol, 39
Run co
Run menu, 39
Runt triggering, 51
S
options, 47
Save
Saving data, 47
Screens, printing, 45
Select
Touchscreen ac
Selected window, 57
Selecting displays, 28
Settings
changing, 33
default, 36
preset, 36
Setups
recalling, 49
saving, 47
Software upgrades, xii
installing, 13
Span Zoom
Touchscreen actions menu, 43
Specifications
altitude,
amplitude, 76
channel response, 77
cooling cl
distortion, 76
environmental, 7
frequenc
guaranteed, 75
humidity, 7
input re
mechanical, 7, 78
noise, 76
power su
product dimensions, 7
spurious response, 78
ature, 7
temper
warranted, 75
Spectrum analyzer
ime concepts, 24
real-t
Standard accessories, 1
power cord, 1
ct Documentation, 1
Produ
Standards presets, 31
Starting acquisitions, 38
ing acquisitions, 38
Stopp
tions menu, 43
7
earances, 7
y, 75
quirements, 37, 75
pply, 7
T
Test using a mask, 63, 64
Testing signals, 61
Time Qualified
triggering, 51
touchscreen actions menu, 43
Trace legend,
Trigger
control panel, 52
mask, 55
violations, 57
Trigger Event parameters, 51
accessing, 5
Triggered trigger mode, 50
Triggering
DPX Density
free run, 50
frequency edge, 50
frequency
parameters, 51
power level, 50
Runt, 51
time qualified, 51
triggered mode, 50
34
2
,50
mask, 50
U
Upgrade
Upgrades
kits, 3
software, xii, 13
V
ions
Violat
trigger mask, 57
W
Window
sis, 24
analy
selected, 57
Windows 10, 3
Z
Zoom
Touchscreen actions menu, 43
80 RSA5100B Series Quick Start User Manual
 Loading...