

Page 1
Spectrum Analyzers
RSA5000 Series Data Sheet
Features & Benefits
RSA5000 Series 3.0 and 6.2 GHz Real Time Signal Analyzers
Outstanding Mid-Rang e Spectrum Analysis
rd
+17 dBm 3
±0.5 dB Absolute Amplitude Accuracy to 3 GHz
Displayed Average Noise Level –154 dBm/Hz at 2 GHz and
–150 dBm/Hz at 10 kHz
Phase noise –109 dBc/Hz at 1 GHz and -134 dBc/Hz at 10 MHz
Carrier Frequency, 10 kHz Offset
High spe
at 10 kHz RBW in < 1 second
Reduce time-to-fault and increase design confidence with real time
signal p rocessing
Up to 292
waveforms per second
Swept DPX Spectrum enables unprecedented signal discovery over
full frequency range
rs zero in on the problem
Trigge
DPX Density Trigger on single occurrences as brief as 5.8 μsin
frequency domain and distinguish between c ontinuo us signals vs
infrequent event
Advanced t im e-qualified, runt, and frequency-edge triggers act on
complex signals as brief as 20 ns
Order Intercept at 2 GHz
ed sweeps with high resolution and low noise: 1 GHz sweeps
,000 spectrums per second, 50,000 time domain (zero span)
Capture the widest and deepest signals
25, 40 or 85 MHz acquisition bandwidths
Acquire more than 7 seconds at 85 MHz bandwidth
More standard analysis than you expect in an everyday tool
Measurements including Channel Power, ACLR, CCDF, OBW/EBW,
Spur Search ,
Amplitude, frequency, phase vs. time, DPX Spectrum, and
Spectrograms
Correlated multi-doma in displays
Optional performance offers add ed value
Advanced DPX including swept DPX, DPX Zero Span with real time
amplitude, frequency, or phase
Advanced Triggers DPX density, time-qualified, runt, frequency edge,
and frequen
Phase Noise and Jitter
Automated Settling Time Measurements (Frequency and Phase)
More than 20 pulse measurements including Rise Time, Pulse Width,
Pulse-to-Pulse Phase, Impulse Response
General P urpose Modulation Analysis of more than 2 0 Modulation
Types
Flexible OFDM analysis of 802.11a/g/j and WiMax 802.16-2004
EMI d etectors
cy mask
Applications
RF Debug a
Spectrum Management – reduce time to intercept and identify known
and unkno
Radio/Satellite Commu nications – Analyze complex behavior of new
designs
EMI Diagnostics – Increase confidence that designs will pass
complian
Radar/EW – Complete analysis o f pulsed, hopping signals of all types
nd design of components, modu les and systems of all types
wn signa ls
ce testing
Page 2
Data Sheet
Revolutiona
discover in
Two high lev
blue, and a t
density tri
is present.
automatic
the measur
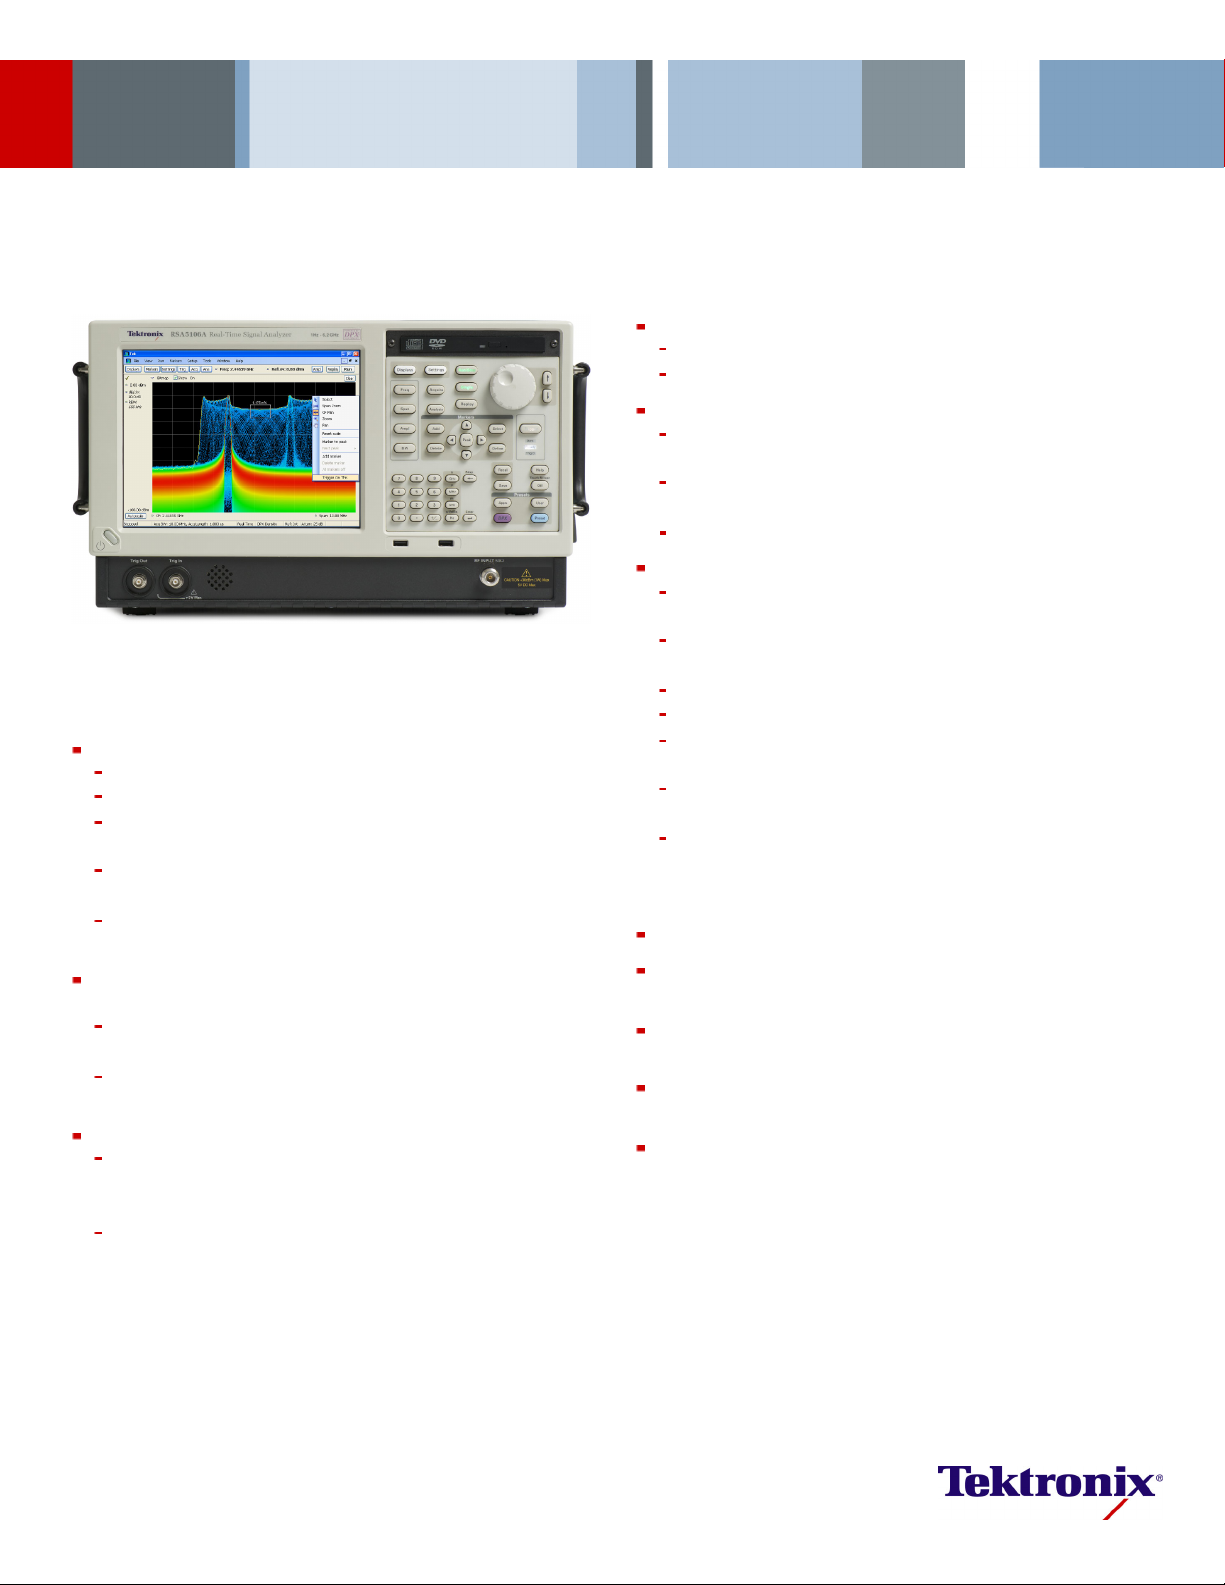
ry DPX® spectrum display reveals transient signal behavior that helps you
stability, glitches, and interference. Here, three distinct signals can be seen.
el signals of different frequency-of-occurrence are seen in light and dark
hird signal beneath the center signal can also be discerned. The DPX
gger allows the user to acquire signals for analysis only when this third signal
Trigger On This™ has been activated, and a density measurement box is
ally opened, measuring a signal density 7.275%. Any signal density greater than
ed value will cause a trigger event.
High-performance Spectrum and Vector
Signal Analysis, and Much More
The RSA5000 Series replaces conventional high-performance signal
analyzers, offering the measurement confidence and functionality you
demand for everyday tasks. A +17 dBm TOI and –154 dBm/Hz DANL at
2 GHz gives you the dynamic range you expect for challenging spectrum
analysis measureme nts. All analysis is fully preselected and image free.
You never
bandwidth by ‘switching out the preselector’.
A complet
standard, including Channel Power, ACLR, CCDF, Occupied Bandwidth,
have to compromise between dynamic range and analysis
e toolset of power and signal statistics measurements are
AM/FM/PM, and Spurious measurements. Available Phase Noise and
General Purpose Mod ulation Analysis measurements round out the
expected set of
high-performance analysis tools.
But, just being an excellent mid-range signal analyzer is not sufficient to
meet the demands of today’s hopping, transient signals.
The RSA5000 Series will help you to easily discover design issues that
other signal analyzers may miss. The revolutionary DPX
®
spectrum display
offers an intuitive live color view of signal transients changing over tim e in
the frequency domain, giving you immediate confidence in the stability of
your design, or instantly displaying a fault when it occurs. This live display
of transients is impossible with o ther signal analyzers. Once a problem is
discovered with DPX
®
, the RSA5000 Series spectrum analyzers can be set
to trigger on the event, capture a contiguous time record of changing RF
events, a nd perform time-correlated analysis in all domains. You get the
functionality of a high-performance spectrum analyzer, wideband vector
signal analyzer, and the unique trigger-capture-analyze capab ility of a
real-time spectrum analyzer – all in a single package.
Discover
The patented DPX®spectrum processing engine brings live analysis
of transient events to spectrum analyzers. Performing up to 292,000
frequency
transforms per second, transients of a minimum event duration
of 5.8 μs in length are displayed in the frequency domain. This is orders
of magnitude fast er than swept analysis techniques. Events can be
color coded by rate of occurrence onto a bitmapped display, providing
unparalleled insight into transient signal behavior. The DPX spectrum
processor can be swept over the entire frequency range of the instrument,
enabling
broadband transient capture previously unavailable in any
spectrum analyzer.
2 www.tektronix.com/rsa
Page 3
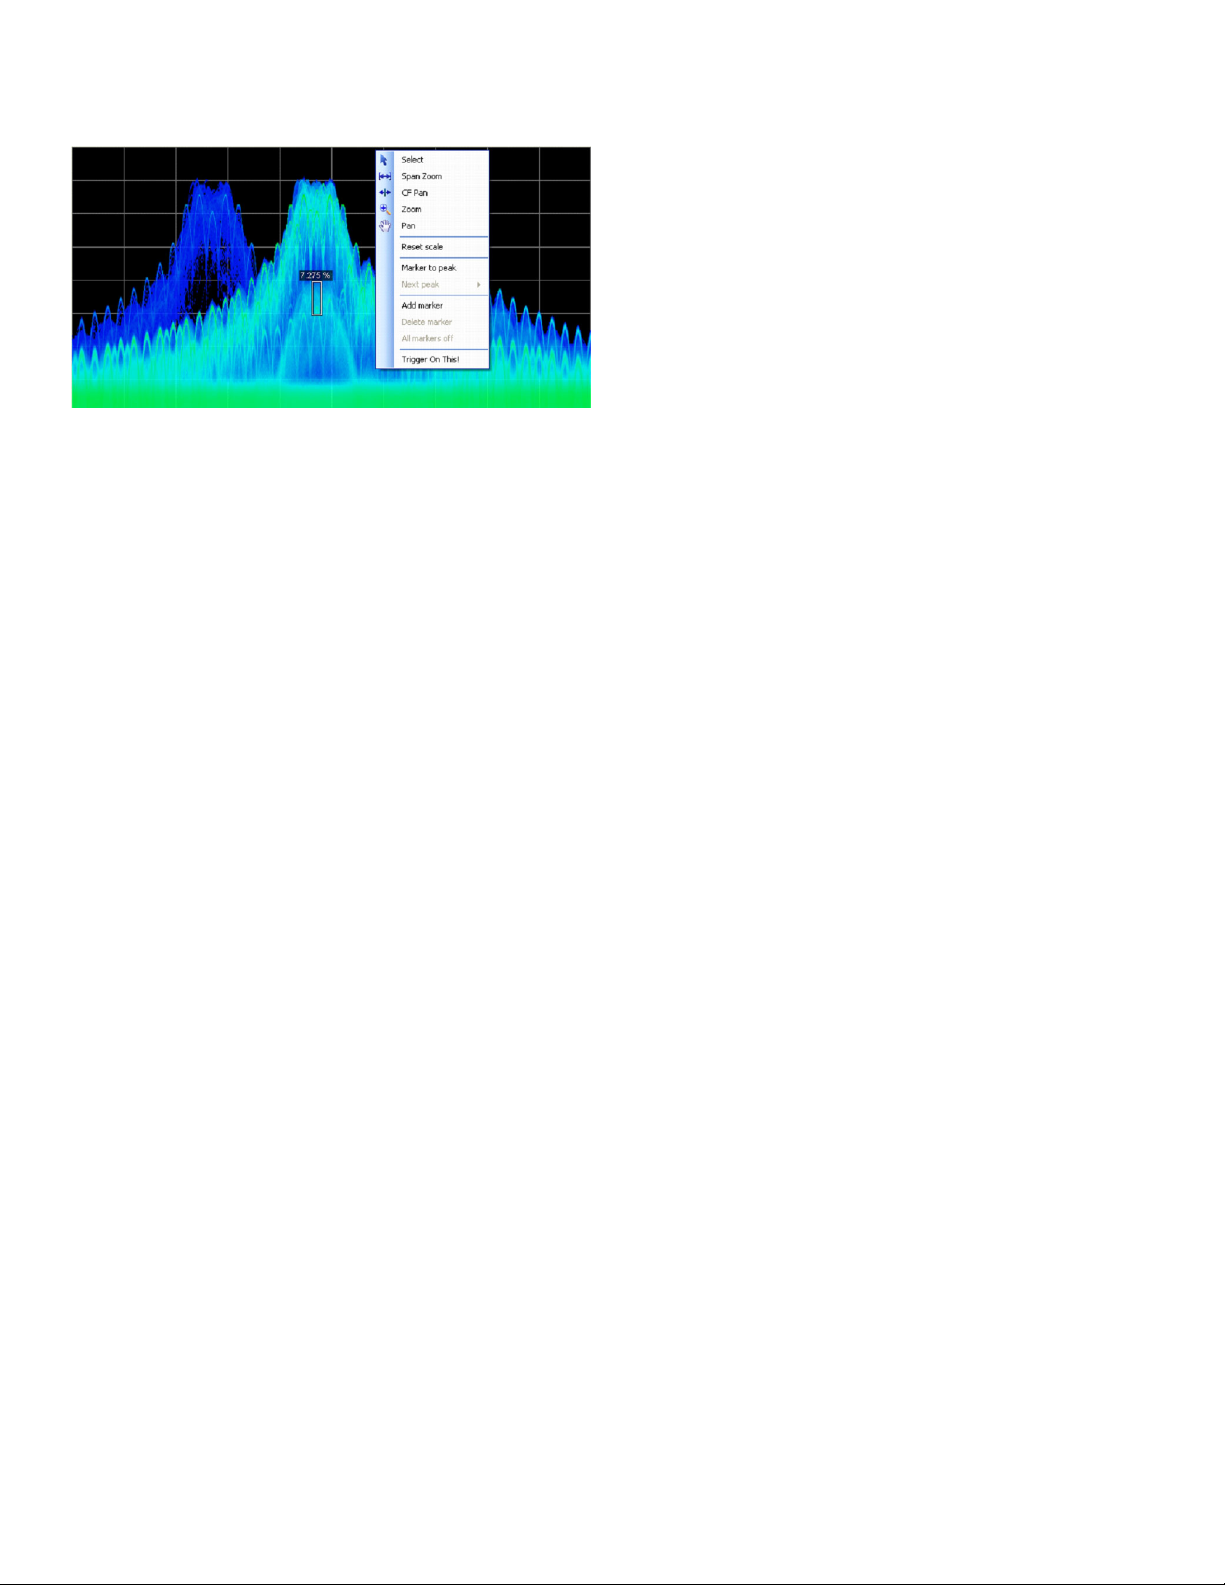
Trigger and Capture: The DPX Density™ Trigger monitors for changes in the frequency
domain, and captures any violations into memory. The spectrogram display (left panel)
shows frequency and amplitude changing over time. By selecting the point in time in
the spectrogram where the spectrum violation triggered the DPX Density™ Trigger, the
frequency domain view (right panel) automatically updates to show the detailed spectrum
view at that precise moment in time.
Tri gger
Tektronix has a long history of innovative triggering capability, and the RSA
Series spectrum analyzers lead the industry in triggered signal analysis.
The RSA5000 Series provides unique triggers essential for troubleshooting
modern digitally implemented RF systems. Includes time-qualified power,
runt, density, frequency, and frequency mask triggers.
Time qualification can be applied to any internal trigger source, enabling
capture of ‘the short pulse’ or ‘the long pulse’ in a pulse train, or, when
Spectrum Analyzers — RSA5000 Series
applied to the Frequency Mask Trigger, only triggering when a frequency
domain event lasts for a specified time. Runt triggers capture troublesome
infrequent pul
reducingtimetofault.
DPX Density™ Tr
density of the DPX display. The unique Trigger On This™ function allows
the user to simply point at the signal of interest on the DPX display, and
a trigger level is automatically set to trigger slightly below the measured
density level. You can capture low-level signals in the presence of high-level
signals at the click of a button.
The Frequency Mask Trigger (FMT) is easily configured to monitor all
changes in frequency occupancy within the acquisition bandwidth.
A Power Trigger working in the time domain can be armed to monitor for a
user-set power threshold. Resolution bandwidths may be used with the
power trigge
are available for synchronization to test system events.
Capture
Capture once
signals in an acquisition bandwidth are recorded into the RSA5000
Series deep memory. Record lengths vary depending upon the selected
acquisition bandwidth – up to 7 seconds at 85 MHz, 343 seconds at
1 MHz, or 6.1 hours at 10 kHz bandwidth with Memory Extension (Opt.
53). Real-time capture of small signals in the presence of large signals is
enabled wit
(Opt. 85). A cquisitions of any length can stored in Matlab™ Level 5 format
for offline analysis.
ses that either turn on or turn off to an incorrect level, greatly
igger works on the measured frequency of occurrence or
r for band limiting and noise reduction. Two external triggers
– make multiple measurements without recapturing. All
h 73 dB SFDR in all acqu isition bandwidths, even up to 85 MHz
www.tektronix.com/rsa 3
Page 4
Data Sheet
Analyze
The RSA5000 Series offers analysis capabilities that advance productivity
for engineers working on components or in RF system design, integration,
and performance verification, or operations engineers working in networks,
or spectrum man
agement. In addition to spectrum analysis, spectrograms
display both frequency and amplitude changes over time. Time-correlated
measurements can be made across the frequency, phase, amplitude,
and modulation domains. This is ideal for signal analysis that includes
frequency hopping, pulse characteristics, modulation switching, settling
time, bandwidth changes, and intermittent signals.
The measurement capabilities of the RSA5000 Series and available options
and software packages are summarized below:
Measurement Functions
Measurements Description
Spectrum Analyzer
Measurements
Time Domain and
Statistical Measurements
Spur Sear
Measurem
Analog Modulation
Analysis Measurement
Functions
Phase Noise and Jitter
Measurements (Opt. 11)
Settling Time (Frequency
and Phase) (Opt. 12)
Advanced Pulse
Measurements Suite
(Opt. 20)
General Purpose Digital
Modulation Analysis
(Opt. 21)
ch
ent
Channel Power, Adjacent Channel Power, Multicarrier
Adjacent Channel Power/Leakage Ratio, Occupied
Bandwidth, xdB Down, dBm/Hz Marker, dBc/Hz Marker
RF IQ vs. Time, Power vs. Time, Frequency vs. Time,
Phase vs. Time, CCDF, Peak-to-Average Ratio
Up to 20 fr
(peak, av
VBW in eac
Measurem
relative
tabular f
% Amplitude Modulation (+, –, Total)
Frequency Modulation (±peak, +peak, –peak, RMS,
peak-peak/2, Frequency Error)
Phase Modulation (±peak, RMS, +peak, –peak)
10 Hz to 1 GHz Frequency Offset Range, Log
Frequency Scale
Traces – 2: ±Peak Trace, Average Trace, Trace
Smoothing and Averaging
Measured Frequency, Settling Time from last settled
frequency, Settling Time from last settled phase,
Settling Time from Trigger. Automatic or manual
reference frequency selection. User-adjustable
measurement bandwidth, averaging, and smoothing.
Pass/Fail Mask Testing with 3 user-settable zones
Average On Power, Peak Power, Average Transmitted
Power, Pulse Width, Rise Time, Fall Time, Repetition
Interval (seconds), Repetition Interval (Hz), Duty Factor
(%), Duty Factor (ratio), Ripple (dB), Ripple (%),
Overshoot (dB), Overshoot (%), Droop (dB), Droop (%),
Pulse-Pulse Frequency Difference, Pulse-Pulse Phase
Difference, RMS Frequency Error, Max Frequency
Error, RMS Phase Error, Max Phase Error, Frequency
Deviation, Phase Deviation, Impulse Response (dB),
Impulse Response (time), Time Stamp
Error Vector Magnitude (EVM) (RMS, Peak, EVM
vs. Time), Modulation Error Ratio (MER), Magnitude
Error (RMS, Peak, Mag Error vs. Time), Phase Error
(RMS, Peak, Phase Error vs. Time), Origin Offset,
Frequency Error, Gain Imbalance, Quadrature Error,
Rho, Constellation, Symbol Table
equency ranges, user-selected detectors
erage, QP), filters (RBW, CISPR, MIL), and
h range. Linear or Log frequency scale.
ents and violations in absolute power or
toacarrier. Upto999violationsidentified in
orm for export in CSV format
Measurements Description
Flexible OFDM analysis
(Opt. 22)
DPX Density
Measurement
(Opt. 200)
RSAVu Analysis Software W-CDMA, HSUPA. HSDPA, GSM/EDGE, CDMA2000
Analysis SW
(RSA-IQWIMAX)
Analysis Software
(RSALTE)
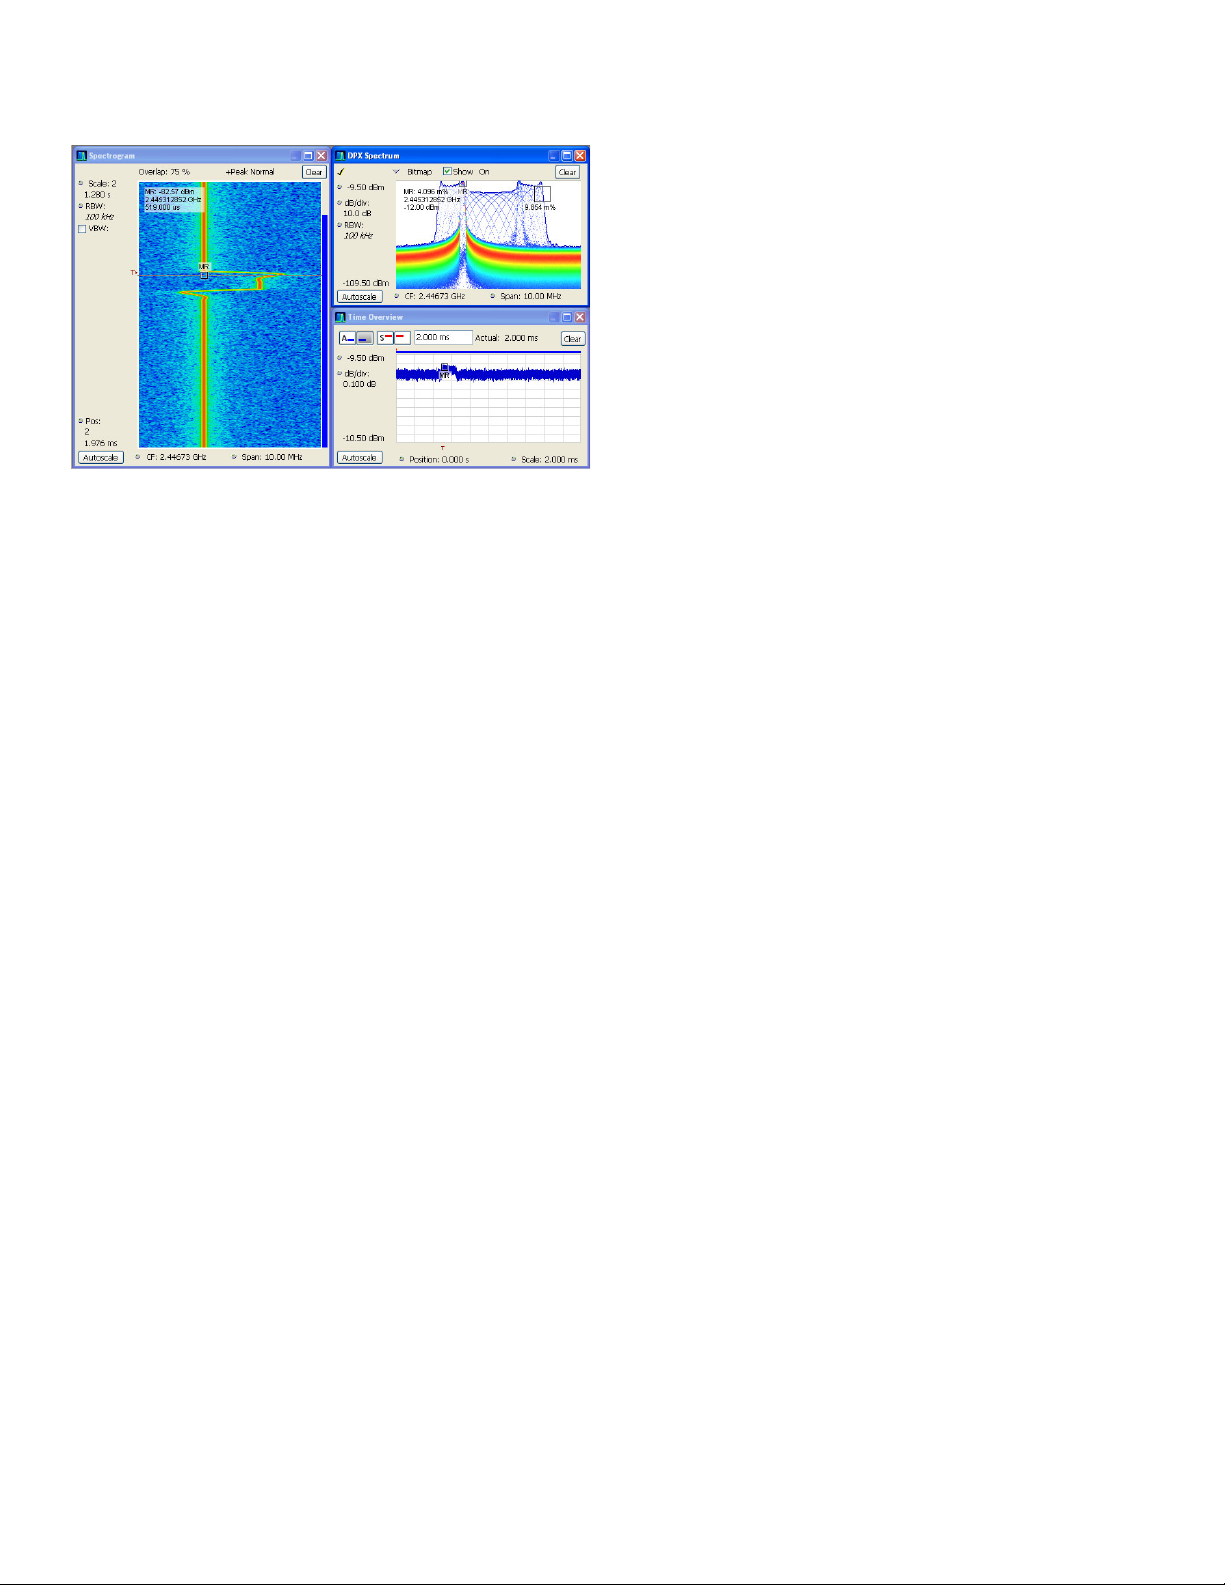
Time-correlated views in multiple domains provide a new level of insight into design
problems not possible with conventional analyzers. Here, ACLR and modulation quality
are performed simultaneously in a single acquisition, combined with the continuous
monitoring of the DPX
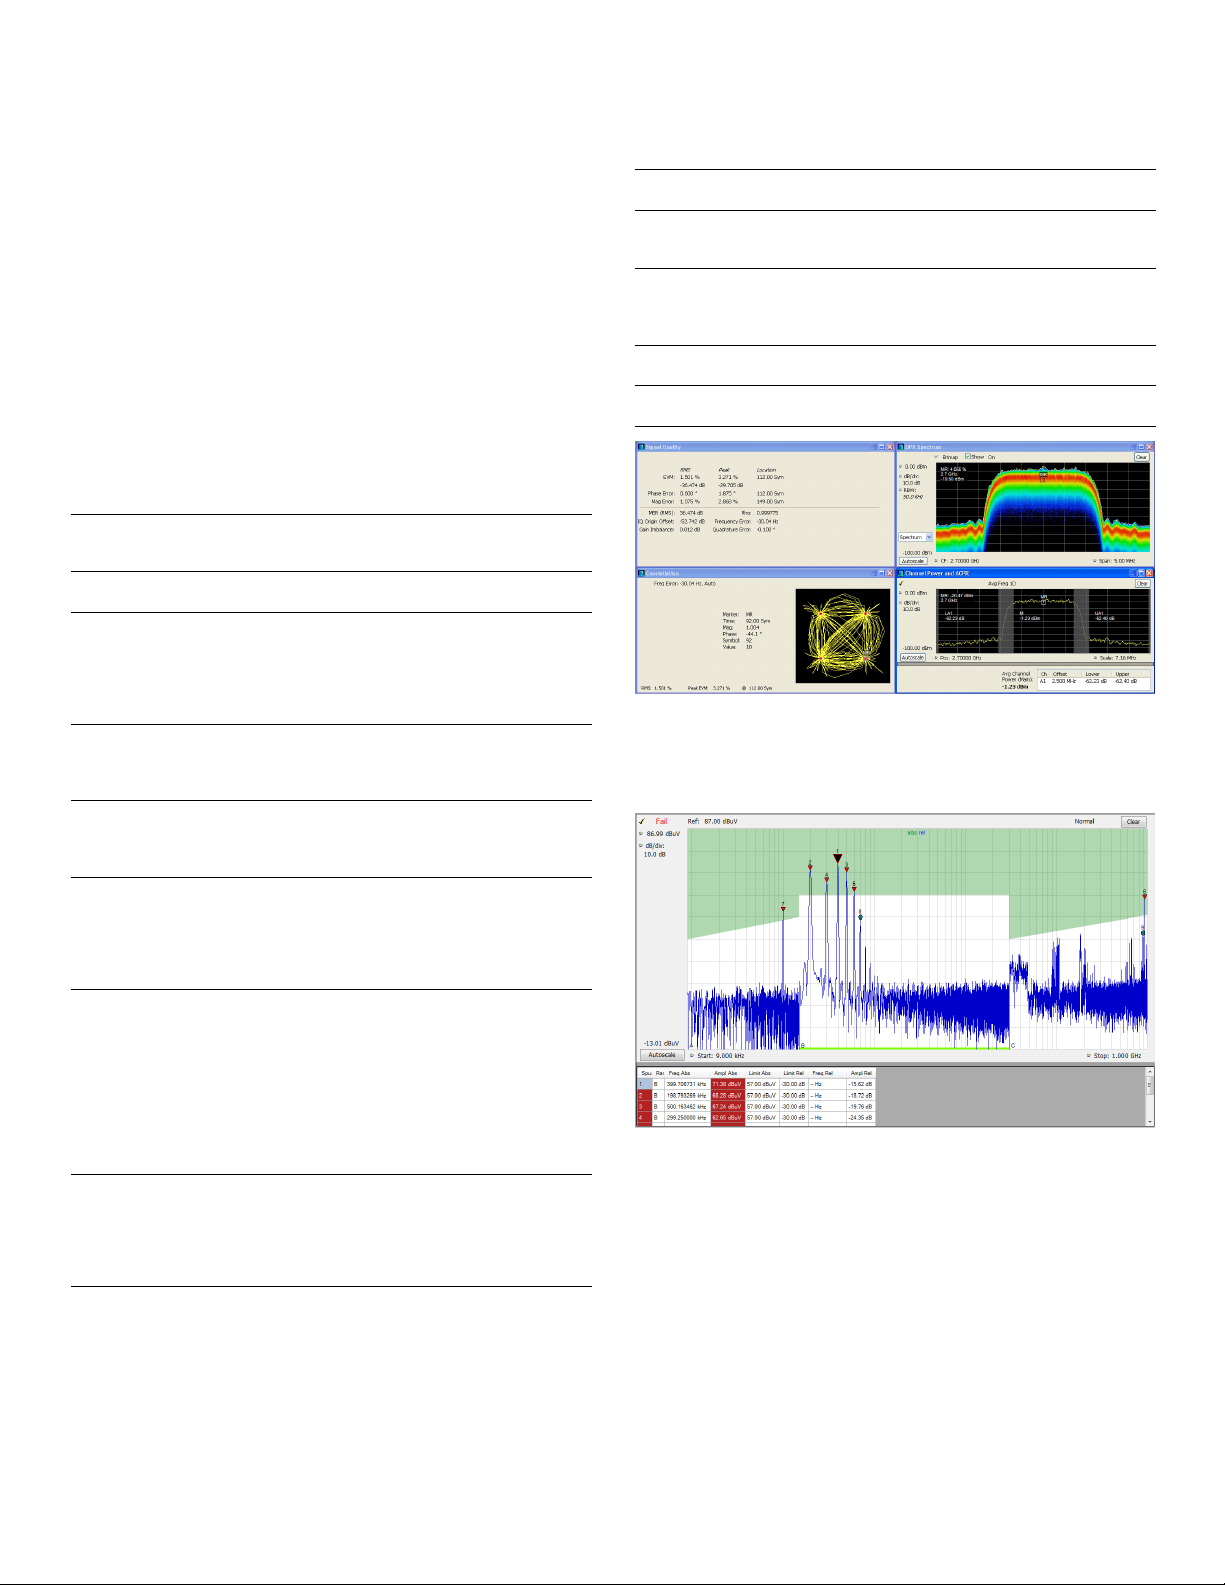
Spurious Search – Up to 20 noncontiguous frequency regions can be defined, each with
their own resolution bandwidth, video bandwidth, detector (peak, average, quasi-peak),
and limit ranges. Test results can be exported in CSV format to external programs, with up
to 999 violations reported. Spectrum results are available in linear or log scale.
OFDM Analysis for WLAN 802.11a/j/g and WiMax
802.16-2004
Measures % signal density at any location on the
DPX spectrum display and triggers on specified signal
density
1x, CDMA2000 1xEV-DO, RFID, Phase Noise, Jitter,
IEEE 802.11 a/b/g/n WLAN, IEEE 802.15.4 OQPSK
(Zigbee), Audio Analysis
WiMAX 802.16-2004 and 802.16e standards support
3GPP Release 8 LTE standards support
®
spectrum display.
4 www.tektronix.com/rsa
Page 5
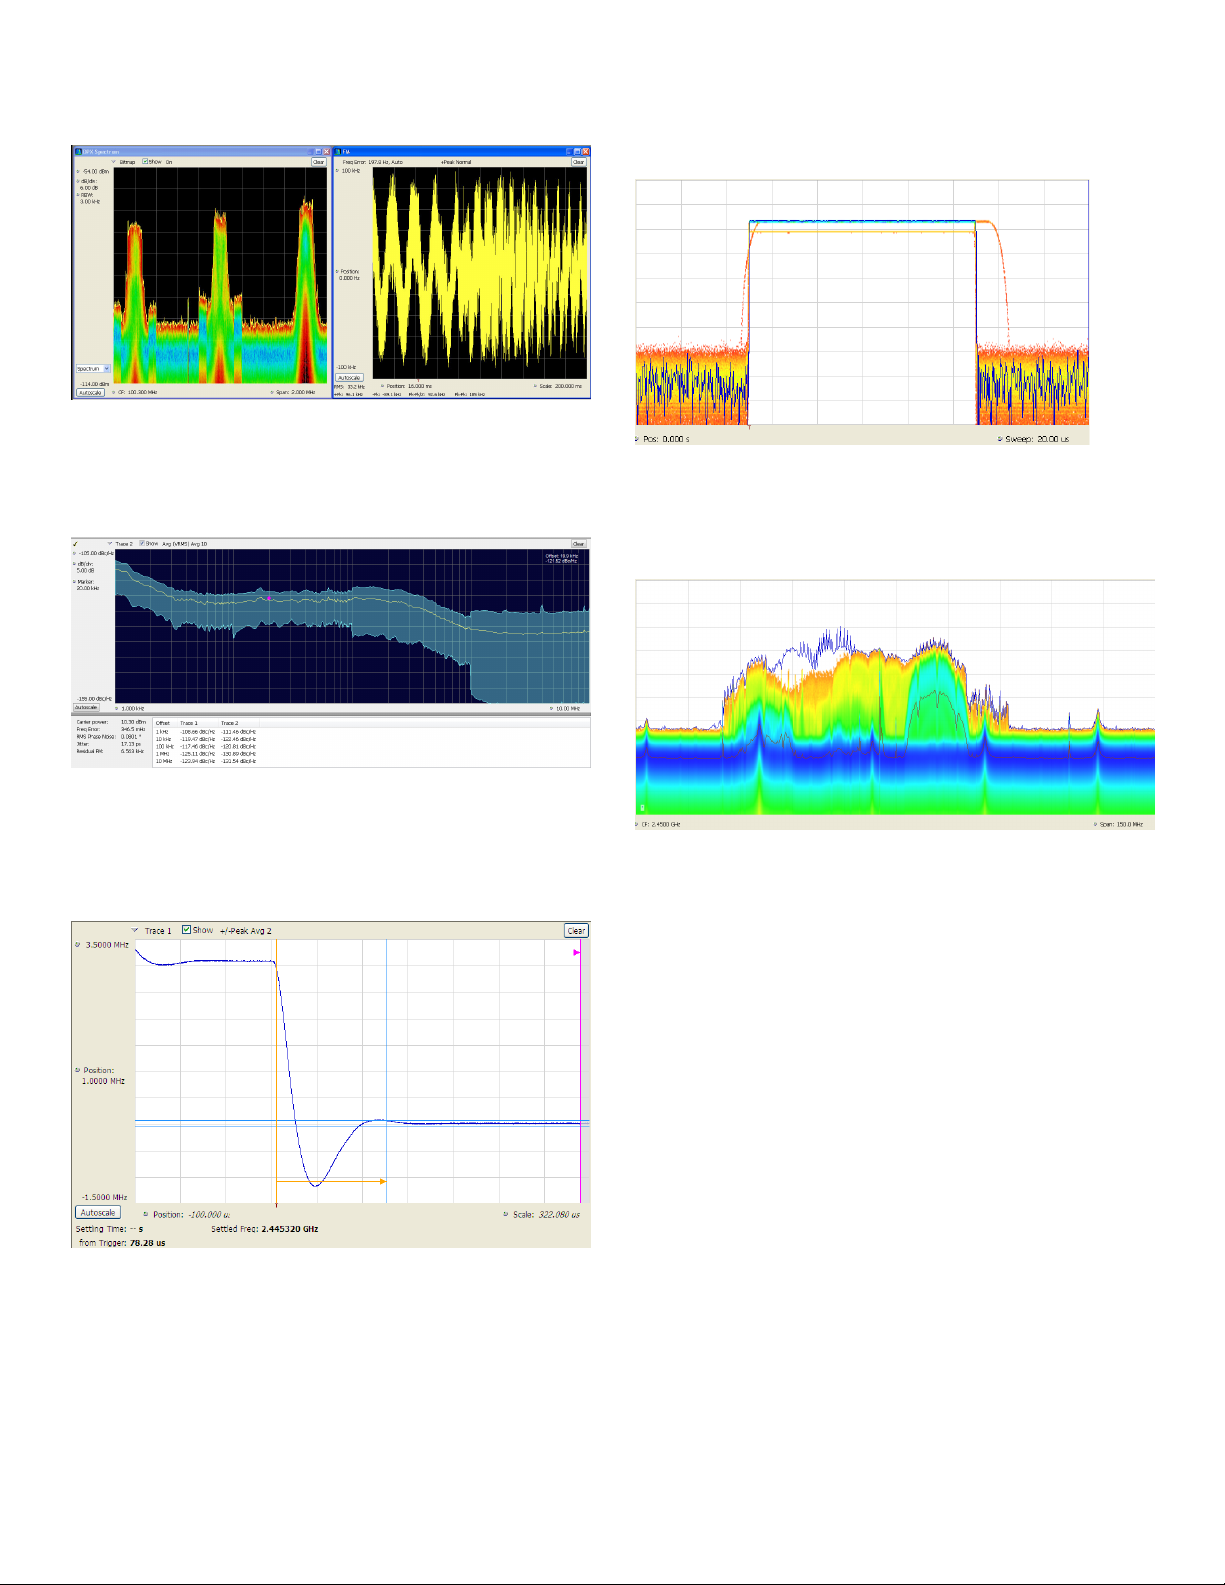
Audio monitoring and modulation measurements simultaneously can make spectrum
management an easier, faster task. Here, the DPX spectrum display shows a live
spectrum of the signal of interest and simultaneously provides demodulated audio to the
internal instrument loudspeaker. FM deviation measurements are seen in the right side of
the display for t he same signal.
Spectrum Analyzers — RSA5000 Series
DPX Zero-span produces real time analysis in amplitude, frequency or phase vs. time.
Up to 50,000 waveforms per second are processed. DPX Zero-span ensures that all
time-domain anomalies are immediately found, reducing time-to-fault. Here, three distinct
pulse shapes are captured in zero-span amplitude vs. time. Two of the three waveforms
occur only once in 10,000 pulses, but all are displayed with DPX.
Phase noise and jitter measurements (Opt. 11) on the RSA5000 series may reduce
the cost of your measurements by reducing the need for a dedicated phase noise
tester. Outstanding phase noise across the operating range provides margin for many
applications. Here, phase noise on a 13 MHz carrier is measured at -119 dBc/Hz at 10 kHz
offset. The instrument phase noise of <–134 dBc/Hz at this frequency provides ample
measurement margin for the task.
Settling time measurements (Opt. 12) are easy and automated. The user can select
measurement bandwidth, tolerance bands, reference frequency (auto or manual), and
establish up to 3 tolerance bands vs. time for Pass/Fail testing. Settling time may be
referenced to external or internal trigger, and from the last settled frequency or phase. In
the illustration, frequency settling time for a hopped oscillator is measured from an external
trigger point from the device under test.
Advanced Triggers, Swept DPX, and Zero Span (Opt. 200) provides superior swept
spectrum analysis for transient signals. Here, a 150 MHz swath of spectrum is swept
across the ISM band. Multiple WLAN signals are seen, and narrow signals seen in the
blue peak-hold trace are Bluetooth access probes. Multiple interfering signals are seen
below the analyzers noise level in the multi-color DPX display.
www.tektronix.com/rsa 5
Page 6

Data Sheet
Characteristics
Frequency Rel
Characteristic
Frequency Range
Initial Center Frequency
Setting Accuracy
Center Frequency Setting
Resolution
Frequency Marker
Readout Accuracy
RE
MF
Span Accuracy ±0.3% of Span (Auto mode)
Reference Frequency
Initial accuracy at cal
Aging per day
Aging per 10 years
Temperature drift 2 × 10⁻⁸(5 to 40 °C)
Cumulative error
(temperature + aging)
Reference Output Level >0 dBm (internal or external reference selected),
External Reference Input
Frequency
External Reference Input
Frequency Requirements
Spurious < –80 dBc within 100 kHz offset
Input level range –10 dBm to +6 dBm
Trigger Related
Characteristic
rigger Modes
T
Trigger Event Source RF Input, Trigger 1 (Front Panel), Trigger 2 (Rear
Trigger Types
Trigger Setting Trigger position settable from 1 to 99% of total
Trigger Combinational
Logic
Trigger Actions
ated
Description
1Hzto3.0GHz(RSA5103A)
1Hzto6.2GHz(RSA5106A)
Within 10–7after 10 minute warm-up
0.1 Hz
±(RE × MF +
0.001 × Span + 2) Hz
Reference Frequency Error
Marker Frequency (Hz)
–7
(after 10 min. warm-up)
1×10
–9
(after 30 days of operation)
1×10
–7
(after 10 years of operation)
3×10
4×10⁻⁷(within 10 years after calibration, typical)
+4 dBm, typical
10 MHz ± 30 Hz
Spurious level on input must be <–80 dBc within
100 kHz offset to avoid on-screen spurs
escription
D
ree Run, Triggered, FastFrame
F
Panel), Gated, Line
Power (Std), Frequency Mask (Opt. 52), Frequency
Edge, DPX Density, Runt, Time-Qualified (Opt. 200)
acquisition length
Trig1ANDTrig2/Gatemaybedefined as a trigger
event
Save acquisition and/or save picture on Trigger
Power Level Trigger
Characteristic
Level Range
Description
0dBto–100dBfromreferencelevel
Accuracy
±0.5 dB (level ≥ –50 dB from reference level)(for trigger levels
>30 dB above noise
floor, 10% to 90% of
±1.5 dB (from < –50 d B to –70 dB from reference level)
signal level)
Trigger Bandwidth Range
(at maximum
acquisition BW)
4 kHz to 10 MHz + wide open (standard)
4 kHz to 20 MHz + wide open (Opt. 40)
11kHzto40MHz+wideopen(Opt.85)
Trigger Position Timing Uncertainty
25 MHz Acquisition
Uncertainty = ±15 ns
BW, 10 MHz BW (Std.)
40 MHz Acquisition
Uncertainty = ±10 ns
BW, 20 MHz BW (Opt.
40)
85 MHz Acquisition
Uncertainty = ±5 ns
BW, 40 MHz BW
(Opt. 85)
Trigger Re-Arm Time, Minimum (Fast Frame ‘On’)
10 MHz Acquisition BW ≤25 μs
40 MHz Acquisition BW
≤10 μs
(Opt. 40)
85 MHz
(Opt.
Acquisition BW
85)
≤5 μs
Minimum Event Duration (Filter = Off)
25 MHz Acquisition BW
40 ns
(Std.)
40 MHz Acquisition BW
25 ns
(Opt. 40)
85 MHz Acquisition
12 ns
BW(Opt. 85)
External Trigger 1
Level Range –2.5 V to +2.5 V
Level Setting Resolution
0.01 V
Trigger Position Timing Uncertainty (50 Ω input impedance)
25 MHz Acquisition
Uncertainty = ±20 ns
BW, 25 MHz Span
(Std.)
40 MHz Acquisition
Uncertainty = ±15 ns
BW, 40 MHz Span
(Opt. 40)
85 MHz Acquisition
Uncertainty = ±12 ns
BW, 85 MHz Span
(Opt. 85)
Input Impedance
External Trigger 2
Selectable 50 Ω/5 kΩ impedance (nominal)
Threshold Voltage Fixed, TTL
Input Impedance
Trigger State Select
Trigger Output
10 kΩ (nominal)
High, Low
Voltage (Output Current <1 mA)
High: >2.0 V
Low: <0.4 V
Advanced trigger specifications are found in sections on Opt 52 (Frequency Mask
Trigger) and Opt. 200 (DPX, Time Qualified, Runt, and Frequency Edge triggers)
6 www.tektronix.com/rsa
Page 7

Spectrum Analyzers — RSA5000 Series
Acquisition Related
Characteristic
Real-time Acquisition
Bandwidth
Description
25 MHz (Std.)
40 MHz (Opt. 40)
85 MHz (Opt. 85)
A/D Converter 100 MS/s 14 bit (optional 300 MS/s, 14 bit, Opts. 40/85)
Acquisition Memory Size 1 GB (4 GB, Opt. 53)
Minimum Acquisition
64 Samples
Length
Acquisition Length Setting
1Sample
Resolution
Fast Frame Acquisition
Mode
>64,000 records can be stored in a single acquisition
(for pulse measurements and spectrogram analysis)
Memory Depth (Time) and Minimum Time Domain Resolution
Acquisition
BW
85 MHz (Opt.
Sample Rate
(For I and Q)
150 MS/s
Record
Length
Record
Length
(Opt. 53)
Time
Resolution
1.79 s 7.15 s 6.6667 ns
85)
40 MHz (Opt.
75 MS/s
3.57 s 14.3 s 13.33 ns
40)
25 MHz
20 MHz
10 MHz
5MHz
1
2MHz*
1MHz
500 kHz
200 kHz
100 kHz
50 kHz
20 kHz
10 kHz
5kHz
2kHz
1kHz
500 Hz
200 Hz
100 Hz
*1In spans ≤2 MHz, higher resolution data is stored.
50 MS/s
25 MS/s
12.5 MS/s
6.25 MS/s
3.125 MS/s
1.56 MS/s
781 kS/s
390 kS/s
195 kS/s
97.6 kS/s
48.8 kS/s
24.4 kS/s
12.2 kS/s
3.05 kS/s
1.52 kS/s
762 S/s
381 S/s
190 S/s
5.28 s 21.1 s 20 ns
10.5 s 42.2 s 40 ns
21.1 s 84.5 s 80 ns
42.2 s 169.1 s 160 ns
42.9 s 171.7 s 320 ns
85.8 s 343.5 s 640 ns
171.7 s 687.1 s 1.28 μs
343.5 s 1347 s 2.56 μs
687.1 s 2748 s 5.12 μs
1374 s 55497 s 10.24 μs
2748 s 10955 s 20.48 μs
5497 s 21990 s 40.96 μs
10955 s 43980 s 81.92 μs
43980 s 175921 s 328 μs
87960 s 351843 s 655 μs
175921 s 703687 s 1.31 ms
351843 s 1407374 s 2.62 ms
703686 s 2814749 s 5.24 ms
Analysis Related
Available Displays Views
Frequency
Spectrum (Amplitude vs Linear or Log Frequency)
®
DPX
Spectrum Display (Live RF Color-graded
Spectrum)
Spectrogram (Amplitude vs. Frequency over Time)
Spurious (Amplitude vs Linear or Log Frequency)
Phase Noise (Phase Noise and Jitter Measurement)
(Opt. 11)
Time and Statistics
Amplitude vs. Time
Frequency vs. Time
Phase vs. Time
DPX Amplitude vs. Time (Opt. 200)
DPX Frequency vs. Time (Opt. 200)
DPX Phase vs. Time (Opt. 200)
Amplitude Modulation vs. Time
Frequency Modulation vs. Time
Phase Modulation vs. Time
RF IQ vs. Time
Time Overview
CCDF
Peak-to-Average Ratio
Settling Time, Frequency,
Frequency Settling vs. Time, Phase Settling vs. Time
and Phase (Opt. 12)
Advanced Measurements
Suite (Opt. 20)
Pulse Results Table
Pulse Trace (selectable by pulse number)
Pulse Statistics (Trend of Pulse Results, FFT of Trend,
and Histogram)
Digital Demod (Opt. 21) Constellation Diagram
EVM vs. Time
Symbol Table (Binary or Hexadecimal)
Magnitude and Phase Error versus Time, and Signal
Quality
Demodulated IQ vs. Time
Eye Diagram
Trellis Diagram
Frequency Deviation vs. Time
Flexible OFDM Analysis
(Opt. 22)
Constellation, Scalar Measurement summary,
EVM or Power vs. Carrier
Symbol Table (Binary or Hexadecimal)
Frequency Offset
Measurement
Signal analysis can be performed either at center
frequency or the assigned measurement frequency
up to the limits of the instrument's acquisition and
measurement bandwidths
www.tektronix.com/rsa 7
Page 8

Data Sheet
RF Spectrum and Analysis Performance
Bandwidth Related
Characteristic
Resolution Bandwidth
Resolution Bandwidth
Range
(Spectrum Analysis)
Resolution Bandwidth
Shape
Resolution Bandwidth
Accuracy
Alternative Resolution
Bandwidth Types
Video Bandwidth
Video Bandwidth Range 1 Hz to 5 MHz plus wide open
RBW/VBW Maximum
RBW/VBW Minimum
Resolution
Accuracy (Typical,
Detector: Average)
Time Domain Bandwidth ( Amp litude vs. Time Display)
Time Domain Bandwidth
Range
Time Domain BW Shape
Time Domain Bandwidth
Accuracy
Description
0.1 Hz to 5 MHz (10 MHz, Opt 85) (1, 2, 3, 5 sequence,
Auto-coupled), or user selected (arbitrary)
Approximat
±10%, typic
ely Gaussian, shape factor 4.1:1 (60:3 dB)
al
±1% (Auto-coupled RBW mode)
Kaiser window (RBW), –6 dB Mil, CISPR,
Blackman-Harris 4B Window, Uniform (none) Window,
Flat-top (CW Ampl.) Window, Hanning Window
10,000:1
1:1 plus wide open
5% of entered value
±10%
At least 1/10 to 1/10,000 of acquisition bandwidth, 1 Hz
minimum
≤10 MHz, approximately Gaussian, shape factor 4.1:1
(60:3 dB), ±10% typical
20 MHz (60 MHz, Opt. 85), shape factor <2.5:1
(60:3 dB) typical
1Hzto20MHz,and(>20MHzto60MHzOpt. 85),
±10%
DPX®Digital Phosphor Spectrum Processing
Characteristic
Spectrum Processing
DPX
(Standard)
48,828/s 292,969/s
Advanced DPX
(Opt. 200)
Rate (RBW = Auto, Trace
Length 801)
DPX Bitmap Re
DPX Bitmap Color
solution
201 × 501 201 × 801
64k (48 dB) 8G (99 dB)
Dynamic Range
Marker Information Amplitude, frequency,
and hit count on the
DPX display
Minimum Signal Duration
for 100% Probability of
31 μs (Std. or Opt. 40)
24 μs(Opt. 85)
Amplitude, frequency,
and signal density on
the DPX display
5.8 μs(Std.,orOpts.
40/85, RBW = 1 MHz)
Detection (Max-hold On)
Span Range
(Continuous processing)
ange (Swept)
Span R
100Hzto25MHz
(40 MHz with Opt. 40)
(85 MHz with Opt. 85)
Not Available Up to instrument
100Hzto25MHz
(40 MHz with Opt. 40)
(85 MHz with Opt. 85)
frequency range
Dwell Time per Step
Trace Processing
Not Available 50 ms to 100 s
Color-graded bitmap,
+Peak, –Peak, Average
Color-graded bitmap,
+Peak, –Peak, Average
Trace Length 501 801, 2401, 4001, 10401
Resolution BW Accuracy
For complete Advanced DPX specifications, see the Opt. 200 section of this data sheet.
Minimum RBW, Swept Spans (Opt. 200) – 10 kHz.
7% ±1%
Stability
Residual FM – <2 Hz
in 1 second (95% confidence, typical).
p-p
Minimum Settable Spectrum Analysis RBW vs. Span
Frequency Span
RBW
>10 MHz 100 Hz
>1.25 MHz to 10 MHz 10 Hz
≤1MHz 1Hz
≤100 kHz 0.1 Hz
Spectrum Display Traces, Detector, and Functions
Characteristic
Traces
Description
Threetraces+1mathwaveform+1tracefrom
spectrogram for spectrum display
Detector
Trace Functions
Peak, –Peak, Average (V
(Ave, Peak, Quasi-peak Average (of Logs))
Normal,Average,MaxHold,MinHold,Average(of
), ±Peak, Sample, CISPR
RMS
Logs)
Spectrum Trace Length
Sweep Speed (Typical.
RBW = Auto, RF/IF
Optimization: minimize
801, 2401, 4001, 8001, or 10401 points
1500 MHz/sec (Std.)
2500 MHz/sec (Opt. 40)
6000 MHz/sec (Opt. 85)
sweep time)
Phase Noise Sidebands, dBc/Hz at Spe cified Center
Frequency (CF)
Offset
CF=
10 MHz
Typical
CF = 1 GHz CF =
Spec
Typical Typical Typical
2GHz
CF =
6GHz
1 kHz –128 –103 –107 –107 –104
10 kHz –134 –109 –113 –112 –109
100 kHz –134 –112 –116 –115 –114
1 MHz –135 –130 –139 –137 –135
6 MHz –140 –134 –144 –142 –141
10 MHz NA –135 –144 –142 –141
Integrated phase (100 Hz to 100 MHz, typical)
Measurement Frequency Integrated Phase, radians
100 MHz 2.51 x 10
1GHz
2GHz
5GHz
3.14 x 10
3.77 x 10
6.28 x 10
–3
–3
–3
–3
8 www.tektronix.com/rsa
Page 9

Spectrum Analyzers — RSA5000 Series
Typical phase noise performance as measured by Opt. 11.
Amplitude
(Specifications excluding mismatch error)
Characteristic
Measureme
nt Range
Descripti
Displayed
on
average noise level to maximum measurable
input
Input Attenuator Range 0 dB to 55 dB, 5 dB step
Maximum Safe Input Level
Average Continuous
+30 dBm
(RF ATT ≥10 dB,
Preamp Off)
Average Continuous
+20 dBm
(RF ATT ≥10 dB,
Preamp On)
Pulsed RF (RF ATT
50 W
≥30 dB, PW <10 μs,
1% Duty Cycle)
Maximum Measurable Input Level
Average Continuous
+30 dBm
(RF ATT: Auto)
Pulsed RF (RF ATT:
50 W
Auto, PW <10 μs, 1%
Duty Cycle)
Max DC Voltage
Log Display Range
±5 V
0.01 dBm/div to 20 dB/div
Display Divisions 10 divisions
Display Units dBm, dBmV, Watts, Volts, Amps, dBuW, dBuV, dBuA,
dBW, dBV, dBV/m, and dBA/m
Marker Readout
0.01 dB
Resolution, dB Units
Marker Readout
Reference-level dependent, as small as 0.001 μV
Resolution, Volts Units
Reference Level Setting
Range
Level Linearity
0.1 dB step, –170 dBm to +50 dBm (minimum ref. level
–50 dBm at center frequency <80 MHz)
±0.1 dB (0 to –70 dB from reference level)
Frequency Res
Range Response
18 °C to 28 °C, A
10 MHz - 32 MHz (LF
ponse
tten. = 10 dB, Preamp Off
±0.7 dB
Band)
10 MHz - 3 GHz
>3 GHz - 6.2 GHz
±0.5 dB
±1.0 dB
(RSA5106A)
5 °C to 40 °C , All Atten uator Settings (Typical, Preamp Off)
1Hz-32MHz(LF
±0.8 dB
Band)
9kHz-3GHz
>3 GHz - 6.2 GHz
±0.5 dB
±1.0 dB
(RSA5106A)
Preamp (Opt. 50) On (Atten. = 10 dB)
B
10 MHz - 32 MHz (LF
±1.0 d
Band)
10 MHz - 3.0 GHz
>3 GHz - 6.2 GHz
±0.7 dB
±1.3 dB
(RSA5106A)
Amplitude Accuracy
Characteristic
Absolute Amplitude
Description
±0.31 dB
Accuracy at Calibration
Point (100 MHz, –20 dBm
signal, 10 dB ATT, 18 °C
to 28 °C)
Input Attenuator Switching
±0.3 dB
Uncertainty
Absolute Amplitude Accuracy at Center Frequency, 95% Confidence*
10 MHz to 3 GHz
3GHzto
±0.5 dB
±0.8 dB
2
6.2 GHz(RSA5106A)
VSWR
(Atten. = 10 dB, Preamp Off, CF set within 200 MHz of VSWR Test Frequency)
10 kHz to 30 MHz
10 MHz to 3 GHz
>3 GHz to 6.2 GHz
<1.6:1 (Typical)
<1.4:1
<1.6:1
(RSA5106A)
VSWR with Preamp
(Atten. = 10 dB, Preamp On, CF set within 200 MHz of VSWR Test Frequency
10 MHz to 3/6.2 GHz
*218 °C to 28 °C, Ref Level ≤ –15 dBm, Attenuator Auto-coupled, Signal Level –15 dBm to –50 dBm. 10 Hz ≤
RBW ≤ 1 MHz, after alignment performed.
<1.6:1
www.tektronix.com/rsa 9
Page 10

Data Sheet
Noise and Distortion
3rdOrder Intermodulation Distortion: –84 dBc at 2.13 GHz
(Specified)*
Frequency Range
10kHz-32MHz(LF
Band)
9kHz-80MHz –72 +11
>80 MHz - 300 MHz –76 +13
>300 MHz - 3 GHz
>3 GHz - 6.2 GHz
*3Each Signal Level –25 dBm, Ref Level –20 dBm, Attenuator = 0 dB, 1 MHz tone separation.
rd
Note:3
2ndHarmonic Distortion*
Frequency 2ndHarmonic Distortion, Typical
10 MHz -1 GHz
>1 GHz – 3.1 GHz
*4–40 dBm at RF input, Attenuator = 0, Preamp Off, typical.
Displayed Average Noise Level*5,PreampOff
Frequency Range
LF Band
1Hz-100Hz
>100 Hz - 2 kHz
>2 kHz - 10 kHz
>10kHz-32MHz
RF Band
9kHz-1MHz
>1 MHz - 10 MHz
>10MHz-2GHz –154dBm/Hz –157dBm/Hz
>2 GHz - 3 GHz –153 dBm/Hz –156 dBm/Hz
>3 GHz - 4 GHz (R5106A) –151 dBm/Hz –154 dBm/Hz
>4 GHz - 6.2 GHz
(R5106A)
*5Measured using 1 kHz RBW, 100 kHz span, 100 averages, Minimum Noise mode, input terminated,
log-average detector and trace function.
Preamplifier Performance (Opt. 50)
Characteristic
Frequency Range
NoiseFigureat2GHz
Gain at 2 GHz 18 dB (nominal)
Displayed Average Noise Level*5,PreampOn(Opt.50)
Frequency Range
LF Band
1MHz-32MHz
RF Band
1MHz-10MHz
>10 MHz - 2
>2 GHz - 3 G
>3 GHz - 6.
(RSA5106
*5Measured using 1 kHz RBW, 100 kHz span, 100 averages, Minimum Noise mode, input terminated,
log-average trace detector and function.
3
rd
3
Order
Intermodulation
Distortion, dBc
(Typical)
rd
Order Intercept,
3
dBm (Typical)
–75
–84 +17
–84 +17
order intercept point is calculated from 3rdorder intermodulation performance.
4
<–80dBc
<–83dBc
Specification
–129 dBm/Hz
–124 dBm/Hz –130 dBm/Hz
–141 dBm/Hz –144 dBm/Hz
–150 dBm/Hz –153 dBm/Hz
–108 dBm/Hz –111 dBm/Hz
–136 dBm/Hz –139 dBm/Hz
–149 dBm/Hz –152 dBm/Hz
Description
1 MHz to 3.0 GHz or 6.2 GHz (RSA5106A)
7dB
Specification
Hz
Hz
Hz
Hz
z
–160 dBm/H
–160 dBm/
–167 dBm/
–165 dBm/
–164 dBm/
GHz
Hz
2GHz
–158 dBm/H
–158 dBm/
–164 dBm/
–163 dBm/
–161 dBm/
A)
+12.5
Typ ical
Typ ical
z
Hz
Hz
Hz
Hz
Residual Response*
Frequency Range
500kHz-32MHz,LF
6
Specified
Typical
<–100 dBm
Band
500kHz-80MHz,RF
<–75 dBm
Band
80 MHz - 200 MHz <–95 dBm
200 MHz - 3 GHz
3GHz–6.2GHz
–95 dBm
–95 dBm
(RSA5106A)
*6Input terminated, RBW = 1 kHz, Attenuator = 0 dB, Reference Level –30 dBm.
Image Response*
Frequency
7
Spec
100 Hz – 30 MHz < –75 dBc
30MHz–3GHz
>3 GHz to 6.2 GHz
<–75dBc
<–65dBc
(RSA5106A)
*7Ref = –30 dBm, Attenuator = 10 dB, RF Input Level = –30 dBm, RBW = 10 Hz.
Spurious Response with Signal, Offset ≥400 kHz*
Span ≤25 MHz,
Frequency
1MHz–
Swept Spans >25 MHz
Specification
Typical
–71 dBc –75 dBc NA NA
25 MHz < Sp an ≤ 85 MHz
Specification
8
Opt. 40/85
Typical
32 MHz (LF
Band)
30 MHz –
–73dBc –78dBc –73dBc –75dBc
3GHz
>3 GHz -
–73dBc –78dBc –73dBc –75dBc
6.2 GHz
(RSA5106A)
*8RF Input Level = –15 dBm, Attenuator = 10 dB, Mode: Auto. Input signal at center frequency. Center
Frequency >90 MHz, Opts. 40/85.
Spurious response with signal (10 kHz ≤ offset < 400 kHz),
Typical
For Opts. 40/85,
25 MHz < Span ≤
85 MHz
Frequency
1MHz–32MHz(LF
Span ≤ 25 MHz, Swept
Spans >25 MHz
–71 dBc NA
Band)
30 MHz – 3 GHz
3GHz–6.2GHz
–73 dBc –73 dBc
–73 dBc –73 dBc
(RSA5106A)
Spurious response with signal at 3.5125 GHz <80 dBc (RF input level, –30 dBm)
Local Oscillator Feed-through to Input Connector <–60 dBm
(typical, attenuator = 10 dB)
Adjacent Channel Leakage Ratio Dynamic Range*
Signal Type,
Measurement Mode
Adjacent Alternate
ACLR, Typical
9
3GPP Downlink, 1 DPCH
Uncorrected –70 dB –70 dB
Noise Corrected
*9Measured with test signal amplitude adjusted for optimum performance. (CF = 2.13 GHz)
–79 dB –79 dB
10 www.tektronix.com/rsa
Page 11

Spectrum Analyzers — RSA5000 Series
IF Frequency Response and Phase Linearity*
Frequency
Range (GHz)
0.001 - 0.032
Acquisition
Bandwidth
≤20 MHz ±0.50 dB 0.4 dB
Amplitude
Flatness
(Spec)
10
Amplitude
Flatness
(Typ, RMS)
Phase
Flatness
(Typ, RM S)
1.0°
(LF Band)
11
0.01 - 6.2*
0.03 - 6.2 ≤25 MHz ±0.30 dB 0.20 dB
Option 40
0.03 – 6.2 ≤40 MHz ±0.30 dB 0.20 dB
Option 85
0.07 - 3.0 ≤85 MHz ±0.50 dB 0.30 dB
>3 - 6.2 ≤85 MHz ±0.50 dB 0.40 dB
*10Amplitude flatness and phase deviation over the acquisition BW, includes RF frequency response.
Attenuator Setting: 10 dB.
11
High Dynamic Range mode selected.
*
≤300 kHz ±0.10 dB 0.05 dB
0.1°
0.5°
0.5°
1.5°
1.5°
Frequency Mask Trigger (Opt. 52)
Characteristic
Mask Sha
pe
Mask Point Horizontal
Description
ned
User Defi
span
<0.2% of
Resolution
Level Range
Level Accuracy*
0 to –50 dB from
12
0 dB to –80 dB from reference level
±(Channel Response Flatness + 1.0 dB)
reference level
–50dBto–70dBfrom
±(Channel Response Flatness + 2.5 dB)
reference level
Span Range
100Hzto25MHz
100Hzto40MHz(Opt. 40)
100Hzto85MHz(Opt. 85)
Trigger Position
Uncertainty
Span = 25 MHz:
±15 μs
±9 μs (Opt. 200, RBW = Auto)
Span = 40 MHz (Opt. 40):
±12.8 μs
±7 μs (Opt. 200, RBW = Auto)
Span = 85 MHz (Opt. 85):
±5.12 μs
±5 μs (Opt. 200, RBW = Auto)
*12For masks >30 dB above noise floor, Center Frequency ≥50 MHz.
Opt. 200: Advanced Triggers, Swept DPX, and DPX Zero Span
Minimum Signal
Duration, 100 %
Probability of
Intercept
(µs)
Span
85 MHz
RBW
(kHz)
FFT
Length
Spectrums/sec
1000 1024 292,969 5.8
300 2048 146,484 11.4
100 4096 73,242 37.6
30 16384 18,311 134.6
20 16384 18,311 174.6
40 MHz
1000 1024 292,969 5.8
300 1024 292,969 11.4
100 2048 146,484 30.8
30 4096 73,242 93.6
20 8192 36,621 147.3
10 16384 18,311 294.5
25 MHz
300 1024 292,969 11.4
100 1024 292,969 27.5
30 4096 73,242 93.8
20 4096 73,242 133.9
10 8192 36,621 267.8
Minimum RBW, Swept Spans (Opt. 200) – 10 kHz.
Minimum
(Indepe
FFT Length vs. Trace Length
ndentofSpanandRBW),Opt. 200
Trace Length (Points)
Minimum FFT Length
801 1024
2401 4096
4001 8192
10401 16384
www.tektronix.com/rsa 11
Page 12

Data Sheet
Resolution BW Range vs. Acquisition Bandwidth (DPX®)
Acquisition
Bandwidth
85 MHz (Opt. 85)
55 MHz (Opt. 85)
40 MHz (Opt.
Standard Opt. 200
RBW (Min) RBW (Min) RBW (Max)
640 kHz 20 kHz 10 MHz
320 kHz 10 kHz 5 MHz
320 kHz 10 kHz 5 MHz
40/85)
25 MHz 214 kHz 10 kHz 3 MHz
20 MHz 107 kHz 5 kHz 2 MHz
10 MHz 53.3 kHz 2 kHz 1 MHz
5 MHz 26.7 kHz 1 kHz 500 kHz
2 MHz 13.4 kHz 500 Hz 200 kHz
1 MHz 6.66 kHz 200 Hz 100 kHz
500 kHz 3.33 kHz 100 Hz 50 kHz
200 kHz 1.67 kHz 50 Hz 20 kHz
100 kHz 833 Hz 20 Hz 10 kHz
50 kHz 417 Hz 10 Hz 5 kHz
20 kHz 209 Hz 5 Hz 2 kHz
10 kHz 105 Hz 2 Hz 1 kHz
5 kHz 52 Hz 0.1 Hz 500 Hz
2 kHz 13.1 Hz 0.1 Hz 200 Hz
1 kHz 6.51 Hz 0.1 Hz 100 Hz
500 Hz 3.26 Hz 0.1 Hz 50 Hz
200 Hz 1.63 Hz 0.1 Hz 20 Hz
100 Hz 0.819 Hz 0.1 Hz 10 Hz
Zero-span Amplitude, Frequency, Phase Performance
(Nominal)
l Characteristics, Zero span Ampl itud e, Frequency, Phase
Genera
Measurement BW Range 100 Hz to maximum acquisition
bandwidth of instrument
Time Domain BW (TDBW) Range At least 1/10 to 1/10,000 of acquisition
bandwidth, 1 Hz minimum
Time Domain BW (TDBW) Accuracy ±1%
Sweep Time Range 100 ns (minimum)
1 sec (maximum, Measurement BW
>60MHz)
2000 sec (maximum, Measurement
BW ≤ 60 MHz)
Time Accuracy
±(0.5% + Reference Frequency
Accuracy)
Zerospan Trigger Timing Uncertainty
(power trigger)
±(Zerospan Sweep Time/800) at trigger
point
DPX Frequency Display Range ±100 MHz maximum
DPX Phase Display Range ±200 Degrees maximum
DPX Waveforms/sec 50,000 triggered waveforms/sec for
sweep time ≤20 μs
Opt. 200 – Advanced Triggers
Characteristic
DPX Density Trigger
Density Range
Horizontal Range
Description
0to100%density
0.25 Hz to 25 MHz (Std.)
0.25 Hz to 40 MHz (Opt. 40)
0.25 Hz to 85 MHz (Opt. 85)
Minimum Signal Duration
for 100% Probability of
Trigger (at maximum
acquisition bandwidth)
RBW = Auto, Trace
Length 801 Points
30.7 μs (Standard)
20.5 μs(Opt. 40)
11.4 μs (Opt. 40 and Opt. 200)
8.2 μs (Opt. 85 and Opt. 200)
5.8 μs (Opt. 85 and O pt. 200, RBW = 1 MHz)
Events lasting less than minim um event duration
specification will result in degraded Frequency Mask
Trigger accuracy
Frequency Edge Trigger
Range
Minimum Event Duration
±(½ × (ACQ BW or TDBW if TDBW is active))
12 ns (ACQ BW = 85 MHz, no TDBW, Opt. 85)
25 ns (ACQ BW = 40 MHz, no TDBW, Opt. 40)
40 ns (ACQ BW = 25 MHz, no TDBW, Standard)
Timing Uncertainty
Runt Trigger
Runt Definitions
Same as Power Trigger Position Timing Uncertainty
Positive, Negative
Accuracy
±0.5 dB (level ≥ –50 dB from reference level)(for trigger levels
>30 dB above noise
floor, 10% to 90% of
±1.5 dB (from < –50 d B to –70 dB from reference level)
signal level)
Time-qualified Triggering
Trigger Types and Source Time qualification may be applied to: Level, Frequency
Mask (Opt. 02), DPX Density, Runt, Frequency Edge,
Ext. 1, Ext. 2
1: 0 to 10 seconds
Time Qualification Range
T
T2: 0 to 10 seconds
Time Qualification
Definitions
Shorter than T1
Longer than T1
Longer than T1 AND shorter than T2
Shorter than T1 OR longer than T2
Holdoff Trigger
Range 0 to 10 seconds
Digital IQ Output (Opt. 55)
Characteristic
Description
Connector Type MDR (3M) 50 pin × 2
Data Output Data is corrected for amplitude and phase response
in real time
Data format I data: 16 bit LVDS
Q data: 16 bit LVDS
Control Output Clock: LVDS, Max 50 MHz (150 MHz, Opt. 110) DV
(Data Valid), MSW (Most Significant Word) indicators,
LVDS
Control Input IQ data output enabled, connecting GND enables
outputofIQdata
ClockRisingEdgetoData
8.4 ns (typical, standard), 1.58 ns (typical, Opt. 85)
Transition Time
(Hold time)
Data Transition to Clock
8.2 ns (typical, standard), 1.54 ns (typical, Opt. 85)
Rising Edge (Setup time)
12 www.tektronix.com/rsa
Page 13

Spectrum Analyzers — RSA5000 Series
Phase Noise and Jitter Measurement (Opt. 11)
Characteristic
Carrier Frequency Range
Measurements
Description
1 MHz to Maximum Instrument Frequency
Carrier Power, Frequency Error, RMS Phase Noise,
Jitter (Time Inte rval Error), Residual FM
Residual Phase Noise
Phase Noise and Jitter
Integration Bandwidth
SeePhaseNoisespecifications
Minimum Offset from Carrier: 10 Hz
Maximum Offset from Carrier: 1 GHz
Range
Number of Traces
Trace and Measurement
Functions
2
Detection: Average or ±Peak
Smoothing Averaging
Optimization: Speed or Dynamic Range
Settling
Settled Frequency Uncertainty, 95% Confidence (Typical), at Stated
Measurement Frequencies, Band wid ths, and # of Averages
Measurement
Frequency,
Averages
Time, Frequency, and Phase (Opt. 12)*
Frequency Un certain ty at Stated Measurement
Bandwidth
85 MH z 10 MHz 1 MHz 100 kHz
13
1GHz
Single
2 kHz 100 Hz 10 Hz 1 Hz
Measurement
100 Averages 200 Hz 10 Hz 1 Hz 0.1 Hz
1000 Averages 50 Hz 2 Hz 1 Hz 0.05 Hz
10 GHz
Single
5 kHz 100 Hz 10 Hz 5 Hz
Measurement
100 Averages 300 Hz 10 Hz 1 Hz 0.5 Hz
1000 Averages 100 Hz 5 Hz 0.5 Hz 0.1 Hz
20 GHz
Single
2 kHz 100 Hz 10 Hz 5 Hz
Measurement
100 Averages 200 Hz 10 Hz 1 Hz 0.5 Hz
1000 Averages 100 Hz 5 Hz 0.5 Hz 0.2 Hz
Settled Phase Uncertainty, 95% Confidence (Typical), at Stated
Measurement Frequencies, Band wid ths, and # of Averages
Measurement
Frequency,
Averages
Phase Uncertainty at Stated
Measurement Ban dwid th
85 MH z 10 MHz 1 MHz
1GHz
Single
1.00° 0.50° 0.50°
Measurement
100 Averages
1000 Averages
0.10° 0.05° 0.05°
0.05° 0.01° 0.01°
10 GHz
Single
1.50° 1.00° 0.50°
Measurement
100 Averages
1000 Averages
0.20° 0.10° 0.05°
0.10° 0.05° 0.02°
20 GHz
Single
1.00° 0.50° 0.50°
Measurement
100 Averages
1000 Averages
*13Measured input signal level > –20 dBm, Attenuator: Auto.
0.10° 0.05° 0.05°
0.05° 0.02° 0.02°
Advanced Meas ur ement Suite (Opt. 20)
Characteristic
Measurements
Description
Average On Power, Peak Power, Average Transmitted
Power, Pulse Width, Rise Time, Fall Time, Repetition
Interval (seconds), Repetition Interval (Hz), Duty Factor
(%), Duty Factor (ratio), Ripple (dB), Ripple (%), Droop
(dB), Droop (%), Overshoot (dB), Overshoot (%),
Pulse-Pulse Frequency Difference, Pulse-Pulse Phase
Difference, RMS Frequency Error, Max Frequency
Error, RMS Phase Error, Max Phase Error, Frequency
Deviation, Phase Deviation, Impulse Response (dB),
Impulse Response (time), Time Stamp
Minimum Pulse Width for
150 ns (standard, Opt. 40), 50 ns (Opt. 85)
Detection
Number of Pulses
System Rise Time
1to10,000
<40 ns (standard), <17 ns (Opt. 40), <12 ns (Opt. 85)
(Typical)
Pulse Measurement
Accuracy
Signal Conditions: Unless otherwise stated, Pulse
Width >450 ns (150 ns, Opt. 85), S/N Ratio ≥30 dB,
DutyCycle0.5to0.001,Temperature18°Cto28°C
Impulse Response
Measurement Range: 15 to 40 dB across the width of
the chirp
Measurement Accuracy (typical): ±2 dB for a signal
Impulse Response
40 dB in amplitude and delayed 1% to 40% of the pulse
chirp width*
Taylor Window
14
Weighting
*14ChirpWidth100MHz,PulseWidth10μs, minimum signal delay 1% of pulse width or 10/(chirp bandwidth),
whichever is greater, and minimum 2000 sample points during pulse on-time.
Pulse Measurement Performance
Pulse Amplitude and Timing
Measurement
rage On Power*
Ave
Average Transmitted
15
Power*
Peak Power*
15
Pulse Width
Duty Factor
*15Pulse Width >300 ns (100 ns, Opt. 85) SNR ≥30 dB.
Frequency and Phase Error Referenced to Nonchirped Signal
t stated frequencies and measurement bandwidths*
A
Bandwidth
20 MHz ±10 kHz ±30 kHz
60 MHz
(Opt. 85)
*16Pulse ON Power ≥ –20 dBm, signal peak at Reference Level, Attenuator = Auto, t
Frequency Estimation: Manual. Pulse-to-Pulse Measurement time position excludes the beginning and
ending of the pulse extending for a time = (10 / Measurement BW) as measured from 50% of the t
Absolute Frequency Error determined over center 50% of pulse.
Accuracy (Typical)
15
±0.3 dB + Absolute Amplitude Accuracy
±0.4 dB + Absolute Amplitude Accuracy
±0.4 dB + Absolute Amplitude Accuracy
±3% of reading
±3% of reading
CF: 2 GHz
Abs. Freq Err
(RMS)
Pulse-to-Pulse
±26 kHz ±80 kHz
16
,95%confidence.
Freq
Pulse-to-Pulse
Phase
±0.3°
±0.7°
meas–treference
≤ 10 ms,
(rise)
or t
.
(fall)
www.tektronix.com/rsa 13
Page 14

Data Sheet
Frequency and Phase Error Referenced to a Linear Chirp
At stated frequencies and measurement bandwidths*16, 95% confidence.
Bandwidth
Abs. Freq Err
(RMS)
20 MHz ±17 kHz ±12 kHz
60 MHz (Opt. 85)
*16Pulse ON Power ≥ –20 dBm, signal peak at Reference Level, Attenuator = 0 dB, t
Frequency Estimation: Manual. Pulse-to-Pulse Measurement time position excludes the beginning and
ending of the pulse extending for a time = (10 / Measurement BW) as measured from 50% of the t
Absolute Frequency Error determined over center 50% of pulse.
Note: Signal t
ype: Linear Chirp, Peak-to-Peak Chirp Deviation: ≤0.8 Measurement BW.
±30 kHz ±130 kHz
CF 2 GHz
Pulse-Pulse
Freq
Pulse-Pulse
Phase
±0.3°
±0.5°
≤ 10 ms,
meas–treference
or t
(rise)
Digital Modula t ion Analysis (Opt. 21)
Characteristic
Modulation Formats
Description
π/2DBPSK, BPSK, SBPSK, QPSK, DQPSK,
π/4DQPSK, D8PSK, 8PSK, OQPSK, SOQPSK, CPM,
16/32/64/128/256QAM, MSK, 2-FSK, 4-FSK, 8-FSK,
16-FSK, C4FM
Analysis Period
Up to 80,000 Samples
Filter Types
Measurement filters Square-root raised cosine, raised cosine, Gaussian,
rectangular, IS-95, IS-95 EQ, C4FM-P25, half-sine,
None, User Defined
Reference filters Raised cosine, Gaussian, rectangular, IS-95,
SBPSK-MIL, SOQPSK-MIL, SOQPSK-ARTM, None,
User Defined
Alpha/B×T Range
Measurements
0.001 to 1, 0.001 step
Constellation, Error Vector Magnitude (EVM) vs. Time,
Modulation Error Ratio (MER), Magnitude Error vs.
Time, Phase Error vs. Time, Signal Quality, Symbol
Table , r h o
FSK only: Frequency Deviation, Symbol Timing Error
Symbol Rate Range 1 kS/s to 85 MS/s (Modulated signal must be contained
entirely within acquisition BW)
Digital (Opt. 21)
Symbol Rate Residual EVM (Typical)
QPSK Residual EVM*
17
100 kS/s <0.35%
1 MS/s <0.35%
10 MS/s <0.5%
30 MS/s (Opts. 40/85) <1.5%
(fall)
256 QAM Residual EVM*
18
60 MS/s (Opt. 85) <2.0%
.
10 MS/s <0.4%
30 MS/s (Opts. 40/85) <1.0%
60 MS/s (Opt. 85) <1.5%
Offset QPSK Residual EVM*
17
100 kS/s <0.4%
1 MS/s <0.4%
10 MS/s <1.3%
S-OQPSK (MIL, ARTM) Residual EVM*
4kS/s,
<0.3%
19
CF = 250 MHz
20 kS/s <0.5%
100 kS/s <0.5%
1 MS/s <0.5%
S-BPSK (MIL) Residual EVM*
4kS/s,
20
<0.2%
CF = 250 MHz
20 kS/s <0.5%
100 kS/s <0.5%
1 MS/s <0.5%
CPM (MIL) Residual EVM*
4kS/s,
20
<0.3%
CF = 250 MHz
20 kS/s <0.5%
100 kS/s <0.5%
1 MS/s <0.5%
2/4/8/16 FSK Residual RMS FSK Error*
21
10 kS/s, deviation 10 kHz <0.5%
*17CF = 2 GHz, Measurement Filter = root raised cosine, Reference Filter = raised cosine,
Analysis Length = 200 symbols.
18
CF = 2 GHz, Measurement Filter = root raised cosine, Reference Filter = raised cosine,
*
Analysis Length = 400 symbols.
19
*
CF = 2 GHz unless otherwise noted. Reference Filters: MIL STD, ARTM, Measurement Filter: none.
20
CF = 2 GHz unless otherwise noted. Reference Filter: MIL STD.
*
21
CF = 2 GHz. Reference Filter: None, Measurement Filter: None.
*
14 www.tektronix.com/rsa
Page 15

Spectrum Analyzers — RSA5000 Series
Flexible OFDM Characteristics (Opt. 22)
Recallable Standards WiMax 802.16-2004, WLAN 802.11 a/g/j
Parameter settings
Advanced parameter
settings
Guard Interval, Subcarrier spacing, channel bandwidth,
Carrier detect: 802.11, 802.16-2004 - Auto detect;
Manual Select BPSK; QPSK, 16QAM, 64QAM;
Channel estimation: Preamble, Preamble + data
Pilot tracking: Phase,amplitude,timing
Frequency correction: On, Off
Summary Measurements Symbol clock error, frequency error, average power,
peak-to-average, CPE
EVM (rms and peak) for all carriers, plot carriers, data
carriers
OFDM parameters: # of carriers, guard interval (%),
subcarrier spacing (Hz), FFT length
Power (average, peak-to-average)
Displays EVM vs symbol, vs subcarrier
Subcarrier power vs symbol, vs subcarrier
Mag Error vs symbol, vs subcarrier
Phase Error vs symbol, vs subcarrier
Channel frequency response
Residual EVM
–44 dB (WiMax 802.16-2004, 5 MHz BW)
–44 dB (WLAN 802.11g, 20 MHz BW)
(Signal input power optimized for best EVM)
Analog Modulation Analysis Accuracy (Typical)
Modulation Description
AM
FM
dBm Input at center, Carrier Frequency
±2% (0
10 to 60% Modulation Depth)
1GHz,
±1% of Span
(0 dBm Input at Center)
(Carrier Frequency 1 GHz, 400 Hz/1 kHz
Input/Modulated Frequency)
PM
±3°
(0 dBm Input at Center)
(Carrier Frequency 1 GHz, 1 kHz/5 kHz
Input/Modulated Frequency)
Inputs And Outputs
Characteristic
Front Panel
Display
Description
Touch panel, 10.4 in. (264 mm)
RF Input Connector N-type female, 50 Ω
Trigger Out BNC, High: >2.0 V, Low: <0.4 V, output current 1 mA
(LVTTL)
Trigger In
BNC, 50 Ω/5 kΩ impedance (nominal), ±5 V max
input, –2.5 V to +2.5 V trigger level
USB Ports 2 USB 2.0
Audio
Rear Panel
Speaker
10 MHz REF OUT 50 Ω,BNC,>0dBm
External REF IN
50 Ω,10MHz,BNC
Trig 2 / Gate IN BNC, High: 1.6 to 5.0 V, Low: 0 to 0.5 V
GPIB Interface
IEEE 488.2
LAN Interface Ethernet RJ45, 10/100/1000BASE-T
USB Ports USB 2.0, two ports
VGA Output VGA compatible, 15 DSUB
Audio Out
3.5 mm headphone jack
Noise Source Drive BNC, +28 V, 140 mA (nominal)
Digital IQ Out 2 connectors, LVDS (Opt. 55)
General Characteristics
Characteristic
Description
Temperature Range
Operating +5°Cto+40°C.
(+5 °C to +40 °C when accessing DVD)
Storage –20 °C to +60 °C
Warm-up Time 20 min.
Altitude
Operating Up to 3000 m (approximately 10,000 ft.)
Nonoperating
Up to 12,190 m (40,000 ft.)
Relative Humidity
Operating and
nonoperating
90% RH at 30 °C
(No condensation, max wet bulb, 29 °C)
(80% RH max when
accessing DVD)
Vibration
Operating 0.22 G
–3 dB/octave slope from 350-500 Hz,
0.00007 g
:Profile = 0.00010 g2/Hz at 5-350 Hz,
RMS
2
/Hz at 500 Hz,
3Axesat10min/axis
Nonoperating
2.28 G
–3 dB/octave from 100-200 Hz,
0.00875 g
–3 dB/octave from 350-500 Hz,
0.00613 g
:Profi le = 0.0175 g2/Hz at 5-100 Hz,
RMS
2
/Hz at 200-350 Hz,
2
/Hz at 500 Hz,
3 Axes at 10 min/axis.
Shock
Operating 15 G, half-sine, 11 ms duration. (1 G max when
accessing DVD and Opt. 06 Removable HDD)
Nonoperating
Safety
30 G, half-sine, 11 ms duration
UL 61010-1:2004
CSA C22.2 No.61010-1-04
Electromagnetic
Compatibility,
Complies with:
EU Council EMC Directive 2004/108/EC
EN61326, CISPR 11, Class A
90 VACto 264 VAC,50Hzto60HzPower Requirements
90 V
to 132 VAC,400Hz
AC
Power Consumption
450 W max
Data Storage Internal HDD (Opt. 59), USB ports, DVD±RW (Opt.
57), Removable HDD (Opt. 56)
Calibration Interval One year
Warranty
One year
GPIB SCPI-compatible, IEEE488.2 compliant
Physical Characteristics
Dimensions
mm
in.
Height 282 11.1
Width 473 18.6
Depth 531 20.9
Weight kg lb.
With All Options
Note: Physical characteristics, with feet.
24.6 54
www.tektronix.com/rsa 15
Page 16

Data Sheet
Ordering Information
RSA5103A
Real Time Signal Analyzer, 1 Hz - 3 GHz
RSA5106A
Real Time Signal Analyzer, 1 Hz – 6.2 GHz
All Include: Quick-start Manual (Printed), Application Guide (Printed), Printable
Online Help File, Programmer's manual (on CD), power cord, BNC-N adapter, USB
Keyboard, USB Mouse, Front Cover.
Note: Please specify power plug and language options when ordering.
Options
Product
RSA5103A Real Time Signal Analyzer 1 Hz – 3 GHz
RSA5106A Real Time Signal Analyzer 1 Hz – 6.2 GHz
RSA56KR Rackmount for RSA5K, RSA6K Real
*22Must order one of either Option 56 (removable HDD) or Option 59 (Internal HDD). Removable HDD (Opt.
56) is not compatible with DVD/CD (Opt. 57) or Internal HDD (Opt. 59). Internal HDD (Opt. 59) is not
compatible with Removable HDD (Opt. 56)
Options Description
25 MHz Acquisition BW
25 MHz Acquisition BW
Opt. 50 Internal Preamp, 1 MHz - 3/6.2 GHz
Opt. 52
Frequency Mask Trigger
Opt. 53 Memory Extension, 4 GB Acquisition
Memory Total
Opt. 55 Digital I and Q output
22
Opt. 56*
Removable HDD (160 GB), incompatible
with Options 57 or 59
22
Opt. 57*
Opt. 59*
CD/DVD-RW incompatible with Option 56
22
Internal HDD (160 GB), incompatible
with Option 56 (no cost option)
Opt. 11 Phase Noise / Jitter Measurement
Opt. 12 Settling Time (Frequency and Phase)
Opt. 20 Advanced Signal Analysis
(including pulse measurements)
Opt. 21 General Purpose Modulation Analysis
Opt. 22 Flexible OFDM Analysis
0 MHz Acquisition B andwidth
Opt. 40
Opt. 85
4
5 MHz Acquisition B andwidth
8
Opt. 200 Advanced Triggers, Swept DPX,
and DPX Zero Span
Opt. 5040 Combines Option 50 (Preamp) and Option
40 (40 MHz Acquisition BW). Mutually
exclusive to Options 50 and 40
Opt. 5085 Combines Option 50 (Preamp) and Option
85 (85 MHz Acquisition BW). Mutually
exclusive to Options 50 and 85
Time Signal Analyzers
Accessories
Accessories Description
RTPA2A Spectrum
Analyzer Probe Adapter
Supports TekConnect probes P7225, P7240, P7260,
P7330, P7313, P7350, P7350SMA, P7380, P7380SMA
compatibility
RSAVu Software based on the RSA3000 Series platform for
analysis supporting 3G wireless standards, WLAN
(IEEE802.11a/b/g/n), RFID, Audio Demodulation, and
more measurements
RSA-IQWIMAX
WiMAX 802.16-2004 and 802.16.e standards support
RSALTE 3GPP Release 8 LTE standards support
Additional Removable
Hard Drive
Transit Case
For use with Opt. 56 (Windows 7 and instrument SW
preinstalled). 065-0852-xx
016-2026-xx
Rackmount Retrofit RSA56KR
Additional Quick-start
071-1909-xx
Manual (Paper)
Service Manual (Paper)
SMA (Male) to SMA
071-1914-xx
174-5706-xx
(Male) 36 in. Cable
SMA Female to Female
131-8508-xx
Barrel
International Power Plugs
Opt. A0 – North America power.
Opt. A1 – Universal EURO power.
Opt. A2 – United Kingdom power.
Opt. A3 – Australia power.
Opt. A4 – 240 V, North America power.
Opt. A5 – Switzerland power.
Opt. A6 – Japan power.
Opt. A10 – China power.
Opt. A11 – India power.
Opt. A12 – Brazil power.
Opt. A99 – No power cord or AC adapter.
Service
Opt. C3 – Calibration Service 3 Years
Opt. C5 – Calibration Service 5 Years
Opt. D1 – Calibration Data Report
Opt. D3 – Calibration Data Report 3 Years (with Option C3)
Opt. D5 – Calibration Data Report 5 Years (with Option C5)
Opt. G3 – Complete Care 3 Years (includes loaner, scheduled calibration and more)
Opt. G5 – Complete Care 5Years (includes loaner, scheduled calibration and more)
Opt. R3 – Repair Service 3 Years
Opt. R5 – Repair Service 5 Years
Opt. CA1 – Single calibration or coverage for the designated calibration interval,
whichever comes first
16 www.tektronix.com/rsa
Page 17

Spectrum Analyzers — RSA5000 Series
Upgrades
RSA5UP – Upgrade Options for RSA5103A / RSA5106A
Factory
RSA5UP
Opt. 50
Option Description
Internal Preamp
1MHz–3GHz(5103)or
1MHz–6.2GHz(5106)
Opt. 52
Frequency Mask Trigger
Opt. 53 Memory Extension, 4 G B Acquisition
Memory Total
Opt. 55 Digital IQ Output
Opt. 56
Removable HDD, incompatible with
Options 57 or 59
Opt. 57 CD/DVD-RW, incompatible with Option 56
Opt. 59 Internal HDD, incompatible with Option 56
Opt. 11 Phase Noise / Jitter Measurements SW
Opt. 12 Settling Time (Frequency and Phase) SW
Opt. 20 Advanced Signal Analysis (including pulse
measurements)
Opt. 21 General Purpose Modulation Analysis SW
Opt. 22 Flexible OFDM Analysis SW
Opt. 40 RSA5106A: 40 MHz Acquisition Bandwidth
Opt. 85 RSA5106A: 85 MHz Acquisition Bandwidth
Opt. 403 RSA5103A: 40 MHz Acquisition Bandwidth
Opt. 853 RSA5103A: 85 MHz Acquisition Bandwidth
Opt. 200 Advanced DPX/swept DPX with Density,
Time Qualified, and Runt Triggers and
Zero-Span DPX
HW or
Calibration
Required?
SW
HW Yes
SW
HW No
HW No
HW No
HW No
HW No
SW
HW Yes
HW Yes
HW Yes
HW Yes
HW No
No
No
No
No
No
No
Languages
Options
Opt. L0
Opt. L5
Description
English Manual
Japanese Manual
Opt. L7 Si mplified Chinese Manual
Opt. L10
Product(s) are manuf
Product(s) complies with IEEE Standard 488.1-1987, RS-232-C, and with Tektronix
Standard Codes and Formats.
Russian Manual
actured in ISO registered facilities.
www.tektronix.com/rsa 17
Page 18

Data Sheet
18 www.tektronix.com/rsa
Page 19

Spectrum Analyzers — RSA5000 Series
www.tektronix.com/rsa 19
Page 20

Data Sheet
Contact Tektronix:
ASEAN / Australa
Balkans, Israel, South Africa and other ISE Co untries +41 52 675 3777
Central East Eu
Mexico, Central/South America & Caribbean (52) 56 04 50 90
* European toll-free number. If not accessible, call: +41 52 675 3777
rope, Ukraine, and the Baltics +41 52 675 3777
Central Europe & Greece +41 52 675 3777
Middle E ast,
Asia, and North Africa +41 52 675 3777
The Netherlands 00800 2255 4835*
People’s Rep
Republic of
United K ingdom & Ireland 00800 2255 4835*
sia (65) 6356 3900
Austria 00800 2255 4835*
Belgium 00800 22
Brazil +55(11)37597600
Canada 1 80 0 833 9200
Denmark +4580881401
Finland +41526
France 00800 2255 4835*
Germany 00800 2255 4835*
Hong Kong 40 0 8
India 000 800 650 1835
Italy 00800 2255 4835*
Japan 81 (3) 67
Luxembourg +41526753777
ublic of China 400 820 5835
Poland +41 52 675 3777
Korea 001 800 8255 2835
Russia & CIS +7 (495) 7484900
South Africa +41526753777
Spain 00800
Sweden 008 00 2255 4835*
Switzerland 00800 2255 4835*
Tai wa n 886 (
55 4835*
75 3777
20 5835
14 3010
Norway 800 16098
Portugal 80 08 12370
2255 4835*
2) 2722 9622
USA 1 8 00 833 9200
Updated 25 May 2010
www.tektronix.com/rsa
For Further Information. Tektronix maintains a comprehensive, constantly expanding
collection of application notes, technical briefs and other resources to help engineers working
on the cutting edge of technology. Plea se visit www.tektronix.com
t © Tektronix, Inc. All rights reserved. Tektronix products are covered by U.S. and foreign patents,
Copyrigh
d pending. Information in this publication supersedes that in all previously published material.
issued an
tion and price change privileges reserved. TEKTRONIX and TEK are registered trademarks of
Specifica
x, Inc. All other trade names referenced are the service marks, trademarks, or registered trademarks
Tek t ro ni
espective companies.
of their r
10 Dec 2010 37W-26274-0
 Loading...